California City, CA Map & Demographics
California City Map
California City Overview
$23,297
PER CAPITA INCOME
$58,412
AVG FAMILY INCOME
$55,410
AVG HOUSEHOLD INCOME
34.7%
WAGE / INCOME GAP [ % ]
65.3¢/ $1
WAGE / INCOME GAP [ $ ]
$11,902
FAMILY INCOME DEFICIT
0.49
INEQUALITY / GINI INDEX
15,002
TOTAL POPULATION
8,640
MALE POPULATION
6,362
FEMALE POPULATION
135.81
MALES / 100 FEMALES
73.63
FEMALES / 100 MALES
34.4
MEDIAN AGE
3.5
AVG FAMILY SIZE
2.9
AVG HOUSEHOLD SIZE
5,610
LABOR FORCE [ PEOPLE ]
47.7%
PERCENT IN LABOR FORCE
16.8%
UNEMPLOYMENT RATE
California City Zip Codes
Income in California City
Income Overview in California City
Per Capita Income in California City is $23,297, while median incomes of families and households are $58,412 and $55,410 respectively.
| Characteristic | Number | Measure |
| Per Capita Income | 15,002 | $23,297 |
| Median Family Income | 2,989 | $58,412 |
| Mean Family Income | 2,989 | $83,403 |
| Median Household Income | 4,533 | $55,410 |
| Mean Household Income | 4,533 | $74,736 |
| Income Deficit | 2,989 | $11,902 |
| Wage / Income Gap (%) | 15,002 | 34.68% |
| Wage / Income Gap ($) | 15,002 | 65.32¢ per $1 |
| Gini / Inequality Index | 15,002 | 0.49 |
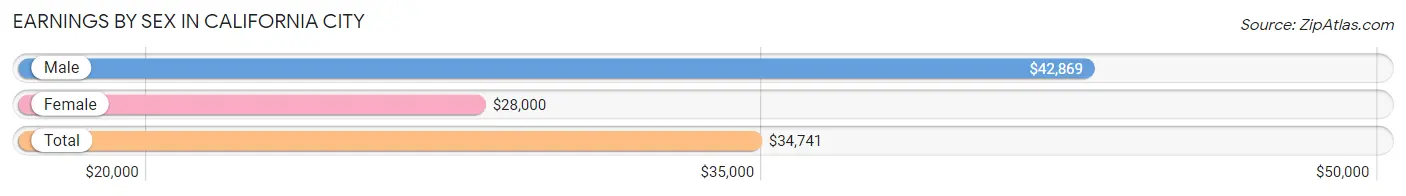
Earnings by Sex in California City
Average Earnings in California City are $34,741, $42,869 for men and $28,000 for women, a difference of 34.7%.
| Sex | Number | Average Earnings |
| Male | 3,017 (56.6%) | $42,869 |
| Female | 2,318 (43.4%) | $28,000 |
| Total | 5,335 (100.0%) | $34,741 |
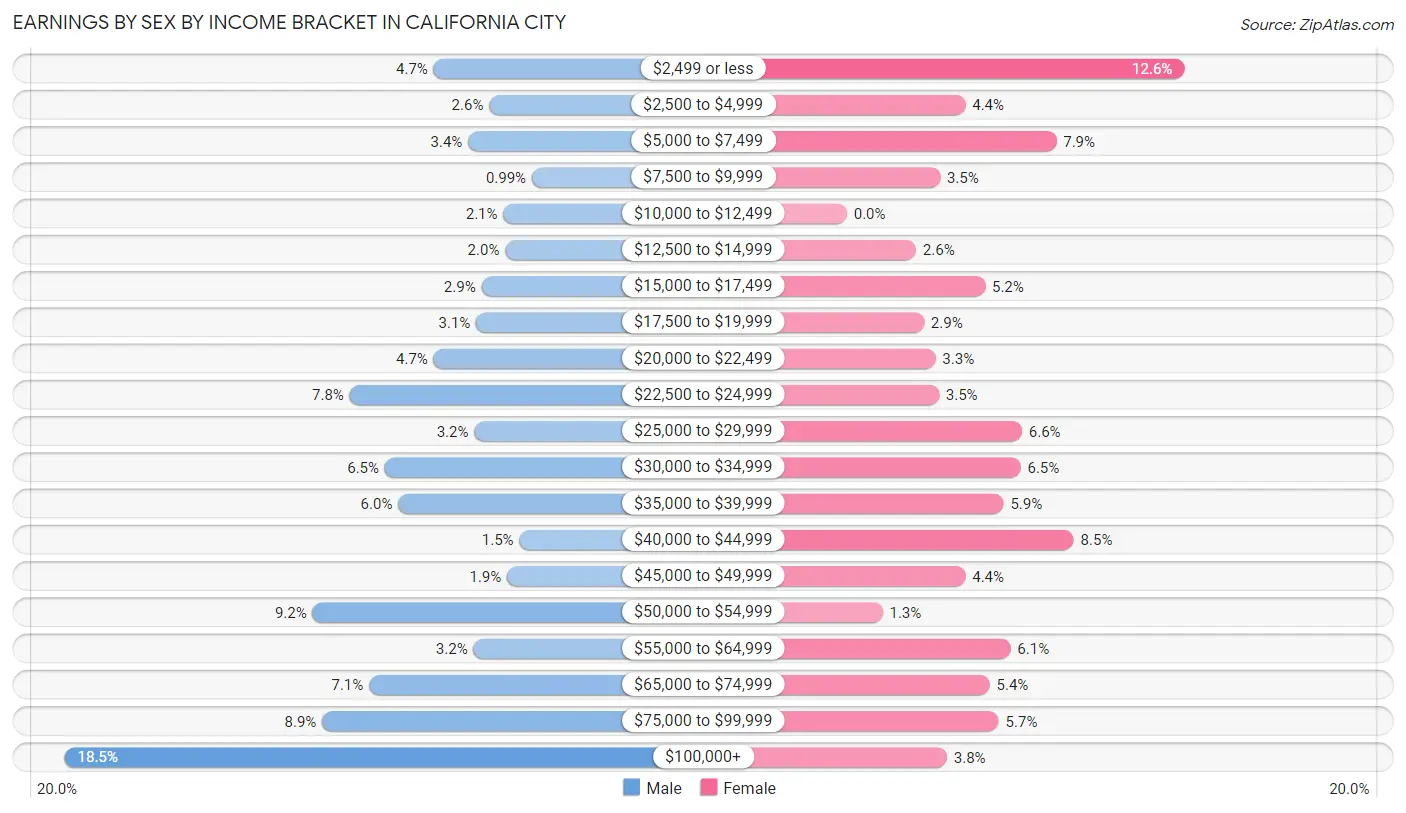
Earnings by Sex by Income Bracket in California City
The most common earnings brackets in California City are $100,000+ for men (558 | 18.5%) and $2,499 or less for women (293 | 12.6%).
| Income | Male | Female |
| $2,499 or less | 141 (4.7%) | 293 (12.6%) |
| $2,500 to $4,999 | 78 (2.6%) | 103 (4.4%) |
| $5,000 to $7,499 | 102 (3.4%) | 182 (7.9%) |
| $7,500 to $9,999 | 30 (1.0%) | 81 (3.5%) |
| $10,000 to $12,499 | 62 (2.1%) | 0 (0.0%) |
| $12,500 to $14,999 | 60 (2.0%) | 60 (2.6%) |
| $15,000 to $17,499 | 87 (2.9%) | 120 (5.2%) |
| $17,500 to $19,999 | 93 (3.1%) | 67 (2.9%) |
| $20,000 to $22,499 | 141 (4.7%) | 77 (3.3%) |
| $22,500 to $24,999 | 236 (7.8%) | 80 (3.5%) |
| $25,000 to $29,999 | 95 (3.2%) | 152 (6.6%) |
| $30,000 to $34,999 | 196 (6.5%) | 151 (6.5%) |
| $35,000 to $39,999 | 181 (6.0%) | 136 (5.9%) |
| $40,000 to $44,999 | 44 (1.5%) | 197 (8.5%) |
| $45,000 to $49,999 | 58 (1.9%) | 103 (4.4%) |
| $50,000 to $54,999 | 278 (9.2%) | 31 (1.3%) |
| $55,000 to $64,999 | 96 (3.2%) | 142 (6.1%) |
| $65,000 to $74,999 | 214 (7.1%) | 124 (5.3%) |
| $75,000 to $99,999 | 267 (8.8%) | 132 (5.7%) |
| $100,000+ | 558 (18.5%) | 87 (3.7%) |
| Total | 3,017 (100.0%) | 2,318 (100.0%) |
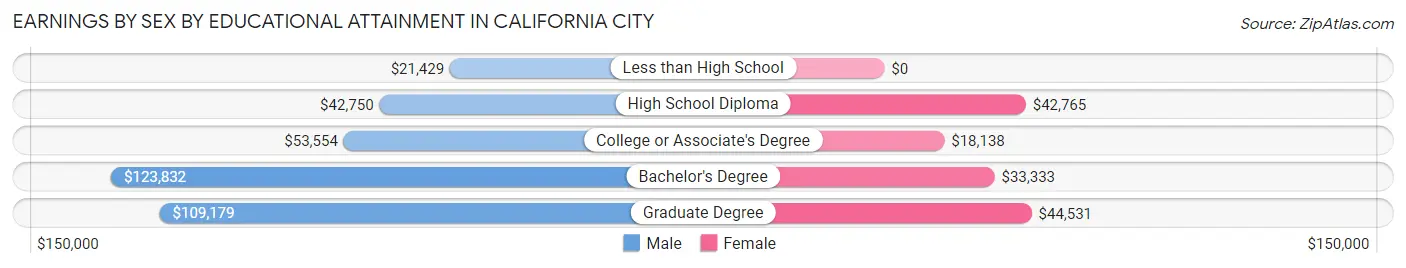
Earnings by Sex by Educational Attainment in California City
Average earnings in California City are $51,490 for men and $28,893 for women, a difference of 43.9%. Men with an educational attainment of bachelor's degree enjoy the highest average annual earnings of $123,832, while those with less than high school education earn the least with $21,429. Women with an educational attainment of graduate degree earn the most with the average annual earnings of $44,531, while those with college or associate's degree education have the smallest earnings of $18,138.
| Educational Attainment | Male Income | Female Income |
| Less than High School | $21,429 | $0 |
| High School Diploma | $42,750 | $42,765 |
| College or Associate's Degree | $53,554 | $18,138 |
| Bachelor's Degree | $123,832 | $33,333 |
| Graduate Degree | $109,179 | $44,531 |
| Total | $51,490 | $28,893 |
Family Income in California City
Family Income Brackets in California City
According to the California City family income data, there are 708 families falling into the $50,000 to $74,999 income range, which is the most common income bracket and makes up 23.7% of all families. Conversely, the $150,000 to $199,999 income bracket is the least frequent group with only 146 families (4.9%) belonging to this category.
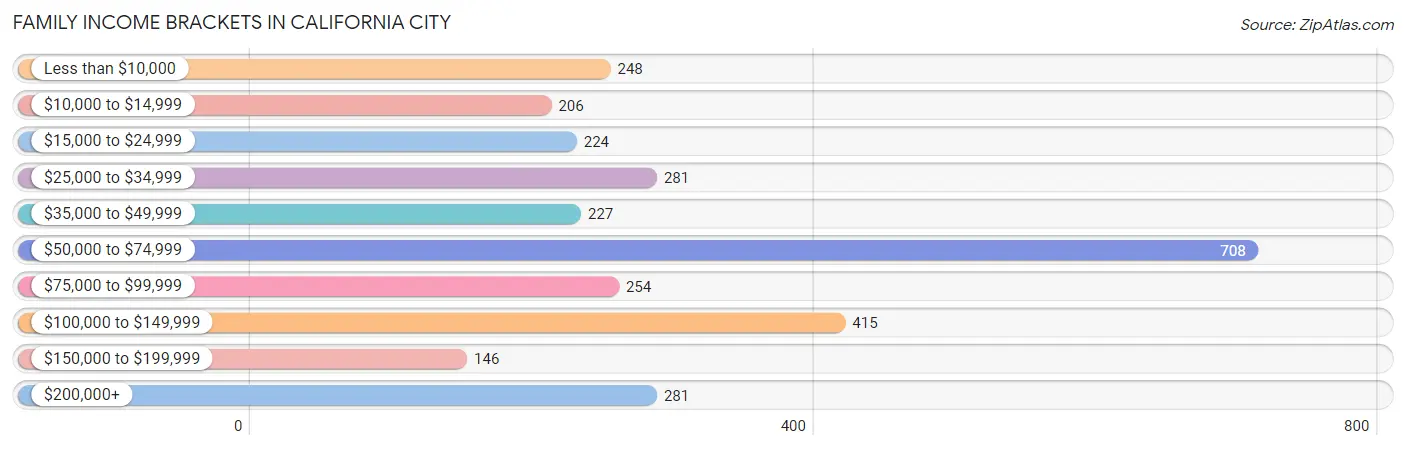
| Income Bracket | # Families | % Families |
| Less than $10,000 | 248 | 8.3% |
| $10,000 to $14,999 | 206 | 6.9% |
| $15,000 to $24,999 | 224 | 7.5% |
| $25,000 to $34,999 | 281 | 9.4% |
| $35,000 to $49,999 | 227 | 7.6% |
| $50,000 to $74,999 | 708 | 23.7% |
| $75,000 to $99,999 | 254 | 8.5% |
| $100,000 to $149,999 | 415 | 13.9% |
| $150,000 to $199,999 | 146 | 4.9% |
| $200,000+ | 281 | 9.4% |
Family Income by Famaliy Size in California City
5-person families (319 | 10.7%) account for the highest median family income in California City with $72,125 per family, while 2-person families (1,033 | 34.6%) have the highest median income of $27,784 per family member.
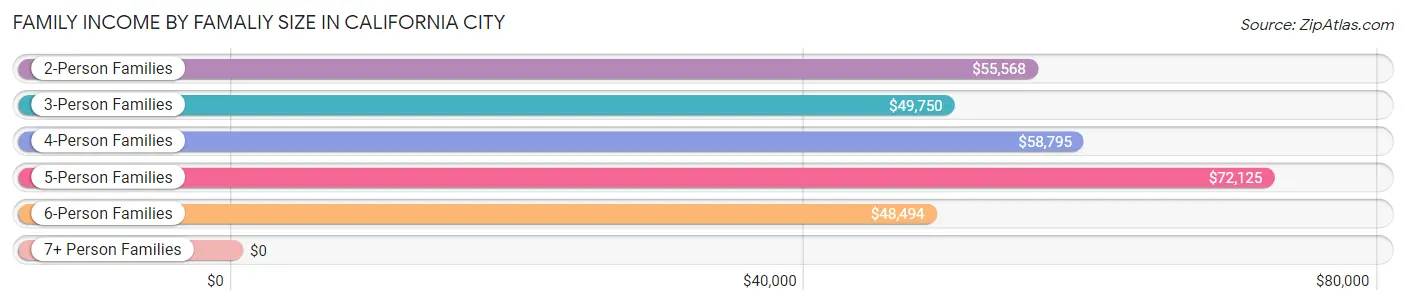
| Income Bracket | # Families | Median Income |
| 2-Person Families | 1,033 (34.6%) | $55,568 |
| 3-Person Families | 781 (26.1%) | $49,750 |
| 4-Person Families | 666 (22.3%) | $58,795 |
| 5-Person Families | 319 (10.7%) | $72,125 |
| 6-Person Families | 73 (2.4%) | $48,494 |
| 7+ Person Families | 117 (3.9%) | $0 |
| Total | 2,989 (100.0%) | $58,412 |
Family Income by Number of Earners in California City
The median family income in California City is $58,412, with families comprising 3+ earners (154) having the highest median family income of $150,294, while families with no earners (539) have the lowest median family income of $17,488, accounting for 5.1% and 18.0% of families, respectively.
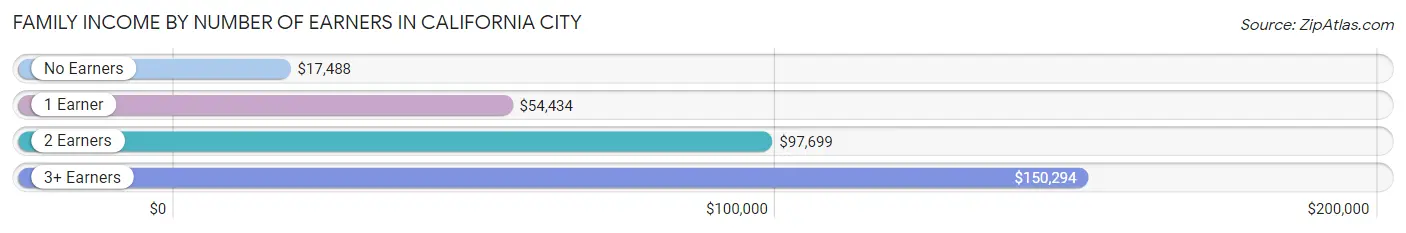
| Number of Earners | # Families | Median Income |
| No Earners | 539 (18.0%) | $17,488 |
| 1 Earner | 1,467 (49.1%) | $54,434 |
| 2 Earners | 829 (27.7%) | $97,699 |
| 3+ Earners | 154 (5.1%) | $150,294 |
| Total | 2,989 (100.0%) | $58,412 |
Household Income in California City
Household Income Brackets in California City
With 947 households falling in the category, the $50,000 to $74,999 income range is the most frequent in California City, accounting for 20.9% of all households. In contrast, only 227 households (5.0%) fall into the $150,000 to $199,999 income bracket, making it the least populous group.
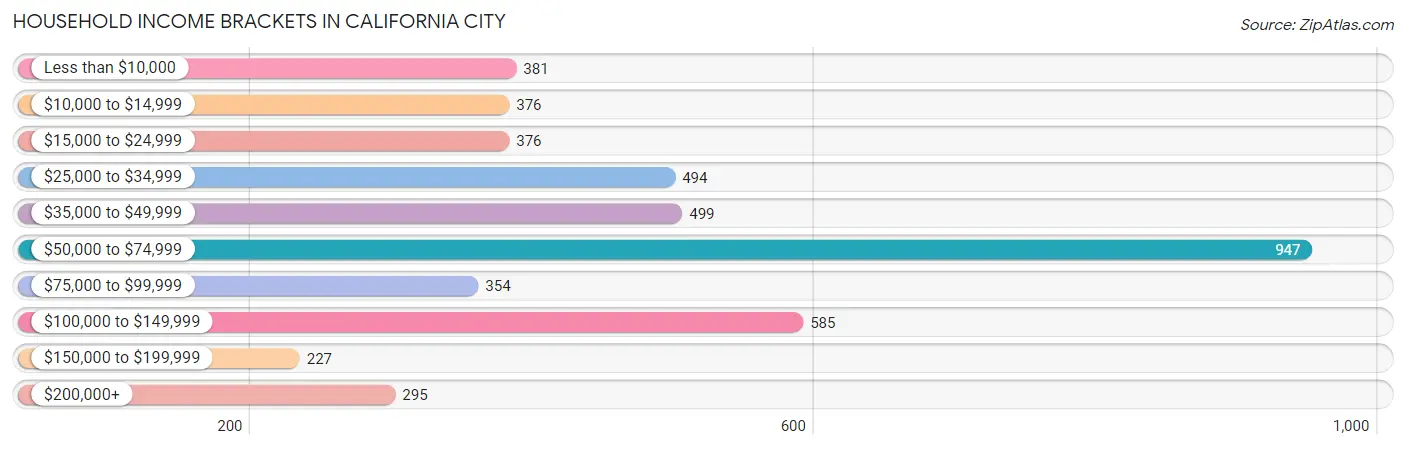
| Income Bracket | # Households | % Households |
| Less than $10,000 | 381 | 8.4% |
| $10,000 to $14,999 | 376 | 8.3% |
| $15,000 to $24,999 | 376 | 8.3% |
| $25,000 to $34,999 | 494 | 10.9% |
| $35,000 to $49,999 | 499 | 11.0% |
| $50,000 to $74,999 | 947 | 20.9% |
| $75,000 to $99,999 | 354 | 7.8% |
| $100,000 to $149,999 | 585 | 12.9% |
| $150,000 to $199,999 | 227 | 5.0% |
| $200,000+ | 295 | 6.5% |
Household Income by Householder Age in California City
The median household income in California City is $55,410, with the highest median household income of $68,036 found in the 45 to 64 years age bracket for the primary householder. A total of 1,321 households (29.1%) fall into this category. Meanwhile, the 65+ years age bracket for the primary householder has the lowest median household income of $33,278, with 1,169 households (25.8%) in this group.
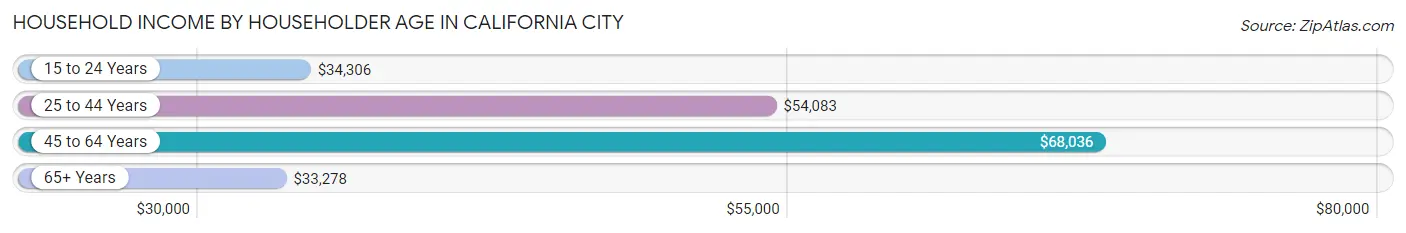
| Income Bracket | # Households | Median Income |
| 15 to 24 Years | 114 (2.5%) | $34,306 |
| 25 to 44 Years | 1,929 (42.5%) | $54,083 |
| 45 to 64 Years | 1,321 (29.1%) | $68,036 |
| 65+ Years | 1,169 (25.8%) | $33,278 |
| Total | 4,533 (100.0%) | $55,410 |
Poverty in California City
Income Below Poverty by Sex and Age in California City
With 19.8% poverty level for males and 26.8% for females among the residents of California City, under 5 year old males and 6 to 11 year old females are the most vulnerable to poverty, with 135 males (52.5%) and 458 females (61.8%) in their respective age groups living below the poverty level.
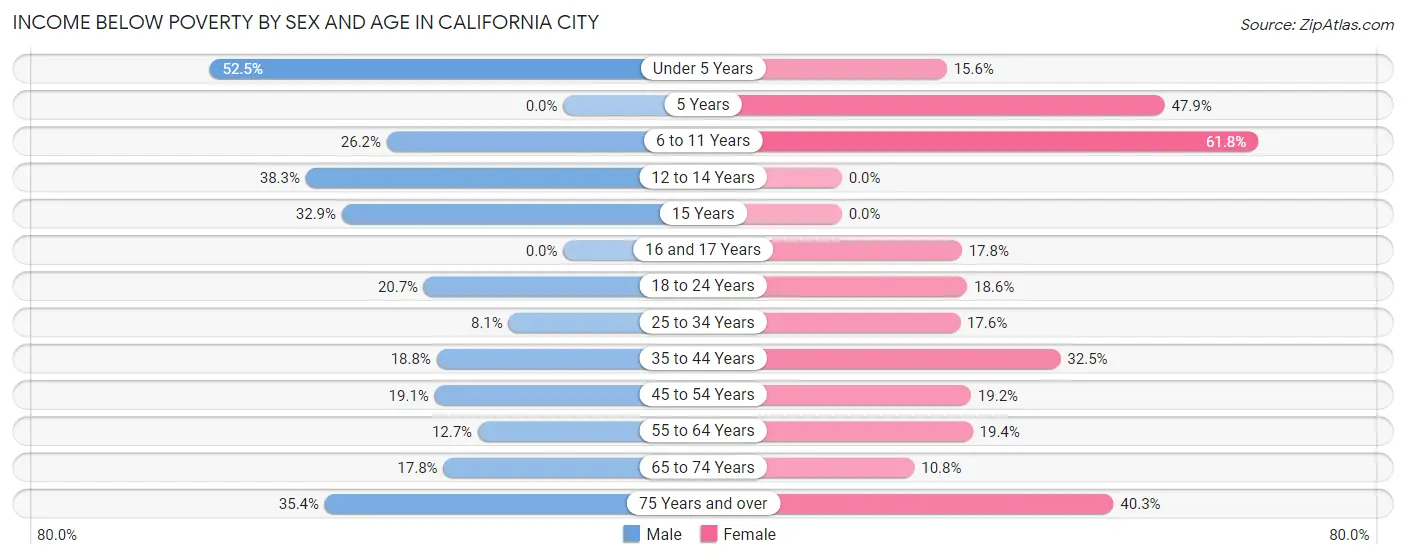
| Age Bracket | Male | Female |
| Under 5 Years | 135 (52.5%) | 91 (15.6%) |
| 5 Years | 0 (0.0%) | 150 (47.9%) |
| 6 to 11 Years | 108 (26.2%) | 458 (61.8%) |
| 12 to 14 Years | 192 (38.3%) | 0 (0.0%) |
| 15 Years | 25 (32.9%) | 0 (0.0%) |
| 16 and 17 Years | 0 (0.0%) | 13 (17.8%) |
| 18 to 24 Years | 160 (20.7%) | 80 (18.6%) |
| 25 to 34 Years | 93 (8.1%) | 156 (17.5%) |
| 35 to 44 Years | 177 (18.8%) | 336 (32.5%) |
| 45 to 54 Years | 125 (19.1%) | 101 (19.2%) |
| 55 to 64 Years | 88 (12.7%) | 134 (19.4%) |
| 65 to 74 Years | 127 (17.8%) | 52 (10.8%) |
| 75 Years and over | 74 (35.4%) | 123 (40.3%) |
| Total | 1,304 (19.8%) | 1,694 (26.8%) |
Income Above Poverty by Sex and Age in California City
According to the poverty statistics in California City, males aged 5 years and females aged 12 to 14 years are the age groups that are most secure financially, with 100.0% of males and 100.0% of females in these age groups living above the poverty line.
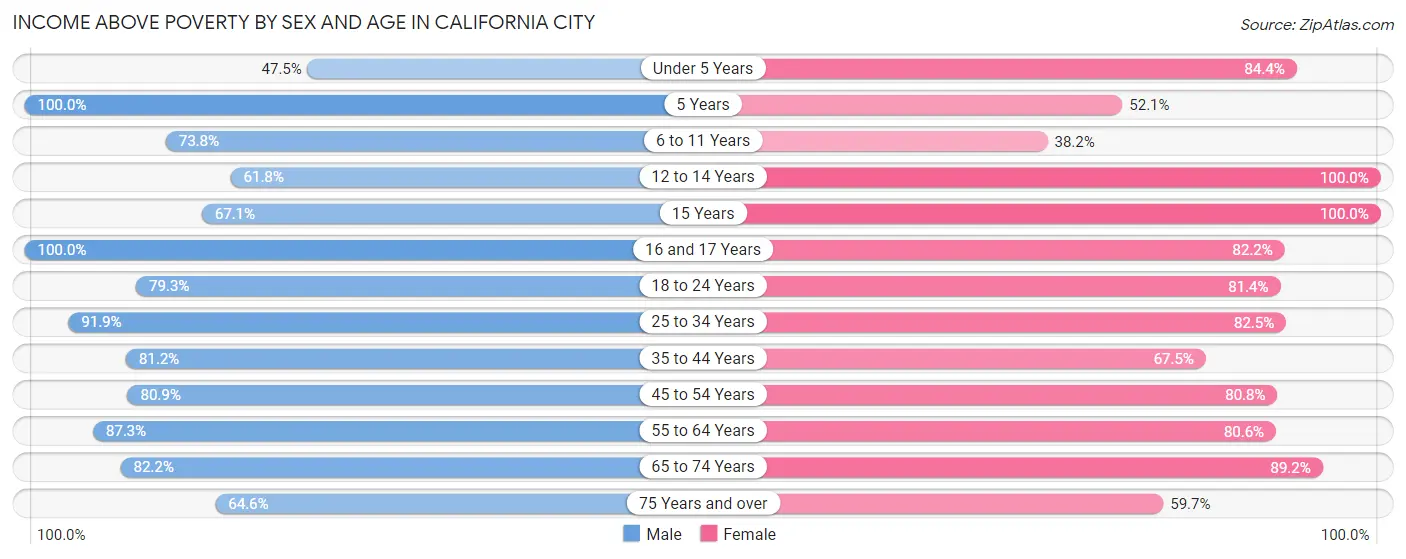
| Age Bracket | Male | Female |
| Under 5 Years | 122 (47.5%) | 493 (84.4%) |
| 5 Years | 54 (100.0%) | 163 (52.1%) |
| 6 to 11 Years | 304 (73.8%) | 283 (38.2%) |
| 12 to 14 Years | 310 (61.8%) | 88 (100.0%) |
| 15 Years | 51 (67.1%) | 159 (100.0%) |
| 16 and 17 Years | 154 (100.0%) | 60 (82.2%) |
| 18 to 24 Years | 613 (79.3%) | 350 (81.4%) |
| 25 to 34 Years | 1,051 (91.9%) | 733 (82.5%) |
| 35 to 44 Years | 764 (81.2%) | 699 (67.5%) |
| 45 to 54 Years | 529 (80.9%) | 426 (80.8%) |
| 55 to 64 Years | 606 (87.3%) | 556 (80.6%) |
| 65 to 74 Years | 586 (82.2%) | 431 (89.2%) |
| 75 Years and over | 135 (64.6%) | 182 (59.7%) |
| Total | 5,279 (80.2%) | 4,623 (73.2%) |
Income Below Poverty Among Married-Couple Families in California City
The poverty statistics for married-couple families in California City show that 11.5% or 218 of the total 1,897 families live below the poverty line. Families with 1 or 2 children have the highest poverty rate of 15.4%, comprising of 132 families. On the other hand, families with 3 or 4 children have the lowest poverty rate of 7.0%, which includes 11 families.
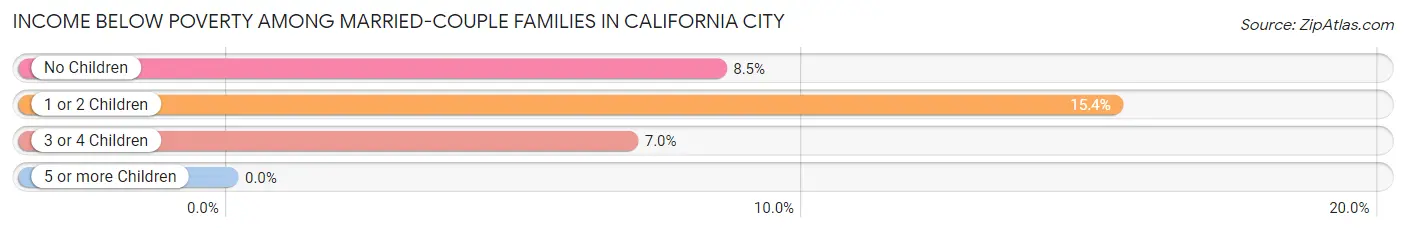
| Children | Above Poverty | Below Poverty |
| No Children | 807 (91.5%) | 75 (8.5%) |
| 1 or 2 Children | 725 (84.6%) | 132 (15.4%) |
| 3 or 4 Children | 147 (93.0%) | 11 (7.0%) |
| 5 or more Children | 0 (0.0%) | 0 (0.0%) |
| Total | 1,679 (88.5%) | 218 (11.5%) |
Income Below Poverty Among Single-Parent Households in California City
According to the poverty data in California City, 47.6% or 216 single-father households and 40.4% or 258 single-mother households are living below the poverty line. Among single-father households, those with 5 or more children have the highest poverty rate, with 21 households (100.0%) experiencing poverty. Likewise, among single-mother households, those with 5 or more children have the highest poverty rate, with 18 households (100.0%) falling below the poverty line.
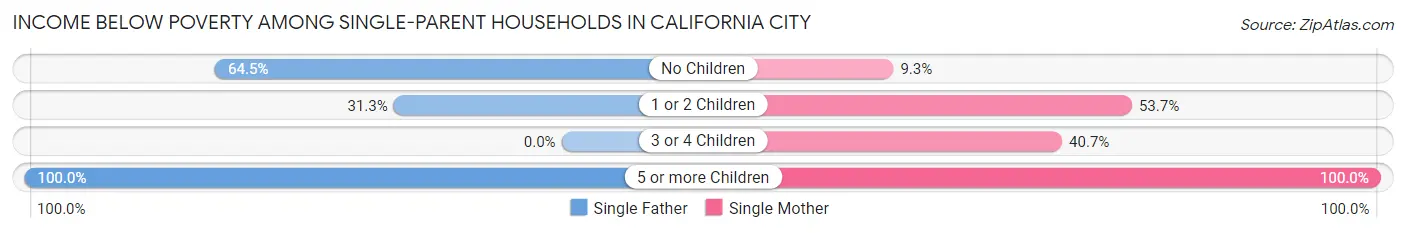
| Children | Single Father | Single Mother |
| No Children | 129 (64.5%) | 14 (9.3%) |
| 1 or 2 Children | 66 (31.3%) | 145 (53.7%) |
| 3 or 4 Children | 0 (0.0%) | 81 (40.7%) |
| 5 or more Children | 21 (100.0%) | 18 (100.0%) |
| Total | 216 (47.6%) | 258 (40.4%) |
Income Below Poverty Among Married-Couple vs Single-Parent Households in California City
The poverty data for California City shows that 218 of the married-couple family households (11.5%) and 474 of the single-parent households (43.4%) are living below the poverty level. Within the married-couple family households, those with 1 or 2 children have the highest poverty rate, with 132 households (15.4%) falling below the poverty line. Among the single-parent households, those with 5 or more children have the highest poverty rate, with 39 household (100.0%) living below poverty.
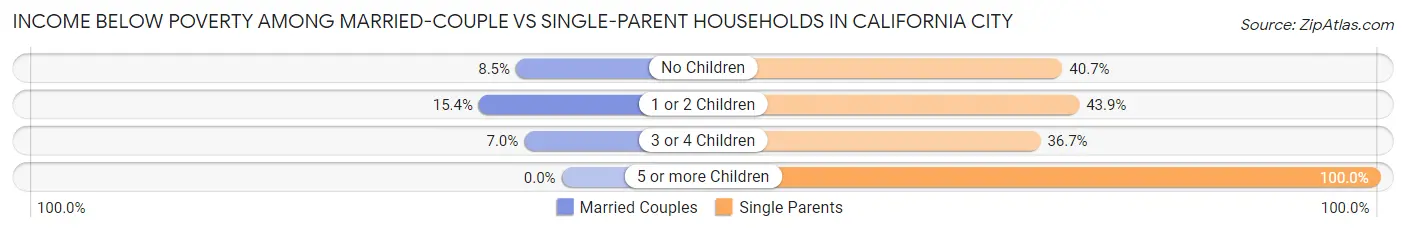
| Children | Married-Couple Families | Single-Parent Households |
| No Children | 75 (8.5%) | 143 (40.7%) |
| 1 or 2 Children | 132 (15.4%) | 211 (43.9%) |
| 3 or 4 Children | 11 (7.0%) | 81 (36.6%) |
| 5 or more Children | 0 (0.0%) | 39 (100.0%) |
| Total | 218 (11.5%) | 474 (43.4%) |
Race in California City
The most populous races in California City are White / Caucasian (6,543 | 43.6%), Hispanic or Latino (5,987 | 39.9%), and Black / African American (3,566 | 23.8%).
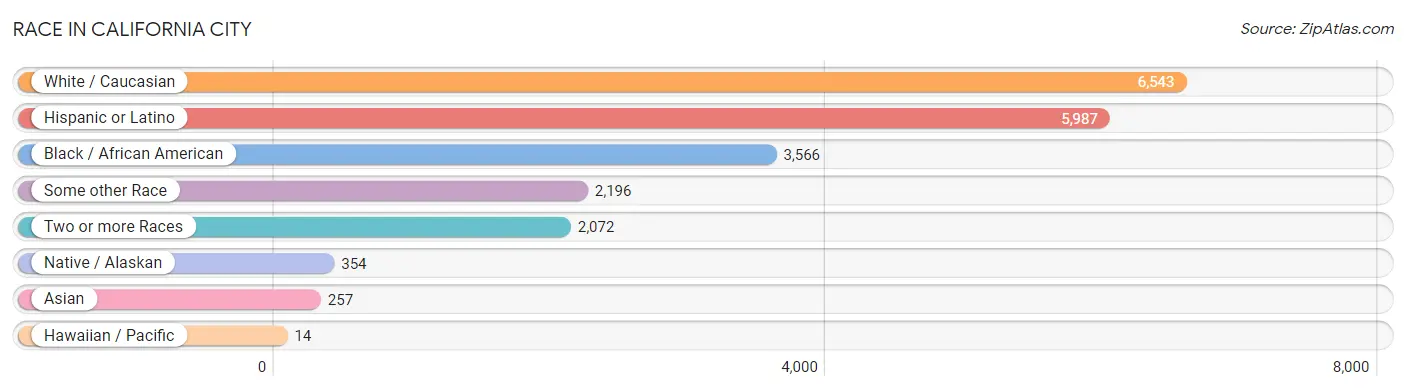
| Race | # Population | % Population |
| Asian | 257 | 1.7% |
| Black / African American | 3,566 | 23.8% |
| Hawaiian / Pacific | 14 | 0.1% |
| Hispanic or Latino | 5,987 | 39.9% |
| Native / Alaskan | 354 | 2.4% |
| White / Caucasian | 6,543 | 43.6% |
| Two or more Races | 2,072 | 13.8% |
| Some other Race | 2,196 | 14.6% |
| Total | 15,002 | 100.0% |
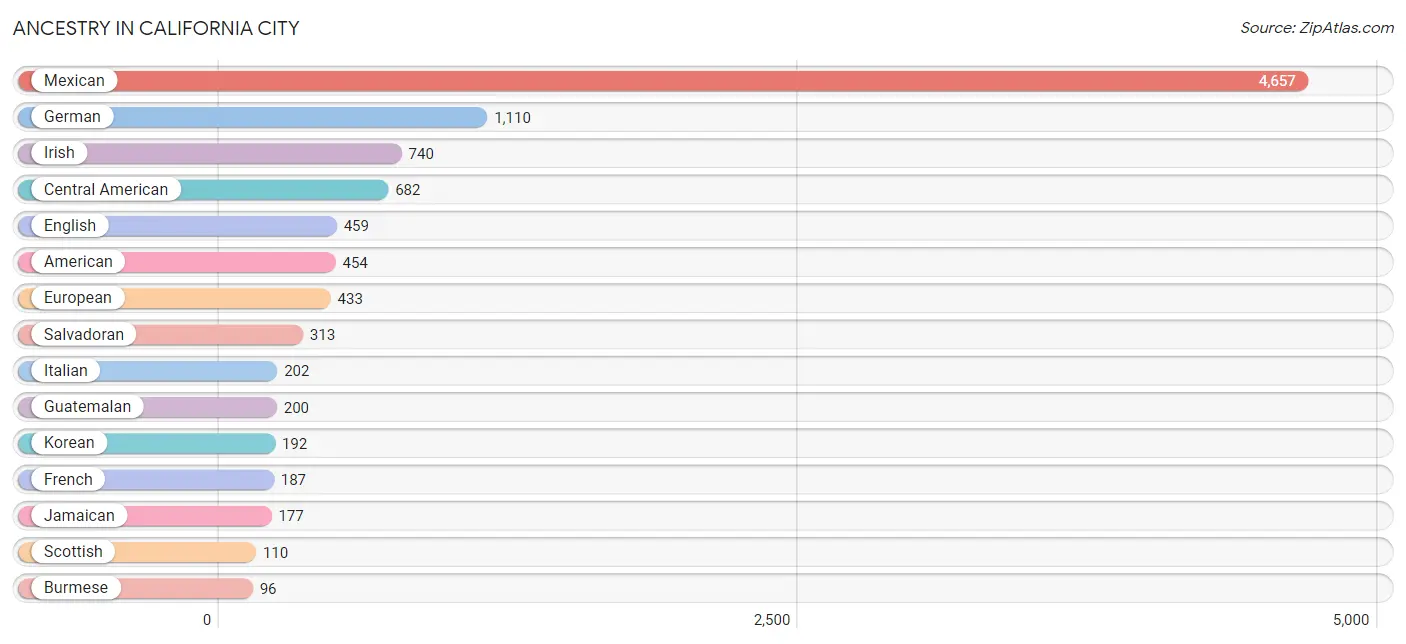
Ancestry in California City
The most populous ancestries reported in California City are Mexican (4,657 | 31.0%), German (1,110 | 7.4%), Irish (740 | 4.9%), Central American (682 | 4.5%), and English (459 | 3.1%), together accounting for 51.0% of all California City residents.
| Ancestry | # Population | % Population |
| African | 48 | 0.3% |
| Albanian | 26 | 0.2% |
| American | 454 | 3.0% |
| Apache | 13 | 0.1% |
| Argentinean | 13 | 0.1% |
| Belgian | 46 | 0.3% |
| Belizean | 10 | 0.1% |
| Bhutanese | 10 | 0.1% |
| Blackfeet | 8 | 0.1% |
| British | 32 | 0.2% |
| Burmese | 96 | 0.6% |
| Central American | 682 | 4.5% |
| Central American Indian | 61 | 0.4% |
| Cherokee | 26 | 0.2% |
| Chilean | 9 | 0.1% |
| Choctaw | 57 | 0.4% |
| Colombian | 40 | 0.3% |
| Costa Rican | 94 | 0.6% |
| Cuban | 39 | 0.3% |
| Czech | 18 | 0.1% |
| Danish | 86 | 0.6% |
| Dominican | 9 | 0.1% |
| Dutch | 15 | 0.1% |
| English | 459 | 3.1% |
| European | 433 | 2.9% |
| Filipino | 10 | 0.1% |
| Finnish | 90 | 0.6% |
| French | 187 | 1.3% |
| French Canadian | 49 | 0.3% |
| German | 1,110 | 7.4% |
| Guatemalan | 200 | 1.3% |
| Honduran | 75 | 0.5% |
| Hungarian | 34 | 0.2% |
| Icelander | 10 | 0.1% |
| Indian (Asian) | 57 | 0.4% |
| Irish | 740 | 4.9% |
| Italian | 202 | 1.3% |
| Jamaican | 177 | 1.2% |
| Japanese | 26 | 0.2% |
| Kenyan | 8 | 0.1% |
| Korean | 192 | 1.3% |
| Malaysian | 25 | 0.2% |
| Mexican | 4,657 | 31.0% |
| Mexican American Indian | 89 | 0.6% |
| Native Hawaiian | 48 | 0.3% |
| Norwegian | 88 | 0.6% |
| Pennsylvania German | 22 | 0.2% |
| Polish | 78 | 0.5% |
| Portuguese | 28 | 0.2% |
| Puerto Rican | 72 | 0.5% |
| Romanian | 51 | 0.3% |
| Russian | 31 | 0.2% |
| Salvadoran | 313 | 2.1% |
| Samoan | 15 | 0.1% |
| Scandinavian | 51 | 0.3% |
| Scotch-Irish | 30 | 0.2% |
| Scottish | 110 | 0.7% |
| Slovak | 58 | 0.4% |
| South American | 62 | 0.4% |
| Spaniard | 9 | 0.1% |
| Spanish | 8 | 0.1% |
| Sri Lankan | 43 | 0.3% |
| Subsaharan African | 72 | 0.5% |
| Swedish | 76 | 0.5% |
| Swiss | 44 | 0.3% |
| Turkish | 8 | 0.1% |
| Welsh | 51 | 0.3% |
| Yaqui | 55 | 0.4% | View All 68 Rows |
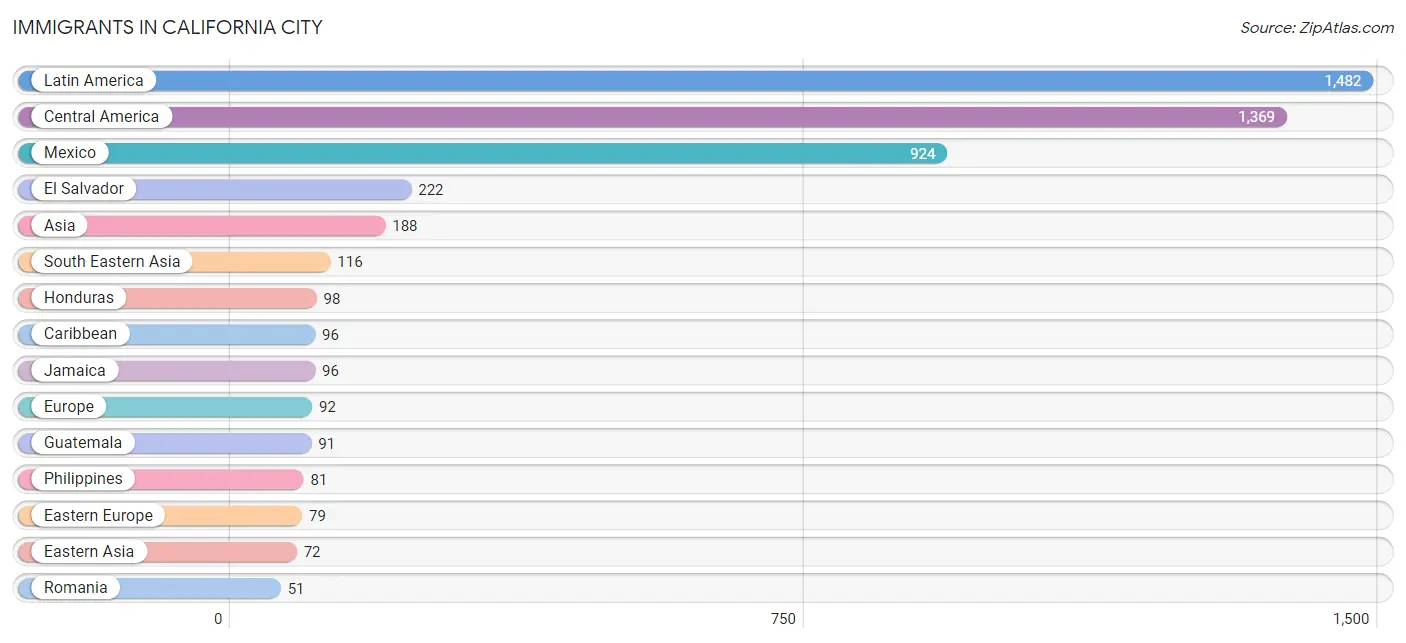
Immigrants in California City
The most numerous immigrant groups reported in California City came from Latin America (1,482 | 9.9%), Central America (1,369 | 9.1%), Mexico (924 | 6.2%), El Salvador (222 | 1.5%), and Asia (188 | 1.3%), together accounting for 27.9% of all California City residents.
| Immigration Origin | # Population | % Population |
| Africa | 8 | 0.1% |
| Asia | 188 | 1.3% |
| Belarus | 7 | 0.1% |
| Belize | 34 | 0.2% |
| Cambodia | 18 | 0.1% |
| Canada | 15 | 0.1% |
| Caribbean | 96 | 0.6% |
| Central America | 1,369 | 9.1% |
| Chile | 9 | 0.1% |
| China | 42 | 0.3% |
| Eastern Africa | 8 | 0.1% |
| Eastern Asia | 72 | 0.5% |
| Eastern Europe | 79 | 0.5% |
| El Salvador | 222 | 1.5% |
| Europe | 92 | 0.6% |
| Guatemala | 91 | 0.6% |
| Honduras | 98 | 0.6% |
| Hong Kong | 18 | 0.1% |
| Hungary | 21 | 0.1% |
| Jamaica | 96 | 0.6% |
| Kenya | 8 | 0.1% |
| Korea | 30 | 0.2% |
| Laos | 8 | 0.1% |
| Latin America | 1,482 | 9.9% |
| Mexico | 924 | 6.2% |
| Northern Europe | 13 | 0.1% |
| Philippines | 81 | 0.5% |
| Romania | 51 | 0.3% |
| South America | 17 | 0.1% |
| South Eastern Asia | 116 | 0.8% |
| Taiwan | 10 | 0.1% |
| Thailand | 9 | 0.1% | View All 32 Rows |
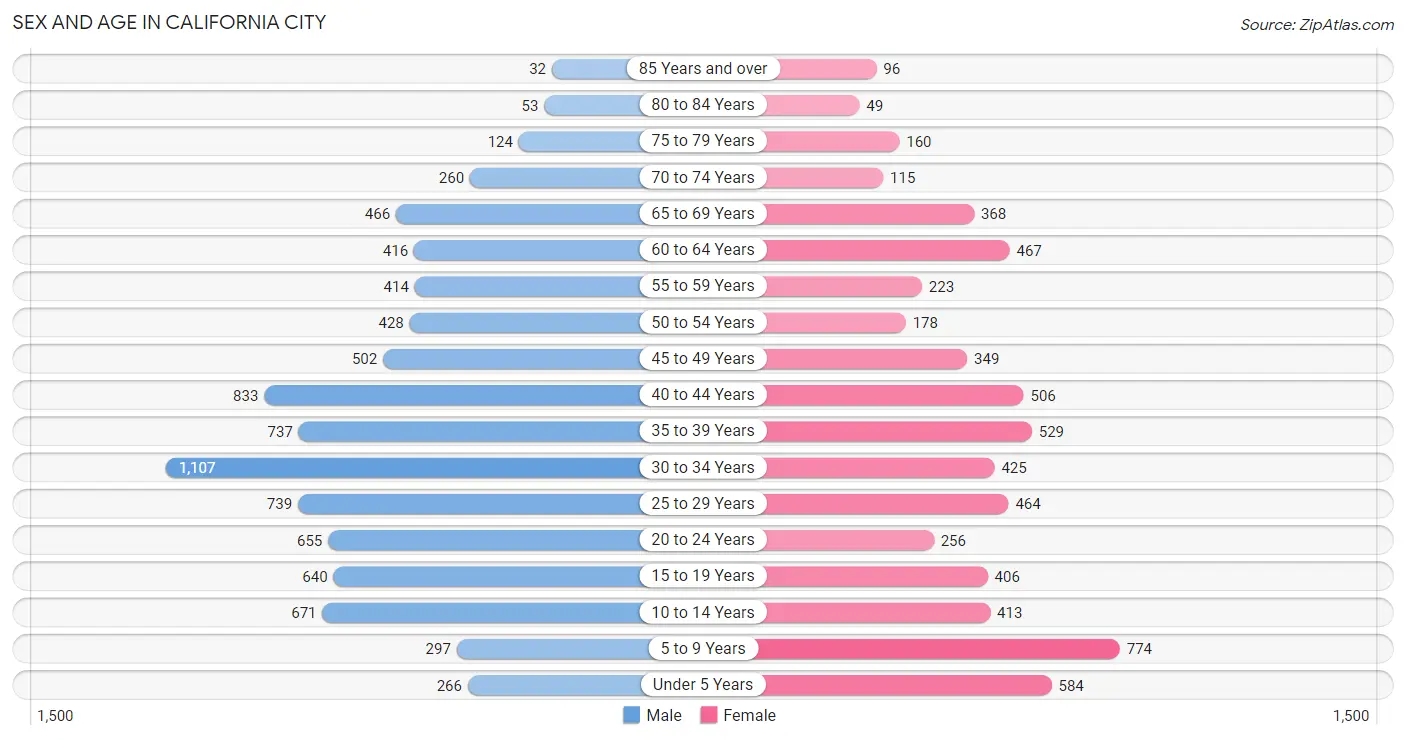
Sex and Age in California City
Sex and Age in California City
The most populous age groups in California City are 30 to 34 Years (1,107 | 12.8%) for men and 5 to 9 Years (774 | 12.2%) for women.
| Age Bracket | Male | Female |
| Under 5 Years | 266 (3.1%) | 584 (9.2%) |
| 5 to 9 Years | 297 (3.4%) | 774 (12.2%) |
| 10 to 14 Years | 671 (7.8%) | 413 (6.5%) |
| 15 to 19 Years | 640 (7.4%) | 406 (6.4%) |
| 20 to 24 Years | 655 (7.6%) | 256 (4.0%) |
| 25 to 29 Years | 739 (8.6%) | 464 (7.3%) |
| 30 to 34 Years | 1,107 (12.8%) | 425 (6.7%) |
| 35 to 39 Years | 737 (8.5%) | 529 (8.3%) |
| 40 to 44 Years | 833 (9.6%) | 506 (8.0%) |
| 45 to 49 Years | 502 (5.8%) | 349 (5.5%) |
| 50 to 54 Years | 428 (5.0%) | 178 (2.8%) |
| 55 to 59 Years | 414 (4.8%) | 223 (3.5%) |
| 60 to 64 Years | 416 (4.8%) | 467 (7.3%) |
| 65 to 69 Years | 466 (5.4%) | 368 (5.8%) |
| 70 to 74 Years | 260 (3.0%) | 115 (1.8%) |
| 75 to 79 Years | 124 (1.4%) | 160 (2.5%) |
| 80 to 84 Years | 53 (0.6%) | 49 (0.8%) |
| 85 Years and over | 32 (0.4%) | 96 (1.5%) |
| Total | 8,640 (100.0%) | 6,362 (100.0%) |
Families and Households in California City
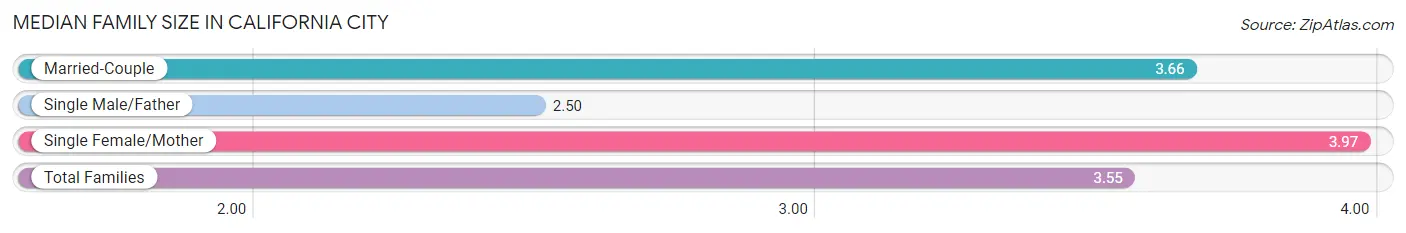
Median Family Size in California City
The median family size in California City is 3.55 persons per family, with single female/mother families (638 | 21.3%) accounting for the largest median family size of 3.97 persons per family. On the other hand, single male/father families (454 | 15.2%) represent the smallest median family size with 2.50 persons per family.
| Family Type | # Families | Family Size |
| Married-Couple | 1,897 (63.5%) | 3.66 |
| Single Male/Father | 454 (15.2%) | 2.50 |
| Single Female/Mother | 638 (21.3%) | 3.97 |
| Total Families | 2,989 (100.0%) | 3.55 |
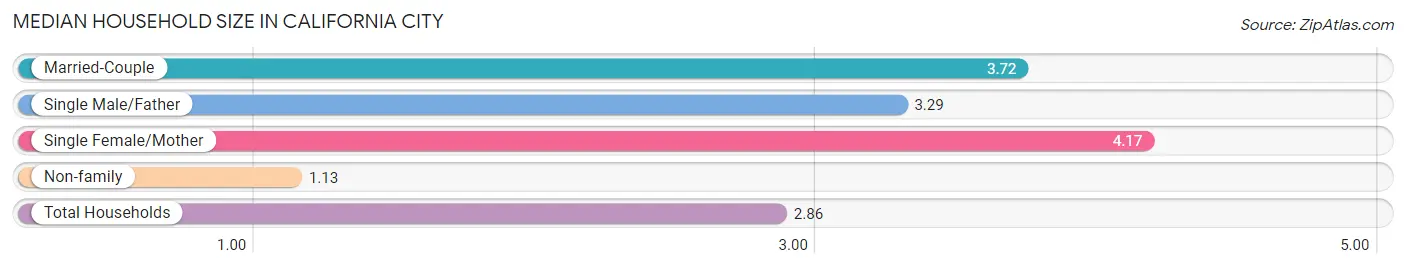
Median Household Size in California City
The median household size in California City is 2.86 persons per household, with single female/mother households (638 | 14.1%) accounting for the largest median household size of 4.17 persons per household. non-family households (1,544 | 34.1%) represent the smallest median household size with 1.13 persons per household.
| Household Type | # Households | Household Size |
| Married-Couple | 1,897 (41.8%) | 3.72 |
| Single Male/Father | 454 (10.0%) | 3.29 |
| Single Female/Mother | 638 (14.1%) | 4.17 |
| Non-family | 1,544 (34.1%) | 1.13 |
| Total Households | 4,533 (100.0%) | 2.86 |
Household Size by Marriage Status in California City
Out of a total of 4,533 households in California City, 2,989 (65.9%) are family households, while 1,544 (34.1%) are nonfamily households. The most numerous type of family households are 2-person households, comprising 894, and the most common type of nonfamily households are 1-person households, comprising 1,347.
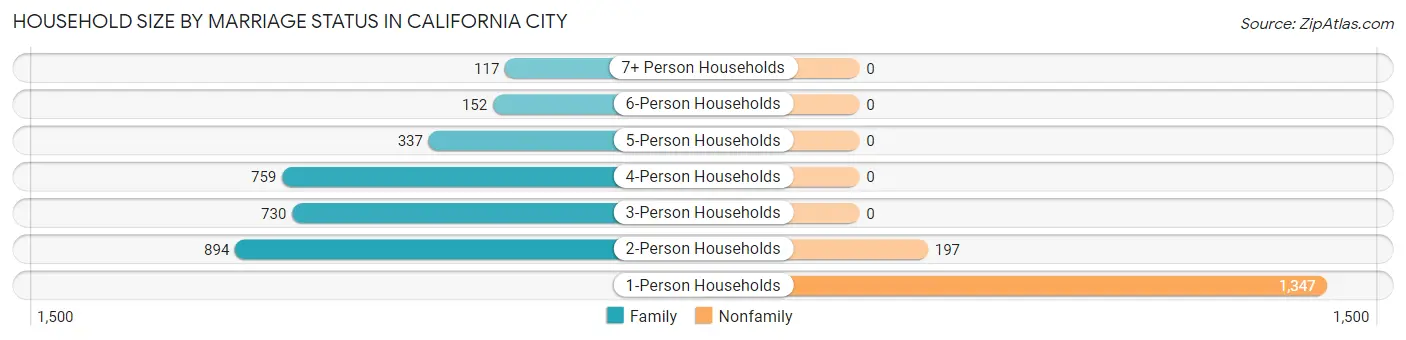
| Household Size | Family Households | Nonfamily Households |
| 1-Person Households | - | 1,347 (29.7%) |
| 2-Person Households | 894 (19.7%) | 197 (4.3%) |
| 3-Person Households | 730 (16.1%) | 0 (0.0%) |
| 4-Person Households | 759 (16.7%) | 0 (0.0%) |
| 5-Person Households | 337 (7.4%) | 0 (0.0%) |
| 6-Person Households | 152 (3.4%) | 0 (0.0%) |
| 7+ Person Households | 117 (2.6%) | 0 (0.0%) |
| Total | 2,989 (65.9%) | 1,544 (34.1%) |
Female Fertility in California City
Fertility by Age in California City
Average fertility rate in California City is 64.0 births per 1,000 women. Women in the age bracket of 20 to 34 years have the highest fertility rate with 143.0 births per 1,000 women. Women in the age bracket of 20 to 34 years acount for 86.8% of all women with births.
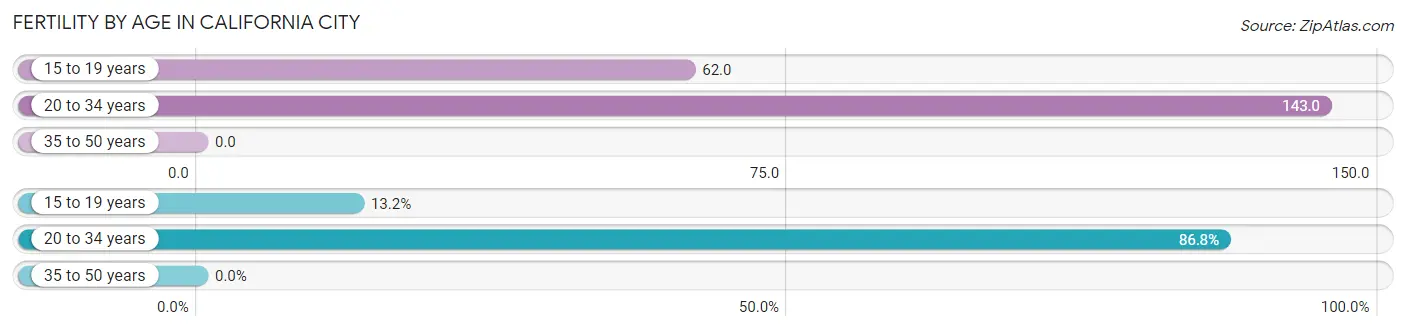
| Age Bracket | Women with Births | Births / 1,000 Women |
| 15 to 19 years | 25 (13.2%) | 62.0 |
| 20 to 34 years | 164 (86.8%) | 143.0 |
| 35 to 50 years | 0 (0.0%) | 0.0 |
| Total | 189 (100.0%) | 64.0 |
Fertility by Age by Marriage Status in California City
34.4% of women with births (189) in California City are married. The highest percentage of unmarried women with births falls into 15 to 19 years age bracket with 100.0% of them unmarried at the time of birth, while the lowest percentage of unmarried women with births belong to 20 to 34 years age bracket with 60.4% of them unmarried.
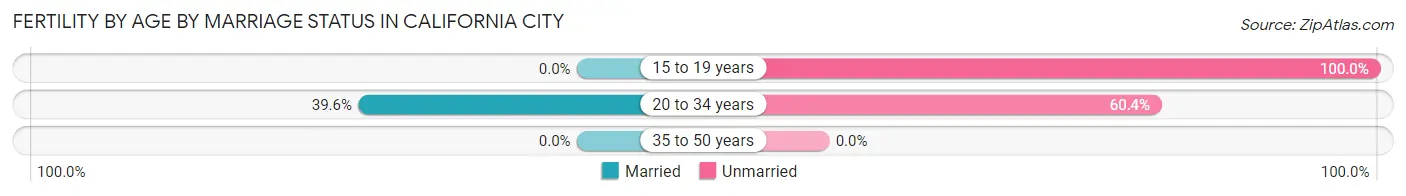
| Age Bracket | Married | Unmarried |
| 15 to 19 years | 0 (0.0%) | 25 (100.0%) |
| 20 to 34 years | 65 (39.6%) | 99 (60.4%) |
| 35 to 50 years | 0 (0.0%) | 0 (0.0%) |
| Total | 65 (34.4%) | 124 (65.6%) |
Fertility by Education in California City
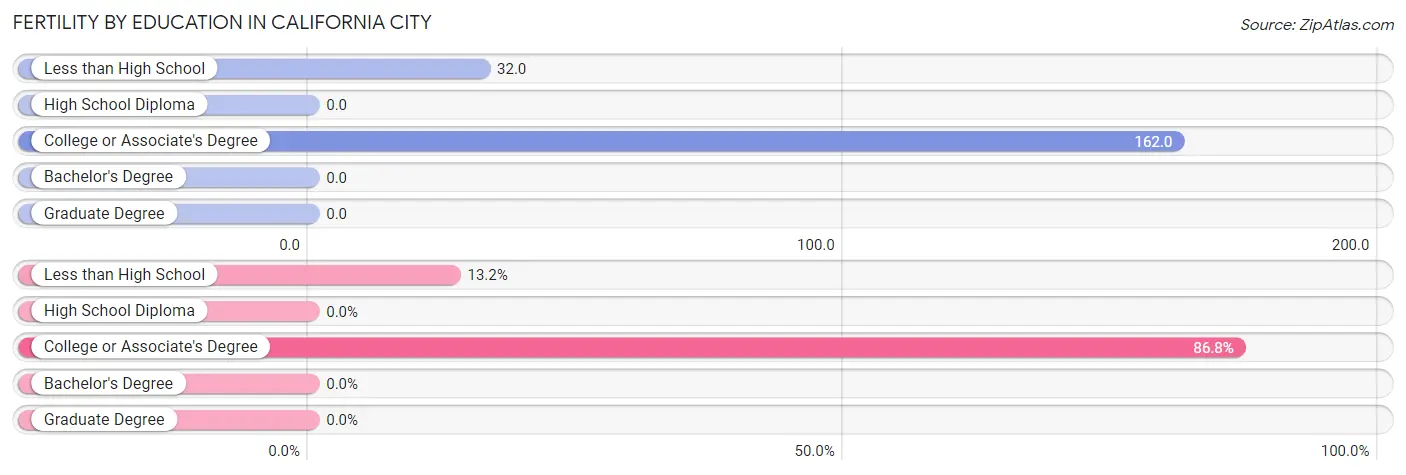
| Educational Attainment | Women with Births | Births / 1,000 Women |
| Less than High School | 25 (13.2%) | 32.0 |
| High School Diploma | 0 (0.0%) | 0.0 |
| College or Associate's Degree | 164 (86.8%) | 162.0 |
| Bachelor's Degree | 0 (0.0%) | 0.0 |
| Graduate Degree | 0 (0.0%) | 0.0 |
| Total | 189 (100.0%) | 64.0 |
Fertility by Education by Marriage Status in California City
65.6% of women with births in California City are unmarried. Women with the educational attainment of college or associate's degree are most likely to be married with 39.6% of them married at childbirth, while women with the educational attainment of less than high school are least likely to be married with 100.0% of them unmarried at childbirth.
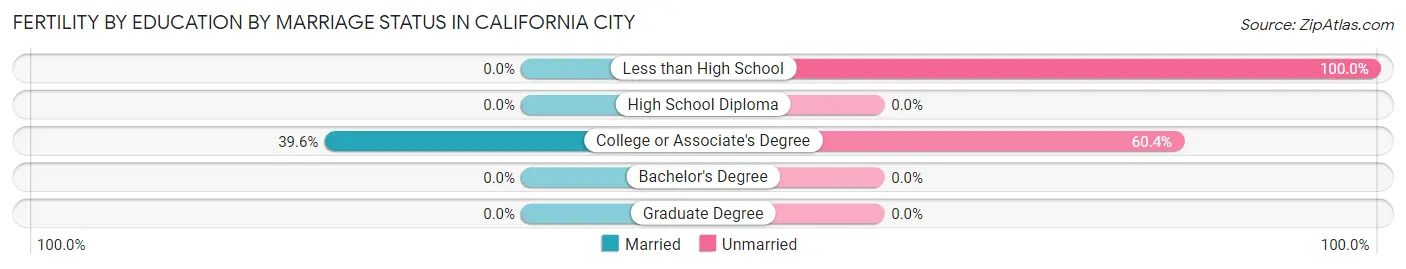
| Educational Attainment | Married | Unmarried |
| Less than High School | 0 (0.0%) | 25 (100.0%) |
| High School Diploma | 0 (0.0%) | 0 (0.0%) |
| College or Associate's Degree | 65 (39.6%) | 99 (60.4%) |
| Bachelor's Degree | 0 (0.0%) | 0 (0.0%) |
| Graduate Degree | 0 (0.0%) | 0 (0.0%) |
| Total | 65 (34.4%) | 124 (65.6%) |
Employment Characteristics in California City
Employment by Class of Employer in California City
Among the 4,535 employed individuals in California City, private company employees (2,751 | 60.7%), federal government employees (692 | 15.3%), and local government employees (657 | 14.5%) make up the most common classes of employment.
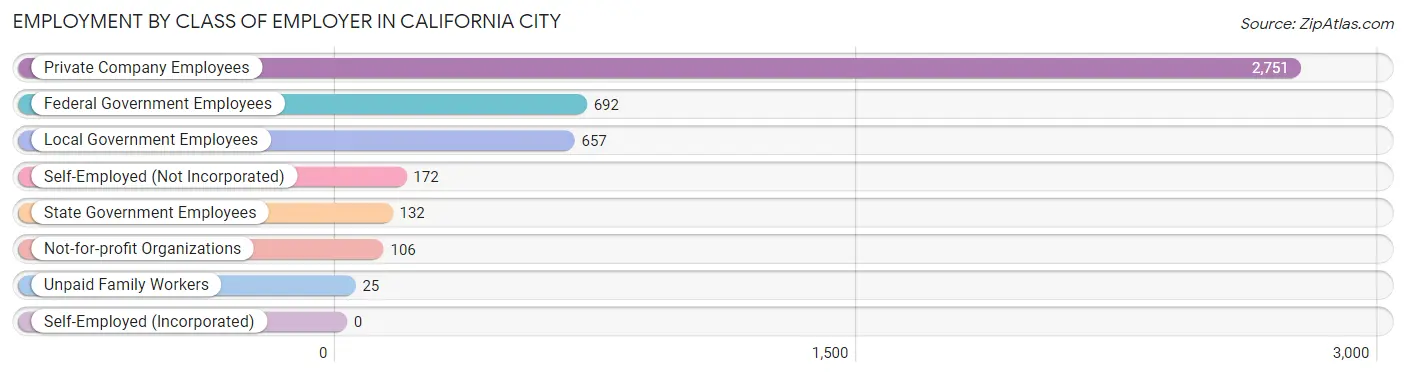
| Employer Class | # Employees | % Employees |
| Private Company Employees | 2,751 | 60.7% |
| Self-Employed (Incorporated) | 0 | 0.0% |
| Self-Employed (Not Incorporated) | 172 | 3.8% |
| Not-for-profit Organizations | 106 | 2.3% |
| Local Government Employees | 657 | 14.5% |
| State Government Employees | 132 | 2.9% |
| Federal Government Employees | 692 | 15.3% |
| Unpaid Family Workers | 25 | 0.5% |
| Total | 4,535 | 100.0% |
Employment Status by Age in California City
According to the labor force statistics for California City, out of the total population over 16 years of age (11,762), 47.7% or 5,610 individuals are in the labor force, with 16.8% or 942 of them unemployed. The age group with the highest labor force participation rate is 35 to 44 years, with 61.8% or 1,610 individuals in the labor force. Within the labor force, the 16 to 19 years age range has the highest percentage of unemployed individuals, with 46.2% or 61 of them being unemployed.
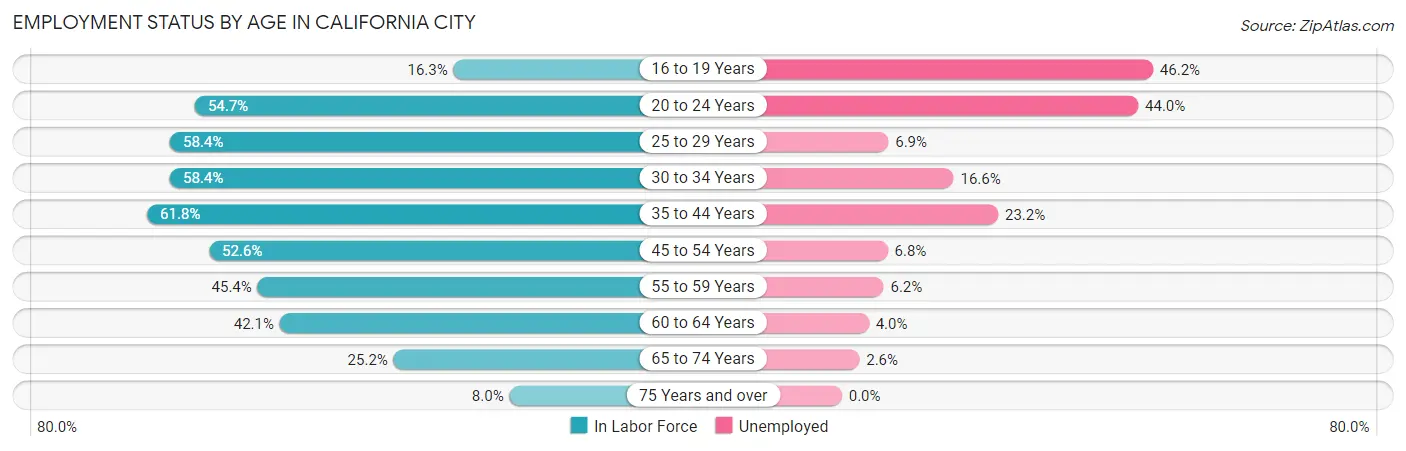
| Age Bracket | In Labor Force | Unemployed |
| 16 to 19 Years | 132 (16.3%) | 61 (46.2%) |
| 20 to 24 Years | 498 (54.7%) | 219 (44.0%) |
| 25 to 29 Years | 703 (58.4%) | 49 (6.9%) |
| 30 to 34 Years | 895 (58.4%) | 149 (16.6%) |
| 35 to 44 Years | 1,610 (61.8%) | 374 (23.2%) |
| 45 to 54 Years | 766 (52.6%) | 52 (6.8%) |
| 55 to 59 Years | 289 (45.4%) | 18 (6.2%) |
| 60 to 64 Years | 372 (42.1%) | 15 (4.0%) |
| 65 to 74 Years | 305 (25.2%) | 8 (2.6%) |
| 75 Years and over | 41 (8.0%) | 0 (0.0%) |
| Total | 5,610 (47.7%) | 942 (16.8%) |
Employment Status by Educational Attainment in California City
According to labor force statistics for California City, 55.7% of individuals (4,633) out of the total population between 25 and 64 years of age (8,317) are in the labor force, with 14.2% or 658 of them being unemployed. The group with the highest labor force participation rate are those with the educational attainment of bachelor's degree or higher, with 79.6% or 555 individuals in the labor force. Within the labor force, individuals with high school diploma education have the highest percentage of unemployment, with 23.8% or 459 of them being unemployed.
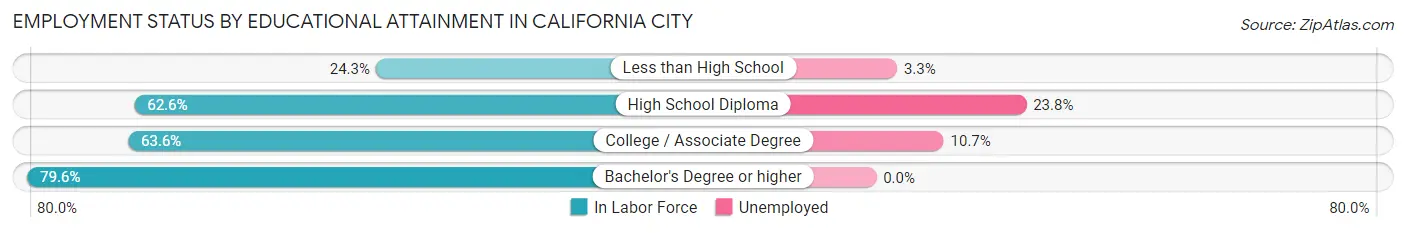
| Educational Attainment | In Labor Force | Unemployed |
| Less than High School | 457 (24.3%) | 62 (3.3%) |
| High School Diploma | 1,930 (62.6%) | 734 (23.8%) |
| College / Associate Degree | 1,690 (63.6%) | 284 (10.7%) |
| Bachelor's Degree or higher | 555 (79.6%) | 0 (0.0%) |
| Total | 4,633 (55.7%) | 1,181 (14.2%) |
Employment Occupations by Sex in California City
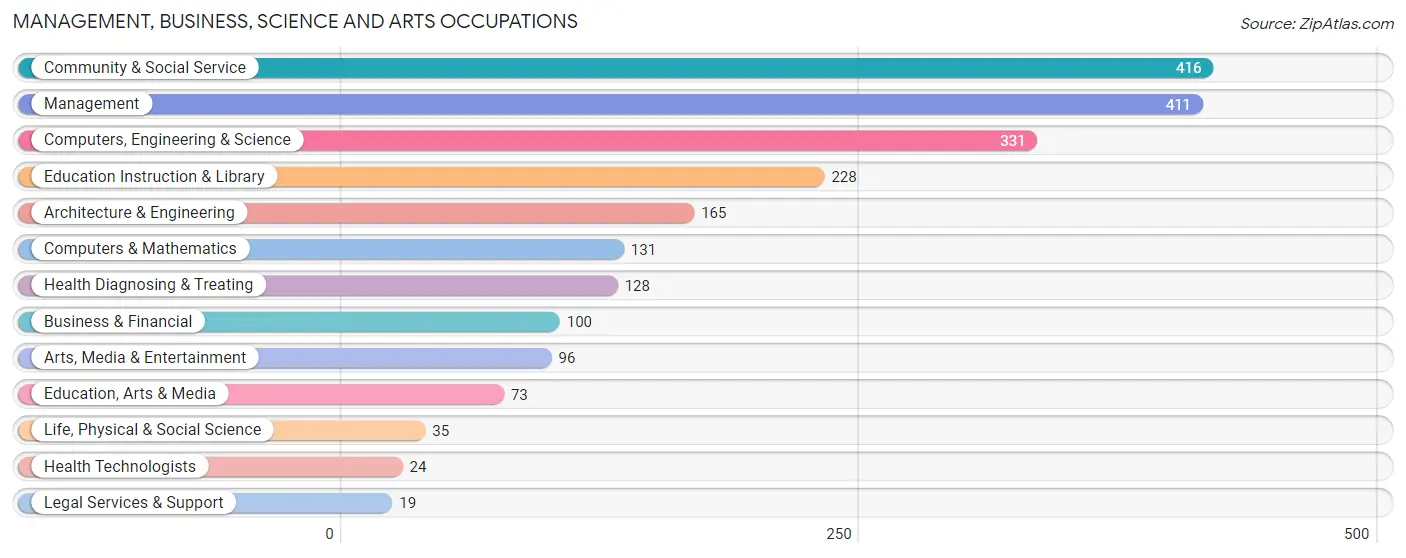
Management, Business, Science and Arts Occupations
The most common Management, Business, Science and Arts occupations in California City are Community & Social Service (416 | 9.0%), Management (411 | 8.9%), Computers, Engineering & Science (331 | 7.2%), Education Instruction & Library (228 | 5.0%), and Architecture & Engineering (165 | 3.6%).
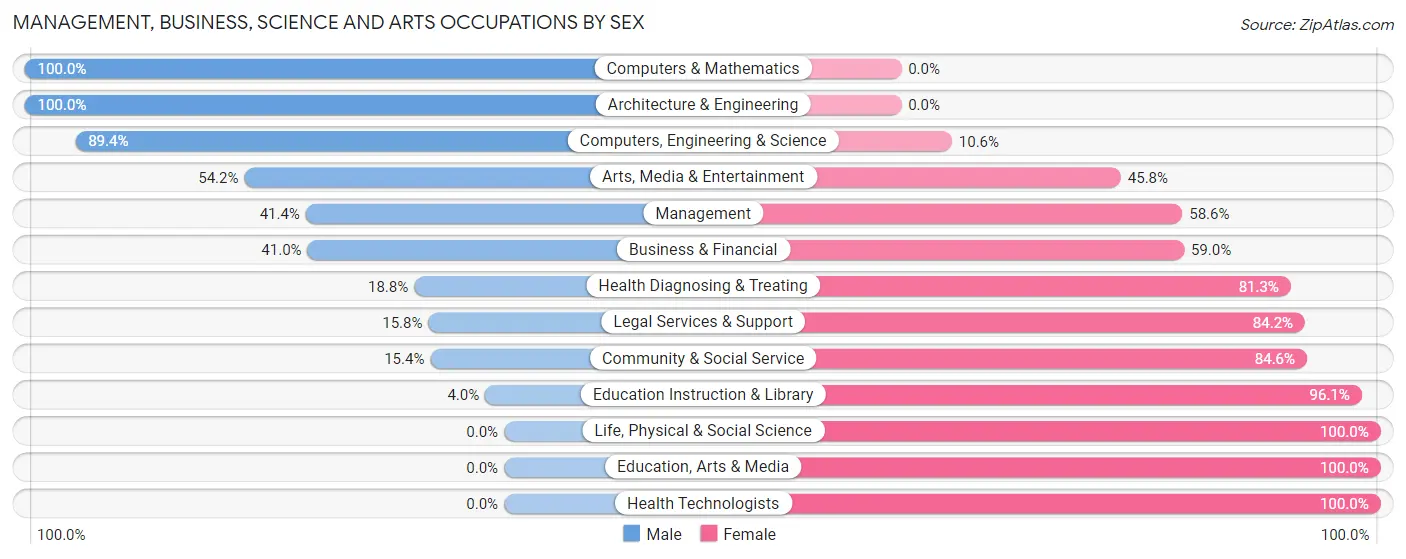
Management, Business, Science and Arts Occupations by Sex
Within the Management, Business, Science and Arts occupations in California City, the most male-oriented occupations are Computers & Mathematics (100.0%), Architecture & Engineering (100.0%), and Computers, Engineering & Science (89.4%), while the most female-oriented occupations are Life, Physical & Social Science (100.0%), Education, Arts & Media (100.0%), and Health Technologists (100.0%).
| Occupation | Male | Female |
| Management | 170 (41.4%) | 241 (58.6%) |
| Business & Financial | 41 (41.0%) | 59 (59.0%) |
| Computers, Engineering & Science | 296 (89.4%) | 35 (10.6%) |
| Computers & Mathematics | 131 (100.0%) | 0 (0.0%) |
| Architecture & Engineering | 165 (100.0%) | 0 (0.0%) |
| Life, Physical & Social Science | 0 (0.0%) | 35 (100.0%) |
| Community & Social Service | 64 (15.4%) | 352 (84.6%) |
| Education, Arts & Media | 0 (0.0%) | 73 (100.0%) |
| Legal Services & Support | 3 (15.8%) | 16 (84.2%) |
| Education Instruction & Library | 9 (4.0%) | 219 (96.1%) |
| Arts, Media & Entertainment | 52 (54.2%) | 44 (45.8%) |
| Health Diagnosing & Treating | 24 (18.8%) | 104 (81.2%) |
| Health Technologists | 0 (0.0%) | 24 (100.0%) |
| Total (Category) | 595 (42.9%) | 791 (57.1%) |
| Total (Overall) | 2,419 (52.6%) | 2,181 (47.4%) |
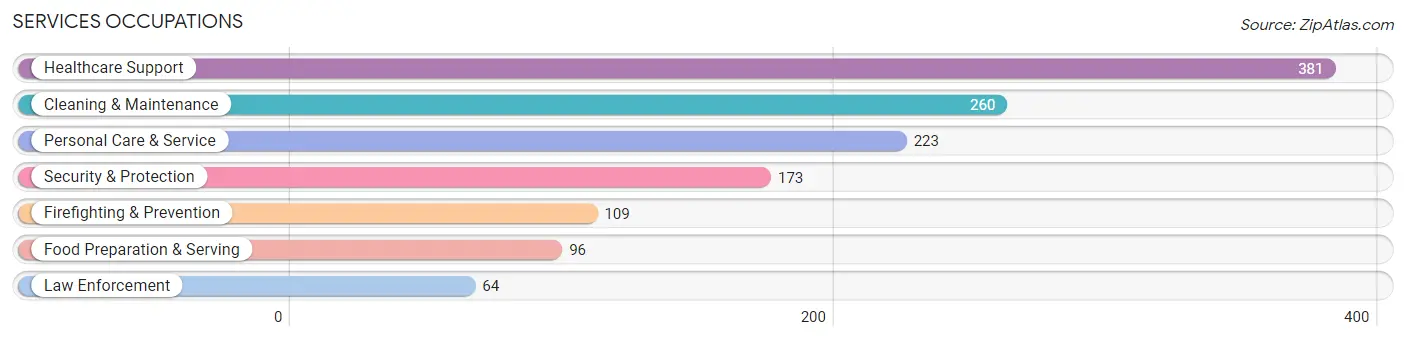
Services Occupations
The most common Services occupations in California City are Healthcare Support (381 | 8.3%), Cleaning & Maintenance (260 | 5.7%), Personal Care & Service (223 | 4.9%), Security & Protection (173 | 3.8%), and Firefighting & Prevention (109 | 2.4%).
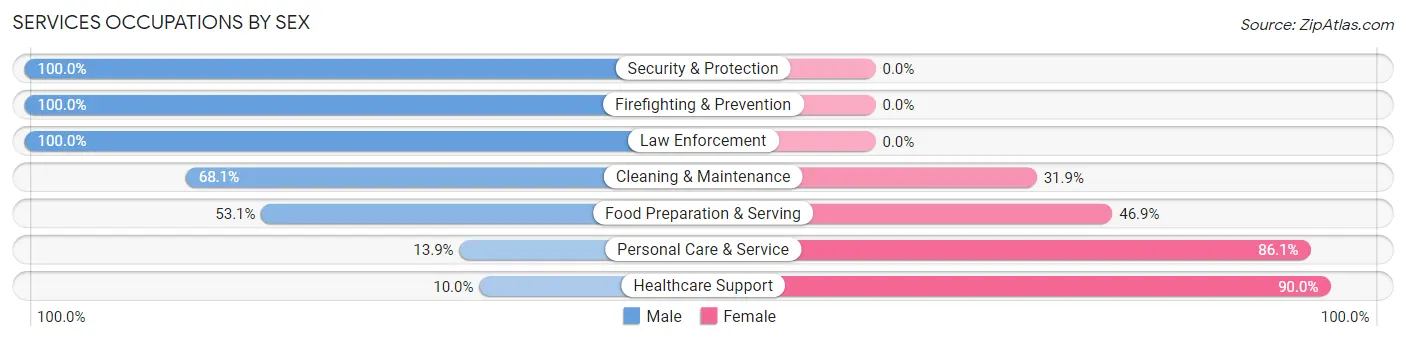
Services Occupations by Sex
Within the Services occupations in California City, the most male-oriented occupations are Security & Protection (100.0%), Firefighting & Prevention (100.0%), and Law Enforcement (100.0%), while the most female-oriented occupations are Healthcare Support (90.0%), Personal Care & Service (86.1%), and Food Preparation & Serving (46.9%).
| Occupation | Male | Female |
| Healthcare Support | 38 (10.0%) | 343 (90.0%) |
| Security & Protection | 173 (100.0%) | 0 (0.0%) |
| Firefighting & Prevention | 109 (100.0%) | 0 (0.0%) |
| Law Enforcement | 64 (100.0%) | 0 (0.0%) |
| Food Preparation & Serving | 51 (53.1%) | 45 (46.9%) |
| Cleaning & Maintenance | 177 (68.1%) | 83 (31.9%) |
| Personal Care & Service | 31 (13.9%) | 192 (86.1%) |
| Total (Category) | 470 (41.5%) | 663 (58.5%) |
| Total (Overall) | 2,419 (52.6%) | 2,181 (47.4%) |
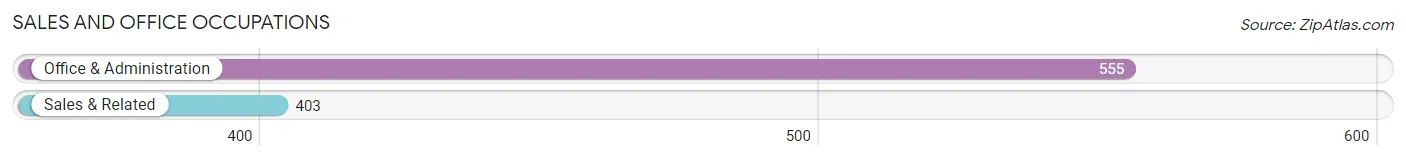
Sales and Office Occupations
The most common Sales and Office occupations in California City are Office & Administration (555 | 12.1%), and Sales & Related (403 | 8.8%).
Sales and Office Occupations by Sex
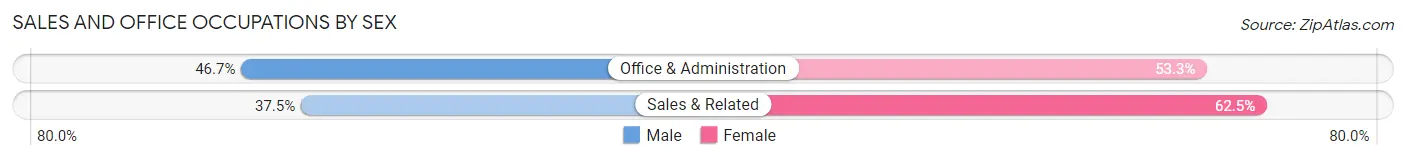
| Occupation | Male | Female |
| Sales & Related | 151 (37.5%) | 252 (62.5%) |
| Office & Administration | 259 (46.7%) | 296 (53.3%) |
| Total (Category) | 410 (42.8%) | 548 (57.2%) |
| Total (Overall) | 2,419 (52.6%) | 2,181 (47.4%) |
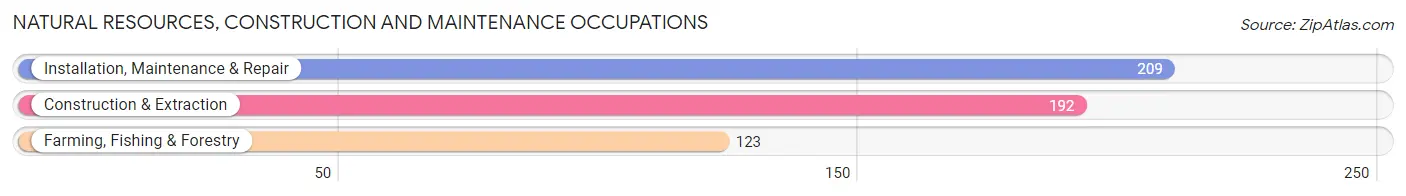
Natural Resources, Construction and Maintenance Occupations
The most common Natural Resources, Construction and Maintenance occupations in California City are Installation, Maintenance & Repair (209 | 4.5%), Construction & Extraction (192 | 4.2%), and Farming, Fishing & Forestry (123 | 2.7%).
Natural Resources, Construction and Maintenance Occupations by Sex
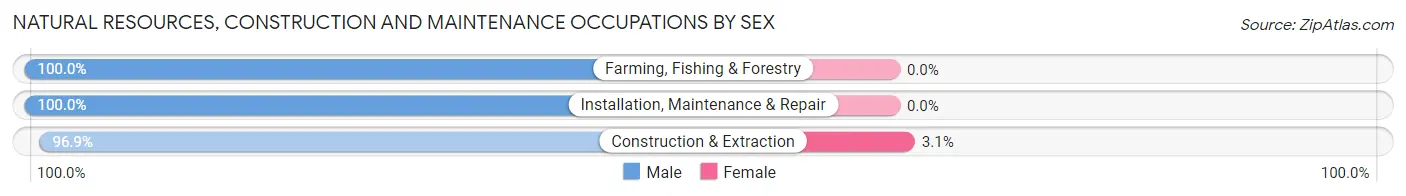
| Occupation | Male | Female |
| Farming, Fishing & Forestry | 123 (100.0%) | 0 (0.0%) |
| Construction & Extraction | 186 (96.9%) | 6 (3.1%) |
| Installation, Maintenance & Repair | 209 (100.0%) | 0 (0.0%) |
| Total (Category) | 518 (98.9%) | 6 (1.1%) |
| Total (Overall) | 2,419 (52.6%) | 2,181 (47.4%) |
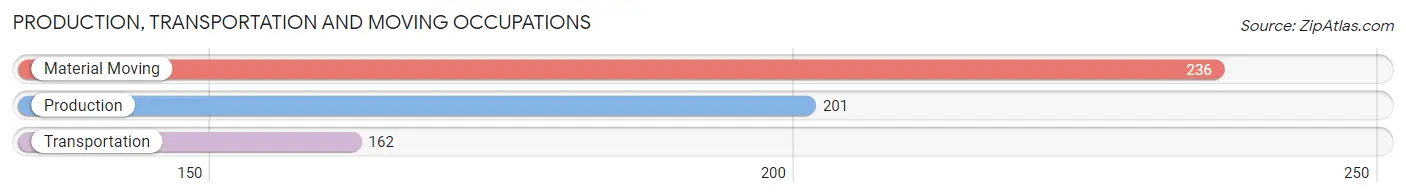
Production, Transportation and Moving Occupations
The most common Production, Transportation and Moving occupations in California City are Material Moving (236 | 5.1%), Production (201 | 4.4%), and Transportation (162 | 3.5%).
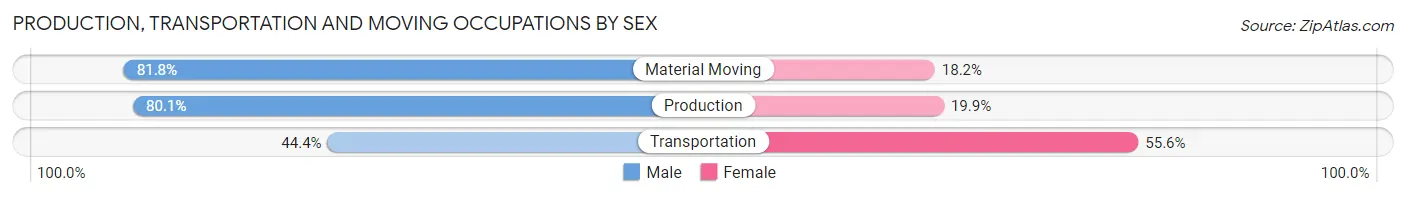
Production, Transportation and Moving Occupations by Sex
| Occupation | Male | Female |
| Production | 161 (80.1%) | 40 (19.9%) |
| Transportation | 72 (44.4%) | 90 (55.6%) |
| Material Moving | 193 (81.8%) | 43 (18.2%) |
| Total (Category) | 426 (71.1%) | 173 (28.9%) |
| Total (Overall) | 2,419 (52.6%) | 2,181 (47.4%) |
Employment Industries by Sex in California City
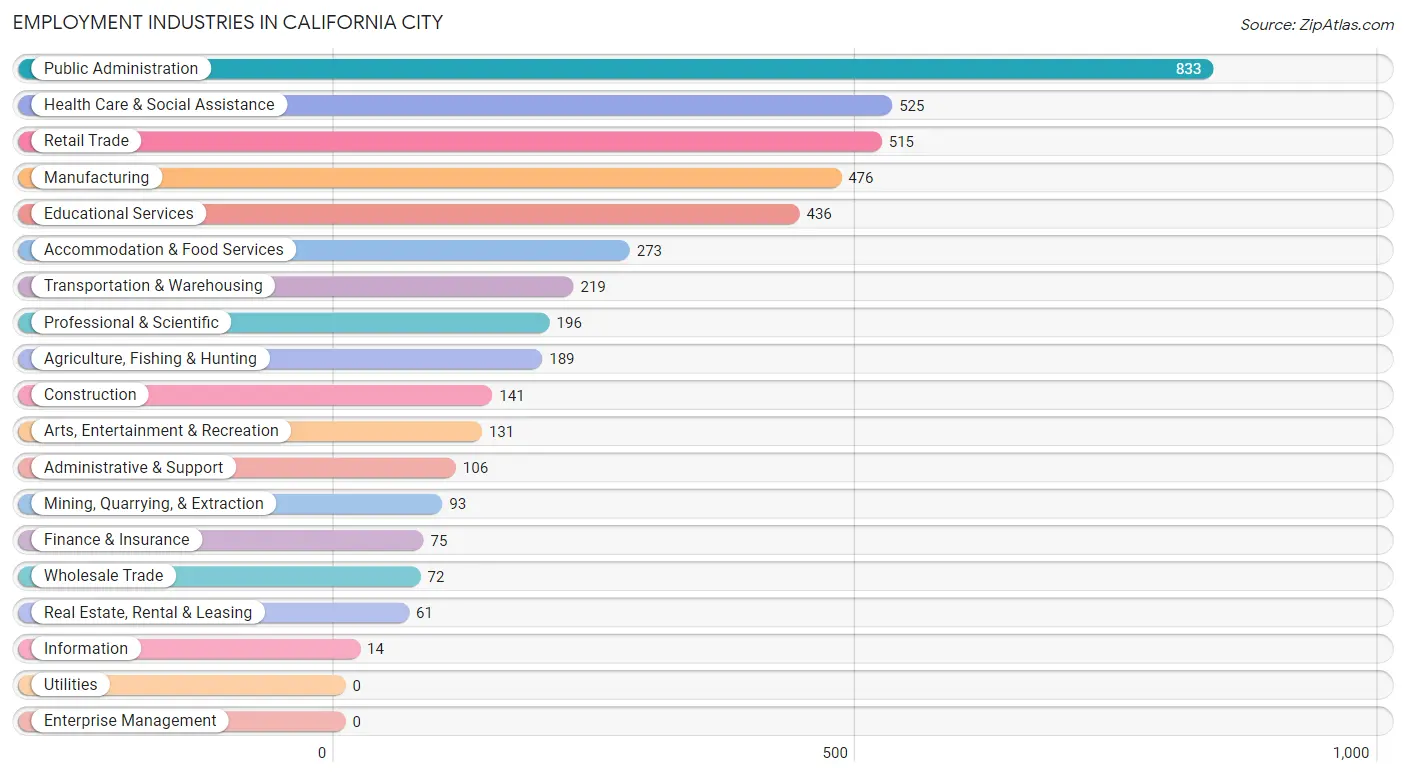
Employment Industries in California City
The major employment industries in California City include Public Administration (833 | 18.1%), Health Care & Social Assistance (525 | 11.4%), Retail Trade (515 | 11.2%), Manufacturing (476 | 10.3%), and Educational Services (436 | 9.5%).
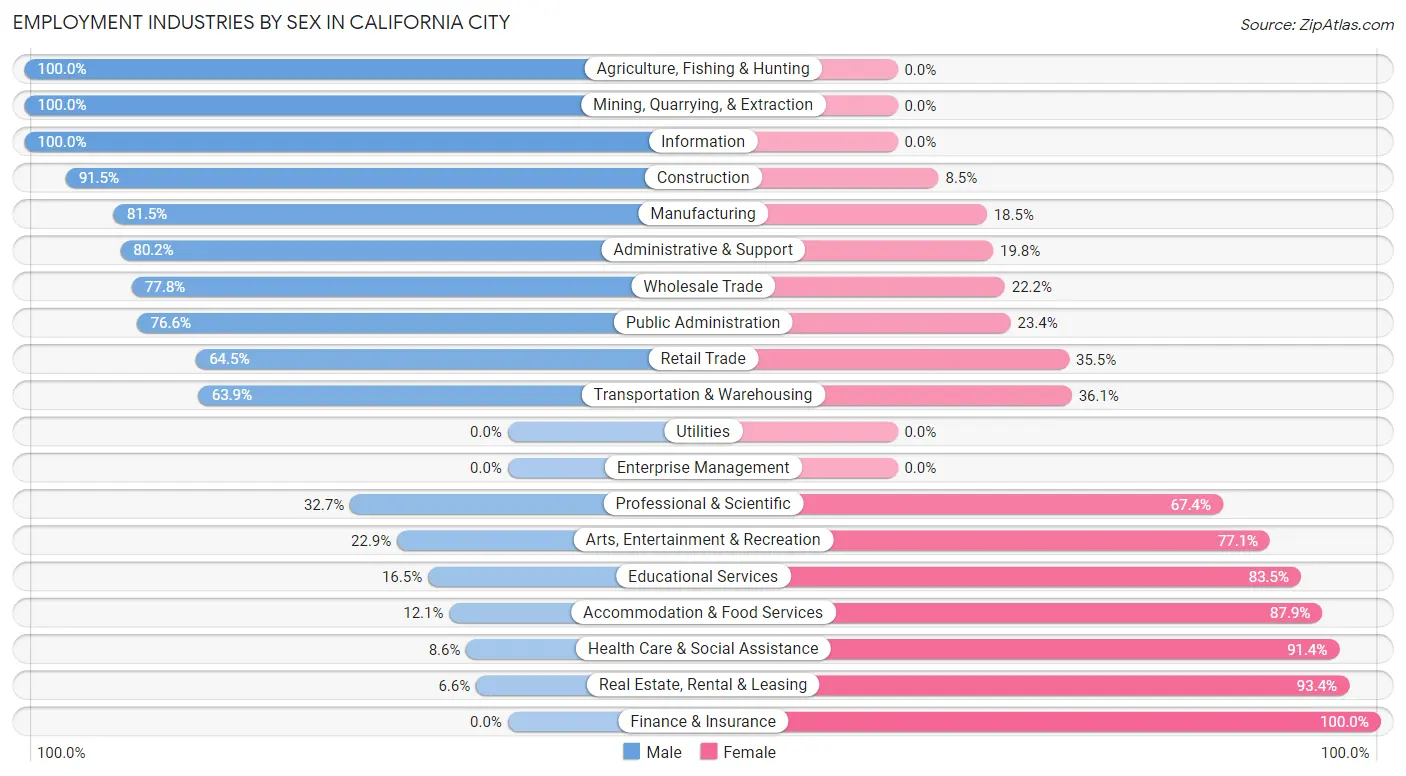
Employment Industries by Sex in California City
The California City industries that see more men than women are Agriculture, Fishing & Hunting (100.0%), Mining, Quarrying, & Extraction (100.0%), and Information (100.0%), whereas the industries that tend to have a higher number of women are Finance & Insurance (100.0%), Real Estate, Rental & Leasing (93.4%), and Health Care & Social Assistance (91.4%).
| Industry | Male | Female |
| Agriculture, Fishing & Hunting | 189 (100.0%) | 0 (0.0%) |
| Mining, Quarrying, & Extraction | 93 (100.0%) | 0 (0.0%) |
| Construction | 129 (91.5%) | 12 (8.5%) |
| Manufacturing | 388 (81.5%) | 88 (18.5%) |
| Wholesale Trade | 56 (77.8%) | 16 (22.2%) |
| Retail Trade | 332 (64.5%) | 183 (35.5%) |
| Transportation & Warehousing | 140 (63.9%) | 79 (36.1%) |
| Utilities | 0 (0.0%) | 0 (0.0%) |
| Information | 14 (100.0%) | 0 (0.0%) |
| Finance & Insurance | 0 (0.0%) | 75 (100.0%) |
| Real Estate, Rental & Leasing | 4 (6.6%) | 57 (93.4%) |
| Professional & Scientific | 64 (32.7%) | 132 (67.3%) |
| Enterprise Management | 0 (0.0%) | 0 (0.0%) |
| Administrative & Support | 85 (80.2%) | 21 (19.8%) |
| Educational Services | 72 (16.5%) | 364 (83.5%) |
| Health Care & Social Assistance | 45 (8.6%) | 480 (91.4%) |
| Arts, Entertainment & Recreation | 30 (22.9%) | 101 (77.1%) |
| Accommodation & Food Services | 33 (12.1%) | 240 (87.9%) |
| Public Administration | 638 (76.6%) | 195 (23.4%) |
| Total | 2,419 (52.6%) | 2,181 (47.4%) |
Education in California City
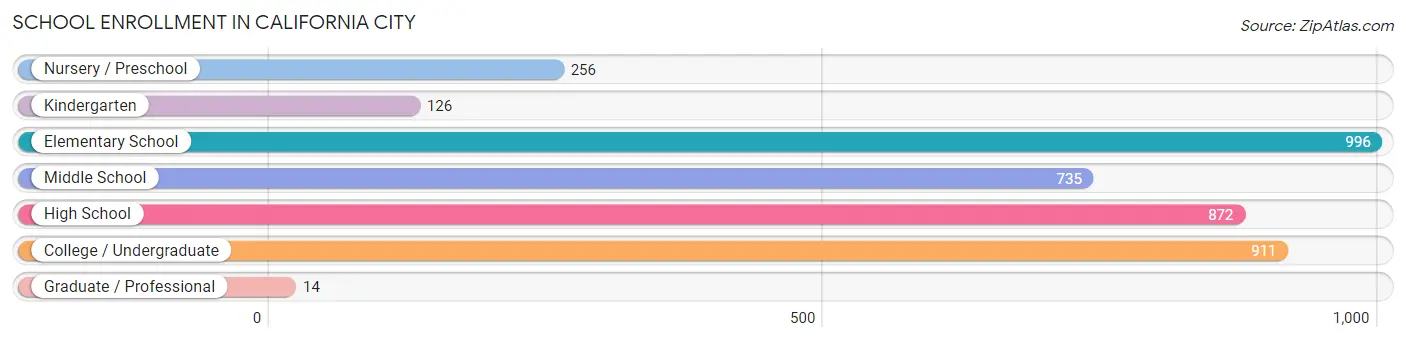
School Enrollment in California City
The most common levels of schooling among the 3,910 students in California City are elementary school (996 | 25.5%), college / undergraduate (911 | 23.3%), and high school (872 | 22.3%).
| School Level | # Students | % Students |
| Nursery / Preschool | 256 | 6.6% |
| Kindergarten | 126 | 3.2% |
| Elementary School | 996 | 25.5% |
| Middle School | 735 | 18.8% |
| High School | 872 | 22.3% |
| College / Undergraduate | 911 | 23.3% |
| Graduate / Professional | 14 | 0.4% |
| Total | 3,910 | 100.0% |
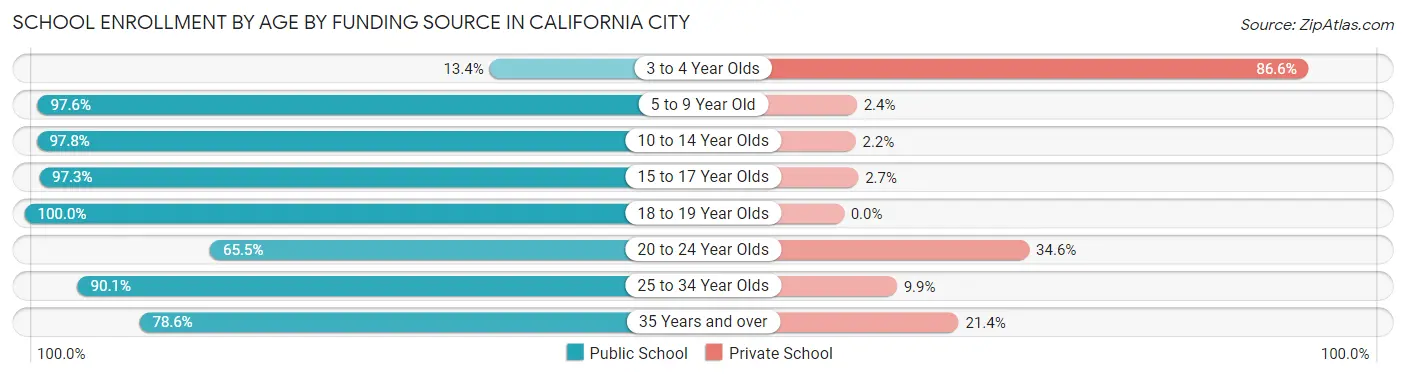
School Enrollment by Age by Funding Source in California City
Out of a total of 3,910 students who are enrolled in schools in California City, 344 (8.8%) attend a private institution, while the remaining 3,566 (91.2%) are enrolled in public schools. The age group of 3 to 4 year olds has the highest likelihood of being enrolled in private schools, with 71 (86.6% in the age bracket) enrolled. Conversely, the age group of 18 to 19 year olds has the lowest likelihood of being enrolled in a private school, with 151 (100.0% in the age bracket) attending a public institution.
| Age Bracket | Public School | Private School |
| 3 to 4 Year Olds | 11 (13.4%) | 71 (86.6%) |
| 5 to 9 Year Old | 1,045 (97.6%) | 26 (2.4%) |
| 10 to 14 Year Olds | 1,060 (97.8%) | 24 (2.2%) |
| 15 to 17 Year Olds | 431 (97.3%) | 12 (2.7%) |
| 18 to 19 Year Olds | 151 (100.0%) | 0 (0.0%) |
| 20 to 24 Year Olds | 144 (65.4%) | 76 (34.5%) |
| 25 to 34 Year Olds | 374 (90.1%) | 41 (9.9%) |
| 35 Years and over | 349 (78.6%) | 95 (21.4%) |
| Total | 3,566 (91.2%) | 344 (8.8%) |
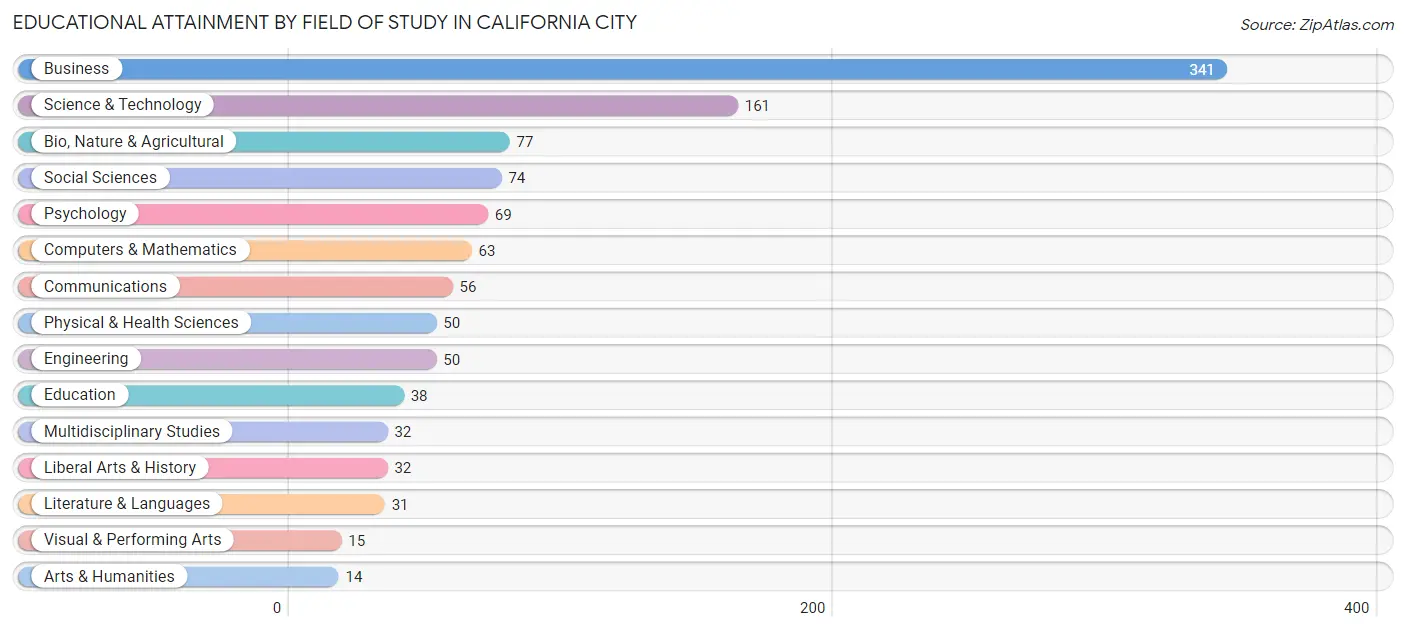
Educational Attainment by Field of Study in California City
Business (341 | 30.9%), science & technology (161 | 14.6%), bio, nature & agricultural (77 | 7.0%), social sciences (74 | 6.7%), and psychology (69 | 6.3%) are the most common fields of study among 1,103 individuals in California City who have obtained a bachelor's degree or higher.
| Field of Study | # Graduates | % Graduates |
| Computers & Mathematics | 63 | 5.7% |
| Bio, Nature & Agricultural | 77 | 7.0% |
| Physical & Health Sciences | 50 | 4.5% |
| Psychology | 69 | 6.3% |
| Social Sciences | 74 | 6.7% |
| Engineering | 50 | 4.5% |
| Multidisciplinary Studies | 32 | 2.9% |
| Science & Technology | 161 | 14.6% |
| Business | 341 | 30.9% |
| Education | 38 | 3.5% |
| Literature & Languages | 31 | 2.8% |
| Liberal Arts & History | 32 | 2.9% |
| Visual & Performing Arts | 15 | 1.4% |
| Communications | 56 | 5.1% |
| Arts & Humanities | 14 | 1.3% |
| Total | 1,103 | 100.0% |
Transportation & Commute in California City
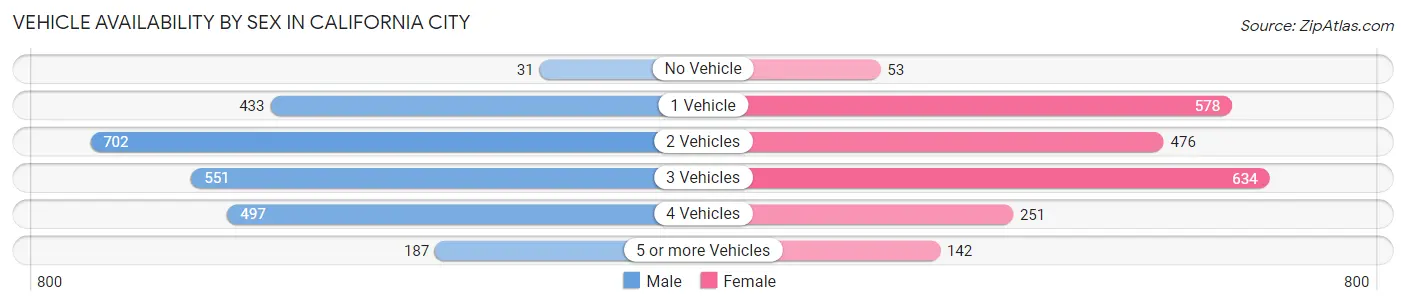
Vehicle Availability by Sex in California City
The most prevalent vehicle ownership categories in California City are males with 2 vehicles (702, accounting for 29.2%) and females with 2 vehicles (476, making up 32.9%).
| Vehicles Available | Male | Female |
| No Vehicle | 31 (1.3%) | 53 (2.5%) |
| 1 Vehicle | 433 (18.0%) | 578 (27.1%) |
| 2 Vehicles | 702 (29.2%) | 476 (22.3%) |
| 3 Vehicles | 551 (23.0%) | 634 (29.7%) |
| 4 Vehicles | 497 (20.7%) | 251 (11.8%) |
| 5 or more Vehicles | 187 (7.8%) | 142 (6.7%) |
| Total | 2,401 (100.0%) | 2,134 (100.0%) |
Commute Time in California City
The most frequently occuring commute durations in California City are 30 to 34 minutes (686 commuters, 16.9%), 45 to 59 minutes (577 commuters, 14.2%), and 60 to 89 minutes (546 commuters, 13.5%).
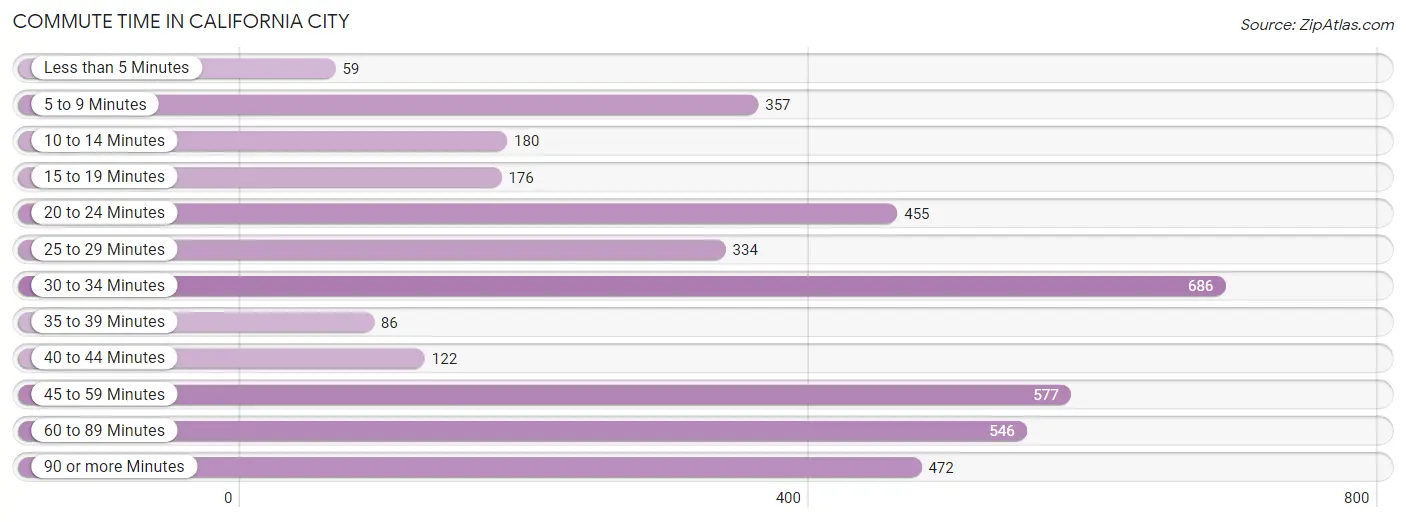
| Commute Time | # Commuters | % Commuters |
| Less than 5 Minutes | 59 | 1.5% |
| 5 to 9 Minutes | 357 | 8.8% |
| 10 to 14 Minutes | 180 | 4.4% |
| 15 to 19 Minutes | 176 | 4.3% |
| 20 to 24 Minutes | 455 | 11.2% |
| 25 to 29 Minutes | 334 | 8.3% |
| 30 to 34 Minutes | 686 | 16.9% |
| 35 to 39 Minutes | 86 | 2.1% |
| 40 to 44 Minutes | 122 | 3.0% |
| 45 to 59 Minutes | 577 | 14.2% |
| 60 to 89 Minutes | 546 | 13.5% |
| 90 or more Minutes | 472 | 11.7% |
Commute Time by Sex in California City
The most common commute times in California City are 30 to 34 minutes (519 commuters, 23.5%) for males and 60 to 89 minutes (277 commuters, 15.0%) for females.
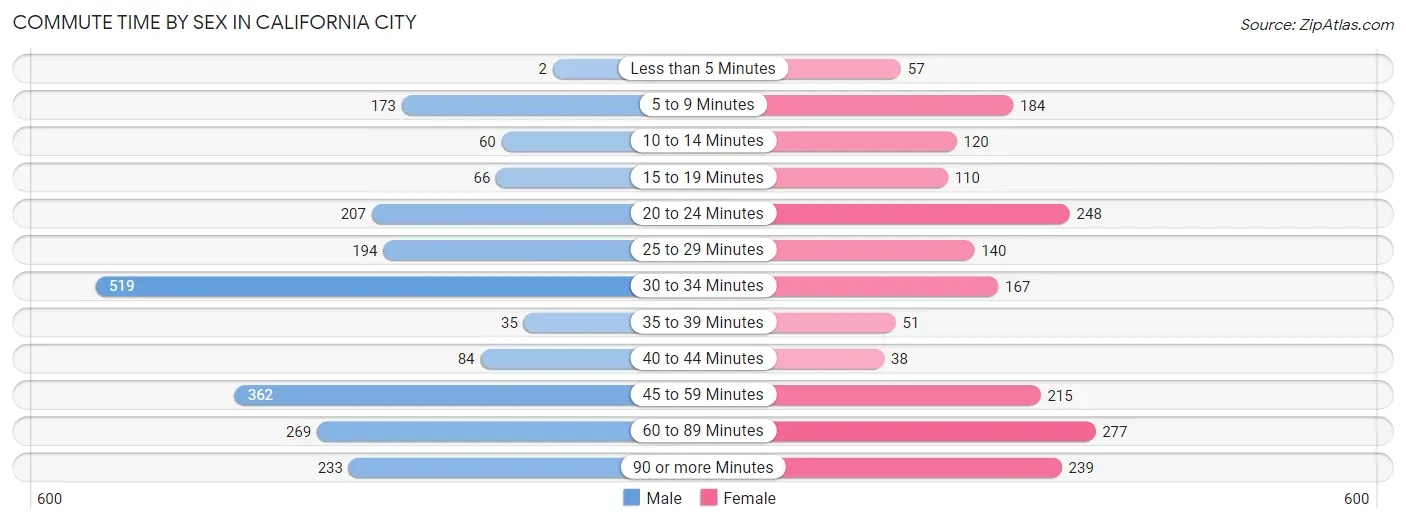
| Commute Time | Male | Female |
| Less than 5 Minutes | 2 (0.1%) | 57 (3.1%) |
| 5 to 9 Minutes | 173 (7.9%) | 184 (10.0%) |
| 10 to 14 Minutes | 60 (2.7%) | 120 (6.5%) |
| 15 to 19 Minutes | 66 (3.0%) | 110 (6.0%) |
| 20 to 24 Minutes | 207 (9.4%) | 248 (13.4%) |
| 25 to 29 Minutes | 194 (8.8%) | 140 (7.6%) |
| 30 to 34 Minutes | 519 (23.5%) | 167 (9.0%) |
| 35 to 39 Minutes | 35 (1.6%) | 51 (2.8%) |
| 40 to 44 Minutes | 84 (3.8%) | 38 (2.1%) |
| 45 to 59 Minutes | 362 (16.4%) | 215 (11.7%) |
| 60 to 89 Minutes | 269 (12.2%) | 277 (15.0%) |
| 90 or more Minutes | 233 (10.6%) | 239 (13.0%) |
Time of Departure to Work by Sex in California City
The most frequent times of departure to work in California City are 6:00 AM to 6:29 AM (346, 15.7%) for males and 8:00 AM to 8:29 AM (282, 15.3%) for females.
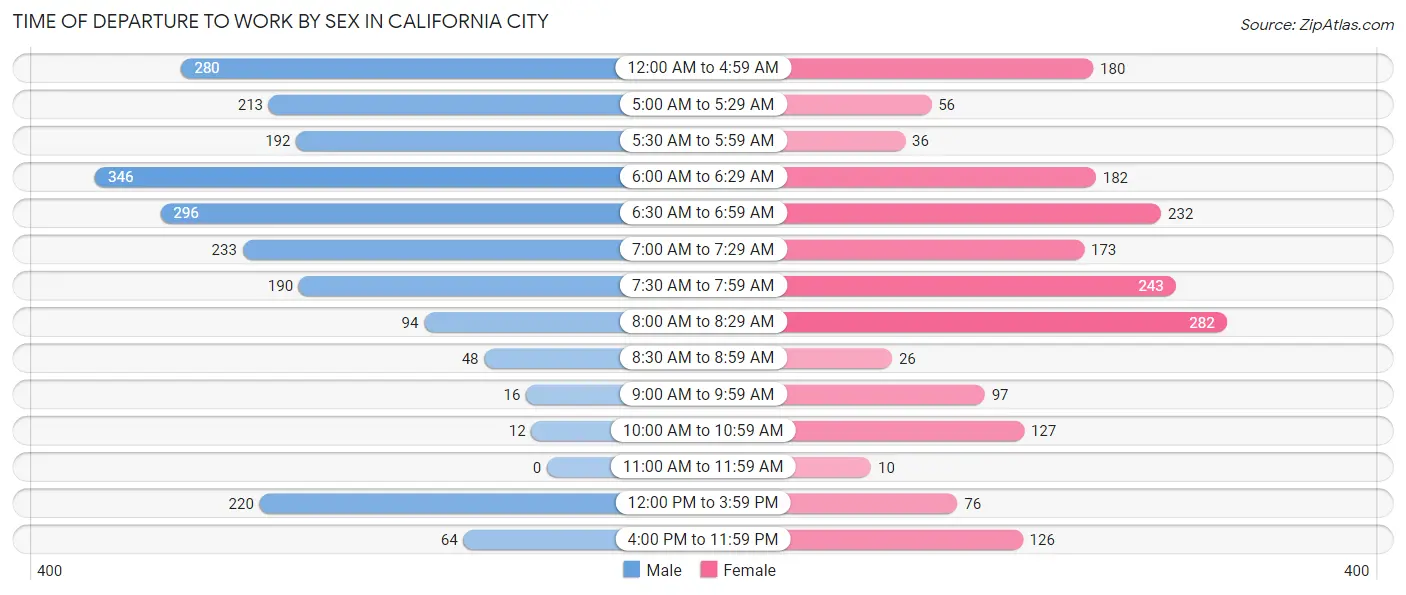
| Time of Departure | Male | Female |
| 12:00 AM to 4:59 AM | 280 (12.7%) | 180 (9.8%) |
| 5:00 AM to 5:29 AM | 213 (9.7%) | 56 (3.0%) |
| 5:30 AM to 5:59 AM | 192 (8.7%) | 36 (1.9%) |
| 6:00 AM to 6:29 AM | 346 (15.7%) | 182 (9.9%) |
| 6:30 AM to 6:59 AM | 296 (13.4%) | 232 (12.6%) |
| 7:00 AM to 7:29 AM | 233 (10.6%) | 173 (9.4%) |
| 7:30 AM to 7:59 AM | 190 (8.6%) | 243 (13.2%) |
| 8:00 AM to 8:29 AM | 94 (4.3%) | 282 (15.3%) |
| 8:30 AM to 8:59 AM | 48 (2.2%) | 26 (1.4%) |
| 9:00 AM to 9:59 AM | 16 (0.7%) | 97 (5.2%) |
| 10:00 AM to 10:59 AM | 12 (0.5%) | 127 (6.9%) |
| 11:00 AM to 11:59 AM | 0 (0.0%) | 10 (0.5%) |
| 12:00 PM to 3:59 PM | 220 (10.0%) | 76 (4.1%) |
| 4:00 PM to 11:59 PM | 64 (2.9%) | 126 (6.8%) |
| Total | 2,204 (100.0%) | 1,846 (100.0%) |
Housing Occupancy in California City
Occupancy by Ownership in California City
Of the total 4,533 dwellings in California City, owner-occupied units account for 2,712 (59.8%), while renter-occupied units make up 1,821 (40.2%).
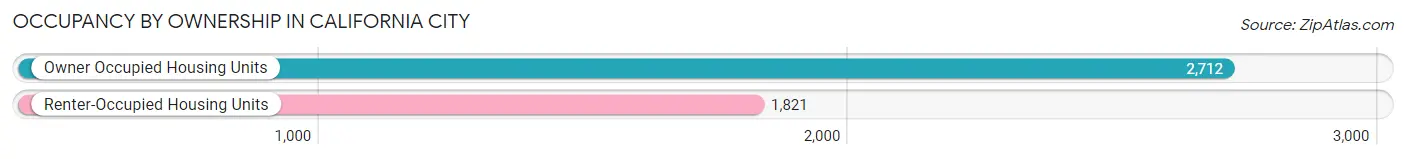
| Occupancy | # Housing Units | % Housing Units |
| Owner Occupied Housing Units | 2,712 | 59.8% |
| Renter-Occupied Housing Units | 1,821 | 40.2% |
| Total Occupied Housing Units | 4,533 | 100.0% |
Occupancy by Household Size in California City
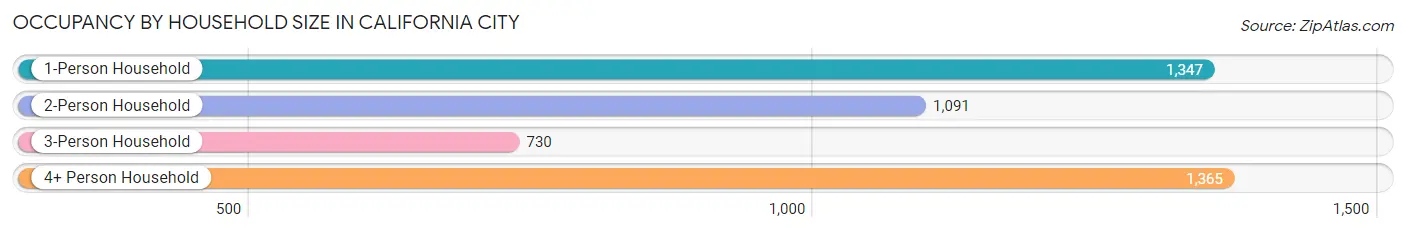
| Household Size | # Housing Units | % Housing Units |
| 1-Person Household | 1,347 | 29.7% |
| 2-Person Household | 1,091 | 24.1% |
| 3-Person Household | 730 | 16.1% |
| 4+ Person Household | 1,365 | 30.1% |
| Total Housing Units | 4,533 | 100.0% |
Occupancy by Ownership by Household Size in California City
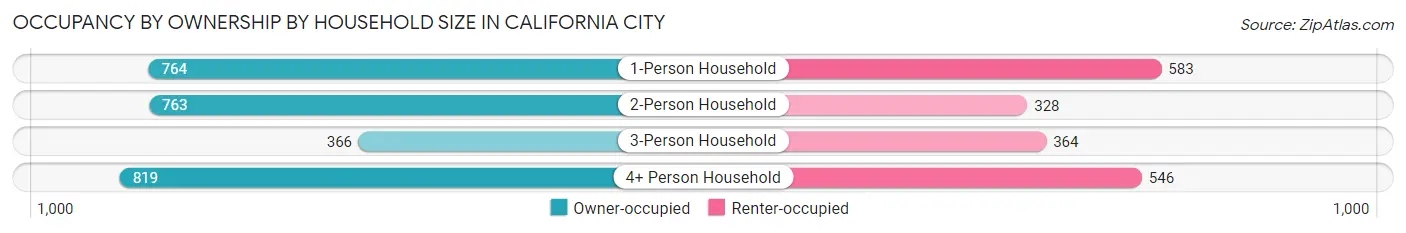
| Household Size | Owner-occupied | Renter-occupied |
| 1-Person Household | 764 (56.7%) | 583 (43.3%) |
| 2-Person Household | 763 (69.9%) | 328 (30.1%) |
| 3-Person Household | 366 (50.1%) | 364 (49.9%) |
| 4+ Person Household | 819 (60.0%) | 546 (40.0%) |
| Total Housing Units | 2,712 (59.8%) | 1,821 (40.2%) |
Occupancy by Educational Attainment in California City
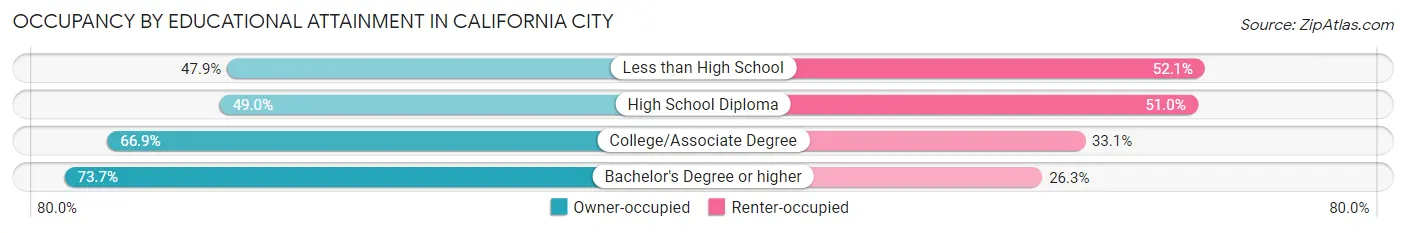
| Household Size | Owner-occupied | Renter-occupied |
| Less than High School | 281 (47.9%) | 306 (52.1%) |
| High School Diploma | 714 (49.0%) | 742 (51.0%) |
| College/Associate Degree | 1,155 (66.9%) | 572 (33.1%) |
| Bachelor's Degree or higher | 562 (73.7%) | 201 (26.3%) |
Occupancy by Age of Householder in California City
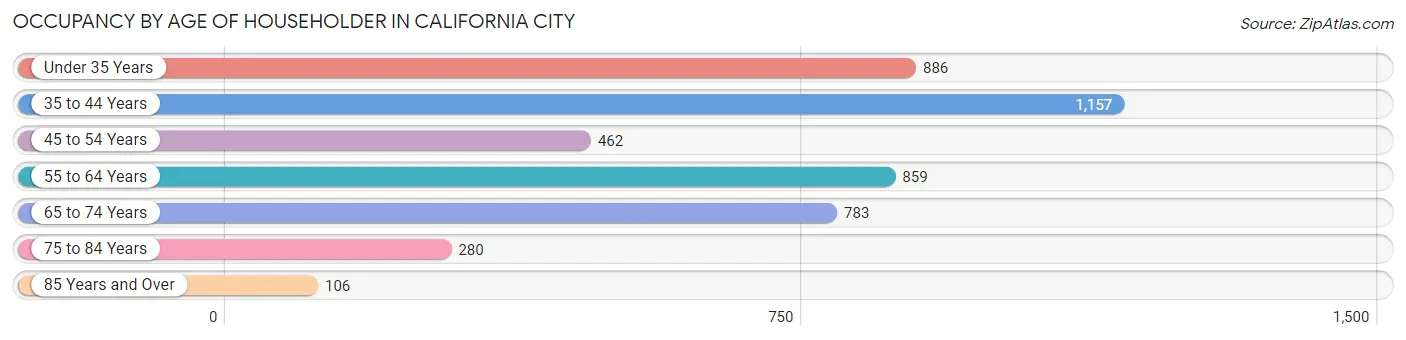
| Age Bracket | # Households | % Households |
| Under 35 Years | 886 | 19.6% |
| 35 to 44 Years | 1,157 | 25.5% |
| 45 to 54 Years | 462 | 10.2% |
| 55 to 64 Years | 859 | 19.0% |
| 65 to 74 Years | 783 | 17.3% |
| 75 to 84 Years | 280 | 6.2% |
| 85 Years and Over | 106 | 2.3% |
| Total | 4,533 | 100.0% |
Housing Finances in California City
Median Income by Occupancy in California City
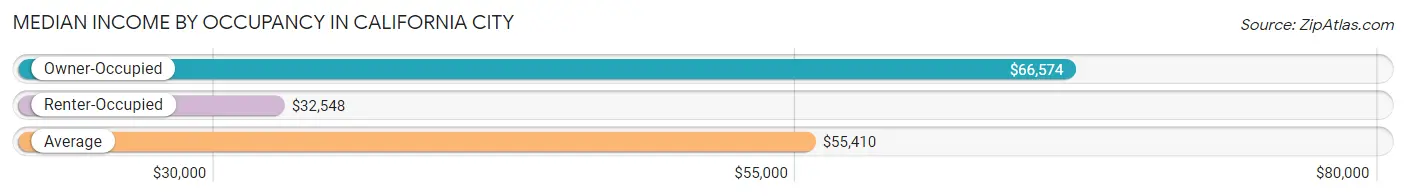
| Occupancy Type | # Households | Median Income |
| Owner-Occupied | 2,712 (59.8%) | $66,574 |
| Renter-Occupied | 1,821 (40.2%) | $32,548 |
| Average | 4,533 (100.0%) | $55,410 |
Occupancy by Householder Income Bracket in California City
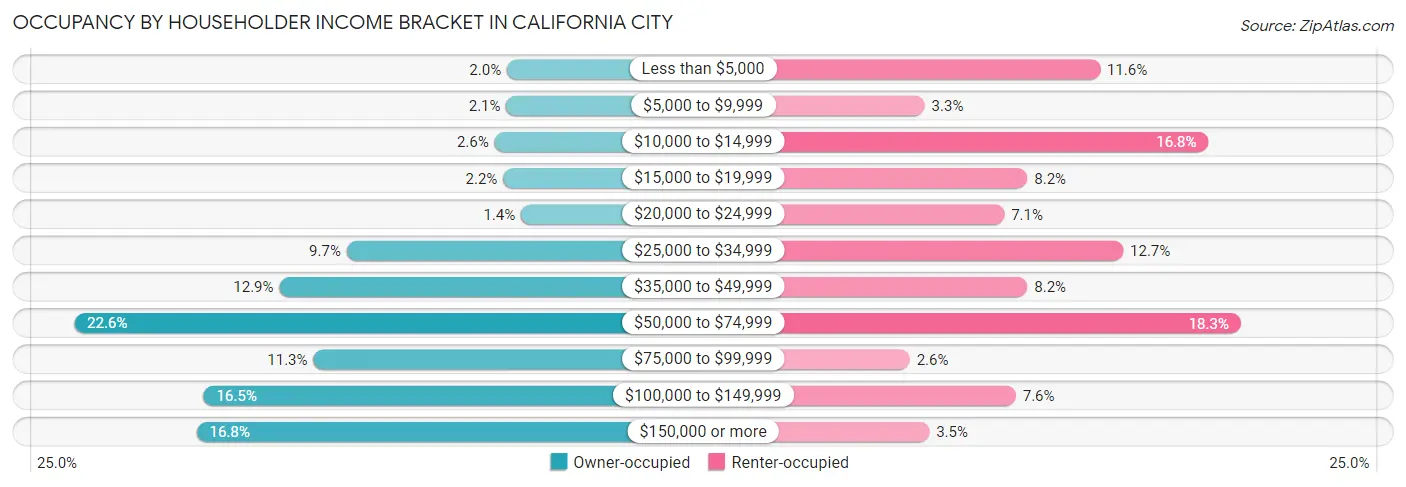
| Income Bracket | Owner-occupied | Renter-occupied |
| Less than $5,000 | 55 (2.0%) | 212 (11.6%) |
| $5,000 to $9,999 | 56 (2.1%) | 60 (3.3%) |
| $10,000 to $14,999 | 71 (2.6%) | 306 (16.8%) |
| $15,000 to $19,999 | 60 (2.2%) | 149 (8.2%) |
| $20,000 to $24,999 | 37 (1.4%) | 129 (7.1%) |
| $25,000 to $34,999 | 262 (9.7%) | 232 (12.7%) |
| $35,000 to $49,999 | 349 (12.9%) | 149 (8.2%) |
| $50,000 to $74,999 | 614 (22.6%) | 334 (18.3%) |
| $75,000 to $99,999 | 305 (11.3%) | 47 (2.6%) |
| $100,000 to $149,999 | 447 (16.5%) | 139 (7.6%) |
| $150,000 or more | 456 (16.8%) | 64 (3.5%) |
| Total | 2,712 (100.0%) | 1,821 (100.0%) |
Monthly Housing Cost Tiers in California City
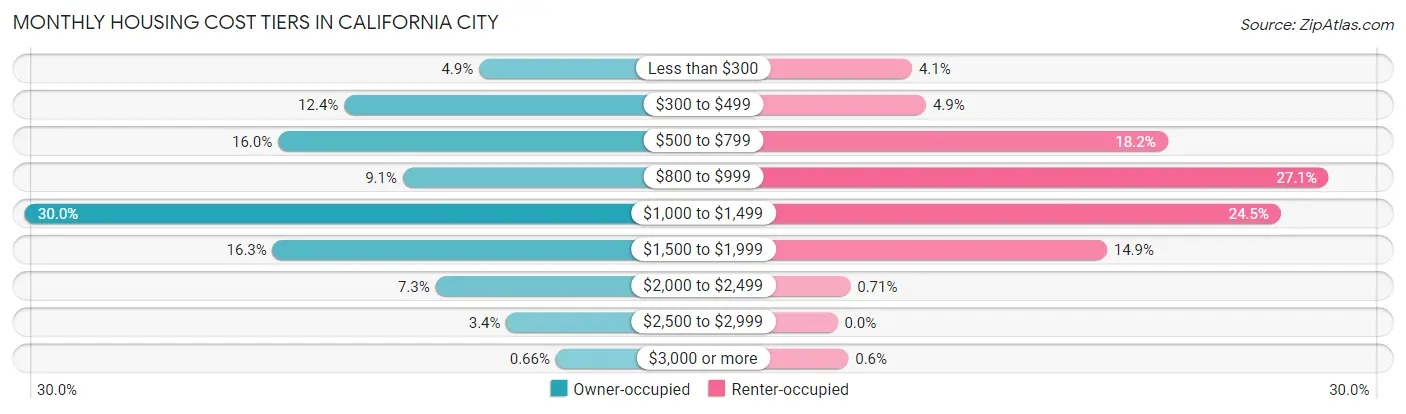
| Monthly Cost | Owner-occupied | Renter-occupied |
| Less than $300 | 133 (4.9%) | 75 (4.1%) |
| $300 to $499 | 335 (12.3%) | 89 (4.9%) |
| $500 to $799 | 434 (16.0%) | 332 (18.2%) |
| $800 to $999 | 247 (9.1%) | 494 (27.1%) |
| $1,000 to $1,499 | 813 (30.0%) | 446 (24.5%) |
| $1,500 to $1,999 | 442 (16.3%) | 271 (14.9%) |
| $2,000 to $2,499 | 198 (7.3%) | 13 (0.7%) |
| $2,500 to $2,999 | 92 (3.4%) | 0 (0.0%) |
| $3,000 or more | 18 (0.7%) | 11 (0.6%) |
| Total | 2,712 (100.0%) | 1,821 (100.0%) |
Physical Housing Characteristics in California City
Housing Structures in California City
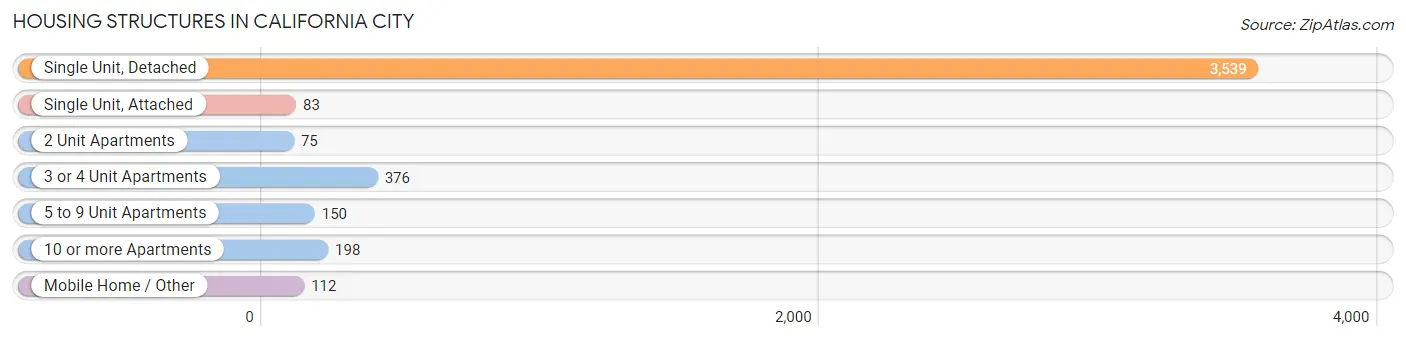
| Structure Type | # Housing Units | % Housing Units |
| Single Unit, Detached | 3,539 | 78.1% |
| Single Unit, Attached | 83 | 1.8% |
| 2 Unit Apartments | 75 | 1.7% |
| 3 or 4 Unit Apartments | 376 | 8.3% |
| 5 to 9 Unit Apartments | 150 | 3.3% |
| 10 or more Apartments | 198 | 4.4% |
| Mobile Home / Other | 112 | 2.5% |
| Total | 4,533 | 100.0% |
Housing Structures by Occupancy in California City
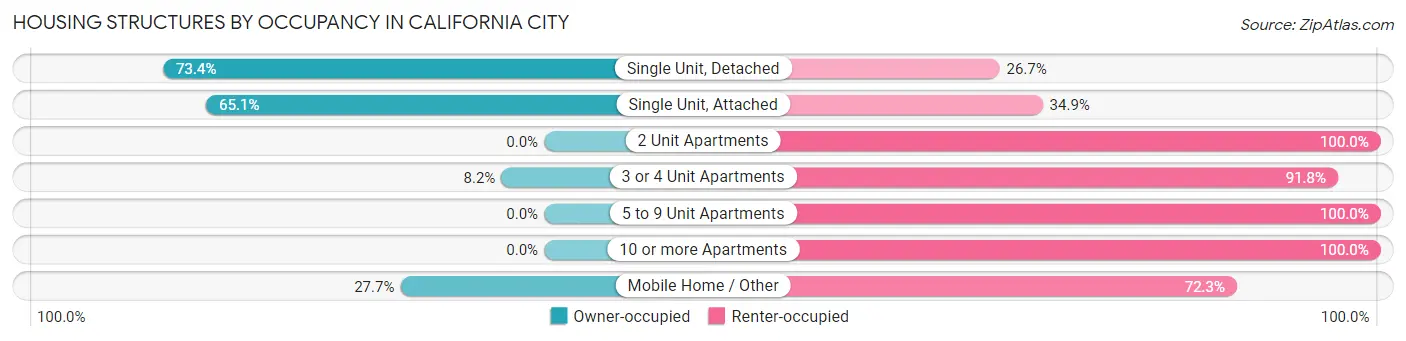
| Structure Type | Owner-occupied | Renter-occupied |
| Single Unit, Detached | 2,596 (73.4%) | 943 (26.7%) |
| Single Unit, Attached | 54 (65.1%) | 29 (34.9%) |
| 2 Unit Apartments | 0 (0.0%) | 75 (100.0%) |
| 3 or 4 Unit Apartments | 31 (8.2%) | 345 (91.8%) |
| 5 to 9 Unit Apartments | 0 (0.0%) | 150 (100.0%) |
| 10 or more Apartments | 0 (0.0%) | 198 (100.0%) |
| Mobile Home / Other | 31 (27.7%) | 81 (72.3%) |
| Total | 2,712 (59.8%) | 1,821 (40.2%) |
Housing Structures by Number of Rooms in California City
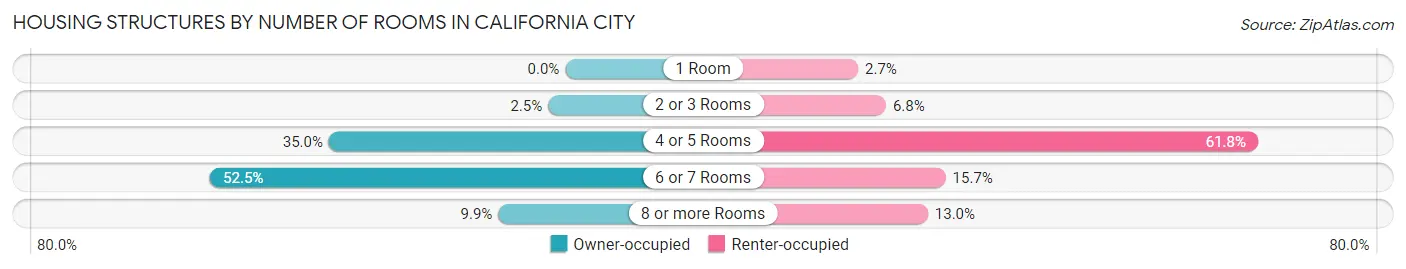
| Number of Rooms | Owner-occupied | Renter-occupied |
| 1 Room | 0 (0.0%) | 49 (2.7%) |
| 2 or 3 Rooms | 69 (2.5%) | 124 (6.8%) |
| 4 or 5 Rooms | 949 (35.0%) | 1,126 (61.8%) |
| 6 or 7 Rooms | 1,425 (52.5%) | 285 (15.7%) |
| 8 or more Rooms | 269 (9.9%) | 237 (13.0%) |
| Total | 2,712 (100.0%) | 1,821 (100.0%) |
Housing Structure by Heating Type in California City
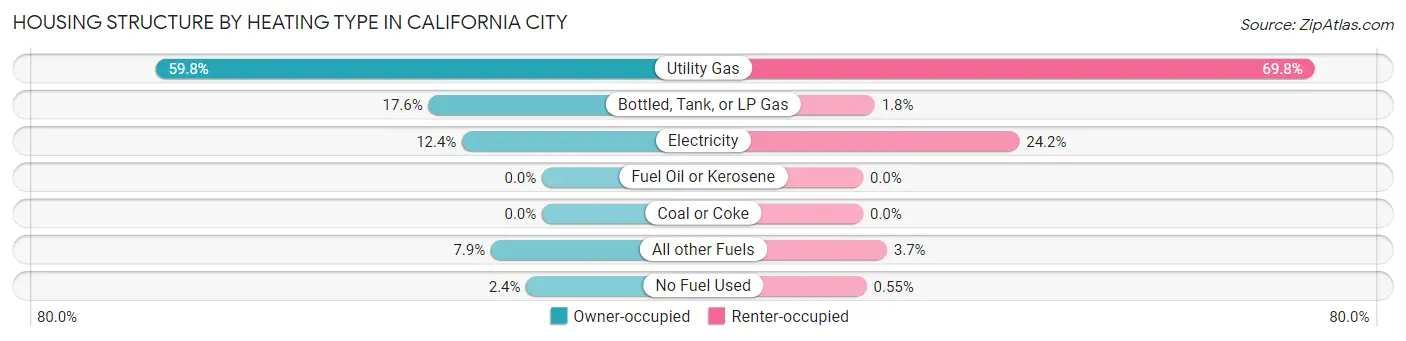
| Heating Type | Owner-occupied | Renter-occupied |
| Utility Gas | 1,621 (59.8%) | 1,271 (69.8%) |
| Bottled, Tank, or LP Gas | 476 (17.5%) | 33 (1.8%) |
| Electricity | 335 (12.3%) | 440 (24.2%) |
| Fuel Oil or Kerosene | 0 (0.0%) | 0 (0.0%) |
| Coal or Coke | 0 (0.0%) | 0 (0.0%) |
| All other Fuels | 214 (7.9%) | 67 (3.7%) |
| No Fuel Used | 66 (2.4%) | 10 (0.5%) |
| Total | 2,712 (100.0%) | 1,821 (100.0%) |
Household Vehicle Usage in California City
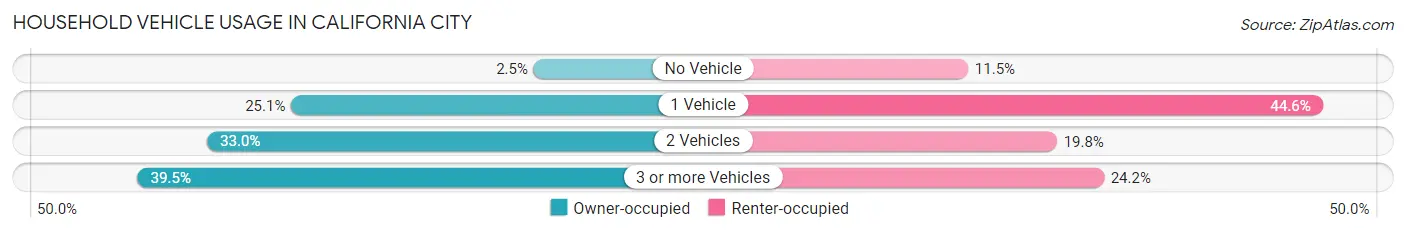
| Vehicles per Household | Owner-occupied | Renter-occupied |
| No Vehicle | 67 (2.5%) | 209 (11.5%) |
| 1 Vehicle | 681 (25.1%) | 812 (44.6%) |
| 2 Vehicles | 894 (33.0%) | 360 (19.8%) |
| 3 or more Vehicles | 1,070 (39.5%) | 440 (24.2%) |
| Total | 2,712 (100.0%) | 1,821 (100.0%) |
Real Estate & Mortgages in California City
Real Estate and Mortgage Overview in California City
| Characteristic | Without Mortgage | With Mortgage |
| Housing Units | 785 | 1,927 |
| Median Property Value | $202,100 | $225,900 |
| Median Household Income | $55,572 | $406 |
| Monthly Housing Costs | $473 | $4 |
| Real Estate Taxes | $1,669 | $81 |
Property Value by Mortgage Status in California City
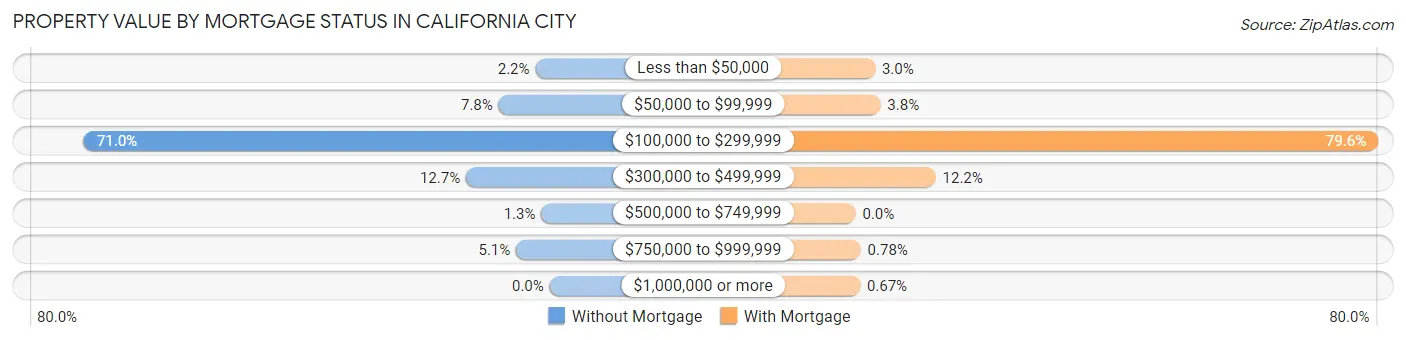
| Property Value | Without Mortgage | With Mortgage |
| Less than $50,000 | 17 (2.2%) | 57 (3.0%) |
| $50,000 to $99,999 | 61 (7.8%) | 73 (3.8%) |
| $100,000 to $299,999 | 557 (71.0%) | 1,534 (79.6%) |
| $300,000 to $499,999 | 100 (12.7%) | 235 (12.2%) |
| $500,000 to $749,999 | 10 (1.3%) | 0 (0.0%) |
| $750,000 to $999,999 | 40 (5.1%) | 15 (0.8%) |
| $1,000,000 or more | 0 (0.0%) | 13 (0.7%) |
| Total | 785 (100.0%) | 1,927 (100.0%) |
Household Income by Mortgage Status in California City
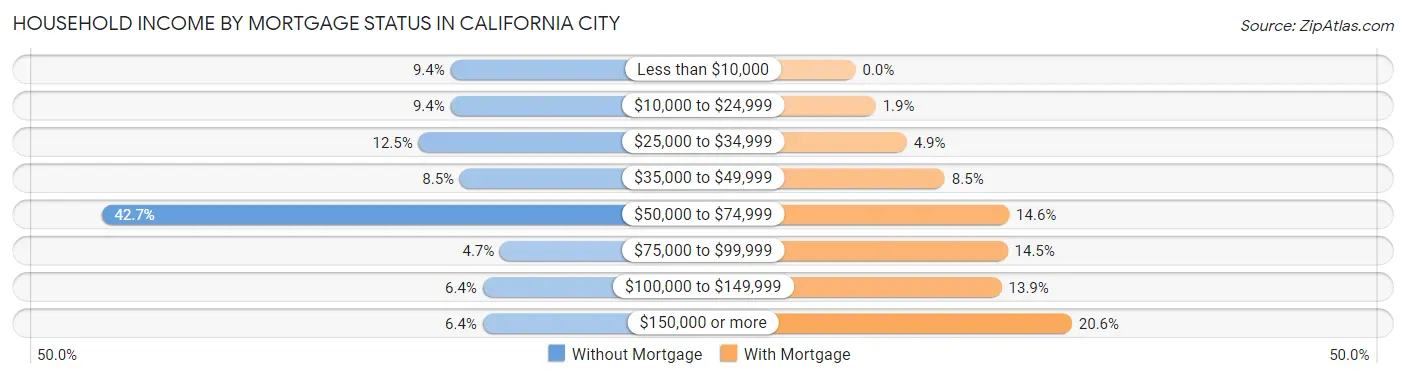
| Household Income | Without Mortgage | With Mortgage |
| Less than $10,000 | 74 (9.4%) | 0 (0.0%) |
| $10,000 to $24,999 | 74 (9.4%) | 37 (1.9%) |
| $25,000 to $34,999 | 98 (12.5%) | 94 (4.9%) |
| $35,000 to $49,999 | 67 (8.5%) | 164 (8.5%) |
| $50,000 to $74,999 | 335 (42.7%) | 282 (14.6%) |
| $75,000 to $99,999 | 37 (4.7%) | 279 (14.5%) |
| $100,000 to $149,999 | 50 (6.4%) | 268 (13.9%) |
| $150,000 or more | 50 (6.4%) | 397 (20.6%) |
| Total | 785 (100.0%) | 1,927 (100.0%) |
Property Value to Household Income Ratio in California City
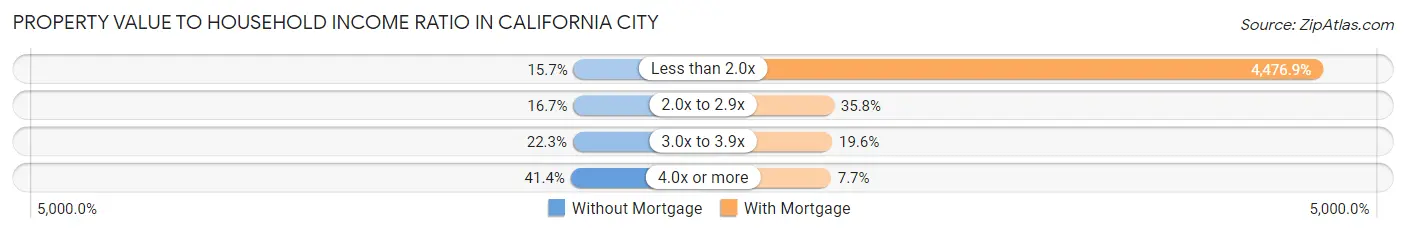
| Value-to-Income Ratio | Without Mortgage | With Mortgage |
| Less than 2.0x | 123 (15.7%) | 86,270 (4,476.9%) |
| 2.0x to 2.9x | 131 (16.7%) | 689 (35.8%) |
| 3.0x to 3.9x | 175 (22.3%) | 378 (19.6%) |
| 4.0x or more | 325 (41.4%) | 148 (7.7%) |
| Total | 785 (100.0%) | 1,927 (100.0%) |
Real Estate Taxes by Mortgage Status in California City
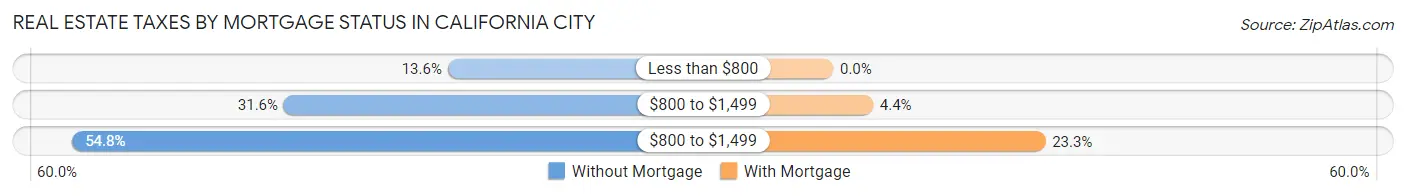
| Property Taxes | Without Mortgage | With Mortgage |
| Less than $800 | 107 (13.6%) | 0 (0.0%) |
| $800 to $1,499 | 248 (31.6%) | 84 (4.4%) |
| $800 to $1,499 | 430 (54.8%) | 448 (23.3%) |
| Total | 785 (100.0%) | 1,927 (100.0%) |
Health & Disability in California City
Health Insurance Coverage by Age in California City
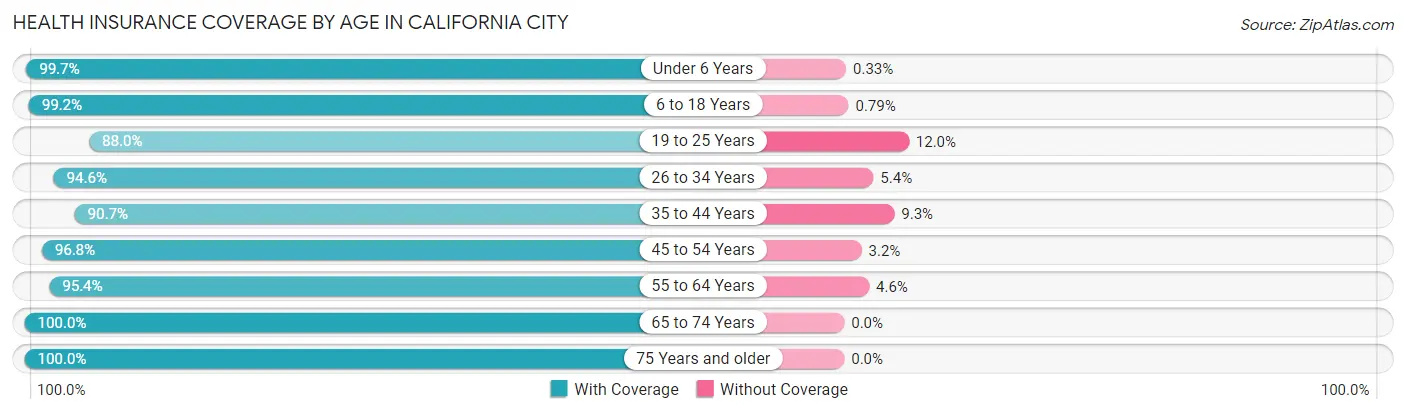
| Age Bracket | With Coverage | Without Coverage |
| Under 6 Years | 1,213 (99.7%) | 4 (0.3%) |
| 6 to 18 Years | 2,511 (99.2%) | 20 (0.8%) |
| 19 to 25 Years | 869 (88.0%) | 119 (12.0%) |
| 26 to 34 Years | 1,793 (94.6%) | 103 (5.4%) |
| 35 to 44 Years | 1,786 (90.7%) | 184 (9.3%) |
| 45 to 54 Years | 1,143 (96.8%) | 38 (3.2%) |
| 55 to 64 Years | 1,320 (95.4%) | 64 (4.6%) |
| 65 to 74 Years | 1,196 (100.0%) | 0 (0.0%) |
| 75 Years and older | 514 (100.0%) | 0 (0.0%) |
| Total | 12,345 (95.9%) | 532 (4.1%) |
Health Insurance Coverage by Citizenship Status in California City
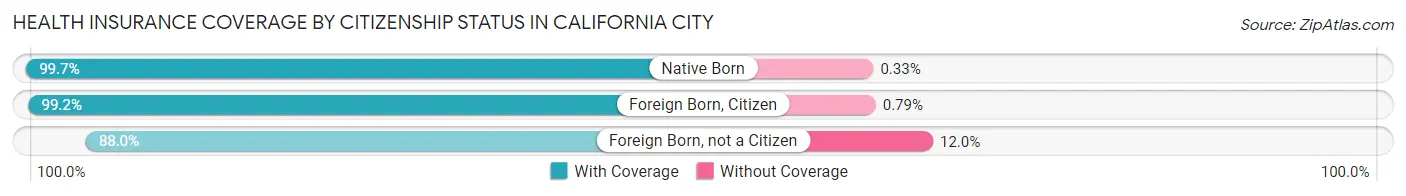
| Citizenship Status | With Coverage | Without Coverage |
| Native Born | 1,213 (99.7%) | 4 (0.3%) |
| Foreign Born, Citizen | 2,511 (99.2%) | 20 (0.8%) |
| Foreign Born, not a Citizen | 869 (88.0%) | 119 (12.0%) |
Health Insurance Coverage by Household Income in California City
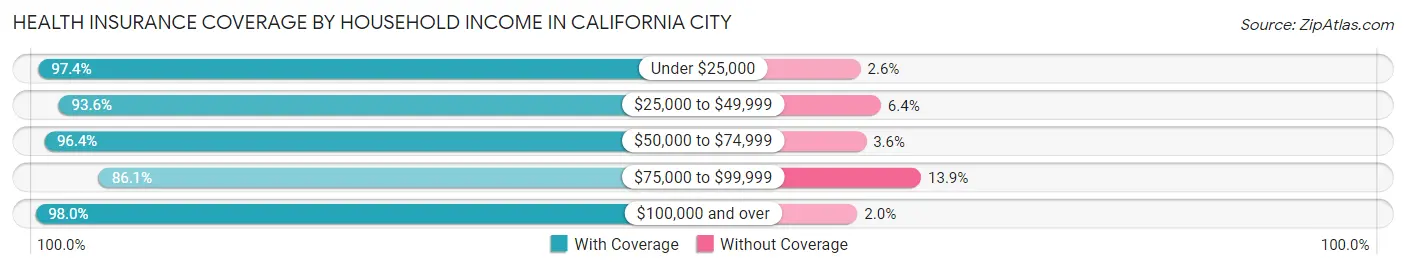
| Household Income | With Coverage | Without Coverage |
| Under $25,000 | 2,218 (97.4%) | 59 (2.6%) |
| $25,000 to $49,999 | 2,300 (93.6%) | 157 (6.4%) |
| $50,000 to $74,999 | 3,343 (96.4%) | 126 (3.6%) |
| $75,000 to $99,999 | 699 (86.1%) | 113 (13.9%) |
| $100,000 and over | 3,785 (98.0%) | 77 (2.0%) |
Public vs Private Health Insurance Coverage by Age in California City
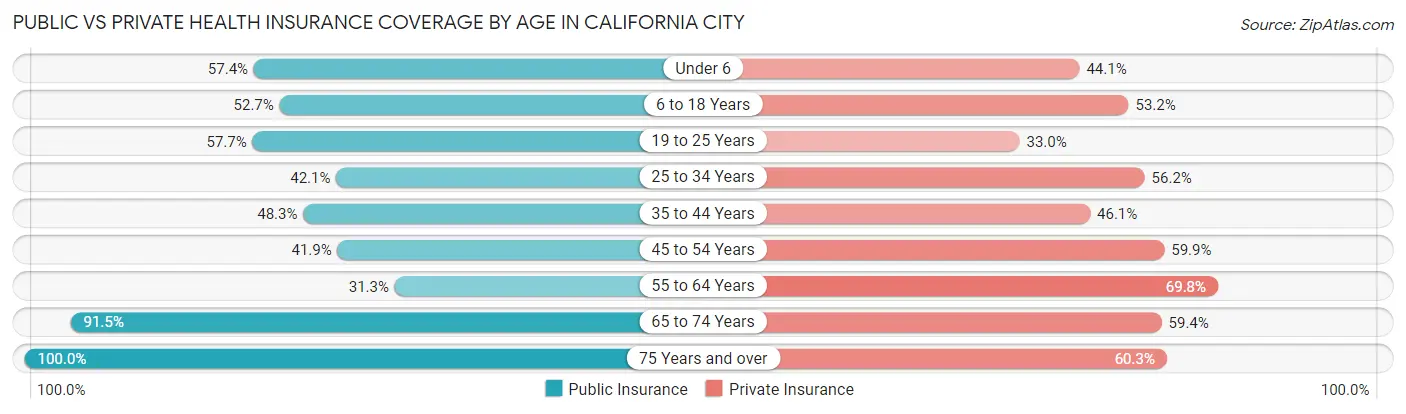
| Age Bracket | Public Insurance | Private Insurance |
| Under 6 | 699 (57.4%) | 537 (44.1%) |
| 6 to 18 Years | 1,333 (52.7%) | 1,347 (53.2%) |
| 19 to 25 Years | 570 (57.7%) | 326 (33.0%) |
| 25 to 34 Years | 799 (42.1%) | 1,066 (56.2%) |
| 35 to 44 Years | 951 (48.3%) | 908 (46.1%) |
| 45 to 54 Years | 495 (41.9%) | 707 (59.9%) |
| 55 to 64 Years | 433 (31.3%) | 966 (69.8%) |
| 65 to 74 Years | 1,094 (91.5%) | 710 (59.4%) |
| 75 Years and over | 514 (100.0%) | 310 (60.3%) |
| Total | 6,888 (53.5%) | 6,877 (53.4%) |
Disability Status by Sex by Age in California City
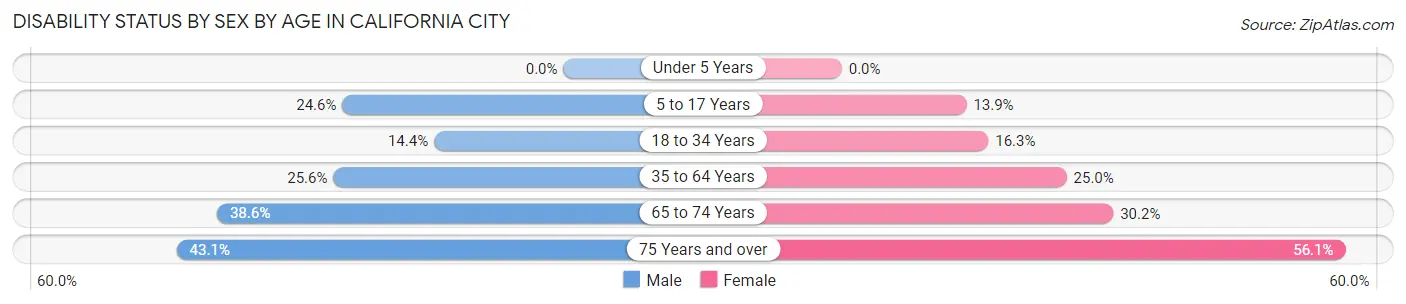
| Age Bracket | Male | Female |
| Under 5 Years | 0 (0.0%) | 0 (0.0%) |
| 5 to 17 Years | 295 (24.6%) | 197 (13.9%) |
| 18 to 34 Years | 268 (14.4%) | 213 (16.3%) |
| 35 to 64 Years | 585 (25.6%) | 564 (25.0%) |
| 65 to 74 Years | 275 (38.6%) | 146 (30.2%) |
| 75 Years and over | 90 (43.1%) | 171 (56.1%) |
Disability Class by Sex by Age in California City
Disability Class: Hearing Difficulty
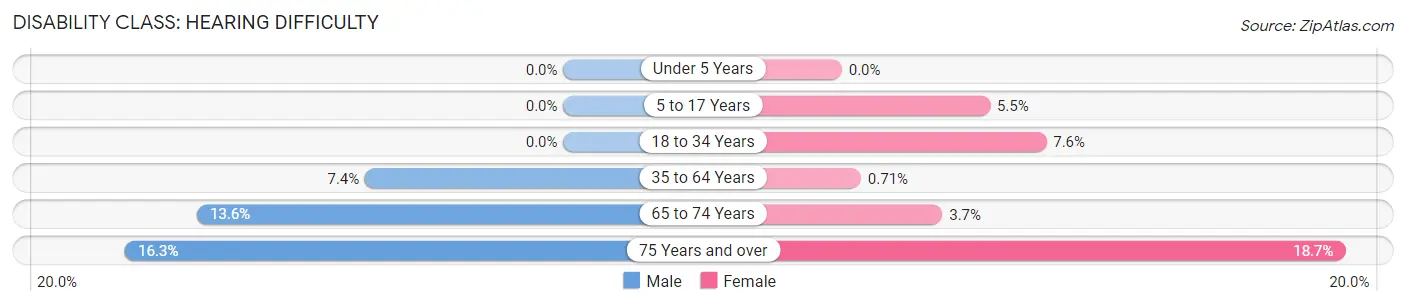
| Age Bracket | Male | Female |
| Under 5 Years | 0 (0.0%) | 0 (0.0%) |
| 5 to 17 Years | 0 (0.0%) | 78 (5.5%) |
| 18 to 34 Years | 0 (0.0%) | 99 (7.6%) |
| 35 to 64 Years | 168 (7.4%) | 16 (0.7%) |
| 65 to 74 Years | 97 (13.6%) | 18 (3.7%) |
| 75 Years and over | 34 (16.3%) | 57 (18.7%) |
Disability Class: Vision Difficulty
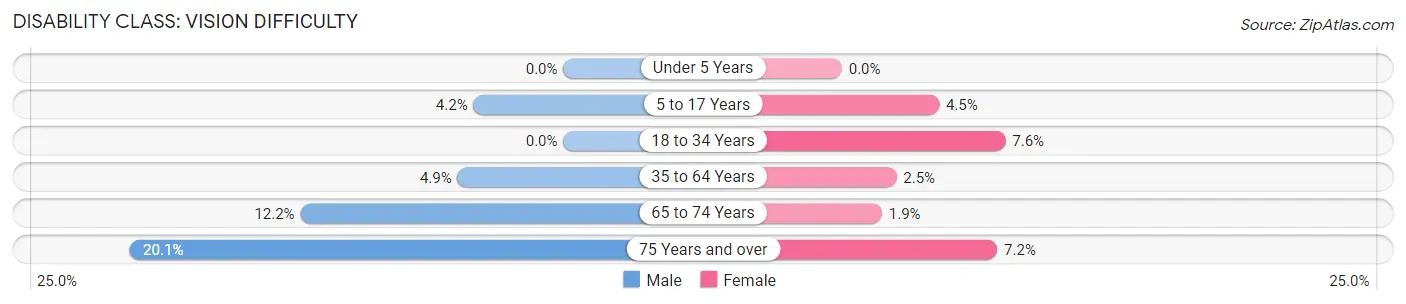
| Age Bracket | Male | Female |
| Under 5 Years | 0 (0.0%) | 0 (0.0%) |
| 5 to 17 Years | 50 (4.2%) | 64 (4.5%) |
| 18 to 34 Years | 0 (0.0%) | 99 (7.6%) |
| 35 to 64 Years | 112 (4.9%) | 57 (2.5%) |
| 65 to 74 Years | 87 (12.2%) | 9 (1.9%) |
| 75 Years and over | 42 (20.1%) | 22 (7.2%) |
Disability Class: Cognitive Difficulty
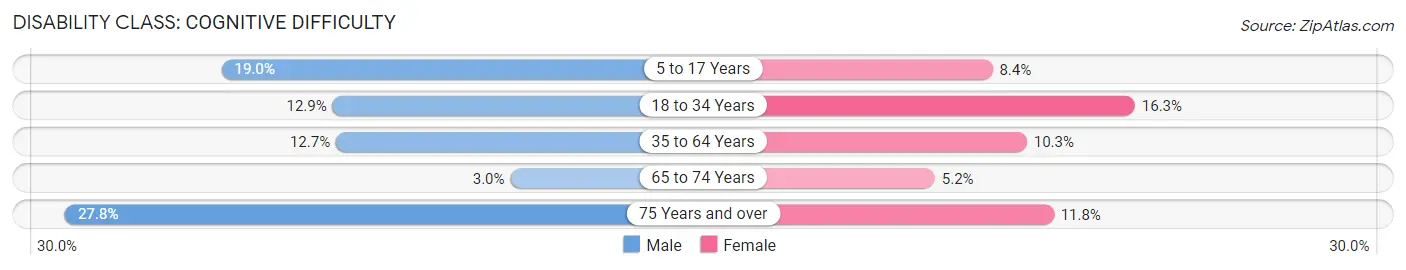
| Age Bracket | Male | Female |
| 5 to 17 Years | 228 (19.0%) | 119 (8.4%) |
| 18 to 34 Years | 239 (12.9%) | 213 (16.3%) |
| 35 to 64 Years | 289 (12.7%) | 232 (10.3%) |
| 65 to 74 Years | 21 (2.9%) | 25 (5.2%) |
| 75 Years and over | 58 (27.8%) | 36 (11.8%) |
Disability Class: Ambulatory Difficulty
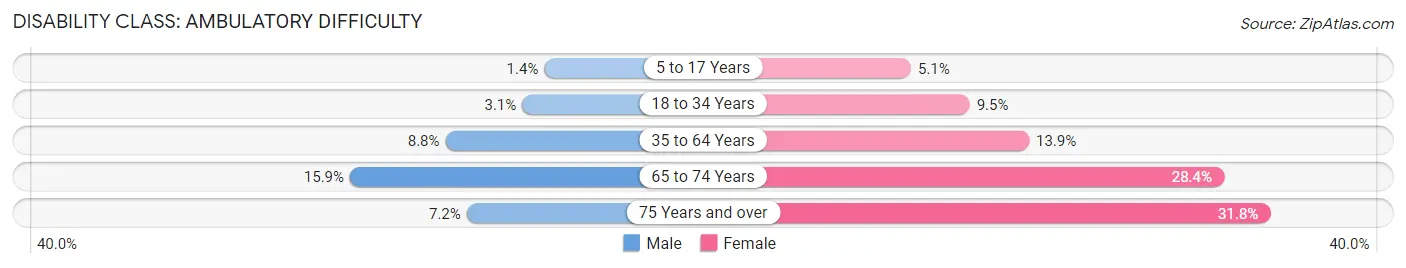
| Age Bracket | Male | Female |
| 5 to 17 Years | 17 (1.4%) | 73 (5.1%) |
| 18 to 34 Years | 57 (3.1%) | 124 (9.5%) |
| 35 to 64 Years | 200 (8.8%) | 313 (13.9%) |
| 65 to 74 Years | 113 (15.9%) | 137 (28.4%) |
| 75 Years and over | 15 (7.2%) | 97 (31.8%) |
Disability Class: Self-Care Difficulty
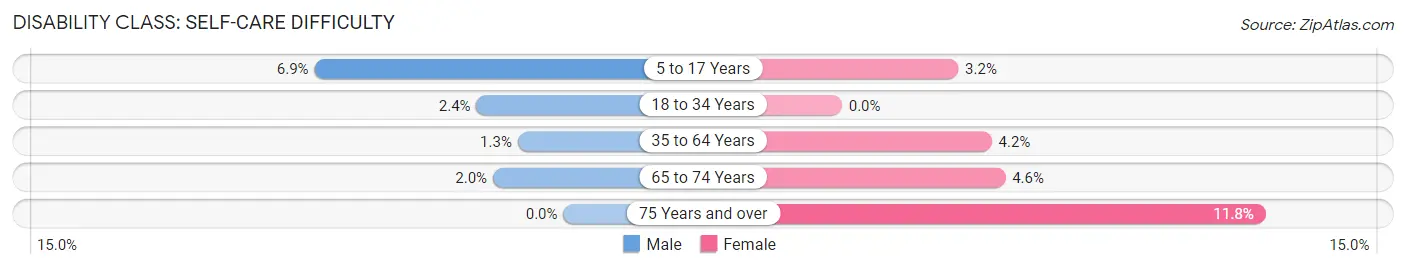
| Age Bracket | Male | Female |
| 5 to 17 Years | 83 (6.9%) | 46 (3.2%) |
| 18 to 34 Years | 45 (2.4%) | 0 (0.0%) |
| 35 to 64 Years | 29 (1.3%) | 94 (4.2%) |
| 65 to 74 Years | 14 (2.0%) | 22 (4.5%) |
| 75 Years and over | 0 (0.0%) | 36 (11.8%) |
Technology Access in California City
Computing Device Access in California City
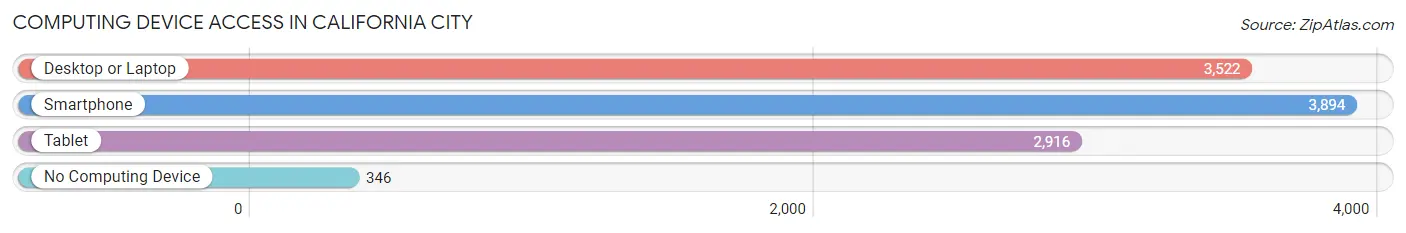
| Device Type | # Households | % Households |
| Desktop or Laptop | 3,522 | 77.7% |
| Smartphone | 3,894 | 85.9% |
| Tablet | 2,916 | 64.3% |
| No Computing Device | 346 | 7.6% |
| Total | 4,533 | 100.0% |
Internet Access in California City
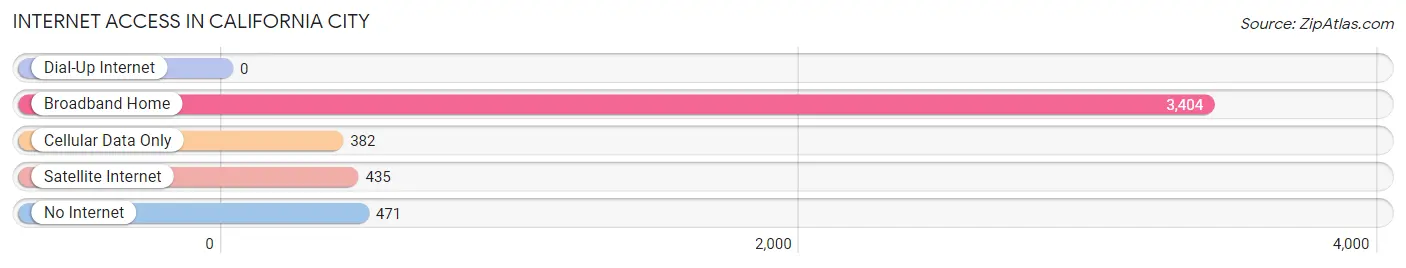
| Internet Type | # Households | % Households |
| Dial-Up Internet | 0 | 0.0% |
| Broadband Home | 3,404 | 75.1% |
| Cellular Data Only | 382 | 8.4% |
| Satellite Internet | 435 | 9.6% |
| No Internet | 471 | 10.4% |
| Total | 4,533 | 100.0% |
California City Summary
City of California City
California City is a city located in the northern part of the Mojave Desert in Kern County, California. It is the third largest city in Kern County, with a population of 14,120 as of the 2010 census. The city was incorporated in 1965 and is located about 100 miles northeast of Los Angeles.
History
California City was founded in 1958 by Nat Mendelsohn, a real estate developer from Los Angeles. He purchased 80,000 acres of land in the Mojave Desert and began to develop it into a planned community. He envisioned a city of 50,000 people, with a university, a hospital, and a shopping center. He named the city after the state of California and began to market it as a place to live and work.
Mendelsohn's plan was ambitious, but it was not successful. The city never grew to the size he had envisioned, and by the 1970s, it had become a ghost town. In the 1980s, the city began to experience a resurgence, as people began to move to the area for its affordable housing and proximity to Los Angeles.
Geography
California City is located in the northern part of the Mojave Desert in Kern County, California. It is situated at an elevation of 2,835 feet above sea level. The city covers an area of approximately 80 square miles and is bordered by the towns of Rosamond, Mojave, and Boron.
The climate in California City is arid and semi-arid, with hot summers and mild winters. The average annual temperature is 68°F, and the average annual precipitation is 4.5 inches.
Economy
The economy of California City is largely based on agriculture and tourism. The city is home to several large farms, which produce a variety of crops, including alfalfa, cotton, and wheat. The city is also home to several tourist attractions, including the California City Speedway, the California City Golf Course, and the California City Museum.
The city is also home to several manufacturing companies, including a solar panel manufacturer, a plastics manufacturer, and a metal fabrication company.
Demographics
As of the 2010 census, the population of California City was 14,120. The racial makeup of the city was 68.3% White, 5.2% African American, 0.7% Native American, 1.2% Asian, 0.2% Pacific Islander, 20.2% from other races, and 4.2% from two or more races. Hispanic or Latino of any race were 33.2% of the population.
The median household income in California City was $41,945, and the median family income was $48,945. The per capita income was $19,845. About 17.2% of the population was below the poverty line.
Conclusion
California City is a city located in the northern part of the Mojave Desert in Kern County, California. It was founded in 1958 by Nat Mendelsohn, a real estate developer from Los Angeles. The city covers an area of approximately 80 square miles and is bordered by the towns of Rosamond, Mojave, and Boron. The economy of California City is largely based on agriculture and tourism. As of the 2010 census, the population of California City was 14,120. The racial makeup of the city was 68.3% White, 5.2% African American, 0.7% Native American, 1.2% Asian, 0.2% Pacific Islander, 20.2% from other races, and 4.2% from two or more races. The median household income in California City was $41,945, and the median family income was $48,945. The per capita income was $19,845. About 17.2% of the population was below the poverty line.
Common Questions
What is Per Capita Income in California City?
Per Capita income in California City is $23,297.
What is the Median Family Income in California City?
Median Family Income in California City is $58,412.
What is the Median Household income in California City?
Median Household Income in California City is $55,410.
What is Income or Wage Gap in California City?
Income or Wage Gap in California City is 34.7%.
Women in California City earn 65.3 cents for every dollar earned by a man.
What is Family Income Deficit in California City?
Family Income Deficit in California City is $11,902.
Families that are below poverty line in California City earn $11,902 less on average than the poverty threshold level.
What is Inequality or Gini Index in California City?
Inequality or Gini Index in California City is 0.49.
What is the Total Population of California City?
Total Population of California City is 15,002.
What is the Total Male Population of California City?
Total Male Population of California City is 8,640.
What is the Total Female Population of California City?
Total Female Population of California City is 6,362.
What is the Ratio of Males per 100 Females in California City?
There are 135.81 Males per 100 Females in California City.
What is the Ratio of Females per 100 Males in California City?
There are 73.63 Females per 100 Males in California City.
What is the Median Population Age in California City?
Median Population Age in California City is 34.4 Years.
What is the Average Family Size in California City
Average Family Size in California City is 3.5 People.
What is the Average Household Size in California City
Average Household Size in California City is 2.9 People.
How Large is the Labor Force in California City?
There are 5,610 People in the Labor Forcein in California City.
What is the Percentage of People in the Labor Force in California City?
47.7% of People are in the Labor Force in California City.
What is the Unemployment Rate in California City?
Unemployment Rate in California City is 16.8%.