Brawley, CA Map & Demographics
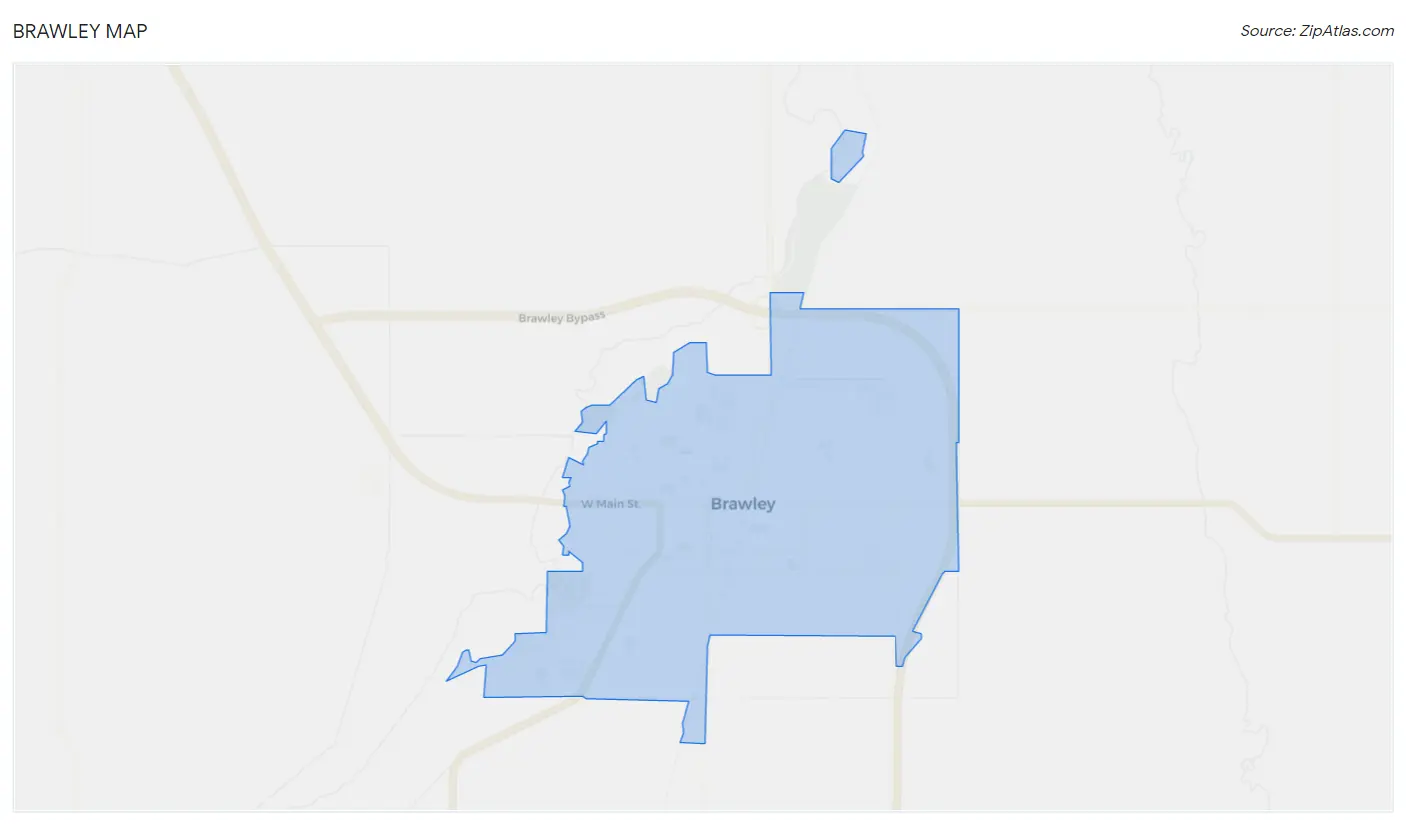
Brawley Map
Brawley Overview
$25,017
PER CAPITA INCOME
$62,160
AVG FAMILY INCOME
$56,229
AVG HOUSEHOLD INCOME
31.6%
WAGE / INCOME GAP [ % ]
68.4¢/ $1
WAGE / INCOME GAP [ $ ]
$12,517
FAMILY INCOME DEFICIT
0.48
INEQUALITY / GINI INDEX
26,509
TOTAL POPULATION
13,424
MALE POPULATION
13,085
FEMALE POPULATION
102.59
MALES / 100 FEMALES
97.47
FEMALES / 100 MALES
30.5
MEDIAN AGE
4.2
AVG FAMILY SIZE
3.5
AVG HOUSEHOLD SIZE
10,936
LABOR FORCE [ PEOPLE ]
56.0%
PERCENT IN LABOR FORCE
18.2%
UNEMPLOYMENT RATE
Brawley Zip Codes
Income in Brawley
Income Overview in Brawley
Per Capita Income in Brawley is $25,017, while median incomes of families and households are $62,160 and $56,229 respectively.
| Characteristic | Number | Measure |
| Per Capita Income | 26,509 | $25,017 |
| Median Family Income | 5,461 | $62,160 |
| Mean Family Income | 5,461 | $83,045 |
| Median Household Income | 7,501 | $56,229 |
| Mean Household Income | 7,501 | $79,848 |
| Income Deficit | 5,461 | $12,517 |
| Wage / Income Gap (%) | 26,509 | 31.58% |
| Wage / Income Gap ($) | 26,509 | 68.42¢ per $1 |
| Gini / Inequality Index | 26,509 | 0.48 |
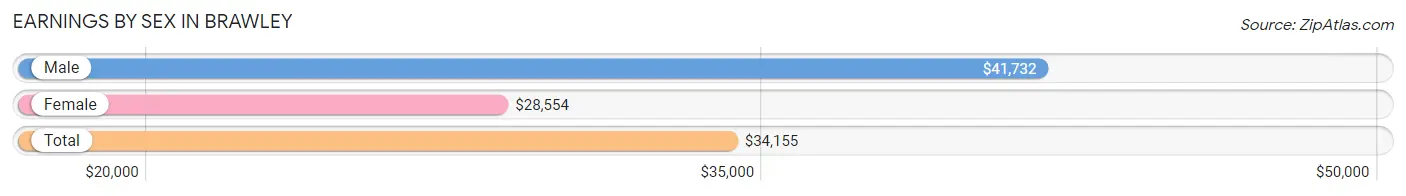
Earnings by Sex in Brawley
Average Earnings in Brawley are $34,155, $41,732 for men and $28,554 for women, a difference of 31.6%.
| Sex | Number | Average Earnings |
| Male | 6,011 (56.3%) | $41,732 |
| Female | 4,669 (43.7%) | $28,554 |
| Total | 10,680 (100.0%) | $34,155 |
Earnings by Sex by Income Bracket in Brawley
The most common earnings brackets in Brawley are $100,000+ for men (1,008 | 16.8%) and $25,000 to $29,999 for women (420 | 9.0%).
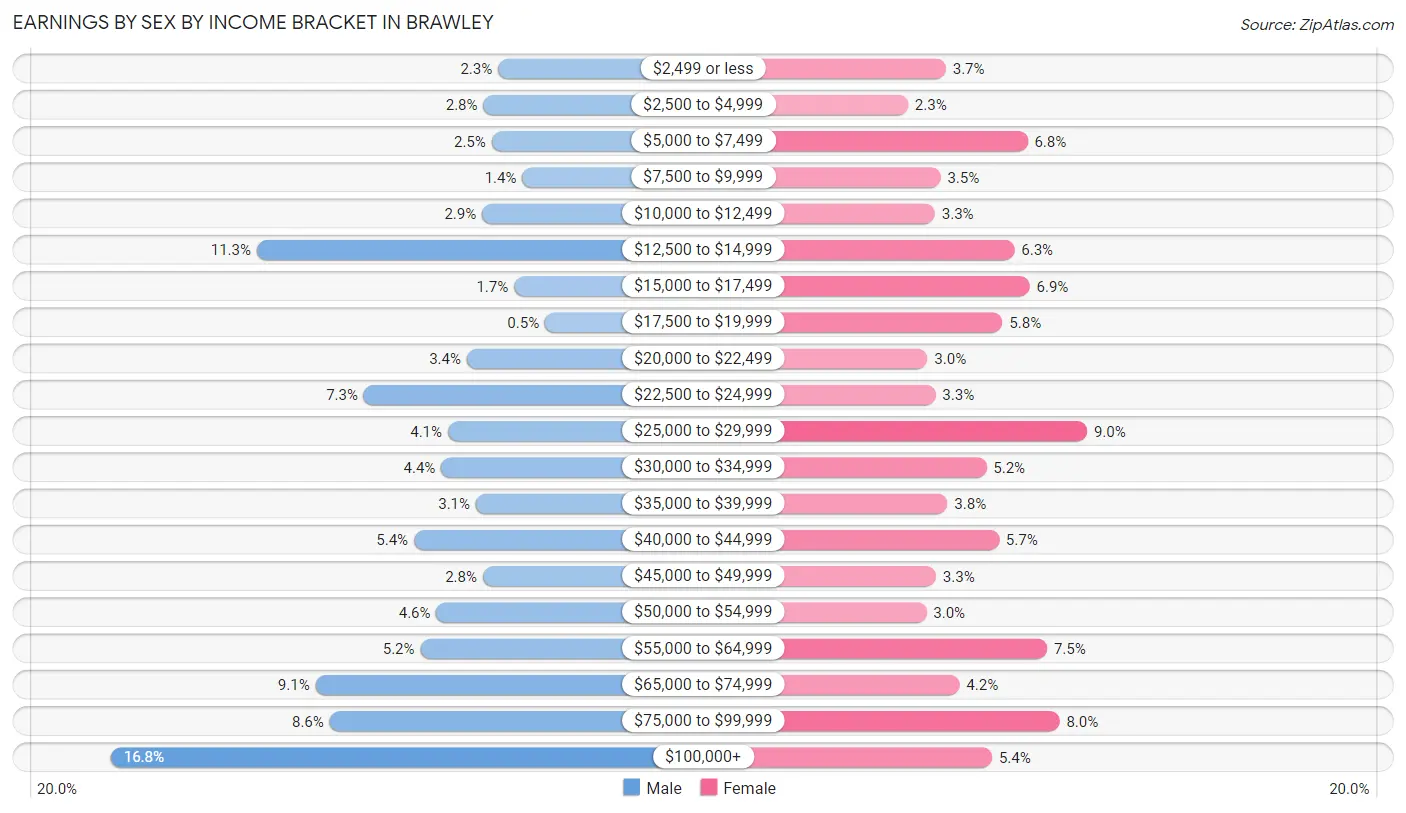
| Income | Male | Female |
| $2,499 or less | 136 (2.3%) | 173 (3.7%) |
| $2,500 to $4,999 | 169 (2.8%) | 107 (2.3%) |
| $5,000 to $7,499 | 150 (2.5%) | 316 (6.8%) |
| $7,500 to $9,999 | 81 (1.3%) | 164 (3.5%) |
| $10,000 to $12,499 | 172 (2.9%) | 154 (3.3%) |
| $12,500 to $14,999 | 679 (11.3%) | 293 (6.3%) |
| $15,000 to $17,499 | 100 (1.7%) | 320 (6.9%) |
| $17,500 to $19,999 | 30 (0.5%) | 272 (5.8%) |
| $20,000 to $22,499 | 206 (3.4%) | 141 (3.0%) |
| $22,500 to $24,999 | 438 (7.3%) | 155 (3.3%) |
| $25,000 to $29,999 | 249 (4.1%) | 420 (9.0%) |
| $30,000 to $34,999 | 264 (4.4%) | 244 (5.2%) |
| $35,000 to $39,999 | 186 (3.1%) | 176 (3.8%) |
| $40,000 to $44,999 | 325 (5.4%) | 266 (5.7%) |
| $45,000 to $49,999 | 170 (2.8%) | 156 (3.3%) |
| $50,000 to $54,999 | 275 (4.6%) | 139 (3.0%) |
| $55,000 to $64,999 | 311 (5.2%) | 350 (7.5%) |
| $65,000 to $74,999 | 547 (9.1%) | 197 (4.2%) |
| $75,000 to $99,999 | 515 (8.6%) | 372 (8.0%) |
| $100,000+ | 1,008 (16.8%) | 254 (5.4%) |
| Total | 6,011 (100.0%) | 4,669 (100.0%) |
Earnings by Sex by Educational Attainment in Brawley
Average earnings in Brawley are $51,458 for men and $29,828 for women, a difference of 42.0%. Men with an educational attainment of bachelor's degree enjoy the highest average annual earnings of $73,635, while those with high school diploma education earn the least with $35,692. Women with an educational attainment of bachelor's degree earn the most with the average annual earnings of $55,577, while those with less than high school education have the smallest earnings of $13,716.
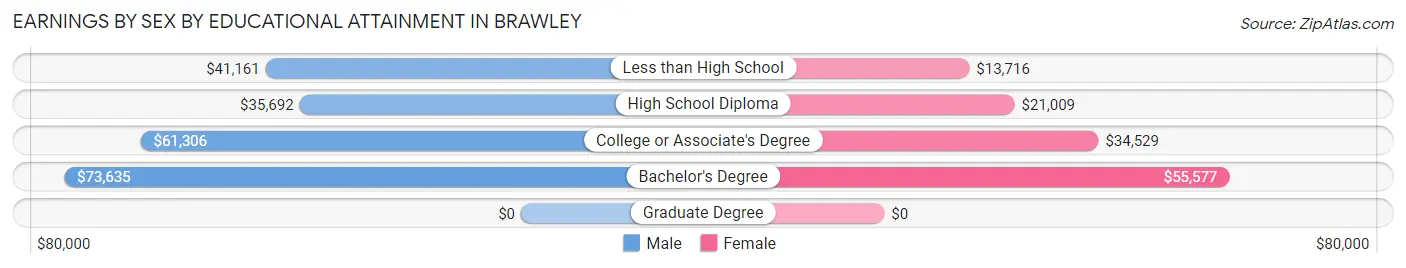
| Educational Attainment | Male Income | Female Income |
| Less than High School | $41,161 | $13,716 |
| High School Diploma | $35,692 | $21,009 |
| College or Associate's Degree | $61,306 | $34,529 |
| Bachelor's Degree | $73,635 | $55,577 |
| Graduate Degree | - | - |
| Total | $51,458 | $29,828 |
Family Income in Brawley
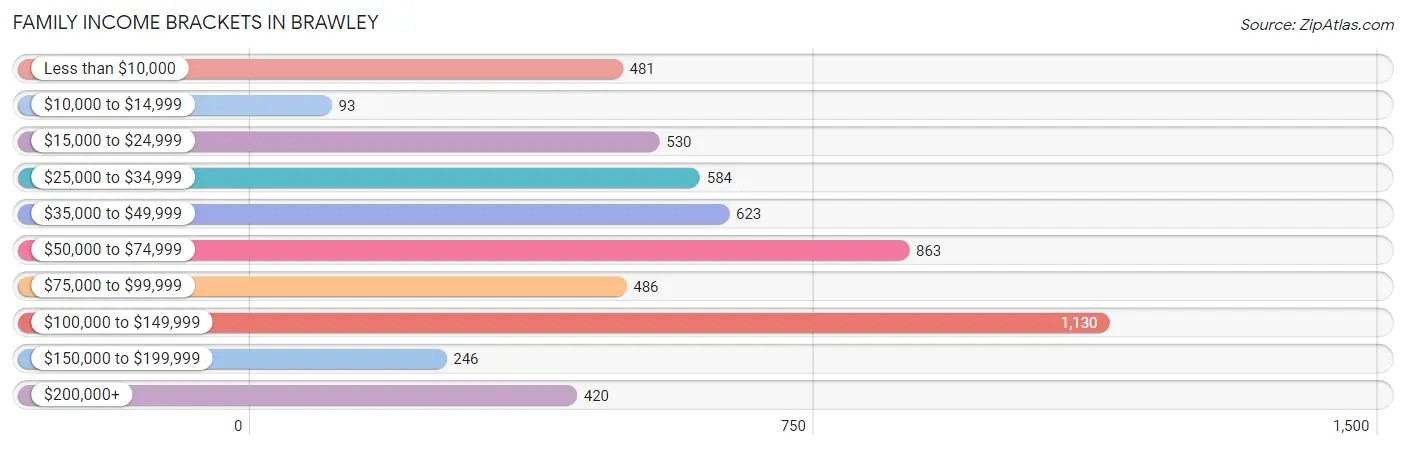
Family Income Brackets in Brawley
According to the Brawley family income data, there are 1,130 families falling into the $100,000 to $149,999 income range, which is the most common income bracket and makes up 20.7% of all families. Conversely, the $10,000 to $14,999 income bracket is the least frequent group with only 93 families (1.7%) belonging to this category.
| Income Bracket | # Families | % Families |
| Less than $10,000 | 481 | 8.8% |
| $10,000 to $14,999 | 93 | 1.7% |
| $15,000 to $24,999 | 530 | 9.7% |
| $25,000 to $34,999 | 584 | 10.7% |
| $35,000 to $49,999 | 623 | 11.4% |
| $50,000 to $74,999 | 863 | 15.8% |
| $75,000 to $99,999 | 486 | 8.9% |
| $100,000 to $149,999 | 1,130 | 20.7% |
| $150,000 to $199,999 | 246 | 4.5% |
| $200,000+ | 420 | 7.7% |
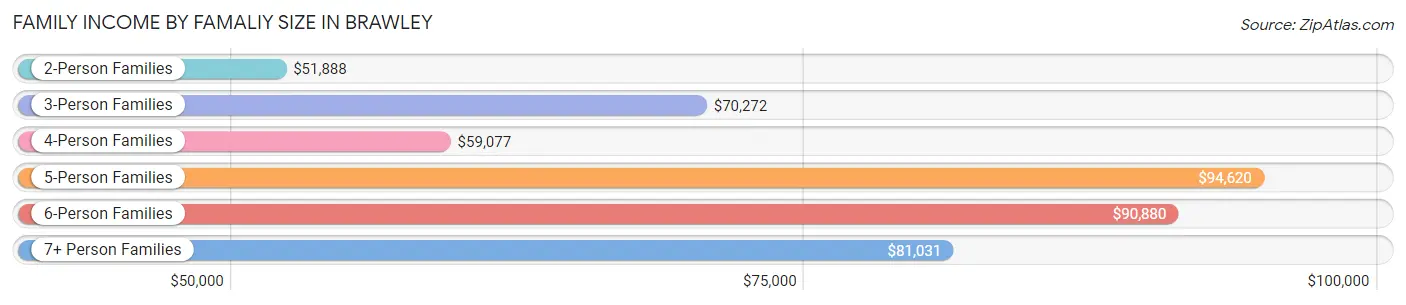
Family Income by Famaliy Size in Brawley
5-person families (603 | 11.0%) account for the highest median family income in Brawley with $94,620 per family, while 2-person families (1,845 | 33.8%) have the highest median income of $25,944 per family member.
| Income Bracket | # Families | Median Income |
| 2-Person Families | 1,845 (33.8%) | $51,888 |
| 3-Person Families | 1,304 (23.9%) | $70,272 |
| 4-Person Families | 1,227 (22.5%) | $59,077 |
| 5-Person Families | 603 (11.0%) | $94,620 |
| 6-Person Families | 283 (5.2%) | $90,880 |
| 7+ Person Families | 199 (3.6%) | $81,031 |
| Total | 5,461 (100.0%) | $62,160 |
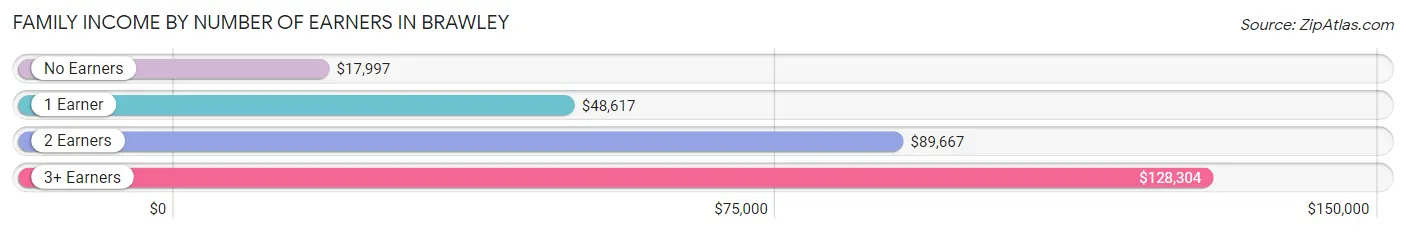
Family Income by Number of Earners in Brawley
The median family income in Brawley is $62,160, with families comprising 3+ earners (513) having the highest median family income of $128,304, while families with no earners (1,023) have the lowest median family income of $17,997, accounting for 9.4% and 18.7% of families, respectively.
| Number of Earners | # Families | Median Income |
| No Earners | 1,023 (18.7%) | $17,997 |
| 1 Earner | 2,051 (37.6%) | $48,617 |
| 2 Earners | 1,874 (34.3%) | $89,667 |
| 3+ Earners | 513 (9.4%) | $128,304 |
| Total | 5,461 (100.0%) | $62,160 |
Household Income in Brawley
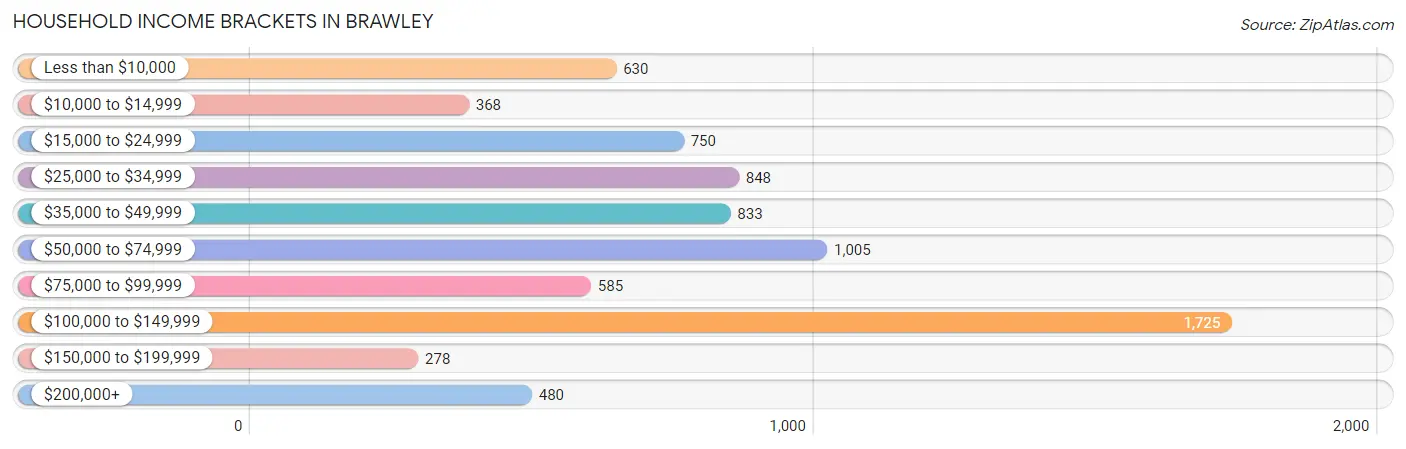
Household Income Brackets in Brawley
With 1,725 households falling in the category, the $100,000 to $149,999 income range is the most frequent in Brawley, accounting for 23.0% of all households. In contrast, only 278 households (3.7%) fall into the $150,000 to $199,999 income bracket, making it the least populous group.
| Income Bracket | # Households | % Households |
| Less than $10,000 | 630 | 8.4% |
| $10,000 to $14,999 | 368 | 4.9% |
| $15,000 to $24,999 | 750 | 10.0% |
| $25,000 to $34,999 | 848 | 11.3% |
| $35,000 to $49,999 | 833 | 11.1% |
| $50,000 to $74,999 | 1,005 | 13.4% |
| $75,000 to $99,999 | 585 | 7.8% |
| $100,000 to $149,999 | 1,725 | 23.0% |
| $150,000 to $199,999 | 278 | 3.7% |
| $200,000+ | 480 | 6.4% |
Household Income by Householder Age in Brawley
The median household income in Brawley is $56,229, with the highest median household income of $67,946 found in the 25 to 44 years age bracket for the primary householder. A total of 2,771 households (36.9%) fall into this category. Meanwhile, the 15 to 24 years age bracket for the primary householder has the lowest median household income of $8,367, with 194 households (2.6%) in this group.
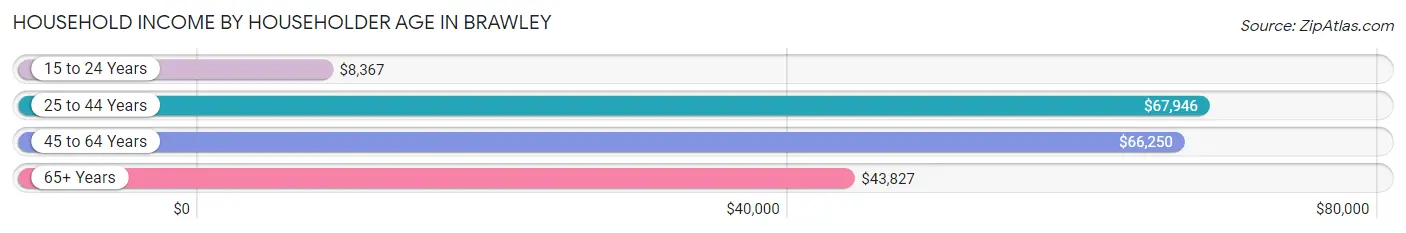
| Income Bracket | # Households | Median Income |
| 15 to 24 Years | 194 (2.6%) | $8,367 |
| 25 to 44 Years | 2,771 (36.9%) | $67,946 |
| 45 to 64 Years | 2,803 (37.4%) | $66,250 |
| 65+ Years | 1,733 (23.1%) | $43,827 |
| Total | 7,501 (100.0%) | $56,229 |
Poverty in Brawley
Income Below Poverty by Sex and Age in Brawley
With 22.0% poverty level for males and 25.2% for females among the residents of Brawley, 12 to 14 year old males and 5 year old females are the most vulnerable to poverty, with 240 males (48.6%) and 69 females (53.9%) in their respective age groups living below the poverty level.
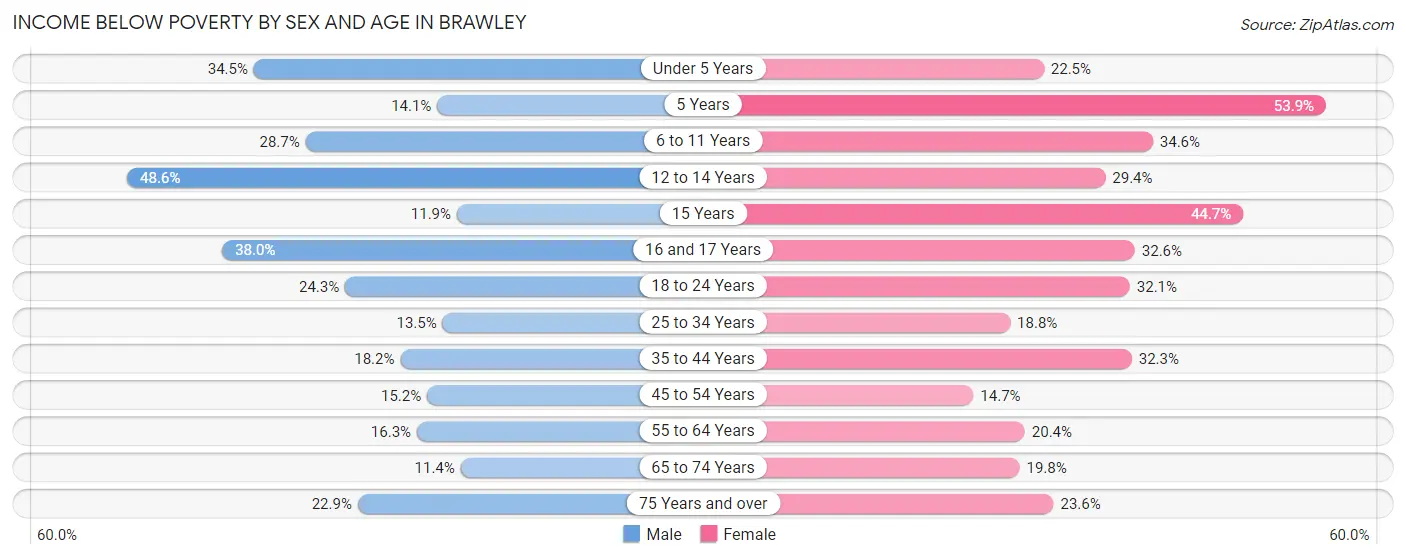
| Age Bracket | Male | Female |
| Under 5 Years | 414 (34.5%) | 274 (22.5%) |
| 5 Years | 34 (14.1%) | 69 (53.9%) |
| 6 to 11 Years | 455 (28.7%) | 416 (34.6%) |
| 12 to 14 Years | 240 (48.6%) | 177 (29.3%) |
| 15 Years | 7 (11.9%) | 97 (44.7%) |
| 16 and 17 Years | 163 (38.0%) | 204 (32.6%) |
| 18 to 24 Years | 413 (24.3%) | 357 (32.1%) |
| 25 to 34 Years | 277 (13.5%) | 397 (18.8%) |
| 35 to 44 Years | 276 (18.2%) | 470 (32.3%) |
| 45 to 54 Years | 232 (15.2%) | 221 (14.7%) |
| 55 to 64 Years | 176 (16.3%) | 263 (20.4%) |
| 65 to 74 Years | 78 (11.4%) | 158 (19.8%) |
| 75 Years and over | 177 (22.9%) | 179 (23.6%) |
| Total | 2,942 (22.0%) | 3,282 (25.2%) |
Income Above Poverty by Sex and Age in Brawley
According to the poverty statistics in Brawley, males aged 65 to 74 years and females aged 45 to 54 years are the age groups that are most secure financially, with 88.6% of males and 85.3% of females in these age groups living above the poverty line.
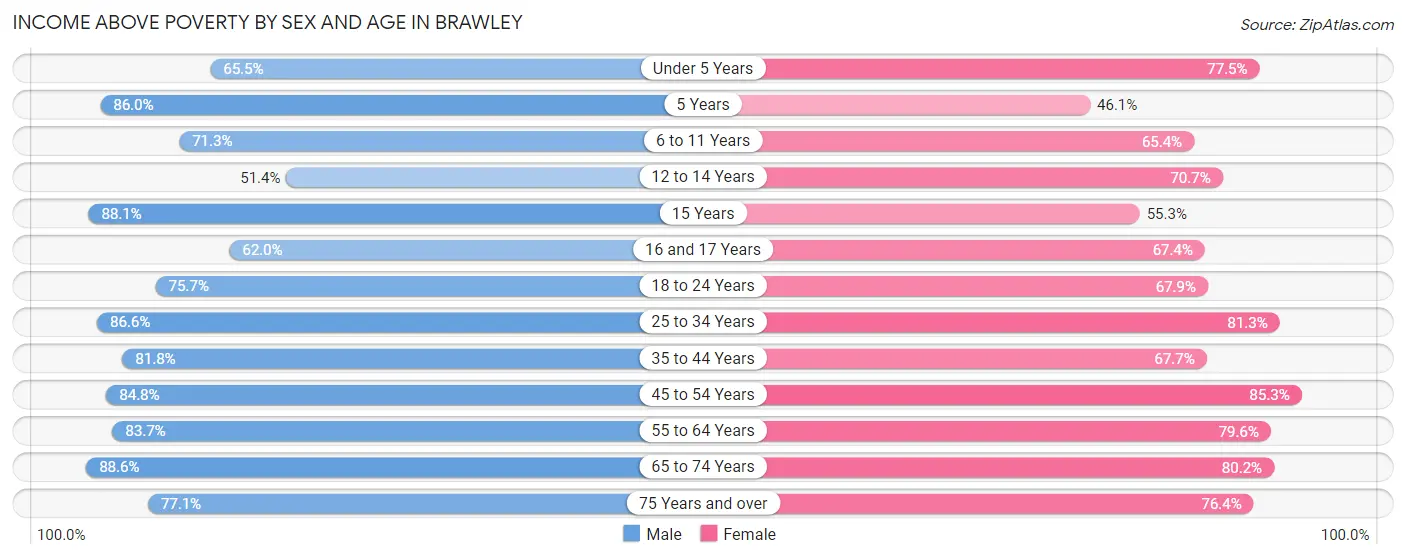
| Age Bracket | Male | Female |
| Under 5 Years | 787 (65.5%) | 944 (77.5%) |
| 5 Years | 208 (86.0%) | 59 (46.1%) |
| 6 to 11 Years | 1,130 (71.3%) | 785 (65.4%) |
| 12 to 14 Years | 254 (51.4%) | 426 (70.7%) |
| 15 Years | 52 (88.1%) | 120 (55.3%) |
| 16 and 17 Years | 266 (62.0%) | 421 (67.4%) |
| 18 to 24 Years | 1,286 (75.7%) | 756 (67.9%) |
| 25 to 34 Years | 1,783 (86.6%) | 1,720 (81.2%) |
| 35 to 44 Years | 1,244 (81.8%) | 985 (67.7%) |
| 45 to 54 Years | 1,296 (84.8%) | 1,286 (85.3%) |
| 55 to 64 Years | 903 (83.7%) | 1,027 (79.6%) |
| 65 to 74 Years | 604 (88.6%) | 640 (80.2%) |
| 75 Years and over | 596 (77.1%) | 580 (76.4%) |
| Total | 10,409 (78.0%) | 9,749 (74.8%) |
Income Below Poverty Among Married-Couple Families in Brawley
The poverty statistics for married-couple families in Brawley show that 10.0% or 321 of the total 3,223 families live below the poverty line. Families with 3 or 4 children have the highest poverty rate of 25.6%, comprising of 115 families. On the other hand, families with no children have the lowest poverty rate of 4.1%, which includes 67 families.
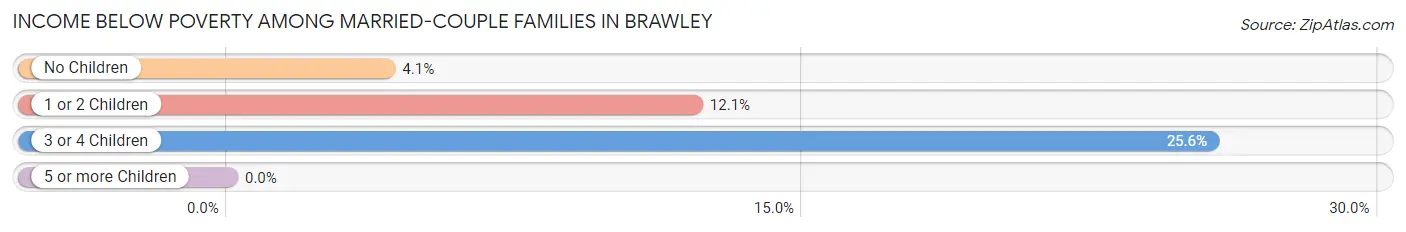
| Children | Above Poverty | Below Poverty |
| No Children | 1,562 (95.9%) | 67 (4.1%) |
| 1 or 2 Children | 1,006 (87.9%) | 139 (12.1%) |
| 3 or 4 Children | 334 (74.4%) | 115 (25.6%) |
| 5 or more Children | 0 (0.0%) | 0 (0.0%) |
| Total | 2,902 (90.0%) | 321 (10.0%) |
Income Below Poverty Among Single-Parent Households in Brawley
According to the poverty data in Brawley, 22.9% or 173 single-father households and 42.9% or 636 single-mother households are living below the poverty line. Among single-father households, those with 3 or 4 children have the highest poverty rate, with 12 households (46.2%) experiencing poverty. Likewise, among single-mother households, those with 5 or more children have the highest poverty rate, with 43 households (100.0%) falling below the poverty line.
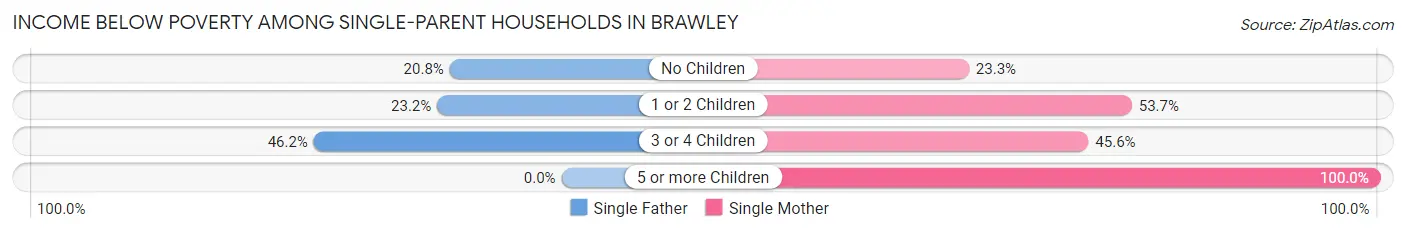
| Children | Single Father | Single Mother |
| No Children | 70 (20.8%) | 122 (23.3%) |
| 1 or 2 Children | 91 (23.2%) | 352 (53.7%) |
| 3 or 4 Children | 12 (46.2%) | 119 (45.6%) |
| 5 or more Children | 0 (0.0%) | 43 (100.0%) |
| Total | 173 (22.9%) | 636 (42.9%) |
Income Below Poverty Among Married-Couple vs Single-Parent Households in Brawley
The poverty data for Brawley shows that 321 of the married-couple family households (10.0%) and 809 of the single-parent households (36.1%) are living below the poverty level. Within the married-couple family households, those with 3 or 4 children have the highest poverty rate, with 115 households (25.6%) falling below the poverty line. Among the single-parent households, those with 5 or more children have the highest poverty rate, with 43 household (100.0%) living below poverty.
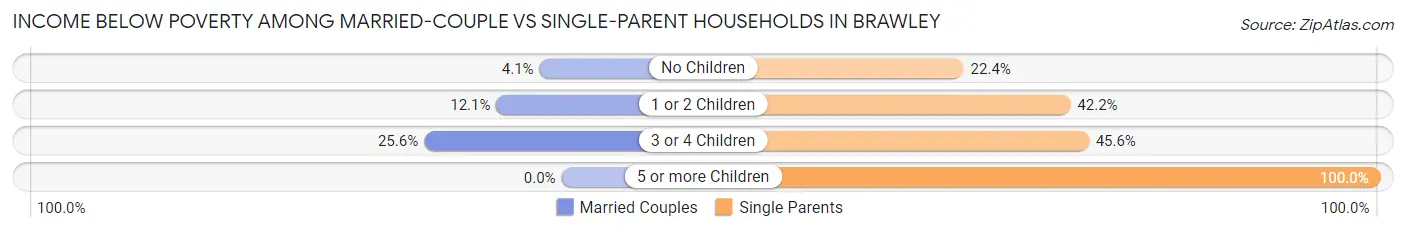
| Children | Married-Couple Families | Single-Parent Households |
| No Children | 67 (4.1%) | 192 (22.4%) |
| 1 or 2 Children | 139 (12.1%) | 443 (42.2%) |
| 3 or 4 Children | 115 (25.6%) | 131 (45.6%) |
| 5 or more Children | 0 (0.0%) | 43 (100.0%) |
| Total | 321 (10.0%) | 809 (36.1%) |
Race in Brawley
The most populous races in Brawley are Hispanic or Latino (22,416 | 84.6%), White / Caucasian (13,864 | 52.3%), and Some other Race (7,082 | 26.7%).
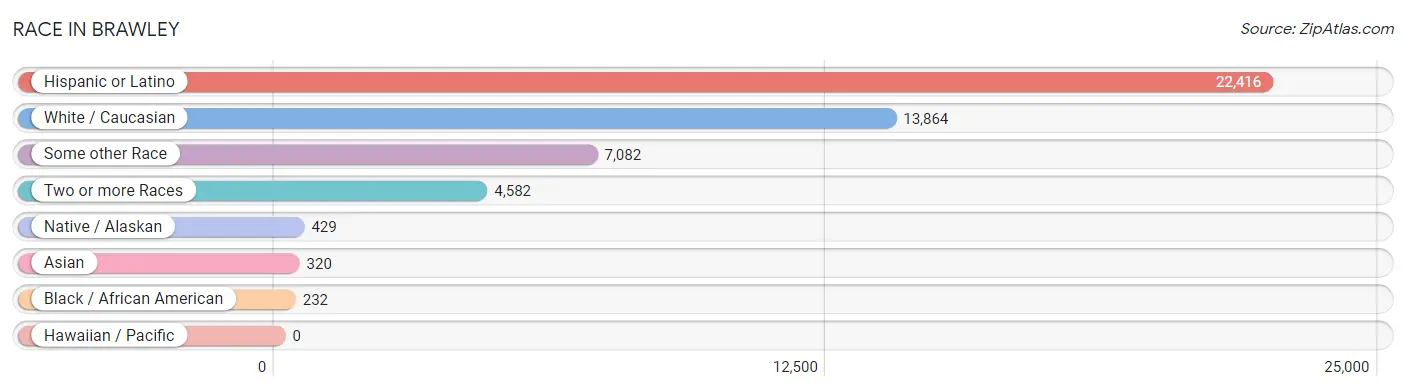
| Race | # Population | % Population |
| Asian | 320 | 1.2% |
| Black / African American | 232 | 0.9% |
| Hawaiian / Pacific | 0 | 0.0% |
| Hispanic or Latino | 22,416 | 84.6% |
| Native / Alaskan | 429 | 1.6% |
| White / Caucasian | 13,864 | 52.3% |
| Two or more Races | 4,582 | 17.3% |
| Some other Race | 7,082 | 26.7% |
| Total | 26,509 | 100.0% |
Ancestry in Brawley
The most populous ancestries reported in Brawley are Mexican (22,027 | 83.1%), German (1,022 | 3.9%), Irish (655 | 2.5%), English (618 | 2.3%), and American (385 | 1.5%), together accounting for 93.2% of all Brawley residents.
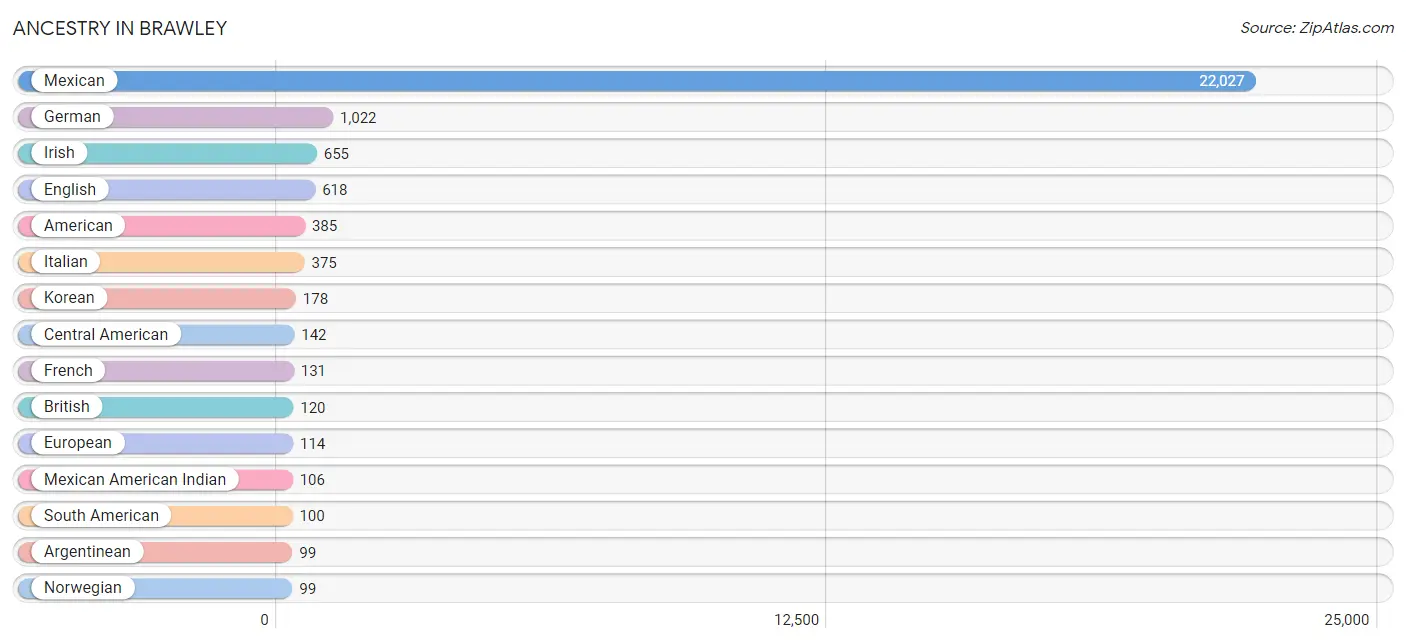
| Ancestry | # Population | % Population |
| African | 5 | 0.0% |
| American | 385 | 1.5% |
| Apache | 14 | 0.1% |
| Argentinean | 99 | 0.4% |
| Basque | 20 | 0.1% |
| Bhutanese | 72 | 0.3% |
| Blackfeet | 1 | 0.0% |
| British | 120 | 0.4% |
| Burmese | 1 | 0.0% |
| Cape Verdean | 9 | 0.0% |
| Central American | 142 | 0.5% |
| Cherokee | 96 | 0.4% |
| Choctaw | 57 | 0.2% |
| Colombian | 1 | 0.0% |
| Danish | 17 | 0.1% |
| Dutch | 44 | 0.2% |
| Eastern European | 17 | 0.1% |
| English | 618 | 2.3% |
| European | 114 | 0.4% |
| Finnish | 12 | 0.1% |
| French | 131 | 0.5% |
| German | 1,022 | 3.9% |
| Guatemalan | 14 | 0.1% |
| Honduran | 20 | 0.1% |
| Hungarian | 13 | 0.1% |
| Indian (Asian) | 86 | 0.3% |
| Irish | 655 | 2.5% |
| Israeli | 67 | 0.3% |
| Italian | 375 | 1.4% |
| Korean | 178 | 0.7% |
| Mexican | 22,027 | 83.1% |
| Mexican American Indian | 106 | 0.4% |
| Navajo | 5 | 0.0% |
| Nicaraguan | 18 | 0.1% |
| Norwegian | 99 | 0.4% |
| Polish | 47 | 0.2% |
| Portuguese | 39 | 0.2% |
| Puerto Rican | 34 | 0.1% |
| Salvadoran | 90 | 0.3% |
| Scotch-Irish | 48 | 0.2% |
| Scottish | 86 | 0.3% |
| South American | 100 | 0.4% |
| Sri Lankan | 29 | 0.1% |
| Subsaharan African | 14 | 0.1% |
| Swedish | 41 | 0.2% |
| Swiss | 25 | 0.1% |
| Thai | 80 | 0.3% |
| Welsh | 61 | 0.2% |
| Yaqui | 40 | 0.2% | View All 49 Rows |
Immigrants in Brawley
The most numerous immigrant groups reported in Brawley came from Latin America (6,861 | 25.9%), Central America (6,732 | 25.4%), Mexico (6,581 | 24.8%), Asia (141 | 0.5%), and El Salvador (128 | 0.5%), together accounting for 77.1% of all Brawley residents.
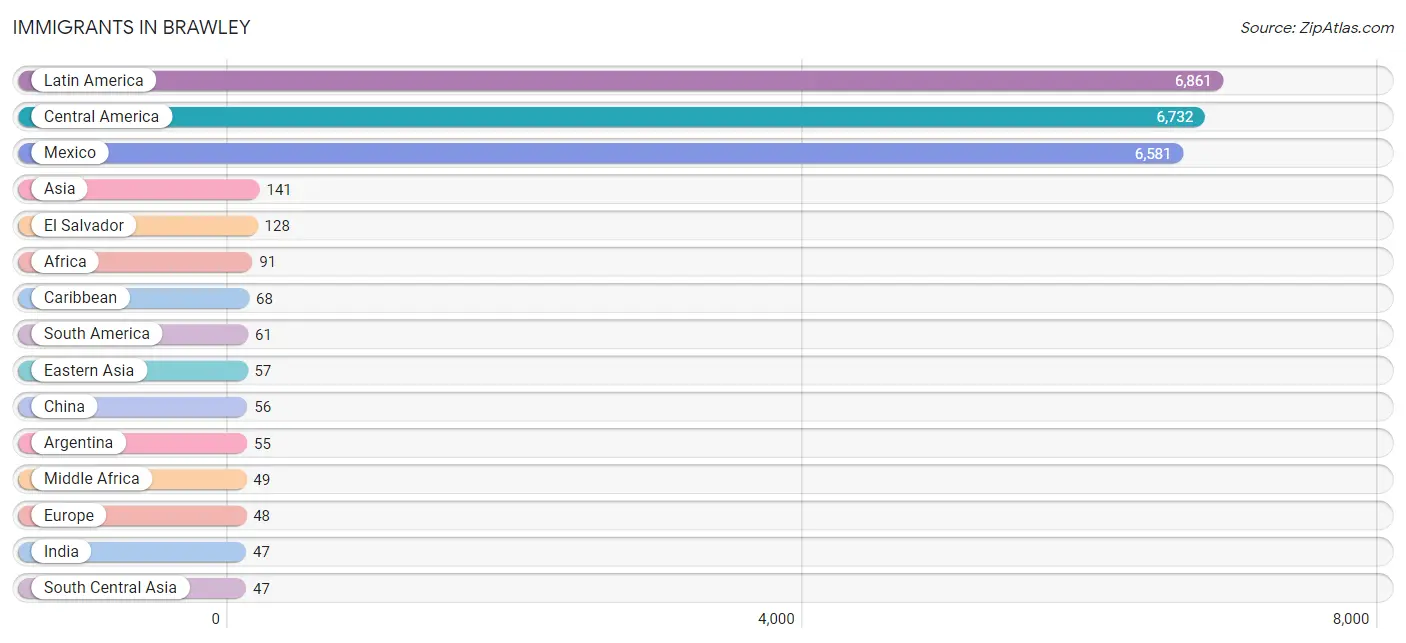
| Immigration Origin | # Population | % Population |
| Africa | 91 | 0.3% |
| Argentina | 55 | 0.2% |
| Asia | 141 | 0.5% |
| Caribbean | 68 | 0.3% |
| Central America | 6,732 | 25.4% |
| Chile | 6 | 0.0% |
| China | 56 | 0.2% |
| Eastern Africa | 42 | 0.2% |
| Eastern Asia | 57 | 0.2% |
| El Salvador | 128 | 0.5% |
| Europe | 48 | 0.2% |
| Germany | 30 | 0.1% |
| Guatemala | 14 | 0.1% |
| Honduras | 9 | 0.0% |
| India | 47 | 0.2% |
| Italy | 18 | 0.1% |
| Korea | 1 | 0.0% |
| Latin America | 6,861 | 25.9% |
| Mexico | 6,581 | 24.8% |
| Middle Africa | 49 | 0.2% |
| Philippines | 37 | 0.1% |
| South America | 61 | 0.2% |
| South Central Asia | 47 | 0.2% |
| South Eastern Asia | 37 | 0.1% |
| Southern Europe | 18 | 0.1% |
| Uganda | 42 | 0.2% |
| Western Europe | 30 | 0.1% | View All 27 Rows |
Sex and Age in Brawley
Sex and Age in Brawley
The most populous age groups in Brawley are 20 to 24 Years (1,383 | 10.3%) for men and Under 5 Years (1,218 | 9.3%) for women.
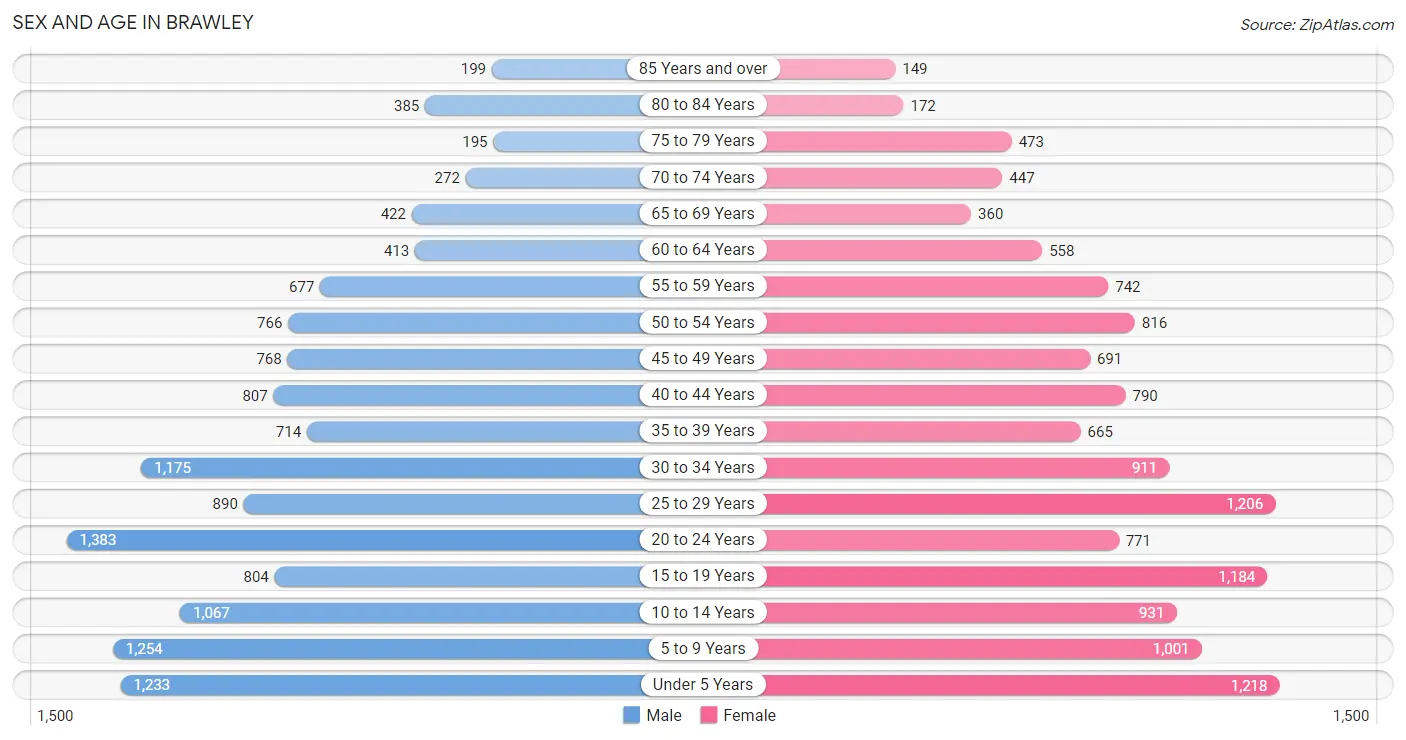
| Age Bracket | Male | Female |
| Under 5 Years | 1,233 (9.2%) | 1,218 (9.3%) |
| 5 to 9 Years | 1,254 (9.3%) | 1,001 (7.6%) |
| 10 to 14 Years | 1,067 (8.0%) | 931 (7.1%) |
| 15 to 19 Years | 804 (6.0%) | 1,184 (9.0%) |
| 20 to 24 Years | 1,383 (10.3%) | 771 (5.9%) |
| 25 to 29 Years | 890 (6.6%) | 1,206 (9.2%) |
| 30 to 34 Years | 1,175 (8.7%) | 911 (7.0%) |
| 35 to 39 Years | 714 (5.3%) | 665 (5.1%) |
| 40 to 44 Years | 807 (6.0%) | 790 (6.0%) |
| 45 to 49 Years | 768 (5.7%) | 691 (5.3%) |
| 50 to 54 Years | 766 (5.7%) | 816 (6.2%) |
| 55 to 59 Years | 677 (5.0%) | 742 (5.7%) |
| 60 to 64 Years | 413 (3.1%) | 558 (4.3%) |
| 65 to 69 Years | 422 (3.1%) | 360 (2.8%) |
| 70 to 74 Years | 272 (2.0%) | 447 (3.4%) |
| 75 to 79 Years | 195 (1.5%) | 473 (3.6%) |
| 80 to 84 Years | 385 (2.9%) | 172 (1.3%) |
| 85 Years and over | 199 (1.5%) | 149 (1.1%) |
| Total | 13,424 (100.0%) | 13,085 (100.0%) |
Families and Households in Brawley
Median Family Size in Brawley
The median family size in Brawley is 4.25 persons per family, with single female/mother families (1,483 | 27.2%) accounting for the largest median family size of 4.64 persons per family. On the other hand, single male/father families (755 | 13.8%) represent the smallest median family size with 3.38 persons per family.
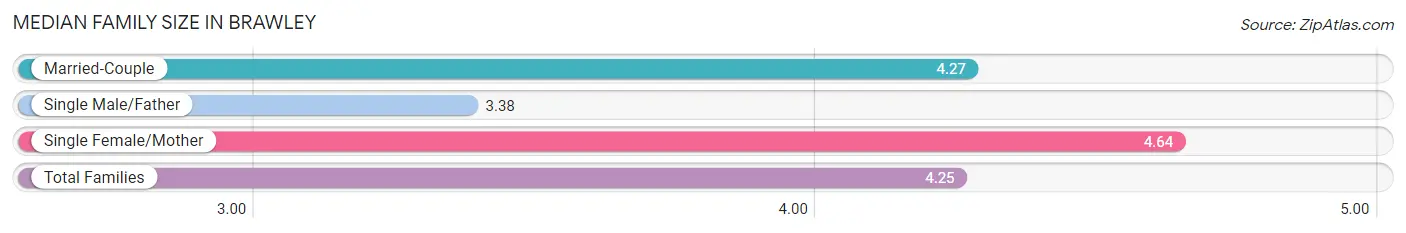
| Family Type | # Families | Family Size |
| Married-Couple | 3,223 (59.0%) | 4.27 |
| Single Male/Father | 755 (13.8%) | 3.38 |
| Single Female/Mother | 1,483 (27.2%) | 4.64 |
| Total Families | 5,461 (100.0%) | 4.25 |
Median Household Size in Brawley
The median household size in Brawley is 3.51 persons per household, with single female/mother households (1,483 | 19.8%) accounting for the largest median household size of 4.86 persons per household. non-family households (2,040 | 27.2%) represent the smallest median household size with 1.20 persons per household.
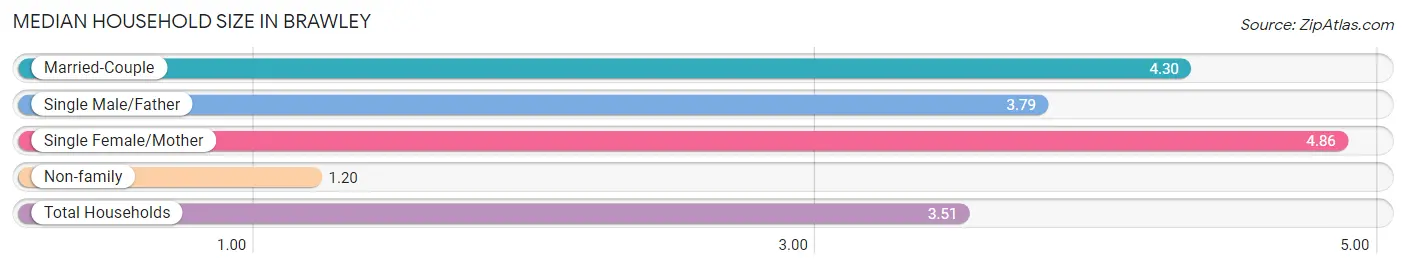
| Household Type | # Households | Household Size |
| Married-Couple | 3,223 (43.0%) | 4.30 |
| Single Male/Father | 755 (10.1%) | 3.79 |
| Single Female/Mother | 1,483 (19.8%) | 4.86 |
| Non-family | 2,040 (27.2%) | 1.20 |
| Total Households | 7,501 (100.0%) | 3.51 |
Household Size by Marriage Status in Brawley
Out of a total of 7,501 households in Brawley, 5,461 (72.8%) are family households, while 2,040 (27.2%) are nonfamily households. The most numerous type of family households are 2-person households, comprising 1,791, and the most common type of nonfamily households are 1-person households, comprising 1,694.
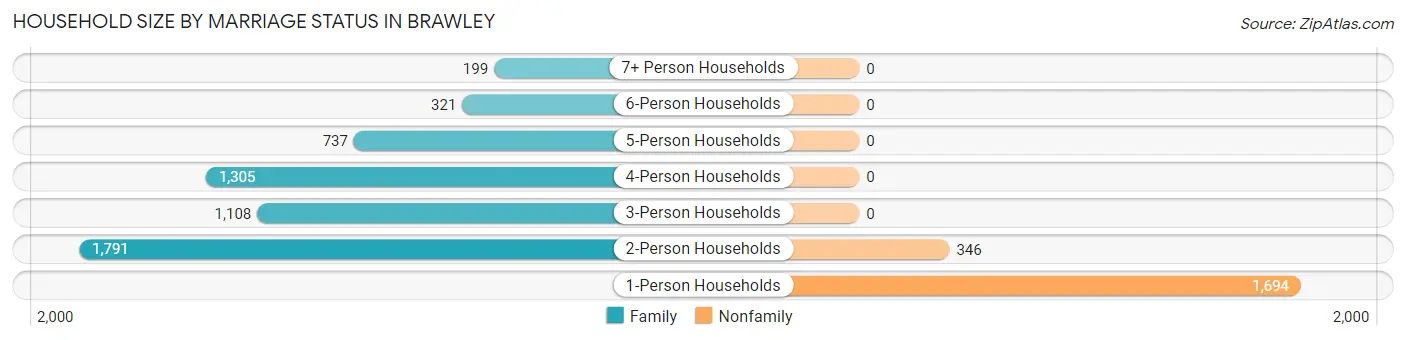
| Household Size | Family Households | Nonfamily Households |
| 1-Person Households | - | 1,694 (22.6%) |
| 2-Person Households | 1,791 (23.9%) | 346 (4.6%) |
| 3-Person Households | 1,108 (14.8%) | 0 (0.0%) |
| 4-Person Households | 1,305 (17.4%) | 0 (0.0%) |
| 5-Person Households | 737 (9.8%) | 0 (0.0%) |
| 6-Person Households | 321 (4.3%) | 0 (0.0%) |
| 7+ Person Households | 199 (2.6%) | 0 (0.0%) |
| Total | 5,461 (72.8%) | 2,040 (27.2%) |
Female Fertility in Brawley
Fertility by Age in Brawley
Average fertility rate in Brawley is 63.0 births per 1,000 women. Women in the age bracket of 20 to 34 years have the highest fertility rate with 111.0 births per 1,000 women. Women in the age bracket of 20 to 34 years acount for 81.5% of all women with births.
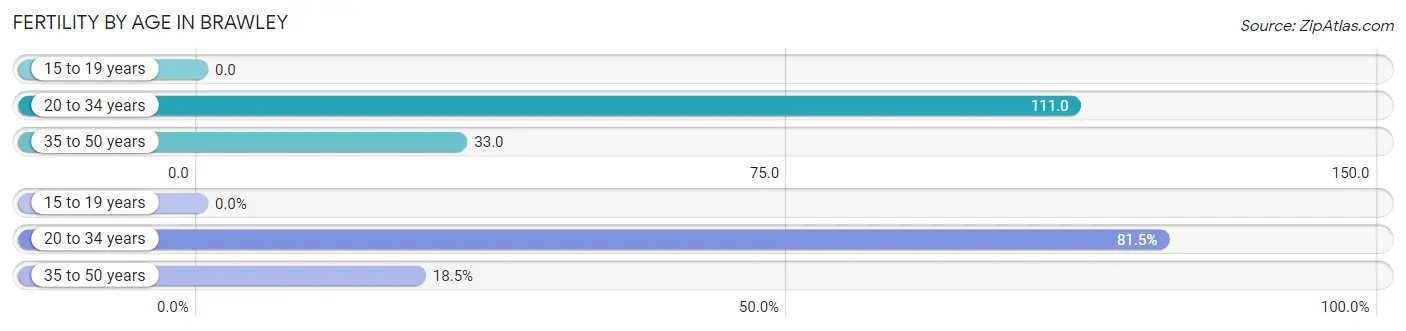
| Age Bracket | Women with Births | Births / 1,000 Women |
| 15 to 19 years | 0 (0.0%) | 0.0 |
| 20 to 34 years | 322 (81.5%) | 111.0 |
| 35 to 50 years | 73 (18.5%) | 33.0 |
| Total | 395 (100.0%) | 63.0 |
Fertility by Age by Marriage Status in Brawley
90.4% of women with births (395) in Brawley are married. The highest percentage of unmarried women with births falls into 20 to 34 years age bracket with 11.8% of them unmarried at the time of birth, while the lowest percentage of unmarried women with births belong to 35 to 50 years age bracket with 0.0% of them unmarried.
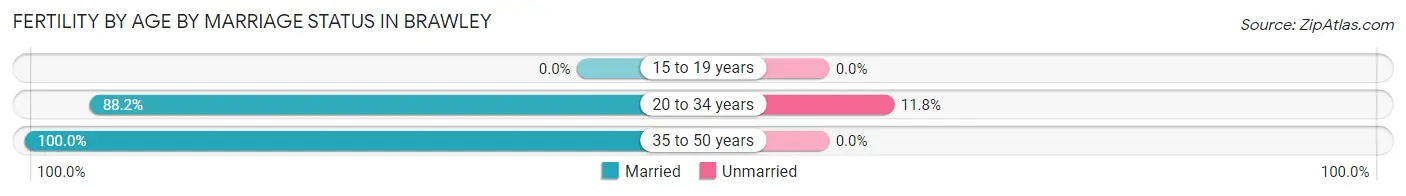
| Age Bracket | Married | Unmarried |
| 15 to 19 years | 0 (0.0%) | 0 (0.0%) |
| 20 to 34 years | 284 (88.2%) | 38 (11.8%) |
| 35 to 50 years | 73 (100.0%) | 0 (0.0%) |
| Total | 357 (90.4%) | 38 (9.6%) |
Fertility by Education in Brawley
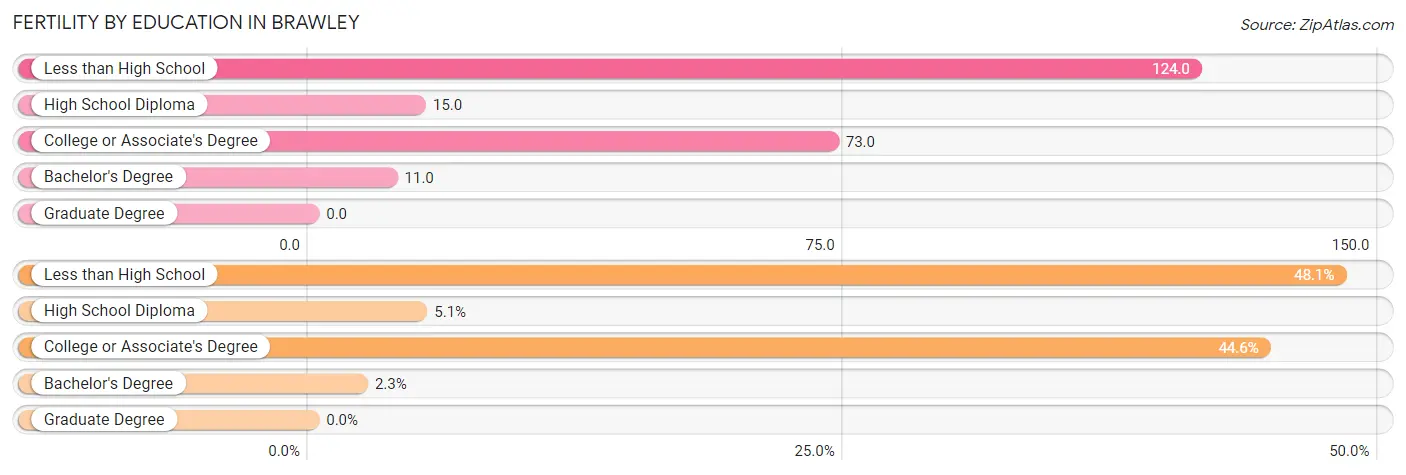
| Educational Attainment | Women with Births | Births / 1,000 Women |
| Less than High School | 190 (48.1%) | 124.0 |
| High School Diploma | 20 (5.1%) | 15.0 |
| College or Associate's Degree | 176 (44.6%) | 73.0 |
| Bachelor's Degree | 9 (2.3%) | 11.0 |
| Graduate Degree | 0 (0.0%) | 0.0 |
| Total | 395 (100.0%) | 63.0 |
Fertility by Education by Marriage Status in Brawley
9.6% of women with births in Brawley are unmarried. Women with the educational attainment of less than high school are most likely to be married with 100.0% of them married at childbirth, while women with the educational attainment of bachelor's degree are least likely to be married with 44.4% of them unmarried at childbirth.
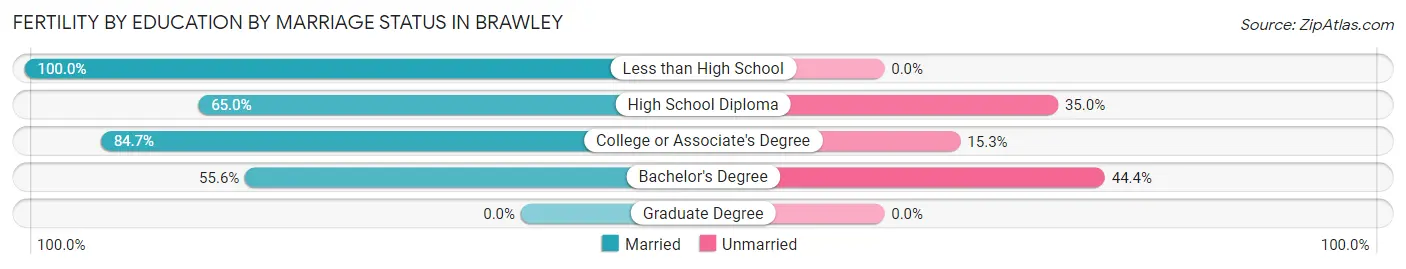
| Educational Attainment | Married | Unmarried |
| Less than High School | 190 (100.0%) | 0 (0.0%) |
| High School Diploma | 13 (65.0%) | 7 (35.0%) |
| College or Associate's Degree | 149 (84.7%) | 27 (15.3%) |
| Bachelor's Degree | 5 (55.6%) | 4 (44.4%) |
| Graduate Degree | 0 (0.0%) | 0 (0.0%) |
| Total | 357 (90.4%) | 38 (9.6%) |
Employment Characteristics in Brawley
Employment by Class of Employer in Brawley
Among the 8,714 employed individuals in Brawley, private company employees (5,244 | 60.2%), local government employees (1,204 | 13.8%), and state government employees (1,082 | 12.4%) make up the most common classes of employment.
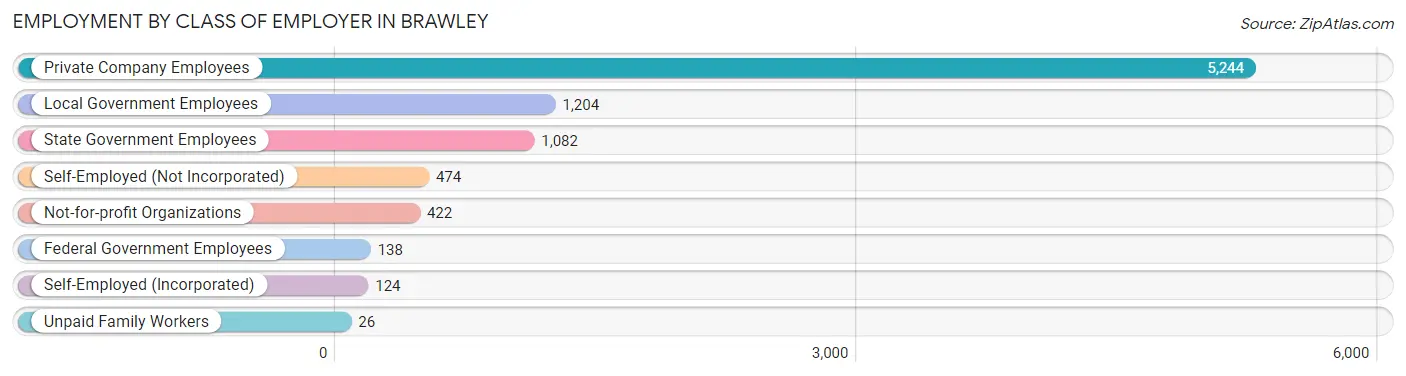
| Employer Class | # Employees | % Employees |
| Private Company Employees | 5,244 | 60.2% |
| Self-Employed (Incorporated) | 124 | 1.4% |
| Self-Employed (Not Incorporated) | 474 | 5.4% |
| Not-for-profit Organizations | 422 | 4.8% |
| Local Government Employees | 1,204 | 13.8% |
| State Government Employees | 1,082 | 12.4% |
| Federal Government Employees | 138 | 1.6% |
| Unpaid Family Workers | 26 | 0.3% |
| Total | 8,714 | 100.0% |
Employment Status by Age in Brawley
According to the labor force statistics for Brawley, out of the total population over 16 years of age (19,529), 56.0% or 10,936 individuals are in the labor force, with 18.2% or 1,990 of them unemployed. The age group with the highest labor force participation rate is 30 to 34 years, with 80.8% or 1,685 individuals in the labor force. Within the labor force, the 16 to 19 years age range has the highest percentage of unemployed individuals, with 45.0% or 104 of them being unemployed.
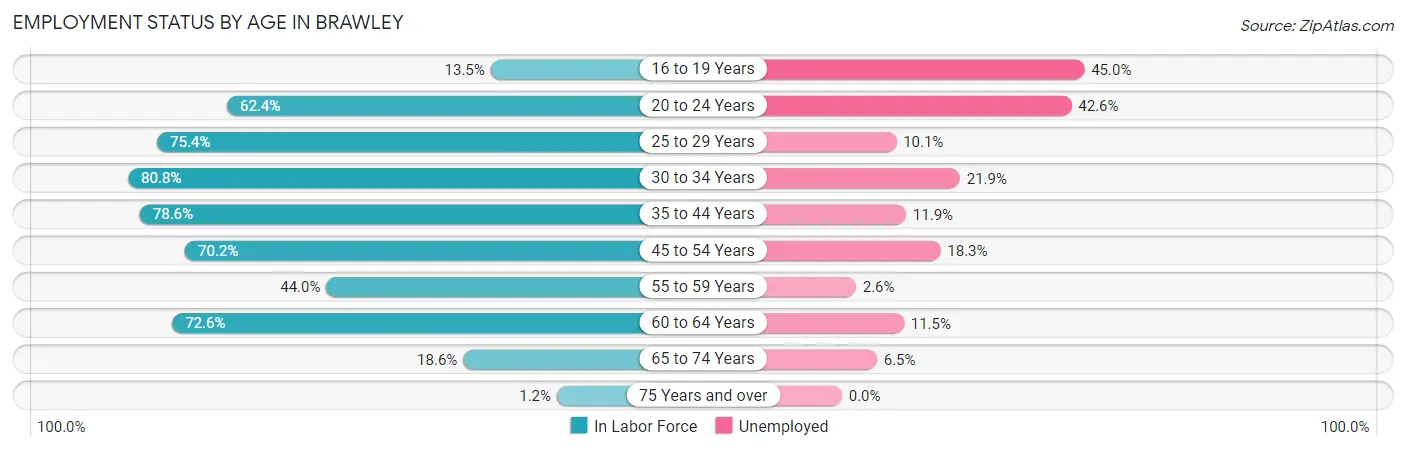
| Age Bracket | In Labor Force | Unemployed |
| 16 to 19 Years | 231 (13.5%) | 104 (45.0%) |
| 20 to 24 Years | 1,344 (62.4%) | 573 (42.6%) |
| 25 to 29 Years | 1,580 (75.4%) | 160 (10.1%) |
| 30 to 34 Years | 1,685 (80.8%) | 369 (21.9%) |
| 35 to 44 Years | 2,339 (78.6%) | 278 (11.9%) |
| 45 to 54 Years | 2,135 (70.2%) | 391 (18.3%) |
| 55 to 59 Years | 624 (44.0%) | 16 (2.6%) |
| 60 to 64 Years | 705 (72.6%) | 81 (11.5%) |
| 65 to 74 Years | 279 (18.6%) | 18 (6.5%) |
| 75 Years and over | 19 (1.2%) | 0 (0.0%) |
| Total | 10,936 (56.0%) | 1,990 (18.2%) |
Employment Status by Educational Attainment in Brawley
According to labor force statistics for Brawley, 72.0% of individuals (9,064) out of the total population between 25 and 64 years of age (12,589) are in the labor force, with 14.3% or 1,296 of them being unemployed. The group with the highest labor force participation rate are those with the educational attainment of bachelor's degree or higher, with 91.7% or 1,826 individuals in the labor force. Within the labor force, individuals with less than high school education have the highest percentage of unemployment, with 28.7% or 381 of them being unemployed.
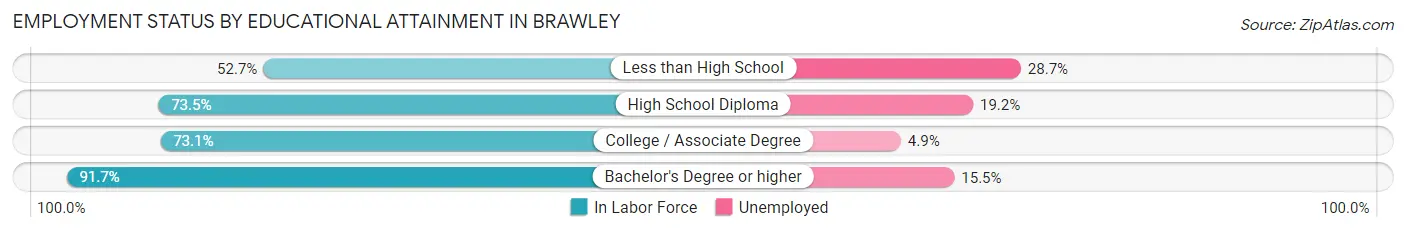
| Educational Attainment | In Labor Force | Unemployed |
| Less than High School | 1,328 (52.7%) | 723 (28.7%) |
| High School Diploma | 2,364 (73.5%) | 618 (19.2%) |
| College / Associate Degree | 3,553 (73.1%) | 238 (4.9%) |
| Bachelor's Degree or higher | 1,826 (91.7%) | 309 (15.5%) |
| Total | 9,064 (72.0%) | 1,800 (14.3%) |
Employment Occupations by Sex in Brawley
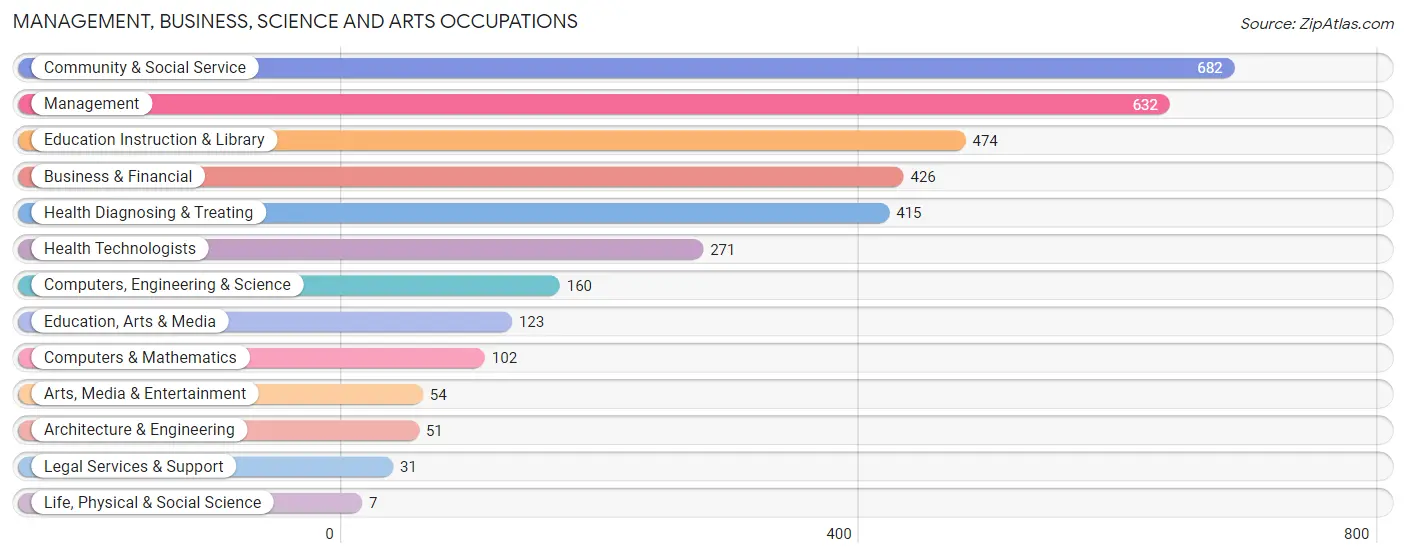
Management, Business, Science and Arts Occupations
The most common Management, Business, Science and Arts occupations in Brawley are Community & Social Service (682 | 7.6%), Management (632 | 7.1%), Education Instruction & Library (474 | 5.3%), Business & Financial (426 | 4.8%), and Health Diagnosing & Treating (415 | 4.6%).
Management, Business, Science and Arts Occupations by Sex
Within the Management, Business, Science and Arts occupations in Brawley, the most male-oriented occupations are Computers & Mathematics (100.0%), Architecture & Engineering (100.0%), and Computers, Engineering & Science (95.6%), while the most female-oriented occupations are Life, Physical & Social Science (100.0%), Legal Services & Support (100.0%), and Arts, Media & Entertainment (100.0%).
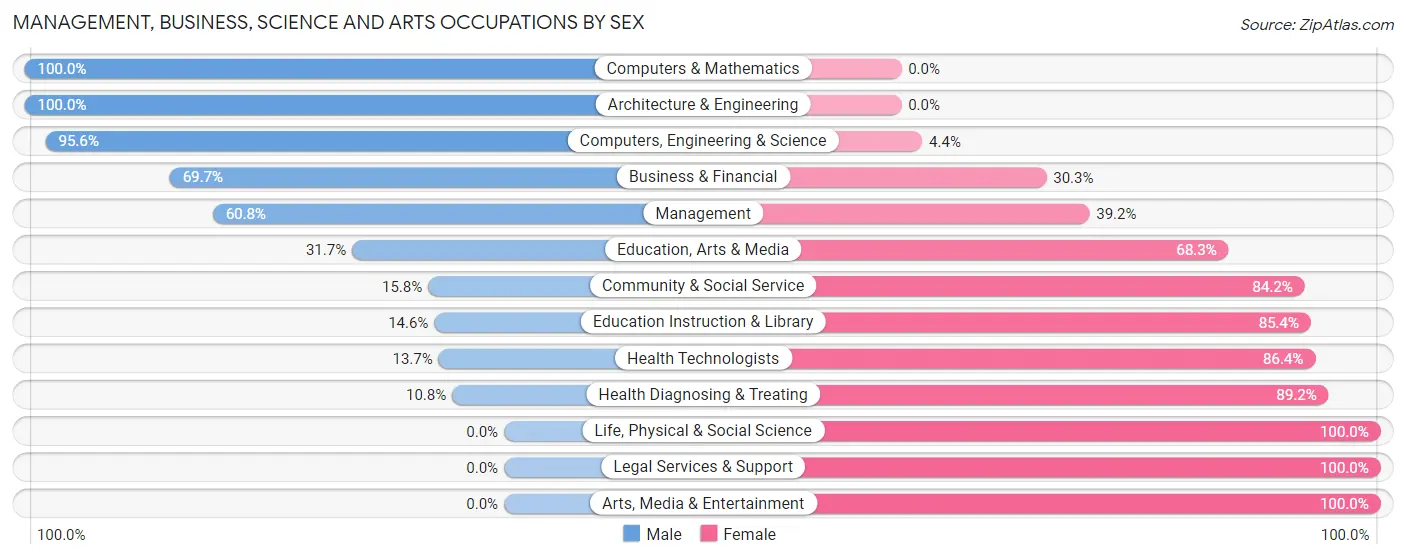
| Occupation | Male | Female |
| Management | 384 (60.8%) | 248 (39.2%) |
| Business & Financial | 297 (69.7%) | 129 (30.3%) |
| Computers, Engineering & Science | 153 (95.6%) | 7 (4.4%) |
| Computers & Mathematics | 102 (100.0%) | 0 (0.0%) |
| Architecture & Engineering | 51 (100.0%) | 0 (0.0%) |
| Life, Physical & Social Science | 0 (0.0%) | 7 (100.0%) |
| Community & Social Service | 108 (15.8%) | 574 (84.2%) |
| Education, Arts & Media | 39 (31.7%) | 84 (68.3%) |
| Legal Services & Support | 0 (0.0%) | 31 (100.0%) |
| Education Instruction & Library | 69 (14.6%) | 405 (85.4%) |
| Arts, Media & Entertainment | 0 (0.0%) | 54 (100.0%) |
| Health Diagnosing & Treating | 45 (10.8%) | 370 (89.2%) |
| Health Technologists | 37 (13.7%) | 234 (86.4%) |
| Total (Category) | 987 (42.6%) | 1,328 (57.4%) |
| Total (Overall) | 4,874 (54.6%) | 4,055 (45.4%) |
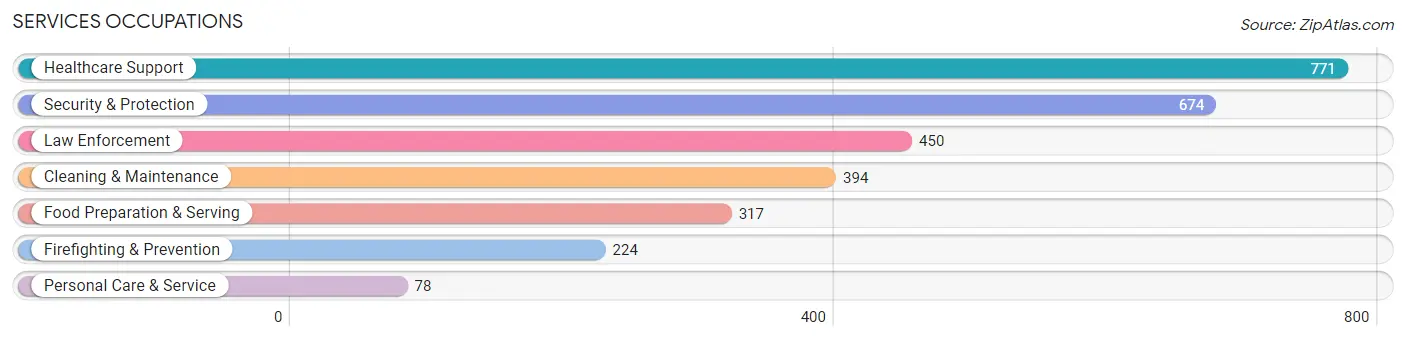
Services Occupations
The most common Services occupations in Brawley are Healthcare Support (771 | 8.6%), Security & Protection (674 | 7.5%), Law Enforcement (450 | 5.0%), Cleaning & Maintenance (394 | 4.4%), and Food Preparation & Serving (317 | 3.5%).
Services Occupations by Sex
Within the Services occupations in Brawley, the most male-oriented occupations are Law Enforcement (88.2%), Security & Protection (85.0%), and Firefighting & Prevention (78.6%), while the most female-oriented occupations are Food Preparation & Serving (89.0%), Healthcare Support (84.2%), and Personal Care & Service (32.1%).
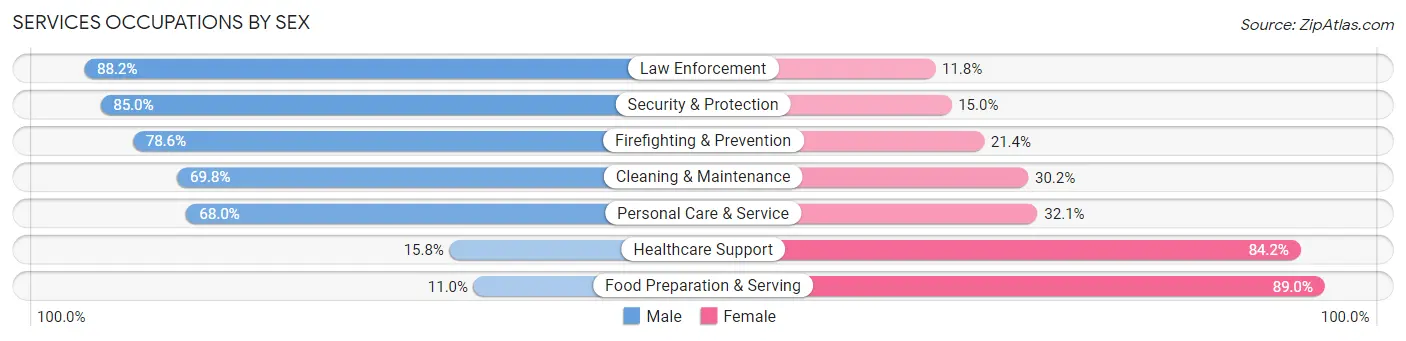
| Occupation | Male | Female |
| Healthcare Support | 122 (15.8%) | 649 (84.2%) |
| Security & Protection | 573 (85.0%) | 101 (15.0%) |
| Firefighting & Prevention | 176 (78.6%) | 48 (21.4%) |
| Law Enforcement | 397 (88.2%) | 53 (11.8%) |
| Food Preparation & Serving | 35 (11.0%) | 282 (89.0%) |
| Cleaning & Maintenance | 275 (69.8%) | 119 (30.2%) |
| Personal Care & Service | 53 (67.9%) | 25 (32.1%) |
| Total (Category) | 1,058 (47.4%) | 1,176 (52.6%) |
| Total (Overall) | 4,874 (54.6%) | 4,055 (45.4%) |
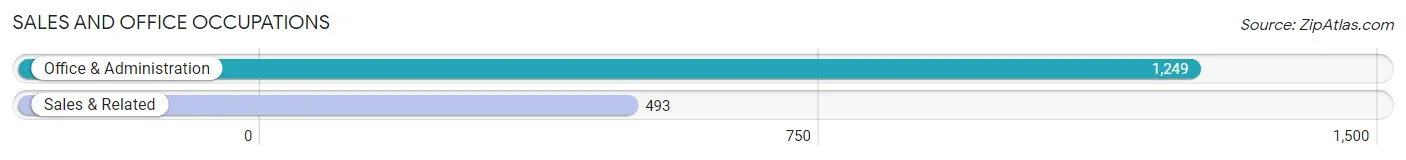
Sales and Office Occupations
The most common Sales and Office occupations in Brawley are Office & Administration (1,249 | 14.0%), and Sales & Related (493 | 5.5%).
Sales and Office Occupations by Sex
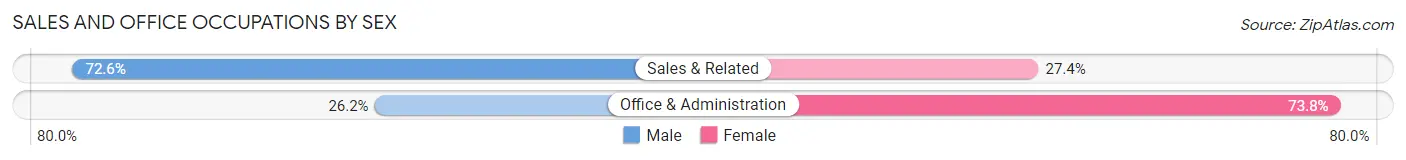
| Occupation | Male | Female |
| Sales & Related | 358 (72.6%) | 135 (27.4%) |
| Office & Administration | 327 (26.2%) | 922 (73.8%) |
| Total (Category) | 685 (39.3%) | 1,057 (60.7%) |
| Total (Overall) | 4,874 (54.6%) | 4,055 (45.4%) |
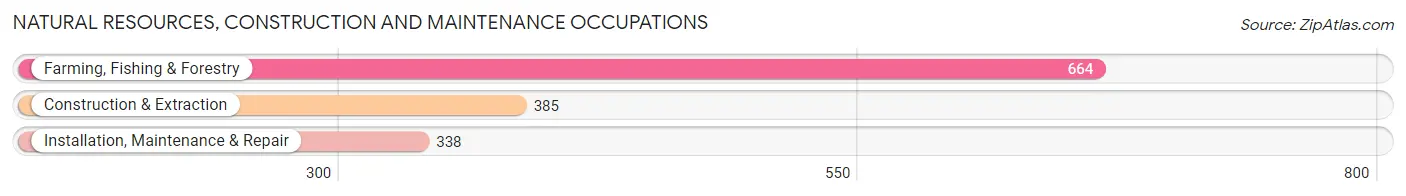
Natural Resources, Construction and Maintenance Occupations
The most common Natural Resources, Construction and Maintenance occupations in Brawley are Farming, Fishing & Forestry (664 | 7.4%), Construction & Extraction (385 | 4.3%), and Installation, Maintenance & Repair (338 | 3.8%).
Natural Resources, Construction and Maintenance Occupations by Sex
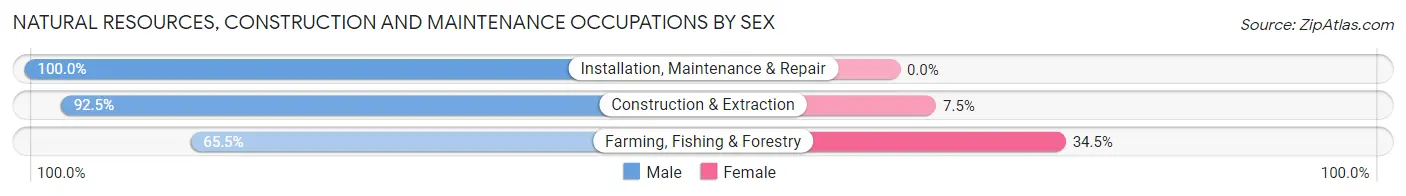
| Occupation | Male | Female |
| Farming, Fishing & Forestry | 435 (65.5%) | 229 (34.5%) |
| Construction & Extraction | 356 (92.5%) | 29 (7.5%) |
| Installation, Maintenance & Repair | 338 (100.0%) | 0 (0.0%) |
| Total (Category) | 1,129 (81.4%) | 258 (18.6%) |
| Total (Overall) | 4,874 (54.6%) | 4,055 (45.4%) |
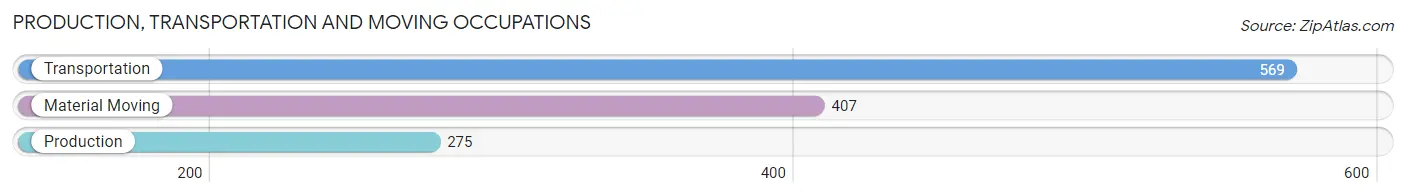
Production, Transportation and Moving Occupations
The most common Production, Transportation and Moving occupations in Brawley are Transportation (569 | 6.4%), Material Moving (407 | 4.6%), and Production (275 | 3.1%).
Production, Transportation and Moving Occupations by Sex
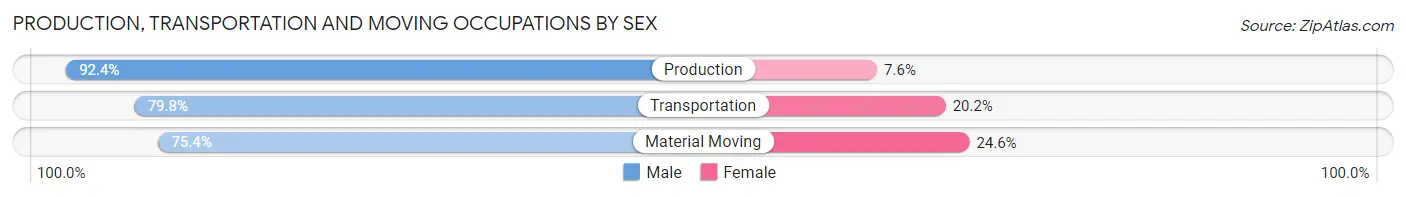
| Occupation | Male | Female |
| Production | 254 (92.4%) | 21 (7.6%) |
| Transportation | 454 (79.8%) | 115 (20.2%) |
| Material Moving | 307 (75.4%) | 100 (24.6%) |
| Total (Category) | 1,015 (81.1%) | 236 (18.9%) |
| Total (Overall) | 4,874 (54.6%) | 4,055 (45.4%) |
Employment Industries by Sex in Brawley
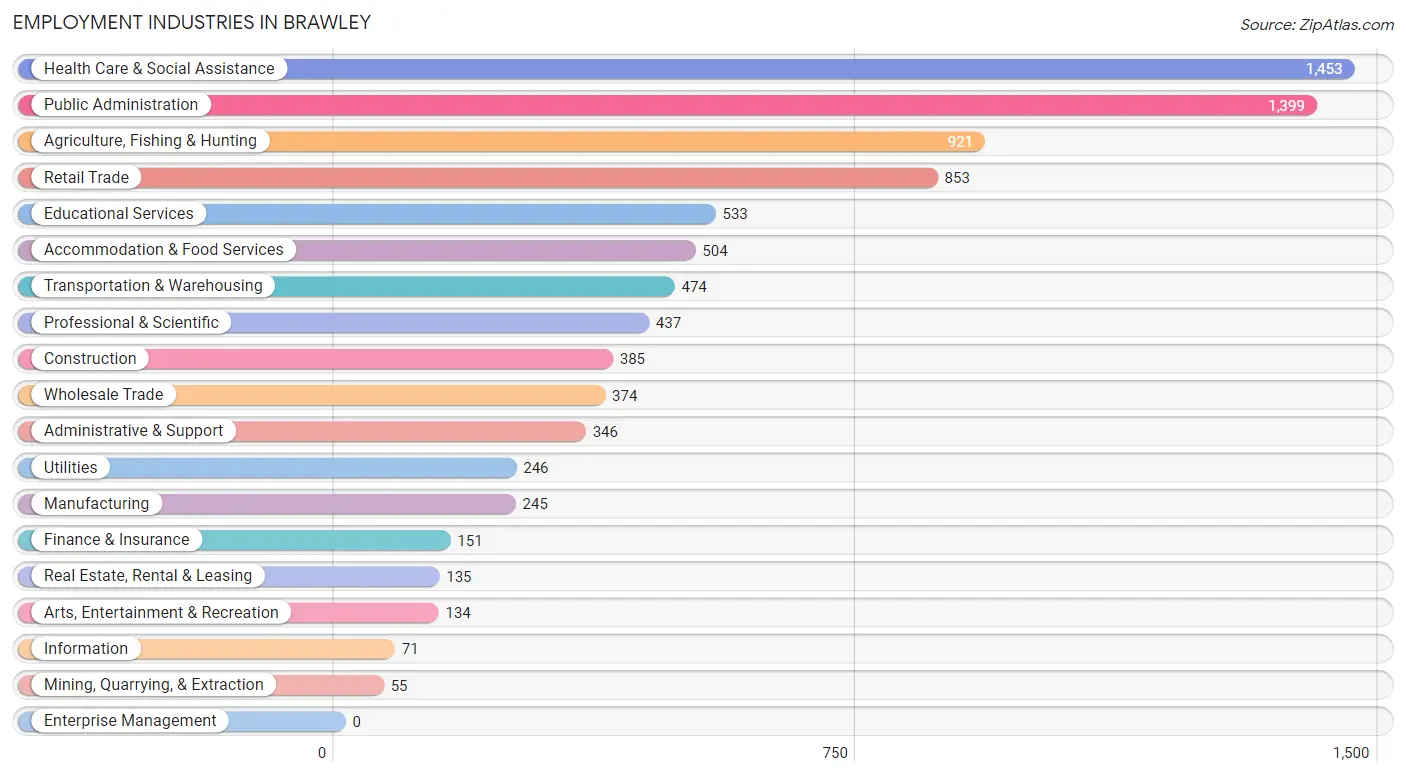
Employment Industries in Brawley
The major employment industries in Brawley include Health Care & Social Assistance (1,453 | 16.3%), Public Administration (1,399 | 15.7%), Agriculture, Fishing & Hunting (921 | 10.3%), Retail Trade (853 | 9.6%), and Educational Services (533 | 6.0%).
Employment Industries by Sex in Brawley
The Brawley industries that see more men than women are Mining, Quarrying, & Extraction (100.0%), Utilities (100.0%), and Construction (90.9%), whereas the industries that tend to have a higher number of women are Health Care & Social Assistance (89.9%), Educational Services (74.3%), and Arts, Entertainment & Recreation (70.9%).
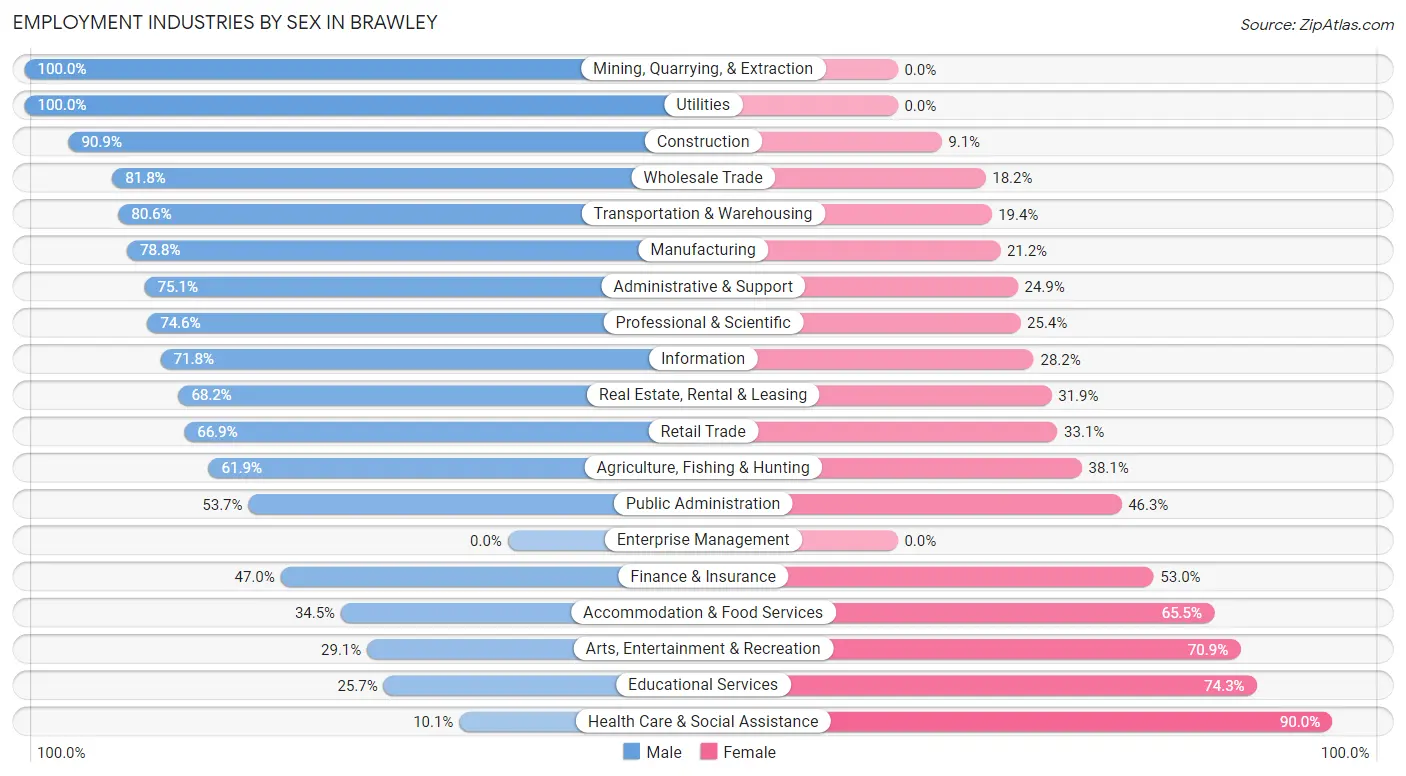
| Industry | Male | Female |
| Agriculture, Fishing & Hunting | 570 (61.9%) | 351 (38.1%) |
| Mining, Quarrying, & Extraction | 55 (100.0%) | 0 (0.0%) |
| Construction | 350 (90.9%) | 35 (9.1%) |
| Manufacturing | 193 (78.8%) | 52 (21.2%) |
| Wholesale Trade | 306 (81.8%) | 68 (18.2%) |
| Retail Trade | 571 (66.9%) | 282 (33.1%) |
| Transportation & Warehousing | 382 (80.6%) | 92 (19.4%) |
| Utilities | 246 (100.0%) | 0 (0.0%) |
| Information | 51 (71.8%) | 20 (28.2%) |
| Finance & Insurance | 71 (47.0%) | 80 (53.0%) |
| Real Estate, Rental & Leasing | 92 (68.1%) | 43 (31.9%) |
| Professional & Scientific | 326 (74.6%) | 111 (25.4%) |
| Enterprise Management | 0 (0.0%) | 0 (0.0%) |
| Administrative & Support | 260 (75.1%) | 86 (24.9%) |
| Educational Services | 137 (25.7%) | 396 (74.3%) |
| Health Care & Social Assistance | 146 (10.1%) | 1,307 (89.9%) |
| Arts, Entertainment & Recreation | 39 (29.1%) | 95 (70.9%) |
| Accommodation & Food Services | 174 (34.5%) | 330 (65.5%) |
| Public Administration | 751 (53.7%) | 648 (46.3%) |
| Total | 4,874 (54.6%) | 4,055 (45.4%) |
Education in Brawley
School Enrollment in Brawley
The most common levels of schooling among the 7,870 students in Brawley are elementary school (1,921 | 24.4%), high school (1,702 | 21.6%), and college / undergraduate (1,555 | 19.8%).
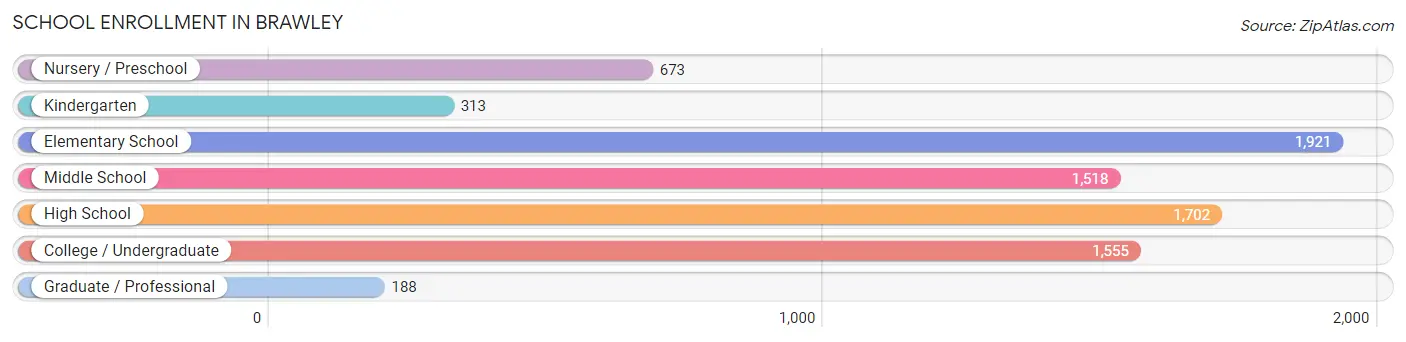
| School Level | # Students | % Students |
| Nursery / Preschool | 673 | 8.6% |
| Kindergarten | 313 | 4.0% |
| Elementary School | 1,921 | 24.4% |
| Middle School | 1,518 | 19.3% |
| High School | 1,702 | 21.6% |
| College / Undergraduate | 1,555 | 19.8% |
| Graduate / Professional | 188 | 2.4% |
| Total | 7,870 | 100.0% |
School Enrollment by Age by Funding Source in Brawley
Out of a total of 7,870 students who are enrolled in schools in Brawley, 236 (3.0%) attend a private institution, while the remaining 7,634 (97.0%) are enrolled in public schools. The age group of 35 years and over has the highest likelihood of being enrolled in private schools, with 41 (10.1% in the age bracket) enrolled. Conversely, the age group of 18 to 19 year olds has the lowest likelihood of being enrolled in a private school, with 479 (100.0% in the age bracket) attending a public institution.
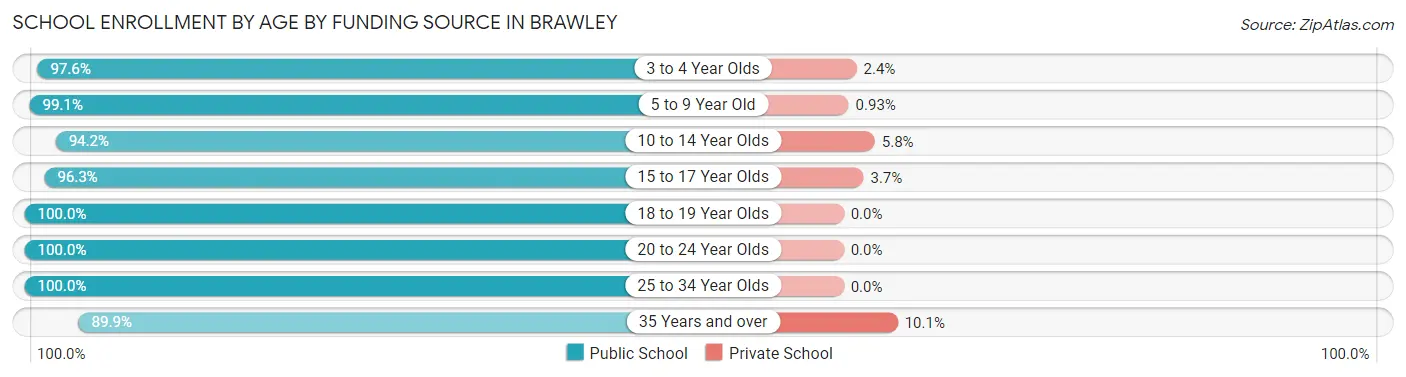
| Age Bracket | Public School | Private School |
| 3 to 4 Year Olds | 648 (97.6%) | 16 (2.4%) |
| 5 to 9 Year Old | 2,031 (99.1%) | 19 (0.9%) |
| 10 to 14 Year Olds | 1,835 (94.2%) | 113 (5.8%) |
| 15 to 17 Year Olds | 1,275 (96.3%) | 49 (3.7%) |
| 18 to 19 Year Olds | 479 (100.0%) | 0 (0.0%) |
| 20 to 24 Year Olds | 533 (100.0%) | 0 (0.0%) |
| 25 to 34 Year Olds | 465 (100.0%) | 0 (0.0%) |
| 35 Years and over | 366 (89.9%) | 41 (10.1%) |
| Total | 7,634 (97.0%) | 236 (3.0%) |
Educational Attainment by Field of Study in Brawley
Education (561 | 22.9%), business (464 | 19.0%), psychology (254 | 10.4%), liberal arts & history (183 | 7.5%), and bio, nature & agricultural (181 | 7.4%) are the most common fields of study among 2,447 individuals in Brawley who have obtained a bachelor's degree or higher.
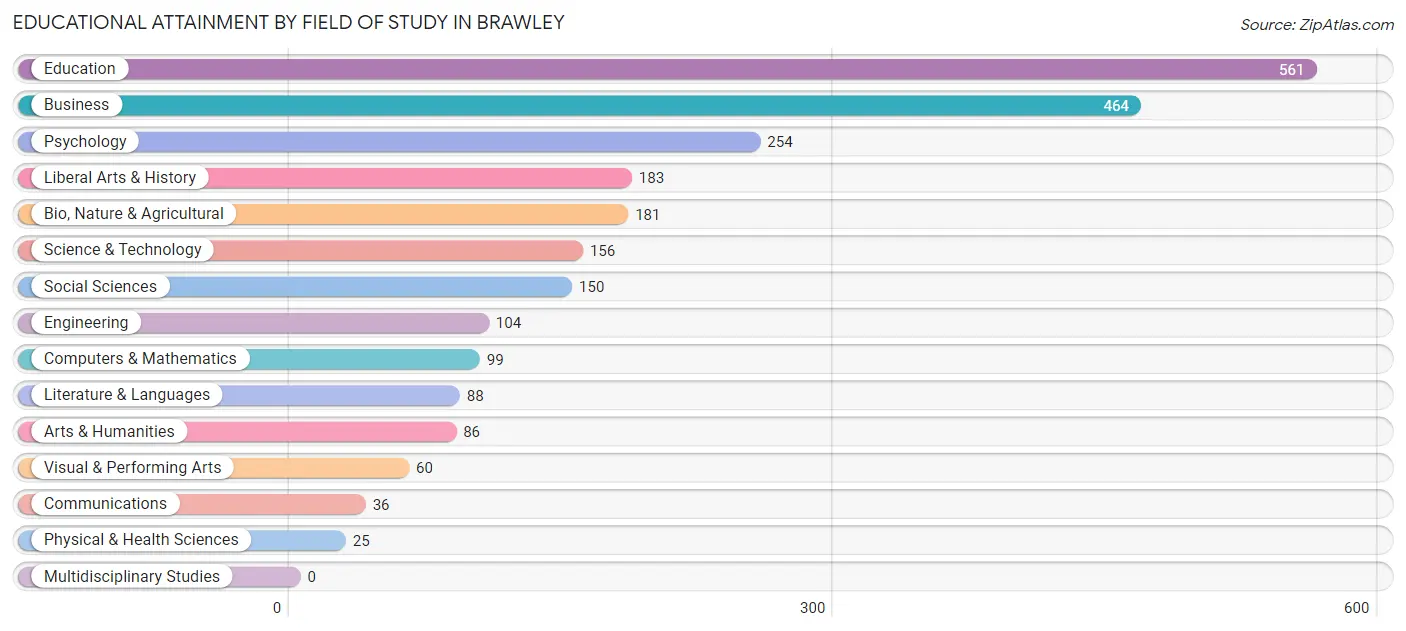
| Field of Study | # Graduates | % Graduates |
| Computers & Mathematics | 99 | 4.1% |
| Bio, Nature & Agricultural | 181 | 7.4% |
| Physical & Health Sciences | 25 | 1.0% |
| Psychology | 254 | 10.4% |
| Social Sciences | 150 | 6.1% |
| Engineering | 104 | 4.3% |
| Multidisciplinary Studies | 0 | 0.0% |
| Science & Technology | 156 | 6.4% |
| Business | 464 | 19.0% |
| Education | 561 | 22.9% |
| Literature & Languages | 88 | 3.6% |
| Liberal Arts & History | 183 | 7.5% |
| Visual & Performing Arts | 60 | 2.5% |
| Communications | 36 | 1.5% |
| Arts & Humanities | 86 | 3.5% |
| Total | 2,447 | 100.0% |
Transportation & Commute in Brawley
Vehicle Availability by Sex in Brawley
The most prevalent vehicle ownership categories in Brawley are males with 2 vehicles (2,207, accounting for 46.2%) and females with 2 vehicles (1,325, making up 56.1%).
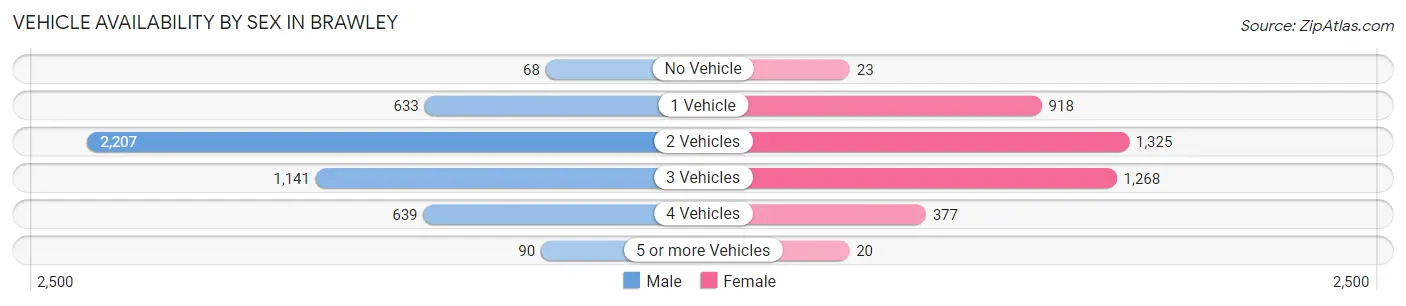
| Vehicles Available | Male | Female |
| No Vehicle | 68 (1.4%) | 23 (0.6%) |
| 1 Vehicle | 633 (13.3%) | 918 (23.4%) |
| 2 Vehicles | 2,207 (46.2%) | 1,325 (33.7%) |
| 3 Vehicles | 1,141 (23.9%) | 1,268 (32.3%) |
| 4 Vehicles | 639 (13.4%) | 377 (9.6%) |
| 5 or more Vehicles | 90 (1.9%) | 20 (0.5%) |
| Total | 4,778 (100.0%) | 3,931 (100.0%) |
Commute Time in Brawley
The most frequently occuring commute durations in Brawley are 5 to 9 minutes (1,569 commuters, 19.7%), 10 to 14 minutes (1,438 commuters, 18.0%), and 30 to 34 minutes (1,113 commuters, 13.9%).
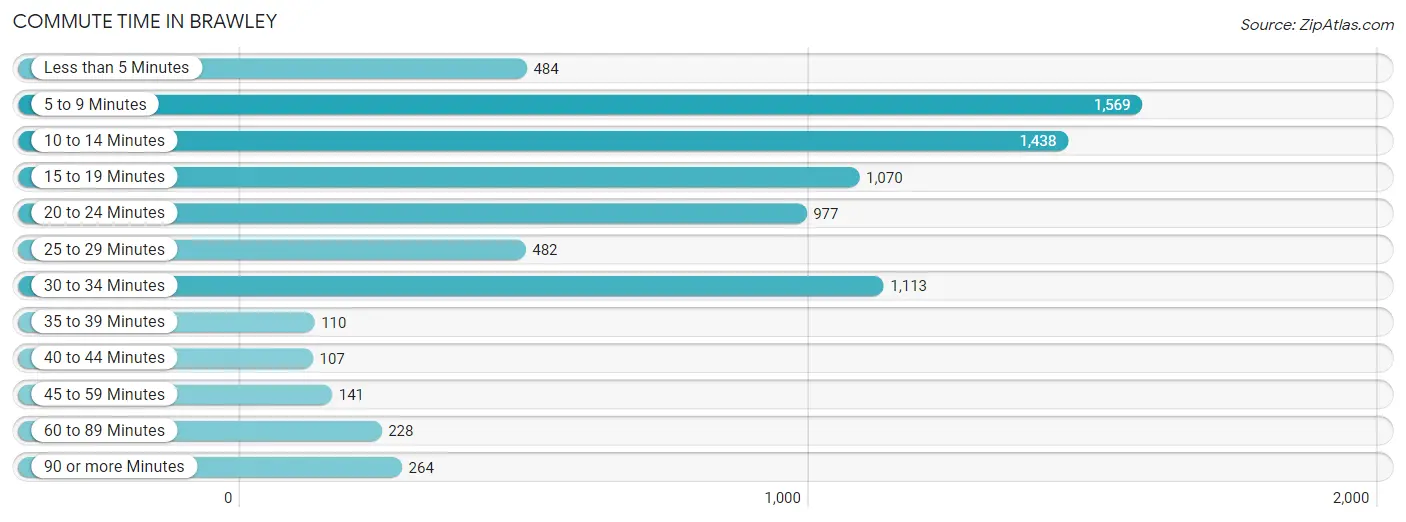
| Commute Time | # Commuters | % Commuters |
| Less than 5 Minutes | 484 | 6.1% |
| 5 to 9 Minutes | 1,569 | 19.7% |
| 10 to 14 Minutes | 1,438 | 18.0% |
| 15 to 19 Minutes | 1,070 | 13.4% |
| 20 to 24 Minutes | 977 | 12.2% |
| 25 to 29 Minutes | 482 | 6.0% |
| 30 to 34 Minutes | 1,113 | 13.9% |
| 35 to 39 Minutes | 110 | 1.4% |
| 40 to 44 Minutes | 107 | 1.3% |
| 45 to 59 Minutes | 141 | 1.8% |
| 60 to 89 Minutes | 228 | 2.9% |
| 90 or more Minutes | 264 | 3.3% |
Commute Time by Sex in Brawley
The most common commute times in Brawley are 5 to 9 minutes (757 commuters, 16.8%) for males and 5 to 9 minutes (812 commuters, 23.3%) for females.
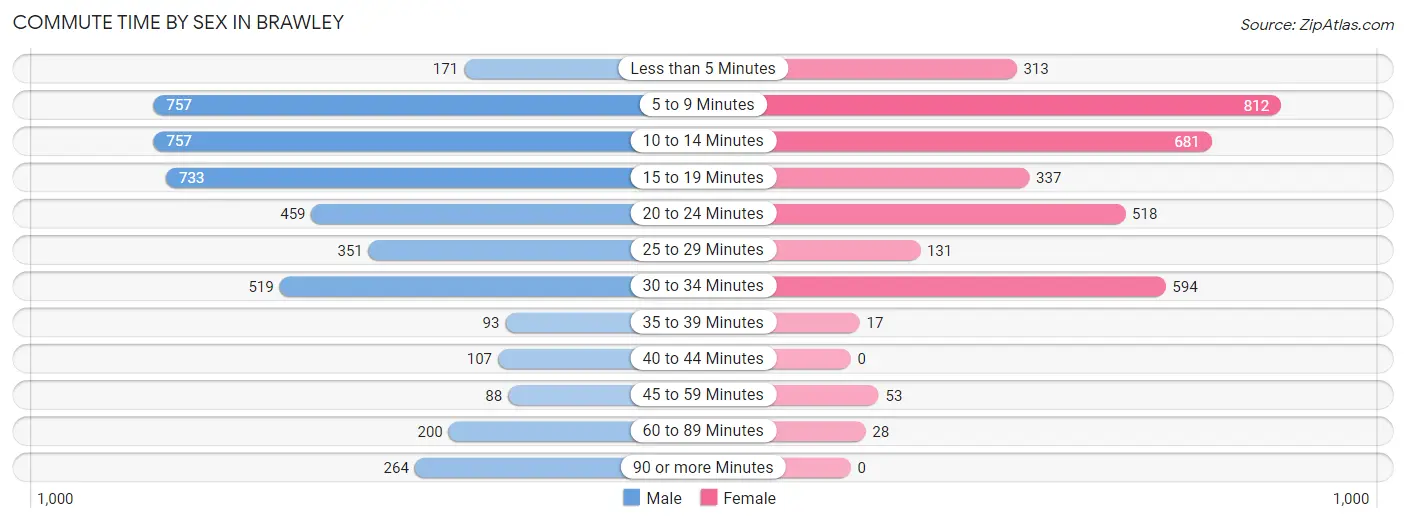
| Commute Time | Male | Female |
| Less than 5 Minutes | 171 (3.8%) | 313 (9.0%) |
| 5 to 9 Minutes | 757 (16.8%) | 812 (23.3%) |
| 10 to 14 Minutes | 757 (16.8%) | 681 (19.6%) |
| 15 to 19 Minutes | 733 (16.3%) | 337 (9.7%) |
| 20 to 24 Minutes | 459 (10.2%) | 518 (14.9%) |
| 25 to 29 Minutes | 351 (7.8%) | 131 (3.8%) |
| 30 to 34 Minutes | 519 (11.5%) | 594 (17.1%) |
| 35 to 39 Minutes | 93 (2.1%) | 17 (0.5%) |
| 40 to 44 Minutes | 107 (2.4%) | 0 (0.0%) |
| 45 to 59 Minutes | 88 (2.0%) | 53 (1.5%) |
| 60 to 89 Minutes | 200 (4.4%) | 28 (0.8%) |
| 90 or more Minutes | 264 (5.9%) | 0 (0.0%) |
Time of Departure to Work by Sex in Brawley
The most frequent times of departure to work in Brawley are 12:00 AM to 4:59 AM (768, 17.1%) for males and 7:30 AM to 7:59 AM (957, 27.5%) for females.
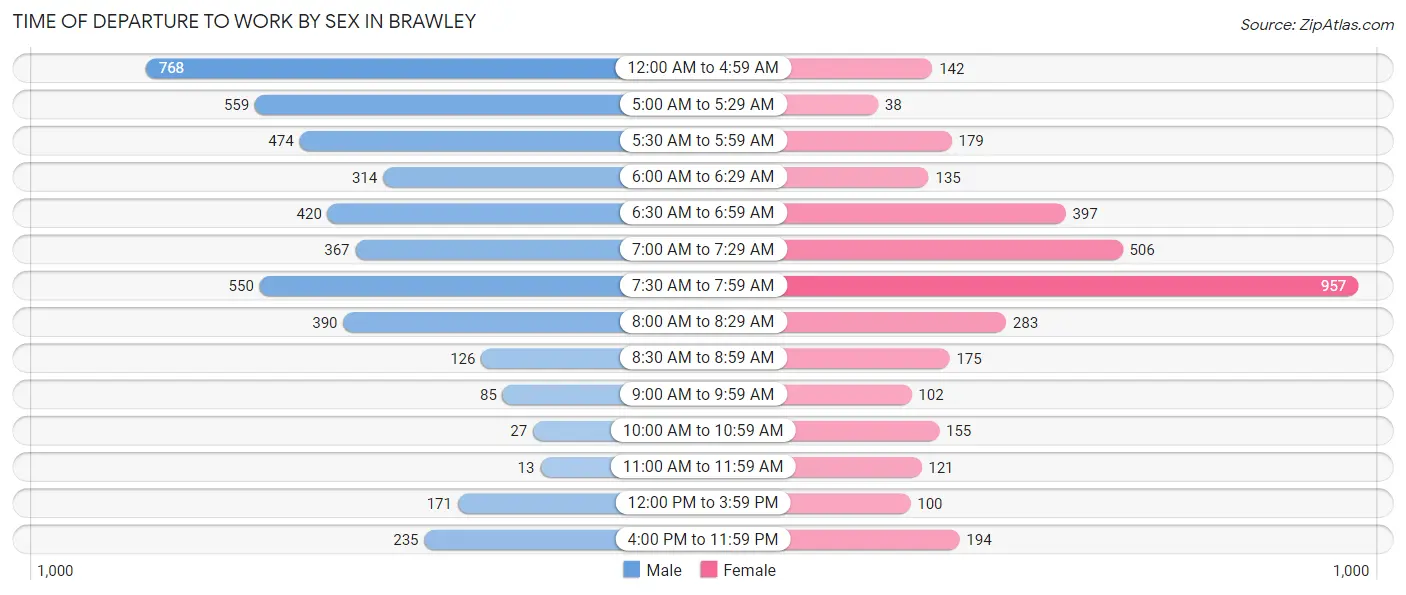
| Time of Departure | Male | Female |
| 12:00 AM to 4:59 AM | 768 (17.1%) | 142 (4.1%) |
| 5:00 AM to 5:29 AM | 559 (12.4%) | 38 (1.1%) |
| 5:30 AM to 5:59 AM | 474 (10.5%) | 179 (5.1%) |
| 6:00 AM to 6:29 AM | 314 (7.0%) | 135 (3.9%) |
| 6:30 AM to 6:59 AM | 420 (9.3%) | 397 (11.4%) |
| 7:00 AM to 7:29 AM | 367 (8.2%) | 506 (14.5%) |
| 7:30 AM to 7:59 AM | 550 (12.2%) | 957 (27.5%) |
| 8:00 AM to 8:29 AM | 390 (8.7%) | 283 (8.1%) |
| 8:30 AM to 8:59 AM | 126 (2.8%) | 175 (5.0%) |
| 9:00 AM to 9:59 AM | 85 (1.9%) | 102 (2.9%) |
| 10:00 AM to 10:59 AM | 27 (0.6%) | 155 (4.4%) |
| 11:00 AM to 11:59 AM | 13 (0.3%) | 121 (3.5%) |
| 12:00 PM to 3:59 PM | 171 (3.8%) | 100 (2.9%) |
| 4:00 PM to 11:59 PM | 235 (5.2%) | 194 (5.6%) |
| Total | 4,499 (100.0%) | 3,484 (100.0%) |
Housing Occupancy in Brawley
Occupancy by Ownership in Brawley
Of the total 7,501 dwellings in Brawley, owner-occupied units account for 3,984 (53.1%), while renter-occupied units make up 3,517 (46.9%).
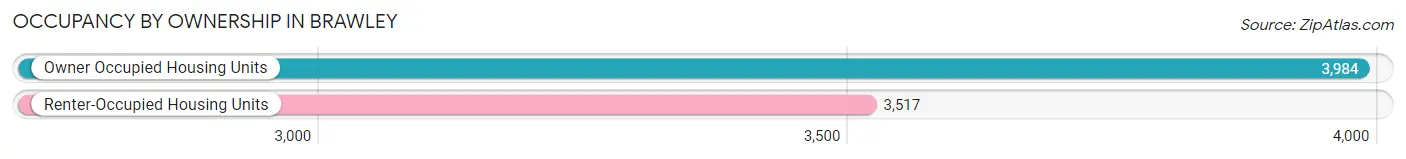
| Occupancy | # Housing Units | % Housing Units |
| Owner Occupied Housing Units | 3,984 | 53.1% |
| Renter-Occupied Housing Units | 3,517 | 46.9% |
| Total Occupied Housing Units | 7,501 | 100.0% |
Occupancy by Household Size in Brawley
| Household Size | # Housing Units | % Housing Units |
| 1-Person Household | 1,694 | 22.6% |
| 2-Person Household | 2,137 | 28.5% |
| 3-Person Household | 1,108 | 14.8% |
| 4+ Person Household | 2,562 | 34.2% |
| Total Housing Units | 7,501 | 100.0% |
Occupancy by Ownership by Household Size in Brawley
| Household Size | Owner-occupied | Renter-occupied |
| 1-Person Household | 801 (47.3%) | 893 (52.7%) |
| 2-Person Household | 1,216 (56.9%) | 921 (43.1%) |
| 3-Person Household | 599 (54.1%) | 509 (45.9%) |
| 4+ Person Household | 1,368 (53.4%) | 1,194 (46.6%) |
| Total Housing Units | 3,984 (53.1%) | 3,517 (46.9%) |
Occupancy by Educational Attainment in Brawley
| Household Size | Owner-occupied | Renter-occupied |
| Less than High School | 633 (38.0%) | 1,034 (62.0%) |
| High School Diploma | 854 (53.2%) | 751 (46.8%) |
| College/Associate Degree | 1,684 (55.3%) | 1,359 (44.7%) |
| Bachelor's Degree or higher | 813 (68.5%) | 373 (31.5%) |
Occupancy by Age of Householder in Brawley
| Age Bracket | # Households | % Households |
| Under 35 Years | 1,485 | 19.8% |
| 35 to 44 Years | 1,480 | 19.7% |
| 45 to 54 Years | 1,507 | 20.1% |
| 55 to 64 Years | 1,296 | 17.3% |
| 65 to 74 Years | 879 | 11.7% |
| 75 to 84 Years | 706 | 9.4% |
| 85 Years and Over | 148 | 2.0% |
| Total | 7,501 | 100.0% |
Housing Finances in Brawley
Median Income by Occupancy in Brawley
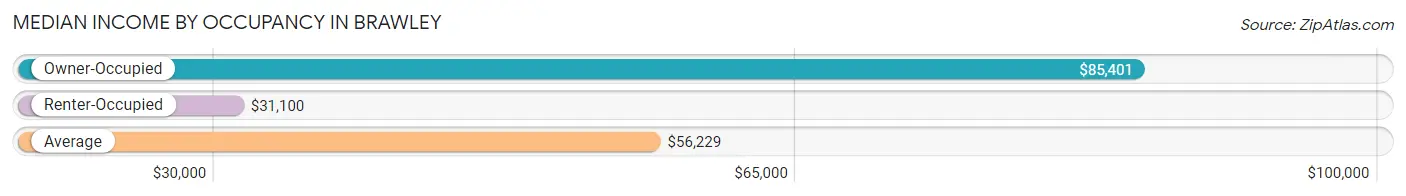
| Occupancy Type | # Households | Median Income |
| Owner-Occupied | 3,984 (53.1%) | $85,401 |
| Renter-Occupied | 3,517 (46.9%) | $31,100 |
| Average | 7,501 (100.0%) | $56,229 |
Occupancy by Householder Income Bracket in Brawley
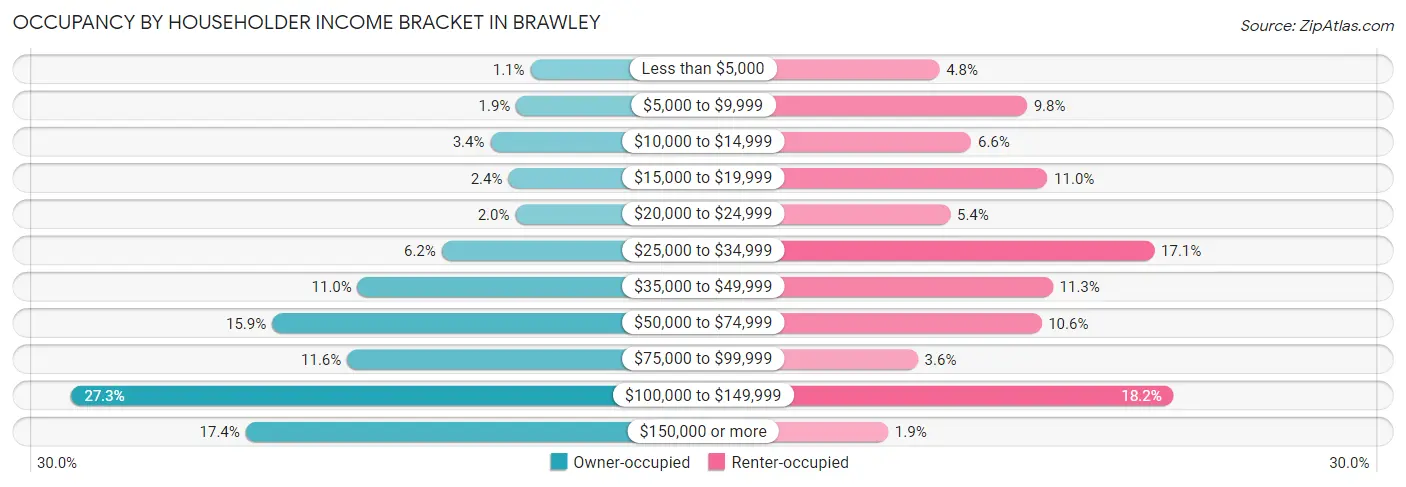
| Income Bracket | Owner-occupied | Renter-occupied |
| Less than $5,000 | 44 (1.1%) | 168 (4.8%) |
| $5,000 to $9,999 | 76 (1.9%) | 344 (9.8%) |
| $10,000 to $14,999 | 135 (3.4%) | 232 (6.6%) |
| $15,000 to $19,999 | 94 (2.4%) | 385 (11.0%) |
| $20,000 to $24,999 | 78 (2.0%) | 190 (5.4%) |
| $25,000 to $34,999 | 246 (6.2%) | 600 (17.1%) |
| $35,000 to $49,999 | 437 (11.0%) | 396 (11.3%) |
| $50,000 to $74,999 | 632 (15.9%) | 373 (10.6%) |
| $75,000 to $99,999 | 461 (11.6%) | 125 (3.5%) |
| $100,000 to $149,999 | 1,089 (27.3%) | 639 (18.2%) |
| $150,000 or more | 692 (17.4%) | 65 (1.8%) |
| Total | 3,984 (100.0%) | 3,517 (100.0%) |
Monthly Housing Cost Tiers in Brawley
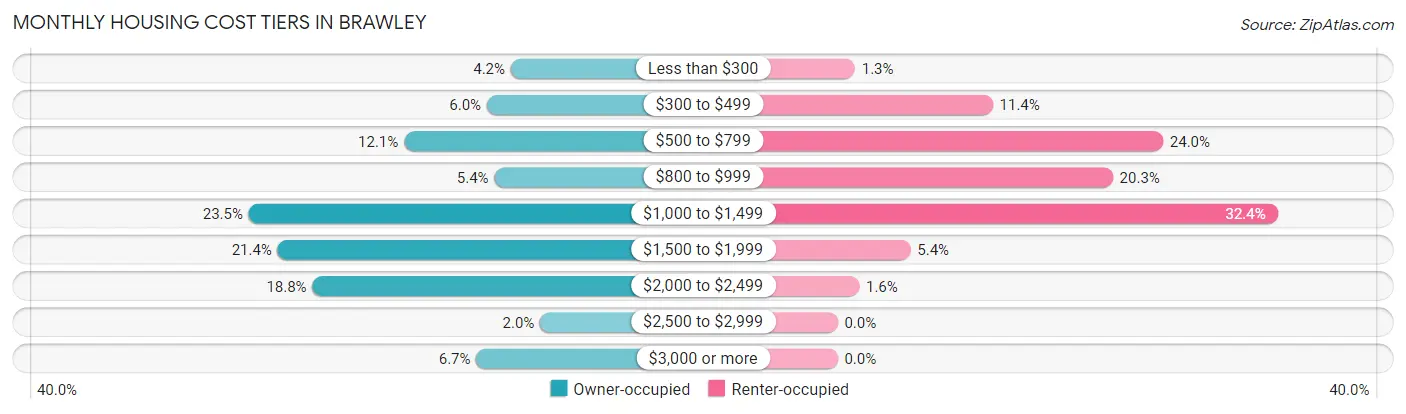
| Monthly Cost | Owner-occupied | Renter-occupied |
| Less than $300 | 167 (4.2%) | 45 (1.3%) |
| $300 to $499 | 237 (5.9%) | 402 (11.4%) |
| $500 to $799 | 480 (12.0%) | 843 (24.0%) |
| $800 to $999 | 215 (5.4%) | 713 (20.3%) |
| $1,000 to $1,499 | 936 (23.5%) | 1,140 (32.4%) |
| $1,500 to $1,999 | 851 (21.4%) | 189 (5.4%) |
| $2,000 to $2,499 | 749 (18.8%) | 56 (1.6%) |
| $2,500 to $2,999 | 81 (2.0%) | 0 (0.0%) |
| $3,000 or more | 268 (6.7%) | 0 (0.0%) |
| Total | 3,984 (100.0%) | 3,517 (100.0%) |
Physical Housing Characteristics in Brawley
Housing Structures in Brawley
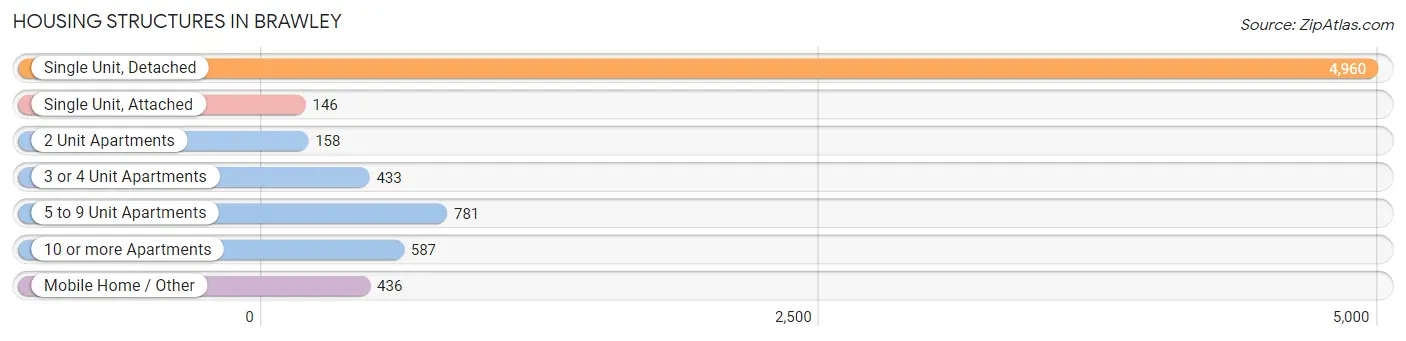
| Structure Type | # Housing Units | % Housing Units |
| Single Unit, Detached | 4,960 | 66.1% |
| Single Unit, Attached | 146 | 1.9% |
| 2 Unit Apartments | 158 | 2.1% |
| 3 or 4 Unit Apartments | 433 | 5.8% |
| 5 to 9 Unit Apartments | 781 | 10.4% |
| 10 or more Apartments | 587 | 7.8% |
| Mobile Home / Other | 436 | 5.8% |
| Total | 7,501 | 100.0% |
Housing Structures by Occupancy in Brawley
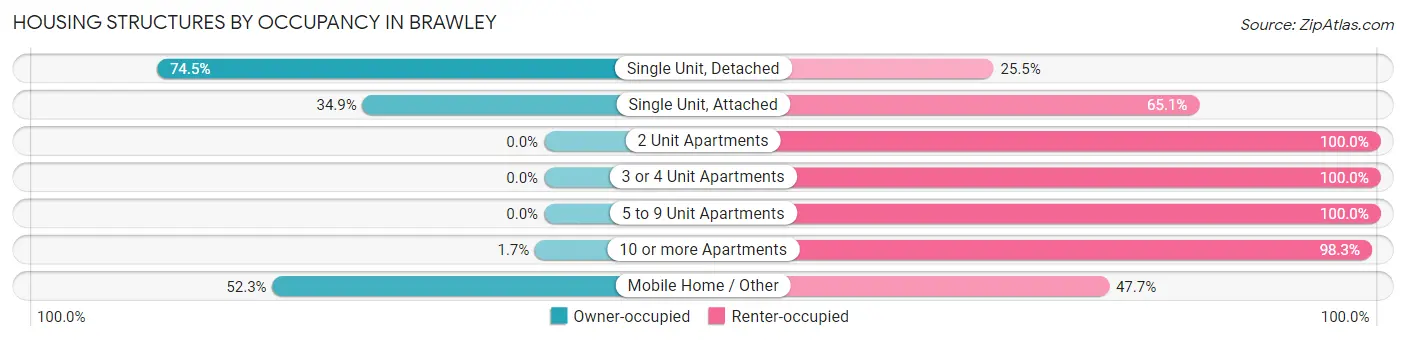
| Structure Type | Owner-occupied | Renter-occupied |
| Single Unit, Detached | 3,695 (74.5%) | 1,265 (25.5%) |
| Single Unit, Attached | 51 (34.9%) | 95 (65.1%) |
| 2 Unit Apartments | 0 (0.0%) | 158 (100.0%) |
| 3 or 4 Unit Apartments | 0 (0.0%) | 433 (100.0%) |
| 5 to 9 Unit Apartments | 0 (0.0%) | 781 (100.0%) |
| 10 or more Apartments | 10 (1.7%) | 577 (98.3%) |
| Mobile Home / Other | 228 (52.3%) | 208 (47.7%) |
| Total | 3,984 (53.1%) | 3,517 (46.9%) |
Housing Structures by Number of Rooms in Brawley
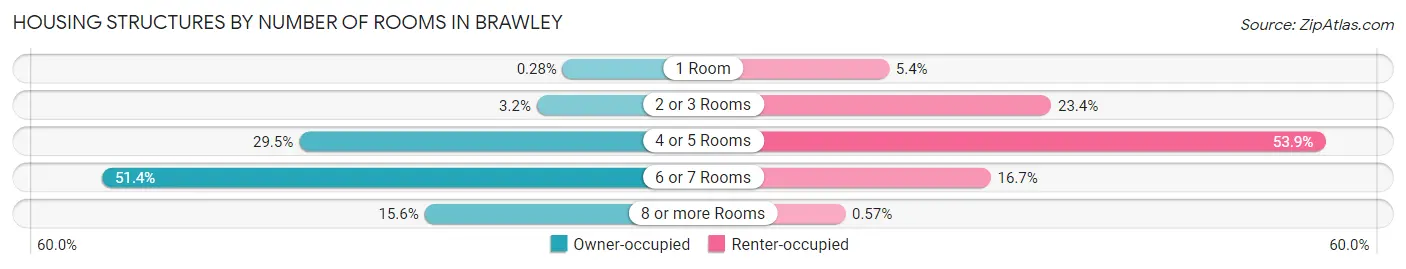
| Number of Rooms | Owner-occupied | Renter-occupied |
| 1 Room | 11 (0.3%) | 191 (5.4%) |
| 2 or 3 Rooms | 126 (3.2%) | 824 (23.4%) |
| 4 or 5 Rooms | 1,177 (29.5%) | 1,894 (53.8%) |
| 6 or 7 Rooms | 2,048 (51.4%) | 588 (16.7%) |
| 8 or more Rooms | 622 (15.6%) | 20 (0.6%) |
| Total | 3,984 (100.0%) | 3,517 (100.0%) |
Housing Structure by Heating Type in Brawley
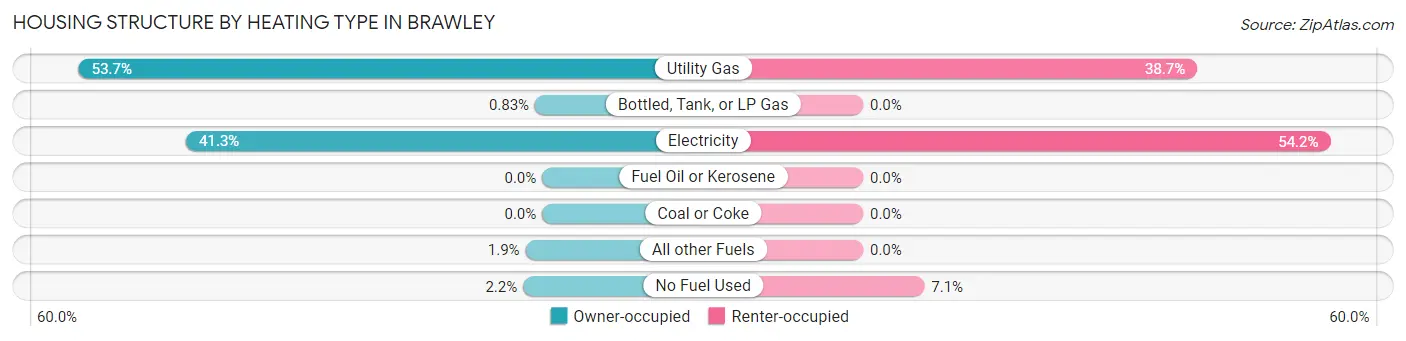
| Heating Type | Owner-occupied | Renter-occupied |
| Utility Gas | 2,141 (53.7%) | 1,362 (38.7%) |
| Bottled, Tank, or LP Gas | 33 (0.8%) | 0 (0.0%) |
| Electricity | 1,645 (41.3%) | 1,905 (54.2%) |
| Fuel Oil or Kerosene | 0 (0.0%) | 0 (0.0%) |
| Coal or Coke | 0 (0.0%) | 0 (0.0%) |
| All other Fuels | 77 (1.9%) | 0 (0.0%) |
| No Fuel Used | 88 (2.2%) | 250 (7.1%) |
| Total | 3,984 (100.0%) | 3,517 (100.0%) |
Household Vehicle Usage in Brawley
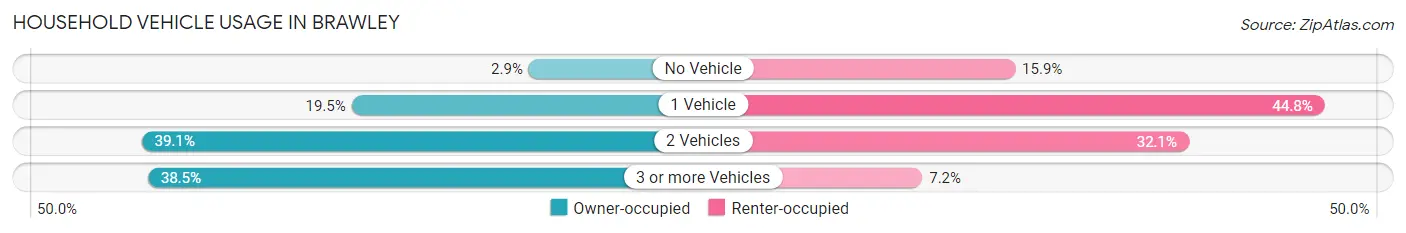
| Vehicles per Household | Owner-occupied | Renter-occupied |
| No Vehicle | 117 (2.9%) | 559 (15.9%) |
| 1 Vehicle | 776 (19.5%) | 1,575 (44.8%) |
| 2 Vehicles | 1,557 (39.1%) | 1,129 (32.1%) |
| 3 or more Vehicles | 1,534 (38.5%) | 254 (7.2%) |
| Total | 3,984 (100.0%) | 3,517 (100.0%) |
Real Estate & Mortgages in Brawley
Real Estate and Mortgage Overview in Brawley
| Characteristic | Without Mortgage | With Mortgage |
| Housing Units | 1,032 | 2,952 |
| Median Property Value | $216,300 | $269,700 |
| Median Household Income | $60,750 | $546 |
| Monthly Housing Costs | $590 | $268 |
| Real Estate Taxes | $1,154 | $34 |
Property Value by Mortgage Status in Brawley
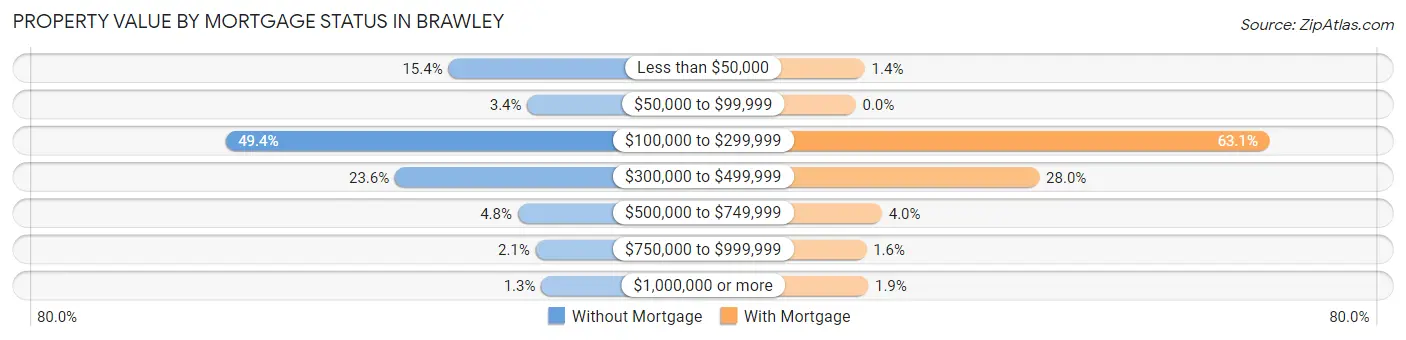
| Property Value | Without Mortgage | With Mortgage |
| Less than $50,000 | 159 (15.4%) | 41 (1.4%) |
| $50,000 to $99,999 | 35 (3.4%) | 0 (0.0%) |
| $100,000 to $299,999 | 510 (49.4%) | 1,863 (63.1%) |
| $300,000 to $499,999 | 243 (23.5%) | 826 (28.0%) |
| $500,000 to $749,999 | 50 (4.8%) | 118 (4.0%) |
| $750,000 to $999,999 | 22 (2.1%) | 48 (1.6%) |
| $1,000,000 or more | 13 (1.3%) | 56 (1.9%) |
| Total | 1,032 (100.0%) | 2,952 (100.0%) |
Household Income by Mortgage Status in Brawley
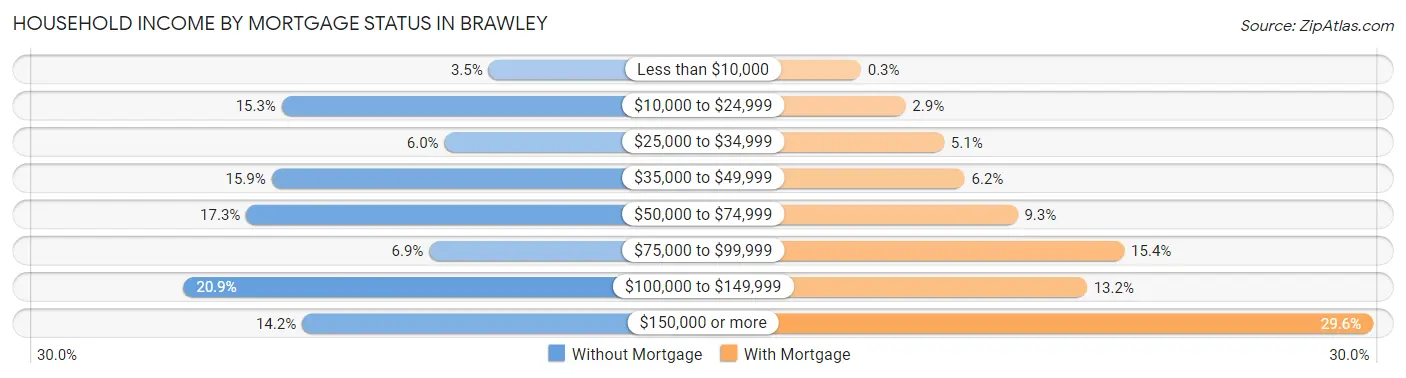
| Household Income | Without Mortgage | With Mortgage |
| Less than $10,000 | 36 (3.5%) | 9 (0.3%) |
| $10,000 to $24,999 | 158 (15.3%) | 84 (2.9%) |
| $25,000 to $34,999 | 62 (6.0%) | 149 (5.1%) |
| $35,000 to $49,999 | 164 (15.9%) | 184 (6.2%) |
| $50,000 to $74,999 | 179 (17.3%) | 273 (9.2%) |
| $75,000 to $99,999 | 71 (6.9%) | 453 (15.3%) |
| $100,000 to $149,999 | 216 (20.9%) | 390 (13.2%) |
| $150,000 or more | 146 (14.1%) | 873 (29.6%) |
| Total | 1,032 (100.0%) | 2,952 (100.0%) |
Property Value to Household Income Ratio in Brawley
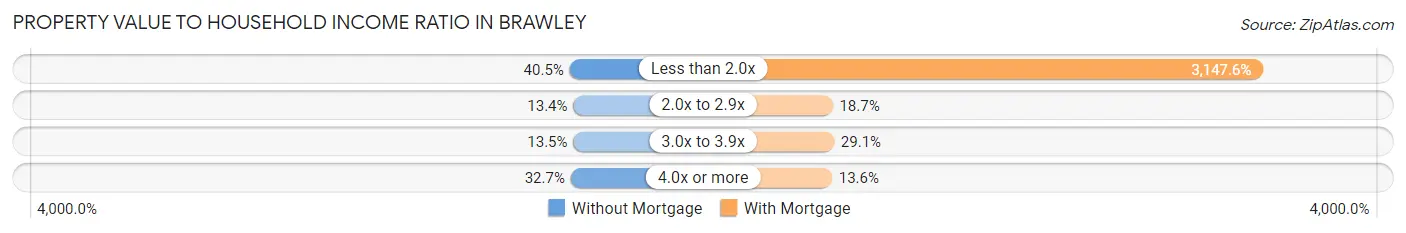
| Value-to-Income Ratio | Without Mortgage | With Mortgage |
| Less than 2.0x | 418 (40.5%) | 92,917 (3,147.6%) |
| 2.0x to 2.9x | 138 (13.4%) | 552 (18.7%) |
| 3.0x to 3.9x | 139 (13.5%) | 858 (29.1%) |
| 4.0x or more | 337 (32.7%) | 401 (13.6%) |
| Total | 1,032 (100.0%) | 2,952 (100.0%) |
Real Estate Taxes by Mortgage Status in Brawley
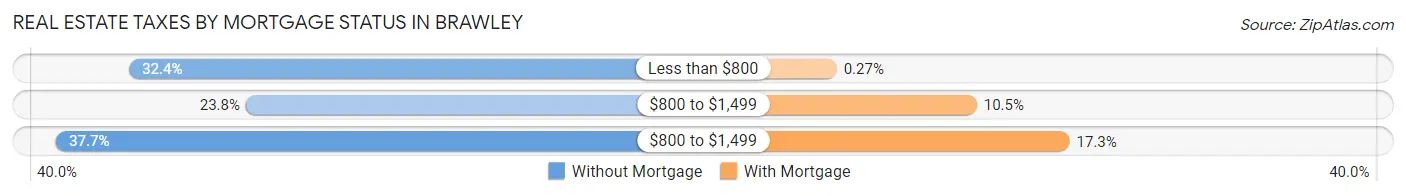
| Property Taxes | Without Mortgage | With Mortgage |
| Less than $800 | 334 (32.4%) | 8 (0.3%) |
| $800 to $1,499 | 246 (23.8%) | 310 (10.5%) |
| $800 to $1,499 | 389 (37.7%) | 510 (17.3%) |
| Total | 1,032 (100.0%) | 2,952 (100.0%) |
Health & Disability in Brawley
Health Insurance Coverage by Age in Brawley
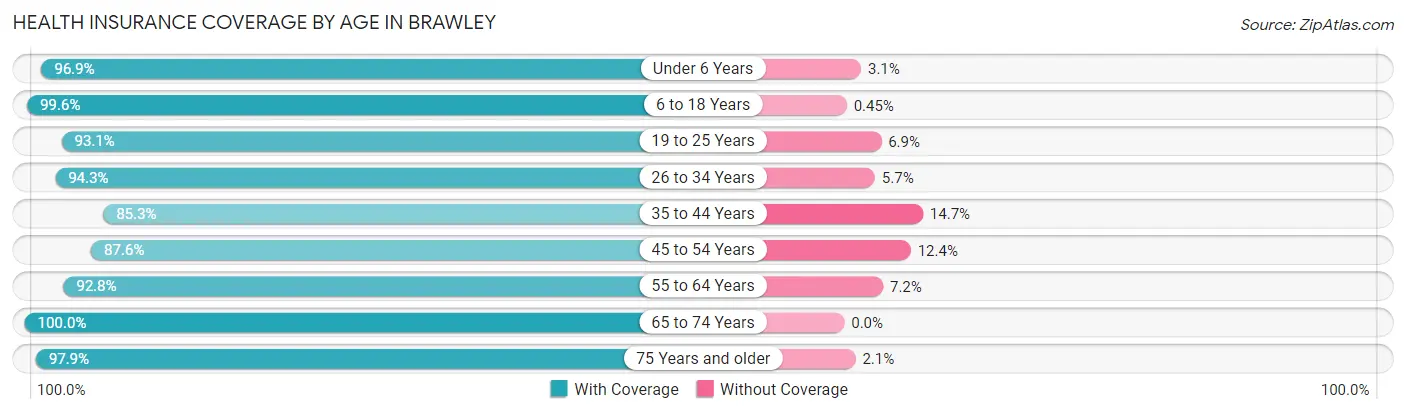
| Age Bracket | With Coverage | Without Coverage |
| Under 6 Years | 2,732 (96.9%) | 88 (3.1%) |
| 6 to 18 Years | 5,702 (99.6%) | 26 (0.4%) |
| 19 to 25 Years | 2,396 (93.1%) | 177 (6.9%) |
| 26 to 34 Years | 3,665 (94.3%) | 222 (5.7%) |
| 35 to 44 Years | 2,526 (85.3%) | 434 (14.7%) |
| 45 to 54 Years | 2,659 (87.6%) | 376 (12.4%) |
| 55 to 64 Years | 2,198 (92.8%) | 171 (7.2%) |
| 65 to 74 Years | 1,480 (100.0%) | 0 (0.0%) |
| 75 Years and older | 1,500 (97.9%) | 32 (2.1%) |
| Total | 24,858 (94.2%) | 1,526 (5.8%) |
Health Insurance Coverage by Citizenship Status in Brawley
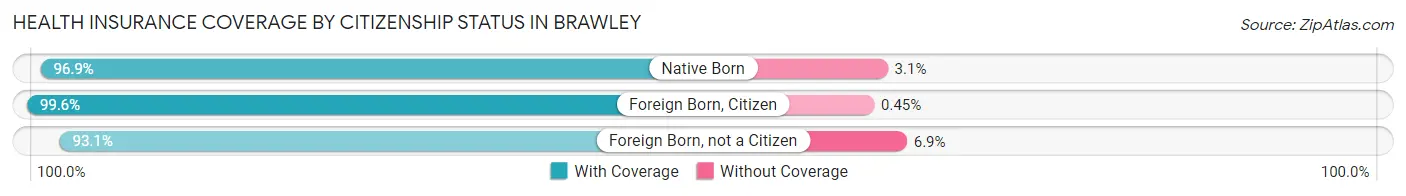
| Citizenship Status | With Coverage | Without Coverage |
| Native Born | 2,732 (96.9%) | 88 (3.1%) |
| Foreign Born, Citizen | 5,702 (99.6%) | 26 (0.4%) |
| Foreign Born, not a Citizen | 2,396 (93.1%) | 177 (6.9%) |
Health Insurance Coverage by Household Income in Brawley
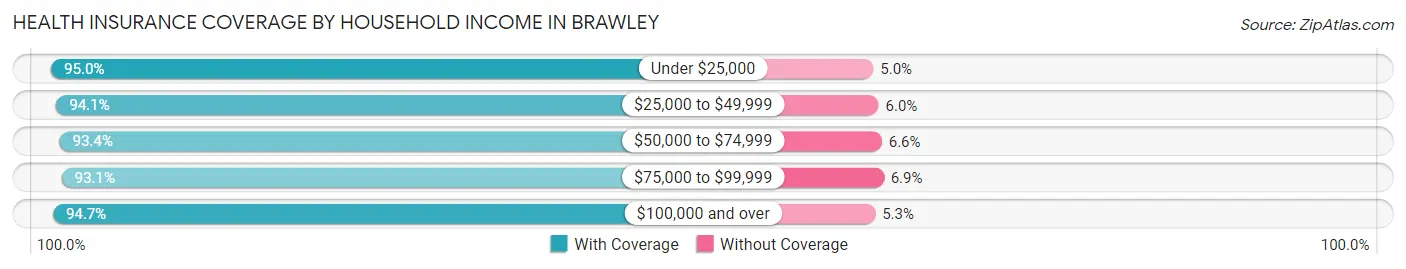
| Household Income | With Coverage | Without Coverage |
| Under $25,000 | 4,863 (95.0%) | 255 (5.0%) |
| $25,000 to $49,999 | 5,390 (94.1%) | 341 (5.9%) |
| $50,000 to $74,999 | 2,875 (93.4%) | 202 (6.6%) |
| $75,000 to $99,999 | 2,489 (93.1%) | 185 (6.9%) |
| $100,000 and over | 9,214 (94.7%) | 518 (5.3%) |
Public vs Private Health Insurance Coverage by Age in Brawley
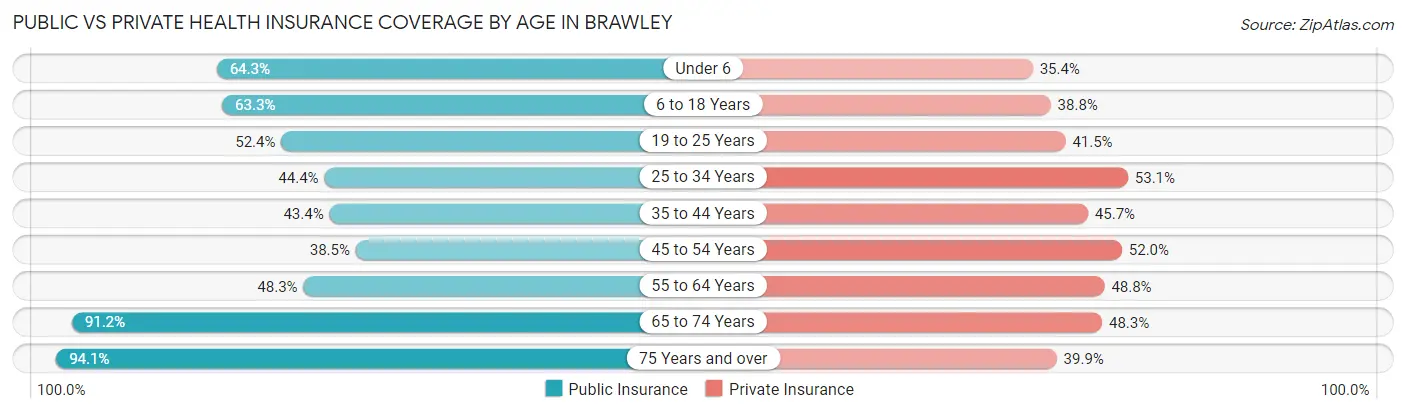
| Age Bracket | Public Insurance | Private Insurance |
| Under 6 | 1,814 (64.3%) | 999 (35.4%) |
| 6 to 18 Years | 3,627 (63.3%) | 2,221 (38.8%) |
| 19 to 25 Years | 1,347 (52.3%) | 1,068 (41.5%) |
| 25 to 34 Years | 1,724 (44.4%) | 2,064 (53.1%) |
| 35 to 44 Years | 1,285 (43.4%) | 1,352 (45.7%) |
| 45 to 54 Years | 1,169 (38.5%) | 1,578 (52.0%) |
| 55 to 64 Years | 1,143 (48.2%) | 1,155 (48.7%) |
| 65 to 74 Years | 1,350 (91.2%) | 715 (48.3%) |
| 75 Years and over | 1,442 (94.1%) | 611 (39.9%) |
| Total | 14,901 (56.5%) | 11,763 (44.6%) |
Disability Status by Sex by Age in Brawley
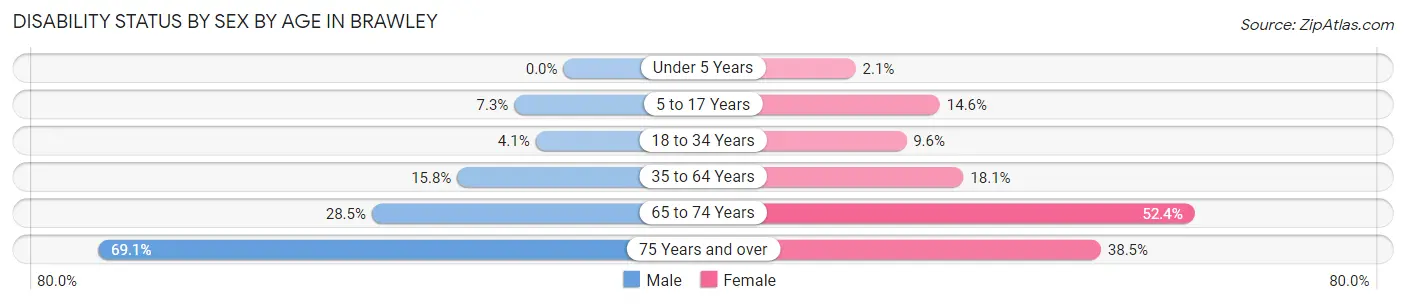
| Age Bracket | Male | Female |
| Under 5 Years | 0 (0.0%) | 25 (2.1%) |
| 5 to 17 Years | 205 (7.3%) | 404 (14.6%) |
| 18 to 34 Years | 155 (4.1%) | 309 (9.6%) |
| 35 to 64 Years | 648 (15.8%) | 768 (18.1%) |
| 65 to 74 Years | 194 (28.4%) | 418 (52.4%) |
| 75 Years and over | 534 (69.1%) | 292 (38.5%) |
Disability Class by Sex by Age in Brawley
Disability Class: Hearing Difficulty
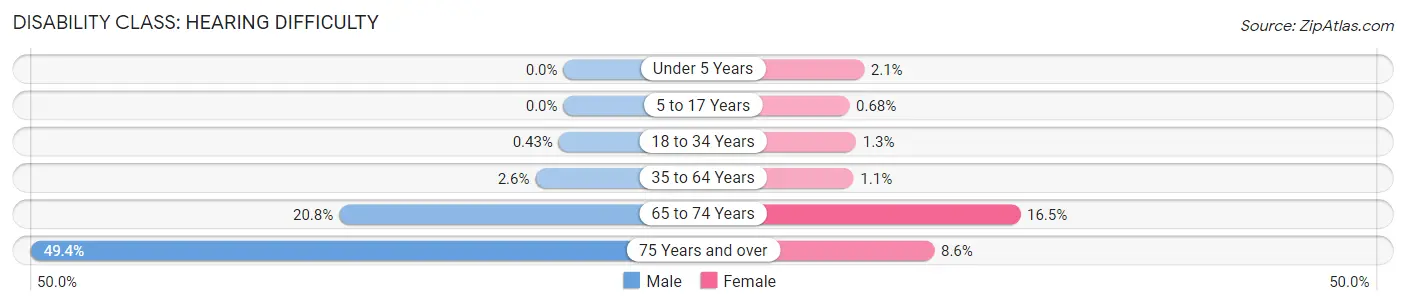
| Age Bracket | Male | Female |
| Under 5 Years | 0 (0.0%) | 25 (2.1%) |
| 5 to 17 Years | 0 (0.0%) | 19 (0.7%) |
| 18 to 34 Years | 16 (0.4%) | 42 (1.3%) |
| 35 to 64 Years | 107 (2.6%) | 46 (1.1%) |
| 65 to 74 Years | 142 (20.8%) | 132 (16.5%) |
| 75 Years and over | 382 (49.4%) | 65 (8.6%) |
Disability Class: Vision Difficulty
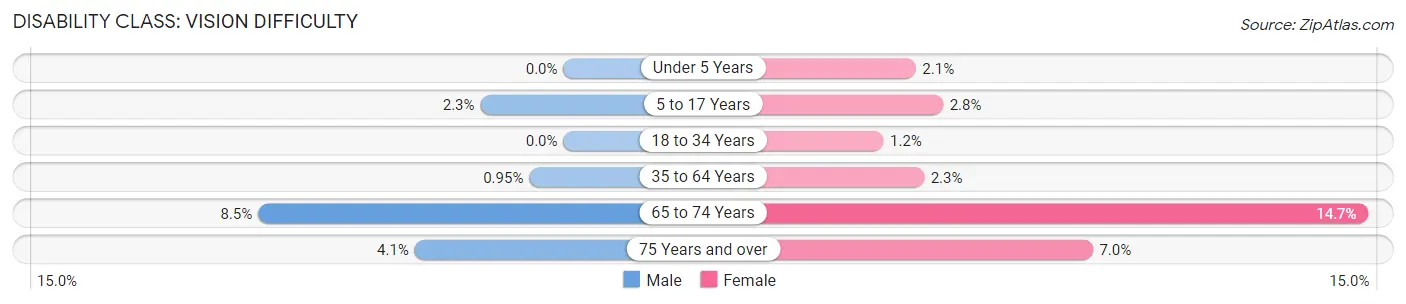
| Age Bracket | Male | Female |
| Under 5 Years | 0 (0.0%) | 25 (2.1%) |
| 5 to 17 Years | 65 (2.3%) | 78 (2.8%) |
| 18 to 34 Years | 0 (0.0%) | 37 (1.1%) |
| 35 to 64 Years | 39 (0.9%) | 97 (2.3%) |
| 65 to 74 Years | 58 (8.5%) | 117 (14.7%) |
| 75 Years and over | 32 (4.1%) | 53 (7.0%) |
Disability Class: Cognitive Difficulty
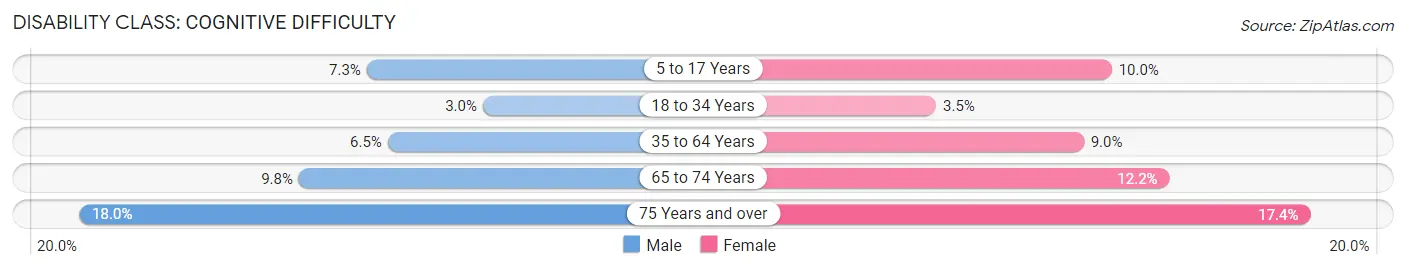
| Age Bracket | Male | Female |
| 5 to 17 Years | 205 (7.3%) | 278 (10.0%) |
| 18 to 34 Years | 112 (3.0%) | 113 (3.5%) |
| 35 to 64 Years | 268 (6.5%) | 382 (9.0%) |
| 65 to 74 Years | 67 (9.8%) | 97 (12.2%) |
| 75 Years and over | 139 (18.0%) | 132 (17.4%) |
Disability Class: Ambulatory Difficulty
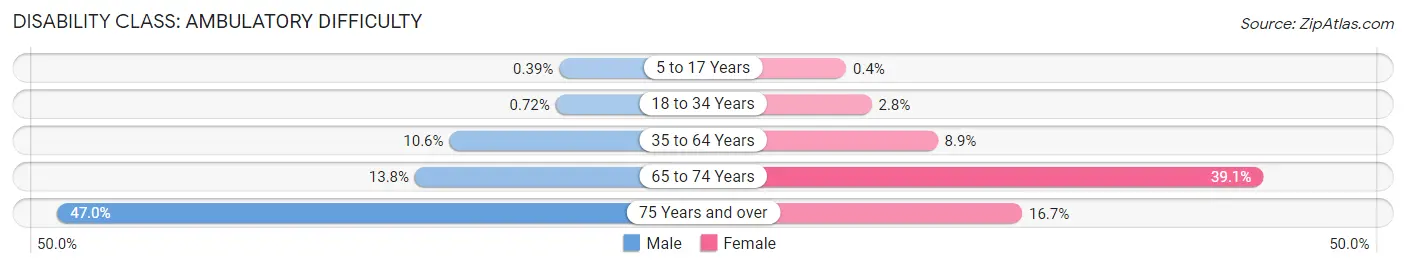
| Age Bracket | Male | Female |
| 5 to 17 Years | 11 (0.4%) | 11 (0.4%) |
| 18 to 34 Years | 27 (0.7%) | 89 (2.8%) |
| 35 to 64 Years | 435 (10.6%) | 378 (8.9%) |
| 65 to 74 Years | 94 (13.8%) | 312 (39.1%) |
| 75 Years and over | 363 (47.0%) | 127 (16.7%) |
Disability Class: Self-Care Difficulty
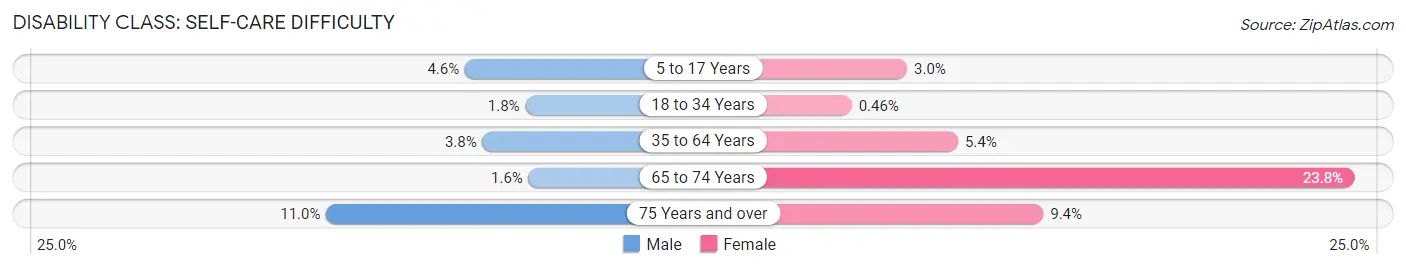
| Age Bracket | Male | Female |
| 5 to 17 Years | 128 (4.6%) | 84 (3.0%) |
| 18 to 34 Years | 66 (1.8%) | 15 (0.5%) |
| 35 to 64 Years | 154 (3.7%) | 229 (5.4%) |
| 65 to 74 Years | 11 (1.6%) | 190 (23.8%) |
| 75 Years and over | 85 (11.0%) | 71 (9.3%) |
Technology Access in Brawley
Computing Device Access in Brawley
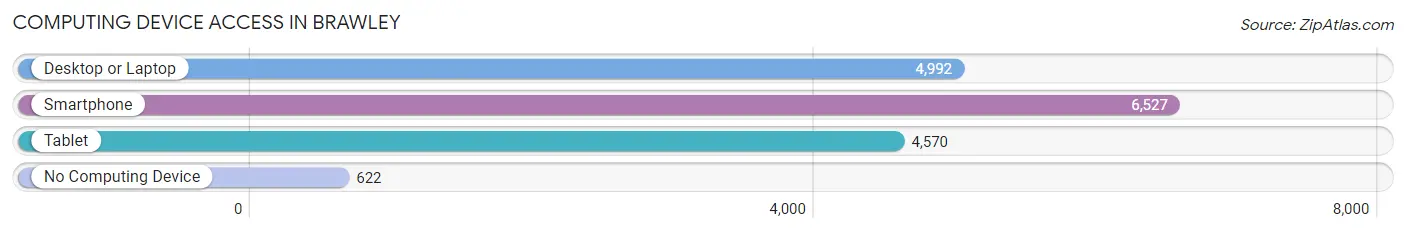
| Device Type | # Households | % Households |
| Desktop or Laptop | 4,992 | 66.5% |
| Smartphone | 6,527 | 87.0% |
| Tablet | 4,570 | 60.9% |
| No Computing Device | 622 | 8.3% |
| Total | 7,501 | 100.0% |
Internet Access in Brawley
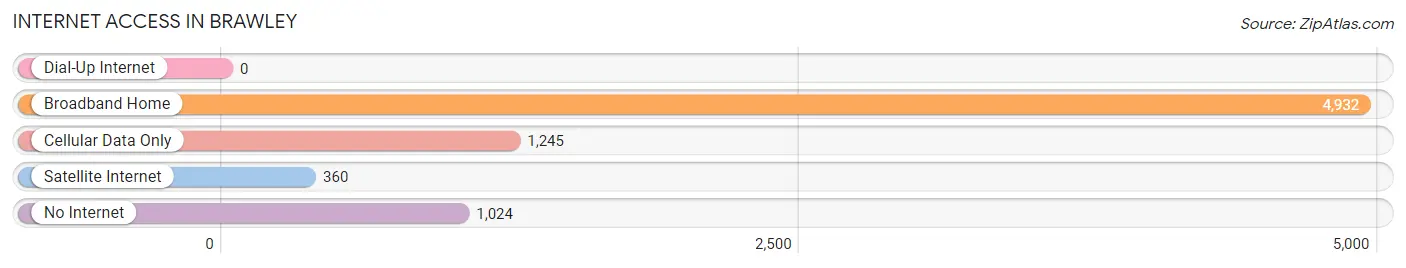
| Internet Type | # Households | % Households |
| Dial-Up Internet | 0 | 0.0% |
| Broadband Home | 4,932 | 65.7% |
| Cellular Data Only | 1,245 | 16.6% |
| Satellite Internet | 360 | 4.8% |
| No Internet | 1,024 | 13.7% |
| Total | 7,501 | 100.0% |
Brawley Summary
Brawley is a city located in Imperial County, California, United States. It is situated in the Imperial Valley, a region known for its agricultural production. The city is located on the banks of the New River, which flows from Mexico into the United States. The population of Brawley was estimated to be 24,953 in 2019.
History
Brawley was founded in 1906 by W.F. Holt and C.A. Barker, who named the city after their friend, Dr. John Brawley. The city was incorporated in 1908 and has since grown to become the largest city in Imperial County.
The city was originally a farming community, but it has since become a hub for industry and commerce. The city is home to a number of large companies, including the Imperial Valley Mall, which is the largest shopping center in the county.
Geography
Brawley is located in the Imperial Valley, which is a desert region in southeastern California. The city is situated on the banks of the New River, which flows from Mexico into the United States. The city is located about 120 miles east of San Diego and about 30 miles west of Yuma, Arizona.
The city has a total area of 8.3 square miles, of which 8.2 square miles is land and 0.1 square miles is water. The city is located at an elevation of -53 feet below sea level.
Economy
Brawley is a major agricultural center in the Imperial Valley. The city is home to a number of large farms, including the Imperial Valley Farm, which is the largest farm in the county. The city is also home to a number of food processing plants, including the Brawley Packing Company, which processes and packages fruits and vegetables for distribution throughout the United States.
The city is also home to a number of manufacturing companies, including the Brawley Manufacturing Company, which produces a variety of products, including furniture, clothing, and electronics.
Demographics
As of the 2019 census, the population of Brawley was estimated to be 24,953. The racial makeup of the city was 63.3% White, 0.9% African American, 0.7% Native American, 0.7% Asian, 0.1% Pacific Islander, 31.2% from other races, and 3.1% from two or more races. Hispanic or Latino of any race were 68.2% of the population.
The median household income in Brawley was $37,945 in 2019. The per capita income for the city was $17,845. The poverty rate in Brawley was 28.2%.
Conclusion
Brawley is a city located in Imperial County, California, United States. It is situated in the Imperial Valley, a region known for its agricultural production. The city is located on the banks of the New River, which flows from Mexico into the United States. The population of Brawley was estimated to be 24,953 in 2019. The city is a major agricultural center in the Imperial Valley and is home to a number of large farms and food processing plants. The city is also home to a number of manufacturing companies. The racial makeup of the city was 63.3% White, 0.9% African American, 0.7% Native American, 0.7% Asian, 0.1% Pacific Islander, 31.2% from other races, and 3.1% from two or more races. Hispanic or Latino of any race were 68.2% of the population. The median household income in Brawley was $37,945 in 2019. The per capita income for the city was $17,845. The poverty rate in Brawley was 28.2%.
Common Questions
What is Per Capita Income in Brawley?
Per Capita income in Brawley is $25,017.
What is the Median Family Income in Brawley?
Median Family Income in Brawley is $62,160.
What is the Median Household income in Brawley?
Median Household Income in Brawley is $56,229.
What is Income or Wage Gap in Brawley?
Income or Wage Gap in Brawley is 31.6%.
Women in Brawley earn 68.4 cents for every dollar earned by a man.
What is Family Income Deficit in Brawley?
Family Income Deficit in Brawley is $12,517.
Families that are below poverty line in Brawley earn $12,517 less on average than the poverty threshold level.
What is Inequality or Gini Index in Brawley?
Inequality or Gini Index in Brawley is 0.48.
What is the Total Population of Brawley?
Total Population of Brawley is 26,509.
What is the Total Male Population of Brawley?
Total Male Population of Brawley is 13,424.
What is the Total Female Population of Brawley?
Total Female Population of Brawley is 13,085.
What is the Ratio of Males per 100 Females in Brawley?
There are 102.59 Males per 100 Females in Brawley.
What is the Ratio of Females per 100 Males in Brawley?
There are 97.47 Females per 100 Males in Brawley.
What is the Median Population Age in Brawley?
Median Population Age in Brawley is 30.5 Years.
What is the Average Family Size in Brawley
Average Family Size in Brawley is 4.2 People.
What is the Average Household Size in Brawley
Average Household Size in Brawley is 3.5 People.
How Large is the Labor Force in Brawley?
There are 10,936 People in the Labor Forcein in Brawley.
What is the Percentage of People in the Labor Force in Brawley?
56.0% of People are in the Labor Force in Brawley.
What is the Unemployment Rate in Brawley?
Unemployment Rate in Brawley is 18.2%.