Borrego Springs, CA Map & Demographics
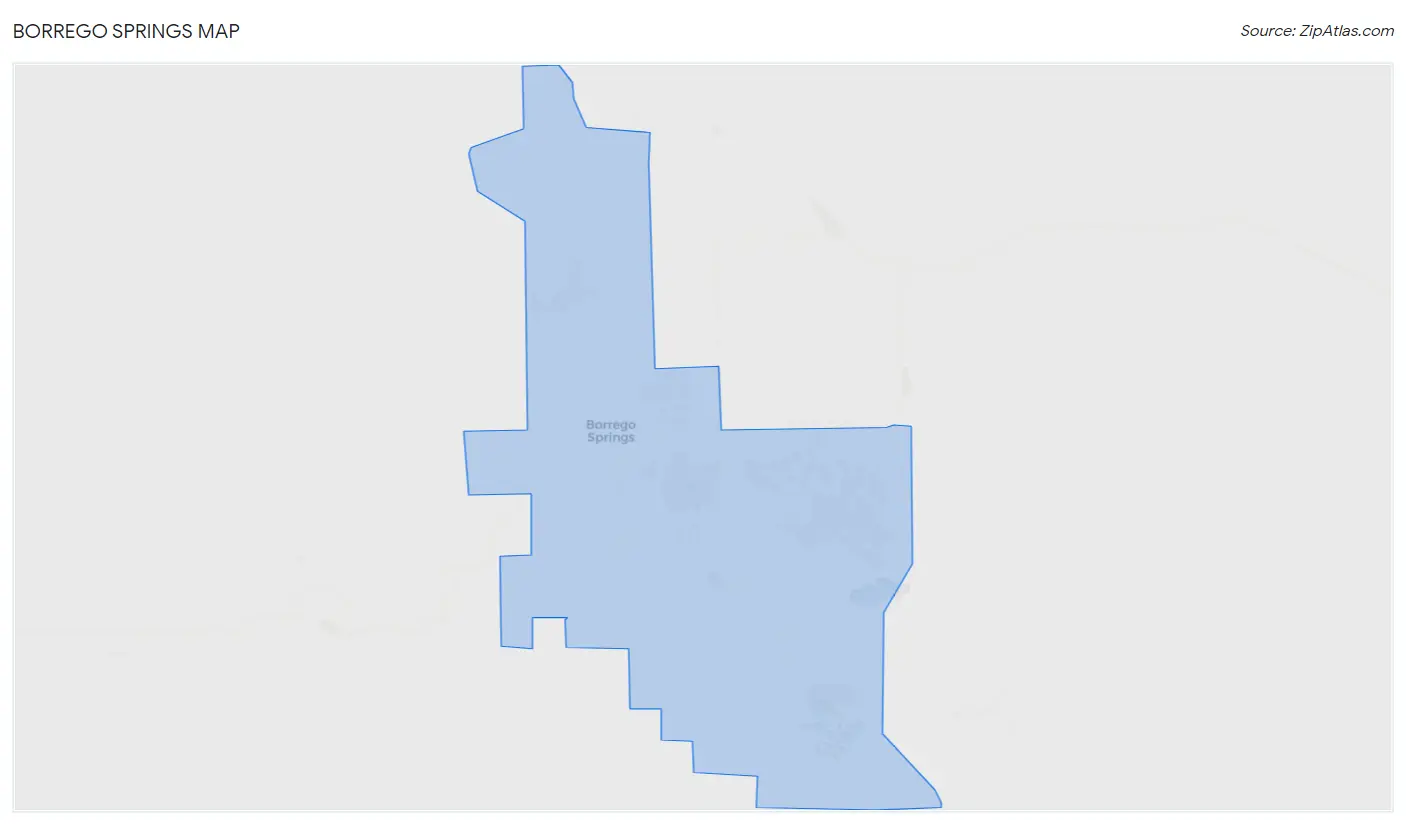
Borrego Springs Map
Borrego Springs Overview
$50,699
PER CAPITA INCOME
$114,212
AVG FAMILY INCOME
$101,458
AVG HOUSEHOLD INCOME
35.0%
WAGE / INCOME GAP [ % ]
65.0¢/ $1
WAGE / INCOME GAP [ $ ]
0.38
INEQUALITY / GINI INDEX
2,946
TOTAL POPULATION
1,263
MALE POPULATION
1,683
FEMALE POPULATION
75.04
MALES / 100 FEMALES
133.25
FEMALES / 100 MALES
58.8
MEDIAN AGE
2.5
AVG FAMILY SIZE
2.1
AVG HOUSEHOLD SIZE
1,258
LABOR FORCE [ PEOPLE ]
48.0%
PERCENT IN LABOR FORCE
5.3%
UNEMPLOYMENT RATE
Borrego Springs Zip Codes
Borrego Springs Area Codes
Income in Borrego Springs
Income Overview in Borrego Springs
Per Capita Income in Borrego Springs is $50,699, while median incomes of families and households are $114,212 and $101,458 respectively.
| Characteristic | Number | Measure |
| Per Capita Income | 2,946 | $50,699 |
| Median Family Income | 930 | $114,212 |
| Mean Family Income | 930 | $127,293 |
| Median Household Income | 1,397 | $101,458 |
| Mean Household Income | 1,397 | $106,874 |
| Income Deficit | 930 | $0 |
| Wage / Income Gap (%) | 2,946 | 34.98% |
| Wage / Income Gap ($) | 2,946 | 65.02¢ per $1 |
| Gini / Inequality Index | 2,946 | 0.38 |
Earnings by Sex in Borrego Springs
Average Earnings in Borrego Springs are $41,633, $32,917 for men and $50,625 for women, a difference of 35.0%.
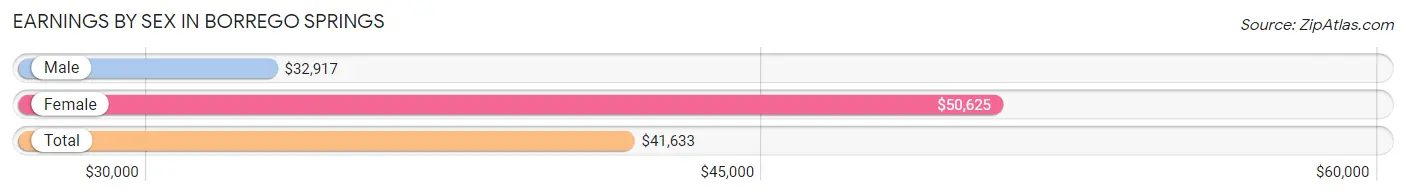
| Sex | Number | Average Earnings |
| Male | 547 (44.4%) | $32,917 |
| Female | 685 (55.6%) | $50,625 |
| Total | 1,232 (100.0%) | $41,633 |
Earnings by Sex by Income Bracket in Borrego Springs
The most common earnings brackets in Borrego Springs are $25,000 to $29,999 for men (180 | 32.9%) and $100,000+ for women (180 | 26.3%).
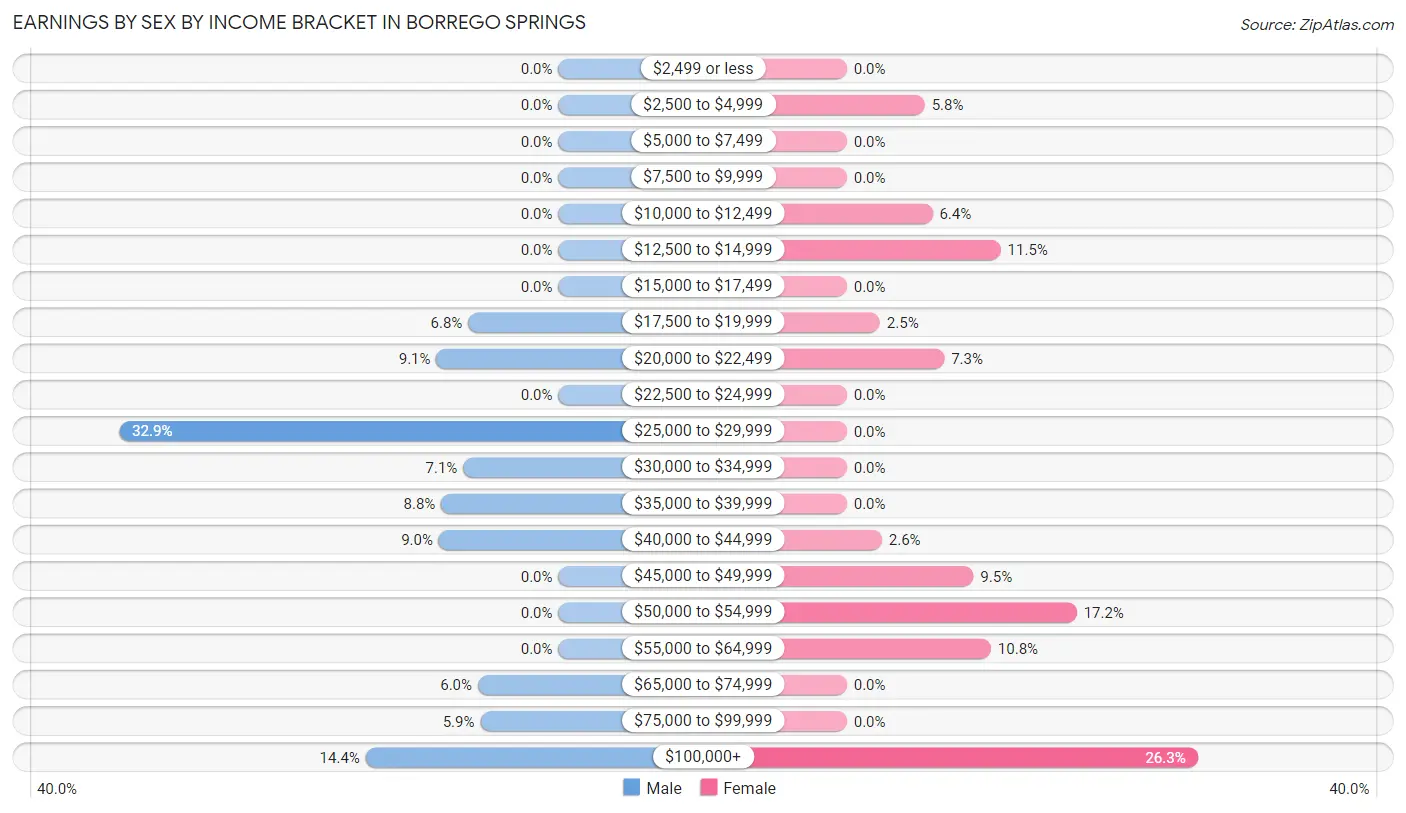
| Income | Male | Female |
| $2,499 or less | 0 (0.0%) | 0 (0.0%) |
| $2,500 to $4,999 | 0 (0.0%) | 40 (5.8%) |
| $5,000 to $7,499 | 0 (0.0%) | 0 (0.0%) |
| $7,500 to $9,999 | 0 (0.0%) | 0 (0.0%) |
| $10,000 to $12,499 | 0 (0.0%) | 44 (6.4%) |
| $12,500 to $14,999 | 0 (0.0%) | 79 (11.5%) |
| $15,000 to $17,499 | 0 (0.0%) | 0 (0.0%) |
| $17,500 to $19,999 | 37 (6.8%) | 17 (2.5%) |
| $20,000 to $22,499 | 50 (9.1%) | 50 (7.3%) |
| $22,500 to $24,999 | 0 (0.0%) | 0 (0.0%) |
| $25,000 to $29,999 | 180 (32.9%) | 0 (0.0%) |
| $30,000 to $34,999 | 39 (7.1%) | 0 (0.0%) |
| $35,000 to $39,999 | 48 (8.8%) | 0 (0.0%) |
| $40,000 to $44,999 | 49 (9.0%) | 18 (2.6%) |
| $45,000 to $49,999 | 0 (0.0%) | 65 (9.5%) |
| $50,000 to $54,999 | 0 (0.0%) | 118 (17.2%) |
| $55,000 to $64,999 | 0 (0.0%) | 74 (10.8%) |
| $65,000 to $74,999 | 33 (6.0%) | 0 (0.0%) |
| $75,000 to $99,999 | 32 (5.9%) | 0 (0.0%) |
| $100,000+ | 79 (14.4%) | 180 (26.3%) |
| Total | 547 (100.0%) | 685 (100.0%) |
Earnings by Sex by Educational Attainment in Borrego Springs
Average earnings in Borrego Springs are $32,917 for men and $50,805 for women, a difference of 35.2%. Men with an educational attainment of less than high school enjoy the highest average annual earnings of $29,778, while those with high school diploma education earn the least with $27,461. Women with an educational attainment of high school diploma earn the most with the average annual earnings of $57,868, while those with high school diploma education have the smallest earnings of $57,868.
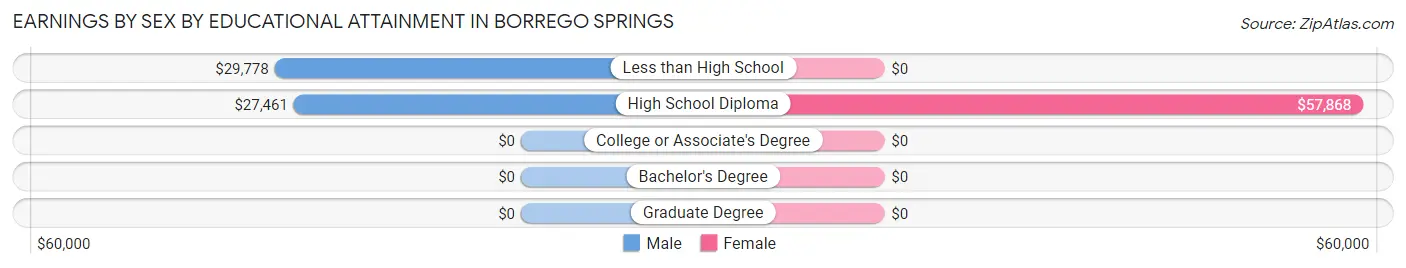
| Educational Attainment | Male Income | Female Income |
| Less than High School | $29,778 | $0 |
| High School Diploma | $27,461 | $57,868 |
| College or Associate's Degree | - | - |
| Bachelor's Degree | - | - |
| Graduate Degree | - | - |
| Total | $32,917 | $50,805 |
Family Income in Borrego Springs
Family Income Brackets in Borrego Springs
According to the Borrego Springs family income data, there are 243 families falling into the $100,000 to $149,999 income range, which is the most common income bracket and makes up 26.1% of all families.
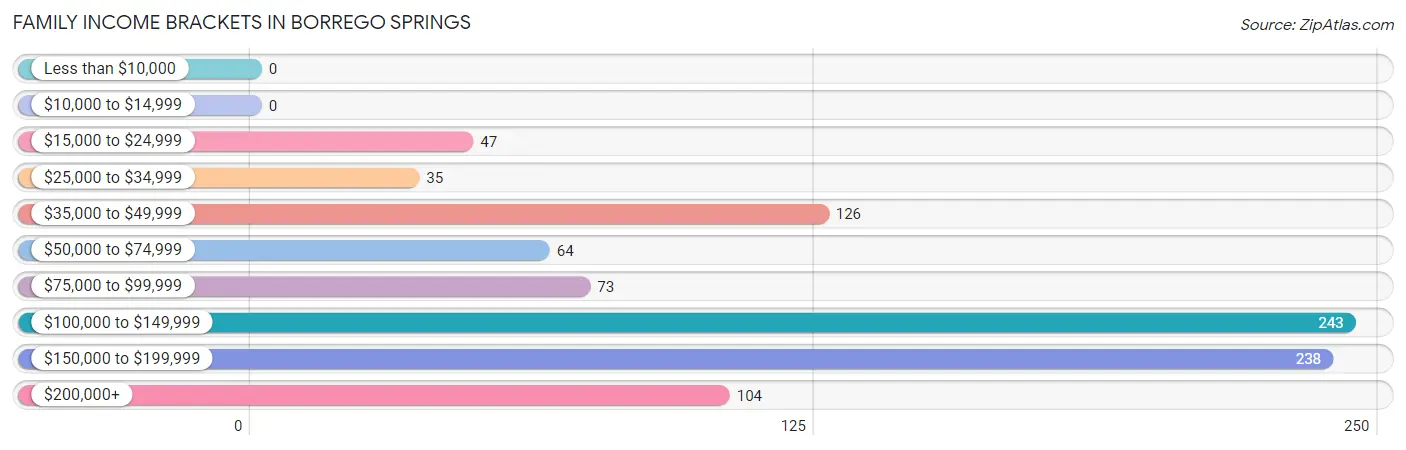
| Income Bracket | # Families | % Families |
| Less than $10,000 | 0 | 0.0% |
| $10,000 to $14,999 | 0 | 0.0% |
| $15,000 to $24,999 | 47 | 5.1% |
| $25,000 to $34,999 | 35 | 3.8% |
| $35,000 to $49,999 | 126 | 13.5% |
| $50,000 to $74,999 | 64 | 6.9% |
| $75,000 to $99,999 | 73 | 7.8% |
| $100,000 to $149,999 | 243 | 26.1% |
| $150,000 to $199,999 | 238 | 25.6% |
| $200,000+ | 104 | 11.2% |
Family Income by Famaliy Size in Borrego Springs
2-person families (694 | 74.6%) account for the highest median family income in Borrego Springs with $147,097 per family, while 2-person families (694 | 74.6%) have the highest median income of $73,548 per family member.
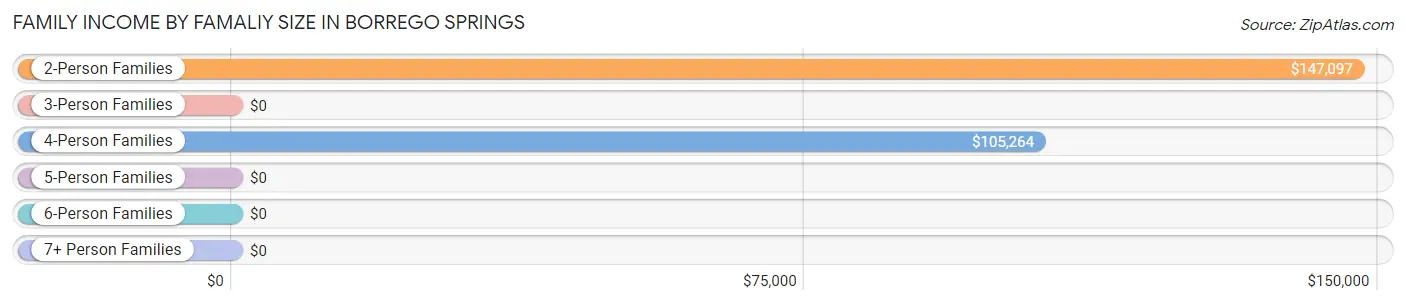
| Income Bracket | # Families | Median Income |
| 2-Person Families | 694 (74.6%) | $147,097 |
| 3-Person Families | 49 (5.3%) | $0 |
| 4-Person Families | 187 (20.1%) | $105,264 |
| 5-Person Families | 0 (0.0%) | $0 |
| 6-Person Families | 0 (0.0%) | $0 |
| 7+ Person Families | 0 (0.0%) | $0 |
| Total | 930 (100.0%) | $114,212 |
Family Income by Number of Earners in Borrego Springs
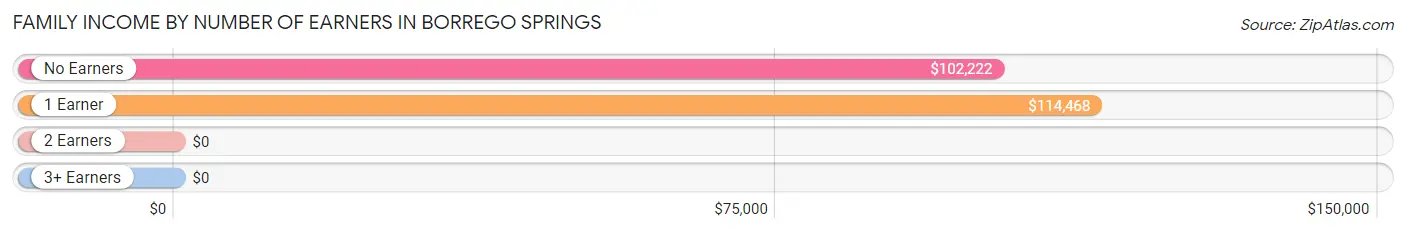
| Number of Earners | # Families | Median Income |
| No Earners | 350 (37.6%) | $102,222 |
| 1 Earner | 270 (29.0%) | $114,468 |
| 2 Earners | 271 (29.1%) | $0 |
| 3+ Earners | 39 (4.2%) | $0 |
| Total | 930 (100.0%) | $114,212 |
Household Income in Borrego Springs
Household Income Brackets in Borrego Springs
With 346 households falling in the category, the $100,000 to $149,999 income range is the most frequent in Borrego Springs, accounting for 24.8% of all households.
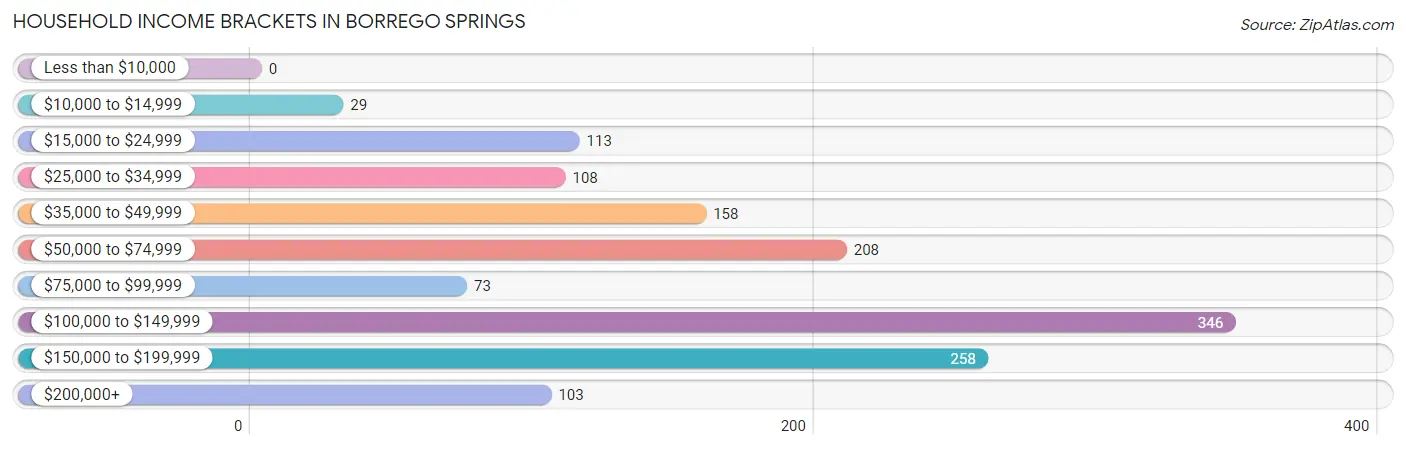
| Income Bracket | # Households | % Households |
| Less than $10,000 | 0 | 0.0% |
| $10,000 to $14,999 | 29 | 2.1% |
| $15,000 to $24,999 | 113 | 8.1% |
| $25,000 to $34,999 | 108 | 7.7% |
| $35,000 to $49,999 | 158 | 11.3% |
| $50,000 to $74,999 | 208 | 14.9% |
| $75,000 to $99,999 | 73 | 5.2% |
| $100,000 to $149,999 | 346 | 24.8% |
| $150,000 to $199,999 | 258 | 18.5% |
| $200,000+ | 103 | 7.4% |
Household Income by Householder Age in Borrego Springs
The median household income in Borrego Springs is $101,458, with the highest median household income of $119,453 found in the 45 to 64 years age bracket for the primary householder. A total of 530 households (37.9%) fall into this category. Meanwhile, the 15 to 24 years age bracket for the primary householder has the lowest median household income of $0, with 17 households (1.2%) in this group.
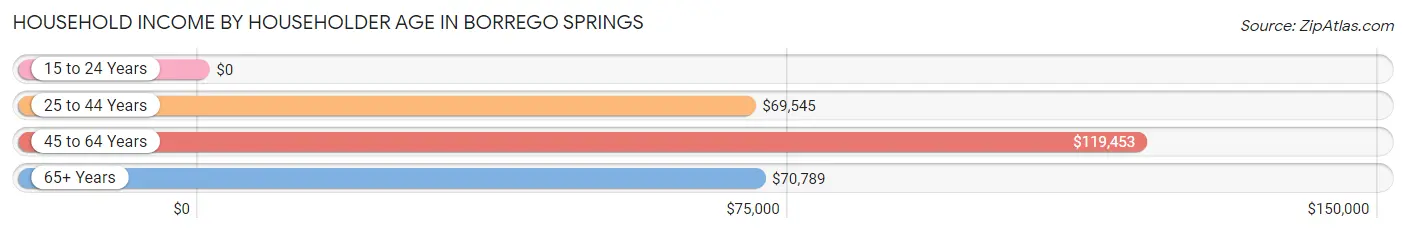
| Income Bracket | # Households | Median Income |
| 15 to 24 Years | 17 (1.2%) | $0 |
| 25 to 44 Years | 152 (10.9%) | $69,545 |
| 45 to 64 Years | 530 (37.9%) | $119,453 |
| 65+ Years | 698 (50.0%) | $70,789 |
| Total | 1,397 (100.0%) | $101,458 |
Poverty in Borrego Springs
Income Below Poverty by Sex and Age in Borrego Springs
With 2.5% poverty level for males and 3.7% for females among the residents of Borrego Springs, 16 and 17 year old males and 35 to 44 year old females are the most vulnerable to poverty, with 19 males (100.0%) and 46 females (31.3%) in their respective age groups living below the poverty level.
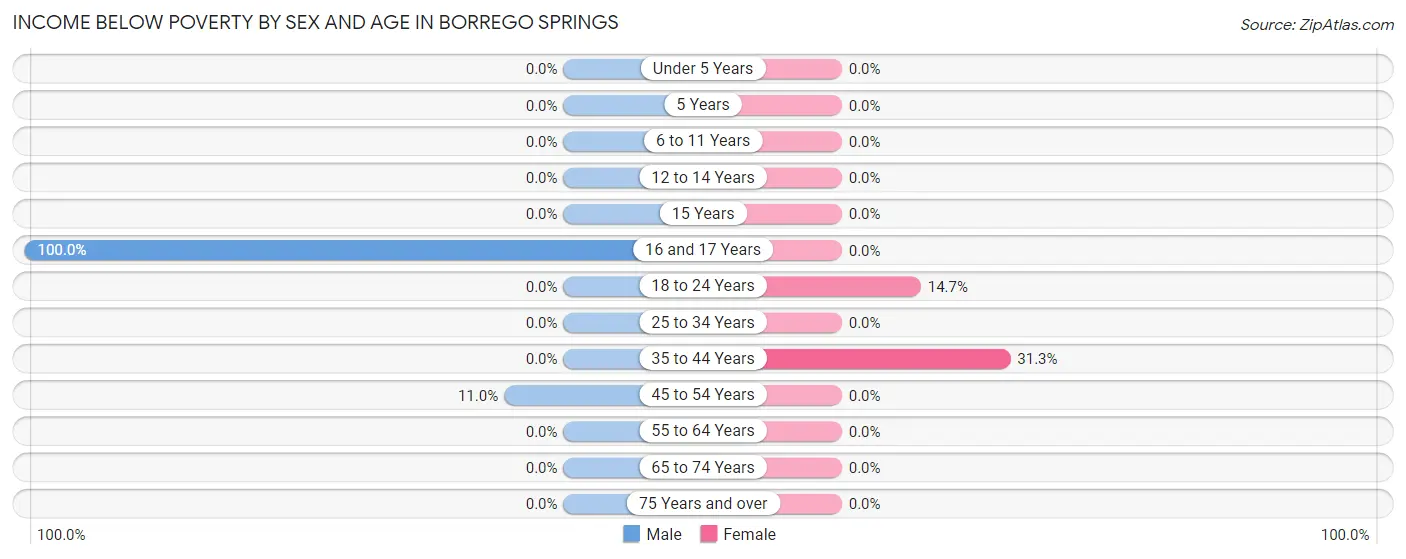
| Age Bracket | Male | Female |
| Under 5 Years | 0 (0.0%) | 0 (0.0%) |
| 5 Years | 0 (0.0%) | 0 (0.0%) |
| 6 to 11 Years | 0 (0.0%) | 0 (0.0%) |
| 12 to 14 Years | 0 (0.0%) | 0 (0.0%) |
| 15 Years | 0 (0.0%) | 0 (0.0%) |
| 16 and 17 Years | 19 (100.0%) | 0 (0.0%) |
| 18 to 24 Years | 0 (0.0%) | 17 (14.7%) |
| 25 to 34 Years | 0 (0.0%) | 0 (0.0%) |
| 35 to 44 Years | 0 (0.0%) | 46 (31.3%) |
| 45 to 54 Years | 13 (11.0%) | 0 (0.0%) |
| 55 to 64 Years | 0 (0.0%) | 0 (0.0%) |
| 65 to 74 Years | 0 (0.0%) | 0 (0.0%) |
| 75 Years and over | 0 (0.0%) | 0 (0.0%) |
| Total | 32 (2.5%) | 63 (3.7%) |
Income Above Poverty by Sex and Age in Borrego Springs
According to the poverty statistics in Borrego Springs, males aged under 5 years and females aged under 5 years are the age groups that are most secure financially, with 100.0% of males and 100.0% of females in these age groups living above the poverty line.
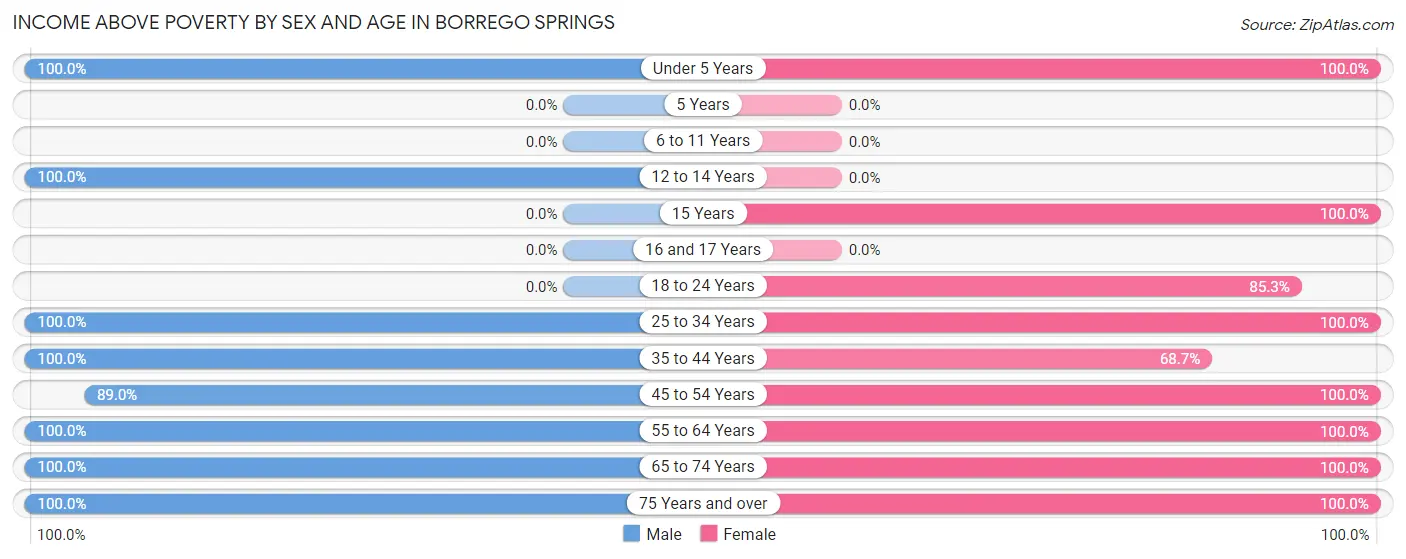
| Age Bracket | Male | Female |
| Under 5 Years | 52 (100.0%) | 118 (100.0%) |
| 5 Years | 0 (0.0%) | 0 (0.0%) |
| 6 to 11 Years | 0 (0.0%) | 0 (0.0%) |
| 12 to 14 Years | 105 (100.0%) | 0 (0.0%) |
| 15 Years | 0 (0.0%) | 50 (100.0%) |
| 16 and 17 Years | 0 (0.0%) | 0 (0.0%) |
| 18 to 24 Years | 0 (0.0%) | 99 (85.3%) |
| 25 to 34 Years | 71 (100.0%) | 119 (100.0%) |
| 35 to 44 Years | 127 (100.0%) | 101 (68.7%) |
| 45 to 54 Years | 105 (89.0%) | 216 (100.0%) |
| 55 to 64 Years | 283 (100.0%) | 198 (100.0%) |
| 65 to 74 Years | 127 (100.0%) | 273 (100.0%) |
| 75 Years and over | 361 (100.0%) | 445 (100.0%) |
| Total | 1,231 (97.5%) | 1,619 (96.3%) |
Income Below Poverty Among Married-Couple Families in Borrego Springs
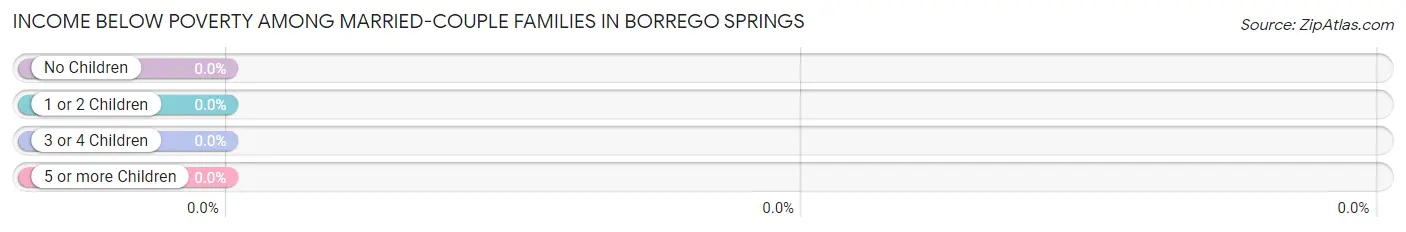
| Children | Above Poverty | Below Poverty |
| No Children | 716 (100.0%) | 0 (0.0%) |
| 1 or 2 Children | 101 (100.0%) | 0 (0.0%) |
| 3 or 4 Children | 0 (0.0%) | 0 (0.0%) |
| 5 or more Children | 0 (0.0%) | 0 (0.0%) |
| Total | 817 (100.0%) | 0 (0.0%) |
Income Below Poverty Among Single-Parent Households in Borrego Springs
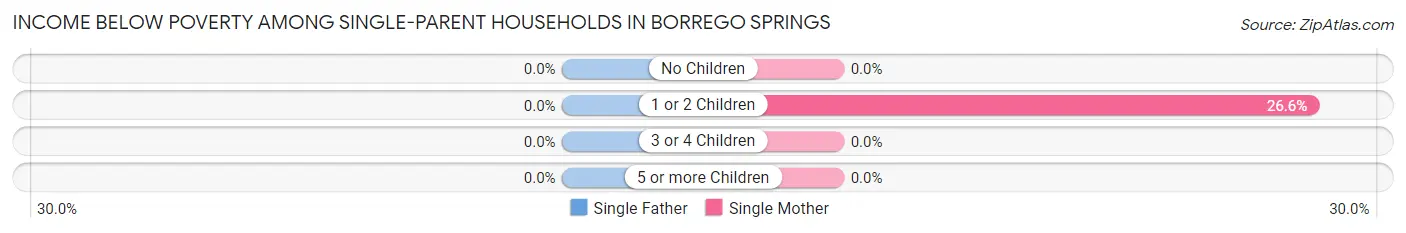
| Children | Single Father | Single Mother |
| No Children | 0 (0.0%) | 0 (0.0%) |
| 1 or 2 Children | 0 (0.0%) | 17 (26.6%) |
| 3 or 4 Children | 0 (0.0%) | 0 (0.0%) |
| 5 or more Children | 0 (0.0%) | 0 (0.0%) |
| Total | 0 (0.0%) | 17 (26.6%) |
Income Below Poverty Among Married-Couple vs Single-Parent Households in Borrego Springs
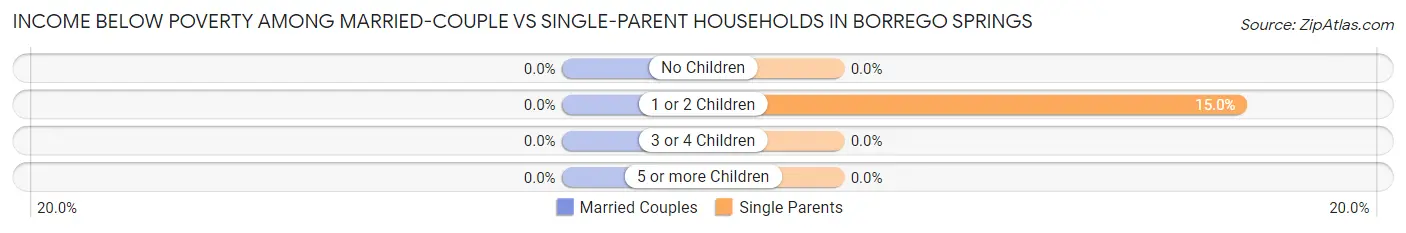
| Children | Married-Couple Families | Single-Parent Households |
| No Children | 0 (0.0%) | 0 (0.0%) |
| 1 or 2 Children | 0 (0.0%) | 17 (15.0%) |
| 3 or 4 Children | 0 (0.0%) | 0 (0.0%) |
| 5 or more Children | 0 (0.0%) | 0 (0.0%) |
| Total | 0 (0.0%) | 17 (15.0%) |
Race in Borrego Springs
The most populous races in Borrego Springs are White / Caucasian (2,364 | 80.2%), Hispanic or Latino (1,042 | 35.4%), and Two or more Races (541 | 18.4%).
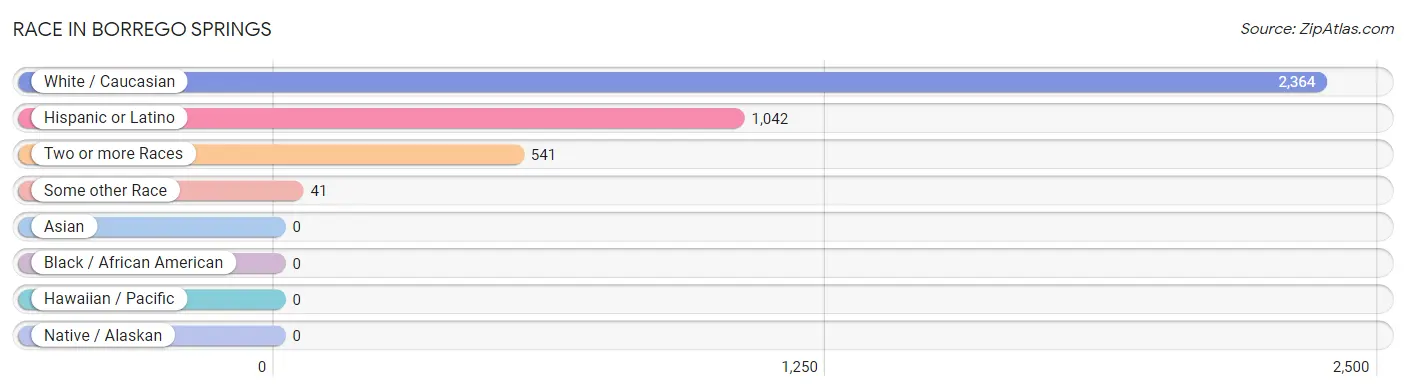
| Race | # Population | % Population |
| Asian | 0 | 0.0% |
| Black / African American | 0 | 0.0% |
| Hawaiian / Pacific | 0 | 0.0% |
| Hispanic or Latino | 1,042 | 35.4% |
| Native / Alaskan | 0 | 0.0% |
| White / Caucasian | 2,364 | 80.2% |
| Two or more Races | 541 | 18.4% |
| Some other Race | 41 | 1.4% |
| Total | 2,946 | 100.0% |
Ancestry in Borrego Springs
The most populous ancestries reported in Borrego Springs are Mexican (1,042 | 35.4%), German (492 | 16.7%), English (396 | 13.4%), Irish (362 | 12.3%), and Scottish (208 | 7.1%), together accounting for 84.9% of all Borrego Springs residents.
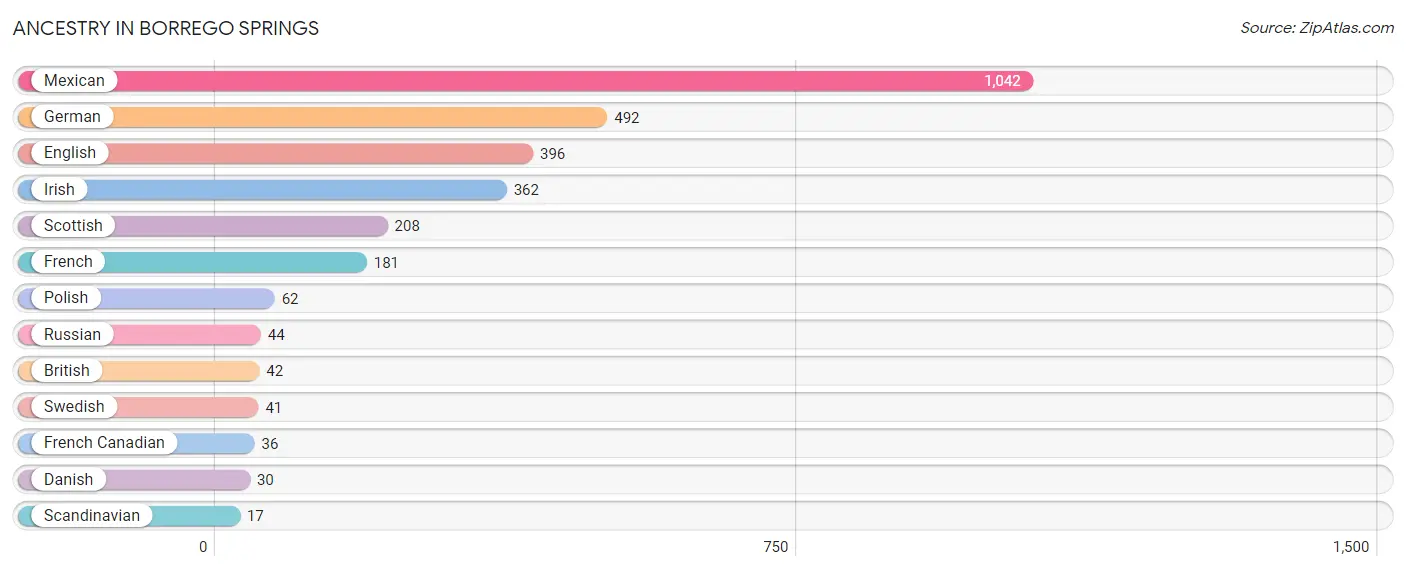
| Ancestry | # Population | % Population |
| British | 42 | 1.4% |
| Danish | 30 | 1.0% |
| English | 396 | 13.4% |
| French | 181 | 6.1% |
| French Canadian | 36 | 1.2% |
| German | 492 | 16.7% |
| Irish | 362 | 12.3% |
| Mexican | 1,042 | 35.4% |
| Polish | 62 | 2.1% |
| Russian | 44 | 1.5% |
| Scandinavian | 17 | 0.6% |
| Scottish | 208 | 7.1% |
| Swedish | 41 | 1.4% | View All 13 Rows |
Immigrants in Borrego Springs
The most numerous immigrant groups reported in Borrego Springs came from Central America (633 | 21.5%), Latin America (633 | 21.5%), Mexico (606 | 20.6%), Europe (48 | 1.6%), and Ireland (30 | 1.0%), together accounting for 66.2% of all Borrego Springs residents.
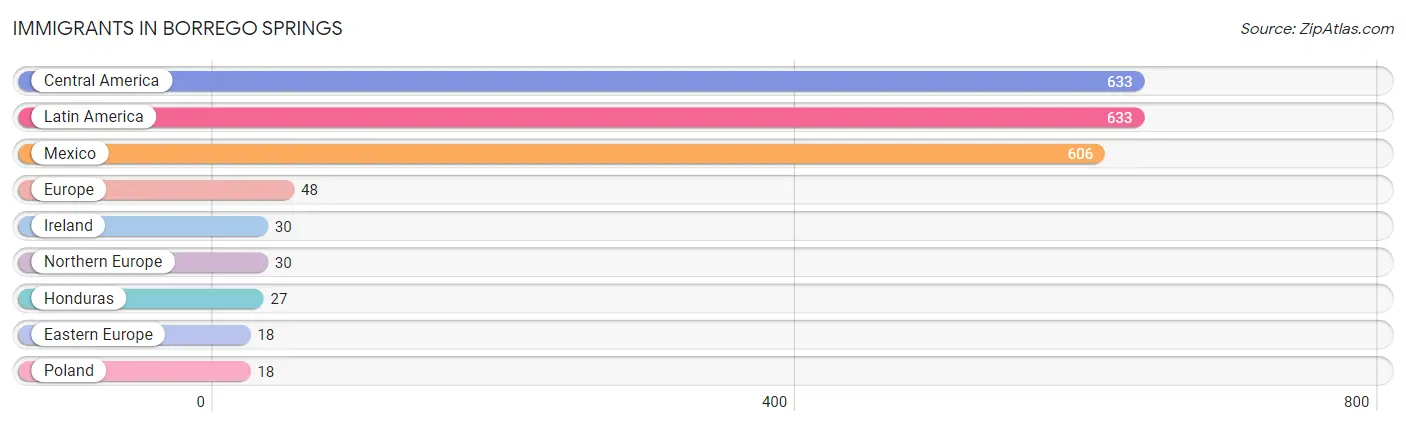
| Immigration Origin | # Population | % Population |
| Central America | 633 | 21.5% |
| Eastern Europe | 18 | 0.6% |
| Europe | 48 | 1.6% |
| Honduras | 27 | 0.9% |
| Ireland | 30 | 1.0% |
| Latin America | 633 | 21.5% |
| Mexico | 606 | 20.6% |
| Northern Europe | 30 | 1.0% |
| Poland | 18 | 0.6% | View All 9 Rows |
Sex and Age in Borrego Springs
Sex and Age in Borrego Springs
The most populous age groups in Borrego Springs are 75 to 79 Years (245 | 19.4%) for men and 75 to 79 Years (325 | 19.3%) for women.
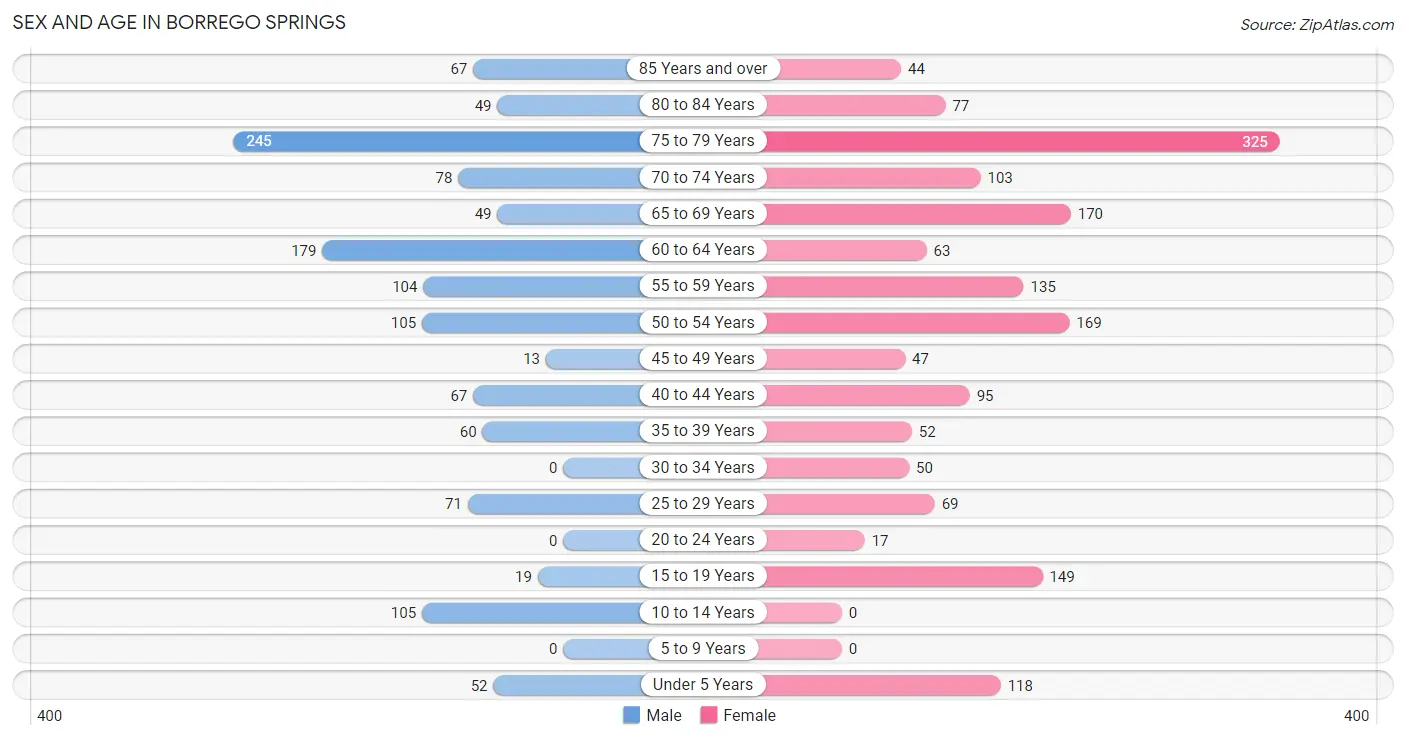
| Age Bracket | Male | Female |
| Under 5 Years | 52 (4.1%) | 118 (7.0%) |
| 5 to 9 Years | 0 (0.0%) | 0 (0.0%) |
| 10 to 14 Years | 105 (8.3%) | 0 (0.0%) |
| 15 to 19 Years | 19 (1.5%) | 149 (8.8%) |
| 20 to 24 Years | 0 (0.0%) | 17 (1.0%) |
| 25 to 29 Years | 71 (5.6%) | 69 (4.1%) |
| 30 to 34 Years | 0 (0.0%) | 50 (3.0%) |
| 35 to 39 Years | 60 (4.8%) | 52 (3.1%) |
| 40 to 44 Years | 67 (5.3%) | 95 (5.6%) |
| 45 to 49 Years | 13 (1.0%) | 47 (2.8%) |
| 50 to 54 Years | 105 (8.3%) | 169 (10.0%) |
| 55 to 59 Years | 104 (8.2%) | 135 (8.0%) |
| 60 to 64 Years | 179 (14.2%) | 63 (3.7%) |
| 65 to 69 Years | 49 (3.9%) | 170 (10.1%) |
| 70 to 74 Years | 78 (6.2%) | 103 (6.1%) |
| 75 to 79 Years | 245 (19.4%) | 325 (19.3%) |
| 80 to 84 Years | 49 (3.9%) | 77 (4.6%) |
| 85 Years and over | 67 (5.3%) | 44 (2.6%) |
| Total | 1,263 (100.0%) | 1,683 (100.0%) |
Families and Households in Borrego Springs
Median Family Size in Borrego Springs
The median family size in Borrego Springs is 2.52 persons per family, with single female/mother families (64 | 6.9%) accounting for the largest median family size of 3.95 persons per family. On the other hand, married-couple families (817 | 87.8%) represent the smallest median family size with 2.38 persons per family.
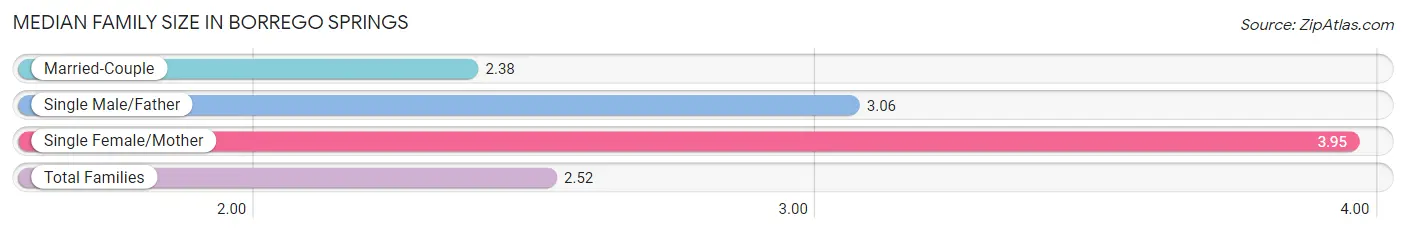
| Family Type | # Families | Family Size |
| Married-Couple | 817 (87.8%) | 2.38 |
| Single Male/Father | 49 (5.3%) | 3.06 |
| Single Female/Mother | 64 (6.9%) | 3.95 |
| Total Families | 930 (100.0%) | 2.52 |
Median Household Size in Borrego Springs
The median household size in Borrego Springs is 2.11 persons per household, with single male/father households (49 | 3.5%) accounting for the largest median household size of 4 persons per household. non-family households (467 | 33.4%) represent the smallest median household size with 1.18 persons per household.
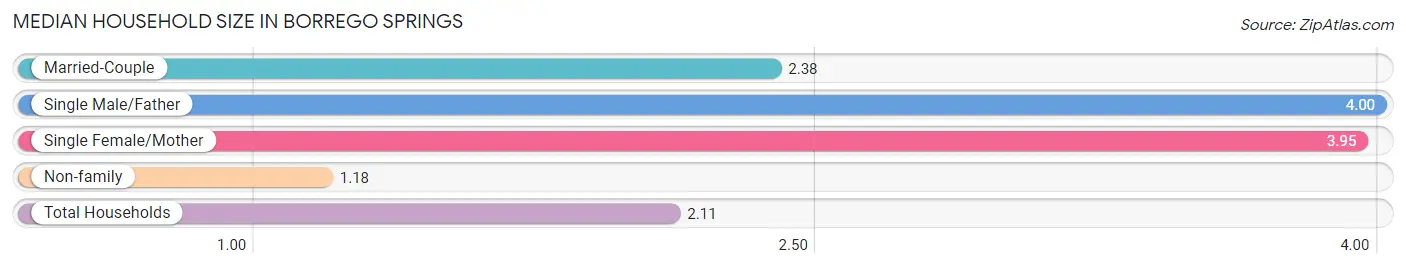
| Household Type | # Households | Household Size |
| Married-Couple | 817 (58.5%) | 2.38 |
| Single Male/Father | 49 (3.5%) | 4.00 |
| Single Female/Mother | 64 (4.6%) | 3.95 |
| Non-family | 467 (33.4%) | 1.18 |
| Total Households | 1,397 (100.0%) | 2.11 |
Household Size by Marriage Status in Borrego Springs
Out of a total of 1,397 households in Borrego Springs, 930 (66.6%) are family households, while 467 (33.4%) are nonfamily households. The most numerous type of family households are 2-person households, comprising 694, and the most common type of nonfamily households are 1-person households, comprising 433.
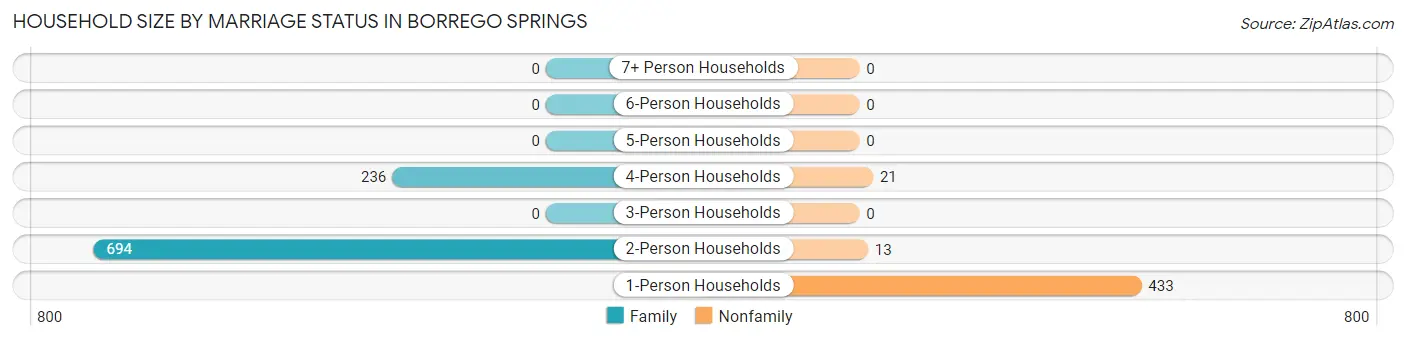
| Household Size | Family Households | Nonfamily Households |
| 1-Person Households | - | 433 (31.0%) |
| 2-Person Households | 694 (49.7%) | 13 (0.9%) |
| 3-Person Households | 0 (0.0%) | 0 (0.0%) |
| 4-Person Households | 236 (16.9%) | 21 (1.5%) |
| 5-Person Households | 0 (0.0%) | 0 (0.0%) |
| 6-Person Households | 0 (0.0%) | 0 (0.0%) |
| 7+ Person Households | 0 (0.0%) | 0 (0.0%) |
| Total | 930 (66.6%) | 467 (33.4%) |
Female Fertility in Borrego Springs
Fertility by Age in Borrego Springs
| Age Bracket | Women with Births | Births / 1,000 Women |
| 15 to 19 years | 0 (0.0%) | 0.0 |
| 20 to 34 years | 0 (0.0%) | 0.0 |
| 35 to 50 years | 0 (0.0%) | 0.0 |
| Total | 0 (0.0%) | 0.0 |
Fertility by Age by Marriage Status in Borrego Springs
| Age Bracket | Married | Unmarried |
| 15 to 19 years | 0 (0.0%) | 0 (0.0%) |
| 20 to 34 years | 0 (0.0%) | 0 (0.0%) |
| 35 to 50 years | 0 (0.0%) | 0 (0.0%) |
| Total | 0 (0.0%) | 0 (0.0%) |
Fertility by Education in Borrego Springs
| Educational Attainment | Women with Births | Births / 1,000 Women |
| Less than High School | 0 (0.0%) | 0.0 |
| High School Diploma | 0 (0.0%) | 0.0 |
| College or Associate's Degree | 0 (0.0%) | 0.0 |
| Bachelor's Degree | 0 (0.0%) | 0.0 |
| Graduate Degree | 0 (0.0%) | 0.0 |
| Total | 0 (0.0%) | 0.0 |
Fertility by Education by Marriage Status in Borrego Springs
| Educational Attainment | Married | Unmarried |
| Less than High School | 0 (0.0%) | 0 (0.0%) |
| High School Diploma | 0 (0.0%) | 0 (0.0%) |
| College or Associate's Degree | 0 (0.0%) | 0 (0.0%) |
| Bachelor's Degree | 0 (0.0%) | 0 (0.0%) |
| Graduate Degree | 0 (0.0%) | 0 (0.0%) |
| Total | 0 (0.0%) | 0 (0.0%) |
Employment Characteristics in Borrego Springs
Employment by Class of Employer in Borrego Springs
Among the 1,147 employed individuals in Borrego Springs, private company employees (841 | 73.3%), self-employed (incorporated) (148 | 12.9%), and self-employed (not incorporated) (70 | 6.1%) make up the most common classes of employment.
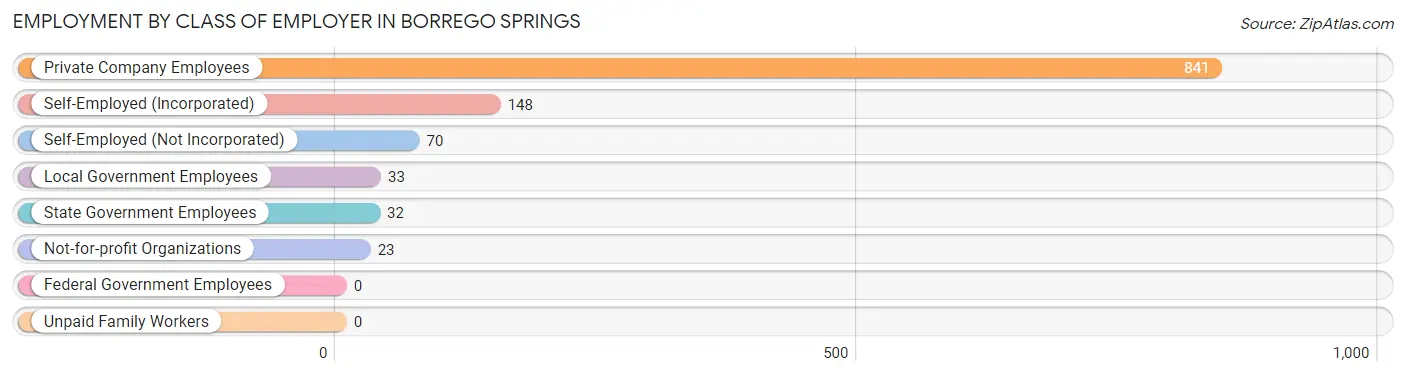
| Employer Class | # Employees | % Employees |
| Private Company Employees | 841 | 73.3% |
| Self-Employed (Incorporated) | 148 | 12.9% |
| Self-Employed (Not Incorporated) | 70 | 6.1% |
| Not-for-profit Organizations | 23 | 2.0% |
| Local Government Employees | 33 | 2.9% |
| State Government Employees | 32 | 2.8% |
| Federal Government Employees | 0 | 0.0% |
| Unpaid Family Workers | 0 | 0.0% |
| Total | 1,147 | 100.0% |
Employment Status by Age in Borrego Springs
According to the labor force statistics for Borrego Springs, out of the total population over 16 years of age (2,621), 48.0% or 1,258 individuals are in the labor force, with 5.3% or 67 of them unemployed. The age group with the highest labor force participation rate is 20 to 24 years, with 100.0% or 17 individuals in the labor force. Within the labor force, the 35 to 44 years age range has the highest percentage of unemployed individuals, with 29.4% or 67 of them being unemployed.
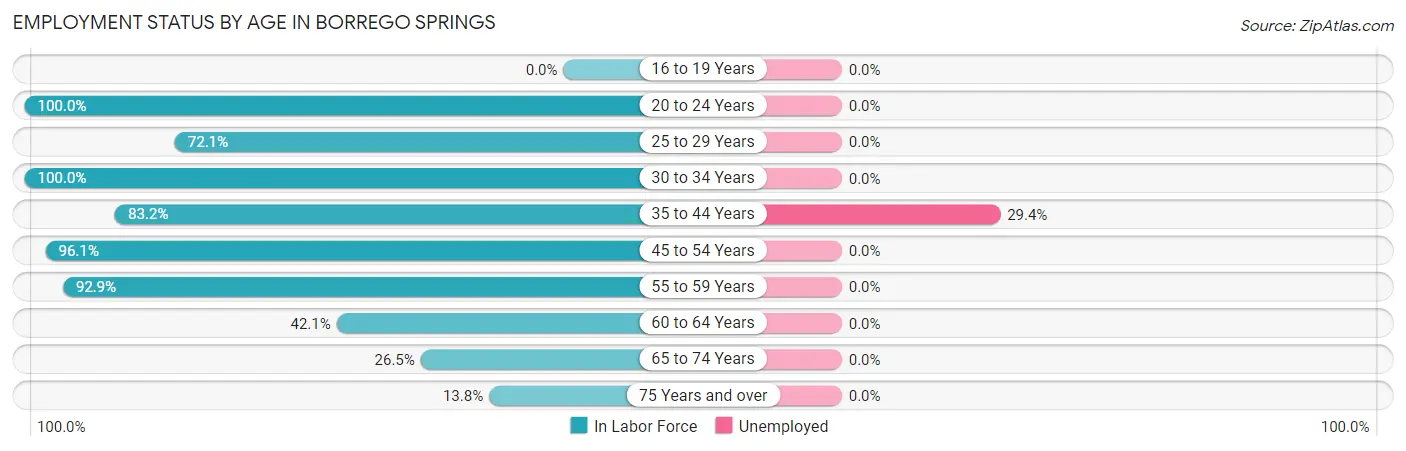
| Age Bracket | In Labor Force | Unemployed |
| 16 to 19 Years | 0 (0.0%) | 0 (0.0%) |
| 20 to 24 Years | 17 (100.0%) | 0 (0.0%) |
| 25 to 29 Years | 101 (72.1%) | 0 (0.0%) |
| 30 to 34 Years | 50 (100.0%) | 0 (0.0%) |
| 35 to 44 Years | 228 (83.2%) | 67 (29.4%) |
| 45 to 54 Years | 321 (96.1%) | 0 (0.0%) |
| 55 to 59 Years | 222 (92.9%) | 0 (0.0%) |
| 60 to 64 Years | 102 (42.1%) | 0 (0.0%) |
| 65 to 74 Years | 106 (26.5%) | 0 (0.0%) |
| 75 Years and over | 111 (13.8%) | 0 (0.0%) |
| Total | 1,258 (48.0%) | 67 (5.3%) |
Employment Status by Educational Attainment in Borrego Springs
According to labor force statistics for Borrego Springs, 80.1% of individuals (1,024) out of the total population between 25 and 64 years of age (1,279) are in the labor force, with 6.5% or 67 of them being unemployed. The group with the highest labor force participation rate are those with the educational attainment of less than high school, with 100.0% or 244 individuals in the labor force. Within the labor force, individuals with high school diploma education have the highest percentage of unemployment, with 18.6% or 67 of them being unemployed.
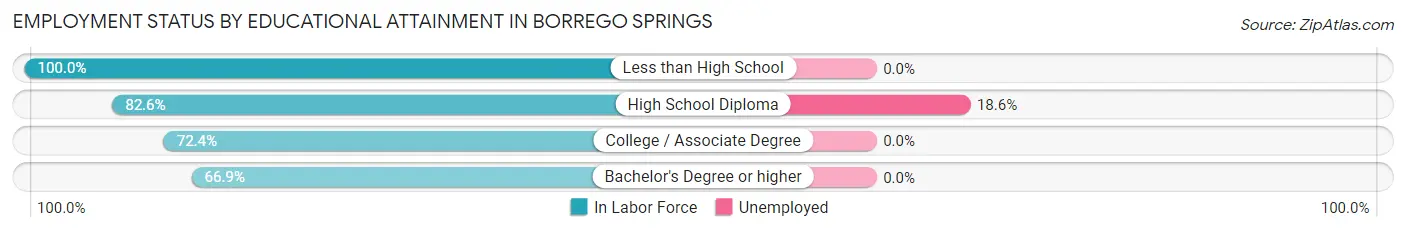
| Educational Attainment | In Labor Force | Unemployed |
| Less than High School | 244 (100.0%) | 0 (0.0%) |
| High School Diploma | 361 (82.6%) | 81 (18.6%) |
| College / Associate Degree | 247 (72.4%) | 0 (0.0%) |
| Bachelor's Degree or higher | 172 (66.9%) | 0 (0.0%) |
| Total | 1,024 (80.1%) | 83 (6.5%) |
Employment Occupations by Sex in Borrego Springs
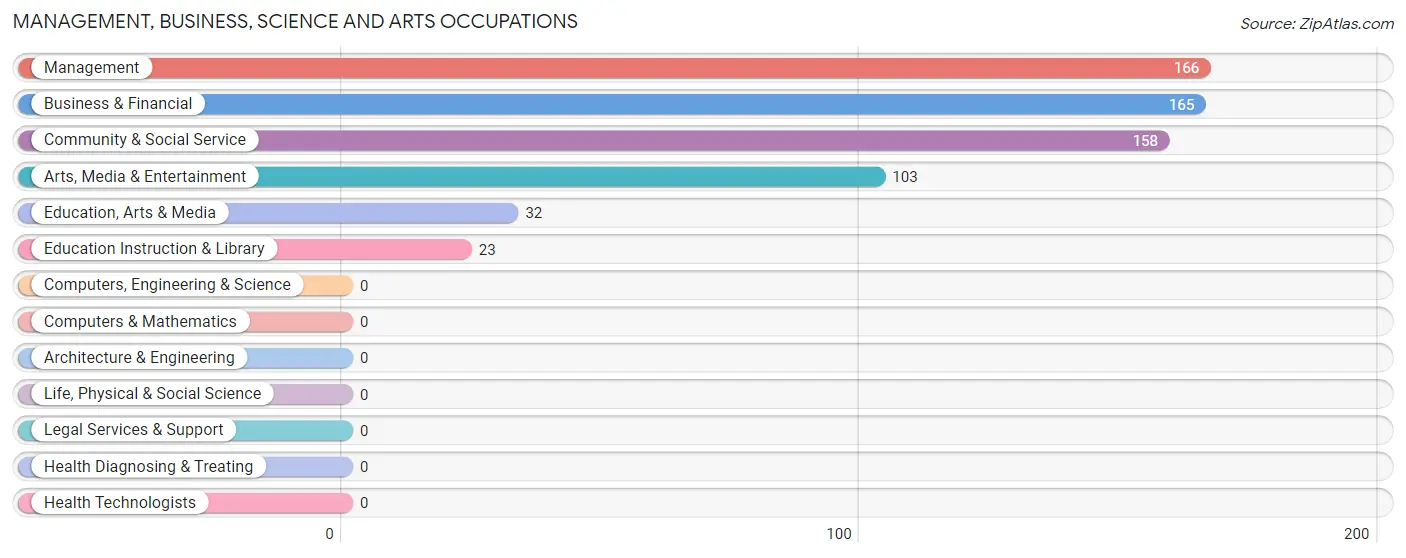
Management, Business, Science and Arts Occupations
The most common Management, Business, Science and Arts occupations in Borrego Springs are Management (166 | 13.9%), Business & Financial (165 | 13.9%), Community & Social Service (158 | 13.3%), Arts, Media & Entertainment (103 | 8.6%), and Education, Arts & Media (32 | 2.7%).
Management, Business, Science and Arts Occupations by Sex
Within the Management, Business, Science and Arts occupations in Borrego Springs, the most male-oriented occupations are Education, Arts & Media (100.0%), Management (61.5%), and Community & Social Service (41.1%), while the most female-oriented occupations are Business & Financial (100.0%), Education Instruction & Library (100.0%), and Arts, Media & Entertainment (68.0%).
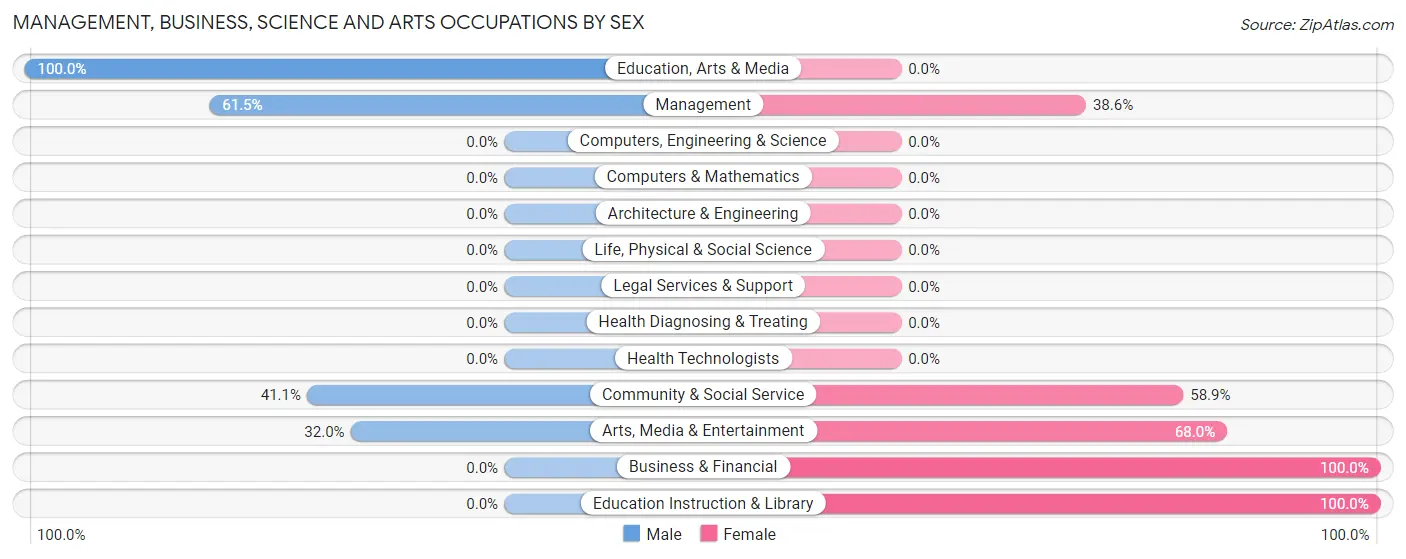
| Occupation | Male | Female |
| Management | 102 (61.5%) | 64 (38.6%) |
| Business & Financial | 0 (0.0%) | 165 (100.0%) |
| Computers, Engineering & Science | 0 (0.0%) | 0 (0.0%) |
| Computers & Mathematics | 0 (0.0%) | 0 (0.0%) |
| Architecture & Engineering | 0 (0.0%) | 0 (0.0%) |
| Life, Physical & Social Science | 0 (0.0%) | 0 (0.0%) |
| Community & Social Service | 65 (41.1%) | 93 (58.9%) |
| Education, Arts & Media | 32 (100.0%) | 0 (0.0%) |
| Legal Services & Support | 0 (0.0%) | 0 (0.0%) |
| Education Instruction & Library | 0 (0.0%) | 23 (100.0%) |
| Arts, Media & Entertainment | 33 (32.0%) | 70 (68.0%) |
| Health Diagnosing & Treating | 0 (0.0%) | 0 (0.0%) |
| Health Technologists | 0 (0.0%) | 0 (0.0%) |
| Total (Category) | 167 (34.2%) | 322 (65.8%) |
| Total (Overall) | 506 (42.5%) | 685 (57.5%) |
Services Occupations
The most common Services occupations in Borrego Springs are Cleaning & Maintenance (203 | 17.0%), Food Preparation & Serving (135 | 11.3%), and Personal Care & Service (50 | 4.2%).
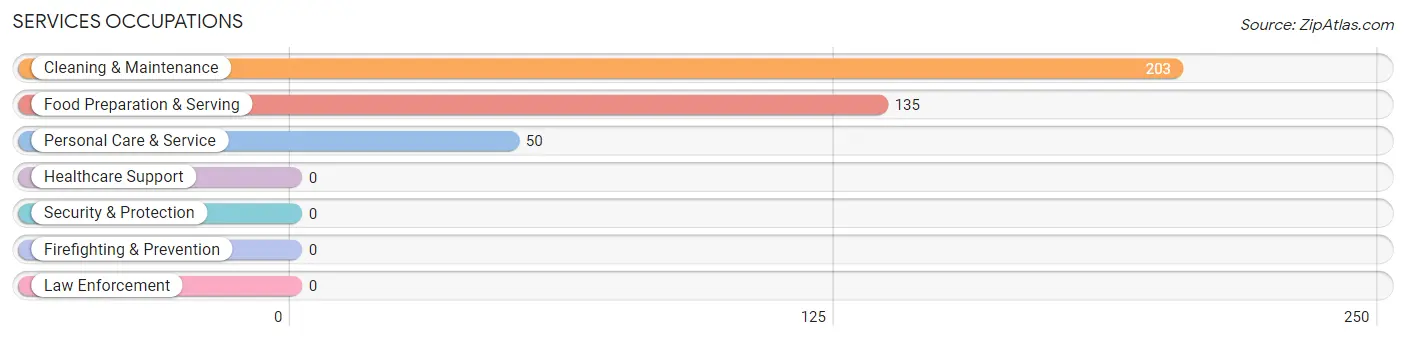
Services Occupations by Sex
Within the Services occupations in Borrego Springs, the most male-oriented occupations are Cleaning & Maintenance (100.0%), and Food Preparation & Serving (37.8%), while the most female-oriented occupations are Personal Care & Service (100.0%), and Food Preparation & Serving (62.2%).
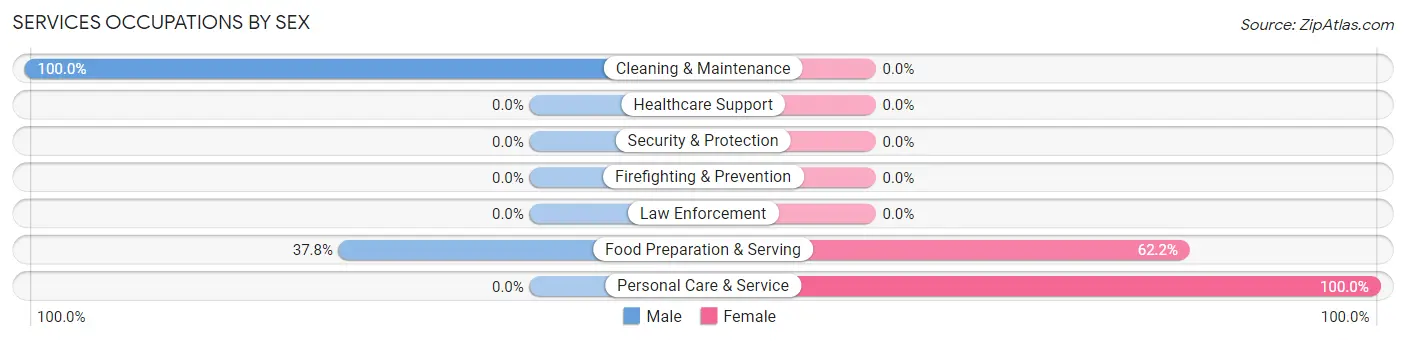
| Occupation | Male | Female |
| Healthcare Support | 0 (0.0%) | 0 (0.0%) |
| Security & Protection | 0 (0.0%) | 0 (0.0%) |
| Firefighting & Prevention | 0 (0.0%) | 0 (0.0%) |
| Law Enforcement | 0 (0.0%) | 0 (0.0%) |
| Food Preparation & Serving | 51 (37.8%) | 84 (62.2%) |
| Cleaning & Maintenance | 203 (100.0%) | 0 (0.0%) |
| Personal Care & Service | 0 (0.0%) | 50 (100.0%) |
| Total (Category) | 254 (65.5%) | 134 (34.5%) |
| Total (Overall) | 506 (42.5%) | 685 (57.5%) |
Sales and Office Occupations
The most common Sales and Office occupations in Borrego Springs are , and Sales & Related (282 | 23.7%).
Sales and Office Occupations by Sex
| Occupation | Male | Female |
| Sales & Related | 53 (18.8%) | 229 (81.2%) |
| Office & Administration | 0 (0.0%) | 0 (0.0%) |
| Total (Category) | 53 (18.8%) | 229 (81.2%) |
| Total (Overall) | 506 (42.5%) | 685 (57.5%) |
Natural Resources, Construction and Maintenance Occupations
The most common Natural Resources, Construction and Maintenance occupations in Borrego Springs are , and Construction & Extraction (32 | 2.7%).
Natural Resources, Construction and Maintenance Occupations by Sex
| Occupation | Male | Female |
| Farming, Fishing & Forestry | 0 (0.0%) | 0 (0.0%) |
| Construction & Extraction | 32 (100.0%) | 0 (0.0%) |
| Installation, Maintenance & Repair | 0 (0.0%) | 0 (0.0%) |
| Total (Category) | 32 (100.0%) | 0 (0.0%) |
| Total (Overall) | 506 (42.5%) | 685 (57.5%) |
Production, Transportation and Moving Occupations
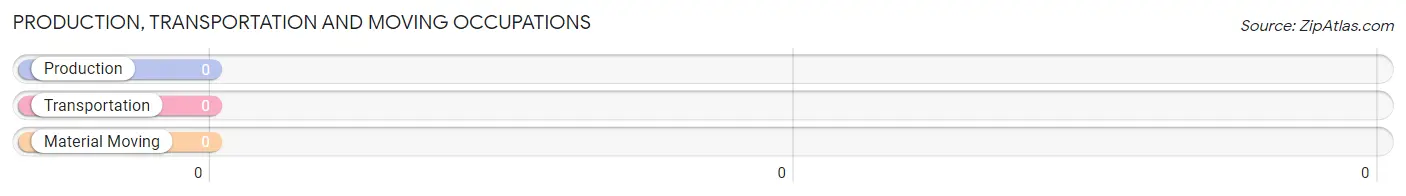
Production, Transportation and Moving Occupations by Sex
| Occupation | Male | Female |
| Production | 0 (0.0%) | 0 (0.0%) |
| Transportation | 0 (0.0%) | 0 (0.0%) |
| Material Moving | 0 (0.0%) | 0 (0.0%) |
| Total (Category) | 0 (0.0%) | 0 (0.0%) |
| Total (Overall) | 506 (42.5%) | 685 (57.5%) |
Employment Industries by Sex in Borrego Springs
Employment Industries in Borrego Springs
The major employment industries in Borrego Springs include Accommodation & Food Services (206 | 17.3%), Arts, Entertainment & Recreation (185 | 15.5%), Administrative & Support (171 | 14.4%), Professional & Scientific (151 | 12.7%), and Manufacturing (133 | 11.2%).
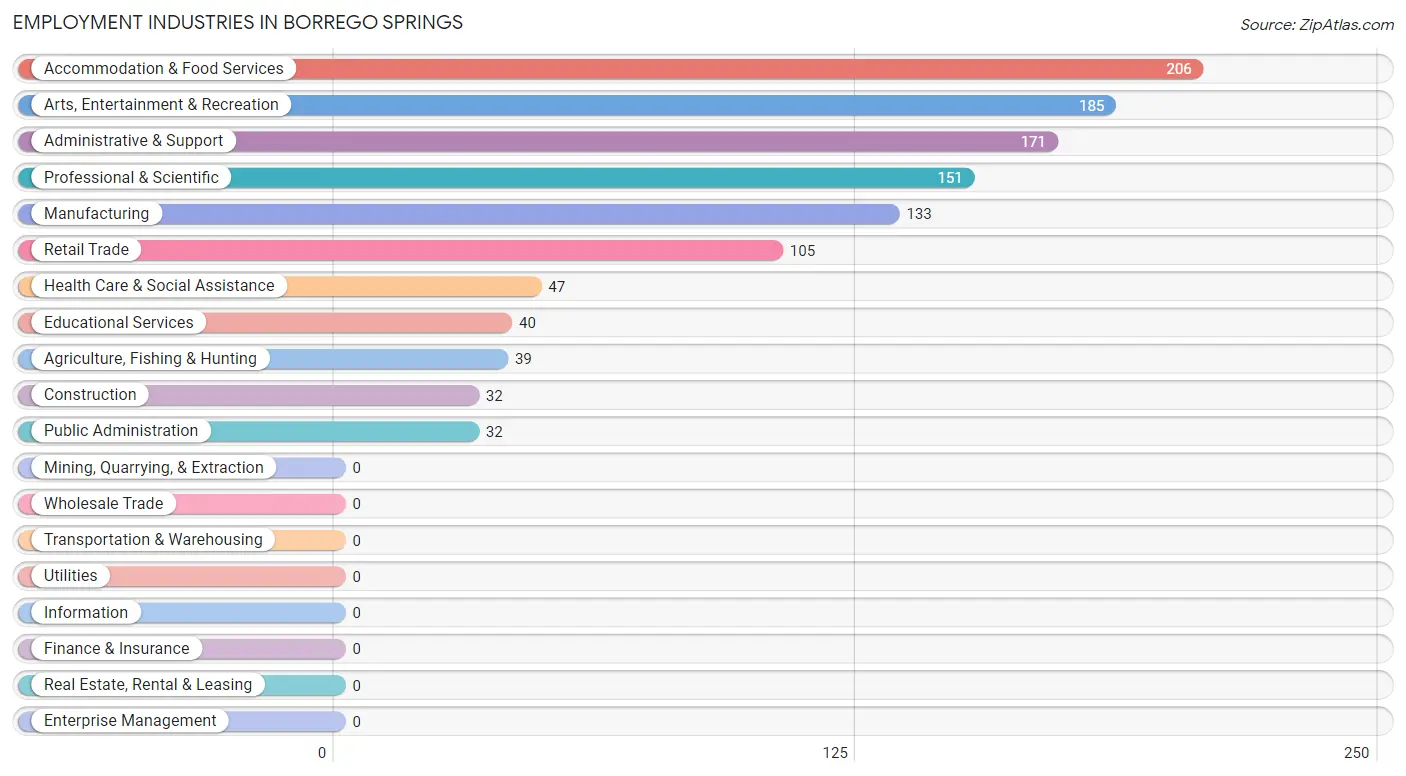
Employment Industries by Sex in Borrego Springs
The Borrego Springs industries that see more men than women are Agriculture, Fishing & Hunting (100.0%), Construction (100.0%), and Public Administration (100.0%), whereas the industries that tend to have a higher number of women are Manufacturing (100.0%), Educational Services (100.0%), and Health Care & Social Assistance (100.0%).
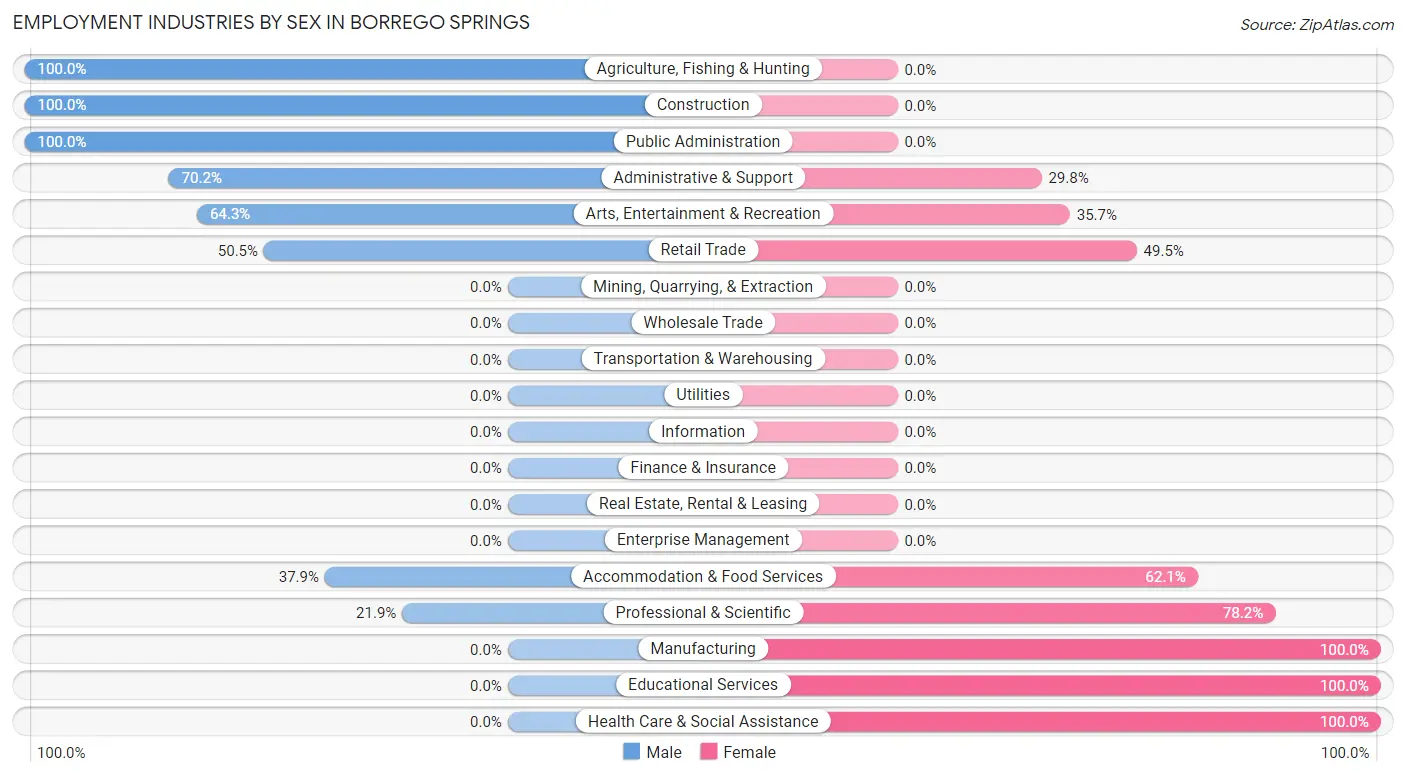
| Industry | Male | Female |
| Agriculture, Fishing & Hunting | 39 (100.0%) | 0 (0.0%) |
| Mining, Quarrying, & Extraction | 0 (0.0%) | 0 (0.0%) |
| Construction | 32 (100.0%) | 0 (0.0%) |
| Manufacturing | 0 (0.0%) | 133 (100.0%) |
| Wholesale Trade | 0 (0.0%) | 0 (0.0%) |
| Retail Trade | 53 (50.5%) | 52 (49.5%) |
| Transportation & Warehousing | 0 (0.0%) | 0 (0.0%) |
| Utilities | 0 (0.0%) | 0 (0.0%) |
| Information | 0 (0.0%) | 0 (0.0%) |
| Finance & Insurance | 0 (0.0%) | 0 (0.0%) |
| Real Estate, Rental & Leasing | 0 (0.0%) | 0 (0.0%) |
| Professional & Scientific | 33 (21.8%) | 118 (78.1%) |
| Enterprise Management | 0 (0.0%) | 0 (0.0%) |
| Administrative & Support | 120 (70.2%) | 51 (29.8%) |
| Educational Services | 0 (0.0%) | 40 (100.0%) |
| Health Care & Social Assistance | 0 (0.0%) | 47 (100.0%) |
| Arts, Entertainment & Recreation | 119 (64.3%) | 66 (35.7%) |
| Accommodation & Food Services | 78 (37.9%) | 128 (62.1%) |
| Public Administration | 32 (100.0%) | 0 (0.0%) |
| Total | 506 (42.5%) | 685 (57.5%) |
Education in Borrego Springs
School Enrollment in Borrego Springs
The most common levels of schooling among the 223 students in Borrego Springs are high school (123 | 55.2%), middle school (51 | 22.9%), and college / undergraduate (49 | 22.0%).
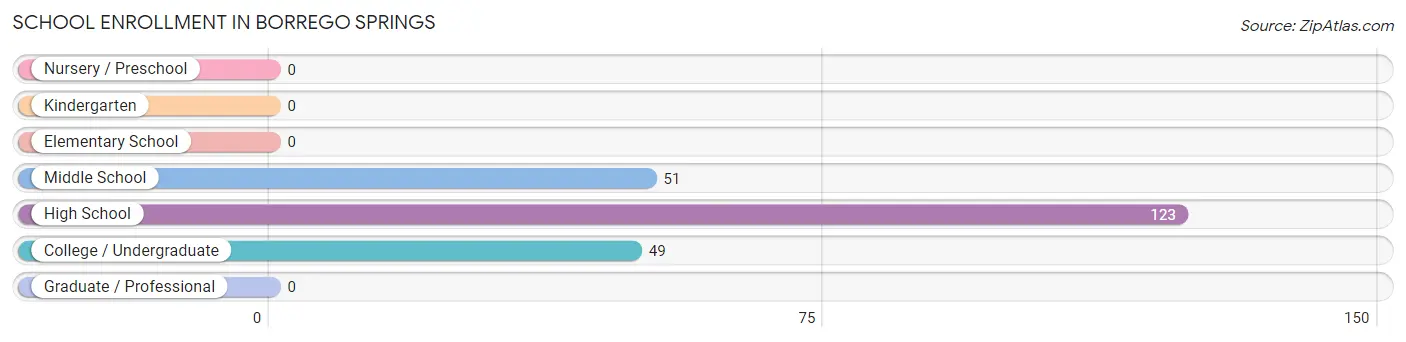
| School Level | # Students | % Students |
| Nursery / Preschool | 0 | 0.0% |
| Kindergarten | 0 | 0.0% |
| Elementary School | 0 | 0.0% |
| Middle School | 51 | 22.9% |
| High School | 123 | 55.2% |
| College / Undergraduate | 49 | 22.0% |
| Graduate / Professional | 0 | 0.0% |
| Total | 223 | 100.0% |
School Enrollment by Age by Funding Source in Borrego Springs
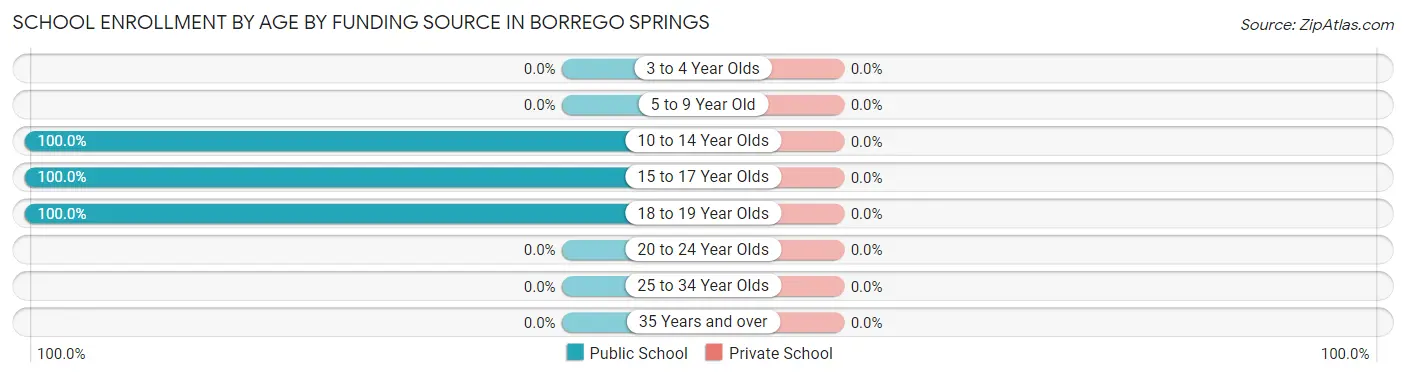
| Age Bracket | Public School | Private School |
| 3 to 4 Year Olds | 0 (0.0%) | 0 (0.0%) |
| 5 to 9 Year Old | 0 (0.0%) | 0 (0.0%) |
| 10 to 14 Year Olds | 105 (100.0%) | 0 (0.0%) |
| 15 to 17 Year Olds | 69 (100.0%) | 0 (0.0%) |
| 18 to 19 Year Olds | 49 (100.0%) | 0 (0.0%) |
| 20 to 24 Year Olds | 0 (0.0%) | 0 (0.0%) |
| 25 to 34 Year Olds | 0 (0.0%) | 0 (0.0%) |
| 35 Years and over | 0 (0.0%) | 0 (0.0%) |
| Total | 223 (100.0%) | 0 (0.0%) |
Educational Attainment by Field of Study in Borrego Springs
Visual & performing arts (184 | 22.3%), physical & health sciences (170 | 20.6%), education (113 | 13.7%), liberal arts & history (75 | 9.1%), and engineering (63 | 7.6%) are the most common fields of study among 826 individuals in Borrego Springs who have obtained a bachelor's degree or higher.
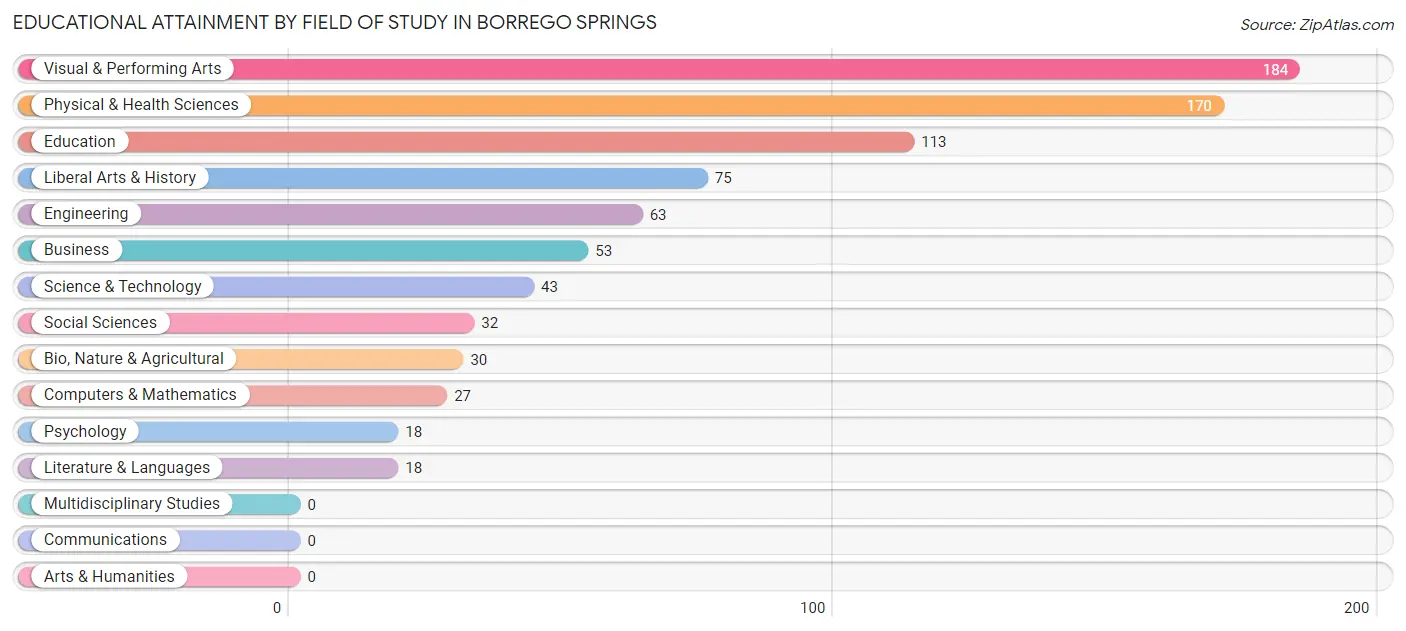
| Field of Study | # Graduates | % Graduates |
| Computers & Mathematics | 27 | 3.3% |
| Bio, Nature & Agricultural | 30 | 3.6% |
| Physical & Health Sciences | 170 | 20.6% |
| Psychology | 18 | 2.2% |
| Social Sciences | 32 | 3.9% |
| Engineering | 63 | 7.6% |
| Multidisciplinary Studies | 0 | 0.0% |
| Science & Technology | 43 | 5.2% |
| Business | 53 | 6.4% |
| Education | 113 | 13.7% |
| Literature & Languages | 18 | 2.2% |
| Liberal Arts & History | 75 | 9.1% |
| Visual & Performing Arts | 184 | 22.3% |
| Communications | 0 | 0.0% |
| Arts & Humanities | 0 | 0.0% |
| Total | 826 | 100.0% |
Transportation & Commute in Borrego Springs
Vehicle Availability by Sex in Borrego Springs
The most prevalent vehicle ownership categories in Borrego Springs are males with 2 vehicles (203, accounting for 40.1%) and females with 2 vehicles (460, making up 31.7%).
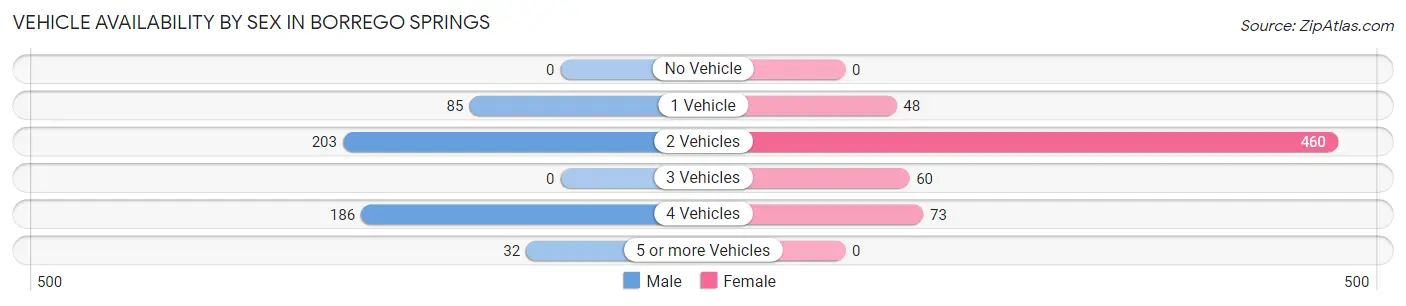
| Vehicles Available | Male | Female |
| No Vehicle | 0 (0.0%) | 0 (0.0%) |
| 1 Vehicle | 85 (16.8%) | 48 (7.5%) |
| 2 Vehicles | 203 (40.1%) | 460 (71.8%) |
| 3 Vehicles | 0 (0.0%) | 60 (9.4%) |
| 4 Vehicles | 186 (36.8%) | 73 (11.4%) |
| 5 or more Vehicles | 32 (6.3%) | 0 (0.0%) |
| Total | 506 (100.0%) | 641 (100.0%) |
Commute Time in Borrego Springs
The most frequently occuring commute durations in Borrego Springs are 10 to 14 minutes (484 commuters, 58.5%), 20 to 24 minutes (160 commuters, 19.4%), and 90 or more minutes (96 commuters, 11.6%).
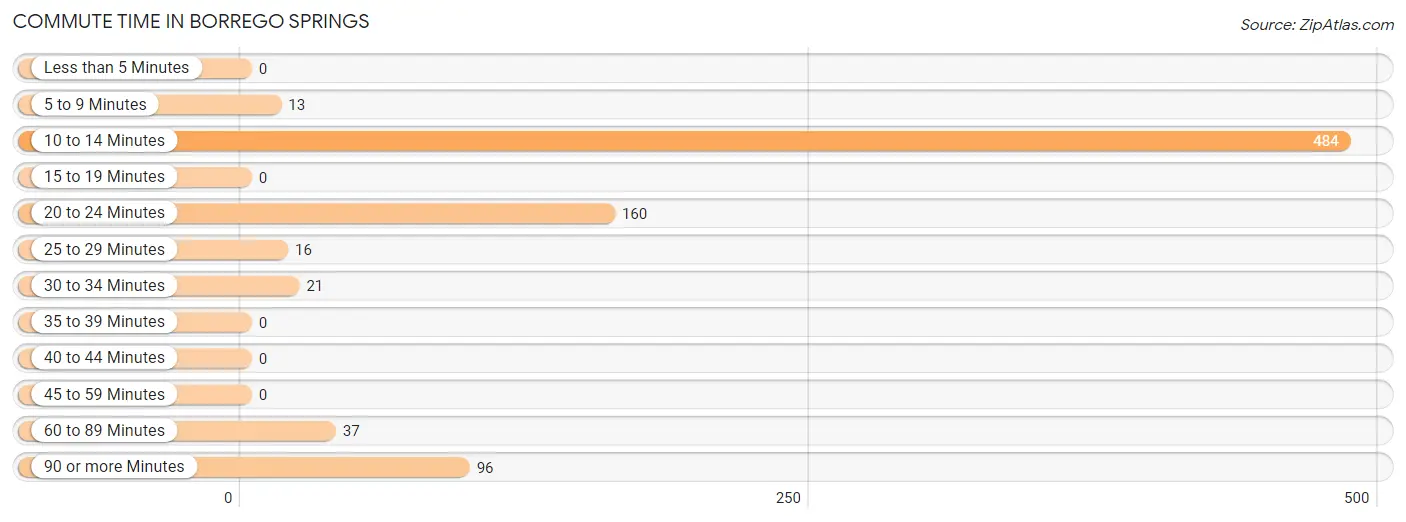
| Commute Time | # Commuters | % Commuters |
| Less than 5 Minutes | 0 | 0.0% |
| 5 to 9 Minutes | 13 | 1.6% |
| 10 to 14 Minutes | 484 | 58.5% |
| 15 to 19 Minutes | 0 | 0.0% |
| 20 to 24 Minutes | 160 | 19.4% |
| 25 to 29 Minutes | 16 | 1.9% |
| 30 to 34 Minutes | 21 | 2.5% |
| 35 to 39 Minutes | 0 | 0.0% |
| 40 to 44 Minutes | 0 | 0.0% |
| 45 to 59 Minutes | 0 | 0.0% |
| 60 to 89 Minutes | 37 | 4.5% |
| 90 or more Minutes | 96 | 11.6% |
Commute Time by Sex in Borrego Springs
The most common commute times in Borrego Springs are 10 to 14 minutes (187 commuters, 40.0%) for males and 10 to 14 minutes (297 commuters, 82.5%) for females.
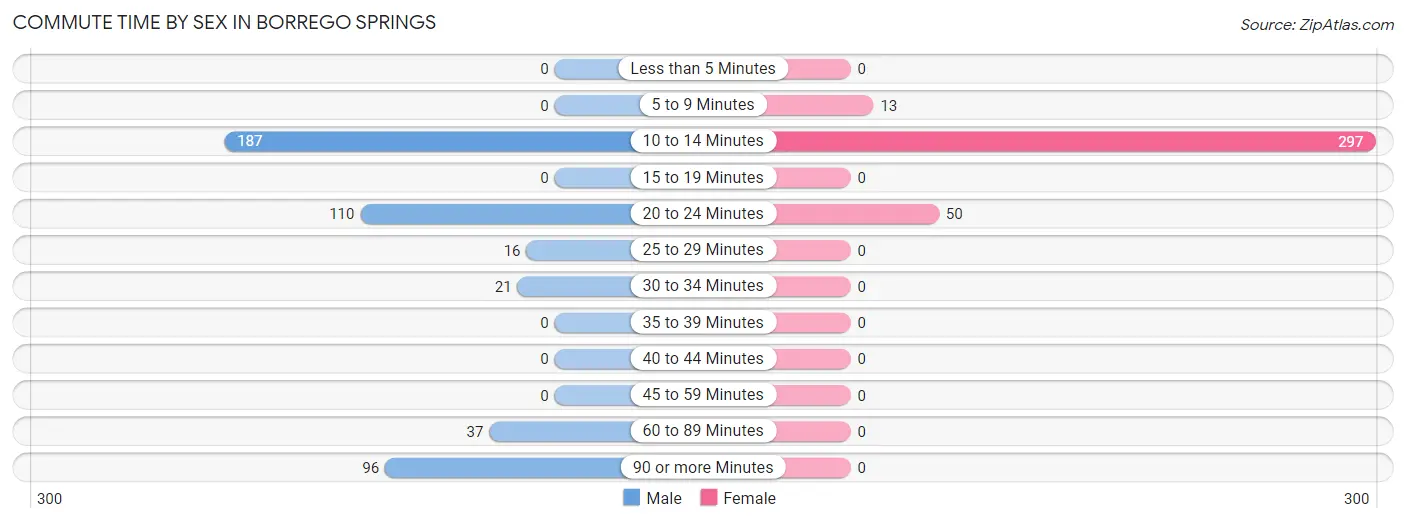
| Commute Time | Male | Female |
| Less than 5 Minutes | 0 (0.0%) | 0 (0.0%) |
| 5 to 9 Minutes | 0 (0.0%) | 13 (3.6%) |
| 10 to 14 Minutes | 187 (40.0%) | 297 (82.5%) |
| 15 to 19 Minutes | 0 (0.0%) | 0 (0.0%) |
| 20 to 24 Minutes | 110 (23.5%) | 50 (13.9%) |
| 25 to 29 Minutes | 16 (3.4%) | 0 (0.0%) |
| 30 to 34 Minutes | 21 (4.5%) | 0 (0.0%) |
| 35 to 39 Minutes | 0 (0.0%) | 0 (0.0%) |
| 40 to 44 Minutes | 0 (0.0%) | 0 (0.0%) |
| 45 to 59 Minutes | 0 (0.0%) | 0 (0.0%) |
| 60 to 89 Minutes | 37 (7.9%) | 0 (0.0%) |
| 90 or more Minutes | 96 (20.6%) | 0 (0.0%) |
Time of Departure to Work by Sex in Borrego Springs
The most frequent times of departure to work in Borrego Springs are 7:00 AM to 7:29 AM (133, 28.5%) for males and 8:00 AM to 8:29 AM (166, 46.1%) for females.
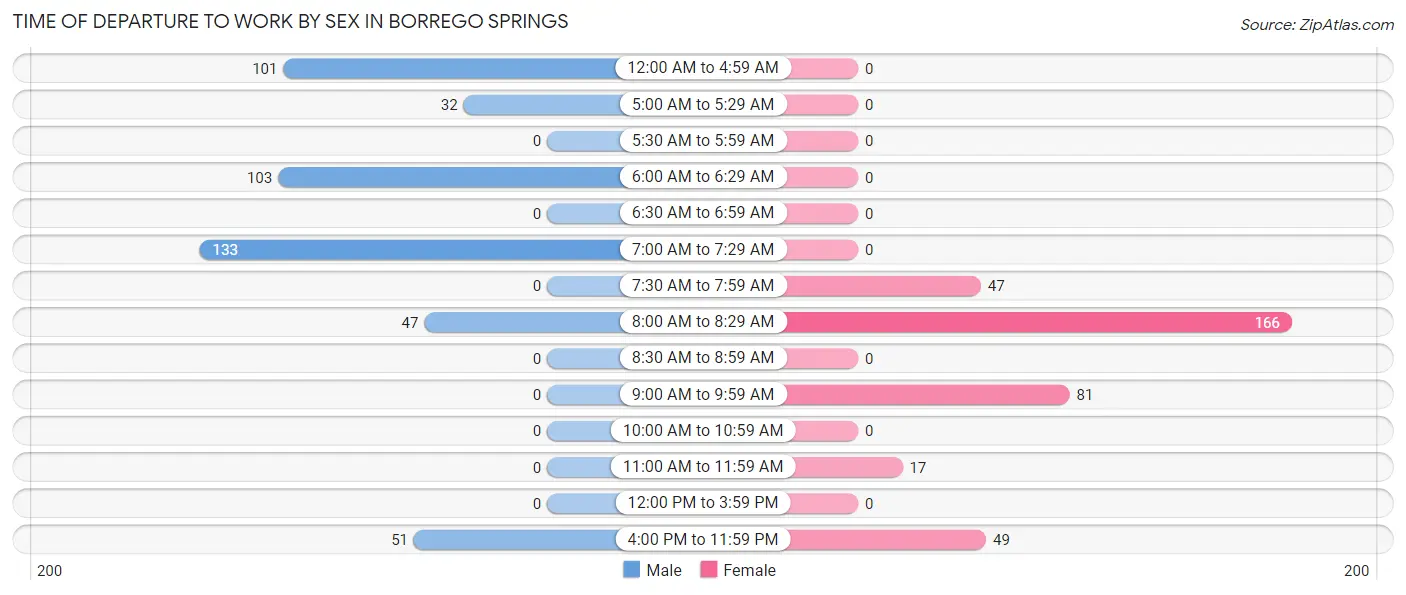
| Time of Departure | Male | Female |
| 12:00 AM to 4:59 AM | 101 (21.6%) | 0 (0.0%) |
| 5:00 AM to 5:29 AM | 32 (6.9%) | 0 (0.0%) |
| 5:30 AM to 5:59 AM | 0 (0.0%) | 0 (0.0%) |
| 6:00 AM to 6:29 AM | 103 (22.1%) | 0 (0.0%) |
| 6:30 AM to 6:59 AM | 0 (0.0%) | 0 (0.0%) |
| 7:00 AM to 7:29 AM | 133 (28.5%) | 0 (0.0%) |
| 7:30 AM to 7:59 AM | 0 (0.0%) | 47 (13.1%) |
| 8:00 AM to 8:29 AM | 47 (10.1%) | 166 (46.1%) |
| 8:30 AM to 8:59 AM | 0 (0.0%) | 0 (0.0%) |
| 9:00 AM to 9:59 AM | 0 (0.0%) | 81 (22.5%) |
| 10:00 AM to 10:59 AM | 0 (0.0%) | 0 (0.0%) |
| 11:00 AM to 11:59 AM | 0 (0.0%) | 17 (4.7%) |
| 12:00 PM to 3:59 PM | 0 (0.0%) | 0 (0.0%) |
| 4:00 PM to 11:59 PM | 51 (10.9%) | 49 (13.6%) |
| Total | 467 (100.0%) | 360 (100.0%) |
Housing Occupancy in Borrego Springs
Occupancy by Ownership in Borrego Springs
Of the total 1,397 dwellings in Borrego Springs, owner-occupied units account for 1,097 (78.5%), while renter-occupied units make up 300 (21.5%).
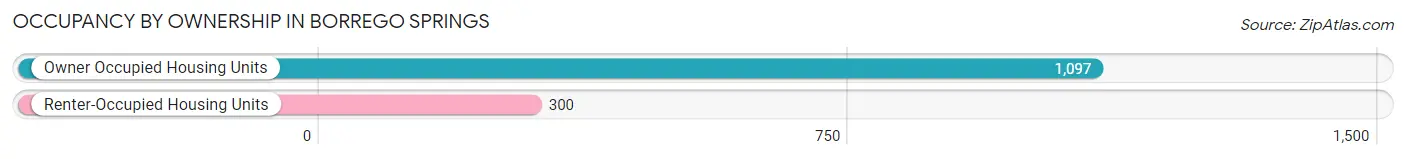
| Occupancy | # Housing Units | % Housing Units |
| Owner Occupied Housing Units | 1,097 | 78.5% |
| Renter-Occupied Housing Units | 300 | 21.5% |
| Total Occupied Housing Units | 1,397 | 100.0% |
Occupancy by Household Size in Borrego Springs
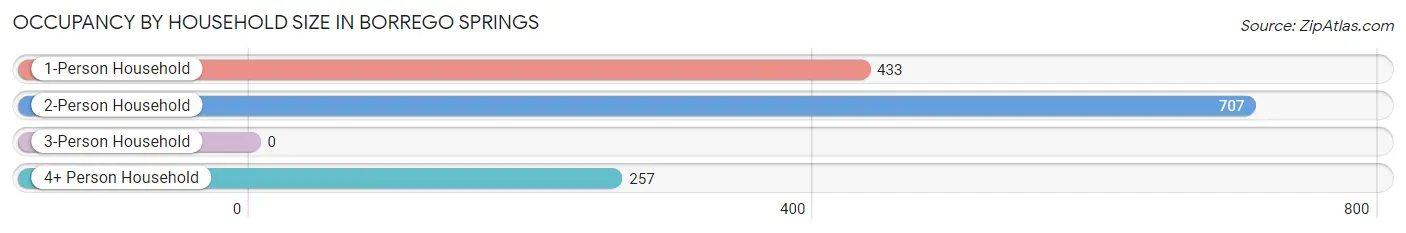
| Household Size | # Housing Units | % Housing Units |
| 1-Person Household | 433 | 31.0% |
| 2-Person Household | 707 | 50.6% |
| 3-Person Household | 0 | 0.0% |
| 4+ Person Household | 257 | 18.4% |
| Total Housing Units | 1,397 | 100.0% |
Occupancy by Ownership by Household Size in Borrego Springs
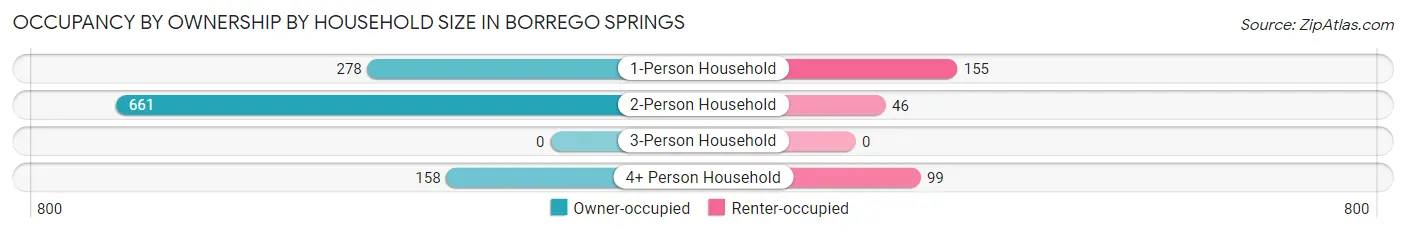
| Household Size | Owner-occupied | Renter-occupied |
| 1-Person Household | 278 (64.2%) | 155 (35.8%) |
| 2-Person Household | 661 (93.5%) | 46 (6.5%) |
| 3-Person Household | 0 (0.0%) | 0 (0.0%) |
| 4+ Person Household | 158 (61.5%) | 99 (38.5%) |
| Total Housing Units | 1,097 (78.5%) | 300 (21.5%) |
Occupancy by Educational Attainment in Borrego Springs
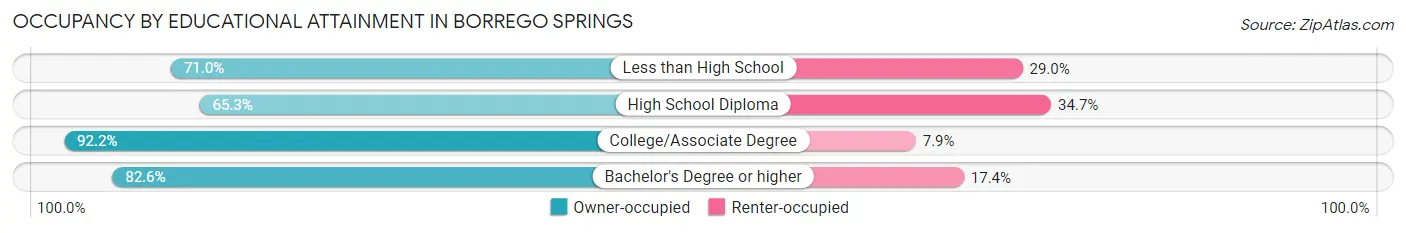
| Household Size | Owner-occupied | Renter-occupied |
| Less than High School | 137 (71.0%) | 56 (29.0%) |
| High School Diploma | 273 (65.3%) | 145 (34.7%) |
| College/Associate Degree | 364 (92.1%) | 31 (7.9%) |
| Bachelor's Degree or higher | 323 (82.6%) | 68 (17.4%) |
Occupancy by Age of Householder in Borrego Springs
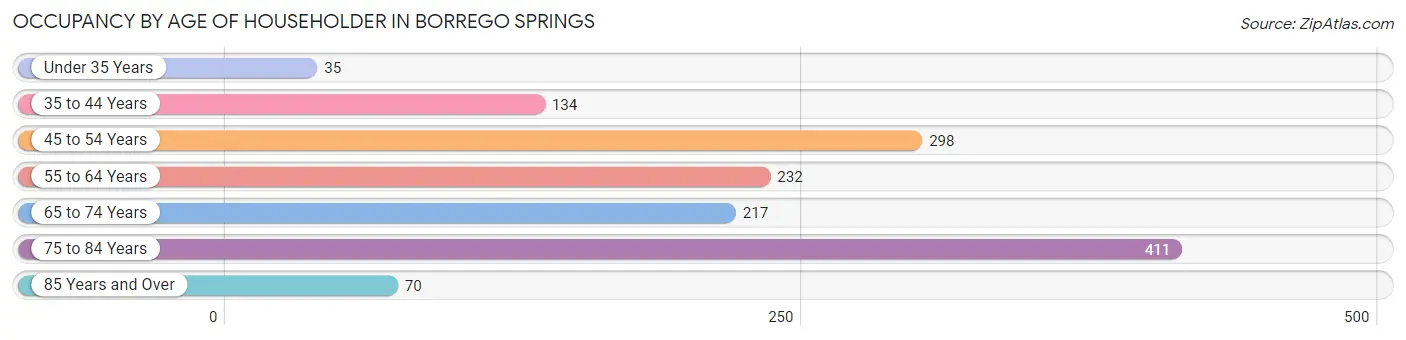
| Age Bracket | # Households | % Households |
| Under 35 Years | 35 | 2.5% |
| 35 to 44 Years | 134 | 9.6% |
| 45 to 54 Years | 298 | 21.3% |
| 55 to 64 Years | 232 | 16.6% |
| 65 to 74 Years | 217 | 15.5% |
| 75 to 84 Years | 411 | 29.4% |
| 85 Years and Over | 70 | 5.0% |
| Total | 1,397 | 100.0% |
Housing Finances in Borrego Springs
Median Income by Occupancy in Borrego Springs
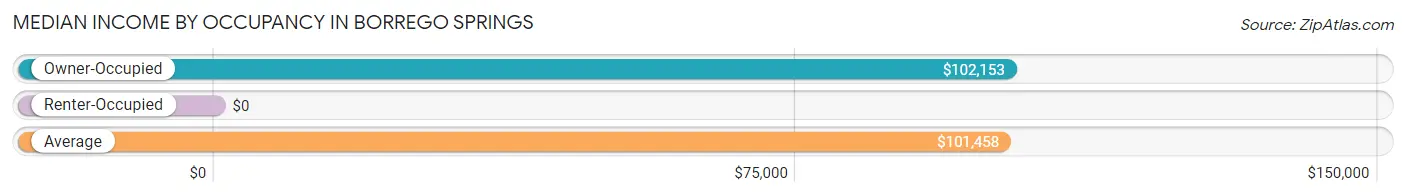
| Occupancy Type | # Households | Median Income |
| Owner-Occupied | 1,097 (78.5%) | $102,153 |
| Renter-Occupied | 300 (21.5%) | $0 |
| Average | 1,397 (100.0%) | $101,458 |
Occupancy by Householder Income Bracket in Borrego Springs
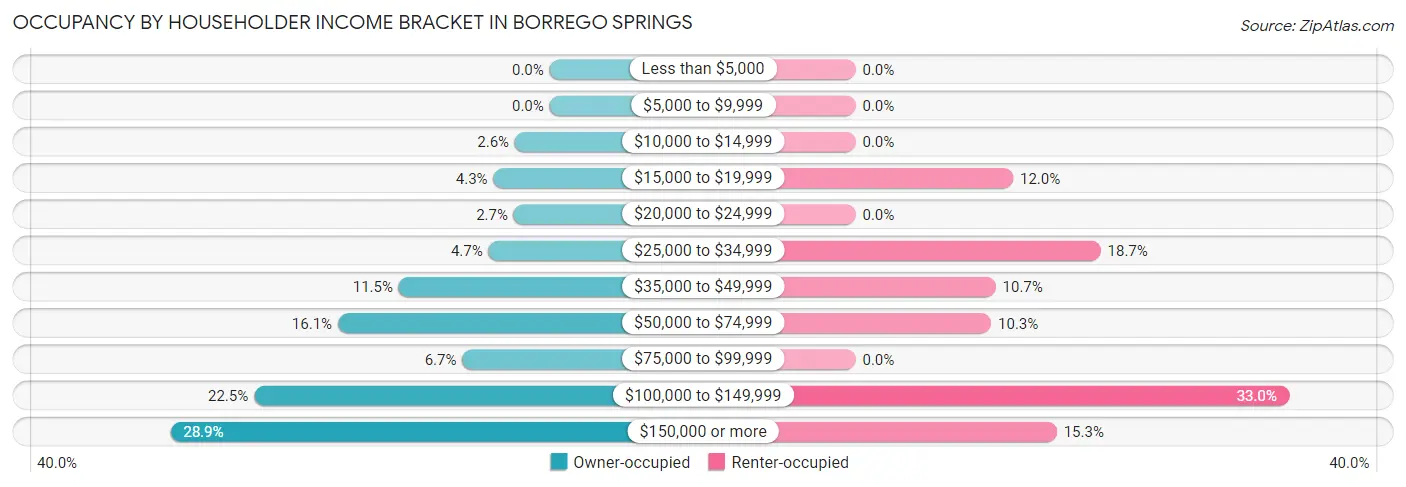
| Income Bracket | Owner-occupied | Renter-occupied |
| Less than $5,000 | 0 (0.0%) | 0 (0.0%) |
| $5,000 to $9,999 | 0 (0.0%) | 0 (0.0%) |
| $10,000 to $14,999 | 29 (2.6%) | 0 (0.0%) |
| $15,000 to $19,999 | 47 (4.3%) | 36 (12.0%) |
| $20,000 to $24,999 | 30 (2.7%) | 0 (0.0%) |
| $25,000 to $34,999 | 51 (4.6%) | 56 (18.7%) |
| $35,000 to $49,999 | 126 (11.5%) | 32 (10.7%) |
| $50,000 to $74,999 | 177 (16.1%) | 31 (10.3%) |
| $75,000 to $99,999 | 73 (6.7%) | 0 (0.0%) |
| $100,000 to $149,999 | 247 (22.5%) | 99 (33.0%) |
| $150,000 or more | 317 (28.9%) | 46 (15.3%) |
| Total | 1,097 (100.0%) | 300 (100.0%) |
Monthly Housing Cost Tiers in Borrego Springs
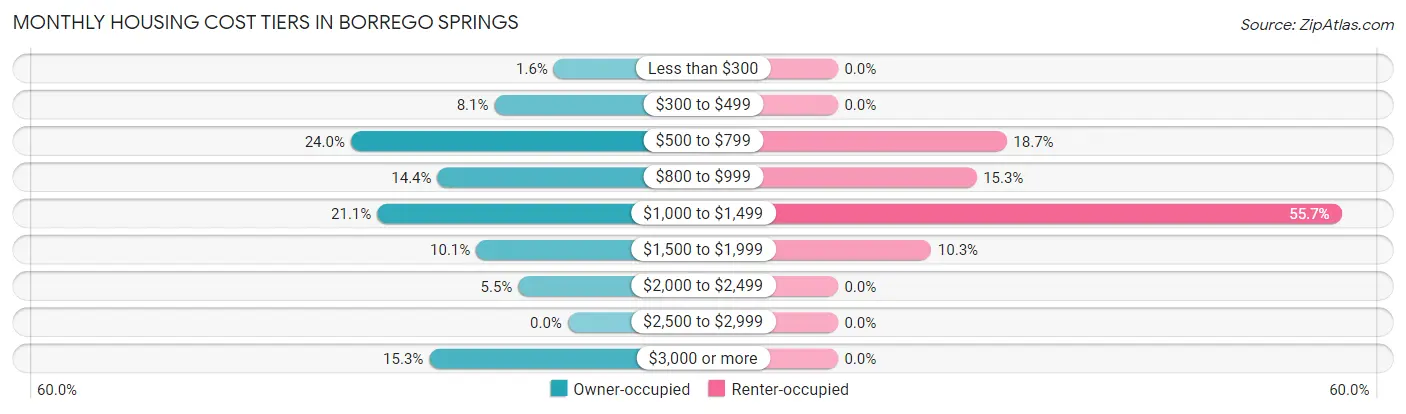
| Monthly Cost | Owner-occupied | Renter-occupied |
| Less than $300 | 17 (1.5%) | 0 (0.0%) |
| $300 to $499 | 89 (8.1%) | 0 (0.0%) |
| $500 to $799 | 263 (24.0%) | 56 (18.7%) |
| $800 to $999 | 158 (14.4%) | 46 (15.3%) |
| $1,000 to $1,499 | 231 (21.1%) | 167 (55.7%) |
| $1,500 to $1,999 | 111 (10.1%) | 31 (10.3%) |
| $2,000 to $2,499 | 60 (5.5%) | 0 (0.0%) |
| $2,500 to $2,999 | 0 (0.0%) | 0 (0.0%) |
| $3,000 or more | 168 (15.3%) | 0 (0.0%) |
| Total | 1,097 (100.0%) | 300 (100.0%) |
Physical Housing Characteristics in Borrego Springs
Housing Structures in Borrego Springs
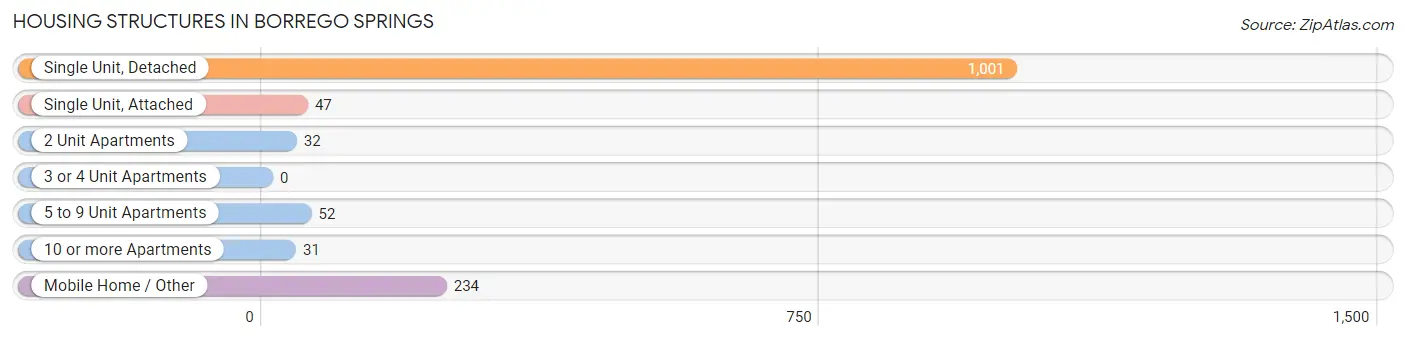
| Structure Type | # Housing Units | % Housing Units |
| Single Unit, Detached | 1,001 | 71.7% |
| Single Unit, Attached | 47 | 3.4% |
| 2 Unit Apartments | 32 | 2.3% |
| 3 or 4 Unit Apartments | 0 | 0.0% |
| 5 to 9 Unit Apartments | 52 | 3.7% |
| 10 or more Apartments | 31 | 2.2% |
| Mobile Home / Other | 234 | 16.8% |
| Total | 1,397 | 100.0% |
Housing Structures by Occupancy in Borrego Springs
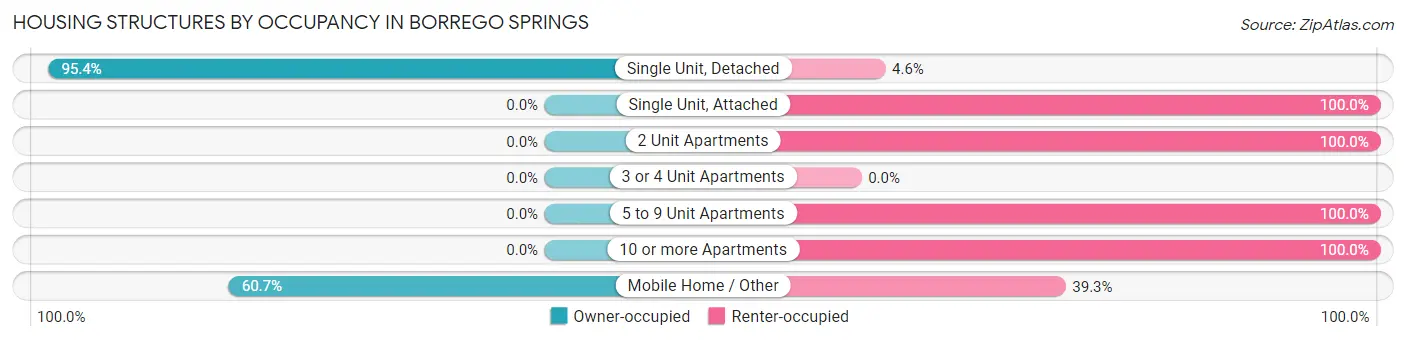
| Structure Type | Owner-occupied | Renter-occupied |
| Single Unit, Detached | 955 (95.4%) | 46 (4.6%) |
| Single Unit, Attached | 0 (0.0%) | 47 (100.0%) |
| 2 Unit Apartments | 0 (0.0%) | 32 (100.0%) |
| 3 or 4 Unit Apartments | 0 (0.0%) | 0 (0.0%) |
| 5 to 9 Unit Apartments | 0 (0.0%) | 52 (100.0%) |
| 10 or more Apartments | 0 (0.0%) | 31 (100.0%) |
| Mobile Home / Other | 142 (60.7%) | 92 (39.3%) |
| Total | 1,097 (78.5%) | 300 (21.5%) |
Housing Structures by Number of Rooms in Borrego Springs
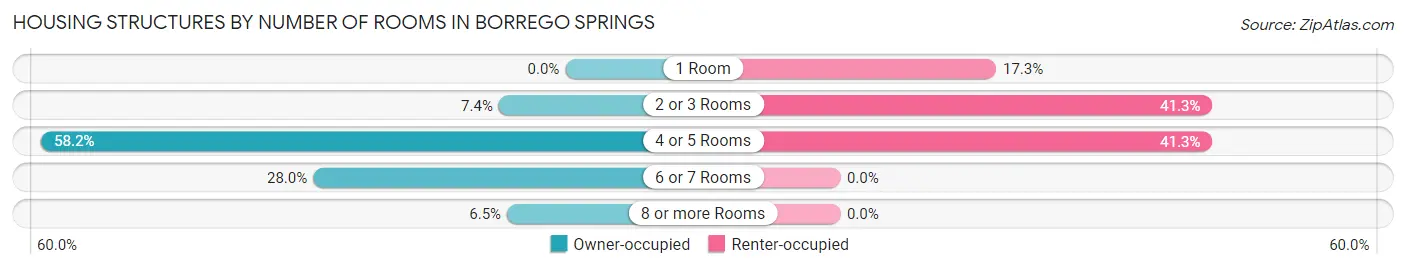
| Number of Rooms | Owner-occupied | Renter-occupied |
| 1 Room | 0 (0.0%) | 52 (17.3%) |
| 2 or 3 Rooms | 81 (7.4%) | 124 (41.3%) |
| 4 or 5 Rooms | 638 (58.2%) | 124 (41.3%) |
| 6 or 7 Rooms | 307 (28.0%) | 0 (0.0%) |
| 8 or more Rooms | 71 (6.5%) | 0 (0.0%) |
| Total | 1,097 (100.0%) | 300 (100.0%) |
Housing Structure by Heating Type in Borrego Springs
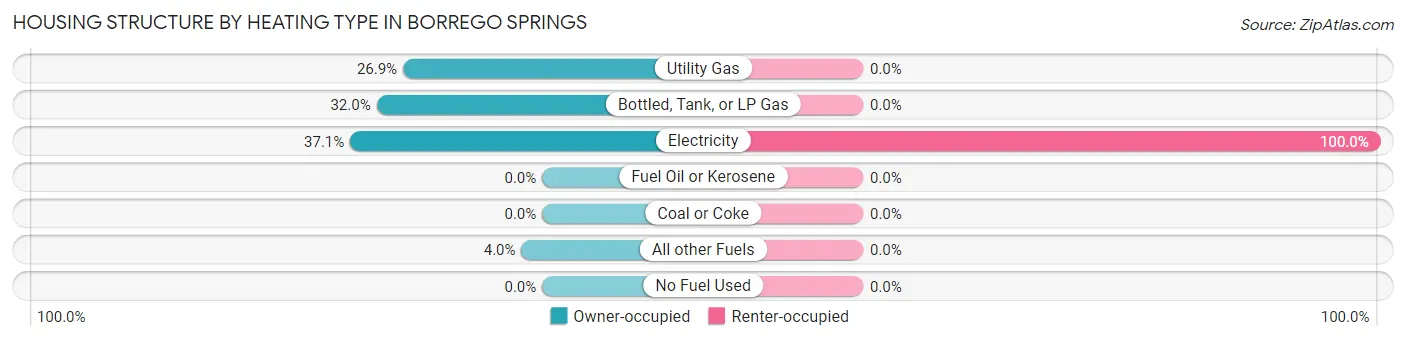
| Heating Type | Owner-occupied | Renter-occupied |
| Utility Gas | 295 (26.9%) | 0 (0.0%) |
| Bottled, Tank, or LP Gas | 351 (32.0%) | 0 (0.0%) |
| Electricity | 407 (37.1%) | 300 (100.0%) |
| Fuel Oil or Kerosene | 0 (0.0%) | 0 (0.0%) |
| Coal or Coke | 0 (0.0%) | 0 (0.0%) |
| All other Fuels | 44 (4.0%) | 0 (0.0%) |
| No Fuel Used | 0 (0.0%) | 0 (0.0%) |
| Total | 1,097 (100.0%) | 300 (100.0%) |
Household Vehicle Usage in Borrego Springs
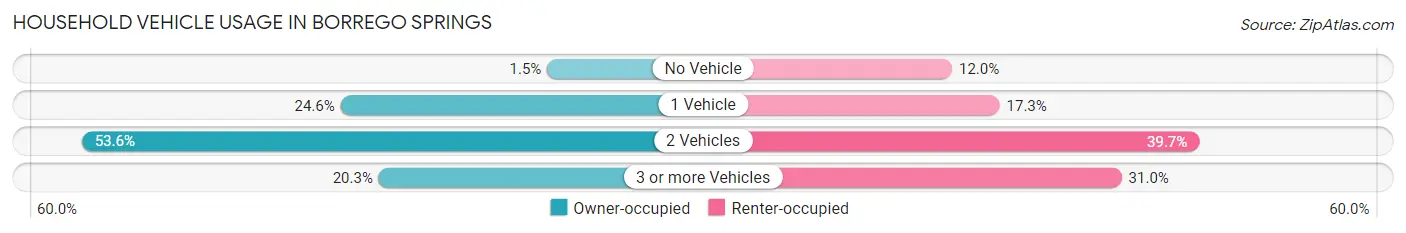
| Vehicles per Household | Owner-occupied | Renter-occupied |
| No Vehicle | 16 (1.5%) | 36 (12.0%) |
| 1 Vehicle | 270 (24.6%) | 52 (17.3%) |
| 2 Vehicles | 588 (53.6%) | 119 (39.7%) |
| 3 or more Vehicles | 223 (20.3%) | 93 (31.0%) |
| Total | 1,097 (100.0%) | 300 (100.0%) |
Real Estate & Mortgages in Borrego Springs
Real Estate and Mortgage Overview in Borrego Springs
| Characteristic | Without Mortgage | With Mortgage |
| Housing Units | 592 | 505 |
| Median Property Value | $478,100 | $0 |
| Median Household Income | $81,838 | $196 |
| Monthly Housing Costs | $765 | $168 |
| Real Estate Taxes | $2,082 | $0 |
Property Value by Mortgage Status in Borrego Springs
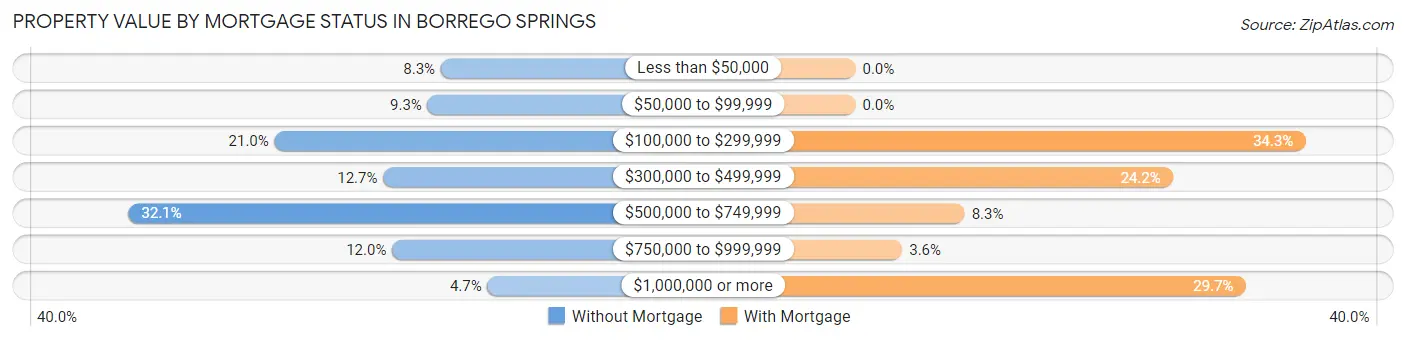
| Property Value | Without Mortgage | With Mortgage |
| Less than $50,000 | 49 (8.3%) | 0 (0.0%) |
| $50,000 to $99,999 | 55 (9.3%) | 0 (0.0%) |
| $100,000 to $299,999 | 124 (20.9%) | 173 (34.3%) |
| $300,000 to $499,999 | 75 (12.7%) | 122 (24.2%) |
| $500,000 to $749,999 | 190 (32.1%) | 42 (8.3%) |
| $750,000 to $999,999 | 71 (12.0%) | 18 (3.6%) |
| $1,000,000 or more | 28 (4.7%) | 150 (29.7%) |
| Total | 592 (100.0%) | 505 (100.0%) |
Household Income by Mortgage Status in Borrego Springs
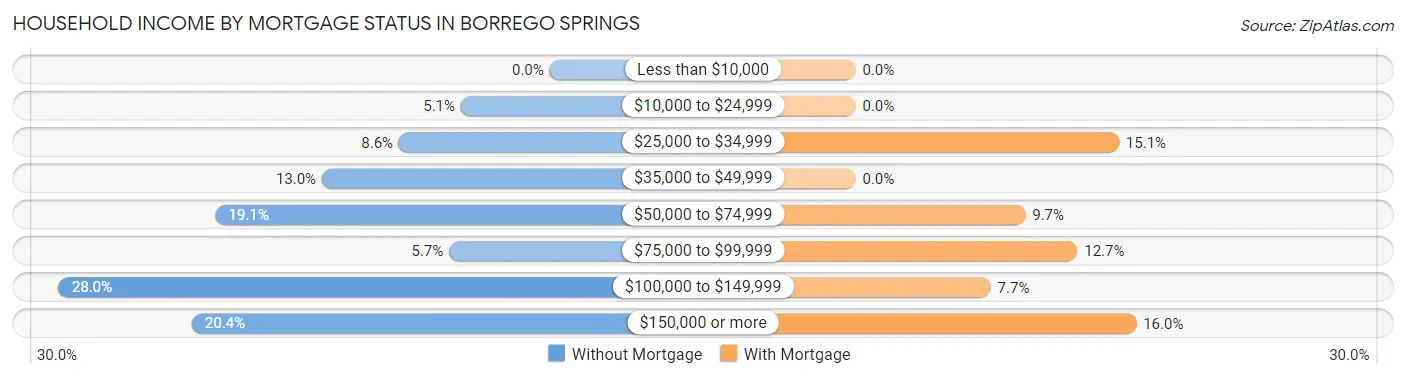
| Household Income | Without Mortgage | With Mortgage |
| Less than $10,000 | 0 (0.0%) | 0 (0.0%) |
| $10,000 to $24,999 | 30 (5.1%) | 0 (0.0%) |
| $25,000 to $34,999 | 51 (8.6%) | 76 (15.0%) |
| $35,000 to $49,999 | 77 (13.0%) | 0 (0.0%) |
| $50,000 to $74,999 | 113 (19.1%) | 49 (9.7%) |
| $75,000 to $99,999 | 34 (5.7%) | 64 (12.7%) |
| $100,000 to $149,999 | 166 (28.0%) | 39 (7.7%) |
| $150,000 or more | 121 (20.4%) | 81 (16.0%) |
| Total | 592 (100.0%) | 505 (100.0%) |
Property Value to Household Income Ratio in Borrego Springs
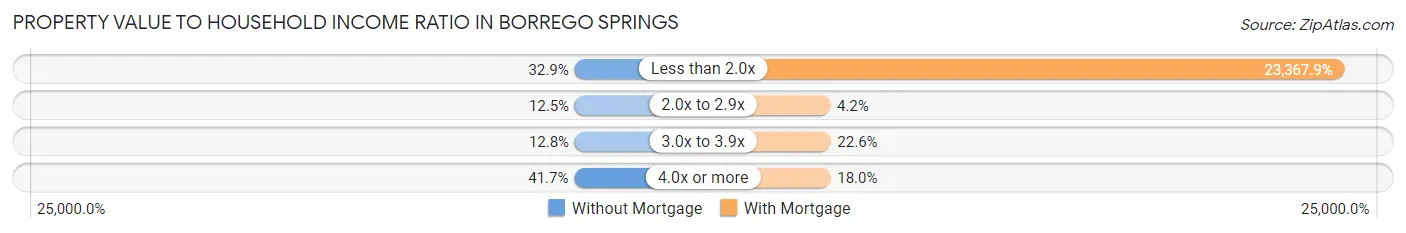
| Value-to-Income Ratio | Without Mortgage | With Mortgage |
| Less than 2.0x | 195 (32.9%) | 118,008 (23,367.9%) |
| 2.0x to 2.9x | 74 (12.5%) | 21 (4.2%) |
| 3.0x to 3.9x | 76 (12.8%) | 114 (22.6%) |
| 4.0x or more | 247 (41.7%) | 91 (18.0%) |
| Total | 592 (100.0%) | 505 (100.0%) |
Real Estate Taxes by Mortgage Status in Borrego Springs
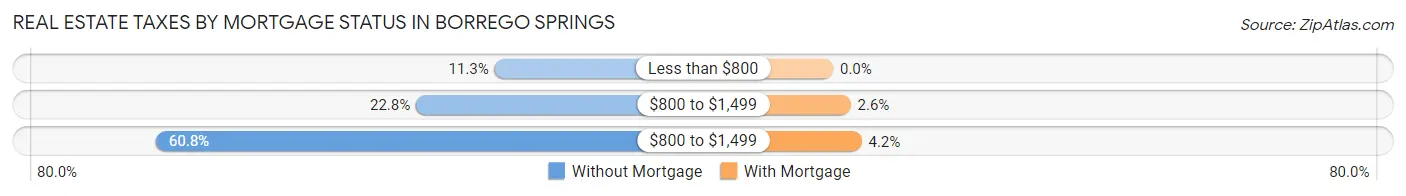
| Property Taxes | Without Mortgage | With Mortgage |
| Less than $800 | 67 (11.3%) | 0 (0.0%) |
| $800 to $1,499 | 135 (22.8%) | 13 (2.6%) |
| $800 to $1,499 | 360 (60.8%) | 21 (4.2%) |
| Total | 592 (100.0%) | 505 (100.0%) |
Health & Disability in Borrego Springs
Health Insurance Coverage by Age in Borrego Springs
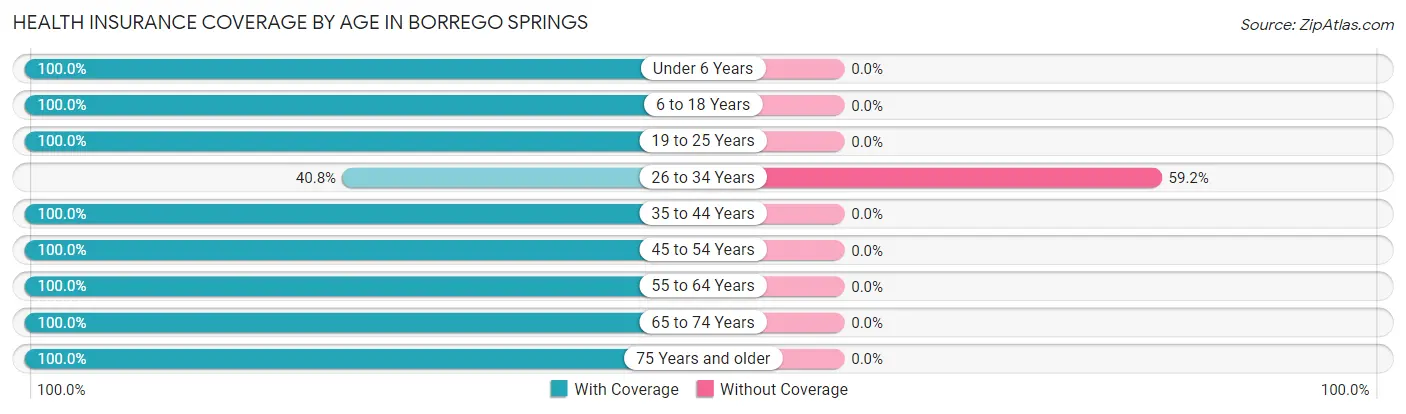
| Age Bracket | With Coverage | Without Coverage |
| Under 6 Years | 170 (100.0%) | 0 (0.0%) |
| 6 to 18 Years | 224 (100.0%) | 0 (0.0%) |
| 19 to 25 Years | 87 (100.0%) | 0 (0.0%) |
| 26 to 34 Years | 69 (40.8%) | 100 (59.2%) |
| 35 to 44 Years | 274 (100.0%) | 0 (0.0%) |
| 45 to 54 Years | 334 (100.0%) | 0 (0.0%) |
| 55 to 64 Years | 481 (100.0%) | 0 (0.0%) |
| 65 to 74 Years | 400 (100.0%) | 0 (0.0%) |
| 75 Years and older | 806 (100.0%) | 0 (0.0%) |
| Total | 2,845 (96.6%) | 100 (3.4%) |
Health Insurance Coverage by Citizenship Status in Borrego Springs
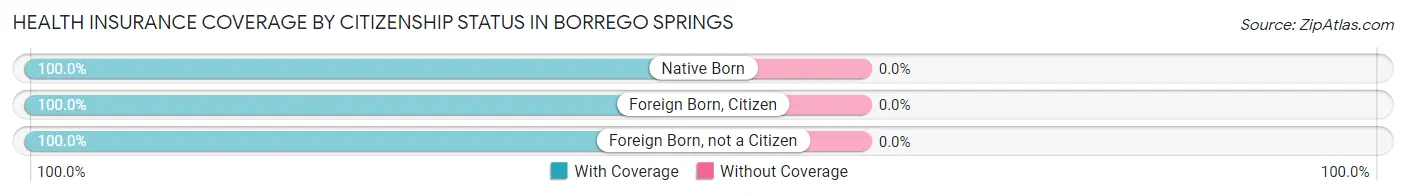
| Citizenship Status | With Coverage | Without Coverage |
| Native Born | 170 (100.0%) | 0 (0.0%) |
| Foreign Born, Citizen | 224 (100.0%) | 0 (0.0%) |
| Foreign Born, not a Citizen | 87 (100.0%) | 0 (0.0%) |
Health Insurance Coverage by Household Income in Borrego Springs
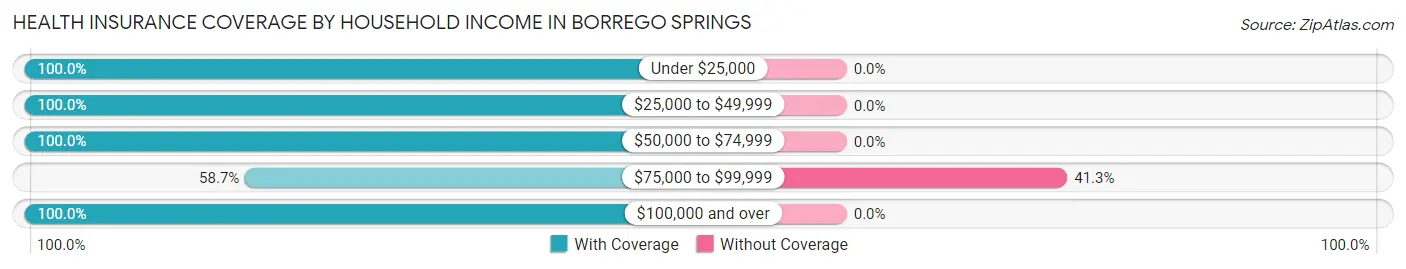
| Household Income | With Coverage | Without Coverage |
| Under $25,000 | 191 (100.0%) | 0 (0.0%) |
| $25,000 to $49,999 | 638 (100.0%) | 0 (0.0%) |
| $50,000 to $74,999 | 286 (100.0%) | 0 (0.0%) |
| $75,000 to $99,999 | 142 (58.7%) | 100 (41.3%) |
| $100,000 and over | 1,588 (100.0%) | 0 (0.0%) |
Public vs Private Health Insurance Coverage by Age in Borrego Springs
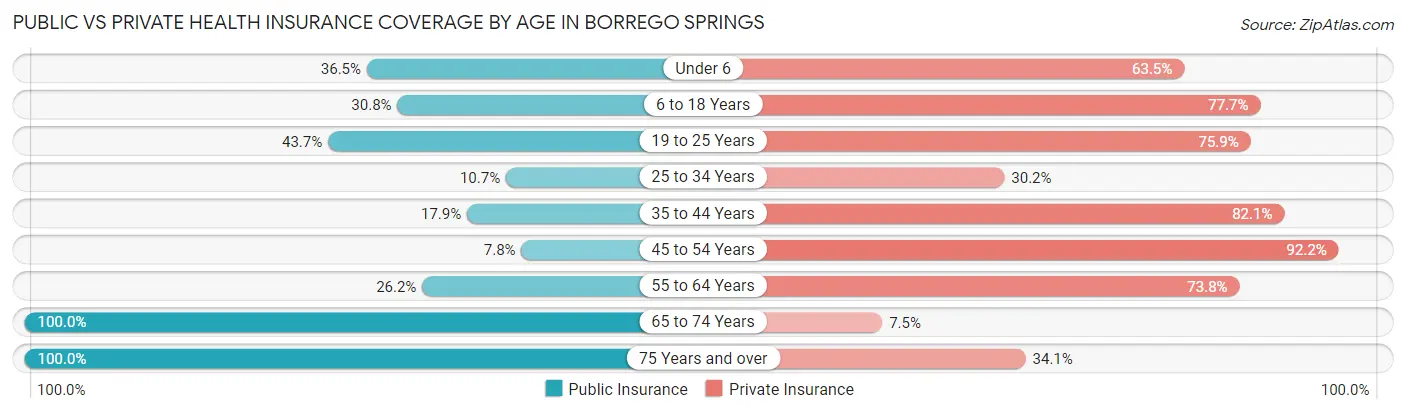
| Age Bracket | Public Insurance | Private Insurance |
| Under 6 | 62 (36.5%) | 108 (63.5%) |
| 6 to 18 Years | 69 (30.8%) | 174 (77.7%) |
| 19 to 25 Years | 38 (43.7%) | 66 (75.9%) |
| 25 to 34 Years | 18 (10.6%) | 51 (30.2%) |
| 35 to 44 Years | 49 (17.9%) | 225 (82.1%) |
| 45 to 54 Years | 26 (7.8%) | 308 (92.2%) |
| 55 to 64 Years | 126 (26.2%) | 355 (73.8%) |
| 65 to 74 Years | 400 (100.0%) | 30 (7.5%) |
| 75 Years and over | 806 (100.0%) | 275 (34.1%) |
| Total | 1,594 (54.1%) | 1,592 (54.1%) |
Disability Status by Sex by Age in Borrego Springs
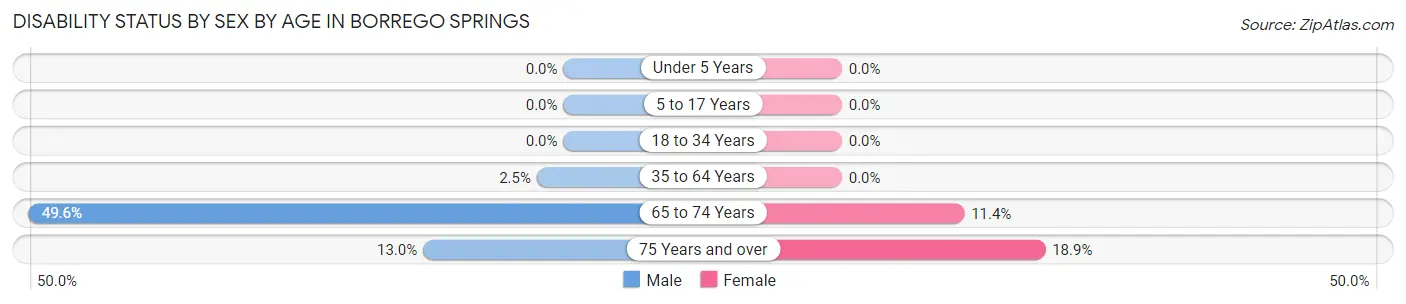
| Age Bracket | Male | Female |
| Under 5 Years | 0 (0.0%) | 0 (0.0%) |
| 5 to 17 Years | 0 (0.0%) | 0 (0.0%) |
| 18 to 34 Years | 0 (0.0%) | 0 (0.0%) |
| 35 to 64 Years | 13 (2.5%) | 0 (0.0%) |
| 65 to 74 Years | 63 (49.6%) | 31 (11.4%) |
| 75 Years and over | 47 (13.0%) | 84 (18.9%) |
Disability Class by Sex by Age in Borrego Springs
Disability Class: Hearing Difficulty
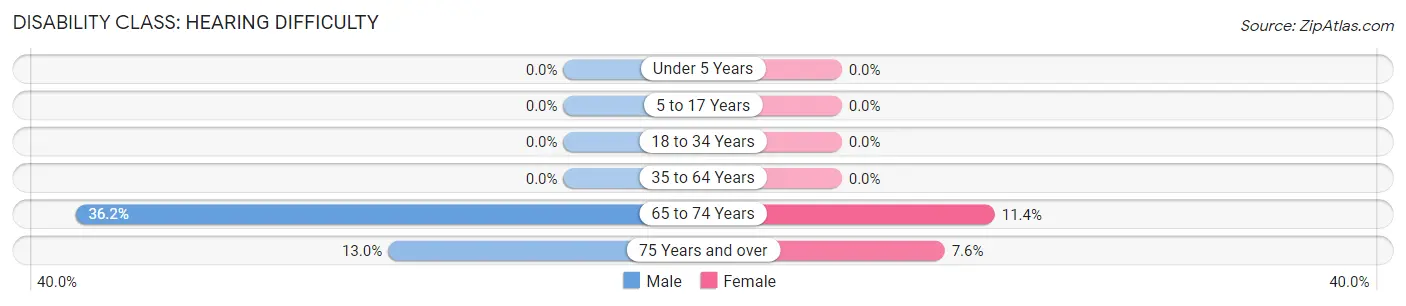
| Age Bracket | Male | Female |
| Under 5 Years | 0 (0.0%) | 0 (0.0%) |
| 5 to 17 Years | 0 (0.0%) | 0 (0.0%) |
| 18 to 34 Years | 0 (0.0%) | 0 (0.0%) |
| 35 to 64 Years | 0 (0.0%) | 0 (0.0%) |
| 65 to 74 Years | 46 (36.2%) | 31 (11.4%) |
| 75 Years and over | 47 (13.0%) | 34 (7.6%) |
Disability Class: Vision Difficulty
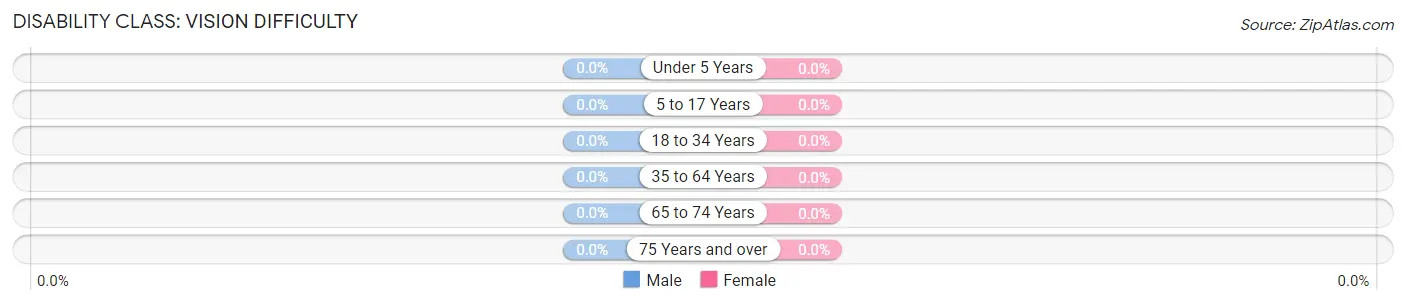
| Age Bracket | Male | Female |
| Under 5 Years | 0 (0.0%) | 0 (0.0%) |
| 5 to 17 Years | 0 (0.0%) | 0 (0.0%) |
| 18 to 34 Years | 0 (0.0%) | 0 (0.0%) |
| 35 to 64 Years | 0 (0.0%) | 0 (0.0%) |
| 65 to 74 Years | 0 (0.0%) | 0 (0.0%) |
| 75 Years and over | 0 (0.0%) | 0 (0.0%) |
Disability Class: Cognitive Difficulty
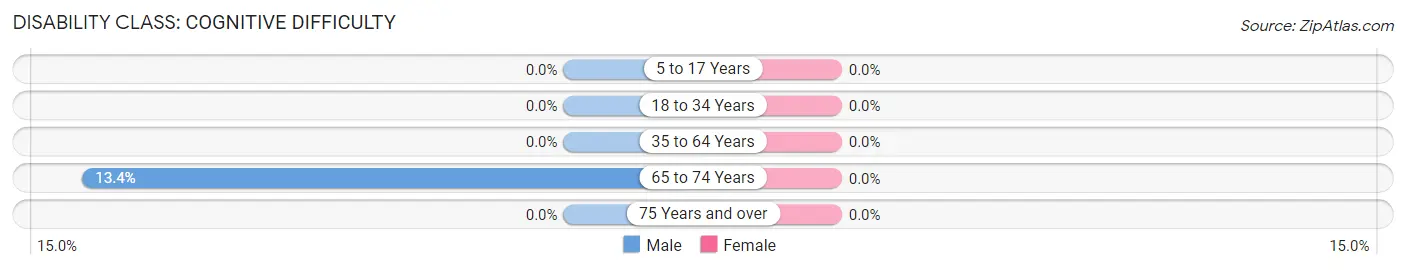
| Age Bracket | Male | Female |
| 5 to 17 Years | 0 (0.0%) | 0 (0.0%) |
| 18 to 34 Years | 0 (0.0%) | 0 (0.0%) |
| 35 to 64 Years | 0 (0.0%) | 0 (0.0%) |
| 65 to 74 Years | 17 (13.4%) | 0 (0.0%) |
| 75 Years and over | 0 (0.0%) | 0 (0.0%) |
Disability Class: Ambulatory Difficulty
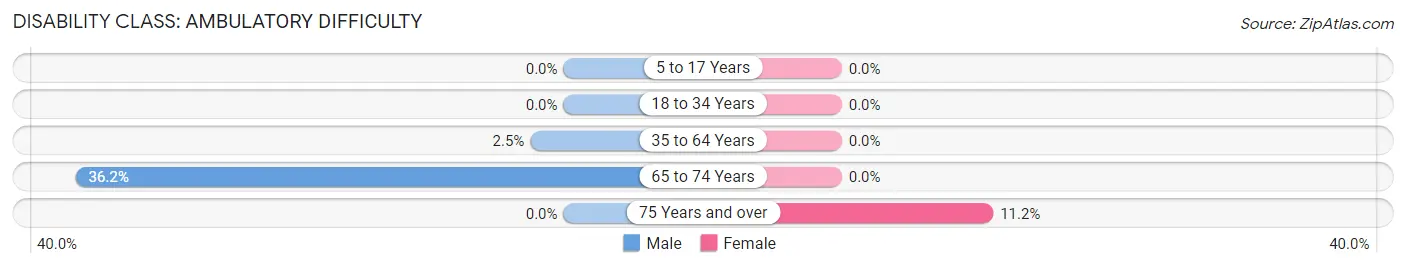
| Age Bracket | Male | Female |
| 5 to 17 Years | 0 (0.0%) | 0 (0.0%) |
| 18 to 34 Years | 0 (0.0%) | 0 (0.0%) |
| 35 to 64 Years | 13 (2.5%) | 0 (0.0%) |
| 65 to 74 Years | 46 (36.2%) | 0 (0.0%) |
| 75 Years and over | 0 (0.0%) | 50 (11.2%) |
Disability Class: Self-Care Difficulty
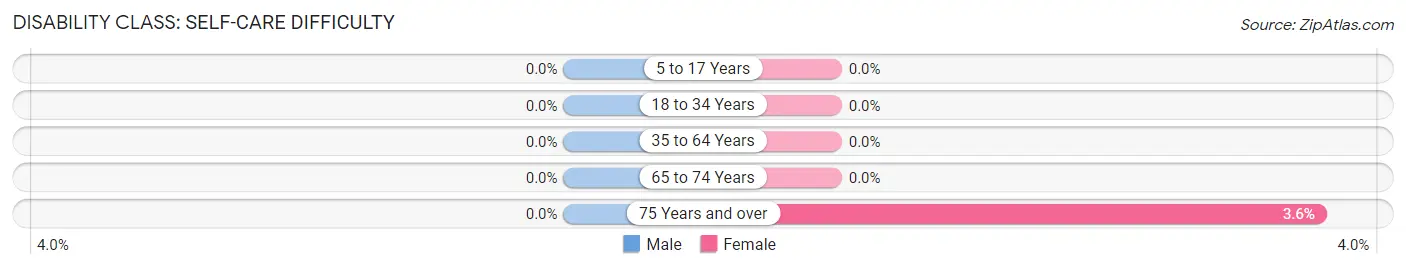
| Age Bracket | Male | Female |
| 5 to 17 Years | 0 (0.0%) | 0 (0.0%) |
| 18 to 34 Years | 0 (0.0%) | 0 (0.0%) |
| 35 to 64 Years | 0 (0.0%) | 0 (0.0%) |
| 65 to 74 Years | 0 (0.0%) | 0 (0.0%) |
| 75 Years and over | 0 (0.0%) | 16 (3.6%) |
Technology Access in Borrego Springs
Computing Device Access in Borrego Springs
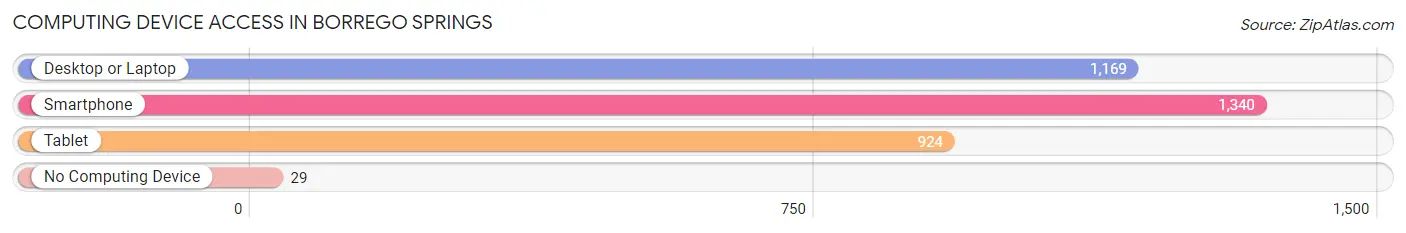
| Device Type | # Households | % Households |
| Desktop or Laptop | 1,169 | 83.7% |
| Smartphone | 1,340 | 95.9% |
| Tablet | 924 | 66.1% |
| No Computing Device | 29 | 2.1% |
| Total | 1,397 | 100.0% |
Internet Access in Borrego Springs
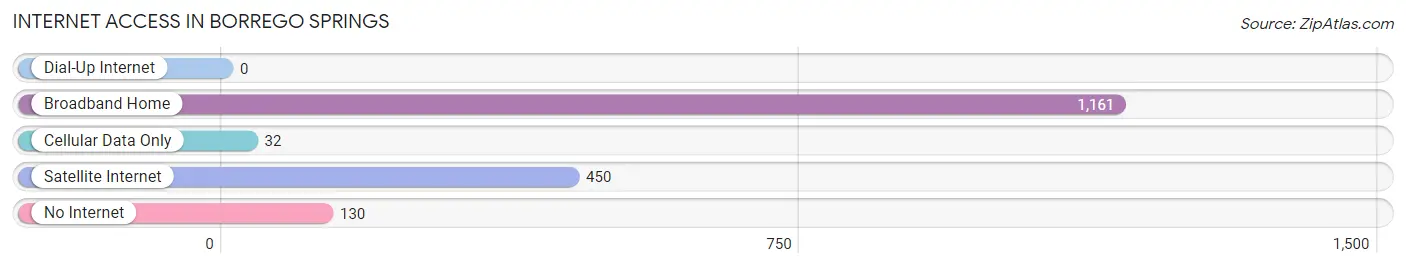
| Internet Type | # Households | % Households |
| Dial-Up Internet | 0 | 0.0% |
| Broadband Home | 1,161 | 83.1% |
| Cellular Data Only | 32 | 2.3% |
| Satellite Internet | 450 | 32.2% |
| No Internet | 130 | 9.3% |
| Total | 1,397 | 100.0% |
Borrego Springs Summary
Borrego Springs is a small unincorporated community located in the Borrego Valley of San Diego County, California. It is situated in the middle of the Anza-Borrego Desert State Park, the largest desert state park in the United States. The town is surrounded by the Santa Rosa Mountains to the west, the San Ysidro Mountains to the east, and the Vallecito Mountains to the north. Borrego Springs is the only incorporated community in the Borrego Valley, and is the largest community in the area.
History
The area now known as Borrego Springs was first inhabited by the Kumeyaay people, who lived in the area for thousands of years. The first European settlers arrived in the area in the late 19th century, and the town was officially founded in 1933 by the Borrego Land Company. The company was formed by a group of investors who wanted to develop the area as a resort destination. The town was named after the Spanish word for bighorn sheep, which were abundant in the area at the time.
The town grew slowly over the next few decades, and by the 1950s it had become a popular destination for tourists and retirees. In the 1960s, the Anza-Borrego Desert State Park was established, and the town began to attract more visitors. In the 1970s, the town was incorporated, and it has since become a popular destination for outdoor recreation and relaxation.
Geography
Borrego Springs is located in the Borrego Valley of San Diego County, California. It is situated in the middle of the Anza-Borrego Desert State Park, the largest desert state park in the United States. The town is surrounded by the Santa Rosa Mountains to the west, the San Ysidro Mountains to the east, and the Vallecito Mountains to the north. The town is located at an elevation of approximately 600 feet (183 meters) above sea level.
The climate in Borrego Springs is hot and dry, with temperatures ranging from the mid-90s in the summer to the mid-60s in the winter. The area receives very little rainfall, with an average of only 4 inches (10 cm) per year.
Economy
The economy of Borrego Springs is largely based on tourism and retirement. The town is a popular destination for outdoor recreation, and it is home to several resorts and golf courses. The town also has a thriving art scene, with several galleries and studios.
The town is also home to several businesses, including restaurants, retail stores, and service providers. The town is also home to a number of government offices, including the Borrego Springs Unified School District and the Anza-Borrego Desert State Park.
Demographics
As of the 2010 census, the population of Borrego Springs was 3,429. The racial makeup of the town was 81.3% White, 0.7% African American, 0.7% Native American, 0.7% Asian, 0.2% Pacific Islander, 14.2% from other races, and 2.2% from two or more races. Hispanic or Latino of any race were 33.2% of the population.
The median household income in Borrego Springs was $41,250, and the median family income was $45,938. The per capita income for the town was $20,945. About 11.2% of families and 14.3% of the population were below the poverty line, including 19.2% of those under age 18 and 8.2% of those age 65 or over.
Common Questions
What is Per Capita Income in Borrego Springs?
Per Capita income in Borrego Springs is $50,699.
What is the Median Family Income in Borrego Springs?
Median Family Income in Borrego Springs is $114,212.
What is the Median Household income in Borrego Springs?
Median Household Income in Borrego Springs is $101,458.
What is Income or Wage Gap in Borrego Springs?
Income or Wage Gap in Borrego Springs is 35.0%.
Women in Borrego Springs earn 65.0 cents for every dollar earned by a man.
What is Inequality or Gini Index in Borrego Springs?
Inequality or Gini Index in Borrego Springs is 0.38.
What is the Total Population of Borrego Springs?
Total Population of Borrego Springs is 2,946.
What is the Total Male Population of Borrego Springs?
Total Male Population of Borrego Springs is 1,263.
What is the Total Female Population of Borrego Springs?
Total Female Population of Borrego Springs is 1,683.
What is the Ratio of Males per 100 Females in Borrego Springs?
There are 75.04 Males per 100 Females in Borrego Springs.
What is the Ratio of Females per 100 Males in Borrego Springs?
There are 133.25 Females per 100 Males in Borrego Springs.
What is the Median Population Age in Borrego Springs?
Median Population Age in Borrego Springs is 58.8 Years.
What is the Average Family Size in Borrego Springs
Average Family Size in Borrego Springs is 2.5 People.
What is the Average Household Size in Borrego Springs
Average Household Size in Borrego Springs is 2.1 People.
How Large is the Labor Force in Borrego Springs?
There are 1,258 People in the Labor Forcein in Borrego Springs.
What is the Percentage of People in the Labor Force in Borrego Springs?
48.0% of People are in the Labor Force in Borrego Springs.
What is the Unemployment Rate in Borrego Springs?
Unemployment Rate in Borrego Springs is 5.3%.