Boron, CA Map & Demographics
Boron Map
Boron Overview
$28,406
PER CAPITA INCOME
$85,921
AVG FAMILY INCOME
$52,969
AVG HOUSEHOLD INCOME
13.3%
WAGE / INCOME GAP [ % ]
86.7¢/ $1
WAGE / INCOME GAP [ $ ]
$12,194
FAMILY INCOME DEFICIT
0.47
INEQUALITY / GINI INDEX
2,469
TOTAL POPULATION
1,336
MALE POPULATION
1,133
FEMALE POPULATION
117.92
MALES / 100 FEMALES
84.81
FEMALES / 100 MALES
33.7
MEDIAN AGE
3.8
AVG FAMILY SIZE
2.8
AVG HOUSEHOLD SIZE
1,028
LABOR FORCE [ PEOPLE ]
54.5%
PERCENT IN LABOR FORCE
10.9%
UNEMPLOYMENT RATE
Boron Zip Codes
Boron Area Codes
Income in Boron
Income Overview in Boron
Per Capita Income in Boron is $28,406, while median incomes of families and households are $85,921 and $52,969 respectively.
| Characteristic | Number | Measure |
| Per Capita Income | 2,469 | $28,406 |
| Median Family Income | 494 | $85,921 |
| Mean Family Income | 494 | $91,312 |
| Median Household Income | 884 | $52,969 |
| Mean Household Income | 884 | $75,587 |
| Income Deficit | 494 | $12,194 |
| Wage / Income Gap (%) | 2,469 | 13.28% |
| Wage / Income Gap ($) | 2,469 | 86.72¢ per $1 |
| Gini / Inequality Index | 2,469 | 0.47 |
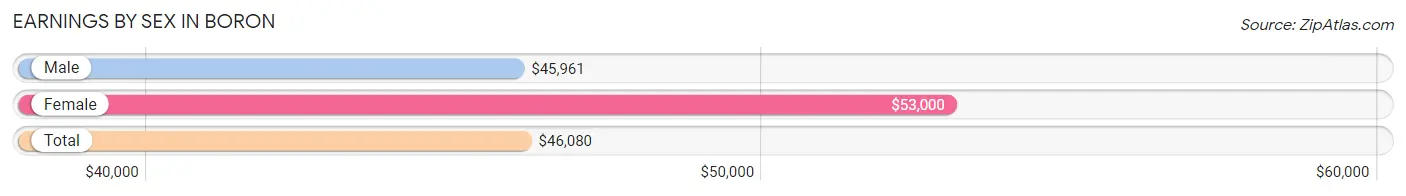
Earnings by Sex in Boron
Average Earnings in Boron are $46,080, $45,961 for men and $53,000 for women, a difference of 13.3%.
| Sex | Number | Average Earnings |
| Male | 627 (61.8%) | $45,961 |
| Female | 388 (38.2%) | $53,000 |
| Total | 1,015 (100.0%) | $46,080 |
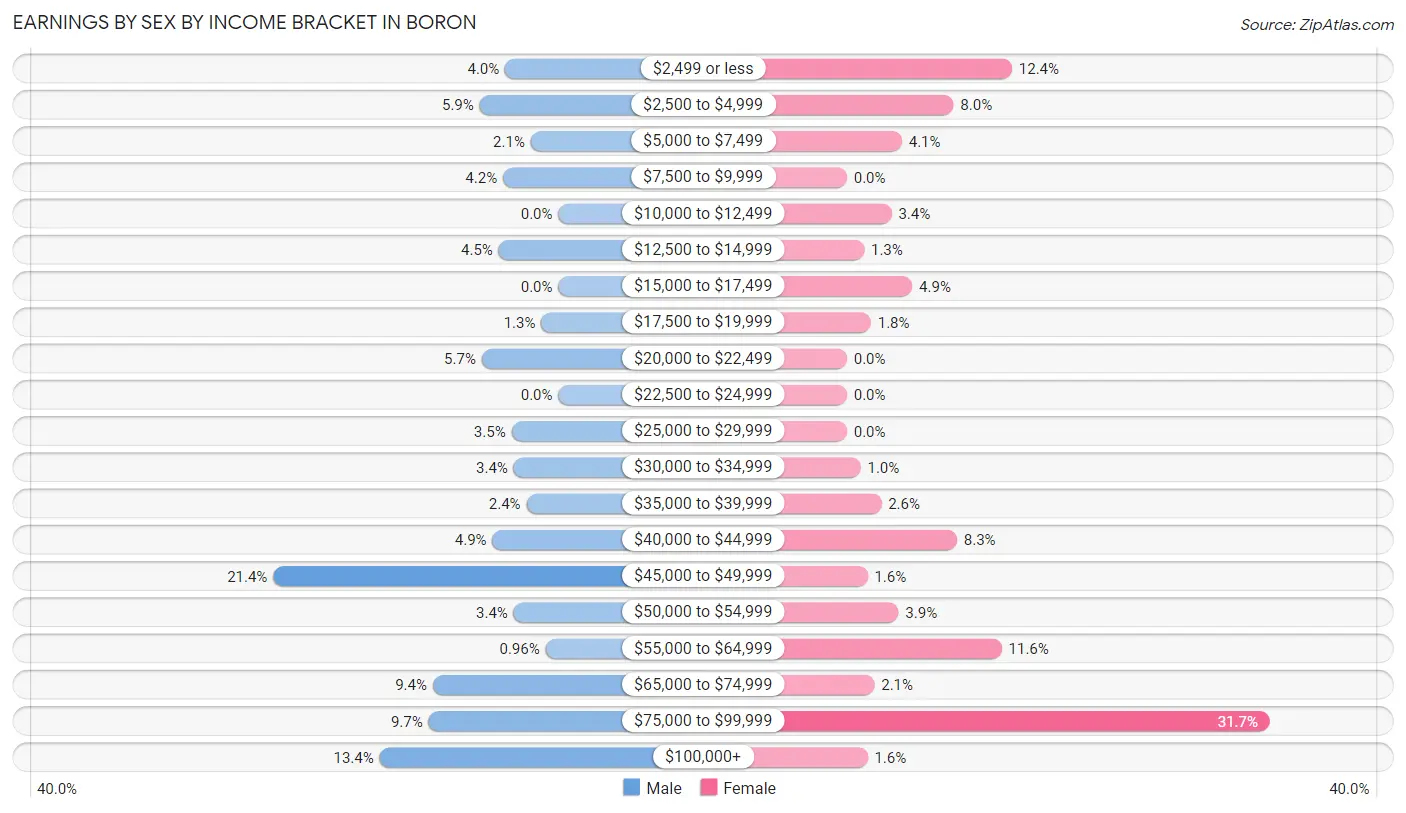
Earnings by Sex by Income Bracket in Boron
The most common earnings brackets in Boron are $45,000 to $49,999 for men (134 | 21.4%) and $75,000 to $99,999 for women (123 | 31.7%).
| Income | Male | Female |
| $2,499 or less | 25 (4.0%) | 48 (12.4%) |
| $2,500 to $4,999 | 37 (5.9%) | 31 (8.0%) |
| $5,000 to $7,499 | 13 (2.1%) | 16 (4.1%) |
| $7,500 to $9,999 | 26 (4.2%) | 0 (0.0%) |
| $10,000 to $12,499 | 0 (0.0%) | 13 (3.4%) |
| $12,500 to $14,999 | 28 (4.5%) | 5 (1.3%) |
| $15,000 to $17,499 | 0 (0.0%) | 19 (4.9%) |
| $17,500 to $19,999 | 8 (1.3%) | 7 (1.8%) |
| $20,000 to $22,499 | 36 (5.7%) | 0 (0.0%) |
| $22,500 to $24,999 | 0 (0.0%) | 0 (0.0%) |
| $25,000 to $29,999 | 22 (3.5%) | 0 (0.0%) |
| $30,000 to $34,999 | 21 (3.4%) | 4 (1.0%) |
| $35,000 to $39,999 | 15 (2.4%) | 10 (2.6%) |
| $40,000 to $44,999 | 31 (4.9%) | 32 (8.3%) |
| $45,000 to $49,999 | 134 (21.4%) | 6 (1.5%) |
| $50,000 to $54,999 | 21 (3.4%) | 15 (3.9%) |
| $55,000 to $64,999 | 6 (1.0%) | 45 (11.6%) |
| $65,000 to $74,999 | 59 (9.4%) | 8 (2.1%) |
| $75,000 to $99,999 | 61 (9.7%) | 123 (31.7%) |
| $100,000+ | 84 (13.4%) | 6 (1.5%) |
| Total | 627 (100.0%) | 388 (100.0%) |
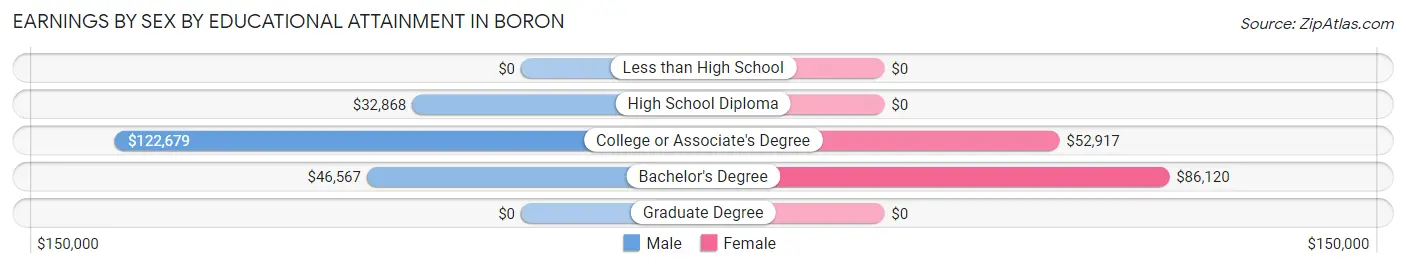
Earnings by Sex by Educational Attainment in Boron
Average earnings in Boron are $46,278 for men and $55,625 for women, a difference of 16.8%. Men with an educational attainment of college or associate's degree enjoy the highest average annual earnings of $122,679, while those with high school diploma education earn the least with $32,868. Women with an educational attainment of bachelor's degree earn the most with the average annual earnings of $86,120, while those with college or associate's degree education have the smallest earnings of $52,917.
| Educational Attainment | Male Income | Female Income |
| Less than High School | - | - |
| High School Diploma | $32,868 | $0 |
| College or Associate's Degree | $122,679 | $52,917 |
| Bachelor's Degree | $46,567 | $86,120 |
| Graduate Degree | - | - |
| Total | $46,278 | $55,625 |
Family Income in Boron
Family Income Brackets in Boron
According to the Boron family income data, there are 104 families falling into the $100,000 to $149,999 income range, which is the most common income bracket and makes up 21.0% of all families. Conversely, the less than $10,000 income bracket is the least frequent group with only 15 families (3.0%) belonging to this category.
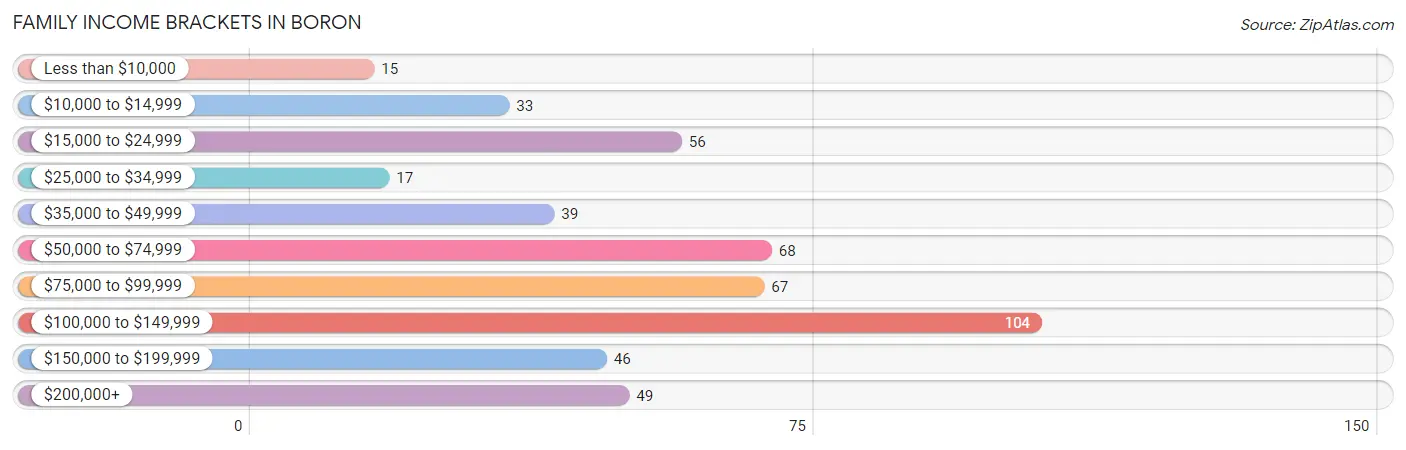
| Income Bracket | # Families | % Families |
| Less than $10,000 | 15 | 3.0% |
| $10,000 to $14,999 | 33 | 6.7% |
| $15,000 to $24,999 | 56 | 11.3% |
| $25,000 to $34,999 | 17 | 3.4% |
| $35,000 to $49,999 | 39 | 7.9% |
| $50,000 to $74,999 | 68 | 13.8% |
| $75,000 to $99,999 | 67 | 13.6% |
| $100,000 to $149,999 | 104 | 21.1% |
| $150,000 to $199,999 | 46 | 9.3% |
| $200,000+ | 49 | 9.9% |
Family Income by Famaliy Size in Boron
3-person families (45 | 9.1%) account for the highest median family income in Boron with $101,161 per family, while 2-person families (227 | 46.0%) have the highest median income of $39,479 per family member.
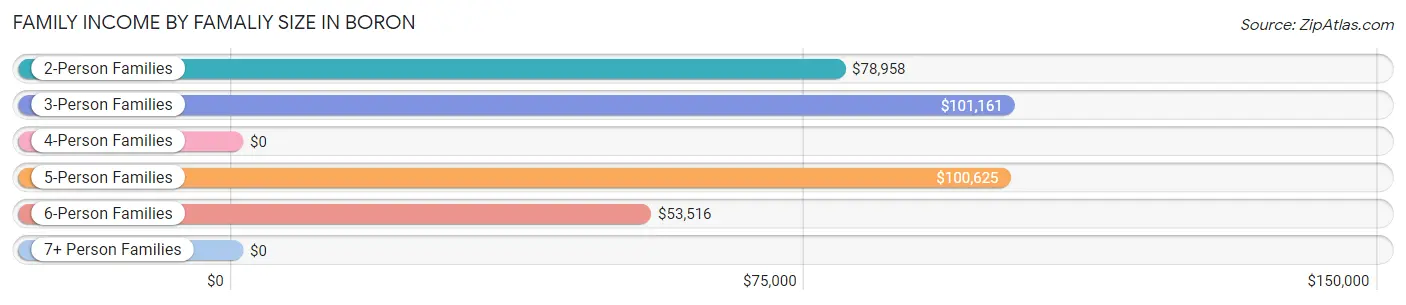
| Income Bracket | # Families | Median Income |
| 2-Person Families | 227 (46.0%) | $78,958 |
| 3-Person Families | 45 (9.1%) | $101,161 |
| 4-Person Families | 61 (12.3%) | $0 |
| 5-Person Families | 108 (21.9%) | $100,625 |
| 6-Person Families | 35 (7.1%) | $53,516 |
| 7+ Person Families | 18 (3.6%) | $0 |
| Total | 494 (100.0%) | $85,921 |
Family Income by Number of Earners in Boron
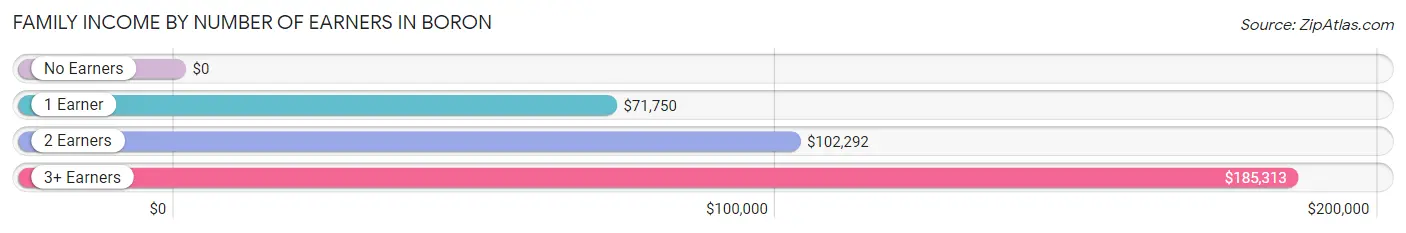
| Number of Earners | # Families | Median Income |
| No Earners | 109 (22.1%) | $0 |
| 1 Earner | 192 (38.9%) | $71,750 |
| 2 Earners | 128 (25.9%) | $102,292 |
| 3+ Earners | 65 (13.2%) | $185,313 |
| Total | 494 (100.0%) | $85,921 |
Household Income in Boron
Household Income Brackets in Boron
With 204 households falling in the category, the $100,000 to $149,999 income range is the most frequent in Boron, accounting for 23.1% of all households. In contrast, only 49 households (5.5%) fall into the $200,000+ income bracket, making it the least populous group.
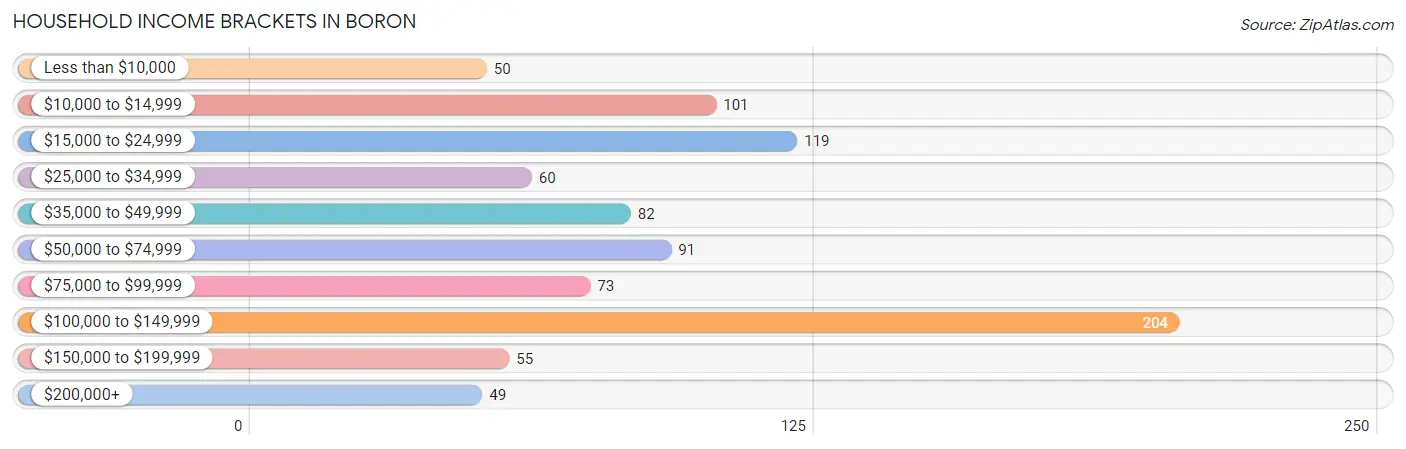
| Income Bracket | # Households | % Households |
| Less than $10,000 | 50 | 5.7% |
| $10,000 to $14,999 | 101 | 11.4% |
| $15,000 to $24,999 | 119 | 13.5% |
| $25,000 to $34,999 | 60 | 6.8% |
| $35,000 to $49,999 | 82 | 9.3% |
| $50,000 to $74,999 | 91 | 10.3% |
| $75,000 to $99,999 | 73 | 8.3% |
| $100,000 to $149,999 | 204 | 23.1% |
| $150,000 to $199,999 | 55 | 6.2% |
| $200,000+ | 49 | 5.5% |
Household Income by Householder Age in Boron
The median household income in Boron is $52,969, with the highest median household income of $92,563 found in the 25 to 44 years age bracket for the primary householder. A total of 297 households (33.6%) fall into this category. Meanwhile, the 15 to 24 years age bracket for the primary householder has the lowest median household income of $0, with 15 households (1.7%) in this group.
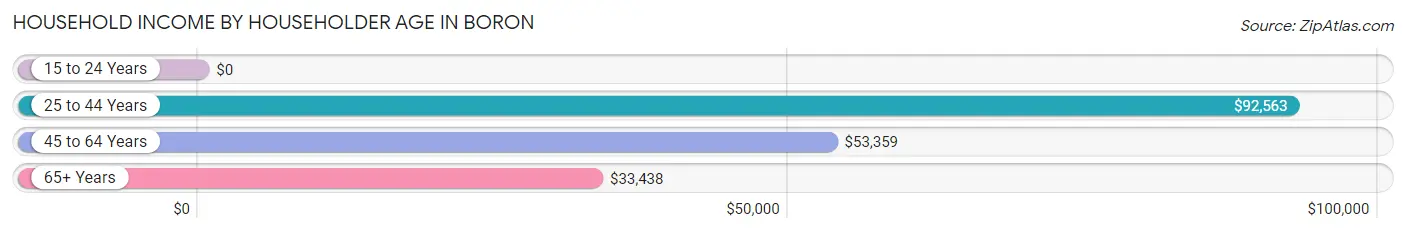
| Income Bracket | # Households | Median Income |
| 15 to 24 Years | 15 (1.7%) | $0 |
| 25 to 44 Years | 297 (33.6%) | $92,563 |
| 45 to 64 Years | 347 (39.3%) | $53,359 |
| 65+ Years | 225 (25.5%) | $33,438 |
| Total | 884 (100.0%) | $52,969 |
Poverty in Boron
Income Below Poverty by Sex and Age in Boron
With 27.0% poverty level for males and 28.1% for females among the residents of Boron, 15 year old males and 5 year old females are the most vulnerable to poverty, with 15 males (100.0%) and 7 females (100.0%) in their respective age groups living below the poverty level.
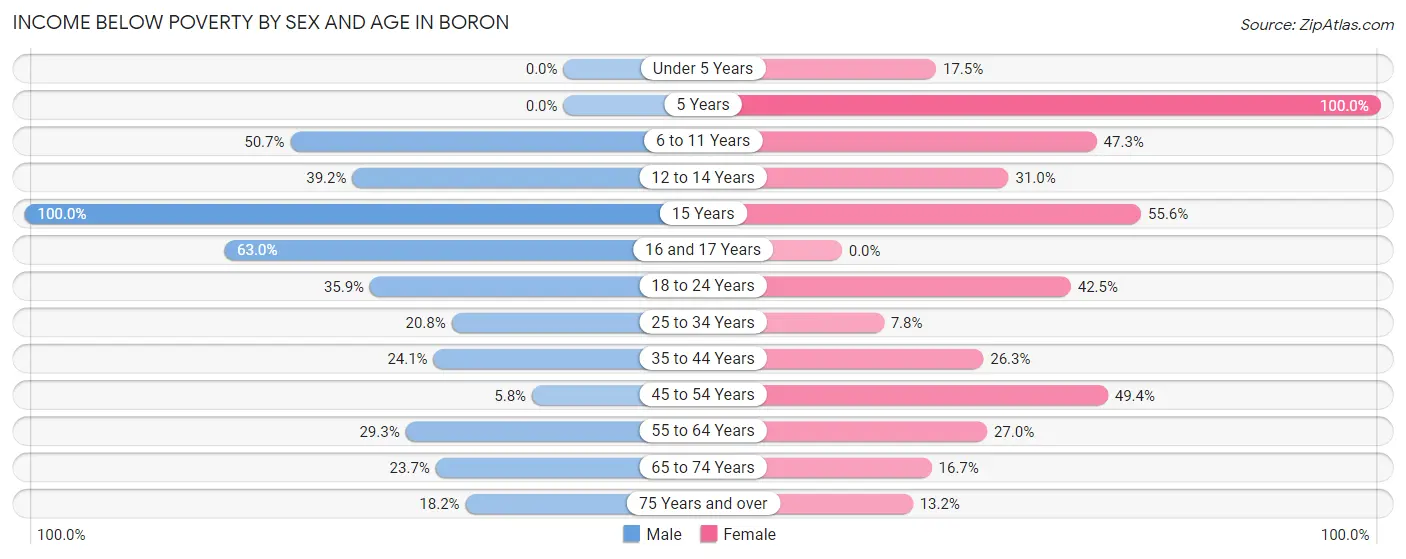
| Age Bracket | Male | Female |
| Under 5 Years | 0 (0.0%) | 14 (17.5%) |
| 5 Years | 0 (0.0%) | 7 (100.0%) |
| 6 to 11 Years | 74 (50.7%) | 44 (47.3%) |
| 12 to 14 Years | 38 (39.2%) | 13 (30.9%) |
| 15 Years | 15 (100.0%) | 15 (55.6%) |
| 16 and 17 Years | 17 (63.0%) | 0 (0.0%) |
| 18 to 24 Years | 28 (35.9%) | 34 (42.5%) |
| 25 to 34 Years | 66 (20.7%) | 13 (7.8%) |
| 35 to 44 Years | 27 (24.1%) | 31 (26.3%) |
| 45 to 54 Years | 7 (5.8%) | 78 (49.4%) |
| 55 to 64 Years | 46 (29.3%) | 45 (27.0%) |
| 65 to 74 Years | 32 (23.7%) | 14 (16.7%) |
| 75 Years and over | 10 (18.2%) | 10 (13.2%) |
| Total | 360 (27.0%) | 318 (28.1%) |
Income Above Poverty by Sex and Age in Boron
According to the poverty statistics in Boron, males aged under 5 years and females aged 16 and 17 years are the age groups that are most secure financially, with 100.0% of males and 100.0% of females in these age groups living above the poverty line.
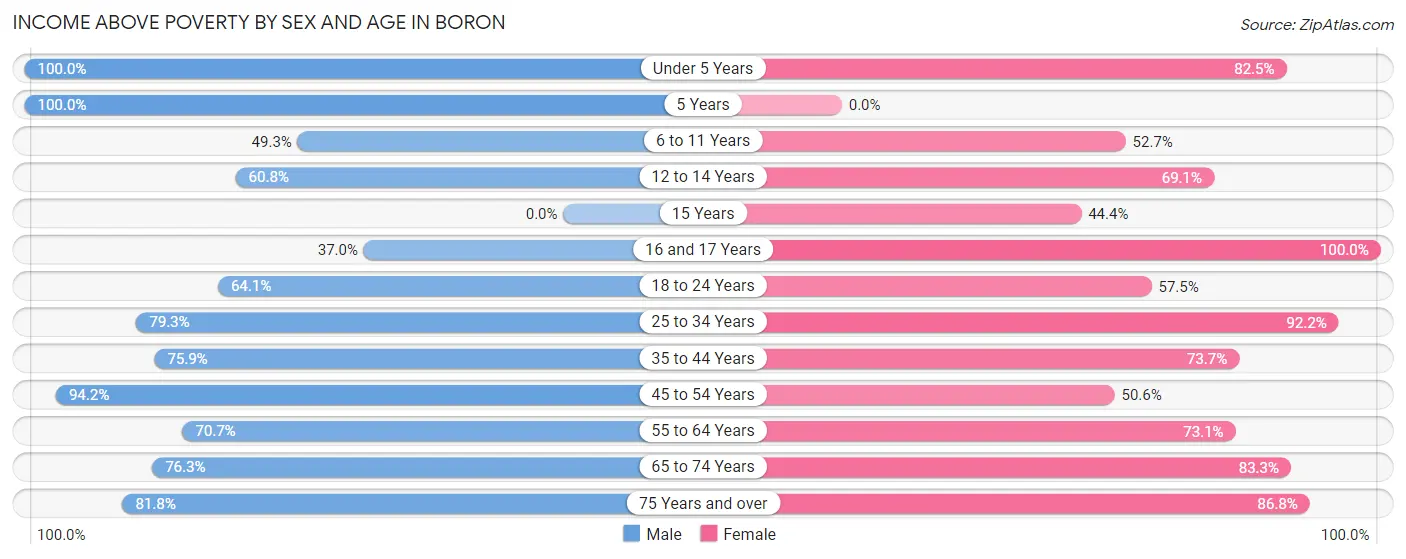
| Age Bracket | Male | Female |
| Under 5 Years | 55 (100.0%) | 66 (82.5%) |
| 5 Years | 21 (100.0%) | 0 (0.0%) |
| 6 to 11 Years | 72 (49.3%) | 49 (52.7%) |
| 12 to 14 Years | 59 (60.8%) | 29 (69.1%) |
| 15 Years | 0 (0.0%) | 12 (44.4%) |
| 16 and 17 Years | 10 (37.0%) | 34 (100.0%) |
| 18 to 24 Years | 50 (64.1%) | 46 (57.5%) |
| 25 to 34 Years | 252 (79.2%) | 154 (92.2%) |
| 35 to 44 Years | 85 (75.9%) | 87 (73.7%) |
| 45 to 54 Years | 113 (94.2%) | 80 (50.6%) |
| 55 to 64 Years | 111 (70.7%) | 122 (73.1%) |
| 65 to 74 Years | 103 (76.3%) | 70 (83.3%) |
| 75 Years and over | 45 (81.8%) | 66 (86.8%) |
| Total | 976 (73.1%) | 815 (71.9%) |
Income Below Poverty Among Married-Couple Families in Boron
The poverty statistics for married-couple families in Boron show that 6.7% or 25 of the total 371 families live below the poverty line. Families with 5 or more children have the highest poverty rate of 100.0%, comprising of 18 families. On the other hand, families with no children have the lowest poverty rate of 0.0%, which includes 0 families.
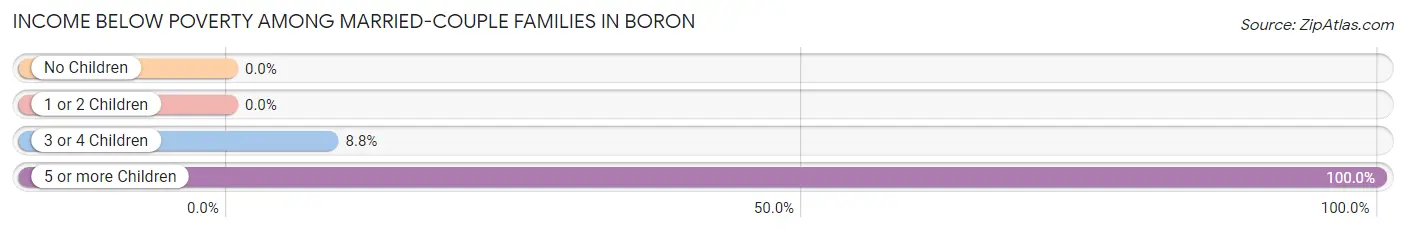
| Children | Above Poverty | Below Poverty |
| No Children | 183 (100.0%) | 0 (0.0%) |
| 1 or 2 Children | 90 (100.0%) | 0 (0.0%) |
| 3 or 4 Children | 73 (91.2%) | 7 (8.7%) |
| 5 or more Children | 0 (0.0%) | 18 (100.0%) |
| Total | 346 (93.3%) | 25 (6.7%) |
Income Below Poverty Among Single-Parent Households in Boron
According to the poverty data in Boron, 83.3% or 50 single-father households and 54.0% or 34 single-mother households are living below the poverty line. Among single-father households, those with 1 or 2 children have the highest poverty rate, with 8 households (100.0%) experiencing poverty. Likewise, among single-mother households, those with 1 or 2 children have the highest poverty rate, with 14 households (100.0%) falling below the poverty line.
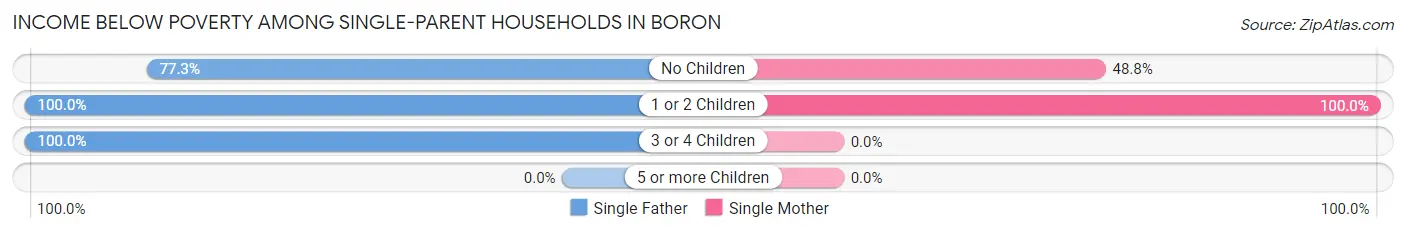
| Children | Single Father | Single Mother |
| No Children | 34 (77.3%) | 20 (48.8%) |
| 1 or 2 Children | 8 (100.0%) | 14 (100.0%) |
| 3 or 4 Children | 8 (100.0%) | 0 (0.0%) |
| 5 or more Children | 0 (0.0%) | 0 (0.0%) |
| Total | 50 (83.3%) | 34 (54.0%) |
Income Below Poverty Among Married-Couple vs Single-Parent Households in Boron
The poverty data for Boron shows that 25 of the married-couple family households (6.7%) and 84 of the single-parent households (68.3%) are living below the poverty level. Within the married-couple family households, those with 5 or more children have the highest poverty rate, with 18 households (100.0%) falling below the poverty line. Among the single-parent households, those with 1 or 2 children have the highest poverty rate, with 22 household (100.0%) living below poverty.
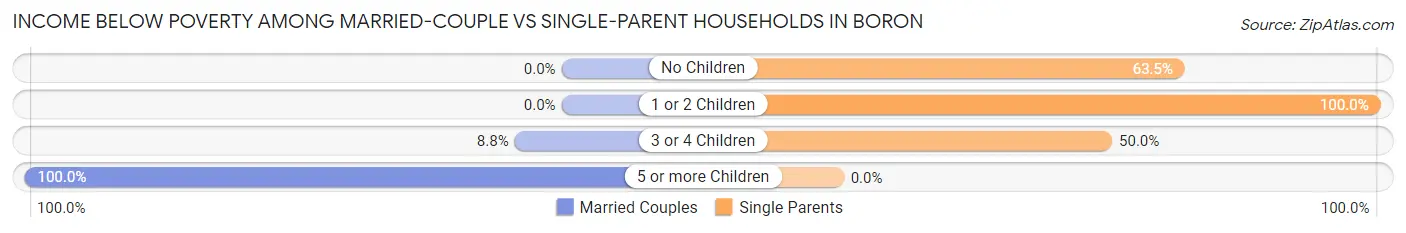
| Children | Married-Couple Families | Single-Parent Households |
| No Children | 0 (0.0%) | 54 (63.5%) |
| 1 or 2 Children | 0 (0.0%) | 22 (100.0%) |
| 3 or 4 Children | 7 (8.7%) | 8 (50.0%) |
| 5 or more Children | 18 (100.0%) | 0 (0.0%) |
| Total | 25 (6.7%) | 84 (68.3%) |
Race in Boron
The most populous races in Boron are White / Caucasian (1,425 | 57.7%), Hispanic or Latino (797 | 32.3%), and Two or more Races (404 | 16.4%).
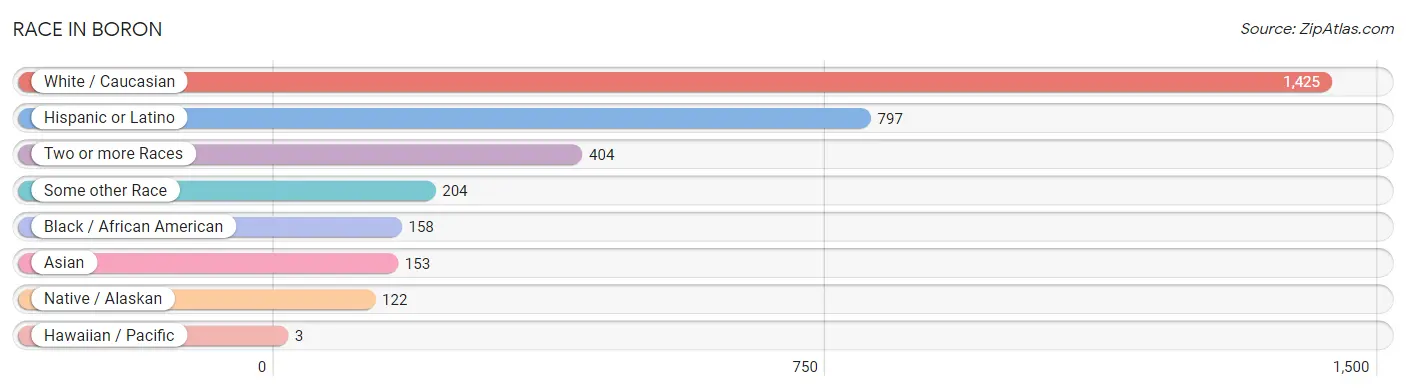
| Race | # Population | % Population |
| Asian | 153 | 6.2% |
| Black / African American | 158 | 6.4% |
| Hawaiian / Pacific | 3 | 0.1% |
| Hispanic or Latino | 797 | 32.3% |
| Native / Alaskan | 122 | 4.9% |
| White / Caucasian | 1,425 | 57.7% |
| Two or more Races | 404 | 16.4% |
| Some other Race | 204 | 8.3% |
| Total | 2,469 | 100.0% |
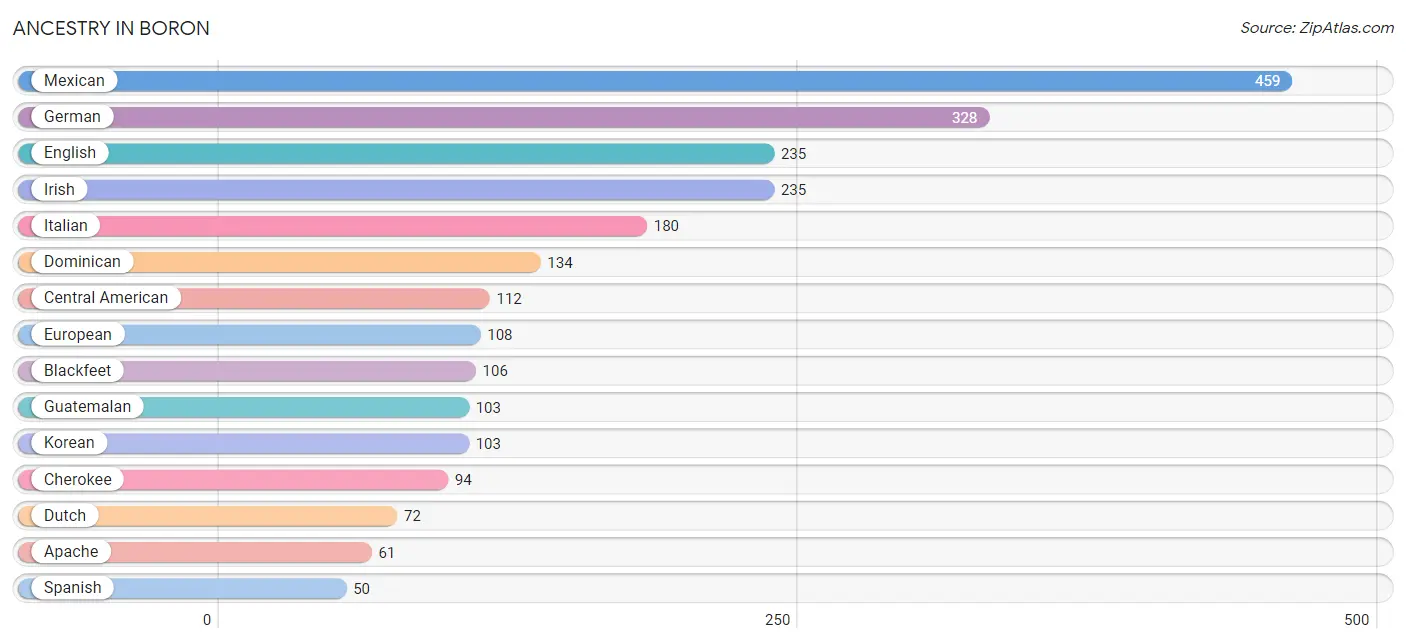
Ancestry in Boron
The most populous ancestries reported in Boron are Mexican (459 | 18.6%), German (328 | 13.3%), English (235 | 9.5%), Irish (235 | 9.5%), and Italian (180 | 7.3%), together accounting for 58.2% of all Boron residents.
| Ancestry | # Population | % Population |
| American | 44 | 1.8% |
| Apache | 61 | 2.5% |
| Blackfeet | 106 | 4.3% |
| Burmese | 18 | 0.7% |
| Central American | 112 | 4.5% |
| Cherokee | 94 | 3.8% |
| Choctaw | 4 | 0.2% |
| Danish | 8 | 0.3% |
| Dominican | 134 | 5.4% |
| Dutch | 72 | 2.9% |
| English | 235 | 9.5% |
| European | 108 | 4.4% |
| Filipino | 6 | 0.2% |
| French | 26 | 1.1% |
| French Canadian | 4 | 0.2% |
| German | 328 | 13.3% |
| Greek | 5 | 0.2% |
| Guatemalan | 103 | 4.2% |
| Irish | 235 | 9.5% |
| Italian | 180 | 7.3% |
| Korean | 103 | 4.2% |
| Mexican | 459 | 18.6% |
| Mexican American Indian | 14 | 0.6% |
| Native Hawaiian | 3 | 0.1% |
| Peruvian | 9 | 0.4% |
| Polish | 29 | 1.2% |
| Portuguese | 8 | 0.3% |
| Puerto Rican | 10 | 0.4% |
| Salvadoran | 9 | 0.4% |
| Scotch-Irish | 4 | 0.2% |
| Scottish | 37 | 1.5% |
| South American | 9 | 0.4% |
| Spanish | 50 | 2.0% |
| Swedish | 4 | 0.2% |
| Swiss | 10 | 0.4% |
| Thai | 30 | 1.2% |
| Welsh | 20 | 0.8% | View All 37 Rows |
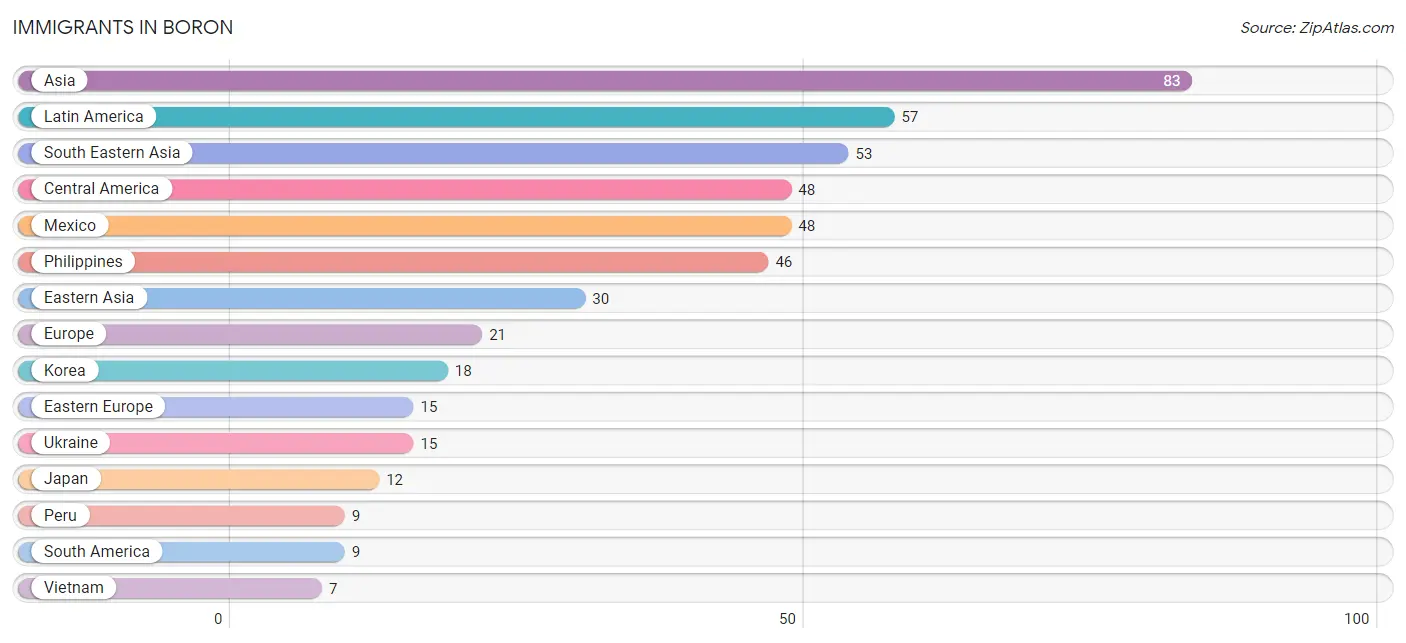
Immigrants in Boron
The most numerous immigrant groups reported in Boron came from Asia (83 | 3.4%), Latin America (57 | 2.3%), South Eastern Asia (53 | 2.1%), Central America (48 | 1.9%), and Mexico (48 | 1.9%), together accounting for 11.7% of all Boron residents.
| Immigration Origin | # Population | % Population |
| Asia | 83 | 3.4% |
| Central America | 48 | 1.9% |
| Eastern Asia | 30 | 1.2% |
| Eastern Europe | 15 | 0.6% |
| England | 6 | 0.2% |
| Europe | 21 | 0.9% |
| Japan | 12 | 0.5% |
| Korea | 18 | 0.7% |
| Latin America | 57 | 2.3% |
| Mexico | 48 | 1.9% |
| Northern Europe | 6 | 0.2% |
| Peru | 9 | 0.4% |
| Philippines | 46 | 1.9% |
| South America | 9 | 0.4% |
| South Eastern Asia | 53 | 2.1% |
| Ukraine | 15 | 0.6% |
| Vietnam | 7 | 0.3% | View All 17 Rows |
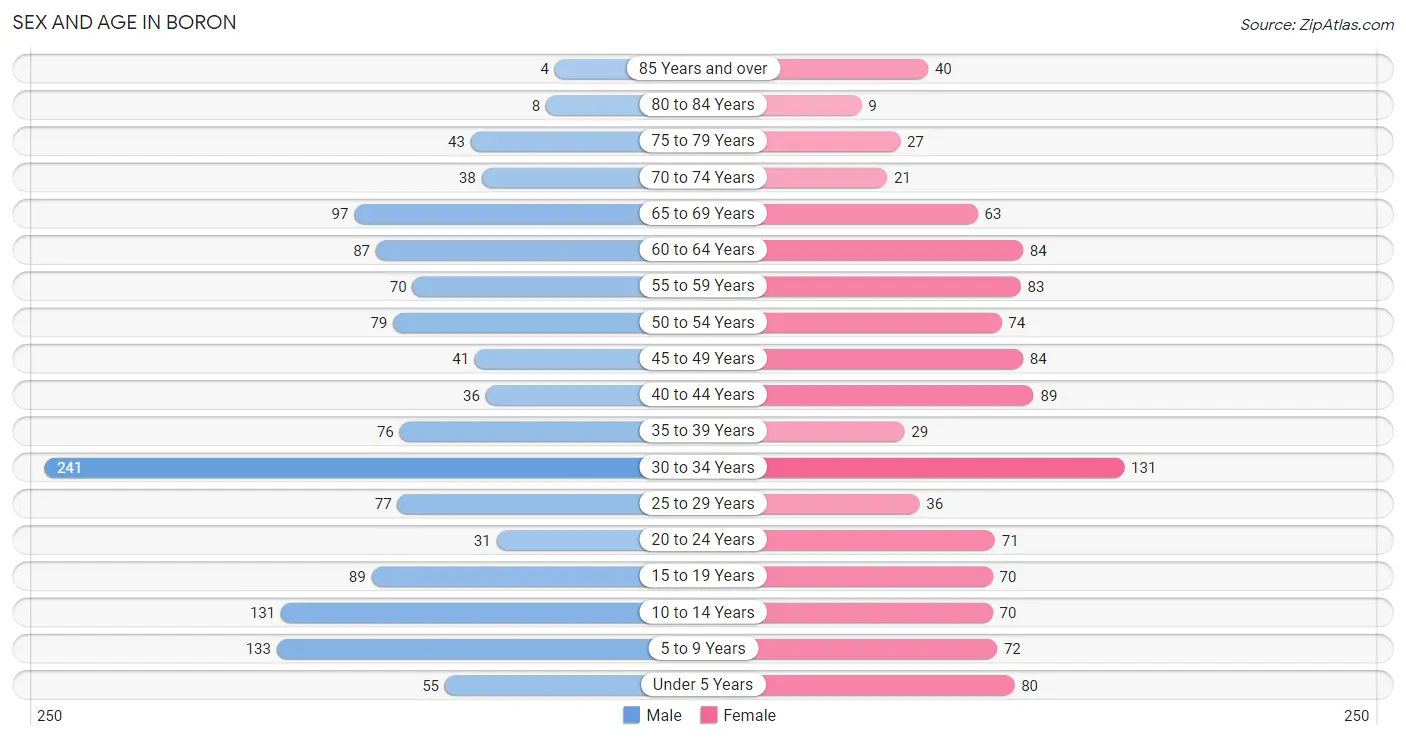
Sex and Age in Boron
Sex and Age in Boron
The most populous age groups in Boron are 30 to 34 Years (241 | 18.0%) for men and 30 to 34 Years (131 | 11.6%) for women.
| Age Bracket | Male | Female |
| Under 5 Years | 55 (4.1%) | 80 (7.1%) |
| 5 to 9 Years | 133 (10.0%) | 72 (6.4%) |
| 10 to 14 Years | 131 (9.8%) | 70 (6.2%) |
| 15 to 19 Years | 89 (6.7%) | 70 (6.2%) |
| 20 to 24 Years | 31 (2.3%) | 71 (6.3%) |
| 25 to 29 Years | 77 (5.8%) | 36 (3.2%) |
| 30 to 34 Years | 241 (18.0%) | 131 (11.6%) |
| 35 to 39 Years | 76 (5.7%) | 29 (2.6%) |
| 40 to 44 Years | 36 (2.7%) | 89 (7.9%) |
| 45 to 49 Years | 41 (3.1%) | 84 (7.4%) |
| 50 to 54 Years | 79 (5.9%) | 74 (6.5%) |
| 55 to 59 Years | 70 (5.2%) | 83 (7.3%) |
| 60 to 64 Years | 87 (6.5%) | 84 (7.4%) |
| 65 to 69 Years | 97 (7.3%) | 63 (5.6%) |
| 70 to 74 Years | 38 (2.8%) | 21 (1.8%) |
| 75 to 79 Years | 43 (3.2%) | 27 (2.4%) |
| 80 to 84 Years | 8 (0.6%) | 9 (0.8%) |
| 85 Years and over | 4 (0.3%) | 40 (3.5%) |
| Total | 1,336 (100.0%) | 1,133 (100.0%) |
Families and Households in Boron
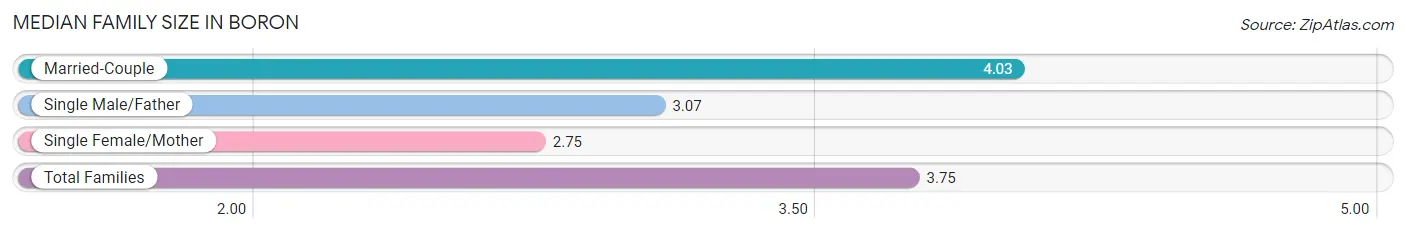
Median Family Size in Boron
The median family size in Boron is 3.75 persons per family, with married-couple families (371 | 75.1%) accounting for the largest median family size of 4.03 persons per family. On the other hand, single female/mother families (63 | 12.8%) represent the smallest median family size with 2.75 persons per family.
| Family Type | # Families | Family Size |
| Married-Couple | 371 (75.1%) | 4.03 |
| Single Male/Father | 60 (12.1%) | 3.07 |
| Single Female/Mother | 63 (12.8%) | 2.75 |
| Total Families | 494 (100.0%) | 3.75 |
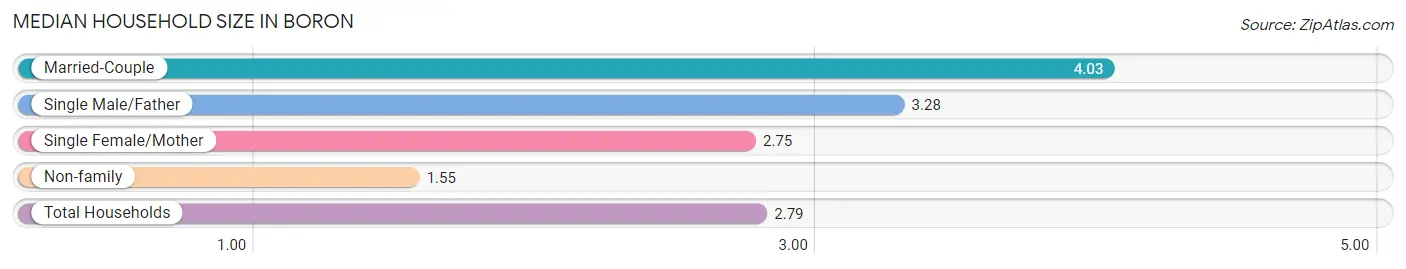
Median Household Size in Boron
The median household size in Boron is 2.79 persons per household, with married-couple households (371 | 42.0%) accounting for the largest median household size of 4.03 persons per household. non-family households (390 | 44.1%) represent the smallest median household size with 1.55 persons per household.
| Household Type | # Households | Household Size |
| Married-Couple | 371 (42.0%) | 4.03 |
| Single Male/Father | 60 (6.8%) | 3.28 |
| Single Female/Mother | 63 (7.1%) | 2.75 |
| Non-family | 390 (44.1%) | 1.55 |
| Total Households | 884 (100.0%) | 2.79 |
Household Size by Marriage Status in Boron
Out of a total of 884 households in Boron, 494 (55.9%) are family households, while 390 (44.1%) are nonfamily households. The most numerous type of family households are 2-person households, comprising 227, and the most common type of nonfamily households are 1-person households, comprising 248.
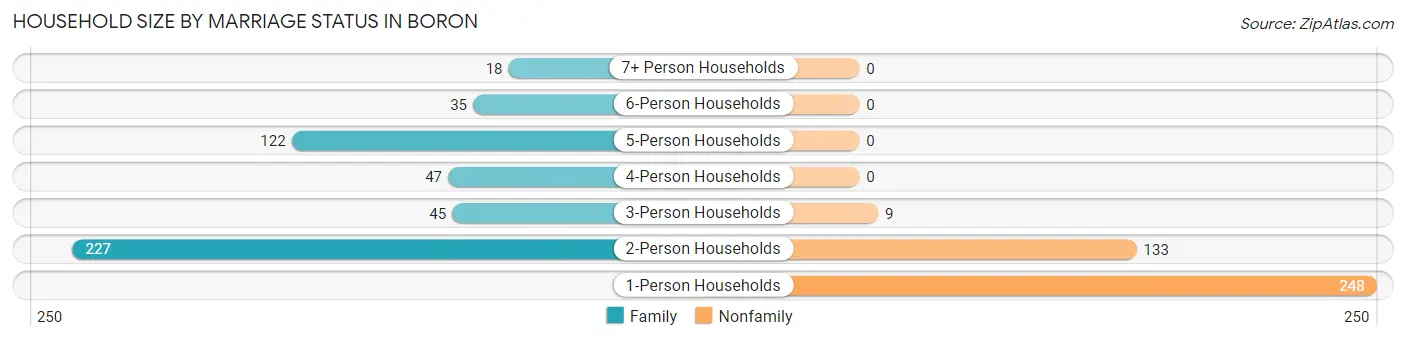
| Household Size | Family Households | Nonfamily Households |
| 1-Person Households | - | 248 (28.1%) |
| 2-Person Households | 227 (25.7%) | 133 (15.0%) |
| 3-Person Households | 45 (5.1%) | 9 (1.0%) |
| 4-Person Households | 47 (5.3%) | 0 (0.0%) |
| 5-Person Households | 122 (13.8%) | 0 (0.0%) |
| 6-Person Households | 35 (4.0%) | 0 (0.0%) |
| 7+ Person Households | 18 (2.0%) | 0 (0.0%) |
| Total | 494 (55.9%) | 390 (44.1%) |
Female Fertility in Boron
Fertility by Age in Boron
Average fertility rate in Boron is 50.0 births per 1,000 women. Women in the age bracket of 20 to 34 years have the highest fertility rate with 80.0 births per 1,000 women. Women in the age bracket of 20 to 34 years acount for 70.4% of all women with births.
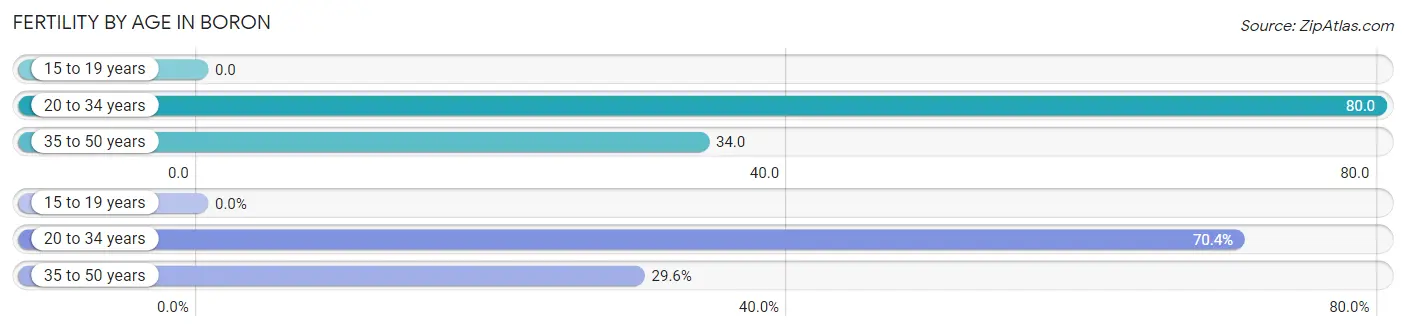
| Age Bracket | Women with Births | Births / 1,000 Women |
| 15 to 19 years | 0 (0.0%) | 0.0 |
| 20 to 34 years | 19 (70.4%) | 80.0 |
| 35 to 50 years | 8 (29.6%) | 34.0 |
| Total | 27 (100.0%) | 50.0 |
Fertility by Age by Marriage Status in Boron
70.4% of women with births (27) in Boron are married. The highest percentage of unmarried women with births falls into 20 to 34 years age bracket with 42.1% of them unmarried at the time of birth, while the lowest percentage of unmarried women with births belong to 35 to 50 years age bracket with 0.0% of them unmarried.
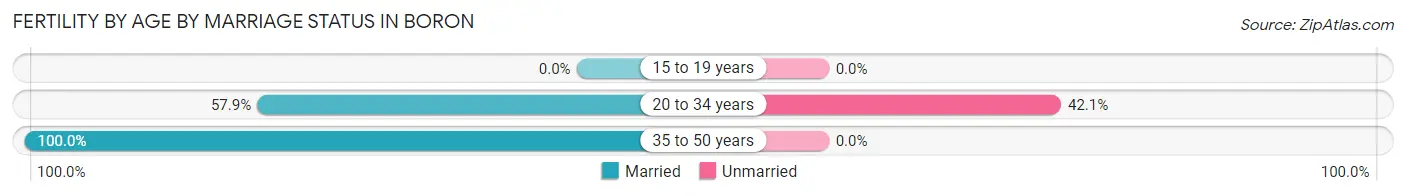
| Age Bracket | Married | Unmarried |
| 15 to 19 years | 0 (0.0%) | 0 (0.0%) |
| 20 to 34 years | 11 (57.9%) | 8 (42.1%) |
| 35 to 50 years | 8 (100.0%) | 0 (0.0%) |
| Total | 19 (70.4%) | 8 (29.6%) |
Fertility by Education in Boron
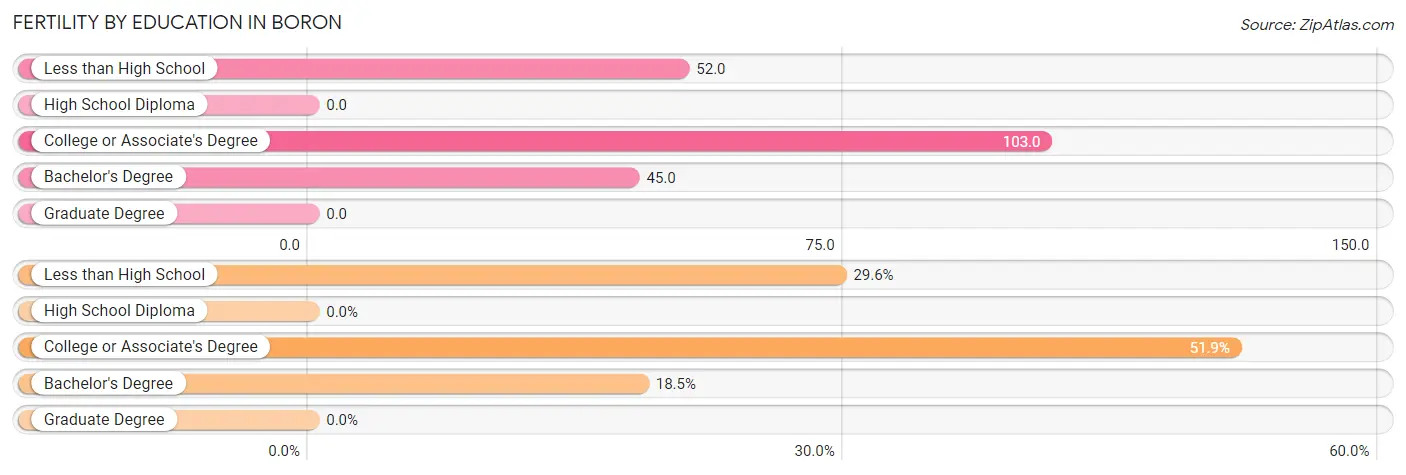
| Educational Attainment | Women with Births | Births / 1,000 Women |
| Less than High School | 8 (29.6%) | 52.0 |
| High School Diploma | 0 (0.0%) | 0.0 |
| College or Associate's Degree | 14 (51.8%) | 103.0 |
| Bachelor's Degree | 5 (18.5%) | 45.0 |
| Graduate Degree | 0 (0.0%) | 0.0 |
| Total | 27 (100.0%) | 50.0 |
Fertility by Education by Marriage Status in Boron
29.6% of women with births in Boron are unmarried. Women with the educational attainment of college or associate's degree are most likely to be married with 100.0% of them married at childbirth, while women with the educational attainment of less than high school are least likely to be married with 100.0% of them unmarried at childbirth.
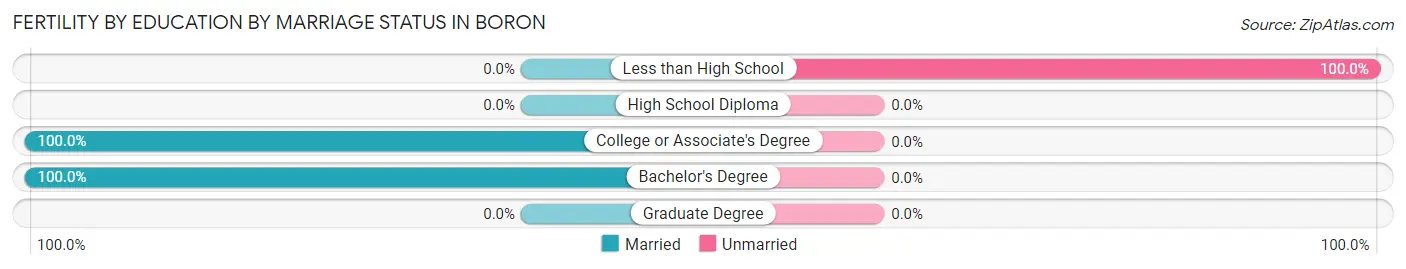
| Educational Attainment | Married | Unmarried |
| Less than High School | 0 (0.0%) | 8 (100.0%) |
| High School Diploma | 0 (0.0%) | 0 (0.0%) |
| College or Associate's Degree | 14 (100.0%) | 0 (0.0%) |
| Bachelor's Degree | 5 (100.0%) | 0 (0.0%) |
| Graduate Degree | 0 (0.0%) | 0 (0.0%) |
| Total | 19 (70.4%) | 8 (29.6%) |
Employment Characteristics in Boron
Employment by Class of Employer in Boron
Among the 888 employed individuals in Boron, private company employees (662 | 74.6%), federal government employees (75 | 8.5%), and local government employees (56 | 6.3%) make up the most common classes of employment.
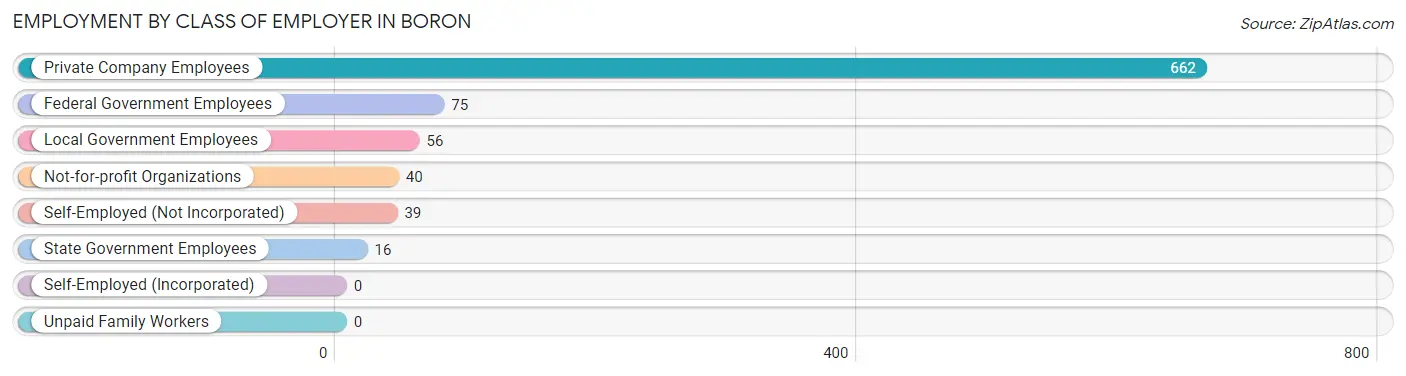
| Employer Class | # Employees | % Employees |
| Private Company Employees | 662 | 74.6% |
| Self-Employed (Incorporated) | 0 | 0.0% |
| Self-Employed (Not Incorporated) | 39 | 4.4% |
| Not-for-profit Organizations | 40 | 4.5% |
| Local Government Employees | 56 | 6.3% |
| State Government Employees | 16 | 1.8% |
| Federal Government Employees | 75 | 8.5% |
| Unpaid Family Workers | 0 | 0.0% |
| Total | 888 | 100.0% |
Employment Status by Age in Boron
According to the labor force statistics for Boron, out of the total population over 16 years of age (1,886), 54.5% or 1,028 individuals are in the labor force, with 10.9% or 112 of them unemployed. The age group with the highest labor force participation rate is 30 to 34 years, with 91.4% or 340 individuals in the labor force. Within the labor force, the 16 to 19 years age range has the highest percentage of unemployed individuals, with 33.3% or 25 of them being unemployed.
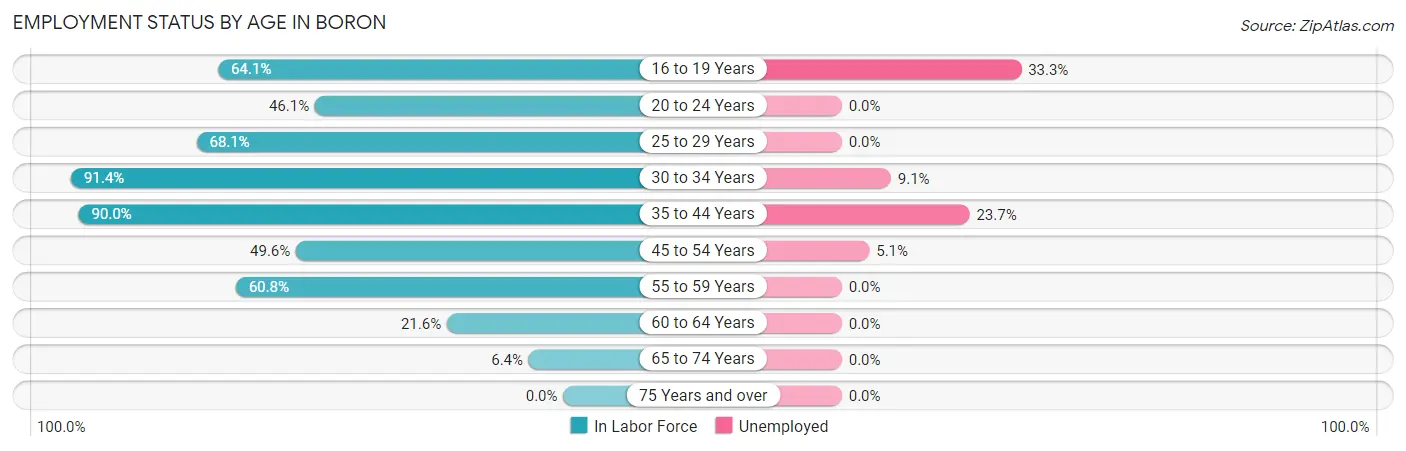
| Age Bracket | In Labor Force | Unemployed |
| 16 to 19 Years | 75 (64.1%) | 25 (33.3%) |
| 20 to 24 Years | 47 (46.1%) | 0 (0.0%) |
| 25 to 29 Years | 77 (68.1%) | 0 (0.0%) |
| 30 to 34 Years | 340 (91.4%) | 31 (9.1%) |
| 35 to 44 Years | 207 (90.0%) | 49 (23.7%) |
| 45 to 54 Years | 138 (49.6%) | 7 (5.1%) |
| 55 to 59 Years | 93 (60.8%) | 0 (0.0%) |
| 60 to 64 Years | 37 (21.6%) | 0 (0.0%) |
| 65 to 74 Years | 14 (6.4%) | 0 (0.0%) |
| 75 Years and over | 0 (0.0%) | 0 (0.0%) |
| Total | 1,028 (54.5%) | 112 (10.9%) |
Employment Status by Educational Attainment in Boron
According to labor force statistics for Boron, 67.7% of individuals (892) out of the total population between 25 and 64 years of age (1,317) are in the labor force, with 9.8% or 87 of them being unemployed. The group with the highest labor force participation rate are those with the educational attainment of bachelor's degree or higher, with 94.0% or 281 individuals in the labor force. Within the labor force, individuals with high school diploma education have the highest percentage of unemployment, with 20.3% or 55 of them being unemployed.
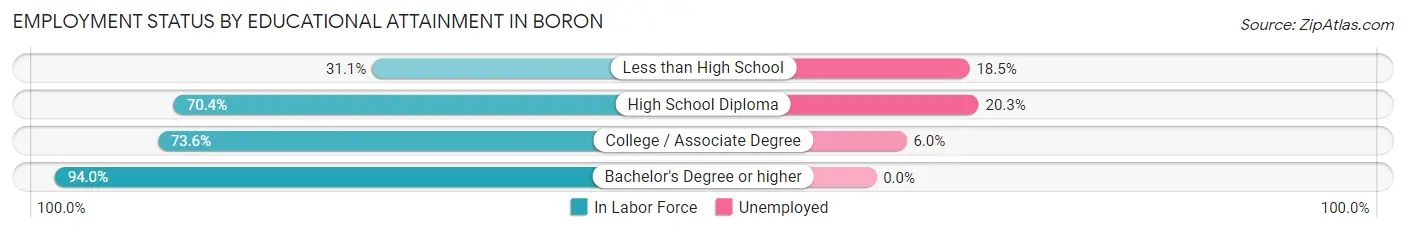
| Educational Attainment | In Labor Force | Unemployed |
| Less than High School | 92 (31.1%) | 55 (18.5%) |
| High School Diploma | 271 (70.4%) | 78 (20.3%) |
| College / Associate Degree | 248 (73.6%) | 20 (6.0%) |
| Bachelor's Degree or higher | 281 (94.0%) | 0 (0.0%) |
| Total | 892 (67.7%) | 129 (9.8%) |
Employment Occupations by Sex in Boron
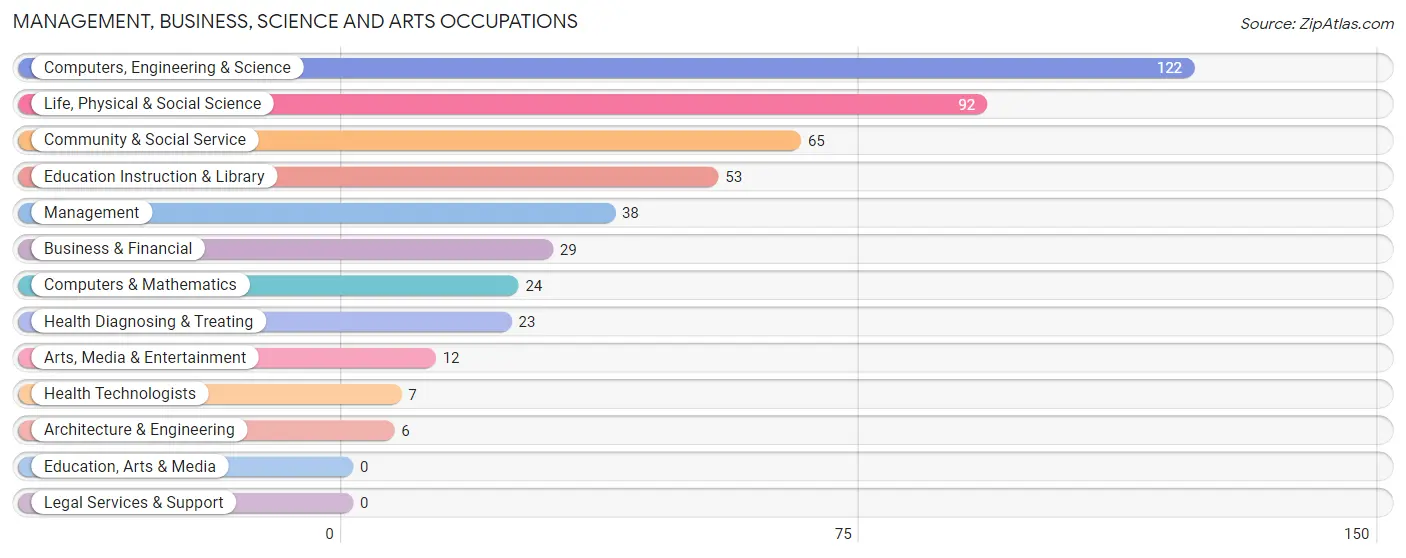
Management, Business, Science and Arts Occupations
The most common Management, Business, Science and Arts occupations in Boron are Computers, Engineering & Science (122 | 13.3%), Life, Physical & Social Science (92 | 10.0%), Community & Social Service (65 | 7.1%), Education Instruction & Library (53 | 5.8%), and Management (38 | 4.2%).
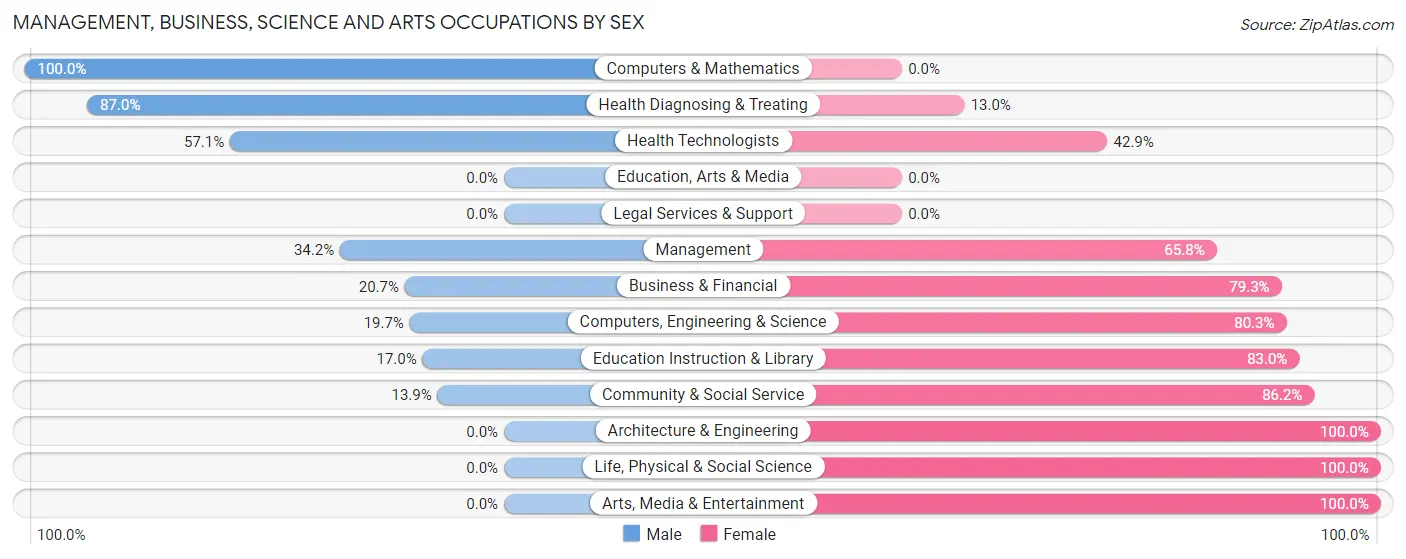
Management, Business, Science and Arts Occupations by Sex
Within the Management, Business, Science and Arts occupations in Boron, the most male-oriented occupations are Computers & Mathematics (100.0%), Health Diagnosing & Treating (87.0%), and Health Technologists (57.1%), while the most female-oriented occupations are Architecture & Engineering (100.0%), Life, Physical & Social Science (100.0%), and Arts, Media & Entertainment (100.0%).
| Occupation | Male | Female |
| Management | 13 (34.2%) | 25 (65.8%) |
| Business & Financial | 6 (20.7%) | 23 (79.3%) |
| Computers, Engineering & Science | 24 (19.7%) | 98 (80.3%) |
| Computers & Mathematics | 24 (100.0%) | 0 (0.0%) |
| Architecture & Engineering | 0 (0.0%) | 6 (100.0%) |
| Life, Physical & Social Science | 0 (0.0%) | 92 (100.0%) |
| Community & Social Service | 9 (13.9%) | 56 (86.2%) |
| Education, Arts & Media | 0 (0.0%) | 0 (0.0%) |
| Legal Services & Support | 0 (0.0%) | 0 (0.0%) |
| Education Instruction & Library | 9 (17.0%) | 44 (83.0%) |
| Arts, Media & Entertainment | 0 (0.0%) | 12 (100.0%) |
| Health Diagnosing & Treating | 20 (87.0%) | 3 (13.0%) |
| Health Technologists | 4 (57.1%) | 3 (42.9%) |
| Total (Category) | 72 (26.0%) | 205 (74.0%) |
| Total (Overall) | 554 (60.5%) | 362 (39.5%) |
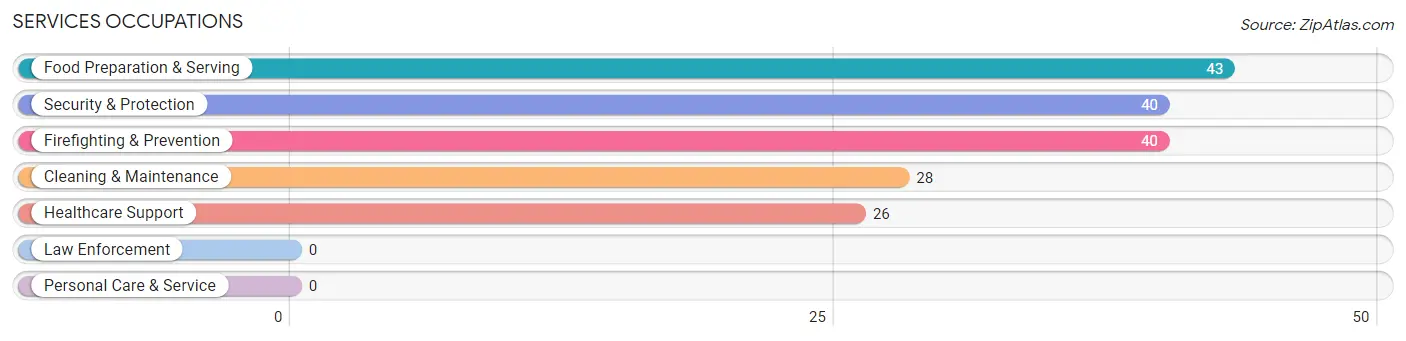
Services Occupations
The most common Services occupations in Boron are Food Preparation & Serving (43 | 4.7%), Security & Protection (40 | 4.4%), Firefighting & Prevention (40 | 4.4%), Cleaning & Maintenance (28 | 3.1%), and Healthcare Support (26 | 2.8%).
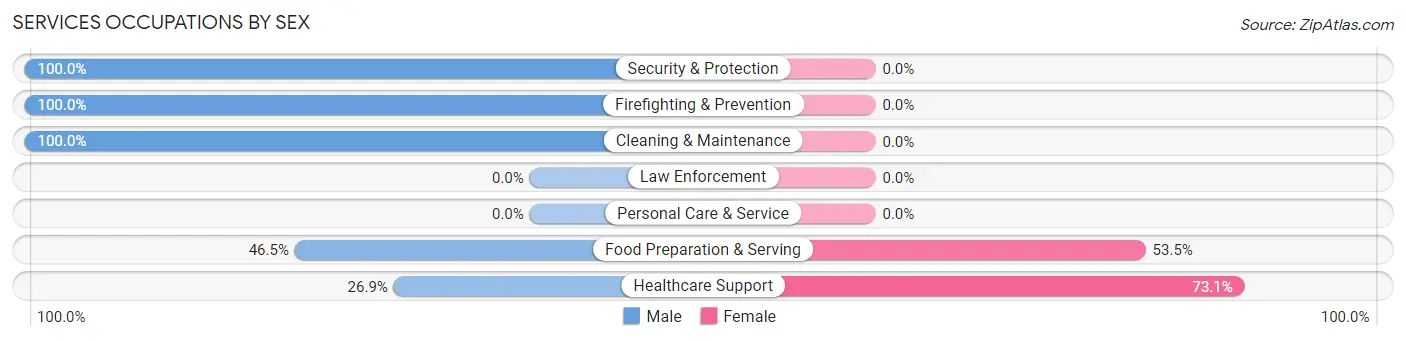
Services Occupations by Sex
Within the Services occupations in Boron, the most male-oriented occupations are Security & Protection (100.0%), Firefighting & Prevention (100.0%), and Cleaning & Maintenance (100.0%), while the most female-oriented occupations are Healthcare Support (73.1%), and Food Preparation & Serving (53.5%).
| Occupation | Male | Female |
| Healthcare Support | 7 (26.9%) | 19 (73.1%) |
| Security & Protection | 40 (100.0%) | 0 (0.0%) |
| Firefighting & Prevention | 40 (100.0%) | 0 (0.0%) |
| Law Enforcement | 0 (0.0%) | 0 (0.0%) |
| Food Preparation & Serving | 20 (46.5%) | 23 (53.5%) |
| Cleaning & Maintenance | 28 (100.0%) | 0 (0.0%) |
| Personal Care & Service | 0 (0.0%) | 0 (0.0%) |
| Total (Category) | 95 (69.3%) | 42 (30.7%) |
| Total (Overall) | 554 (60.5%) | 362 (39.5%) |
Sales and Office Occupations
The most common Sales and Office occupations in Boron are Office & Administration (68 | 7.4%), and Sales & Related (43 | 4.7%).
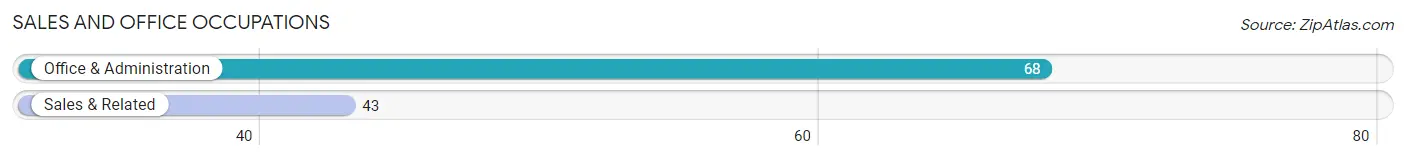
Sales and Office Occupations by Sex
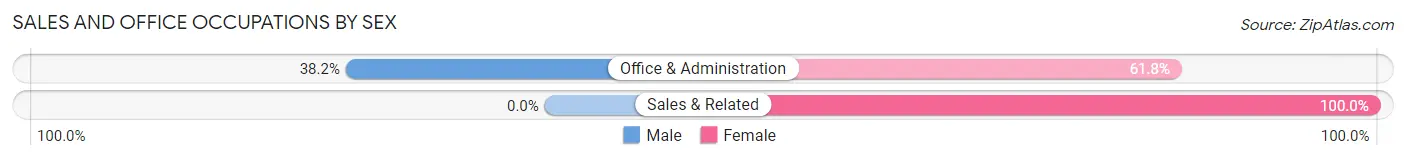
| Occupation | Male | Female |
| Sales & Related | 0 (0.0%) | 43 (100.0%) |
| Office & Administration | 26 (38.2%) | 42 (61.8%) |
| Total (Category) | 26 (23.4%) | 85 (76.6%) |
| Total (Overall) | 554 (60.5%) | 362 (39.5%) |
Natural Resources, Construction and Maintenance Occupations
The most common Natural Resources, Construction and Maintenance occupations in Boron are Installation, Maintenance & Repair (170 | 18.6%), and Construction & Extraction (141 | 15.4%).
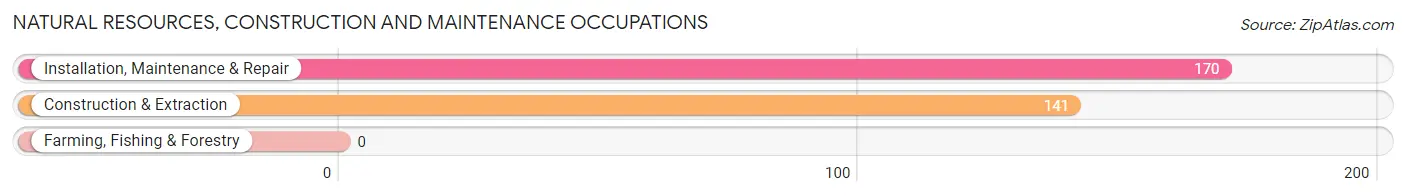
Natural Resources, Construction and Maintenance Occupations by Sex
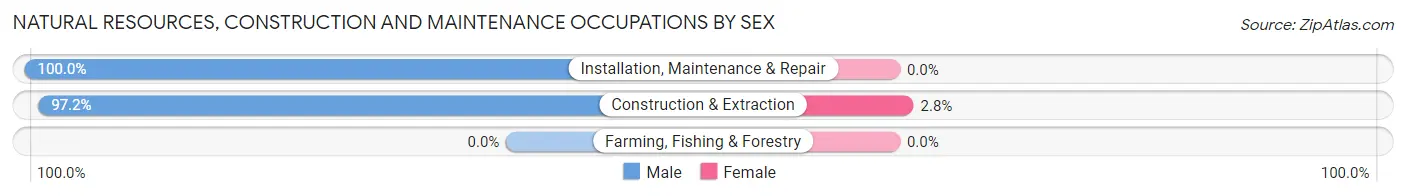
| Occupation | Male | Female |
| Farming, Fishing & Forestry | 0 (0.0%) | 0 (0.0%) |
| Construction & Extraction | 137 (97.2%) | 4 (2.8%) |
| Installation, Maintenance & Repair | 170 (100.0%) | 0 (0.0%) |
| Total (Category) | 307 (98.7%) | 4 (1.3%) |
| Total (Overall) | 554 (60.5%) | 362 (39.5%) |
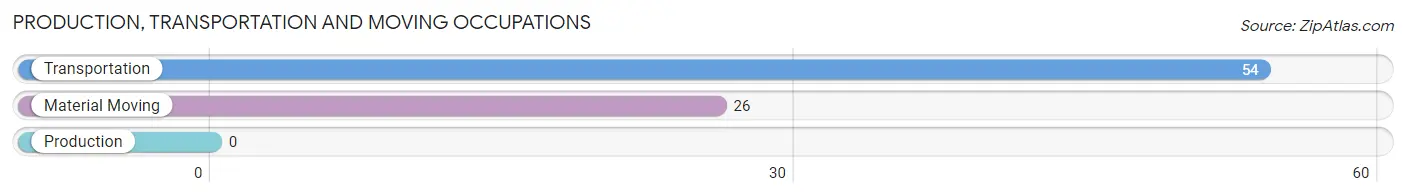
Production, Transportation and Moving Occupations
The most common Production, Transportation and Moving occupations in Boron are Transportation (54 | 5.9%), and Material Moving (26 | 2.8%).
Production, Transportation and Moving Occupations by Sex
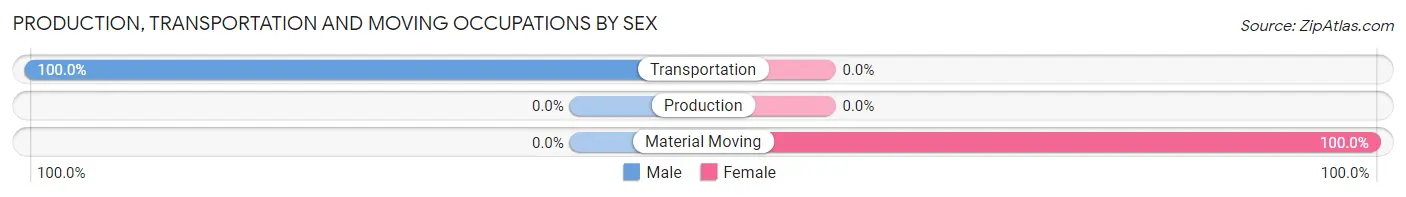
| Occupation | Male | Female |
| Production | 0 (0.0%) | 0 (0.0%) |
| Transportation | 54 (100.0%) | 0 (0.0%) |
| Material Moving | 0 (0.0%) | 26 (100.0%) |
| Total (Category) | 54 (67.5%) | 26 (32.5%) |
| Total (Overall) | 554 (60.5%) | 362 (39.5%) |
Employment Industries by Sex in Boron
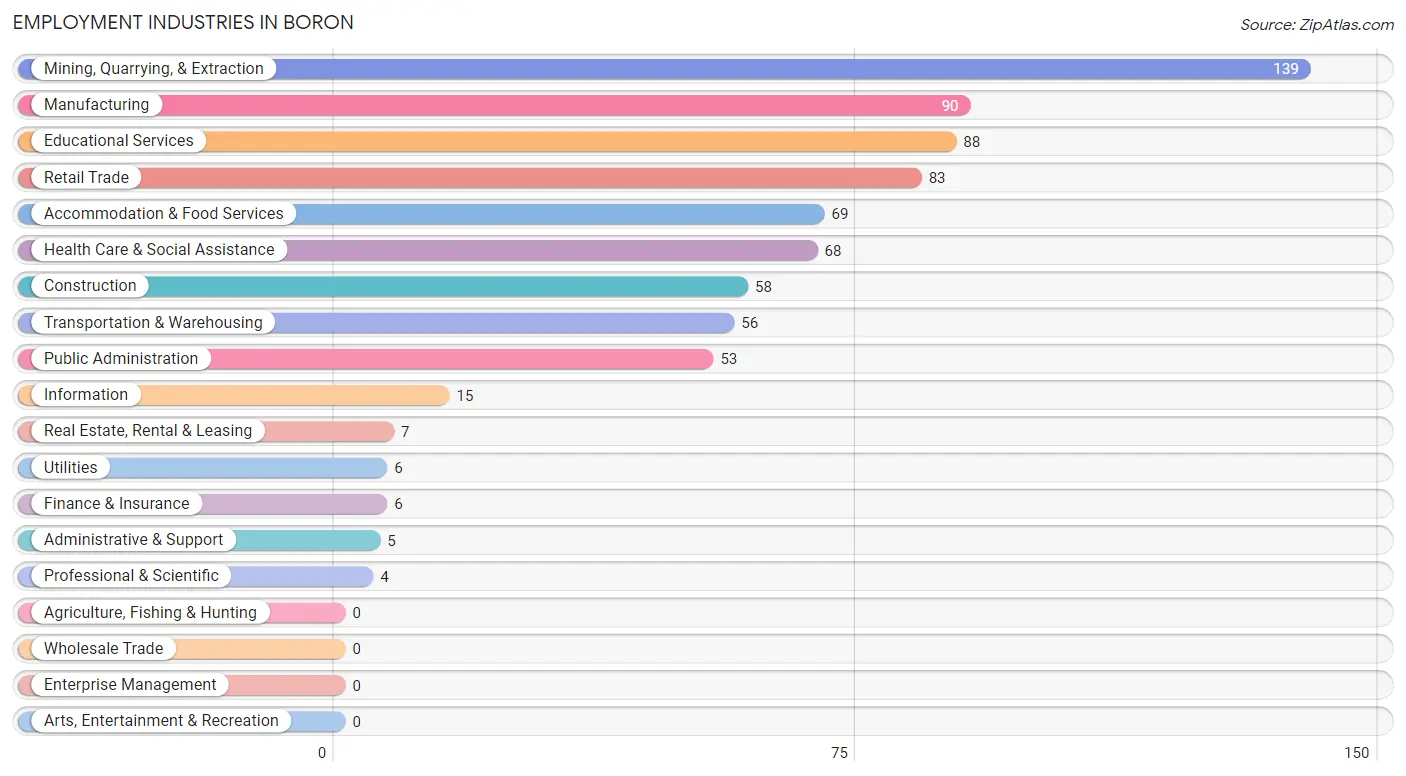
Employment Industries in Boron
The major employment industries in Boron include Mining, Quarrying, & Extraction (139 | 15.2%), Manufacturing (90 | 9.8%), Educational Services (88 | 9.6%), Retail Trade (83 | 9.1%), and Accommodation & Food Services (69 | 7.5%).
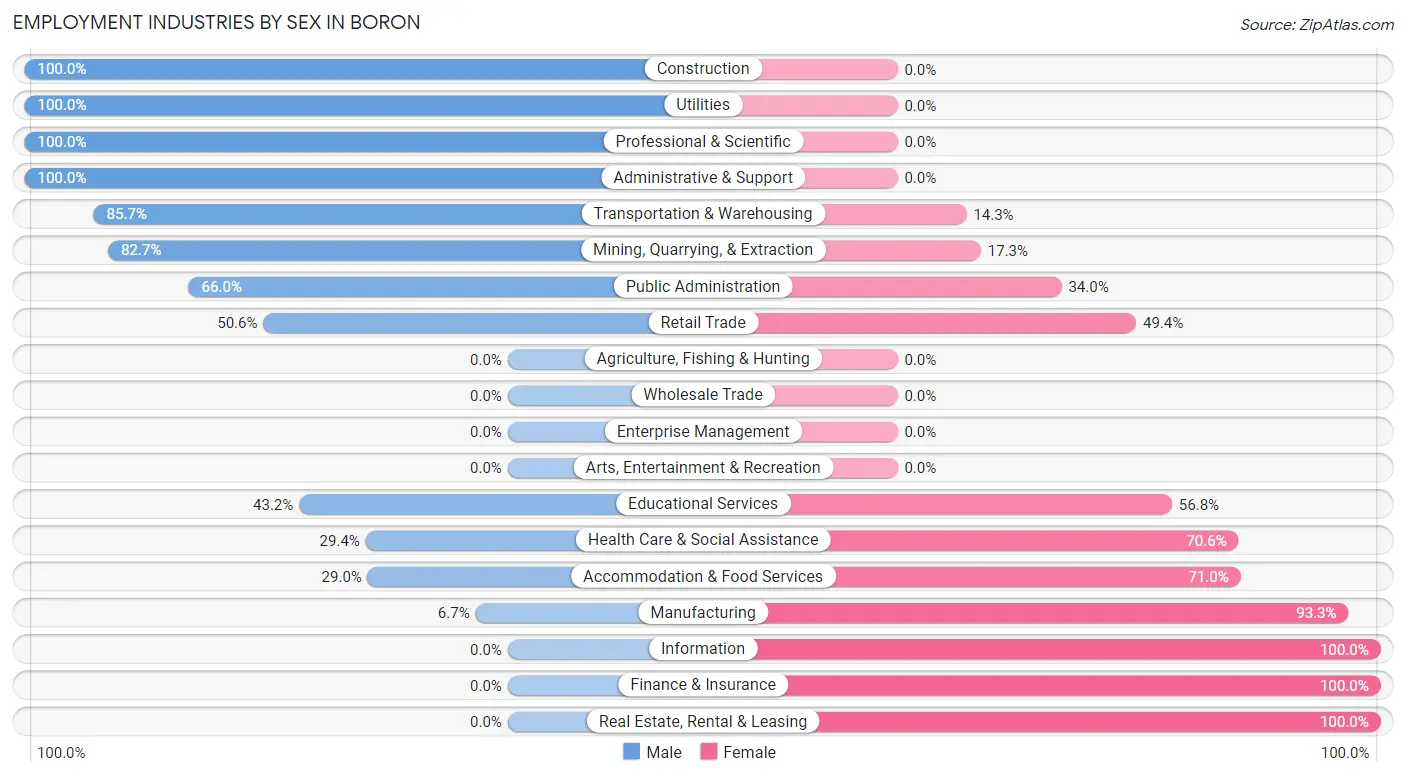
Employment Industries by Sex in Boron
The Boron industries that see more men than women are Construction (100.0%), Utilities (100.0%), and Professional & Scientific (100.0%), whereas the industries that tend to have a higher number of women are Information (100.0%), Finance & Insurance (100.0%), and Real Estate, Rental & Leasing (100.0%).
| Industry | Male | Female |
| Agriculture, Fishing & Hunting | 0 (0.0%) | 0 (0.0%) |
| Mining, Quarrying, & Extraction | 115 (82.7%) | 24 (17.3%) |
| Construction | 58 (100.0%) | 0 (0.0%) |
| Manufacturing | 6 (6.7%) | 84 (93.3%) |
| Wholesale Trade | 0 (0.0%) | 0 (0.0%) |
| Retail Trade | 42 (50.6%) | 41 (49.4%) |
| Transportation & Warehousing | 48 (85.7%) | 8 (14.3%) |
| Utilities | 6 (100.0%) | 0 (0.0%) |
| Information | 0 (0.0%) | 15 (100.0%) |
| Finance & Insurance | 0 (0.0%) | 6 (100.0%) |
| Real Estate, Rental & Leasing | 0 (0.0%) | 7 (100.0%) |
| Professional & Scientific | 4 (100.0%) | 0 (0.0%) |
| Enterprise Management | 0 (0.0%) | 0 (0.0%) |
| Administrative & Support | 5 (100.0%) | 0 (0.0%) |
| Educational Services | 38 (43.2%) | 50 (56.8%) |
| Health Care & Social Assistance | 20 (29.4%) | 48 (70.6%) |
| Arts, Entertainment & Recreation | 0 (0.0%) | 0 (0.0%) |
| Accommodation & Food Services | 20 (29.0%) | 49 (71.0%) |
| Public Administration | 35 (66.0%) | 18 (34.0%) |
| Total | 554 (60.5%) | 362 (39.5%) |
Education in Boron
School Enrollment in Boron
The most common levels of schooling among the 685 students in Boron are elementary school (207 | 30.2%), middle school (184 | 26.9%), and high school (137 | 20.0%).
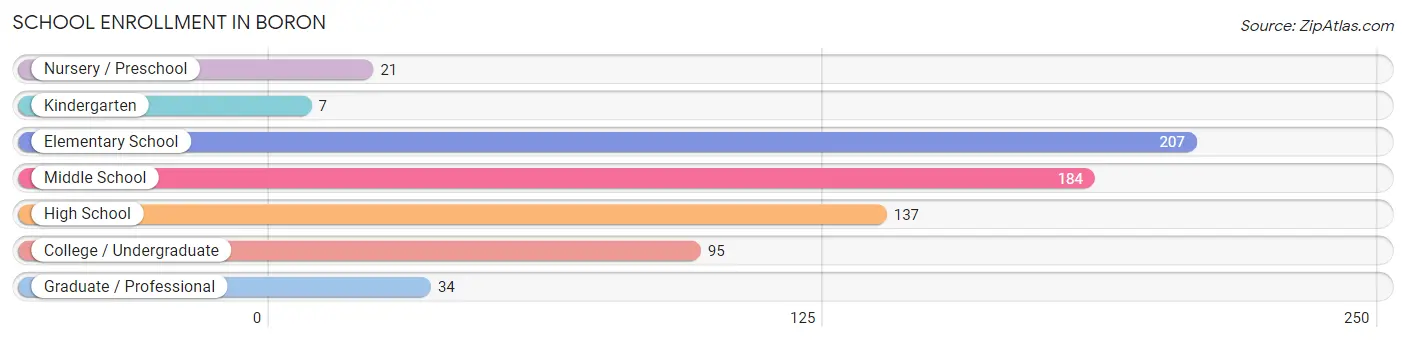
| School Level | # Students | % Students |
| Nursery / Preschool | 21 | 3.1% |
| Kindergarten | 7 | 1.0% |
| Elementary School | 207 | 30.2% |
| Middle School | 184 | 26.9% |
| High School | 137 | 20.0% |
| College / Undergraduate | 95 | 13.9% |
| Graduate / Professional | 34 | 5.0% |
| Total | 685 | 100.0% |
School Enrollment by Age by Funding Source in Boron
Out of a total of 685 students who are enrolled in schools in Boron, 101 (14.7%) attend a private institution, while the remaining 584 (85.3%) are enrolled in public schools. The age group of 3 to 4 year olds has the highest likelihood of being enrolled in private schools, with 21 (100.0% in the age bracket) enrolled. Conversely, the age group of 5 to 9 year old has the lowest likelihood of being enrolled in a private school, with 205 (100.0% in the age bracket) attending a public institution.
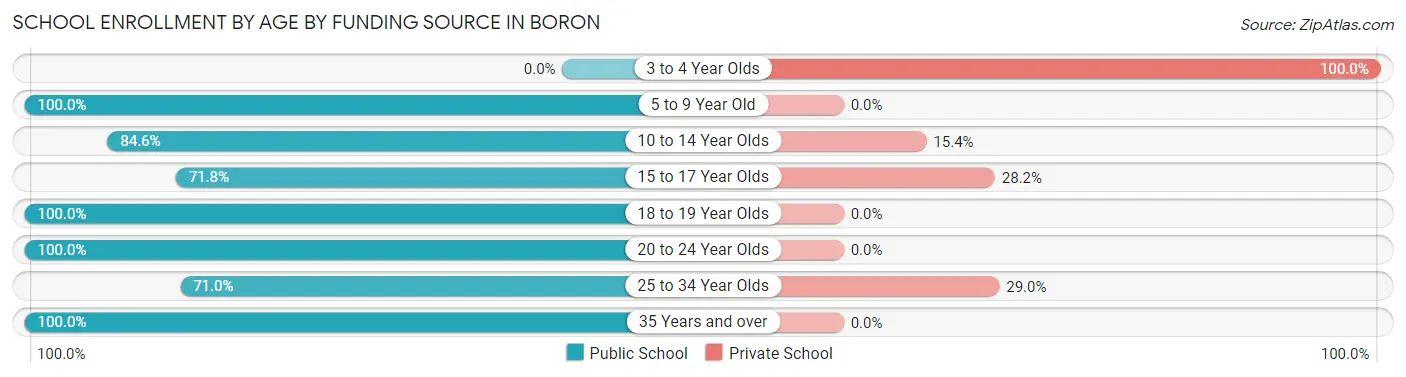
| Age Bracket | Public School | Private School |
| 3 to 4 Year Olds | 0 (0.0%) | 21 (100.0%) |
| 5 to 9 Year Old | 205 (100.0%) | 0 (0.0%) |
| 10 to 14 Year Olds | 170 (84.6%) | 31 (15.4%) |
| 15 to 17 Year Olds | 74 (71.8%) | 29 (28.2%) |
| 18 to 19 Year Olds | 35 (100.0%) | 0 (0.0%) |
| 20 to 24 Year Olds | 23 (100.0%) | 0 (0.0%) |
| 25 to 34 Year Olds | 49 (71.0%) | 20 (29.0%) |
| 35 Years and over | 28 (100.0%) | 0 (0.0%) |
| Total | 584 (85.3%) | 101 (14.7%) |
Educational Attainment by Field of Study in Boron
Visual & performing arts (134 | 32.0%), bio, nature & agricultural (88 | 21.0%), computers & mathematics (78 | 18.6%), science & technology (36 | 8.6%), and business (27 | 6.4%) are the most common fields of study among 419 individuals in Boron who have obtained a bachelor's degree or higher.
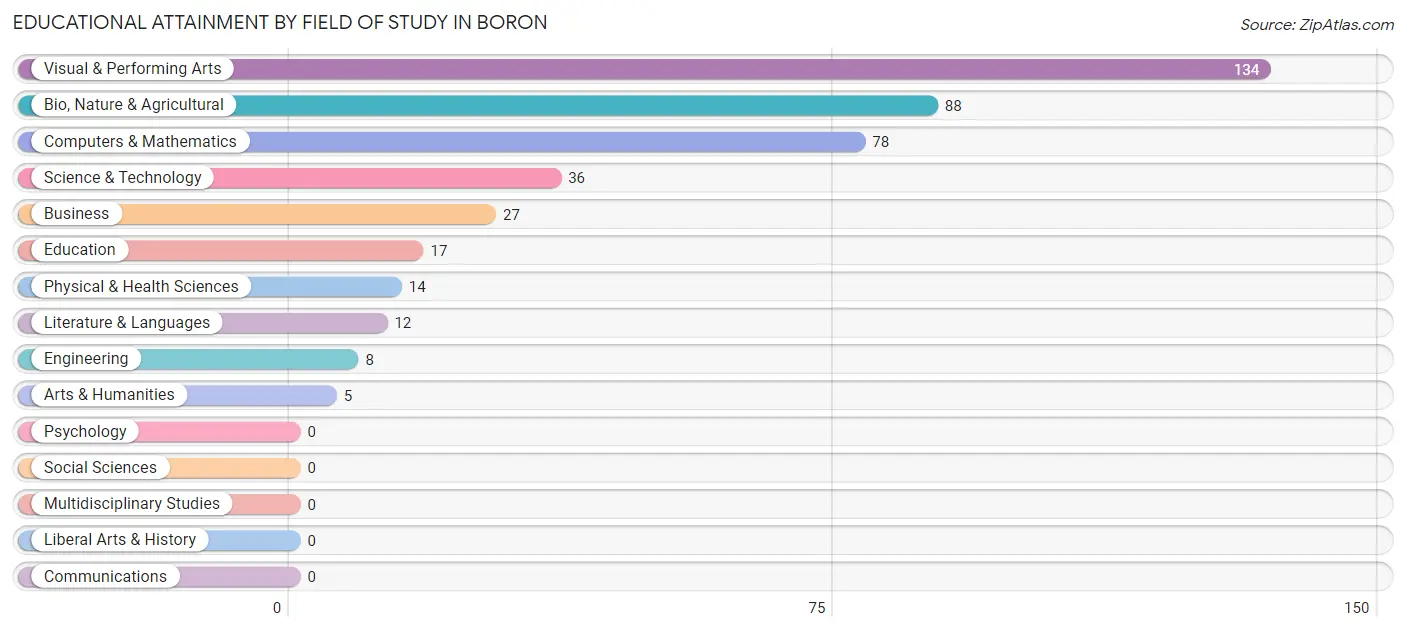
| Field of Study | # Graduates | % Graduates |
| Computers & Mathematics | 78 | 18.6% |
| Bio, Nature & Agricultural | 88 | 21.0% |
| Physical & Health Sciences | 14 | 3.3% |
| Psychology | 0 | 0.0% |
| Social Sciences | 0 | 0.0% |
| Engineering | 8 | 1.9% |
| Multidisciplinary Studies | 0 | 0.0% |
| Science & Technology | 36 | 8.6% |
| Business | 27 | 6.4% |
| Education | 17 | 4.1% |
| Literature & Languages | 12 | 2.9% |
| Liberal Arts & History | 0 | 0.0% |
| Visual & Performing Arts | 134 | 32.0% |
| Communications | 0 | 0.0% |
| Arts & Humanities | 5 | 1.2% |
| Total | 419 | 100.0% |
Transportation & Commute in Boron
Vehicle Availability by Sex in Boron
The most prevalent vehicle ownership categories in Boron are males with 2 vehicles (289, accounting for 54.9%) and females with 2 vehicles (173, making up 79.8%).
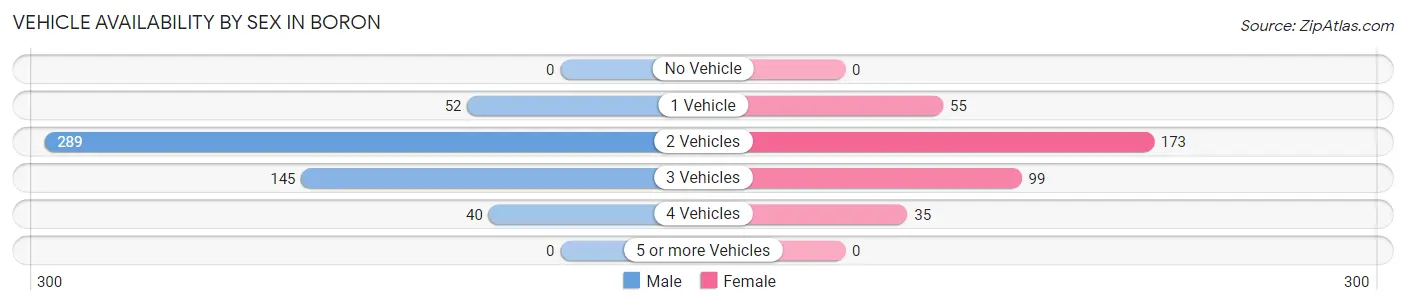
| Vehicles Available | Male | Female |
| No Vehicle | 0 (0.0%) | 0 (0.0%) |
| 1 Vehicle | 52 (9.9%) | 55 (15.2%) |
| 2 Vehicles | 289 (54.9%) | 173 (47.8%) |
| 3 Vehicles | 145 (27.6%) | 99 (27.4%) |
| 4 Vehicles | 40 (7.6%) | 35 (9.7%) |
| 5 or more Vehicles | 0 (0.0%) | 0 (0.0%) |
| Total | 526 (100.0%) | 362 (100.0%) |
Commute Time in Boron
The most frequently occuring commute durations in Boron are less than 5 minutes (337 commuters, 40.3%), 5 to 9 minutes (213 commuters, 25.5%), and 30 to 34 minutes (96 commuters, 11.5%).
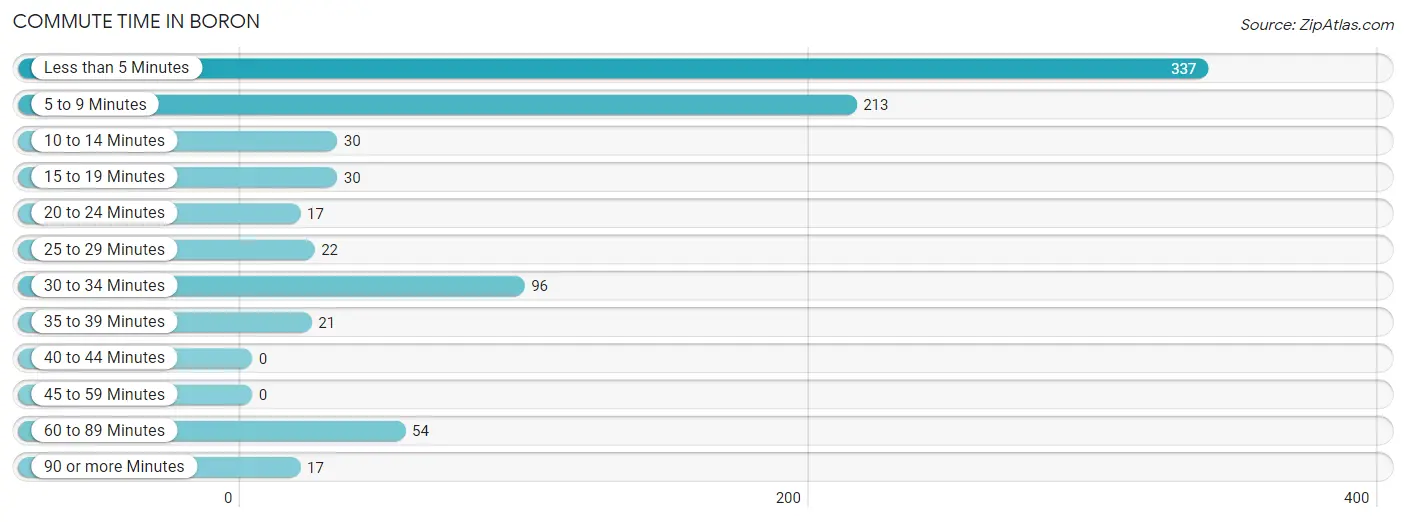
| Commute Time | # Commuters | % Commuters |
| Less than 5 Minutes | 337 | 40.3% |
| 5 to 9 Minutes | 213 | 25.5% |
| 10 to 14 Minutes | 30 | 3.6% |
| 15 to 19 Minutes | 30 | 3.6% |
| 20 to 24 Minutes | 17 | 2.0% |
| 25 to 29 Minutes | 22 | 2.6% |
| 30 to 34 Minutes | 96 | 11.5% |
| 35 to 39 Minutes | 21 | 2.5% |
| 40 to 44 Minutes | 0 | 0.0% |
| 45 to 59 Minutes | 0 | 0.0% |
| 60 to 89 Minutes | 54 | 6.5% |
| 90 or more Minutes | 17 | 2.0% |
Commute Time by Sex in Boron
The most common commute times in Boron are less than 5 minutes (249 commuters, 50.5%) for males and 5 to 9 minutes (114 commuters, 33.1%) for females.
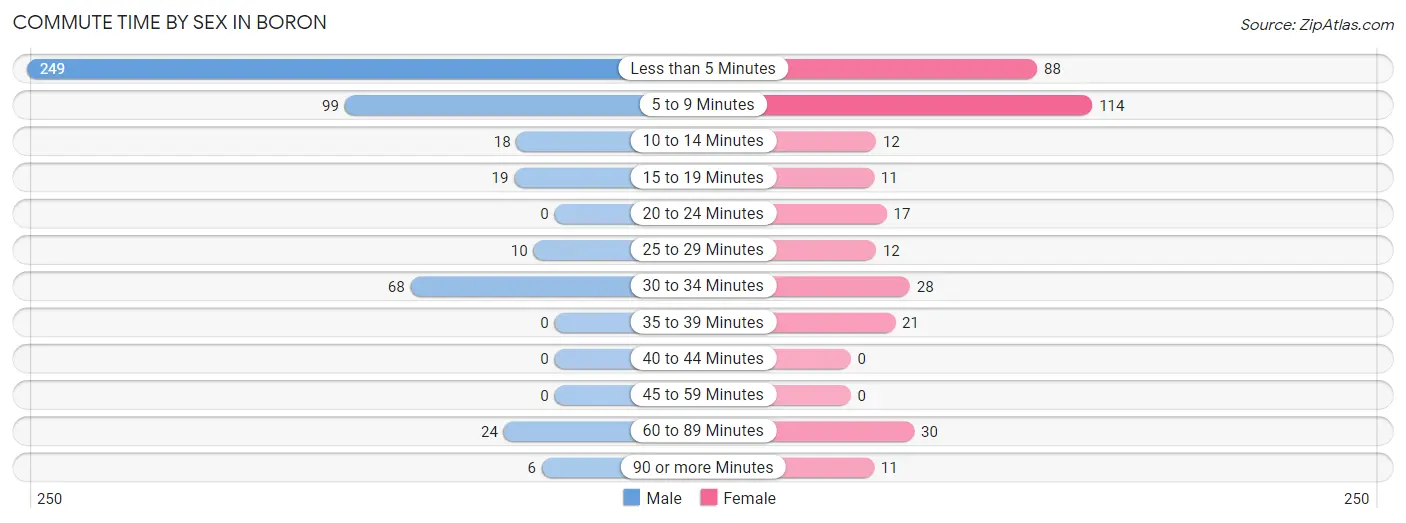
| Commute Time | Male | Female |
| Less than 5 Minutes | 249 (50.5%) | 88 (25.6%) |
| 5 to 9 Minutes | 99 (20.1%) | 114 (33.1%) |
| 10 to 14 Minutes | 18 (3.6%) | 12 (3.5%) |
| 15 to 19 Minutes | 19 (3.8%) | 11 (3.2%) |
| 20 to 24 Minutes | 0 (0.0%) | 17 (4.9%) |
| 25 to 29 Minutes | 10 (2.0%) | 12 (3.5%) |
| 30 to 34 Minutes | 68 (13.8%) | 28 (8.1%) |
| 35 to 39 Minutes | 0 (0.0%) | 21 (6.1%) |
| 40 to 44 Minutes | 0 (0.0%) | 0 (0.0%) |
| 45 to 59 Minutes | 0 (0.0%) | 0 (0.0%) |
| 60 to 89 Minutes | 24 (4.9%) | 30 (8.7%) |
| 90 or more Minutes | 6 (1.2%) | 11 (3.2%) |
Time of Departure to Work by Sex in Boron
The most frequent times of departure to work in Boron are 7:00 AM to 7:29 AM (138, 28.0%) for males and 5:30 AM to 5:59 AM (86, 25.0%) for females.
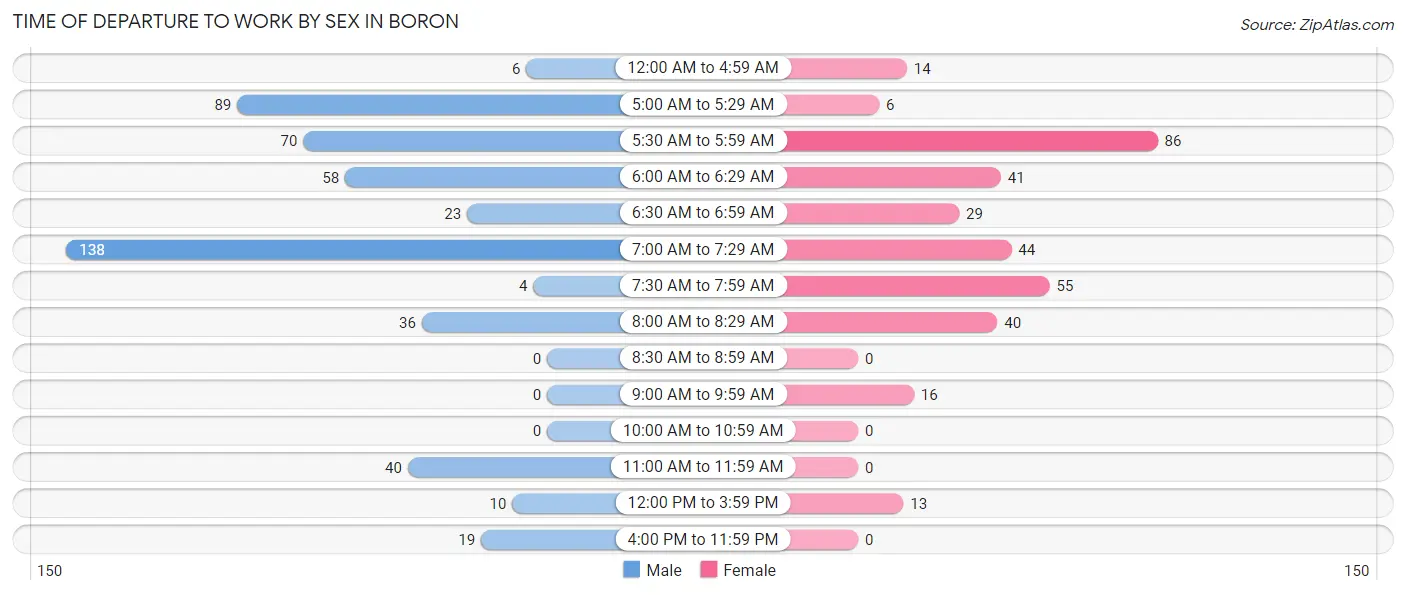
| Time of Departure | Male | Female |
| 12:00 AM to 4:59 AM | 6 (1.2%) | 14 (4.1%) |
| 5:00 AM to 5:29 AM | 89 (18.0%) | 6 (1.7%) |
| 5:30 AM to 5:59 AM | 70 (14.2%) | 86 (25.0%) |
| 6:00 AM to 6:29 AM | 58 (11.8%) | 41 (11.9%) |
| 6:30 AM to 6:59 AM | 23 (4.7%) | 29 (8.4%) |
| 7:00 AM to 7:29 AM | 138 (28.0%) | 44 (12.8%) |
| 7:30 AM to 7:59 AM | 4 (0.8%) | 55 (16.0%) |
| 8:00 AM to 8:29 AM | 36 (7.3%) | 40 (11.6%) |
| 8:30 AM to 8:59 AM | 0 (0.0%) | 0 (0.0%) |
| 9:00 AM to 9:59 AM | 0 (0.0%) | 16 (4.6%) |
| 10:00 AM to 10:59 AM | 0 (0.0%) | 0 (0.0%) |
| 11:00 AM to 11:59 AM | 40 (8.1%) | 0 (0.0%) |
| 12:00 PM to 3:59 PM | 10 (2.0%) | 13 (3.8%) |
| 4:00 PM to 11:59 PM | 19 (3.8%) | 0 (0.0%) |
| Total | 493 (100.0%) | 344 (100.0%) |
Housing Occupancy in Boron
Occupancy by Ownership in Boron
Of the total 884 dwellings in Boron, owner-occupied units account for 456 (51.6%), while renter-occupied units make up 428 (48.4%).
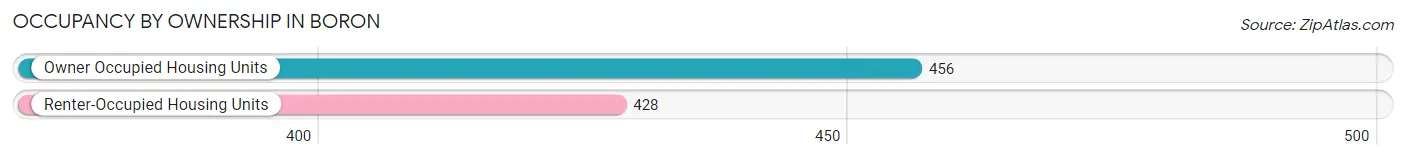
| Occupancy | # Housing Units | % Housing Units |
| Owner Occupied Housing Units | 456 | 51.6% |
| Renter-Occupied Housing Units | 428 | 48.4% |
| Total Occupied Housing Units | 884 | 100.0% |
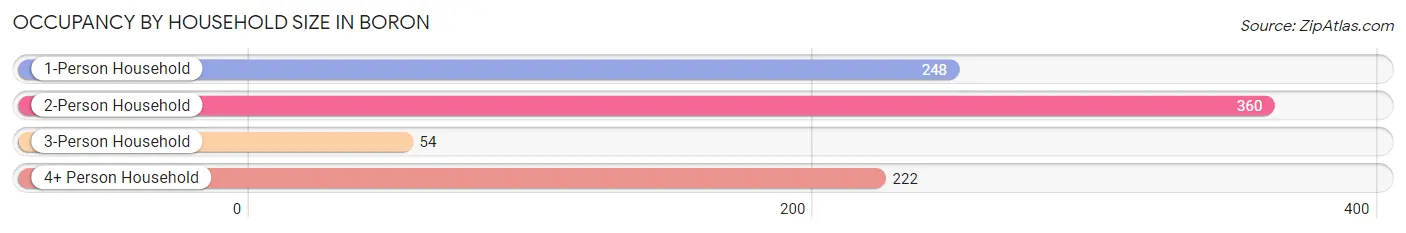
Occupancy by Household Size in Boron
| Household Size | # Housing Units | % Housing Units |
| 1-Person Household | 248 | 28.1% |
| 2-Person Household | 360 | 40.7% |
| 3-Person Household | 54 | 6.1% |
| 4+ Person Household | 222 | 25.1% |
| Total Housing Units | 884 | 100.0% |
Occupancy by Ownership by Household Size in Boron
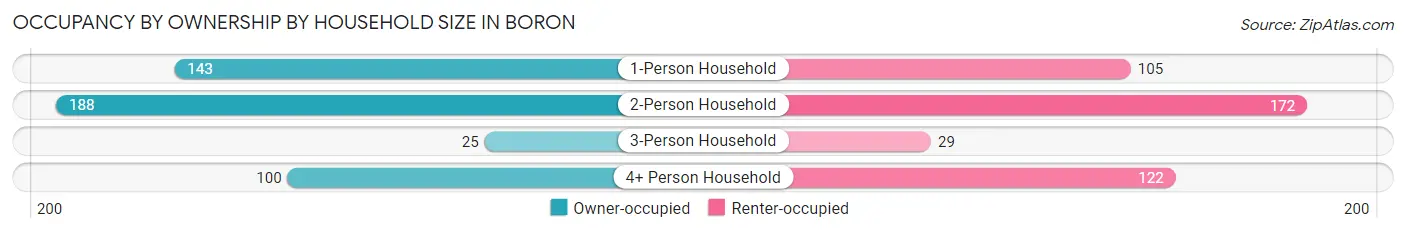
| Household Size | Owner-occupied | Renter-occupied |
| 1-Person Household | 143 (57.7%) | 105 (42.3%) |
| 2-Person Household | 188 (52.2%) | 172 (47.8%) |
| 3-Person Household | 25 (46.3%) | 29 (53.7%) |
| 4+ Person Household | 100 (45.1%) | 122 (54.9%) |
| Total Housing Units | 456 (51.6%) | 428 (48.4%) |
Occupancy by Educational Attainment in Boron
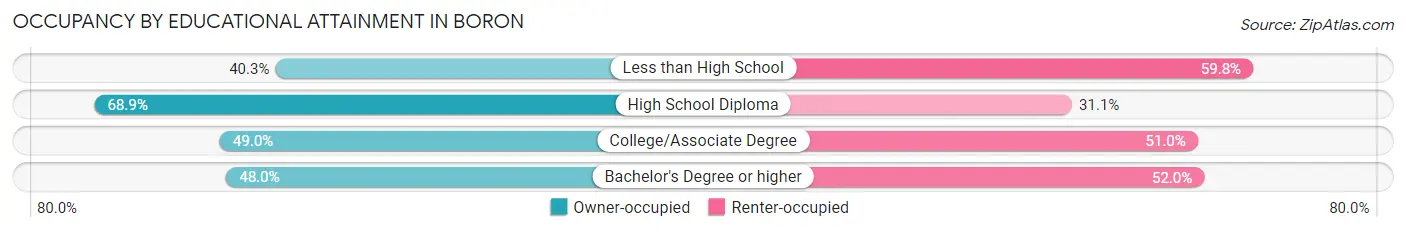
| Household Size | Owner-occupied | Renter-occupied |
| Less than High School | 64 (40.3%) | 95 (59.8%) |
| High School Diploma | 133 (68.9%) | 60 (31.1%) |
| College/Associate Degree | 175 (49.0%) | 182 (51.0%) |
| Bachelor's Degree or higher | 84 (48.0%) | 91 (52.0%) |
Occupancy by Age of Householder in Boron
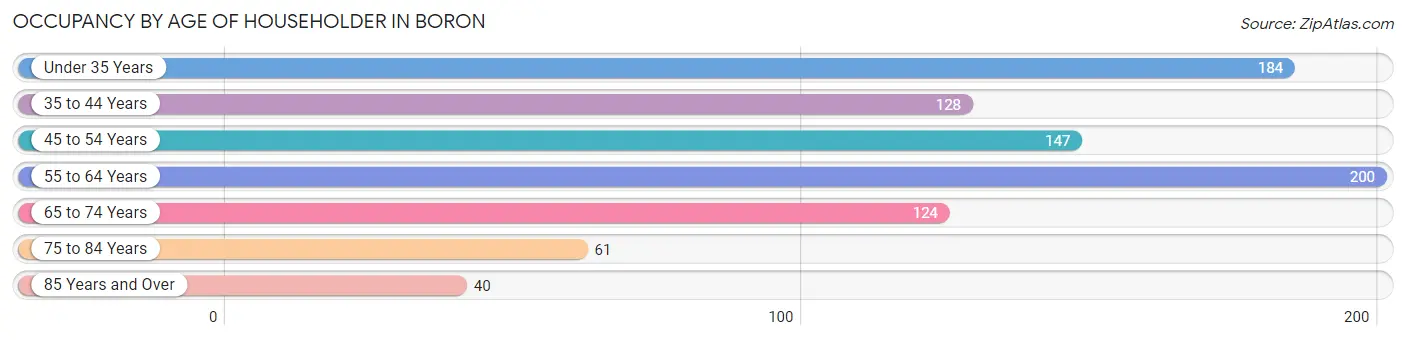
| Age Bracket | # Households | % Households |
| Under 35 Years | 184 | 20.8% |
| 35 to 44 Years | 128 | 14.5% |
| 45 to 54 Years | 147 | 16.6% |
| 55 to 64 Years | 200 | 22.6% |
| 65 to 74 Years | 124 | 14.0% |
| 75 to 84 Years | 61 | 6.9% |
| 85 Years and Over | 40 | 4.5% |
| Total | 884 | 100.0% |
Housing Finances in Boron
Median Income by Occupancy in Boron
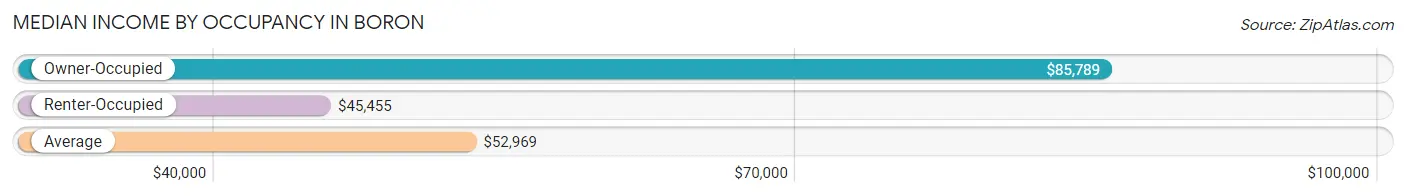
| Occupancy Type | # Households | Median Income |
| Owner-Occupied | 456 (51.6%) | $85,789 |
| Renter-Occupied | 428 (48.4%) | $45,455 |
| Average | 884 (100.0%) | $52,969 |
Occupancy by Householder Income Bracket in Boron
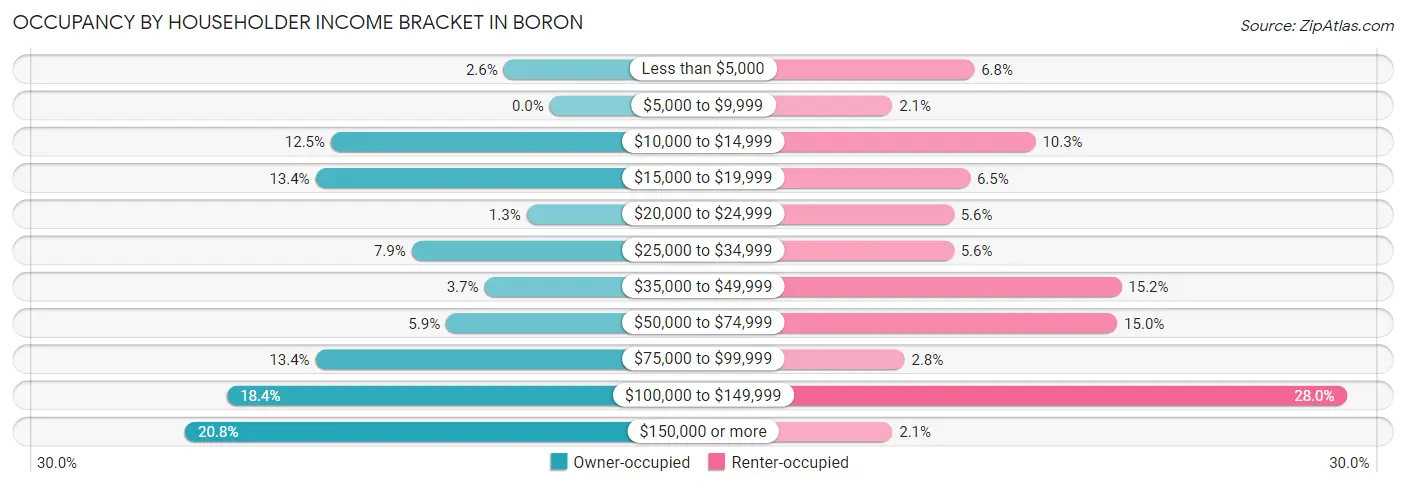
| Income Bracket | Owner-occupied | Renter-occupied |
| Less than $5,000 | 12 (2.6%) | 29 (6.8%) |
| $5,000 to $9,999 | 0 (0.0%) | 9 (2.1%) |
| $10,000 to $14,999 | 57 (12.5%) | 44 (10.3%) |
| $15,000 to $19,999 | 61 (13.4%) | 28 (6.5%) |
| $20,000 to $24,999 | 6 (1.3%) | 24 (5.6%) |
| $25,000 to $34,999 | 36 (7.9%) | 24 (5.6%) |
| $35,000 to $49,999 | 17 (3.7%) | 65 (15.2%) |
| $50,000 to $74,999 | 27 (5.9%) | 64 (14.9%) |
| $75,000 to $99,999 | 61 (13.4%) | 12 (2.8%) |
| $100,000 to $149,999 | 84 (18.4%) | 120 (28.0%) |
| $150,000 or more | 95 (20.8%) | 9 (2.1%) |
| Total | 456 (100.0%) | 428 (100.0%) |
Monthly Housing Cost Tiers in Boron
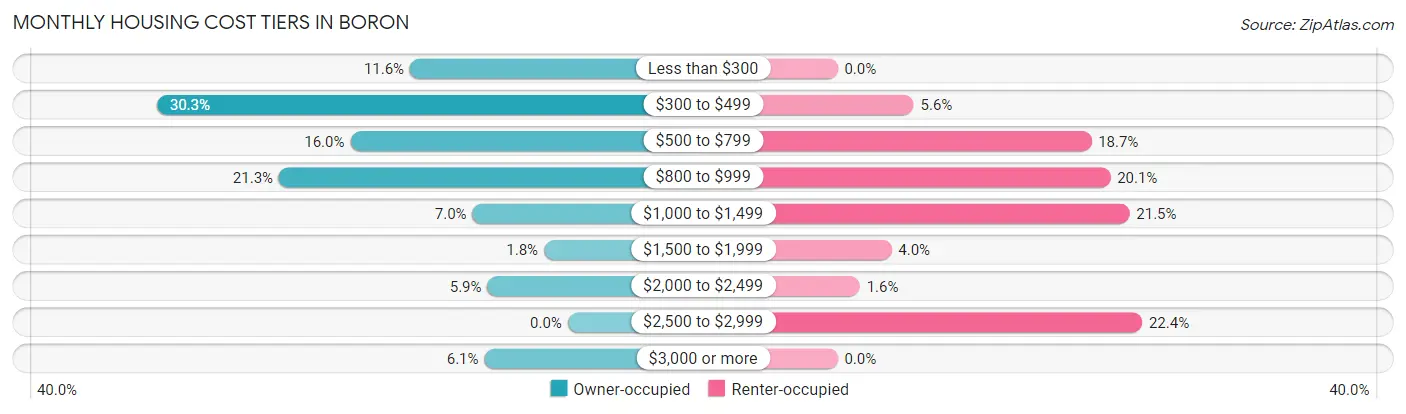
| Monthly Cost | Owner-occupied | Renter-occupied |
| Less than $300 | 53 (11.6%) | 0 (0.0%) |
| $300 to $499 | 138 (30.3%) | 24 (5.6%) |
| $500 to $799 | 73 (16.0%) | 80 (18.7%) |
| $800 to $999 | 97 (21.3%) | 86 (20.1%) |
| $1,000 to $1,499 | 32 (7.0%) | 92 (21.5%) |
| $1,500 to $1,999 | 8 (1.8%) | 17 (4.0%) |
| $2,000 to $2,499 | 27 (5.9%) | 7 (1.6%) |
| $2,500 to $2,999 | 0 (0.0%) | 96 (22.4%) |
| $3,000 or more | 28 (6.1%) | 0 (0.0%) |
| Total | 456 (100.0%) | 428 (100.0%) |
Physical Housing Characteristics in Boron
Housing Structures in Boron
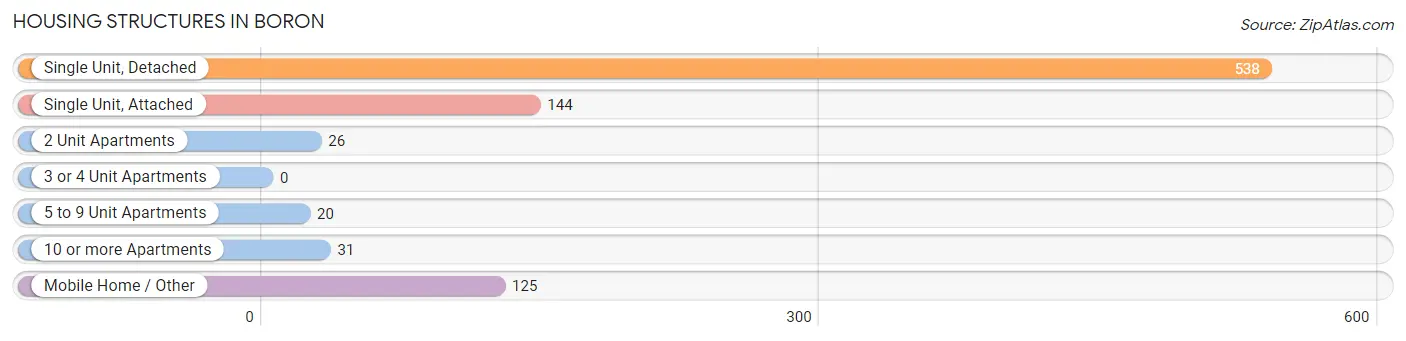
| Structure Type | # Housing Units | % Housing Units |
| Single Unit, Detached | 538 | 60.9% |
| Single Unit, Attached | 144 | 16.3% |
| 2 Unit Apartments | 26 | 2.9% |
| 3 or 4 Unit Apartments | 0 | 0.0% |
| 5 to 9 Unit Apartments | 20 | 2.3% |
| 10 or more Apartments | 31 | 3.5% |
| Mobile Home / Other | 125 | 14.1% |
| Total | 884 | 100.0% |
Housing Structures by Occupancy in Boron
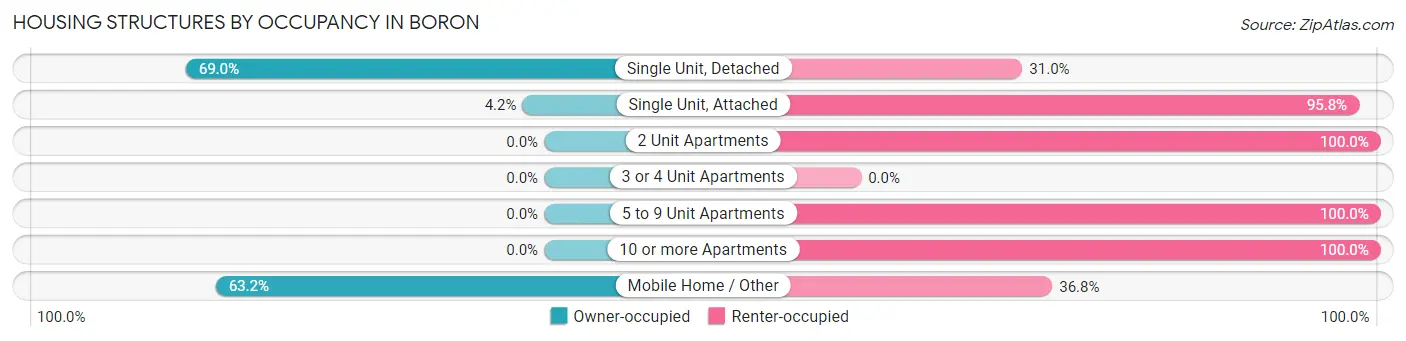
| Structure Type | Owner-occupied | Renter-occupied |
| Single Unit, Detached | 371 (69.0%) | 167 (31.0%) |
| Single Unit, Attached | 6 (4.2%) | 138 (95.8%) |
| 2 Unit Apartments | 0 (0.0%) | 26 (100.0%) |
| 3 or 4 Unit Apartments | 0 (0.0%) | 0 (0.0%) |
| 5 to 9 Unit Apartments | 0 (0.0%) | 20 (100.0%) |
| 10 or more Apartments | 0 (0.0%) | 31 (100.0%) |
| Mobile Home / Other | 79 (63.2%) | 46 (36.8%) |
| Total | 456 (51.6%) | 428 (48.4%) |
Housing Structures by Number of Rooms in Boron
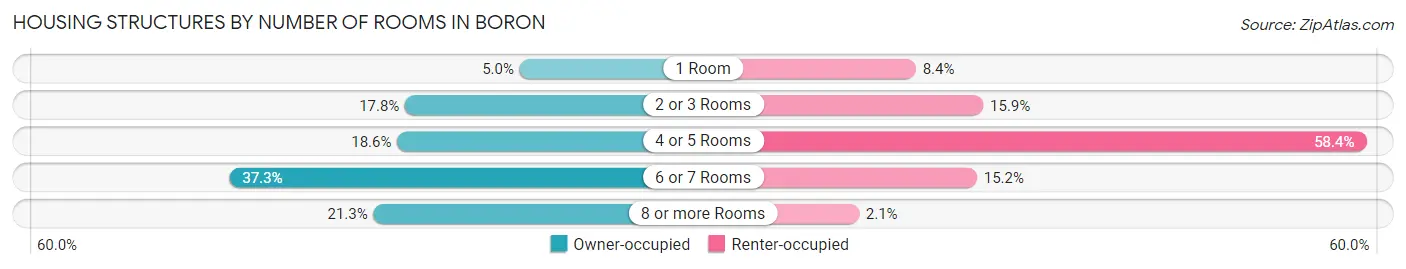
| Number of Rooms | Owner-occupied | Renter-occupied |
| 1 Room | 23 (5.0%) | 36 (8.4%) |
| 2 or 3 Rooms | 81 (17.8%) | 68 (15.9%) |
| 4 or 5 Rooms | 85 (18.6%) | 250 (58.4%) |
| 6 or 7 Rooms | 170 (37.3%) | 65 (15.2%) |
| 8 or more Rooms | 97 (21.3%) | 9 (2.1%) |
| Total | 456 (100.0%) | 428 (100.0%) |
Housing Structure by Heating Type in Boron
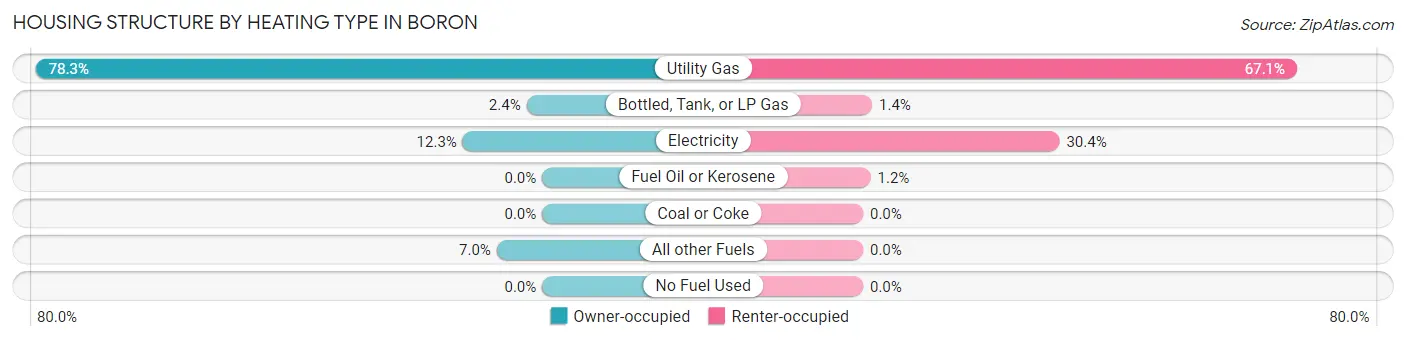
| Heating Type | Owner-occupied | Renter-occupied |
| Utility Gas | 357 (78.3%) | 287 (67.1%) |
| Bottled, Tank, or LP Gas | 11 (2.4%) | 6 (1.4%) |
| Electricity | 56 (12.3%) | 130 (30.4%) |
| Fuel Oil or Kerosene | 0 (0.0%) | 5 (1.2%) |
| Coal or Coke | 0 (0.0%) | 0 (0.0%) |
| All other Fuels | 32 (7.0%) | 0 (0.0%) |
| No Fuel Used | 0 (0.0%) | 0 (0.0%) |
| Total | 456 (100.0%) | 428 (100.0%) |
Household Vehicle Usage in Boron
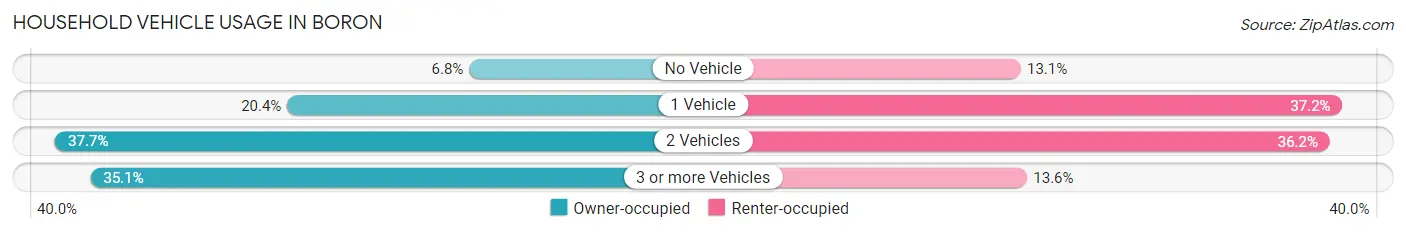
| Vehicles per Household | Owner-occupied | Renter-occupied |
| No Vehicle | 31 (6.8%) | 56 (13.1%) |
| 1 Vehicle | 93 (20.4%) | 159 (37.1%) |
| 2 Vehicles | 172 (37.7%) | 155 (36.2%) |
| 3 or more Vehicles | 160 (35.1%) | 58 (13.6%) |
| Total | 456 (100.0%) | 428 (100.0%) |
Real Estate & Mortgages in Boron
Real Estate and Mortgage Overview in Boron
| Characteristic | Without Mortgage | With Mortgage |
| Housing Units | 221 | 235 |
| Median Property Value | $96,100 | $143,800 |
| Median Household Income | $59,375 | $87 |
| Monthly Housing Costs | $364 | $28 |
| Real Estate Taxes | $635 | $23 |
Property Value by Mortgage Status in Boron
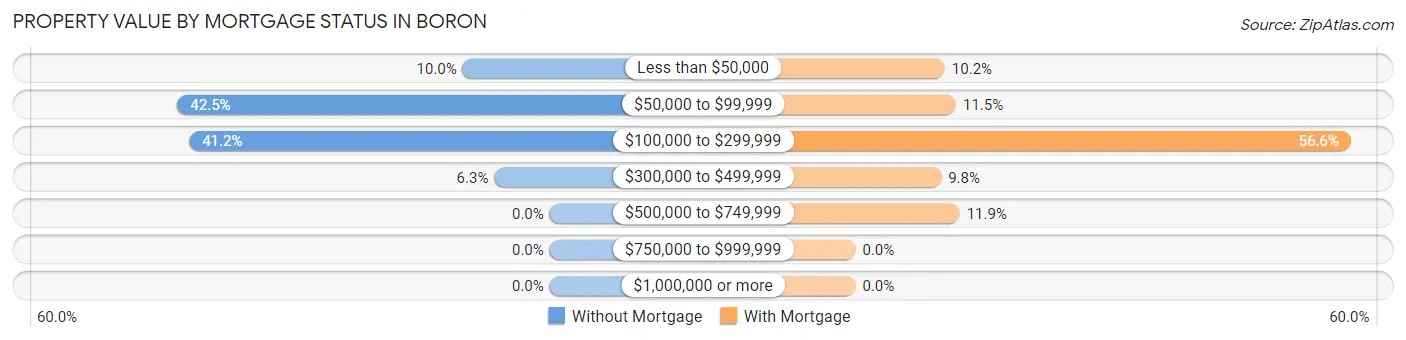
| Property Value | Without Mortgage | With Mortgage |
| Less than $50,000 | 22 (10.0%) | 24 (10.2%) |
| $50,000 to $99,999 | 94 (42.5%) | 27 (11.5%) |
| $100,000 to $299,999 | 91 (41.2%) | 133 (56.6%) |
| $300,000 to $499,999 | 14 (6.3%) | 23 (9.8%) |
| $500,000 to $749,999 | 0 (0.0%) | 28 (11.9%) |
| $750,000 to $999,999 | 0 (0.0%) | 0 (0.0%) |
| $1,000,000 or more | 0 (0.0%) | 0 (0.0%) |
| Total | 221 (100.0%) | 235 (100.0%) |
Household Income by Mortgage Status in Boron
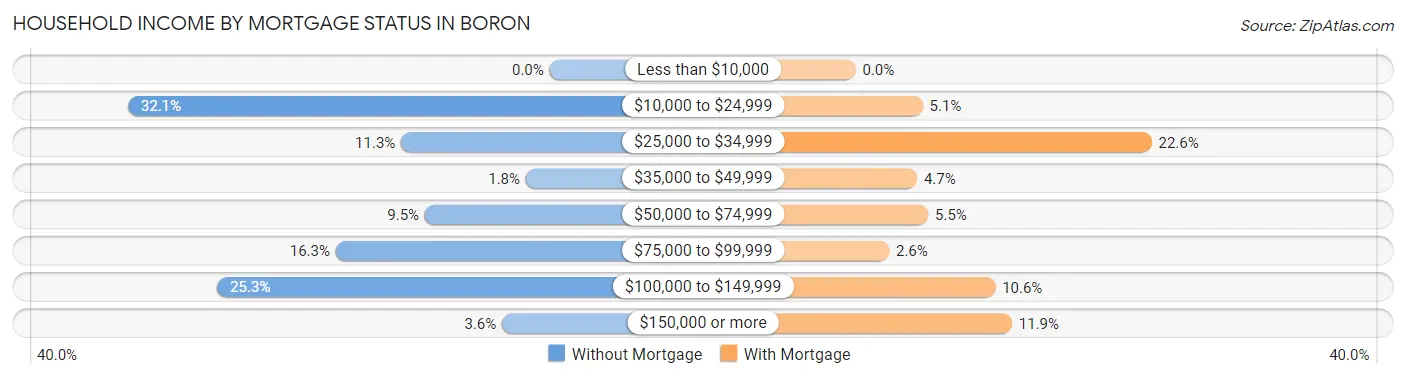
| Household Income | Without Mortgage | With Mortgage |
| Less than $10,000 | 0 (0.0%) | 0 (0.0%) |
| $10,000 to $24,999 | 71 (32.1%) | 12 (5.1%) |
| $25,000 to $34,999 | 25 (11.3%) | 53 (22.6%) |
| $35,000 to $49,999 | 4 (1.8%) | 11 (4.7%) |
| $50,000 to $74,999 | 21 (9.5%) | 13 (5.5%) |
| $75,000 to $99,999 | 36 (16.3%) | 6 (2.5%) |
| $100,000 to $149,999 | 56 (25.3%) | 25 (10.6%) |
| $150,000 or more | 8 (3.6%) | 28 (11.9%) |
| Total | 221 (100.0%) | 235 (100.0%) |
Property Value to Household Income Ratio in Boron
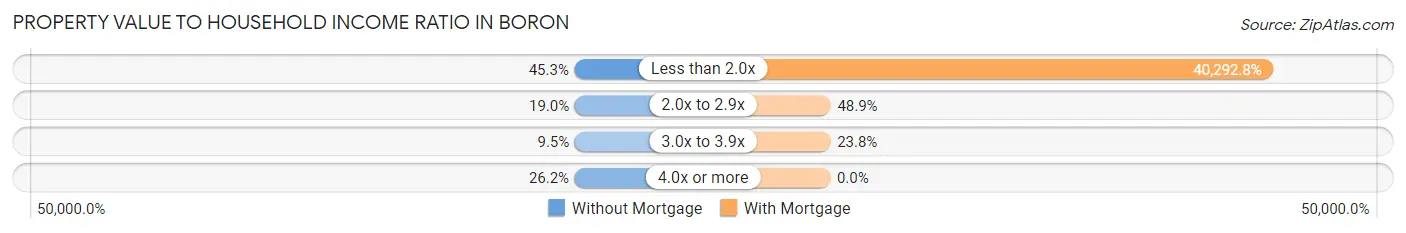
| Value-to-Income Ratio | Without Mortgage | With Mortgage |
| Less than 2.0x | 100 (45.3%) | 94,688 (40,292.8%) |
| 2.0x to 2.9x | 42 (19.0%) | 115 (48.9%) |
| 3.0x to 3.9x | 21 (9.5%) | 56 (23.8%) |
| 4.0x or more | 58 (26.2%) | 0 (0.0%) |
| Total | 221 (100.0%) | 235 (100.0%) |
Real Estate Taxes by Mortgage Status in Boron
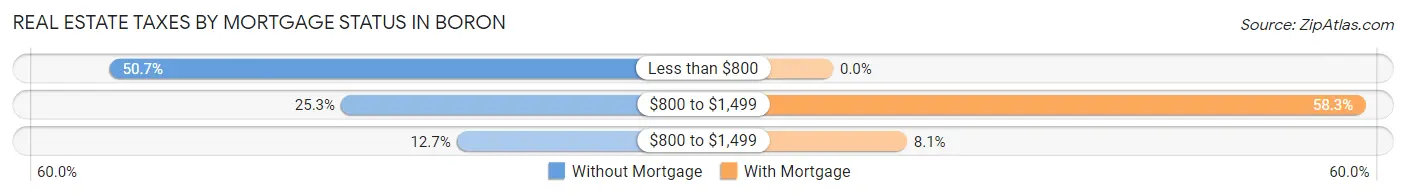
| Property Taxes | Without Mortgage | With Mortgage |
| Less than $800 | 112 (50.7%) | 0 (0.0%) |
| $800 to $1,499 | 56 (25.3%) | 137 (58.3%) |
| $800 to $1,499 | 28 (12.7%) | 19 (8.1%) |
| Total | 221 (100.0%) | 235 (100.0%) |
Health & Disability in Boron
Health Insurance Coverage by Age in Boron
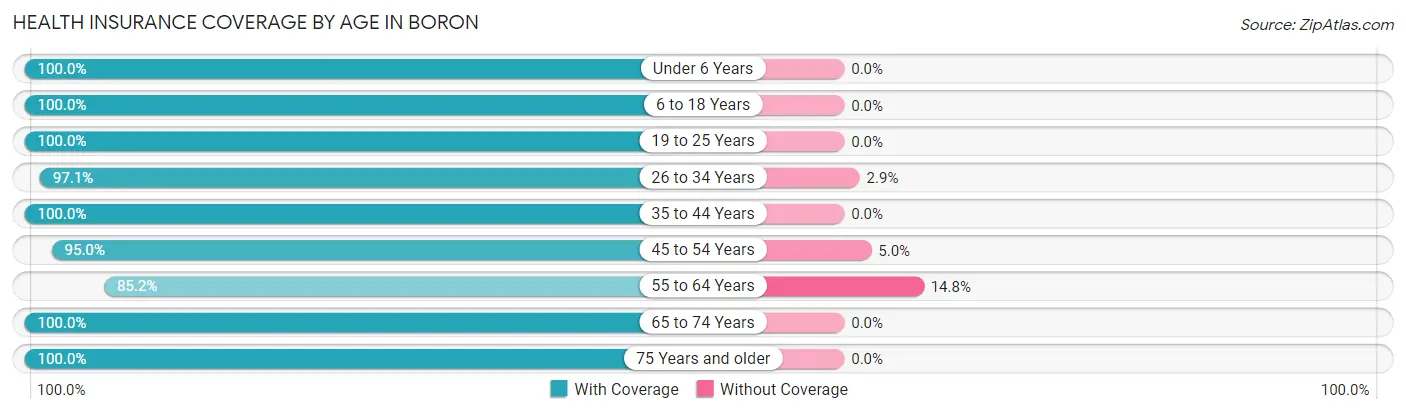
| Age Bracket | With Coverage | Without Coverage |
| Under 6 Years | 163 (100.0%) | 0 (0.0%) |
| 6 to 18 Years | 525 (100.0%) | 0 (0.0%) |
| 19 to 25 Years | 144 (100.0%) | 0 (0.0%) |
| 26 to 34 Years | 442 (97.1%) | 13 (2.9%) |
| 35 to 44 Years | 230 (100.0%) | 0 (0.0%) |
| 45 to 54 Years | 264 (95.0%) | 14 (5.0%) |
| 55 to 64 Years | 276 (85.2%) | 48 (14.8%) |
| 65 to 74 Years | 219 (100.0%) | 0 (0.0%) |
| 75 Years and older | 131 (100.0%) | 0 (0.0%) |
| Total | 2,394 (97.0%) | 75 (3.0%) |
Health Insurance Coverage by Citizenship Status in Boron
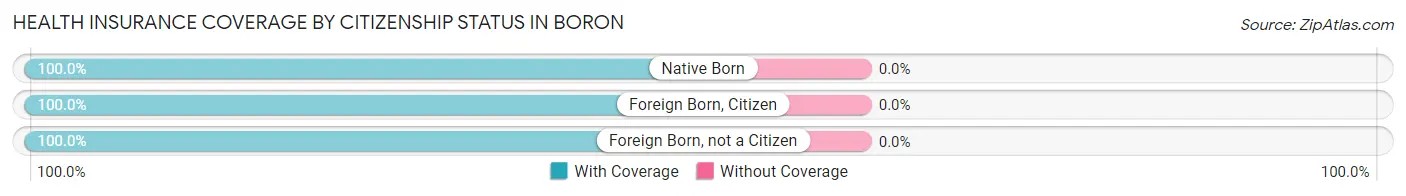
| Citizenship Status | With Coverage | Without Coverage |
| Native Born | 163 (100.0%) | 0 (0.0%) |
| Foreign Born, Citizen | 525 (100.0%) | 0 (0.0%) |
| Foreign Born, not a Citizen | 144 (100.0%) | 0 (0.0%) |
Health Insurance Coverage by Household Income in Boron
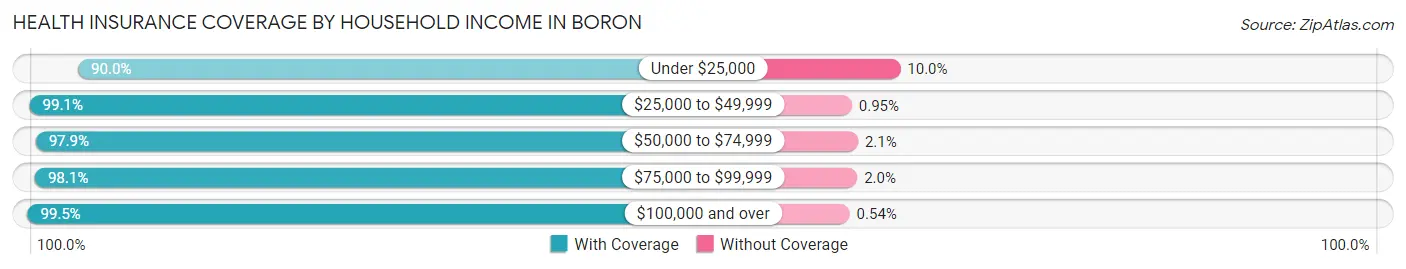
| Household Income | With Coverage | Without Coverage |
| Under $25,000 | 484 (90.0%) | 54 (10.0%) |
| $25,000 to $49,999 | 416 (99.1%) | 4 (0.9%) |
| $50,000 to $74,999 | 328 (97.9%) | 7 (2.1%) |
| $75,000 to $99,999 | 251 (98.1%) | 5 (1.9%) |
| $100,000 and over | 915 (99.5%) | 5 (0.5%) |
Public vs Private Health Insurance Coverage by Age in Boron
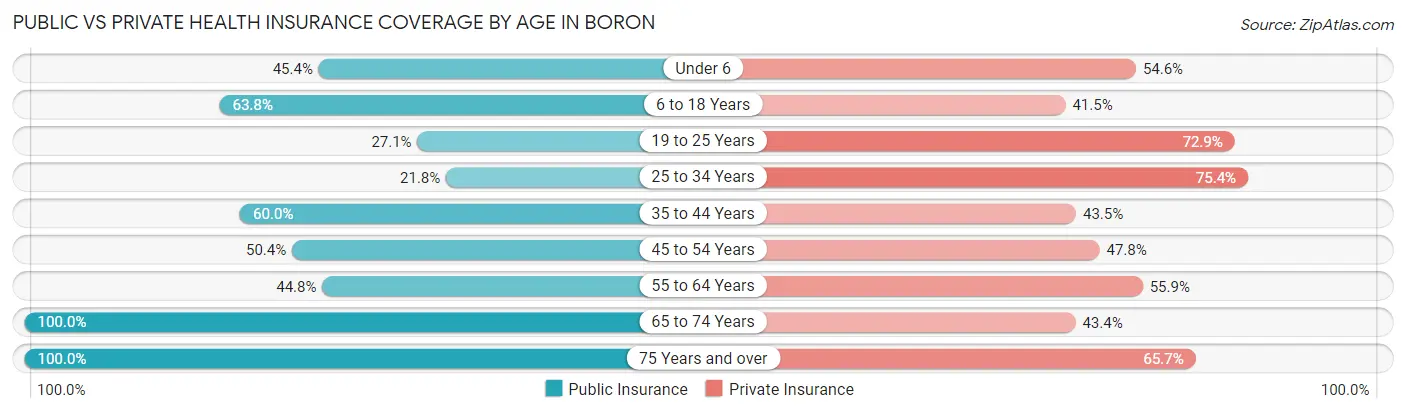
| Age Bracket | Public Insurance | Private Insurance |
| Under 6 | 74 (45.4%) | 89 (54.6%) |
| 6 to 18 Years | 335 (63.8%) | 218 (41.5%) |
| 19 to 25 Years | 39 (27.1%) | 105 (72.9%) |
| 25 to 34 Years | 99 (21.8%) | 343 (75.4%) |
| 35 to 44 Years | 138 (60.0%) | 100 (43.5%) |
| 45 to 54 Years | 140 (50.4%) | 133 (47.8%) |
| 55 to 64 Years | 145 (44.8%) | 181 (55.9%) |
| 65 to 74 Years | 219 (100.0%) | 95 (43.4%) |
| 75 Years and over | 131 (100.0%) | 86 (65.6%) |
| Total | 1,320 (53.5%) | 1,350 (54.7%) |
Disability Status by Sex by Age in Boron
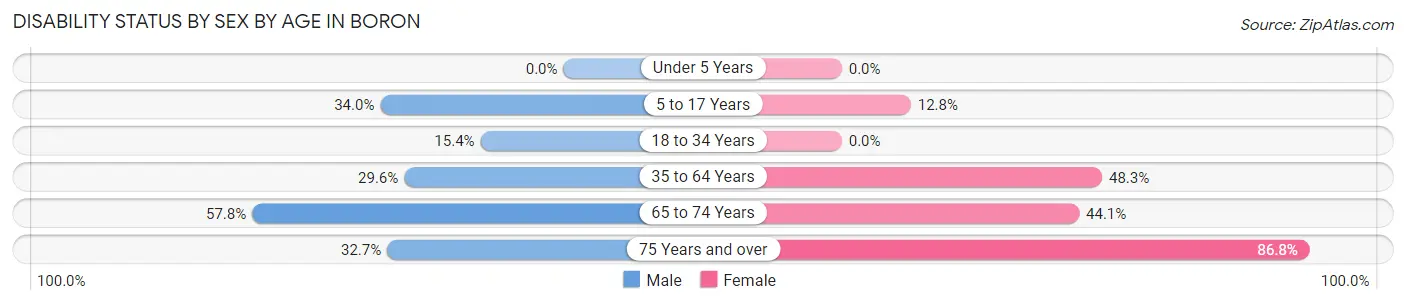
| Age Bracket | Male | Female |
| Under 5 Years | 0 (0.0%) | 0 (0.0%) |
| 5 to 17 Years | 104 (34.0%) | 26 (12.8%) |
| 18 to 34 Years | 61 (15.4%) | 0 (0.0%) |
| 35 to 64 Years | 115 (29.6%) | 214 (48.3%) |
| 65 to 74 Years | 78 (57.8%) | 37 (44.1%) |
| 75 Years and over | 18 (32.7%) | 66 (86.8%) |
Disability Class by Sex by Age in Boron
Disability Class: Hearing Difficulty
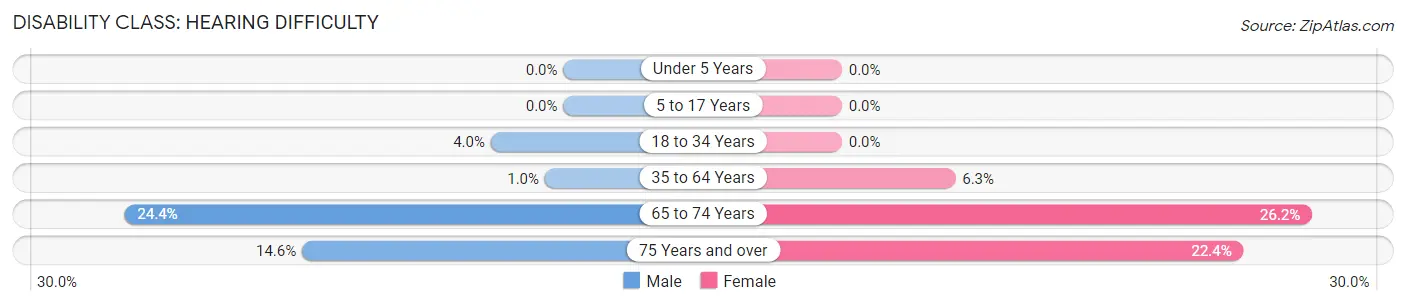
| Age Bracket | Male | Female |
| Under 5 Years | 0 (0.0%) | 0 (0.0%) |
| 5 to 17 Years | 0 (0.0%) | 0 (0.0%) |
| 18 to 34 Years | 16 (4.0%) | 0 (0.0%) |
| 35 to 64 Years | 4 (1.0%) | 28 (6.3%) |
| 65 to 74 Years | 33 (24.4%) | 22 (26.2%) |
| 75 Years and over | 8 (14.5%) | 17 (22.4%) |
Disability Class: Vision Difficulty
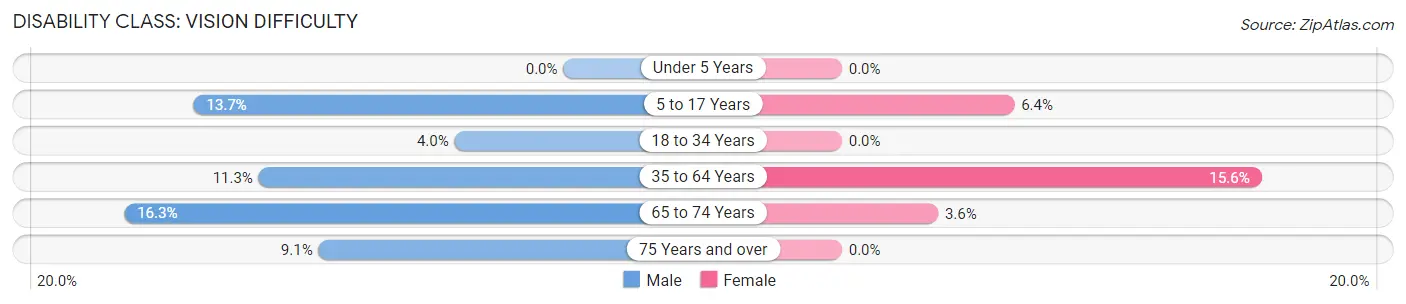
| Age Bracket | Male | Female |
| Under 5 Years | 0 (0.0%) | 0 (0.0%) |
| 5 to 17 Years | 42 (13.7%) | 13 (6.4%) |
| 18 to 34 Years | 16 (4.0%) | 0 (0.0%) |
| 35 to 64 Years | 44 (11.3%) | 69 (15.6%) |
| 65 to 74 Years | 22 (16.3%) | 3 (3.6%) |
| 75 Years and over | 5 (9.1%) | 0 (0.0%) |
Disability Class: Cognitive Difficulty
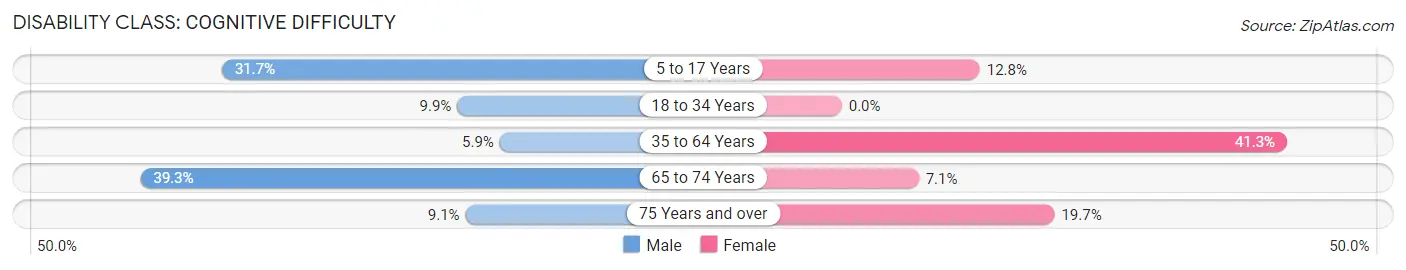
| Age Bracket | Male | Female |
| 5 to 17 Years | 97 (31.7%) | 26 (12.8%) |
| 18 to 34 Years | 39 (9.9%) | 0 (0.0%) |
| 35 to 64 Years | 23 (5.9%) | 183 (41.3%) |
| 65 to 74 Years | 53 (39.3%) | 6 (7.1%) |
| 75 Years and over | 5 (9.1%) | 15 (19.7%) |
Disability Class: Ambulatory Difficulty
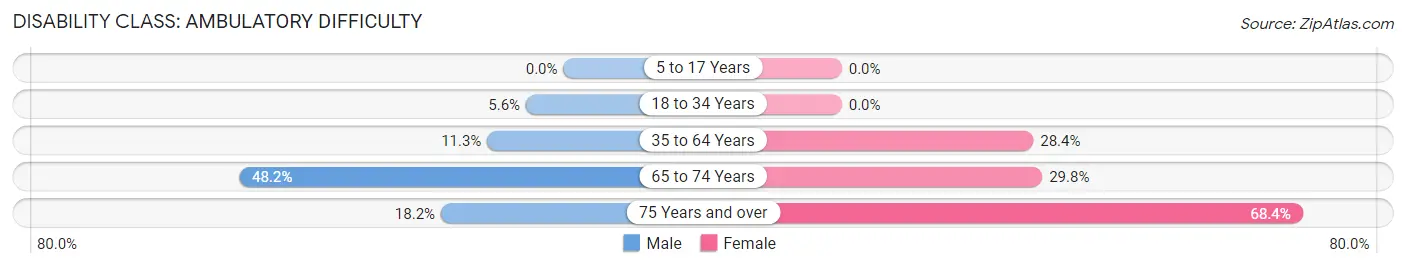
| Age Bracket | Male | Female |
| 5 to 17 Years | 0 (0.0%) | 0 (0.0%) |
| 18 to 34 Years | 22 (5.6%) | 0 (0.0%) |
| 35 to 64 Years | 44 (11.3%) | 126 (28.4%) |
| 65 to 74 Years | 65 (48.1%) | 25 (29.8%) |
| 75 Years and over | 10 (18.2%) | 52 (68.4%) |
Disability Class: Self-Care Difficulty
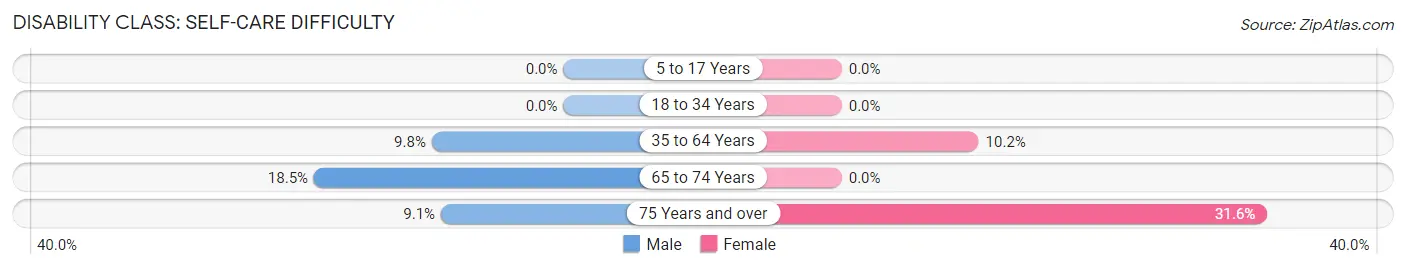
| Age Bracket | Male | Female |
| 5 to 17 Years | 0 (0.0%) | 0 (0.0%) |
| 18 to 34 Years | 0 (0.0%) | 0 (0.0%) |
| 35 to 64 Years | 38 (9.8%) | 45 (10.2%) |
| 65 to 74 Years | 25 (18.5%) | 0 (0.0%) |
| 75 Years and over | 5 (9.1%) | 24 (31.6%) |
Technology Access in Boron
Computing Device Access in Boron
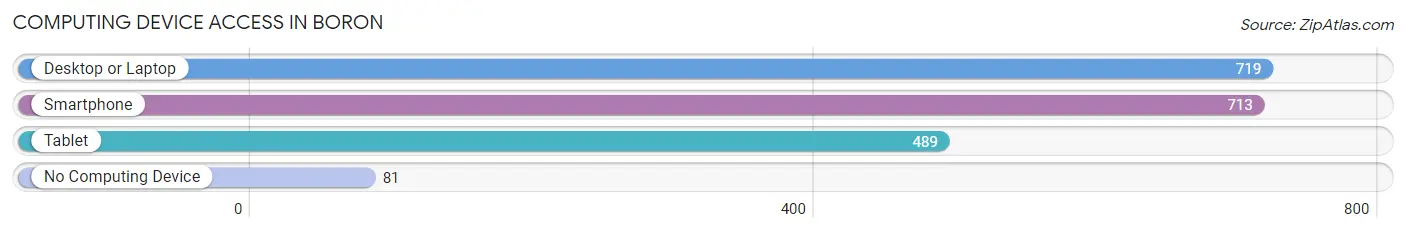
| Device Type | # Households | % Households |
| Desktop or Laptop | 719 | 81.3% |
| Smartphone | 713 | 80.7% |
| Tablet | 489 | 55.3% |
| No Computing Device | 81 | 9.2% |
| Total | 884 | 100.0% |
Internet Access in Boron
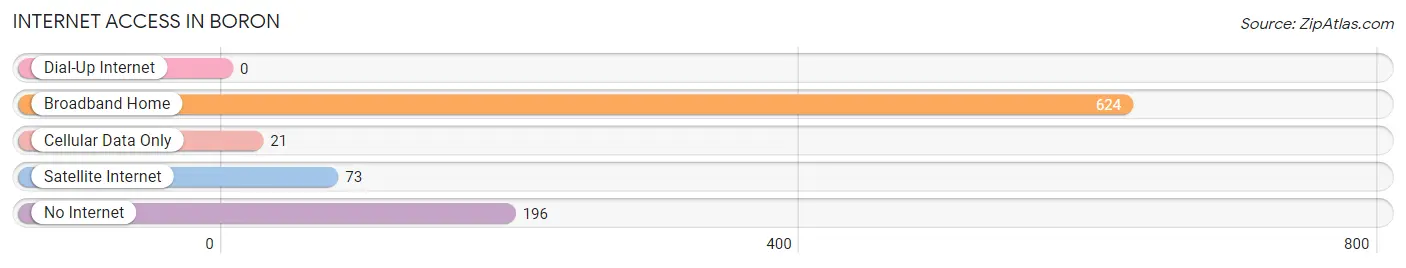
| Internet Type | # Households | % Households |
| Dial-Up Internet | 0 | 0.0% |
| Broadband Home | 624 | 70.6% |
| Cellular Data Only | 21 | 2.4% |
| Satellite Internet | 73 | 8.3% |
| No Internet | 196 | 22.2% |
| Total | 884 | 100.0% |
Boron Summary
Boron is a census-designated place (CDP) located in Kern County, California, United States. It is located in the Mojave Desert, approximately 25 miles (40 km) east of Mojave, and is part of the Greater Los Angeles Area. The population was 2,253 at the 2010 census, up from 2,025 at the 2000 census.
Geography
Boron is located at 35°1′44″N 117°40′3″W (35.02889, -117.66750). According to the United States Census Bureau, the CDP has a total area of 10.3 square miles (26.7 km2), all of it land.
History
The area was first settled in the late 19th century by miners and ranchers. The town was named after the element boron, which was discovered in the area in 1913. The town was officially founded in 1918.
In the 1920s, the Pacific Coast Borax Company built a large borax processing plant in Boron. The plant was the largest of its kind in the world and employed hundreds of people. The plant closed in 1972, but the town remains a major center for borax mining and processing.
Economy
Boron is the home of the world's largest borax mine, operated by Rio Tinto Borax. The mine produces approximately 2.5 million tons of borax ore each year, which is processed into borax, boric acid, and other boron compounds. The mine is the largest employer in the area, providing jobs for over 500 people.
In addition to the borax mine, Boron is home to several other industries, including a solar panel manufacturing plant, a plastics factory, and a cement plant. The town also has a small retail sector, with several stores and restaurants.
Demographics
As of the census of 2000, there were 2,025 people, 645 households, and 517 families residing in the CDP. The population density was 197.2 people per square mile (76.1/km2). There were 709 housing units at an average density of 69.1 per square mile (26.7/km2). The racial makeup of the CDP was 73.2% White, 0.7% African American, 1.2% Native American, 0.7% Asian, 0.1% Pacific Islander, 20.2% from other races, and 4.0% from two or more races. Hispanic or Latino of any race were 33.2% of the population.
There were 645 households, out of which 43.2% had children under the age of 18 living with them, 58.2% were married couples living together, 12.7% had a female householder with no husband present, and 22.2% were non-families. 17.3% of all households were made up of individuals, and 6.2% had someone living alone who was 65 years of age or older. The average household size was 3.14 and the average family size was 3.54.
In the CDP, the population was spread out, with 33.2% under the age of 18, 8.7% from 18 to 24, 28.2% from 25 to 44, 20.2% from 45 to 64, and 9.7% who were 65 years of age or older. The median age was 32 years. For every 100 females, there were 103.2 males. For every 100 females age 18 and over, there were 103.2 males.
The median income for a household in the CDP was $37,917, and the median income for a family was $41,250. Males had a median income of $35,000 versus $25,000 for females. The per capita income for the CDP was $14,845. About 11.2% of families and 13.2% of the population were below the poverty line, including 16.2% of those under age 18 and 8.3% of those age 65 or over.
Common Questions
What is Per Capita Income in Boron?
Per Capita income in Boron is $28,406.
What is the Median Family Income in Boron?
Median Family Income in Boron is $85,921.
What is the Median Household income in Boron?
Median Household Income in Boron is $52,969.
What is Income or Wage Gap in Boron?
Income or Wage Gap in Boron is 13.3%.
Women in Boron earn 86.7 cents for every dollar earned by a man.
What is Family Income Deficit in Boron?
Family Income Deficit in Boron is $12,194.
Families that are below poverty line in Boron earn $12,194 less on average than the poverty threshold level.
What is Inequality or Gini Index in Boron?
Inequality or Gini Index in Boron is 0.47.
What is the Total Population of Boron?
Total Population of Boron is 2,469.
What is the Total Male Population of Boron?
Total Male Population of Boron is 1,336.
What is the Total Female Population of Boron?
Total Female Population of Boron is 1,133.
What is the Ratio of Males per 100 Females in Boron?
There are 117.92 Males per 100 Females in Boron.
What is the Ratio of Females per 100 Males in Boron?
There are 84.81 Females per 100 Males in Boron.
What is the Median Population Age in Boron?
Median Population Age in Boron is 33.7 Years.
What is the Average Family Size in Boron
Average Family Size in Boron is 3.8 People.
What is the Average Household Size in Boron
Average Household Size in Boron is 2.8 People.
How Large is the Labor Force in Boron?
There are 1,028 People in the Labor Forcein in Boron.
What is the Percentage of People in the Labor Force in Boron?
54.5% of People are in the Labor Force in Boron.
What is the Unemployment Rate in Boron?
Unemployment Rate in Boron is 10.9%.