Boonville, CA Map & Demographics
Boonville Map
Boonville Overview
$29,205
PER CAPITA INCOME
$50,577
AVG HOUSEHOLD INCOME
42.7%
WAGE / INCOME GAP [ % ]
57.3¢/ $1
WAGE / INCOME GAP [ $ ]
0.45
INEQUALITY / GINI INDEX
995
TOTAL POPULATION
419
MALE POPULATION
576
FEMALE POPULATION
72.74
MALES / 100 FEMALES
137.47
FEMALES / 100 MALES
42.8
MEDIAN AGE
3.6
AVG FAMILY SIZE
3.0
AVG HOUSEHOLD SIZE
390
LABOR FORCE [ PEOPLE ]
52.1%
PERCENT IN LABOR FORCE
9.7%
UNEMPLOYMENT RATE
Boonville Zip Codes
Boonville Area Codes
Income in Boonville
Income Overview in Boonville
| Characteristic | Number | Measure |
| Per Capita Income | 995 | $29,205 |
| Median Family Income | 220 | $0 |
| Mean Family Income | 220 | $97,213 |
| Median Household Income | 334 | $50,577 |
| Mean Household Income | 334 | $81,279 |
| Income Deficit | 220 | $0 |
| Wage / Income Gap (%) | 995 | 42.66% |
| Wage / Income Gap ($) | 995 | 57.34¢ per $1 |
| Gini / Inequality Index | 995 | 0.45 |
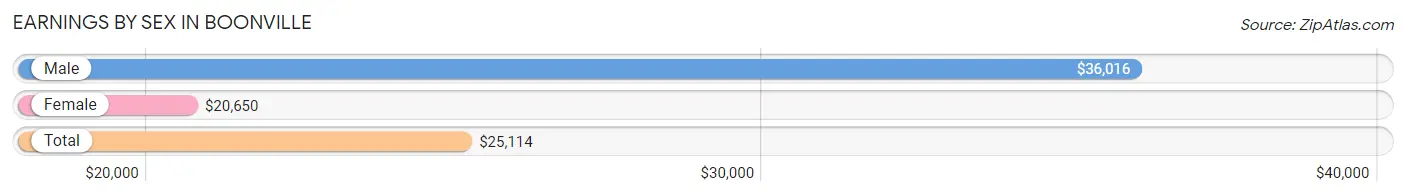
Earnings by Sex in Boonville
Average Earnings in Boonville are $25,114, $36,016 for men and $20,650 for women, a difference of 42.7%.
| Sex | Number | Average Earnings |
| Male | 196 (47.5%) | $36,016 |
| Female | 217 (52.5%) | $20,650 |
| Total | 413 (100.0%) | $25,114 |
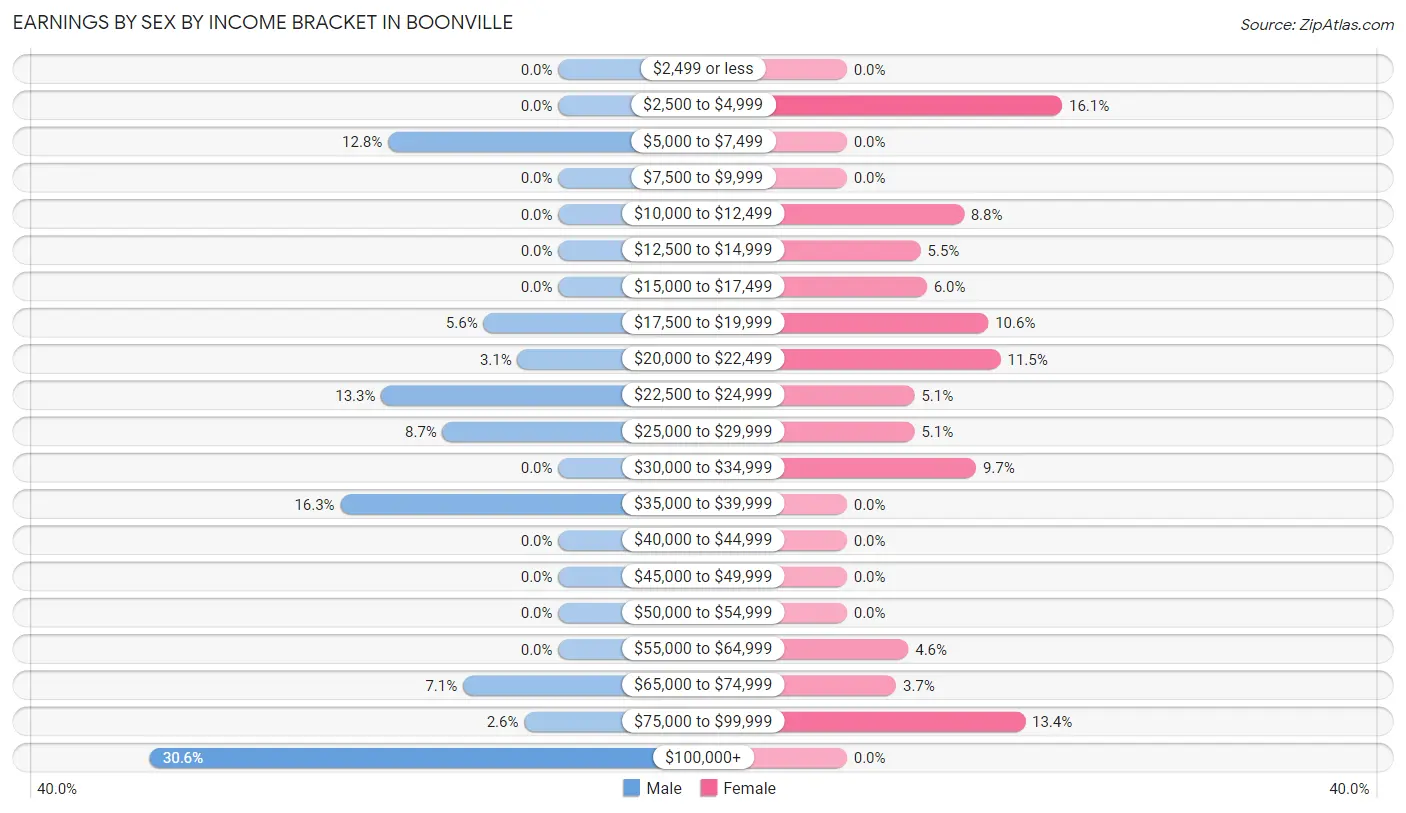
Earnings by Sex by Income Bracket in Boonville
The most common earnings brackets in Boonville are $100,000+ for men (60 | 30.6%) and $2,500 to $4,999 for women (35 | 16.1%).
| Income | Male | Female |
| $2,499 or less | 0 (0.0%) | 0 (0.0%) |
| $2,500 to $4,999 | 0 (0.0%) | 35 (16.1%) |
| $5,000 to $7,499 | 25 (12.8%) | 0 (0.0%) |
| $7,500 to $9,999 | 0 (0.0%) | 0 (0.0%) |
| $10,000 to $12,499 | 0 (0.0%) | 19 (8.8%) |
| $12,500 to $14,999 | 0 (0.0%) | 12 (5.5%) |
| $15,000 to $17,499 | 0 (0.0%) | 13 (6.0%) |
| $17,500 to $19,999 | 11 (5.6%) | 23 (10.6%) |
| $20,000 to $22,499 | 6 (3.1%) | 25 (11.5%) |
| $22,500 to $24,999 | 26 (13.3%) | 11 (5.1%) |
| $25,000 to $29,999 | 17 (8.7%) | 11 (5.1%) |
| $30,000 to $34,999 | 0 (0.0%) | 21 (9.7%) |
| $35,000 to $39,999 | 32 (16.3%) | 0 (0.0%) |
| $40,000 to $44,999 | 0 (0.0%) | 0 (0.0%) |
| $45,000 to $49,999 | 0 (0.0%) | 0 (0.0%) |
| $50,000 to $54,999 | 0 (0.0%) | 0 (0.0%) |
| $55,000 to $64,999 | 0 (0.0%) | 10 (4.6%) |
| $65,000 to $74,999 | 14 (7.1%) | 8 (3.7%) |
| $75,000 to $99,999 | 5 (2.5%) | 29 (13.4%) |
| $100,000+ | 60 (30.6%) | 0 (0.0%) |
| Total | 196 (100.0%) | 217 (100.0%) |
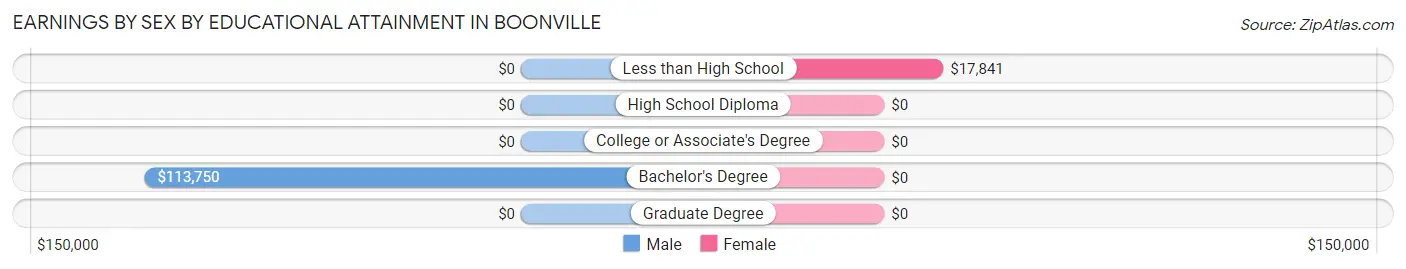
Earnings by Sex by Educational Attainment in Boonville
Average earnings in Boonville are $36,016 for men and $22,400 for women, a difference of 37.8%. Men with an educational attainment of bachelor's degree enjoy the highest average annual earnings of $113,750, while those with bachelor's degree education earn the least with $113,750. Women with an educational attainment of less than high school earn the most with the average annual earnings of $17,841, while those with less than high school education have the smallest earnings of $17,841.
| Educational Attainment | Male Income | Female Income |
| Less than High School | - | - |
| High School Diploma | - | - |
| College or Associate's Degree | - | - |
| Bachelor's Degree | $113,750 | $0 |
| Graduate Degree | - | - |
| Total | $36,016 | $22,400 |
Family Income in Boonville
Family Income Brackets in Boonville
According to the Boonville family income data, there are 62 families falling into the $100,000 to $149,999 income range, which is the most common income bracket and makes up 28.2% of all families.
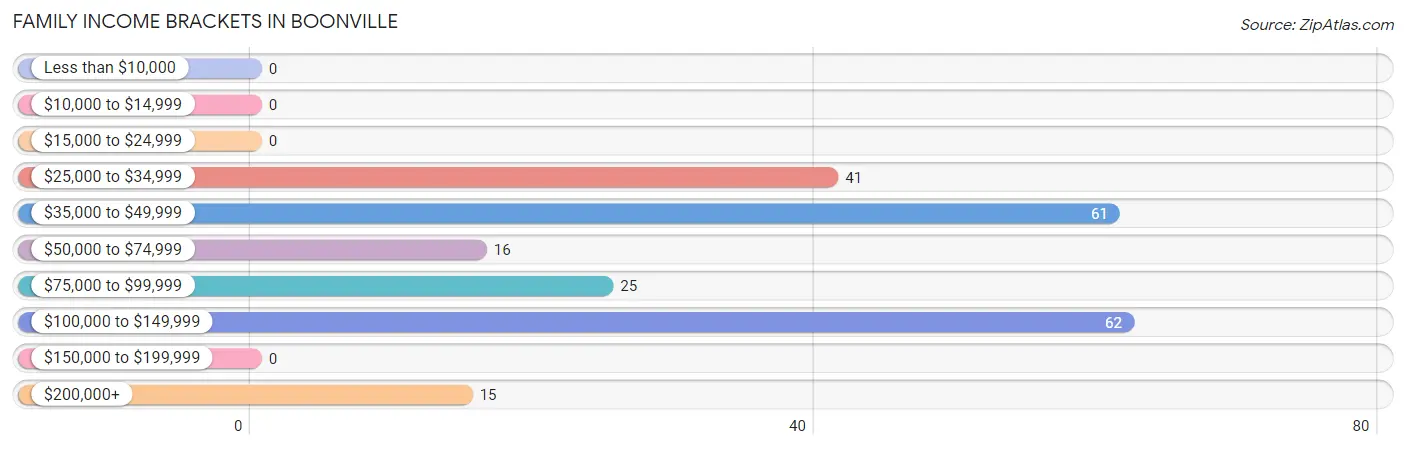
| Income Bracket | # Families | % Families |
| Less than $10,000 | 0 | 0.0% |
| $10,000 to $14,999 | 0 | 0.0% |
| $15,000 to $24,999 | 0 | 0.0% |
| $25,000 to $34,999 | 41 | 18.6% |
| $35,000 to $49,999 | 61 | 27.7% |
| $50,000 to $74,999 | 16 | 7.3% |
| $75,000 to $99,999 | 25 | 11.4% |
| $100,000 to $149,999 | 62 | 28.2% |
| $150,000 to $199,999 | 0 | 0.0% |
| $200,000+ | 15 | 6.8% |
Family Income by Famaliy Size in Boonville
| Income Bracket | # Families | Median Income |
| 2-Person Families | 85 (38.6%) | $0 |
| 3-Person Families | 66 (30.0%) | $0 |
| 4-Person Families | 62 (28.2%) | $0 |
| 5-Person Families | 0 (0.0%) | $0 |
| 6-Person Families | 0 (0.0%) | $0 |
| 7+ Person Families | 7 (3.2%) | $0 |
| Total | 220 (100.0%) | $0 |
Family Income by Number of Earners in Boonville
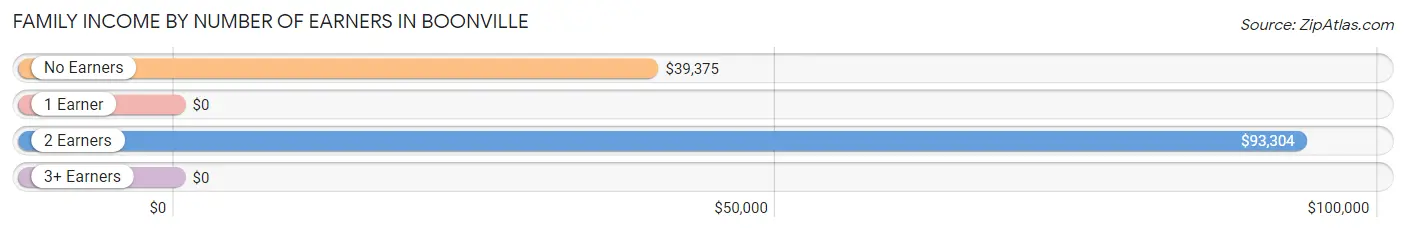
| Number of Earners | # Families | Median Income |
| No Earners | 35 (15.9%) | $39,375 |
| 1 Earner | 65 (29.5%) | $0 |
| 2 Earners | 113 (51.4%) | $93,304 |
| 3+ Earners | 7 (3.2%) | $0 |
| Total | 220 (100.0%) | $0 |
Household Income in Boonville
Household Income Brackets in Boonville
With 79 households falling in the category, the $35,000 to $49,999 income range is the most frequent in Boonville, accounting for 23.6% of all households. In contrast, only 5 households (1.5%) fall into the less than $10,000 income bracket, making it the least populous group.
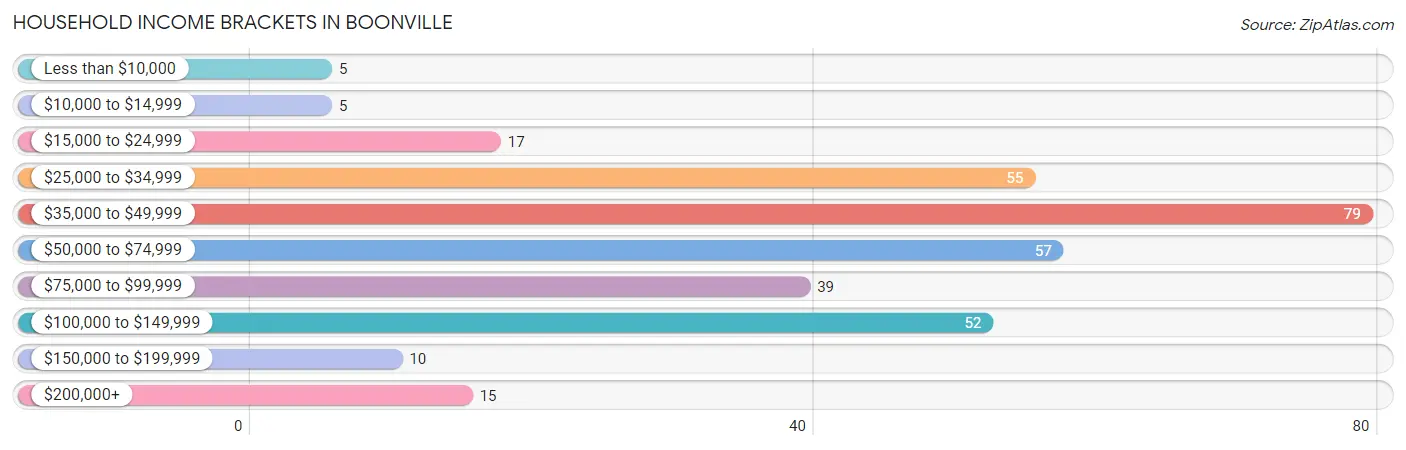
| Income Bracket | # Households | % Households |
| Less than $10,000 | 5 | 1.5% |
| $10,000 to $14,999 | 5 | 1.5% |
| $15,000 to $24,999 | 17 | 5.1% |
| $25,000 to $34,999 | 55 | 16.5% |
| $35,000 to $49,999 | 79 | 23.7% |
| $50,000 to $74,999 | 57 | 17.1% |
| $75,000 to $99,999 | 39 | 11.7% |
| $100,000 to $149,999 | 52 | 15.6% |
| $150,000 to $199,999 | 10 | 3.0% |
| $200,000+ | 15 | 4.5% |
Household Income by Householder Age in Boonville
The median household income in Boonville is $50,577, with the highest median household income of $50,625 found in the 65+ years age bracket for the primary householder. A total of 169 households (50.6%) fall into this category.
| Income Bracket | # Households | Median Income |
| 15 to 24 Years | 0 (0.0%) | $0 |
| 25 to 44 Years | 58 (17.4%) | $0 |
| 45 to 64 Years | 107 (32.0%) | $0 |
| 65+ Years | 169 (50.6%) | $50,625 |
| Total | 334 (100.0%) | $50,577 |
Poverty in Boonville
Income Below Poverty by Sex and Age in Boonville
With 1.2% poverty level for males and 9.4% for females among the residents of Boonville, 75 year old and over males and 35 to 44 year old females are the most vulnerable to poverty, with 5 males (11.6%) and 33 females (37.5%) in their respective age groups living below the poverty level.
| Age Bracket | Male | Female |
| Under 5 Years | 0 (0.0%) | 0 (0.0%) |
| 5 Years | 0 (0.0%) | 0 (0.0%) |
| 6 to 11 Years | 0 (0.0%) | 0 (0.0%) |
| 12 to 14 Years | 0 (0.0%) | 0 (0.0%) |
| 15 Years | 0 (0.0%) | 0 (0.0%) |
| 16 and 17 Years | 0 (0.0%) | 0 (0.0%) |
| 18 to 24 Years | 0 (0.0%) | 0 (0.0%) |
| 25 to 34 Years | 0 (0.0%) | 0 (0.0%) |
| 35 to 44 Years | 0 (0.0%) | 33 (37.5%) |
| 45 to 54 Years | 0 (0.0%) | 5 (13.9%) |
| 55 to 64 Years | 0 (0.0%) | 5 (7.9%) |
| 65 to 74 Years | 0 (0.0%) | 0 (0.0%) |
| 75 Years and over | 5 (11.6%) | 11 (12.1%) |
| Total | 5 (1.2%) | 54 (9.4%) |
Income Above Poverty by Sex and Age in Boonville
According to the poverty statistics in Boonville, males aged 5 years and females aged under 5 years are the age groups that are most secure financially, with 100.0% of males and 100.0% of females in these age groups living above the poverty line.
| Age Bracket | Male | Female |
| Under 5 Years | 0 (0.0%) | 16 (100.0%) |
| 5 Years | 28 (100.0%) | 0 (0.0%) |
| 6 to 11 Years | 29 (100.0%) | 63 (100.0%) |
| 12 to 14 Years | 33 (100.0%) | 57 (100.0%) |
| 15 Years | 0 (0.0%) | 20 (100.0%) |
| 16 and 17 Years | 0 (0.0%) | 12 (100.0%) |
| 18 to 24 Years | 17 (100.0%) | 35 (100.0%) |
| 25 to 34 Years | 51 (100.0%) | 35 (100.0%) |
| 35 to 44 Years | 36 (100.0%) | 55 (62.5%) |
| 45 to 54 Years | 44 (100.0%) | 31 (86.1%) |
| 55 to 64 Years | 64 (100.0%) | 58 (92.1%) |
| 65 to 74 Years | 73 (100.0%) | 60 (100.0%) |
| 75 Years and over | 38 (88.4%) | 80 (87.9%) |
| Total | 413 (98.8%) | 522 (90.6%) |
Income Below Poverty Among Married-Couple Families in Boonville
| Children | Above Poverty | Below Poverty |
| No Children | 96 (100.0%) | 0 (0.0%) |
| 1 or 2 Children | 73 (100.0%) | 0 (0.0%) |
| 3 or 4 Children | 0 (0.0%) | 0 (0.0%) |
| 5 or more Children | 0 (0.0%) | 0 (0.0%) |
| Total | 169 (100.0%) | 0 (0.0%) |
Income Below Poverty Among Single-Parent Households in Boonville
| Children | Single Father | Single Mother |
| No Children | 0 (0.0%) | 0 (0.0%) |
| 1 or 2 Children | 0 (0.0%) | 0 (0.0%) |
| 3 or 4 Children | 0 (0.0%) | 0 (0.0%) |
| 5 or more Children | 0 (0.0%) | 0 (0.0%) |
| Total | 0 (0.0%) | 0 (0.0%) |
Income Below Poverty Among Married-Couple vs Single-Parent Households in Boonville
| Children | Married-Couple Families | Single-Parent Households |
| No Children | 0 (0.0%) | 0 (0.0%) |
| 1 or 2 Children | 0 (0.0%) | 0 (0.0%) |
| 3 or 4 Children | 0 (0.0%) | 0 (0.0%) |
| 5 or more Children | 0 (0.0%) | 0 (0.0%) |
| Total | 0 (0.0%) | 0 (0.0%) |
Race in Boonville
The most populous races in Boonville are White / Caucasian (709 | 71.3%), Hispanic or Latino (364 | 36.6%), and Black / African American (98 | 9.9%).
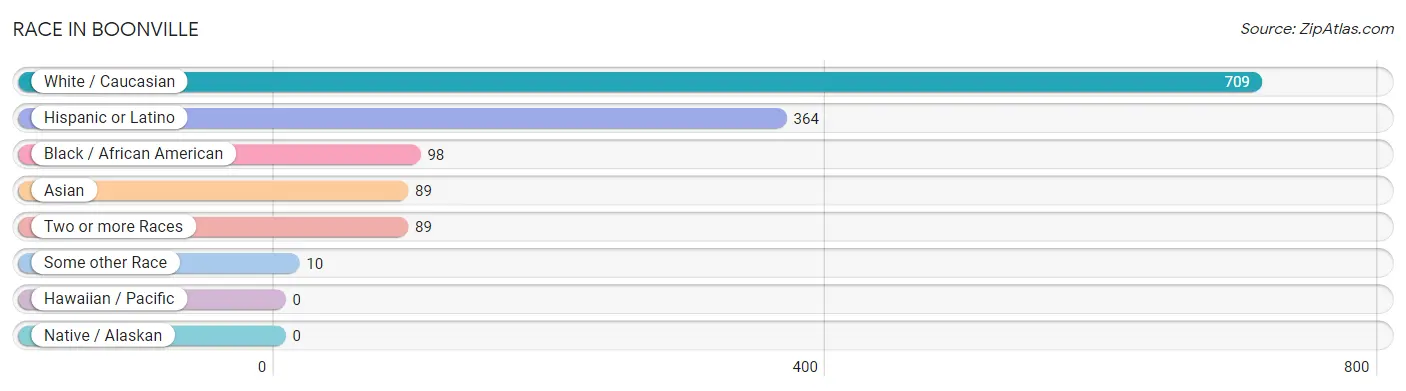
| Race | # Population | % Population |
| Asian | 89 | 8.9% |
| Black / African American | 98 | 9.9% |
| Hawaiian / Pacific | 0 | 0.0% |
| Hispanic or Latino | 364 | 36.6% |
| Native / Alaskan | 0 | 0.0% |
| White / Caucasian | 709 | 71.3% |
| Two or more Races | 89 | 8.9% |
| Some other Race | 10 | 1.0% |
| Total | 995 | 100.0% |
Ancestry in Boonville
The most populous ancestries reported in Boonville are Mexican (354 | 35.6%), German (142 | 14.3%), English (106 | 10.6%), Irish (71 | 7.1%), and Italian (49 | 4.9%), together accounting for 72.6% of all Boonville residents.
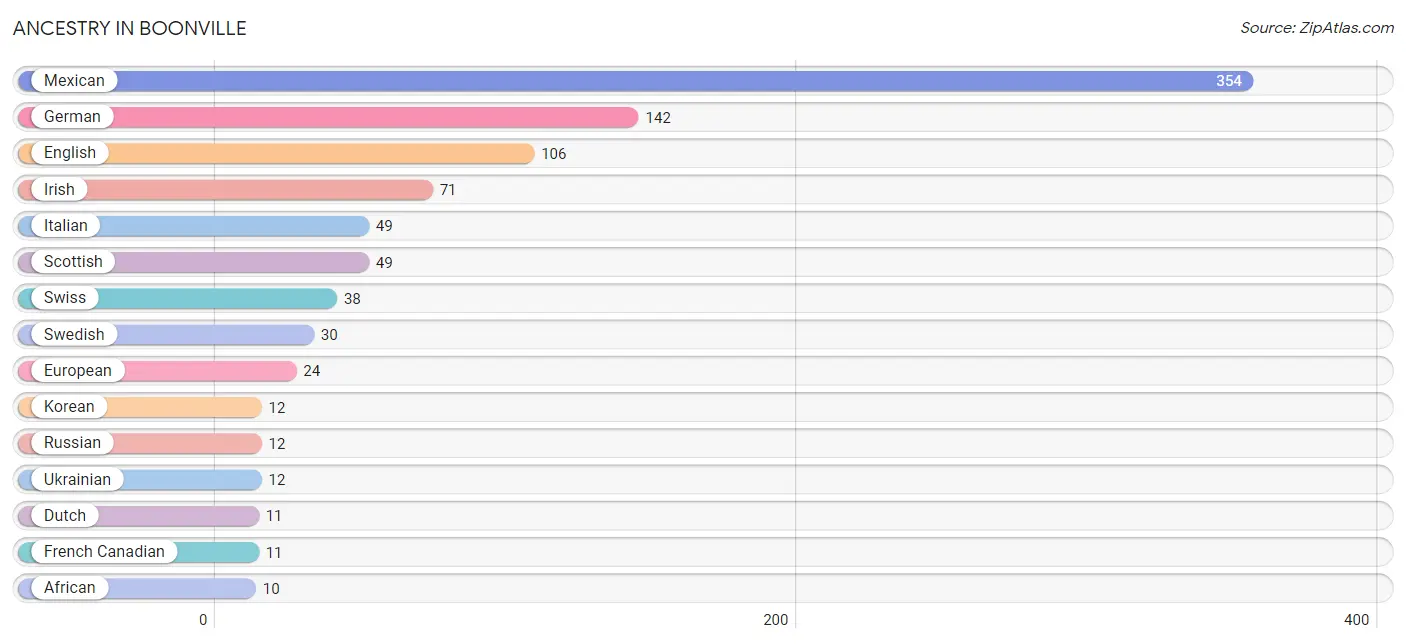
| Ancestry | # Population | % Population |
| African | 10 | 1.0% |
| American | 8 | 0.8% |
| Dutch | 11 | 1.1% |
| English | 106 | 10.6% |
| European | 24 | 2.4% |
| French | 5 | 0.5% |
| French Canadian | 11 | 1.1% |
| German | 142 | 14.3% |
| Irish | 71 | 7.1% |
| Italian | 49 | 4.9% |
| Korean | 12 | 1.2% |
| Mexican | 354 | 35.6% |
| Northern European | 8 | 0.8% |
| Polish | 9 | 0.9% |
| Portuguese | 4 | 0.4% |
| Puerto Rican | 10 | 1.0% |
| Russian | 12 | 1.2% |
| Scottish | 49 | 4.9% |
| Subsaharan African | 10 | 1.0% |
| Swedish | 30 | 3.0% |
| Swiss | 38 | 3.8% |
| Ukrainian | 12 | 1.2% | View All 22 Rows |
Immigrants in Boonville
The most numerous immigrant groups reported in Boonville came from Central America (176 | 17.7%), Latin America (176 | 17.7%), Mexico (176 | 17.7%), Asia (33 | 3.3%), and Pakistan (28 | 2.8%), together accounting for 59.2% of all Boonville residents.
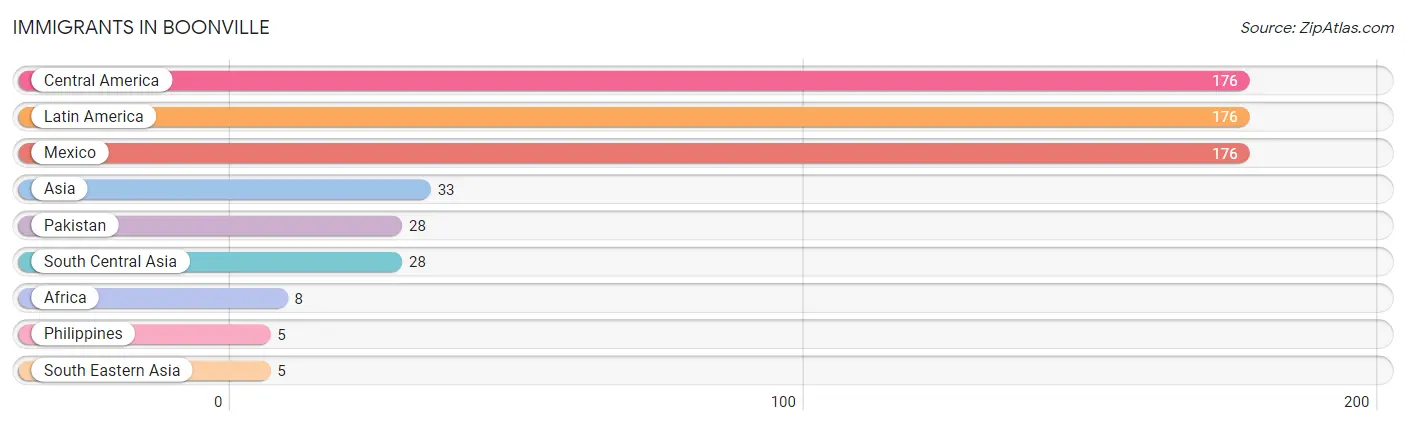
| Immigration Origin | # Population | % Population |
| Africa | 8 | 0.8% |
| Asia | 33 | 3.3% |
| Central America | 176 | 17.7% |
| Latin America | 176 | 17.7% |
| Mexico | 176 | 17.7% |
| Pakistan | 28 | 2.8% |
| Philippines | 5 | 0.5% |
| South Central Asia | 28 | 2.8% |
| South Eastern Asia | 5 | 0.5% | View All 9 Rows |
Sex and Age in Boonville
Sex and Age in Boonville
The most populous age groups in Boonville are 70 to 74 Years (62 | 14.8%) for men and 5 to 9 Years (63 | 10.9%) for women.
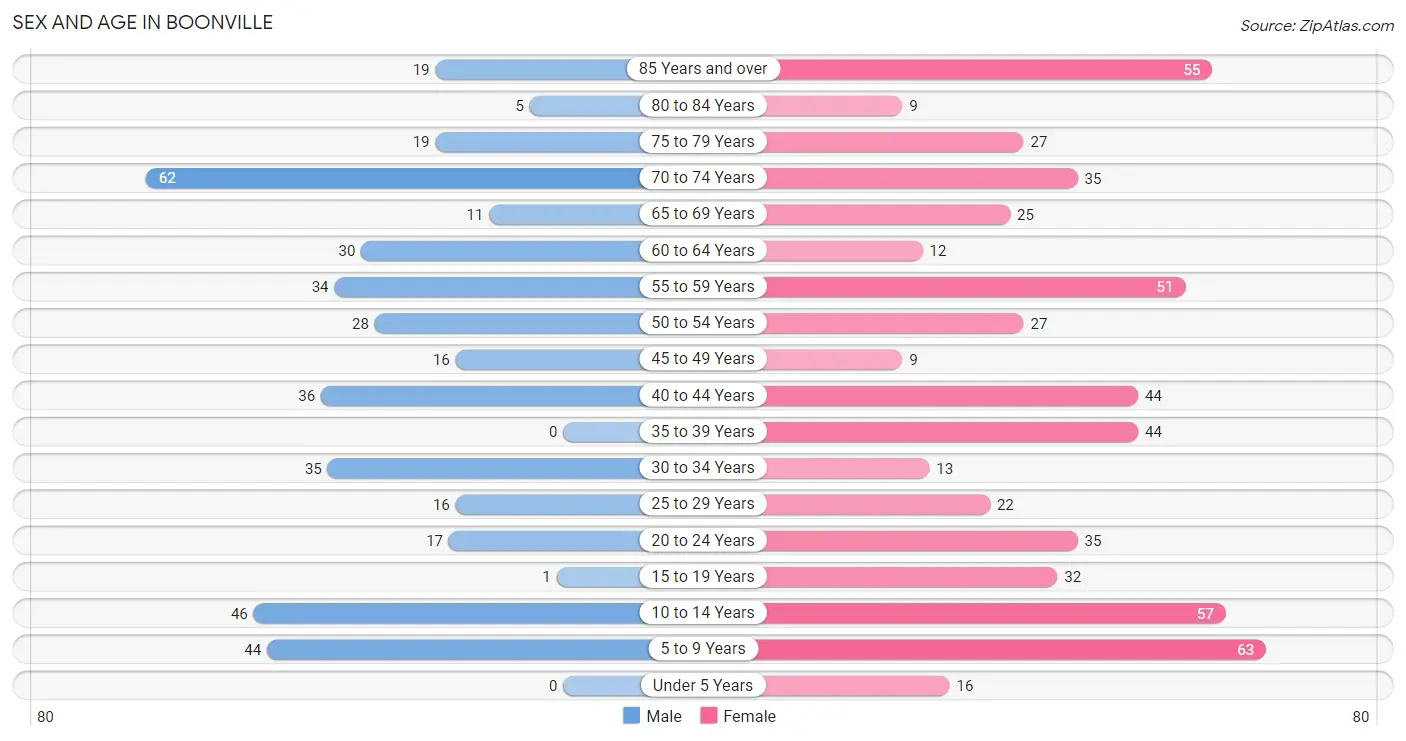
| Age Bracket | Male | Female |
| Under 5 Years | 0 (0.0%) | 16 (2.8%) |
| 5 to 9 Years | 44 (10.5%) | 63 (10.9%) |
| 10 to 14 Years | 46 (11.0%) | 57 (9.9%) |
| 15 to 19 Years | 1 (0.2%) | 32 (5.6%) |
| 20 to 24 Years | 17 (4.1%) | 35 (6.1%) |
| 25 to 29 Years | 16 (3.8%) | 22 (3.8%) |
| 30 to 34 Years | 35 (8.4%) | 13 (2.3%) |
| 35 to 39 Years | 0 (0.0%) | 44 (7.6%) |
| 40 to 44 Years | 36 (8.6%) | 44 (7.6%) |
| 45 to 49 Years | 16 (3.8%) | 9 (1.6%) |
| 50 to 54 Years | 28 (6.7%) | 27 (4.7%) |
| 55 to 59 Years | 34 (8.1%) | 51 (8.8%) |
| 60 to 64 Years | 30 (7.2%) | 12 (2.1%) |
| 65 to 69 Years | 11 (2.6%) | 25 (4.3%) |
| 70 to 74 Years | 62 (14.8%) | 35 (6.1%) |
| 75 to 79 Years | 19 (4.5%) | 27 (4.7%) |
| 80 to 84 Years | 5 (1.2%) | 9 (1.6%) |
| 85 Years and over | 19 (4.5%) | 55 (9.6%) |
| Total | 419 (100.0%) | 576 (100.0%) |
Families and Households in Boonville
Median Family Size in Boonville
The median family size in Boonville is 3.61 persons per family, with single female/mother families (30 | 13.6%) accounting for the largest median family size of 5.23 persons per family. On the other hand, married-couple families (169 | 76.8%) represent the smallest median family size with 3.15 persons per family.
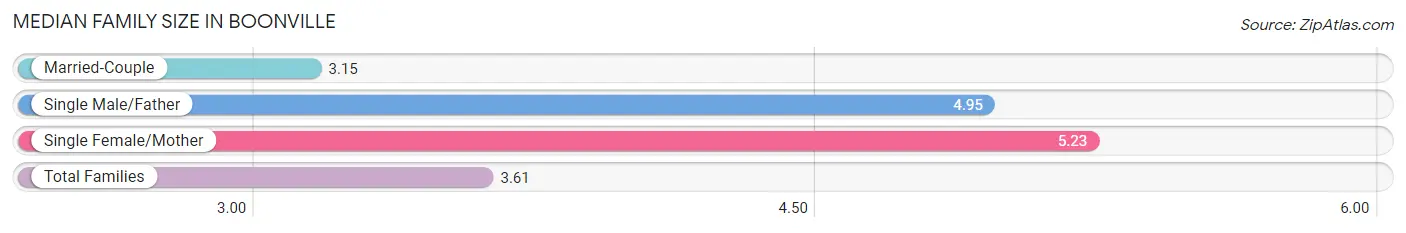
| Family Type | # Families | Family Size |
| Married-Couple | 169 (76.8%) | 3.15 |
| Single Male/Father | 21 (9.6%) | 4.95 |
| Single Female/Mother | 30 (13.6%) | 5.23 |
| Total Families | 220 (100.0%) | 3.61 |
Median Household Size in Boonville
The median household size in Boonville is 2.98 persons per household, with single male/father households (21 | 6.3%) accounting for the largest median household size of 6.52 persons per household. non-family households (114 | 34.1%) represent the smallest median household size with 1.39 persons per household.
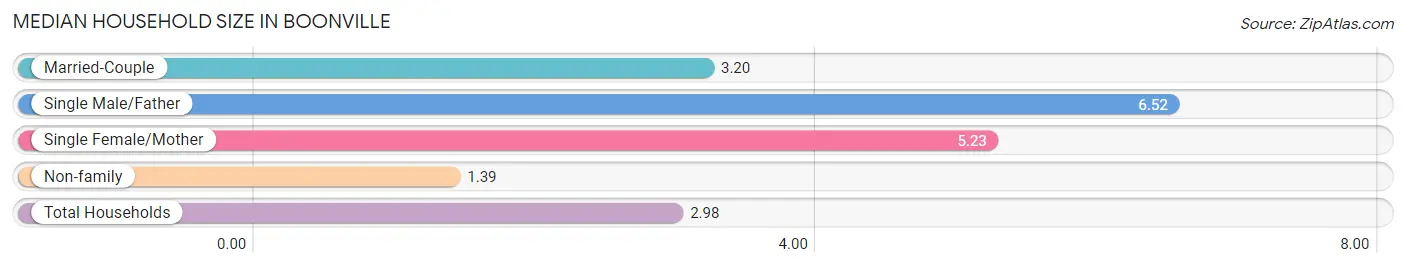
| Household Type | # Households | Household Size |
| Married-Couple | 169 (50.6%) | 3.20 |
| Single Male/Father | 21 (6.3%) | 6.52 |
| Single Female/Mother | 30 (9.0%) | 5.23 |
| Non-family | 114 (34.1%) | 1.39 |
| Total Households | 334 (100.0%) | 2.98 |
Household Size by Marriage Status in Boonville
Out of a total of 334 households in Boonville, 220 (65.9%) are family households, while 114 (34.1%) are nonfamily households. The most numerous type of family households are 4-person households, comprising 77, and the most common type of nonfamily households are 1-person households, comprising 73.
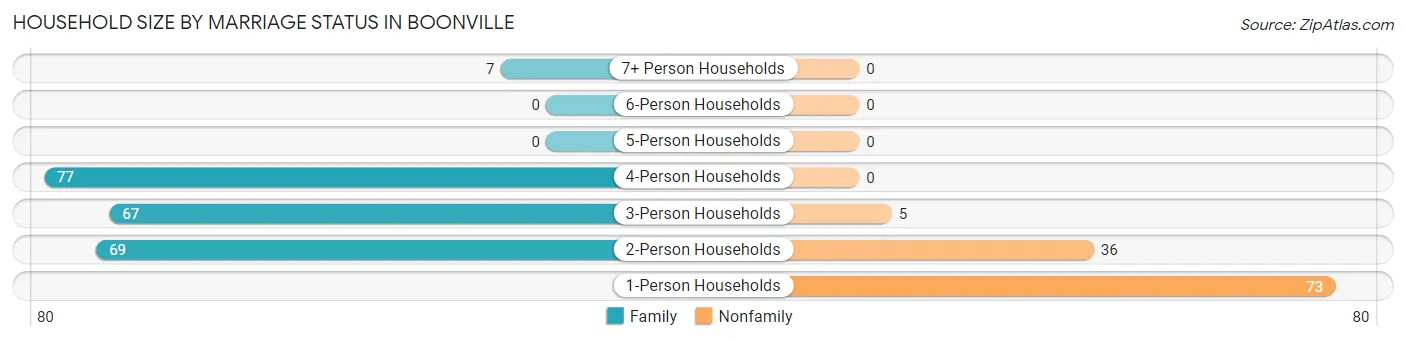
| Household Size | Family Households | Nonfamily Households |
| 1-Person Households | - | 73 (21.9%) |
| 2-Person Households | 69 (20.7%) | 36 (10.8%) |
| 3-Person Households | 67 (20.1%) | 5 (1.5%) |
| 4-Person Households | 77 (23.1%) | 0 (0.0%) |
| 5-Person Households | 0 (0.0%) | 0 (0.0%) |
| 6-Person Households | 0 (0.0%) | 0 (0.0%) |
| 7+ Person Households | 7 (2.1%) | 0 (0.0%) |
| Total | 220 (65.9%) | 114 (34.1%) |
Female Fertility in Boonville
Fertility by Age in Boonville
| Age Bracket | Women with Births | Births / 1,000 Women |
| 15 to 19 years | 0 (0.0%) | 0.0 |
| 20 to 34 years | 0 (0.0%) | 0.0 |
| 35 to 50 years | 0 (0.0%) | 0.0 |
| Total | 0 (0.0%) | 0.0 |
Fertility by Age by Marriage Status in Boonville
| Age Bracket | Married | Unmarried |
| 15 to 19 years | 0 (0.0%) | 0 (0.0%) |
| 20 to 34 years | 0 (0.0%) | 0 (0.0%) |
| 35 to 50 years | 0 (0.0%) | 0 (0.0%) |
| Total | 0 (0.0%) | 0 (0.0%) |
Fertility by Education in Boonville
| Educational Attainment | Women with Births | Births / 1,000 Women |
| Less than High School | 0 (0.0%) | 0.0 |
| High School Diploma | 0 (0.0%) | 0.0 |
| College or Associate's Degree | 0 (0.0%) | 0.0 |
| Bachelor's Degree | 0 (0.0%) | 0.0 |
| Graduate Degree | 0 (0.0%) | 0.0 |
| Total | 0 (0.0%) | 0.0 |
Fertility by Education by Marriage Status in Boonville
| Educational Attainment | Married | Unmarried |
| Less than High School | 0 (0.0%) | 0 (0.0%) |
| High School Diploma | 0 (0.0%) | 0 (0.0%) |
| College or Associate's Degree | 0 (0.0%) | 0 (0.0%) |
| Bachelor's Degree | 0 (0.0%) | 0 (0.0%) |
| Graduate Degree | 0 (0.0%) | 0 (0.0%) |
| Total | 0 (0.0%) | 0 (0.0%) |
Employment Characteristics in Boonville
Employment by Class of Employer in Boonville
Among the 330 employed individuals in Boonville, private company employees (201 | 60.9%), self-employed (not incorporated) (67 | 20.3%), and self-employed (incorporated) (37 | 11.2%) make up the most common classes of employment.
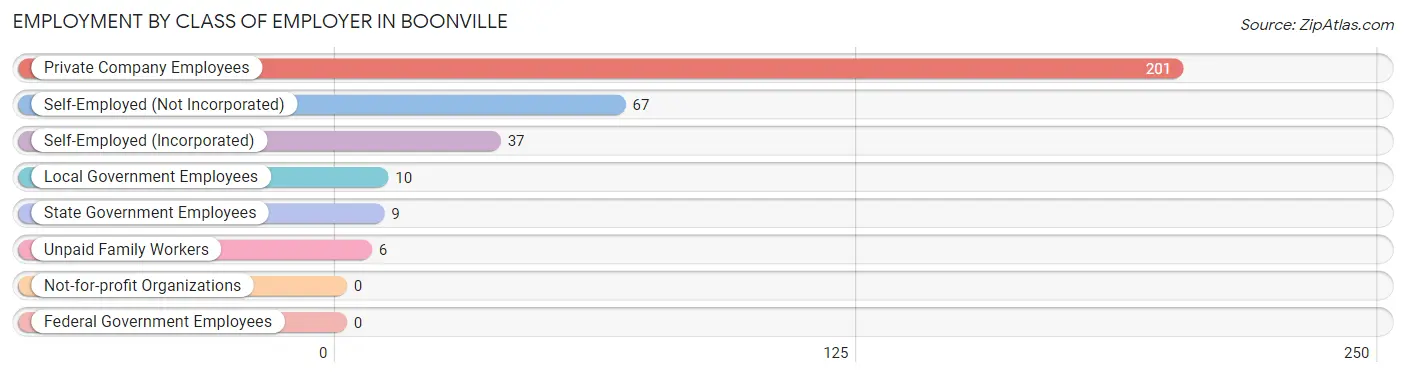
| Employer Class | # Employees | % Employees |
| Private Company Employees | 201 | 60.9% |
| Self-Employed (Incorporated) | 37 | 11.2% |
| Self-Employed (Not Incorporated) | 67 | 20.3% |
| Not-for-profit Organizations | 0 | 0.0% |
| Local Government Employees | 10 | 3.0% |
| State Government Employees | 9 | 2.7% |
| Federal Government Employees | 0 | 0.0% |
| Unpaid Family Workers | 6 | 1.8% |
| Total | 330 | 100.0% |
Employment Status by Age in Boonville
According to the labor force statistics for Boonville, out of the total population over 16 years of age (748), 52.1% or 390 individuals are in the labor force, with 9.7% or 38 of them unemployed. The age group with the highest labor force participation rate is 25 to 29 years, with 100.0% or 38 individuals in the labor force. Within the labor force, the 30 to 34 years age range has the highest percentage of unemployed individuals, with 54.2% or 26 of them being unemployed.
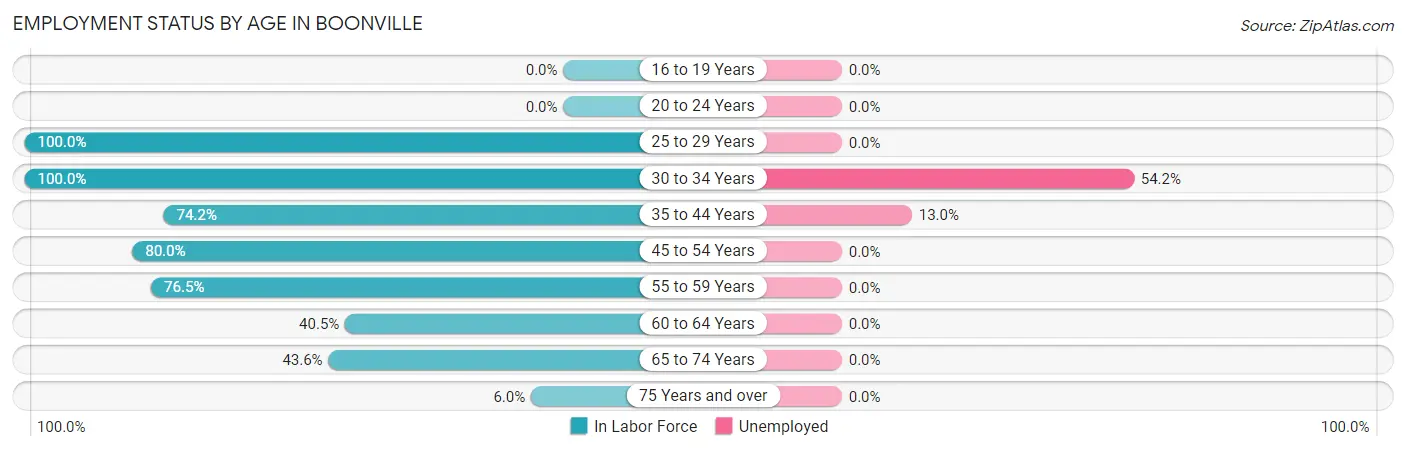
| Age Bracket | In Labor Force | Unemployed |
| 16 to 19 Years | 0 (0.0%) | 0 (0.0%) |
| 20 to 24 Years | 0 (0.0%) | 0 (0.0%) |
| 25 to 29 Years | 38 (100.0%) | 0 (0.0%) |
| 30 to 34 Years | 48 (100.0%) | 26 (54.2%) |
| 35 to 44 Years | 92 (74.2%) | 12 (13.0%) |
| 45 to 54 Years | 64 (80.0%) | 0 (0.0%) |
| 55 to 59 Years | 65 (76.5%) | 0 (0.0%) |
| 60 to 64 Years | 17 (40.5%) | 0 (0.0%) |
| 65 to 74 Years | 58 (43.6%) | 0 (0.0%) |
| 75 Years and over | 8 (6.0%) | 0 (0.0%) |
| Total | 390 (52.1%) | 38 (9.7%) |
Employment Status by Educational Attainment in Boonville
According to labor force statistics for Boonville, 77.7% of individuals (324) out of the total population between 25 and 64 years of age (417) are in the labor force, with 11.7% or 38 of them being unemployed. The group with the highest labor force participation rate are those with the educational attainment of less than high school, with 100.0% or 67 individuals in the labor force. Within the labor force, individuals with college / associate degree education have the highest percentage of unemployment, with 34.5% or 38 of them being unemployed.
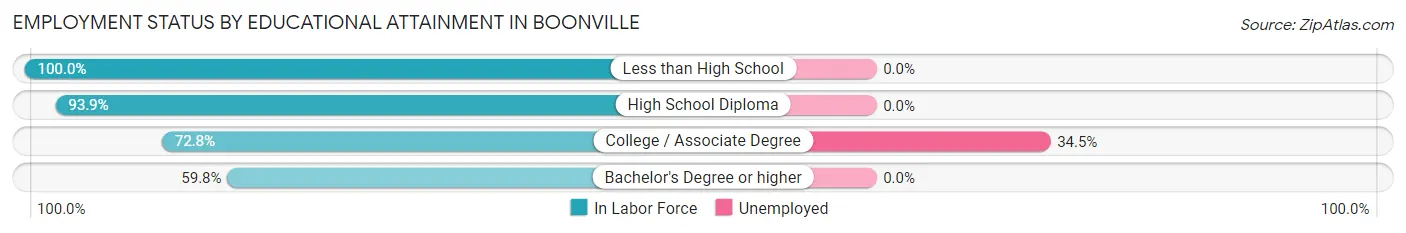
| Educational Attainment | In Labor Force | Unemployed |
| Less than High School | 67 (100.0%) | 0 (0.0%) |
| High School Diploma | 77 (93.9%) | 0 (0.0%) |
| College / Associate Degree | 110 (72.8%) | 52 (34.5%) |
| Bachelor's Degree or higher | 70 (59.8%) | 0 (0.0%) |
| Total | 324 (77.7%) | 49 (11.7%) |
Employment Occupations by Sex in Boonville
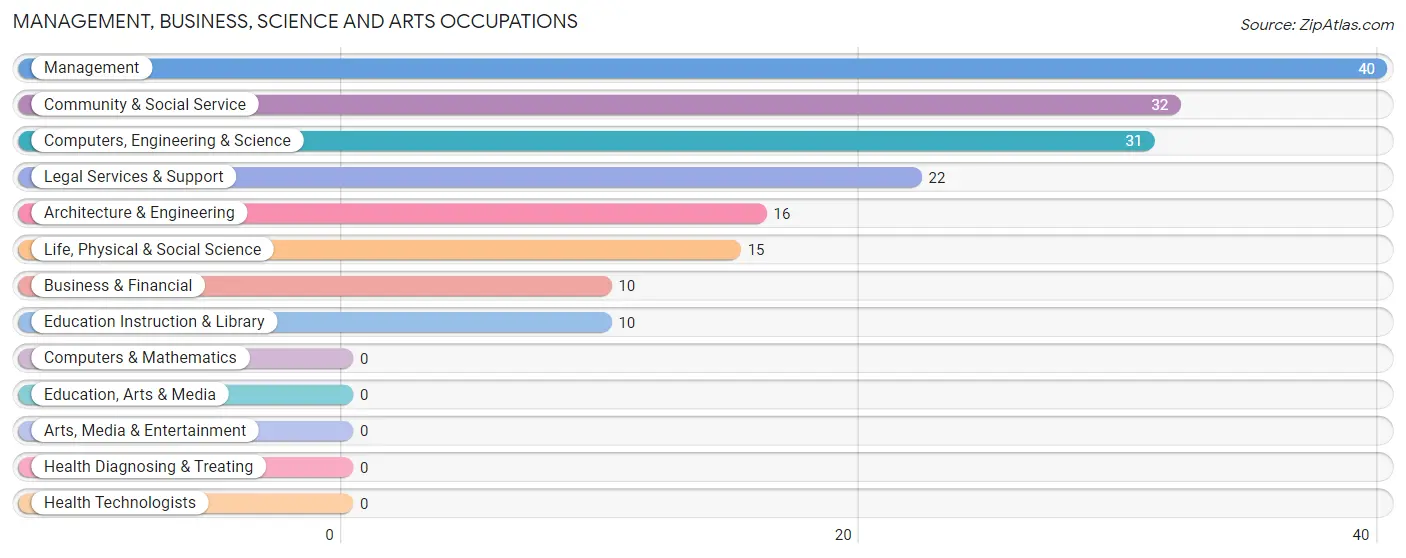
Management, Business, Science and Arts Occupations
The most common Management, Business, Science and Arts occupations in Boonville are Management (40 | 11.4%), Community & Social Service (32 | 9.1%), Computers, Engineering & Science (31 | 8.8%), Legal Services & Support (22 | 6.2%), and Architecture & Engineering (16 | 4.5%).
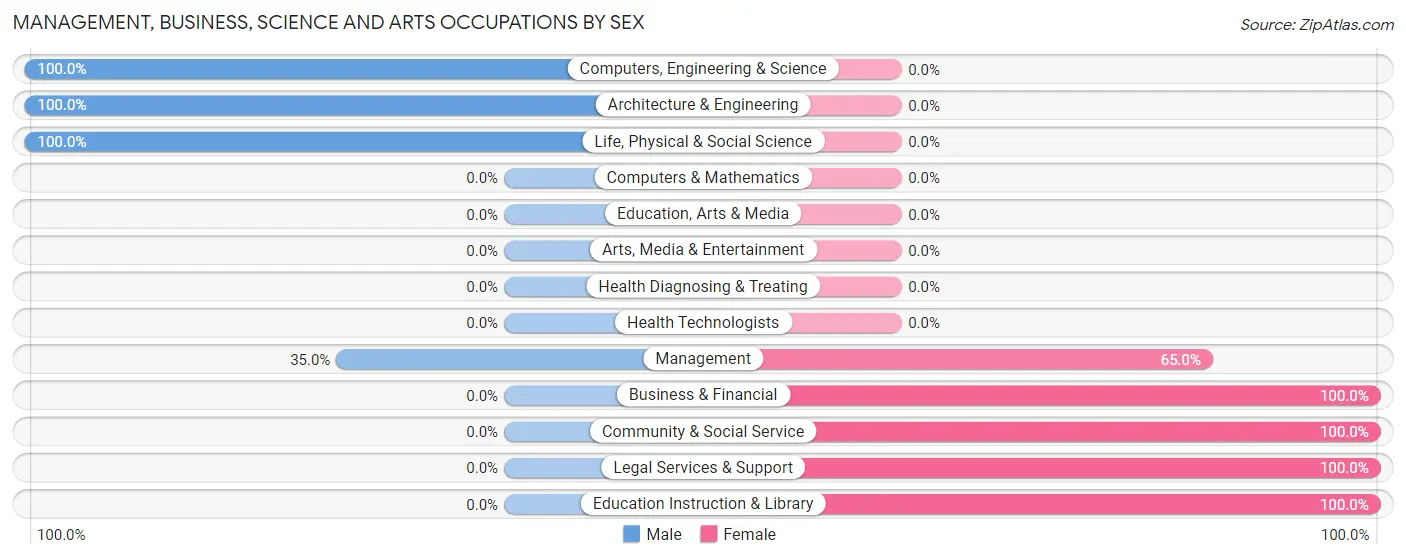
Management, Business, Science and Arts Occupations by Sex
Within the Management, Business, Science and Arts occupations in Boonville, the most male-oriented occupations are Computers, Engineering & Science (100.0%), Architecture & Engineering (100.0%), and Life, Physical & Social Science (100.0%), while the most female-oriented occupations are Business & Financial (100.0%), Community & Social Service (100.0%), and Legal Services & Support (100.0%).
| Occupation | Male | Female |
| Management | 14 (35.0%) | 26 (65.0%) |
| Business & Financial | 0 (0.0%) | 10 (100.0%) |
| Computers, Engineering & Science | 31 (100.0%) | 0 (0.0%) |
| Computers & Mathematics | 0 (0.0%) | 0 (0.0%) |
| Architecture & Engineering | 16 (100.0%) | 0 (0.0%) |
| Life, Physical & Social Science | 15 (100.0%) | 0 (0.0%) |
| Community & Social Service | 0 (0.0%) | 32 (100.0%) |
| Education, Arts & Media | 0 (0.0%) | 0 (0.0%) |
| Legal Services & Support | 0 (0.0%) | 22 (100.0%) |
| Education Instruction & Library | 0 (0.0%) | 10 (100.0%) |
| Arts, Media & Entertainment | 0 (0.0%) | 0 (0.0%) |
| Health Diagnosing & Treating | 0 (0.0%) | 0 (0.0%) |
| Health Technologists | 0 (0.0%) | 0 (0.0%) |
| Total (Category) | 45 (39.8%) | 68 (60.2%) |
| Total (Overall) | 170 (48.3%) | 182 (51.7%) |
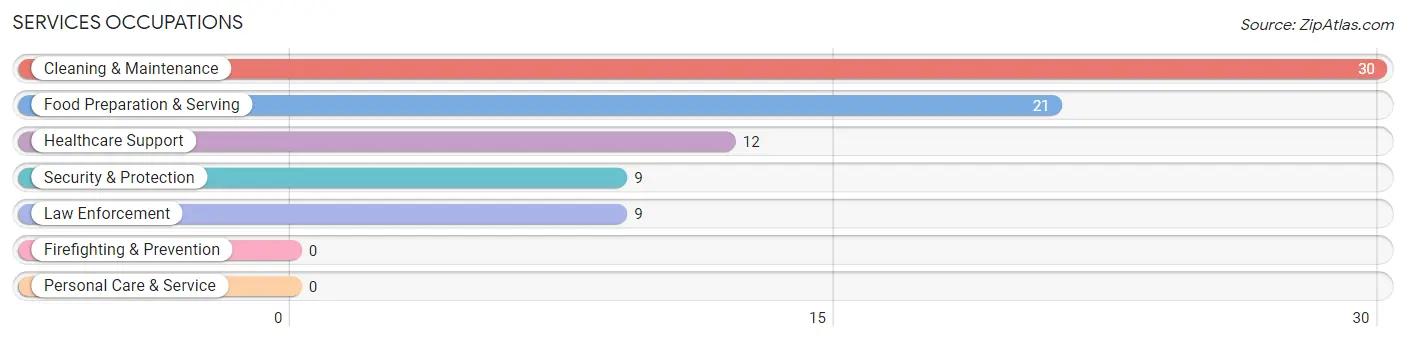
Services Occupations
The most common Services occupations in Boonville are Cleaning & Maintenance (30 | 8.5%), Food Preparation & Serving (21 | 6.0%), Healthcare Support (12 | 3.4%), Security & Protection (9 | 2.6%), and Law Enforcement (9 | 2.6%).
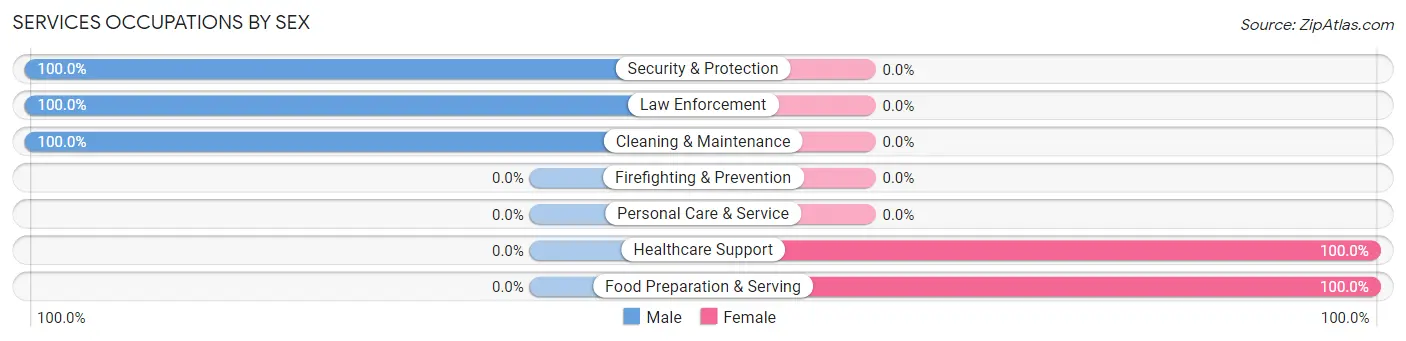
Services Occupations by Sex
Within the Services occupations in Boonville, the most male-oriented occupations are Security & Protection (100.0%), Law Enforcement (100.0%), and Cleaning & Maintenance (100.0%), while the most female-oriented occupations are Healthcare Support (100.0%), and Food Preparation & Serving (100.0%).
| Occupation | Male | Female |
| Healthcare Support | 0 (0.0%) | 12 (100.0%) |
| Security & Protection | 9 (100.0%) | 0 (0.0%) |
| Firefighting & Prevention | 0 (0.0%) | 0 (0.0%) |
| Law Enforcement | 9 (100.0%) | 0 (0.0%) |
| Food Preparation & Serving | 0 (0.0%) | 21 (100.0%) |
| Cleaning & Maintenance | 30 (100.0%) | 0 (0.0%) |
| Personal Care & Service | 0 (0.0%) | 0 (0.0%) |
| Total (Category) | 39 (54.2%) | 33 (45.8%) |
| Total (Overall) | 170 (48.3%) | 182 (51.7%) |
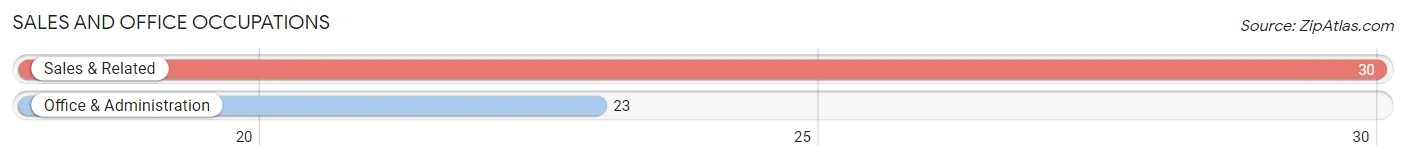
Sales and Office Occupations
The most common Sales and Office occupations in Boonville are Sales & Related (30 | 8.5%), and Office & Administration (23 | 6.5%).
Sales and Office Occupations by Sex
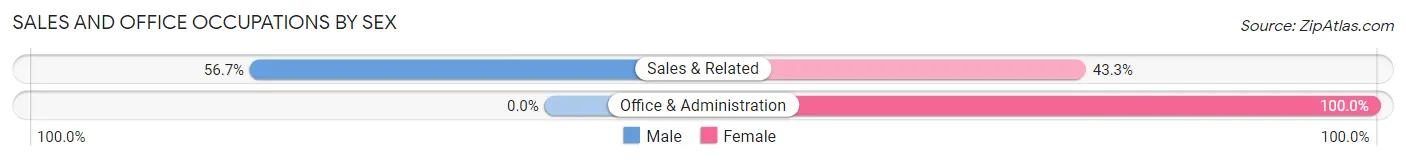
| Occupation | Male | Female |
| Sales & Related | 17 (56.7%) | 13 (43.3%) |
| Office & Administration | 0 (0.0%) | 23 (100.0%) |
| Total (Category) | 17 (32.1%) | 36 (67.9%) |
| Total (Overall) | 170 (48.3%) | 182 (51.7%) |
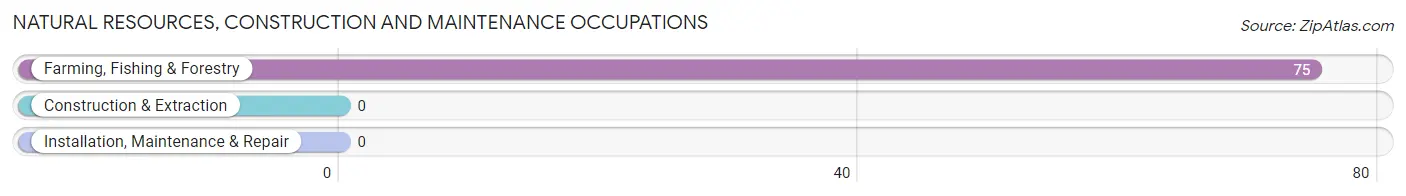
Natural Resources, Construction and Maintenance Occupations
The most common Natural Resources, Construction and Maintenance occupations in Boonville are , and Farming, Fishing & Forestry (75 | 21.3%).
Natural Resources, Construction and Maintenance Occupations by Sex
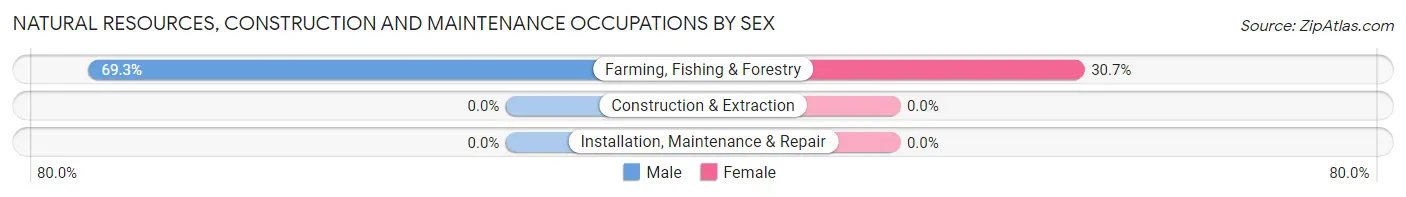
| Occupation | Male | Female |
| Farming, Fishing & Forestry | 52 (69.3%) | 23 (30.7%) |
| Construction & Extraction | 0 (0.0%) | 0 (0.0%) |
| Installation, Maintenance & Repair | 0 (0.0%) | 0 (0.0%) |
| Total (Category) | 52 (69.3%) | 23 (30.7%) |
| Total (Overall) | 170 (48.3%) | 182 (51.7%) |
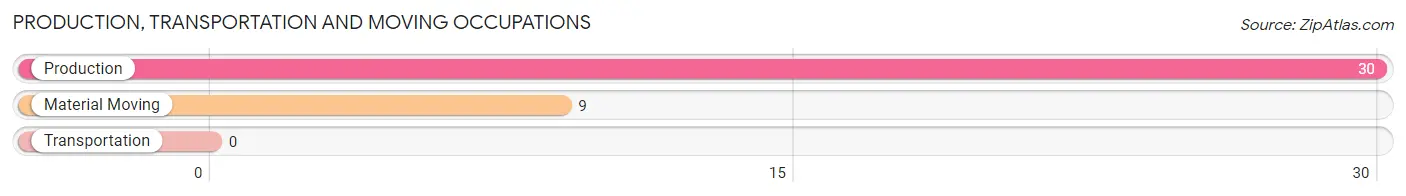
Production, Transportation and Moving Occupations
The most common Production, Transportation and Moving occupations in Boonville are Production (30 | 8.5%), and Material Moving (9 | 2.6%).
Production, Transportation and Moving Occupations by Sex
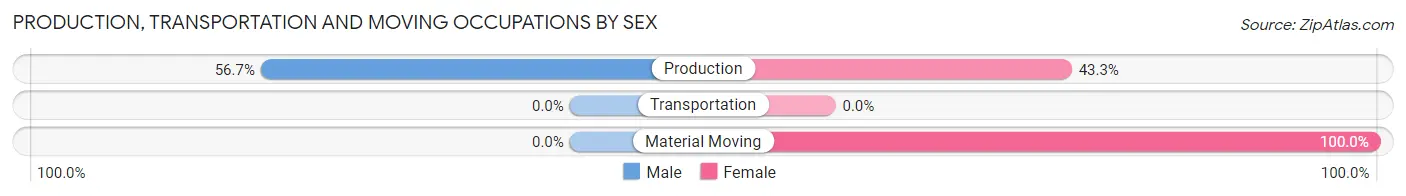
| Occupation | Male | Female |
| Production | 17 (56.7%) | 13 (43.3%) |
| Transportation | 0 (0.0%) | 0 (0.0%) |
| Material Moving | 0 (0.0%) | 9 (100.0%) |
| Total (Category) | 17 (43.6%) | 22 (56.4%) |
| Total (Overall) | 170 (48.3%) | 182 (51.7%) |
Employment Industries by Sex in Boonville
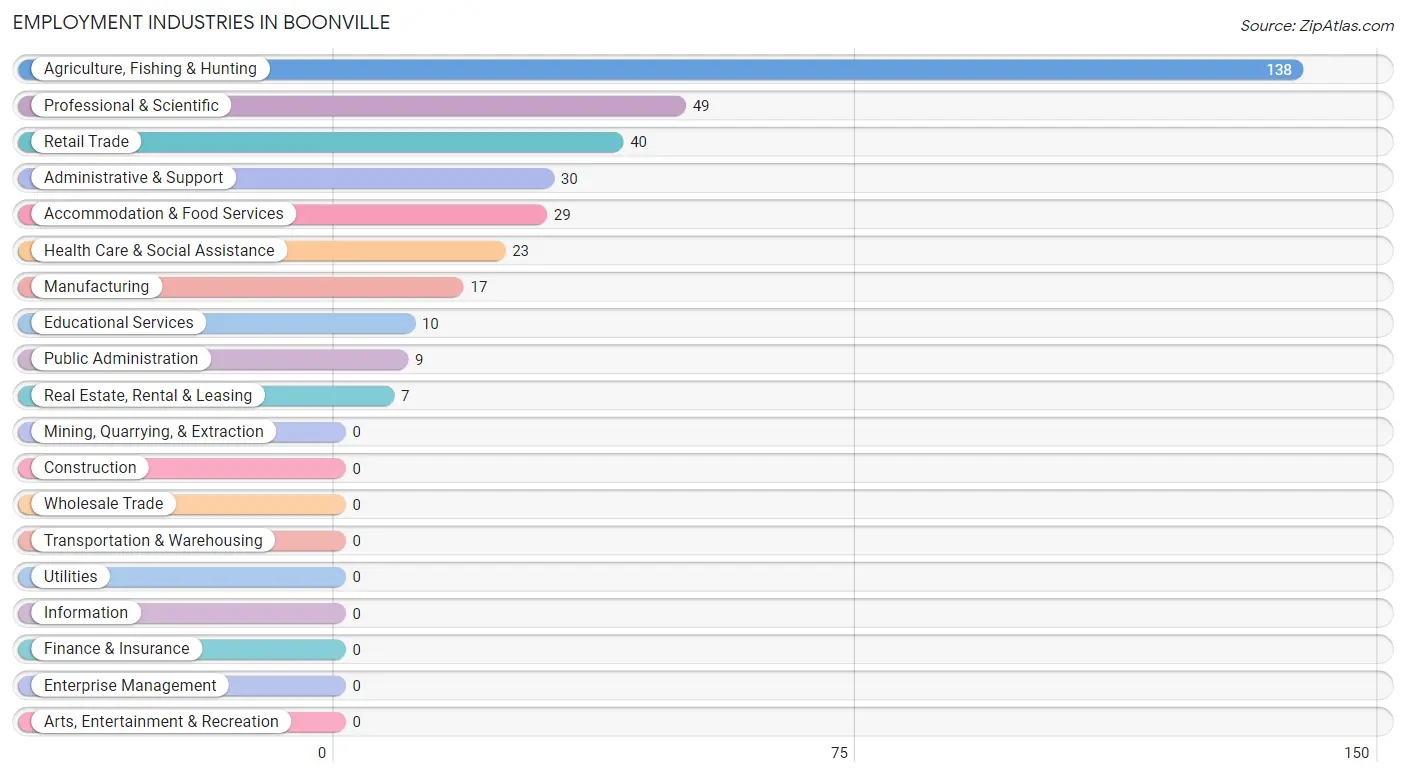
Employment Industries in Boonville
The major employment industries in Boonville include Agriculture, Fishing & Hunting (138 | 39.2%), Professional & Scientific (49 | 13.9%), Retail Trade (40 | 11.4%), Administrative & Support (30 | 8.5%), and Accommodation & Food Services (29 | 8.2%).
Employment Industries by Sex in Boonville
The Boonville industries that see more men than women are Manufacturing (100.0%), Administrative & Support (100.0%), and Public Administration (100.0%), whereas the industries that tend to have a higher number of women are Real Estate, Rental & Leasing (100.0%), Educational Services (100.0%), and Health Care & Social Assistance (100.0%).
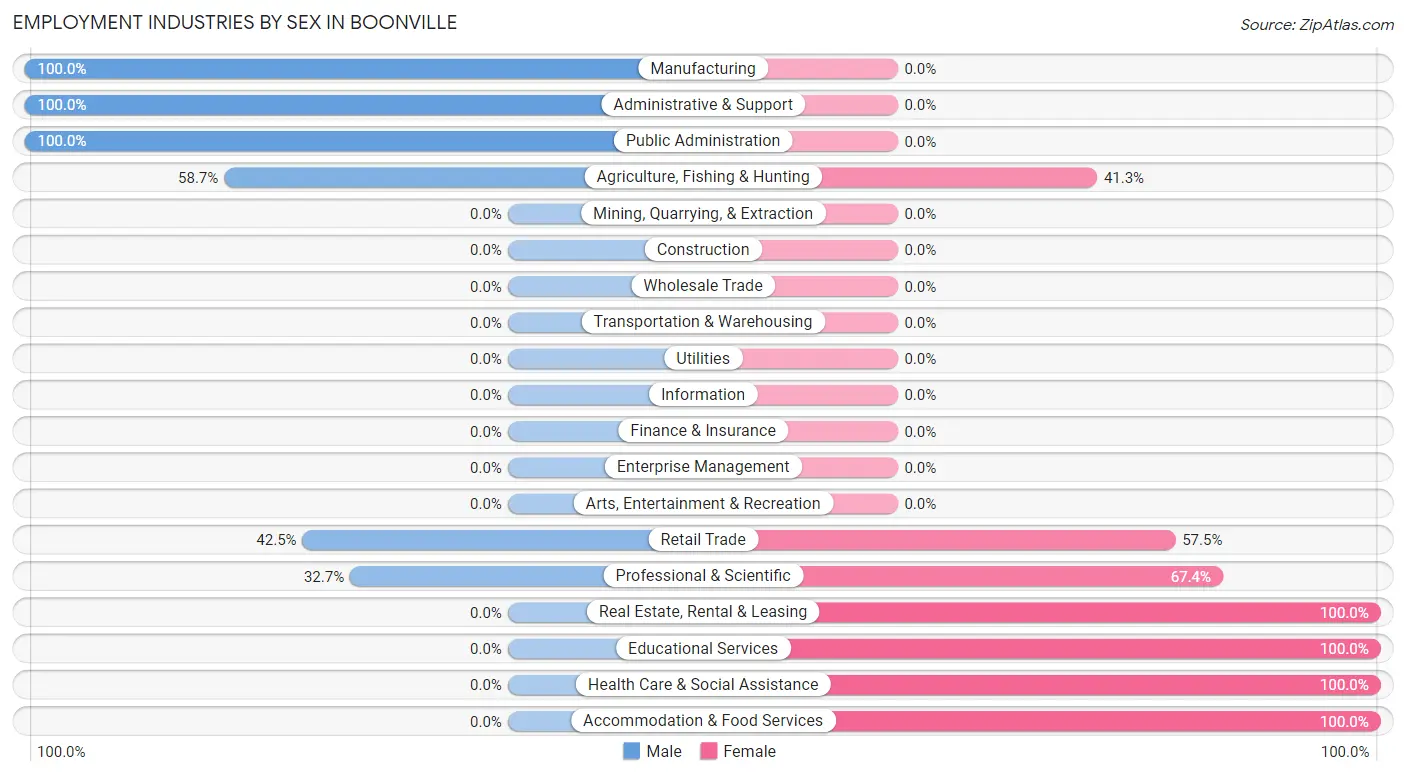
| Industry | Male | Female |
| Agriculture, Fishing & Hunting | 81 (58.7%) | 57 (41.3%) |
| Mining, Quarrying, & Extraction | 0 (0.0%) | 0 (0.0%) |
| Construction | 0 (0.0%) | 0 (0.0%) |
| Manufacturing | 17 (100.0%) | 0 (0.0%) |
| Wholesale Trade | 0 (0.0%) | 0 (0.0%) |
| Retail Trade | 17 (42.5%) | 23 (57.5%) |
| Transportation & Warehousing | 0 (0.0%) | 0 (0.0%) |
| Utilities | 0 (0.0%) | 0 (0.0%) |
| Information | 0 (0.0%) | 0 (0.0%) |
| Finance & Insurance | 0 (0.0%) | 0 (0.0%) |
| Real Estate, Rental & Leasing | 0 (0.0%) | 7 (100.0%) |
| Professional & Scientific | 16 (32.7%) | 33 (67.3%) |
| Enterprise Management | 0 (0.0%) | 0 (0.0%) |
| Administrative & Support | 30 (100.0%) | 0 (0.0%) |
| Educational Services | 0 (0.0%) | 10 (100.0%) |
| Health Care & Social Assistance | 0 (0.0%) | 23 (100.0%) |
| Arts, Entertainment & Recreation | 0 (0.0%) | 0 (0.0%) |
| Accommodation & Food Services | 0 (0.0%) | 29 (100.0%) |
| Public Administration | 9 (100.0%) | 0 (0.0%) |
| Total | 170 (48.3%) | 182 (51.7%) |
Education in Boonville
School Enrollment in Boonville
The most common levels of schooling among the 354 students in Boonville are college / undergraduate (95 | 26.8%), middle school (82 | 23.2%), and elementary school (79 | 22.3%).
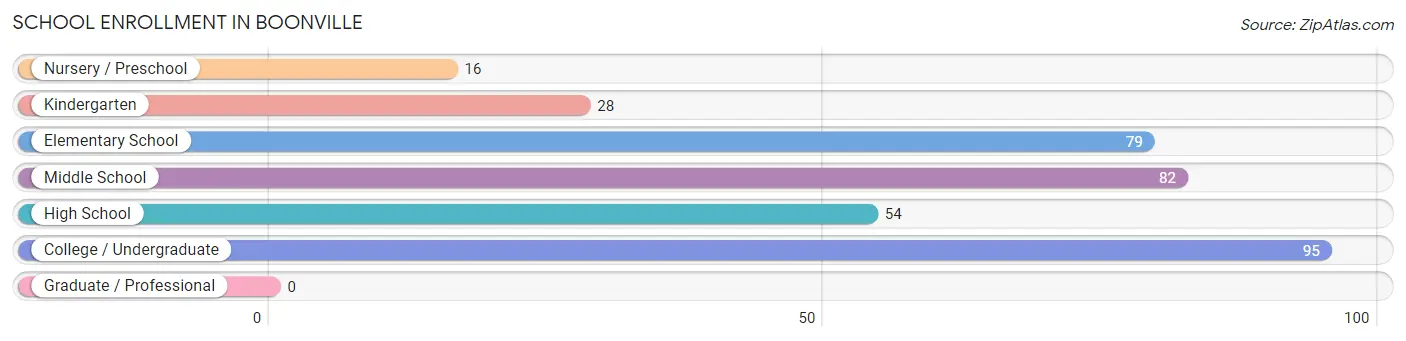
| School Level | # Students | % Students |
| Nursery / Preschool | 16 | 4.5% |
| Kindergarten | 28 | 7.9% |
| Elementary School | 79 | 22.3% |
| Middle School | 82 | 23.2% |
| High School | 54 | 15.2% |
| College / Undergraduate | 95 | 26.8% |
| Graduate / Professional | 0 | 0.0% |
| Total | 354 | 100.0% |
School Enrollment by Age by Funding Source in Boonville
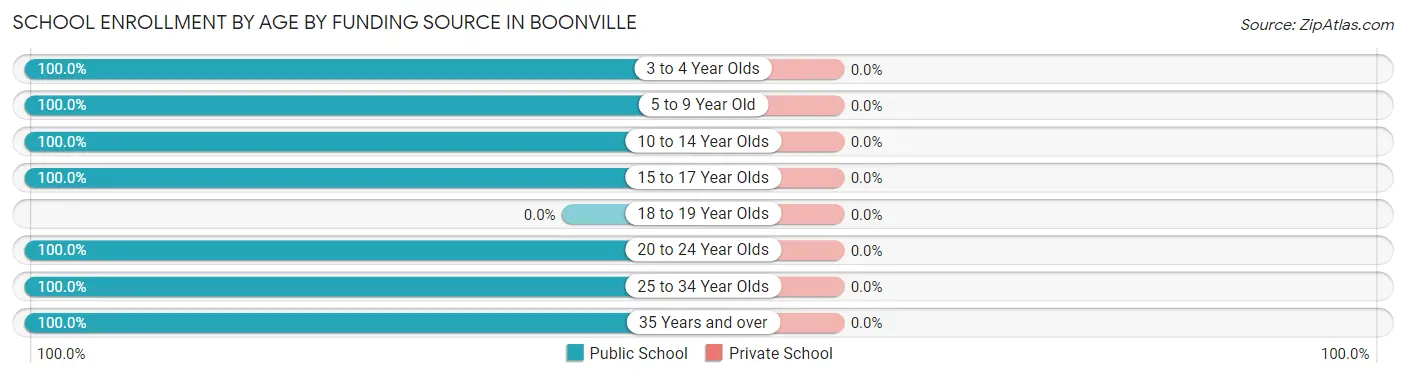
| Age Bracket | Public School | Private School |
| 3 to 4 Year Olds | 16 (100.0%) | 0 (0.0%) |
| 5 to 9 Year Old | 107 (100.0%) | 0 (0.0%) |
| 10 to 14 Year Olds | 103 (100.0%) | 0 (0.0%) |
| 15 to 17 Year Olds | 33 (100.0%) | 0 (0.0%) |
| 18 to 19 Year Olds | 0 (0.0%) | 0 (0.0%) |
| 20 to 24 Year Olds | 52 (100.0%) | 0 (0.0%) |
| 25 to 34 Year Olds | 22 (100.0%) | 0 (0.0%) |
| 35 Years and over | 21 (100.0%) | 0 (0.0%) |
| Total | 354 (100.0%) | 0 (0.0%) |
Educational Attainment by Field of Study in Boonville
Bio, nature & agricultural (41 | 18.5%), physical & health sciences (39 | 17.6%), engineering (31 | 14.0%), social sciences (27 | 12.2%), and science & technology (23 | 10.4%) are the most common fields of study among 221 individuals in Boonville who have obtained a bachelor's degree or higher.
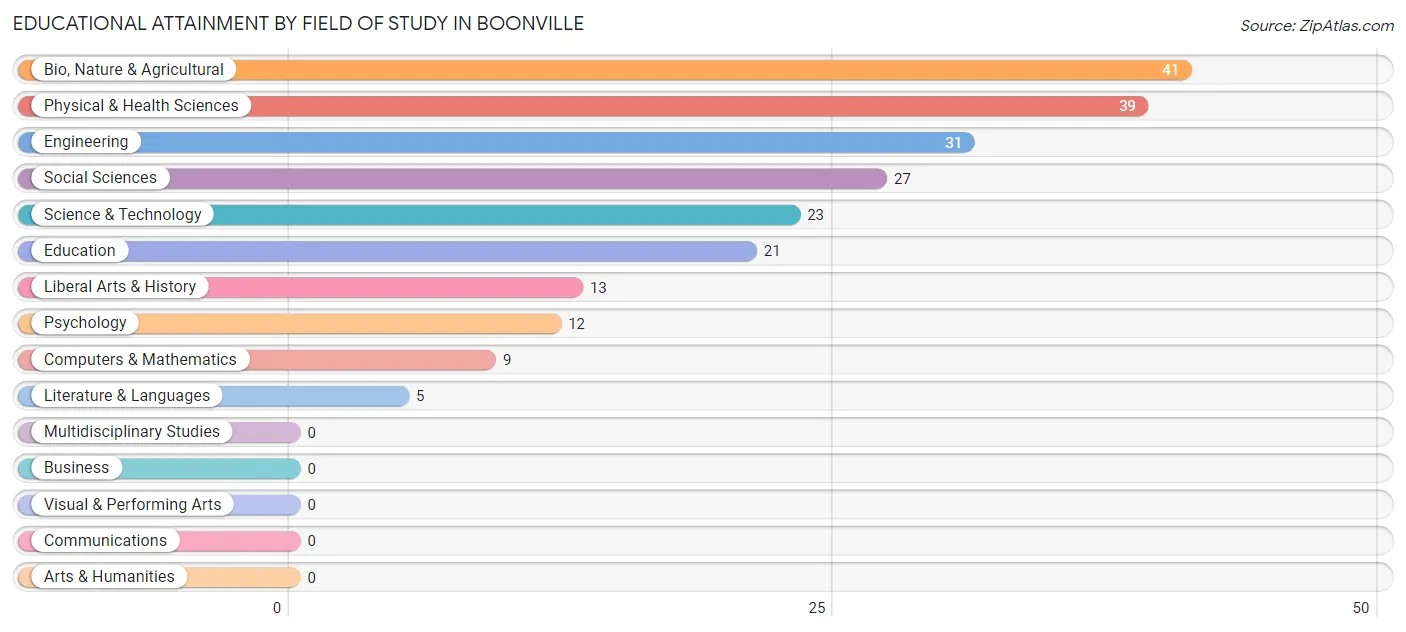
| Field of Study | # Graduates | % Graduates |
| Computers & Mathematics | 9 | 4.1% |
| Bio, Nature & Agricultural | 41 | 18.5% |
| Physical & Health Sciences | 39 | 17.6% |
| Psychology | 12 | 5.4% |
| Social Sciences | 27 | 12.2% |
| Engineering | 31 | 14.0% |
| Multidisciplinary Studies | 0 | 0.0% |
| Science & Technology | 23 | 10.4% |
| Business | 0 | 0.0% |
| Education | 21 | 9.5% |
| Literature & Languages | 5 | 2.3% |
| Liberal Arts & History | 13 | 5.9% |
| Visual & Performing Arts | 0 | 0.0% |
| Communications | 0 | 0.0% |
| Arts & Humanities | 0 | 0.0% |
| Total | 221 | 100.0% |
Transportation & Commute in Boonville
Vehicle Availability by Sex in Boonville
The most prevalent vehicle ownership categories in Boonville are males with 2 vehicles (76, accounting for 44.7%) and females with 2 vehicles (92, making up 47.5%).
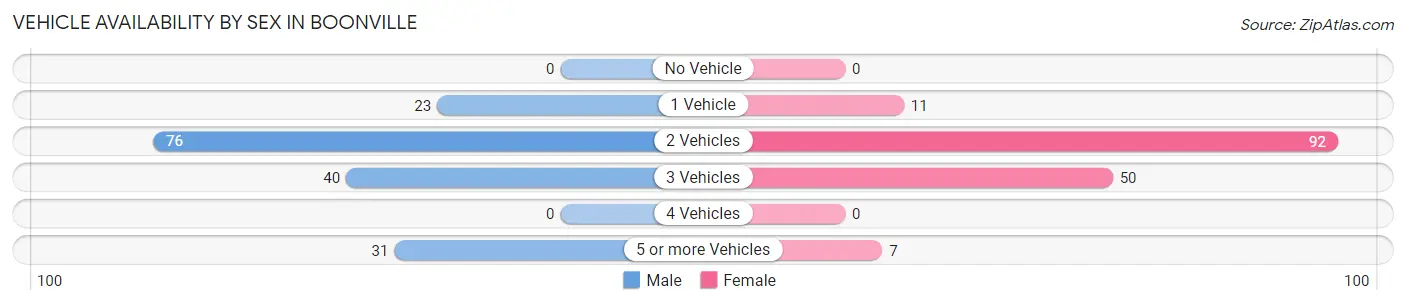
| Vehicles Available | Male | Female |
| No Vehicle | 0 (0.0%) | 0 (0.0%) |
| 1 Vehicle | 23 (13.5%) | 11 (6.9%) |
| 2 Vehicles | 76 (44.7%) | 92 (57.5%) |
| 3 Vehicles | 40 (23.5%) | 50 (31.2%) |
| 4 Vehicles | 0 (0.0%) | 0 (0.0%) |
| 5 or more Vehicles | 31 (18.2%) | 7 (4.4%) |
| Total | 170 (100.0%) | 160 (100.0%) |
Commute Time in Boonville
The most frequently occuring commute durations in Boonville are 5 to 9 minutes (136 commuters, 49.1%), 10 to 14 minutes (42 commuters, 15.2%), and 30 to 34 minutes (42 commuters, 15.2%).
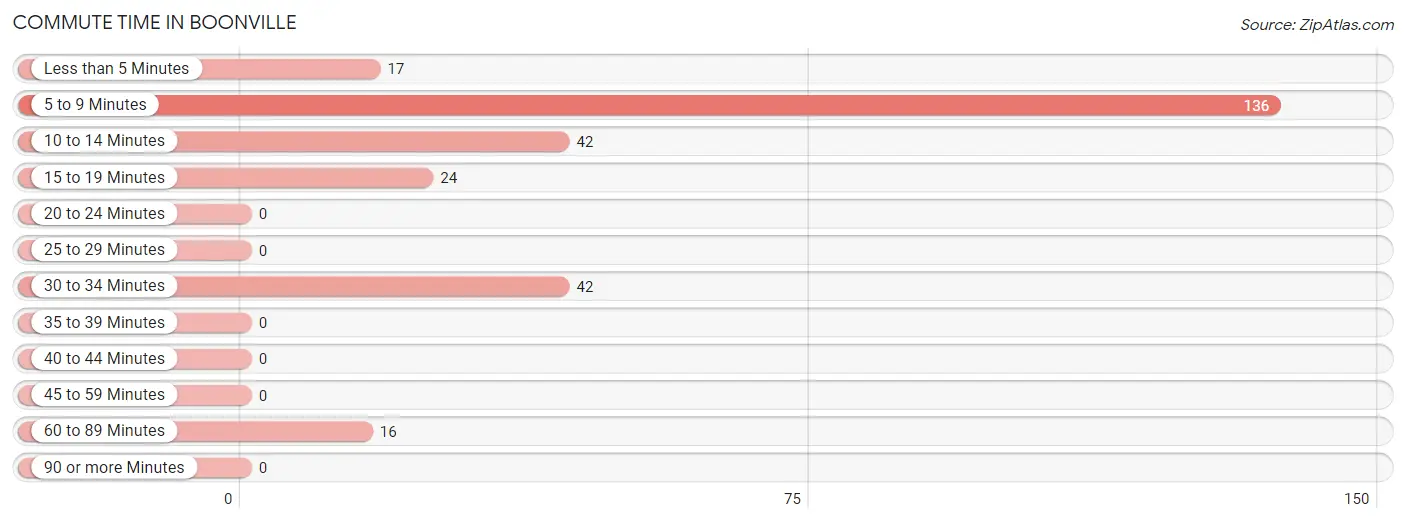
| Commute Time | # Commuters | % Commuters |
| Less than 5 Minutes | 17 | 6.1% |
| 5 to 9 Minutes | 136 | 49.1% |
| 10 to 14 Minutes | 42 | 15.2% |
| 15 to 19 Minutes | 24 | 8.7% |
| 20 to 24 Minutes | 0 | 0.0% |
| 25 to 29 Minutes | 0 | 0.0% |
| 30 to 34 Minutes | 42 | 15.2% |
| 35 to 39 Minutes | 0 | 0.0% |
| 40 to 44 Minutes | 0 | 0.0% |
| 45 to 59 Minutes | 0 | 0.0% |
| 60 to 89 Minutes | 16 | 5.8% |
| 90 or more Minutes | 0 | 0.0% |
Commute Time by Sex in Boonville
The most common commute times in Boonville are 5 to 9 minutes (61 commuters, 45.2%) for males and 5 to 9 minutes (75 commuters, 52.8%) for females.
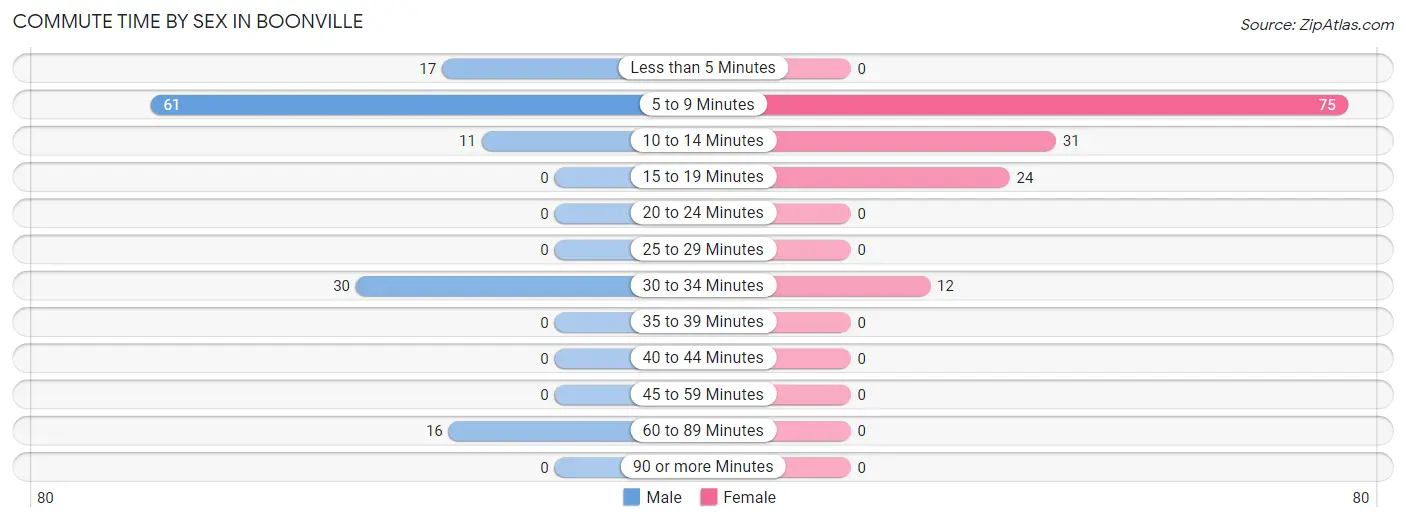
| Commute Time | Male | Female |
| Less than 5 Minutes | 17 (12.6%) | 0 (0.0%) |
| 5 to 9 Minutes | 61 (45.2%) | 75 (52.8%) |
| 10 to 14 Minutes | 11 (8.2%) | 31 (21.8%) |
| 15 to 19 Minutes | 0 (0.0%) | 24 (16.9%) |
| 20 to 24 Minutes | 0 (0.0%) | 0 (0.0%) |
| 25 to 29 Minutes | 0 (0.0%) | 0 (0.0%) |
| 30 to 34 Minutes | 30 (22.2%) | 12 (8.5%) |
| 35 to 39 Minutes | 0 (0.0%) | 0 (0.0%) |
| 40 to 44 Minutes | 0 (0.0%) | 0 (0.0%) |
| 45 to 59 Minutes | 0 (0.0%) | 0 (0.0%) |
| 60 to 89 Minutes | 16 (11.8%) | 0 (0.0%) |
| 90 or more Minutes | 0 (0.0%) | 0 (0.0%) |
Time of Departure to Work by Sex in Boonville
The most frequent times of departure to work in Boonville are 6:00 AM to 6:29 AM (68, 50.4%) for males and 9:00 AM to 9:59 AM (31, 21.8%) for females.

| Time of Departure | Male | Female |
| 12:00 AM to 4:59 AM | 6 (4.4%) | 0 (0.0%) |
| 5:00 AM to 5:29 AM | 0 (0.0%) | 0 (0.0%) |
| 5:30 AM to 5:59 AM | 0 (0.0%) | 0 (0.0%) |
| 6:00 AM to 6:29 AM | 68 (50.4%) | 11 (7.7%) |
| 6:30 AM to 6:59 AM | 0 (0.0%) | 10 (7.0%) |
| 7:00 AM to 7:29 AM | 55 (40.7%) | 20 (14.1%) |
| 7:30 AM to 7:59 AM | 6 (4.4%) | 12 (8.5%) |
| 8:00 AM to 8:29 AM | 0 (0.0%) | 0 (0.0%) |
| 8:30 AM to 8:59 AM | 0 (0.0%) | 12 (8.5%) |
| 9:00 AM to 9:59 AM | 0 (0.0%) | 31 (21.8%) |
| 10:00 AM to 10:59 AM | 0 (0.0%) | 12 (8.5%) |
| 11:00 AM to 11:59 AM | 0 (0.0%) | 0 (0.0%) |
| 12:00 PM to 3:59 PM | 0 (0.0%) | 13 (9.1%) |
| 4:00 PM to 11:59 PM | 0 (0.0%) | 21 (14.8%) |
| Total | 135 (100.0%) | 142 (100.0%) |
Housing Occupancy in Boonville
Occupancy by Ownership in Boonville
Of the total 334 dwellings in Boonville, owner-occupied units account for 202 (60.5%), while renter-occupied units make up 132 (39.5%).
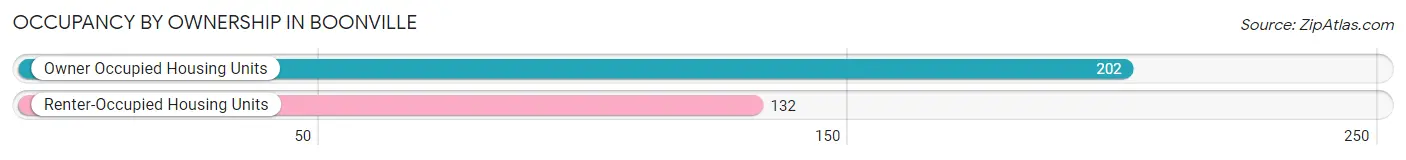
| Occupancy | # Housing Units | % Housing Units |
| Owner Occupied Housing Units | 202 | 60.5% |
| Renter-Occupied Housing Units | 132 | 39.5% |
| Total Occupied Housing Units | 334 | 100.0% |
Occupancy by Household Size in Boonville
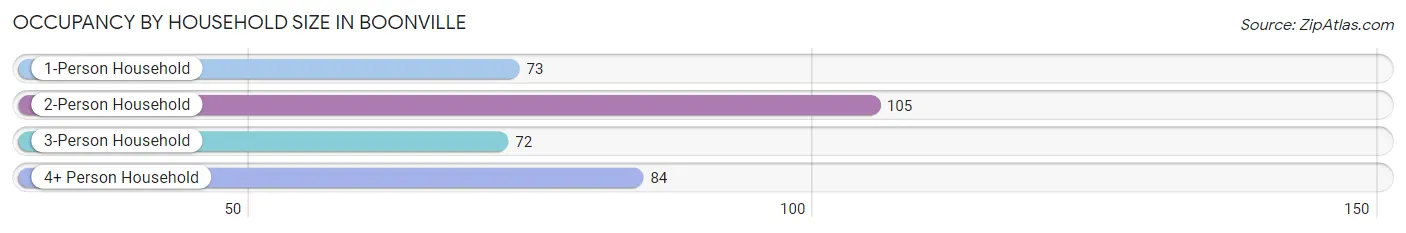
| Household Size | # Housing Units | % Housing Units |
| 1-Person Household | 73 | 21.9% |
| 2-Person Household | 105 | 31.4% |
| 3-Person Household | 72 | 21.6% |
| 4+ Person Household | 84 | 25.2% |
| Total Housing Units | 334 | 100.0% |
Occupancy by Ownership by Household Size in Boonville
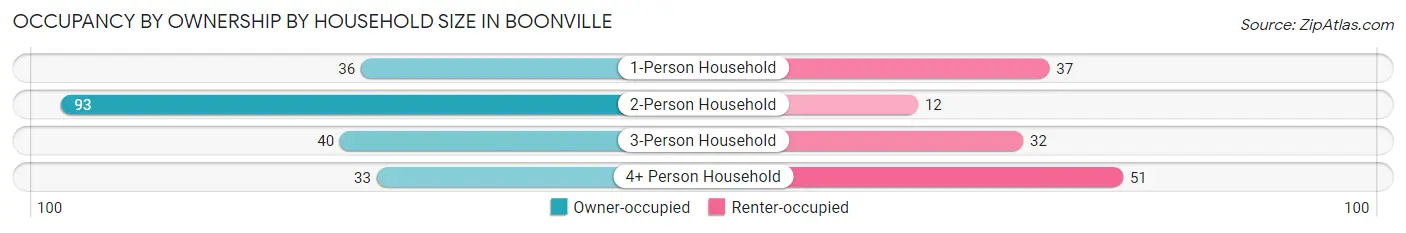
| Household Size | Owner-occupied | Renter-occupied |
| 1-Person Household | 36 (49.3%) | 37 (50.7%) |
| 2-Person Household | 93 (88.6%) | 12 (11.4%) |
| 3-Person Household | 40 (55.6%) | 32 (44.4%) |
| 4+ Person Household | 33 (39.3%) | 51 (60.7%) |
| Total Housing Units | 202 (60.5%) | 132 (39.5%) |
Occupancy by Educational Attainment in Boonville
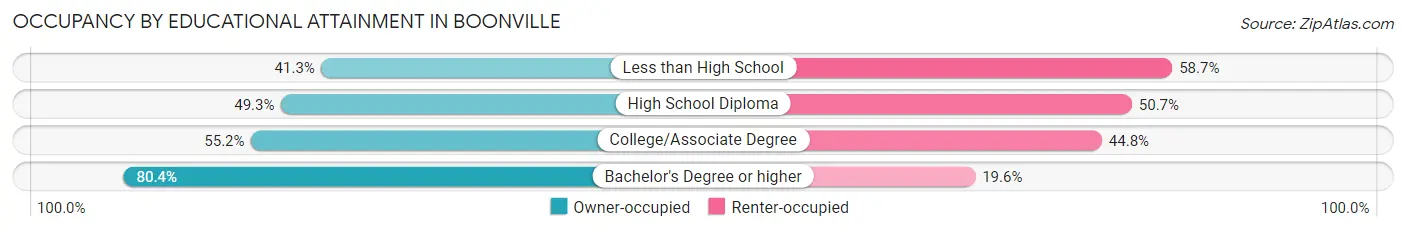
| Household Size | Owner-occupied | Renter-occupied |
| Less than High School | 19 (41.3%) | 27 (58.7%) |
| High School Diploma | 35 (49.3%) | 36 (50.7%) |
| College/Associate Degree | 58 (55.2%) | 47 (44.8%) |
| Bachelor's Degree or higher | 90 (80.4%) | 22 (19.6%) |
Occupancy by Age of Householder in Boonville
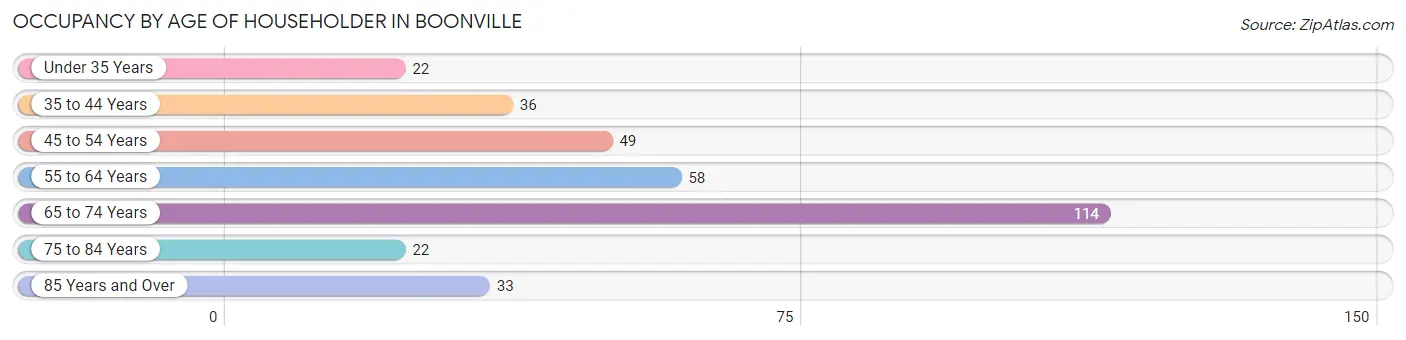
| Age Bracket | # Households | % Households |
| Under 35 Years | 22 | 6.6% |
| 35 to 44 Years | 36 | 10.8% |
| 45 to 54 Years | 49 | 14.7% |
| 55 to 64 Years | 58 | 17.4% |
| 65 to 74 Years | 114 | 34.1% |
| 75 to 84 Years | 22 | 6.6% |
| 85 Years and Over | 33 | 9.9% |
| Total | 334 | 100.0% |
Housing Finances in Boonville
Median Income by Occupancy in Boonville
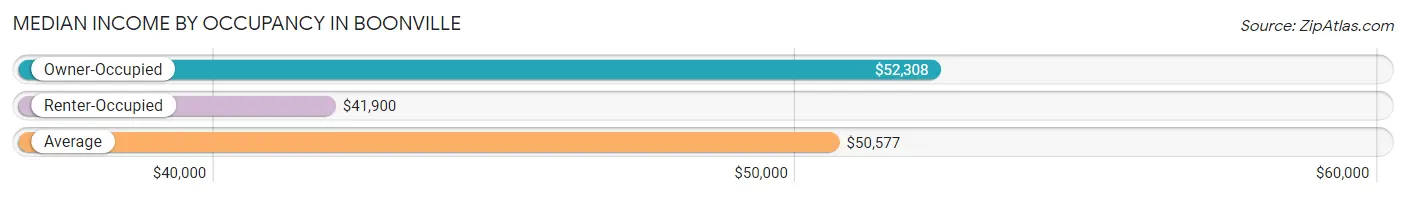
| Occupancy Type | # Households | Median Income |
| Owner-Occupied | 202 (60.5%) | $52,308 |
| Renter-Occupied | 132 (39.5%) | $41,900 |
| Average | 334 (100.0%) | $50,577 |
Occupancy by Householder Income Bracket in Boonville
| Income Bracket | Owner-occupied | Renter-occupied |
| Less than $5,000 | 0 (0.0%) | 0 (0.0%) |
| $5,000 to $9,999 | 5 (2.5%) | 0 (0.0%) |
| $10,000 to $14,999 | 5 (2.5%) | 0 (0.0%) |
| $15,000 to $19,999 | 0 (0.0%) | 0 (0.0%) |
| $20,000 to $24,999 | 4 (2.0%) | 13 (9.9%) |
| $25,000 to $34,999 | 32 (15.8%) | 23 (17.4%) |
| $35,000 to $49,999 | 43 (21.3%) | 36 (27.3%) |
| $50,000 to $74,999 | 28 (13.9%) | 29 (22.0%) |
| $75,000 to $99,999 | 34 (16.8%) | 5 (3.8%) |
| $100,000 to $149,999 | 26 (12.9%) | 26 (19.7%) |
| $150,000 or more | 25 (12.4%) | 0 (0.0%) |
| Total | 202 (100.0%) | 132 (100.0%) |
Monthly Housing Cost Tiers in Boonville
| Monthly Cost | Owner-occupied | Renter-occupied |
| Less than $300 | 5 (2.5%) | 0 (0.0%) |
| $300 to $499 | 54 (26.7%) | 0 (0.0%) |
| $500 to $799 | 32 (15.8%) | 13 (9.9%) |
| $800 to $999 | 29 (14.4%) | 11 (8.3%) |
| $1,000 to $1,499 | 28 (13.9%) | 70 (53.0%) |
| $1,500 to $1,999 | 10 (5.0%) | 21 (15.9%) |
| $2,000 to $2,499 | 12 (5.9%) | 17 (12.9%) |
| $2,500 to $2,999 | 21 (10.4%) | 0 (0.0%) |
| $3,000 or more | 11 (5.4%) | 0 (0.0%) |
| Total | 202 (100.0%) | 132 (100.0%) |
Physical Housing Characteristics in Boonville
Housing Structures in Boonville
| Structure Type | # Housing Units | % Housing Units |
| Single Unit, Detached | 303 | 90.7% |
| Single Unit, Attached | 13 | 3.9% |
| 2 Unit Apartments | 0 | 0.0% |
| 3 or 4 Unit Apartments | 0 | 0.0% |
| 5 to 9 Unit Apartments | 0 | 0.0% |
| 10 or more Apartments | 0 | 0.0% |
| Mobile Home / Other | 18 | 5.4% |
| Total | 334 | 100.0% |
Housing Structures by Occupancy in Boonville
| Structure Type | Owner-occupied | Renter-occupied |
| Single Unit, Detached | 184 (60.7%) | 119 (39.3%) |
| Single Unit, Attached | 0 (0.0%) | 13 (100.0%) |
| 2 Unit Apartments | 0 (0.0%) | 0 (0.0%) |
| 3 or 4 Unit Apartments | 0 (0.0%) | 0 (0.0%) |
| 5 to 9 Unit Apartments | 0 (0.0%) | 0 (0.0%) |
| 10 or more Apartments | 0 (0.0%) | 0 (0.0%) |
| Mobile Home / Other | 18 (100.0%) | 0 (0.0%) |
| Total | 202 (60.5%) | 132 (39.5%) |
Housing Structures by Number of Rooms in Boonville
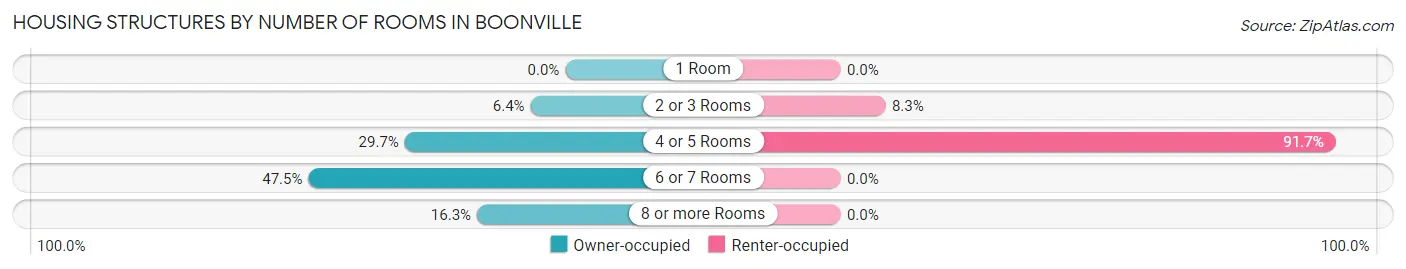
| Number of Rooms | Owner-occupied | Renter-occupied |
| 1 Room | 0 (0.0%) | 0 (0.0%) |
| 2 or 3 Rooms | 13 (6.4%) | 11 (8.3%) |
| 4 or 5 Rooms | 60 (29.7%) | 121 (91.7%) |
| 6 or 7 Rooms | 96 (47.5%) | 0 (0.0%) |
| 8 or more Rooms | 33 (16.3%) | 0 (0.0%) |
| Total | 202 (100.0%) | 132 (100.0%) |
Housing Structure by Heating Type in Boonville
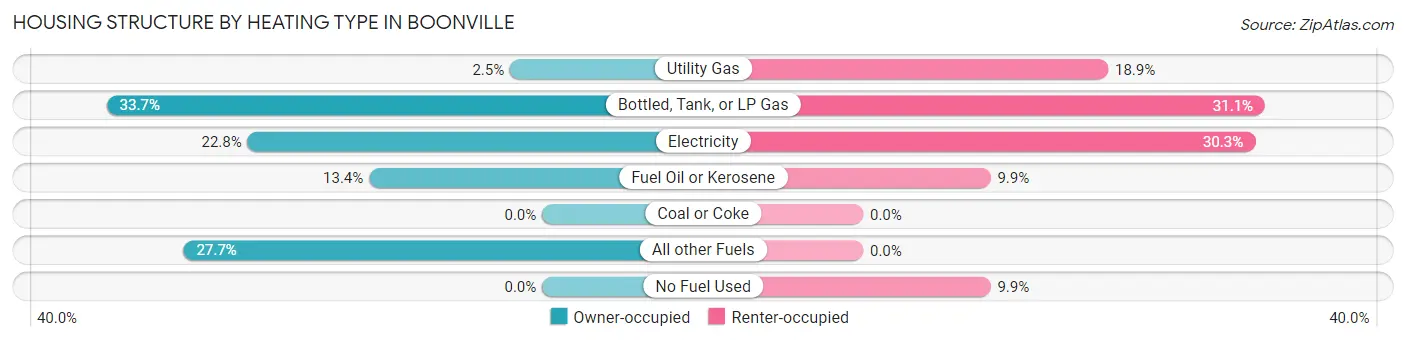
| Heating Type | Owner-occupied | Renter-occupied |
| Utility Gas | 5 (2.5%) | 25 (18.9%) |
| Bottled, Tank, or LP Gas | 68 (33.7%) | 41 (31.1%) |
| Electricity | 46 (22.8%) | 40 (30.3%) |
| Fuel Oil or Kerosene | 27 (13.4%) | 13 (9.9%) |
| Coal or Coke | 0 (0.0%) | 0 (0.0%) |
| All other Fuels | 56 (27.7%) | 0 (0.0%) |
| No Fuel Used | 0 (0.0%) | 13 (9.9%) |
| Total | 202 (100.0%) | 132 (100.0%) |
Household Vehicle Usage in Boonville
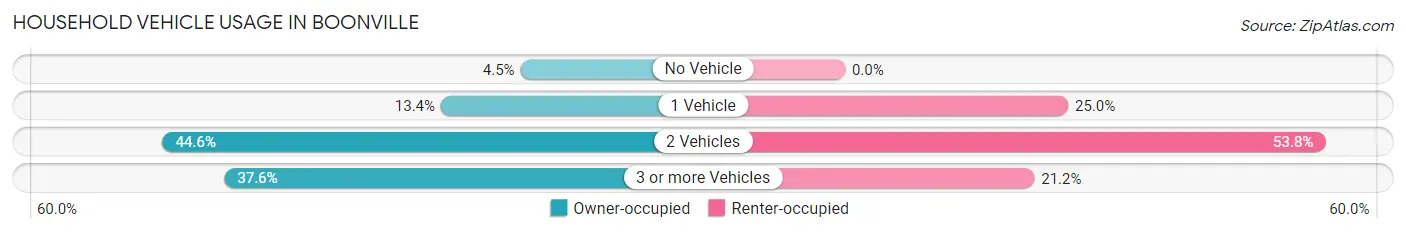
| Vehicles per Household | Owner-occupied | Renter-occupied |
| No Vehicle | 9 (4.5%) | 0 (0.0%) |
| 1 Vehicle | 27 (13.4%) | 33 (25.0%) |
| 2 Vehicles | 90 (44.6%) | 71 (53.8%) |
| 3 or more Vehicles | 76 (37.6%) | 28 (21.2%) |
| Total | 202 (100.0%) | 132 (100.0%) |
Real Estate & Mortgages in Boonville
Real Estate and Mortgage Overview in Boonville
| Characteristic | Without Mortgage | With Mortgage |
| Housing Units | 143 | 59 |
| Median Property Value | $650,600 | $479,400 |
| Median Household Income | $51,827 | $10 |
| Monthly Housing Costs | $574 | $11 |
| Real Estate Taxes | $2,263 | $0 |
Property Value by Mortgage Status in Boonville
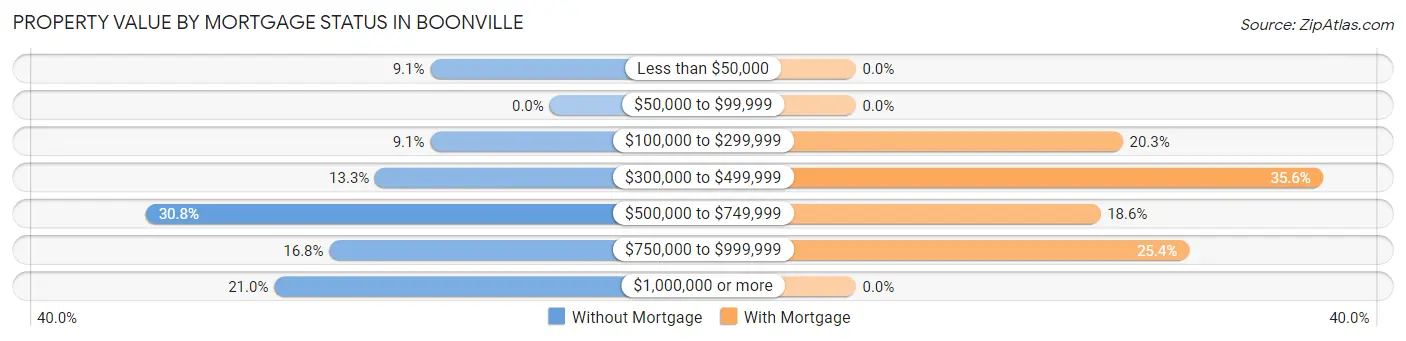
| Property Value | Without Mortgage | With Mortgage |
| Less than $50,000 | 13 (9.1%) | 0 (0.0%) |
| $50,000 to $99,999 | 0 (0.0%) | 0 (0.0%) |
| $100,000 to $299,999 | 13 (9.1%) | 12 (20.3%) |
| $300,000 to $499,999 | 19 (13.3%) | 21 (35.6%) |
| $500,000 to $749,999 | 44 (30.8%) | 11 (18.6%) |
| $750,000 to $999,999 | 24 (16.8%) | 15 (25.4%) |
| $1,000,000 or more | 30 (21.0%) | 0 (0.0%) |
| Total | 143 (100.0%) | 59 (100.0%) |
Household Income by Mortgage Status in Boonville
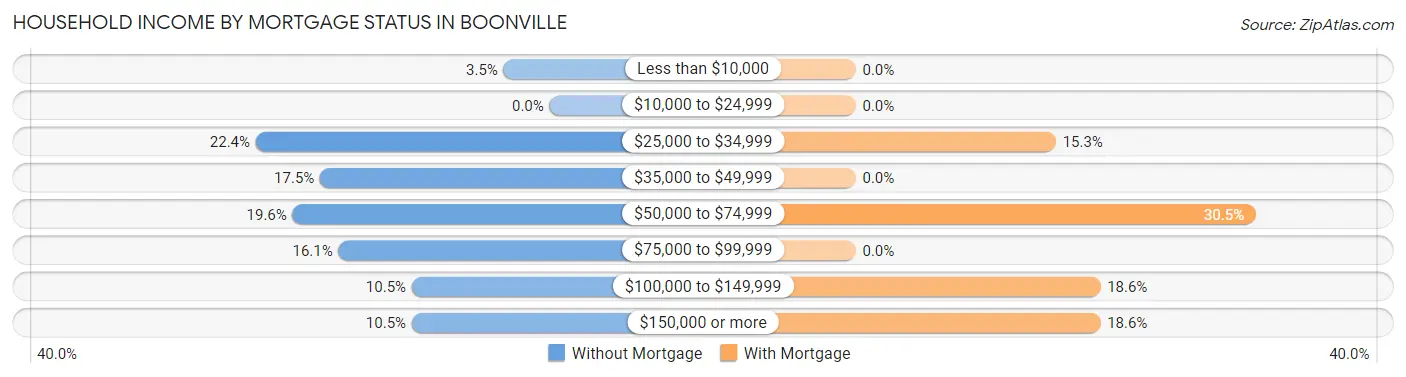
| Household Income | Without Mortgage | With Mortgage |
| Less than $10,000 | 5 (3.5%) | 0 (0.0%) |
| $10,000 to $24,999 | 0 (0.0%) | 0 (0.0%) |
| $25,000 to $34,999 | 32 (22.4%) | 9 (15.2%) |
| $35,000 to $49,999 | 25 (17.5%) | 0 (0.0%) |
| $50,000 to $74,999 | 28 (19.6%) | 18 (30.5%) |
| $75,000 to $99,999 | 23 (16.1%) | 0 (0.0%) |
| $100,000 to $149,999 | 15 (10.5%) | 11 (18.6%) |
| $150,000 or more | 15 (10.5%) | 11 (18.6%) |
| Total | 143 (100.0%) | 59 (100.0%) |
Property Value to Household Income Ratio in Boonville
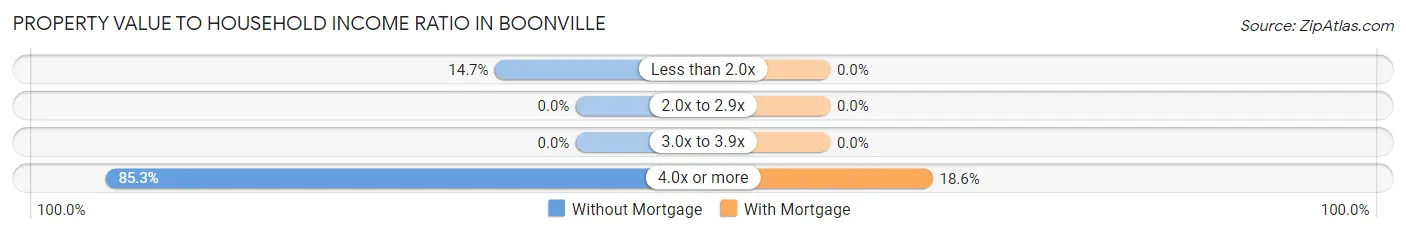
| Value-to-Income Ratio | Without Mortgage | With Mortgage |
| Less than 2.0x | 21 (14.7%) | 0 (0.0%) |
| 2.0x to 2.9x | 0 (0.0%) | 0 (0.0%) |
| 3.0x to 3.9x | 0 (0.0%) | 0 (0.0%) |
| 4.0x or more | 122 (85.3%) | 11 (18.6%) |
| Total | 143 (100.0%) | 59 (100.0%) |
Real Estate Taxes by Mortgage Status in Boonville
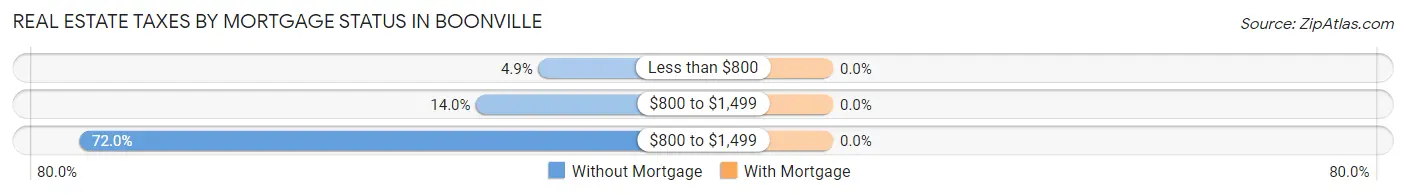
| Property Taxes | Without Mortgage | With Mortgage |
| Less than $800 | 7 (4.9%) | 0 (0.0%) |
| $800 to $1,499 | 20 (14.0%) | 0 (0.0%) |
| $800 to $1,499 | 103 (72.0%) | 0 (0.0%) |
| Total | 143 (100.0%) | 59 (100.0%) |
Health & Disability in Boonville
Health Insurance Coverage by Age in Boonville
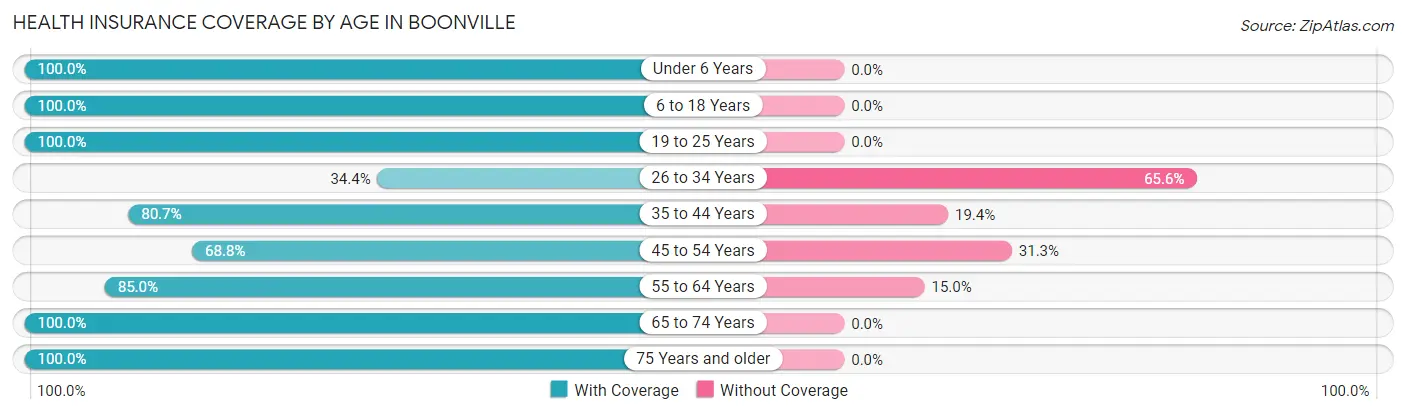
| Age Bracket | With Coverage | Without Coverage |
| Under 6 Years | 44 (100.0%) | 0 (0.0%) |
| 6 to 18 Years | 214 (100.0%) | 0 (0.0%) |
| 19 to 25 Years | 74 (100.0%) | 0 (0.0%) |
| 26 to 34 Years | 22 (34.4%) | 42 (65.6%) |
| 35 to 44 Years | 100 (80.6%) | 24 (19.4%) |
| 45 to 54 Years | 55 (68.8%) | 25 (31.2%) |
| 55 to 64 Years | 108 (85.0%) | 19 (15.0%) |
| 65 to 74 Years | 133 (100.0%) | 0 (0.0%) |
| 75 Years and older | 134 (100.0%) | 0 (0.0%) |
| Total | 884 (88.9%) | 110 (11.1%) |
Health Insurance Coverage by Citizenship Status in Boonville
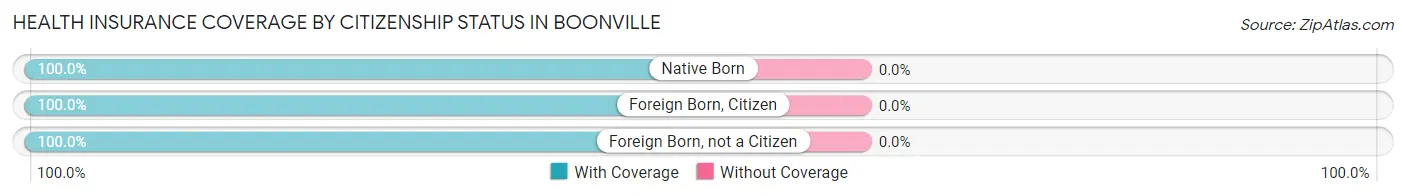
| Citizenship Status | With Coverage | Without Coverage |
| Native Born | 44 (100.0%) | 0 (0.0%) |
| Foreign Born, Citizen | 214 (100.0%) | 0 (0.0%) |
| Foreign Born, not a Citizen | 74 (100.0%) | 0 (0.0%) |
Health Insurance Coverage by Household Income in Boonville
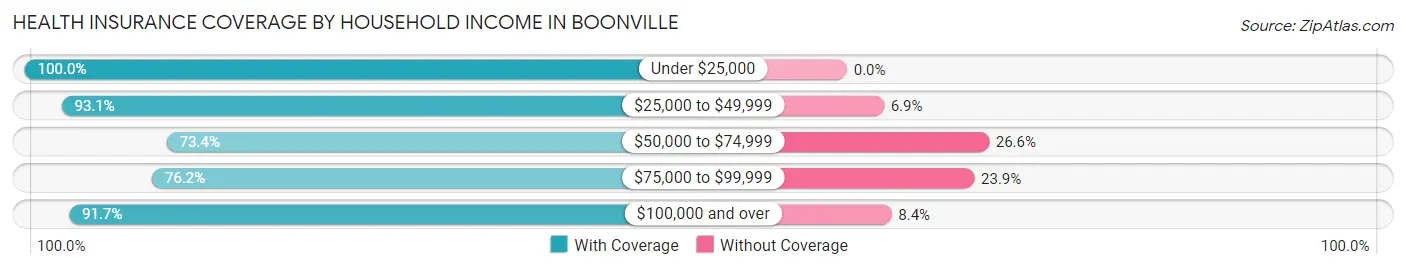
| Household Income | With Coverage | Without Coverage |
| Under $25,000 | 27 (100.0%) | 0 (0.0%) |
| $25,000 to $49,999 | 310 (93.1%) | 23 (6.9%) |
| $50,000 to $74,999 | 69 (73.4%) | 25 (26.6%) |
| $75,000 to $99,999 | 83 (76.1%) | 26 (23.8%) |
| $100,000 and over | 395 (91.6%) | 36 (8.4%) |
Public vs Private Health Insurance Coverage by Age in Boonville
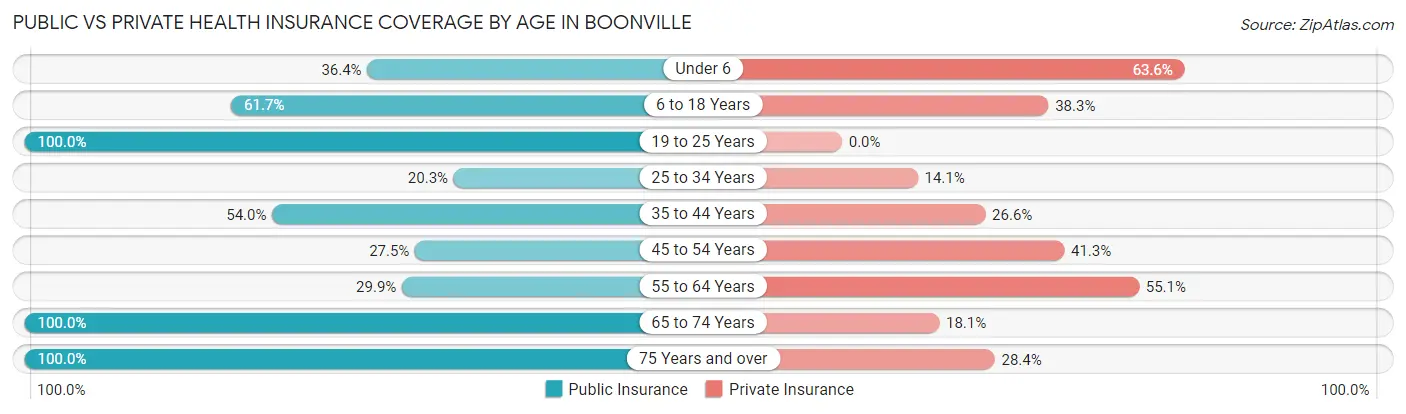
| Age Bracket | Public Insurance | Private Insurance |
| Under 6 | 16 (36.4%) | 28 (63.6%) |
| 6 to 18 Years | 132 (61.7%) | 82 (38.3%) |
| 19 to 25 Years | 74 (100.0%) | 0 (0.0%) |
| 25 to 34 Years | 13 (20.3%) | 9 (14.1%) |
| 35 to 44 Years | 67 (54.0%) | 33 (26.6%) |
| 45 to 54 Years | 22 (27.5%) | 33 (41.2%) |
| 55 to 64 Years | 38 (29.9%) | 70 (55.1%) |
| 65 to 74 Years | 133 (100.0%) | 24 (18.0%) |
| 75 Years and over | 134 (100.0%) | 38 (28.4%) |
| Total | 629 (63.3%) | 317 (31.9%) |
Disability Status by Sex by Age in Boonville
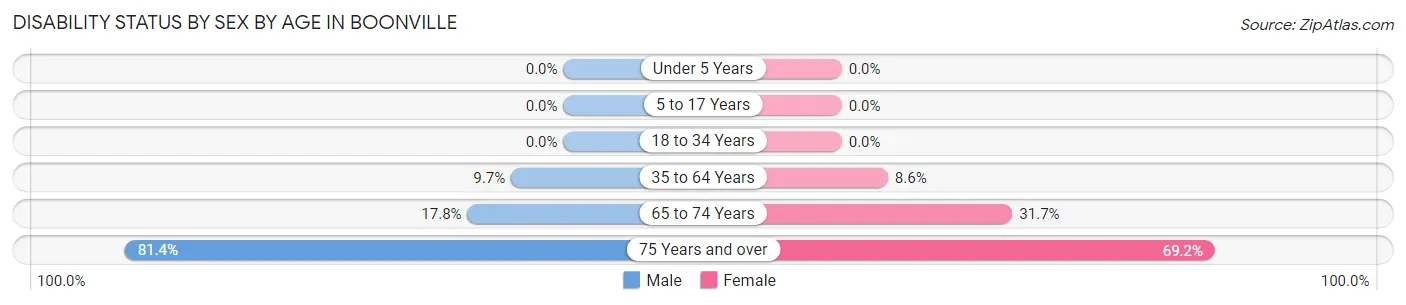
| Age Bracket | Male | Female |
| Under 5 Years | 0 (0.0%) | 0 (0.0%) |
| 5 to 17 Years | 0 (0.0%) | 0 (0.0%) |
| 18 to 34 Years | 0 (0.0%) | 0 (0.0%) |
| 35 to 64 Years | 14 (9.7%) | 16 (8.6%) |
| 65 to 74 Years | 13 (17.8%) | 19 (31.7%) |
| 75 Years and over | 35 (81.4%) | 63 (69.2%) |
Disability Class by Sex by Age in Boonville
Disability Class: Hearing Difficulty
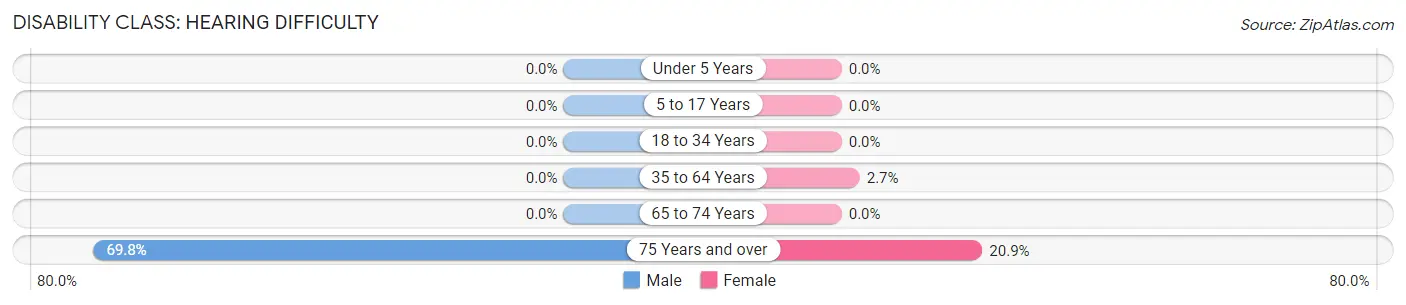
| Age Bracket | Male | Female |
| Under 5 Years | 0 (0.0%) | 0 (0.0%) |
| 5 to 17 Years | 0 (0.0%) | 0 (0.0%) |
| 18 to 34 Years | 0 (0.0%) | 0 (0.0%) |
| 35 to 64 Years | 0 (0.0%) | 5 (2.7%) |
| 65 to 74 Years | 0 (0.0%) | 0 (0.0%) |
| 75 Years and over | 30 (69.8%) | 19 (20.9%) |
Disability Class: Vision Difficulty
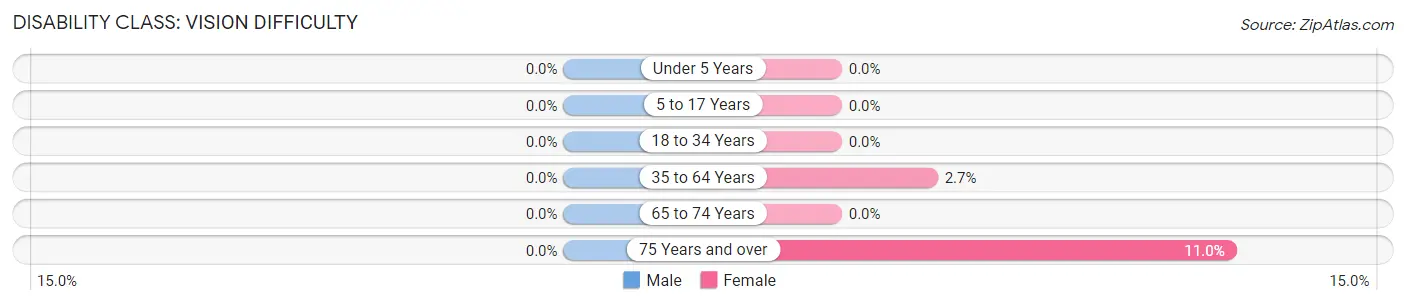
| Age Bracket | Male | Female |
| Under 5 Years | 0 (0.0%) | 0 (0.0%) |
| 5 to 17 Years | 0 (0.0%) | 0 (0.0%) |
| 18 to 34 Years | 0 (0.0%) | 0 (0.0%) |
| 35 to 64 Years | 0 (0.0%) | 5 (2.7%) |
| 65 to 74 Years | 0 (0.0%) | 0 (0.0%) |
| 75 Years and over | 0 (0.0%) | 10 (11.0%) |
Disability Class: Cognitive Difficulty
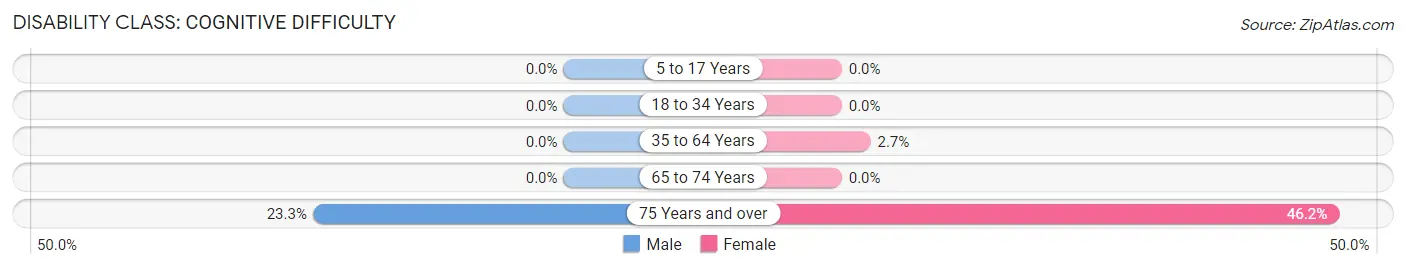
| Age Bracket | Male | Female |
| 5 to 17 Years | 0 (0.0%) | 0 (0.0%) |
| 18 to 34 Years | 0 (0.0%) | 0 (0.0%) |
| 35 to 64 Years | 0 (0.0%) | 5 (2.7%) |
| 65 to 74 Years | 0 (0.0%) | 0 (0.0%) |
| 75 Years and over | 10 (23.3%) | 42 (46.2%) |
Disability Class: Ambulatory Difficulty
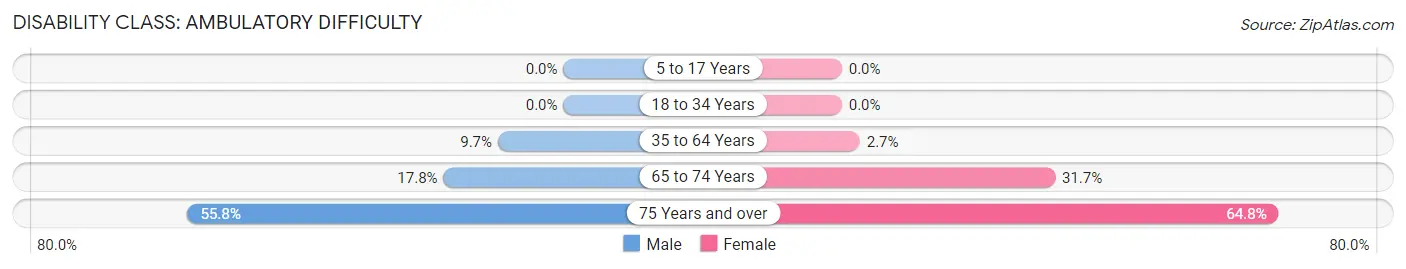
| Age Bracket | Male | Female |
| 5 to 17 Years | 0 (0.0%) | 0 (0.0%) |
| 18 to 34 Years | 0 (0.0%) | 0 (0.0%) |
| 35 to 64 Years | 14 (9.7%) | 5 (2.7%) |
| 65 to 74 Years | 13 (17.8%) | 19 (31.7%) |
| 75 Years and over | 24 (55.8%) | 59 (64.8%) |
Disability Class: Self-Care Difficulty
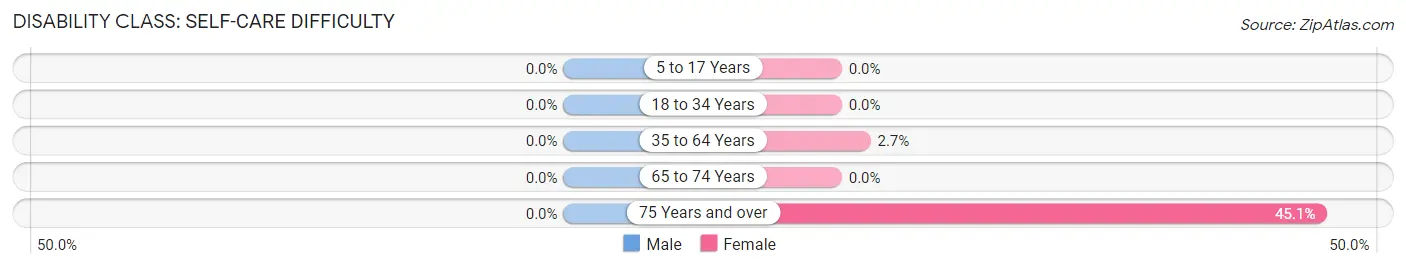
| Age Bracket | Male | Female |
| 5 to 17 Years | 0 (0.0%) | 0 (0.0%) |
| 18 to 34 Years | 0 (0.0%) | 0 (0.0%) |
| 35 to 64 Years | 0 (0.0%) | 5 (2.7%) |
| 65 to 74 Years | 0 (0.0%) | 0 (0.0%) |
| 75 Years and over | 0 (0.0%) | 41 (45.1%) |
Technology Access in Boonville
Computing Device Access in Boonville
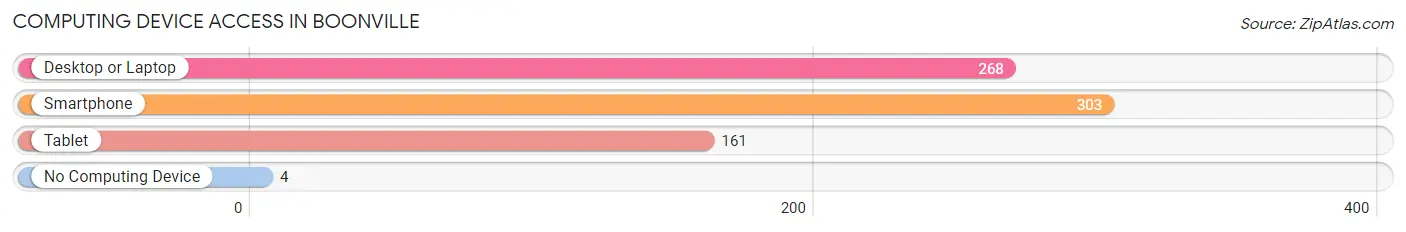
| Device Type | # Households | % Households |
| Desktop or Laptop | 268 | 80.2% |
| Smartphone | 303 | 90.7% |
| Tablet | 161 | 48.2% |
| No Computing Device | 4 | 1.2% |
| Total | 334 | 100.0% |
Internet Access in Boonville
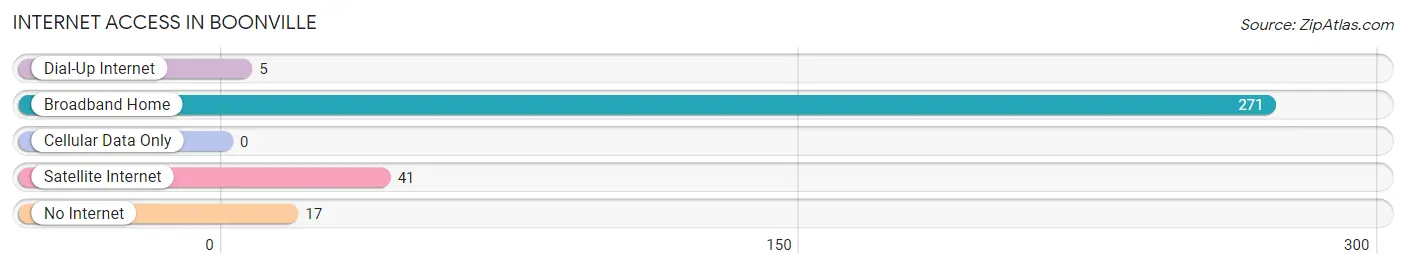
| Internet Type | # Households | % Households |
| Dial-Up Internet | 5 | 1.5% |
| Broadband Home | 271 | 81.1% |
| Cellular Data Only | 0 | 0.0% |
| Satellite Internet | 41 | 12.3% |
| No Internet | 17 | 5.1% |
| Total | 334 | 100.0% |
Boonville Summary
Boonville is a small town located in Mendocino County, California, United States. It is situated in the Anderson Valley, a narrow valley in the coastal mountain range of Northern California. The town has a population of 890 people as of the 2010 census.
History
The area around Boonville was first inhabited by the Pomo people, who lived in the area for thousands of years before the arrival of Europeans. The first Europeans to settle in the area were the Anderson family, who arrived in 1851. They established a homestead and named the area Anderson Valley. The town of Boonville was founded in 1864 by William Boon, who established a store and post office. The town was named after him.
In the late 19th century, the town became a center for logging and lumber production. The lumber industry was the main source of employment for the town until the mid-20th century. In the 1950s, the town began to transition to a more tourism-based economy.
Geography
Boonville is located in the Anderson Valley, a narrow valley in the coastal mountain range of Northern California. The town is situated at an elevation of 1,000 feet (305 m) above sea level. The valley is surrounded by hills and mountains, including the Mendocino Range to the west and the Coastal Range to the east. The climate in the area is Mediterranean, with mild, wet winters and hot, dry summers.
Economy
The economy of Boonville is largely based on tourism. The town is a popular destination for wine tasting, camping, and outdoor recreation. The town is also home to several wineries, including the Anderson Valley Winery, which produces a variety of wines.
The town is also home to several small businesses, including restaurants, cafes, and shops. The town is also home to a number of art galleries and studios.
Demographics
As of the 2010 census, the population of Boonville was 890 people. The racial makeup of the town was 87.2% White, 0.7% African American, 0.7% Native American, 0.7% Asian, 0.1% Pacific Islander, 8.2% from other races, and 2.3% from two or more races. Hispanic or Latino of any race were 16.2% of the population.
The median household income in Boonville was $41,250, and the median family income was $50,000. The per capita income for the town was $21,945. About 11.2% of families and 15.2% of the population were below the poverty line, including 22.2% of those under age 18 and 8.3% of those age 65 or over.
Common Questions
What is Per Capita Income in Boonville?
Per Capita income in Boonville is $29,205.
What is the Median Household income in Boonville?
Median Household Income in Boonville is $50,577.
What is Income or Wage Gap in Boonville?
Income or Wage Gap in Boonville is 42.7%.
Women in Boonville earn 57.3 cents for every dollar earned by a man.
What is Inequality or Gini Index in Boonville?
Inequality or Gini Index in Boonville is 0.45.
What is the Total Population of Boonville?
Total Population of Boonville is 995.
What is the Total Male Population of Boonville?
Total Male Population of Boonville is 419.
What is the Total Female Population of Boonville?
Total Female Population of Boonville is 576.
What is the Ratio of Males per 100 Females in Boonville?
There are 72.74 Males per 100 Females in Boonville.
What is the Ratio of Females per 100 Males in Boonville?
There are 137.47 Females per 100 Males in Boonville.
What is the Median Population Age in Boonville?
Median Population Age in Boonville is 42.8 Years.
What is the Average Family Size in Boonville
Average Family Size in Boonville is 3.6 People.
What is the Average Household Size in Boonville
Average Household Size in Boonville is 3.0 People.
How Large is the Labor Force in Boonville?
There are 390 People in the Labor Forcein in Boonville.
What is the Percentage of People in the Labor Force in Boonville?
52.1% of People are in the Labor Force in Boonville.
What is the Unemployment Rate in Boonville?
Unemployment Rate in Boonville is 9.7%.