Blythe, CA Map & Demographics
Blythe Map
Blythe Overview
$18,085
PER CAPITA INCOME
$58,415
AVG FAMILY INCOME
$52,377
AVG HOUSEHOLD INCOME
12.8%
WAGE / INCOME GAP [ % ]
87.2¢/ $1
WAGE / INCOME GAP [ $ ]
0.46
INEQUALITY / GINI INDEX
17,949
TOTAL POPULATION
11,747
MALE POPULATION
6,202
FEMALE POPULATION
189.41
MALES / 100 FEMALES
52.80
FEMALES / 100 MALES
35.4
MEDIAN AGE
3.4
AVG FAMILY SIZE
2.9
AVG HOUSEHOLD SIZE
4,921
LABOR FORCE [ PEOPLE ]
33.6%
PERCENT IN LABOR FORCE
7.9%
UNEMPLOYMENT RATE
Blythe Zip Codes
Blythe Area Codes
Income in Blythe
Income Overview in Blythe
Per Capita Income in Blythe is $18,085, while median incomes of families and households are $58,415 and $52,377 respectively.
| Characteristic | Number | Measure |
| Per Capita Income | 17,949 | $18,085 |
| Median Family Income | 3,016 | $58,415 |
| Mean Family Income | 3,016 | $73,979 |
| Median Household Income | 4,227 | $52,377 |
| Mean Household Income | 4,227 | $68,862 |
| Income Deficit | 3,016 | $0 |
| Wage / Income Gap (%) | 17,949 | 12.81% |
| Wage / Income Gap ($) | 17,949 | 87.19¢ per $1 |
| Gini / Inequality Index | 17,949 | 0.46 |
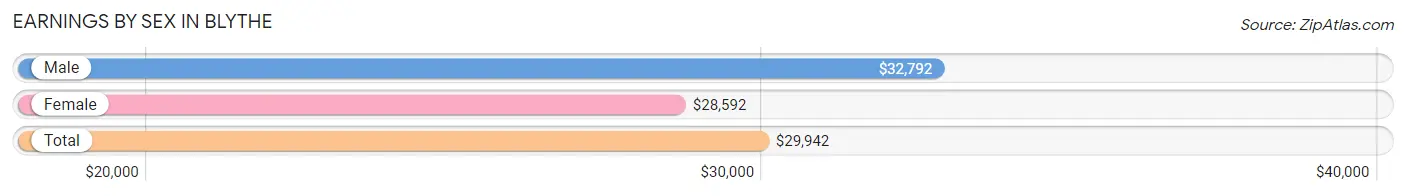
Earnings by Sex in Blythe
Average Earnings in Blythe are $29,942, $32,792 for men and $28,592 for women, a difference of 12.8%.
| Sex | Number | Average Earnings |
| Male | 3,277 (57.3%) | $32,792 |
| Female | 2,446 (42.7%) | $28,592 |
| Total | 5,723 (100.0%) | $29,942 |
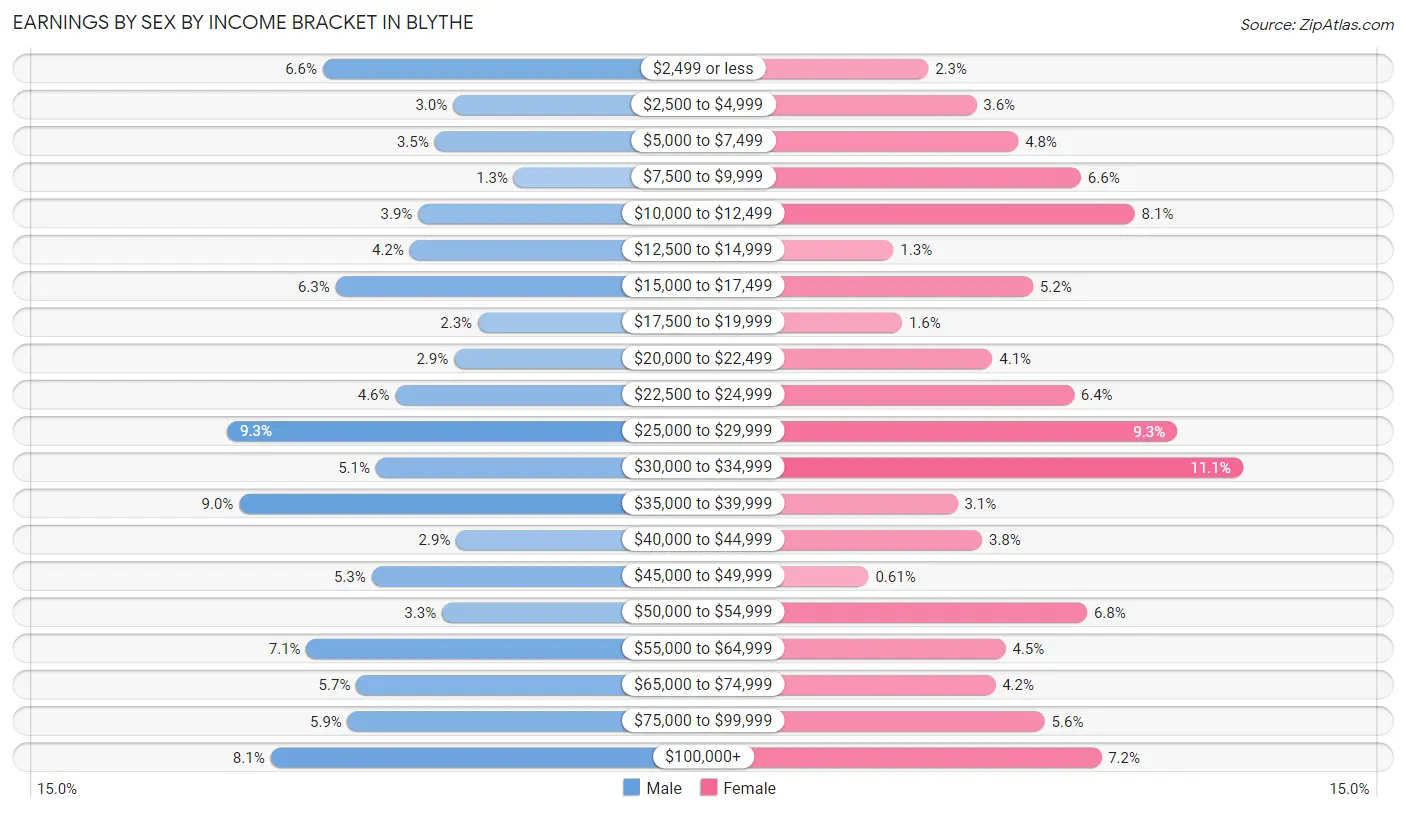
Earnings by Sex by Income Bracket in Blythe
The most common earnings brackets in Blythe are $25,000 to $29,999 for men (305 | 9.3%) and $30,000 to $34,999 for women (272 | 11.1%).
| Income | Male | Female |
| $2,499 or less | 217 (6.6%) | 56 (2.3%) |
| $2,500 to $4,999 | 97 (3.0%) | 89 (3.6%) |
| $5,000 to $7,499 | 114 (3.5%) | 118 (4.8%) |
| $7,500 to $9,999 | 41 (1.3%) | 161 (6.6%) |
| $10,000 to $12,499 | 129 (3.9%) | 198 (8.1%) |
| $12,500 to $14,999 | 137 (4.2%) | 32 (1.3%) |
| $15,000 to $17,499 | 205 (6.3%) | 128 (5.2%) |
| $17,500 to $19,999 | 74 (2.3%) | 38 (1.5%) |
| $20,000 to $22,499 | 96 (2.9%) | 100 (4.1%) |
| $22,500 to $24,999 | 150 (4.6%) | 156 (6.4%) |
| $25,000 to $29,999 | 305 (9.3%) | 227 (9.3%) |
| $30,000 to $34,999 | 168 (5.1%) | 272 (11.1%) |
| $35,000 to $39,999 | 294 (9.0%) | 76 (3.1%) |
| $40,000 to $44,999 | 94 (2.9%) | 93 (3.8%) |
| $45,000 to $49,999 | 172 (5.2%) | 15 (0.6%) |
| $50,000 to $54,999 | 107 (3.3%) | 165 (6.8%) |
| $55,000 to $64,999 | 232 (7.1%) | 109 (4.5%) |
| $65,000 to $74,999 | 186 (5.7%) | 102 (4.2%) |
| $75,000 to $99,999 | 194 (5.9%) | 136 (5.6%) |
| $100,000+ | 265 (8.1%) | 175 (7.1%) |
| Total | 3,277 (100.0%) | 2,446 (100.0%) |
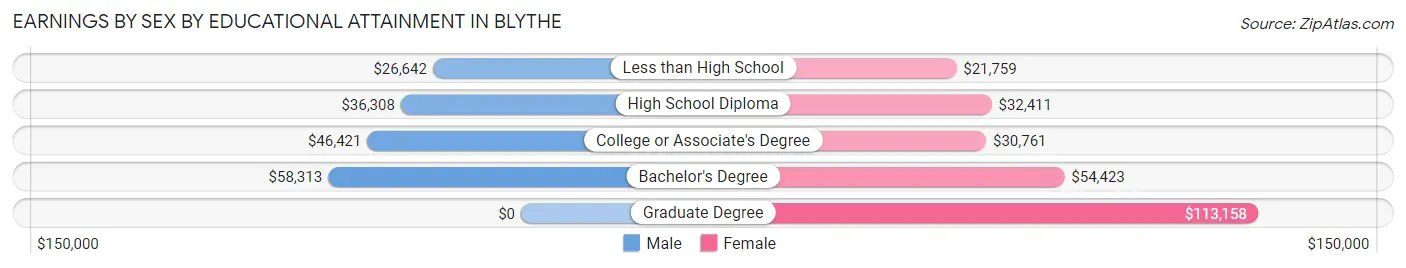
Earnings by Sex by Educational Attainment in Blythe
Average earnings in Blythe are $36,505 for men and $30,783 for women, a difference of 15.7%. Men with an educational attainment of bachelor's degree enjoy the highest average annual earnings of $58,313, while those with less than high school education earn the least with $26,642. Women with an educational attainment of graduate degree earn the most with the average annual earnings of $113,158, while those with less than high school education have the smallest earnings of $21,759.
| Educational Attainment | Male Income | Female Income |
| Less than High School | $26,642 | $21,759 |
| High School Diploma | $36,308 | $32,411 |
| College or Associate's Degree | $46,421 | $30,761 |
| Bachelor's Degree | $58,313 | $54,423 |
| Graduate Degree | - | - |
| Total | $36,505 | $30,783 |
Family Income in Blythe
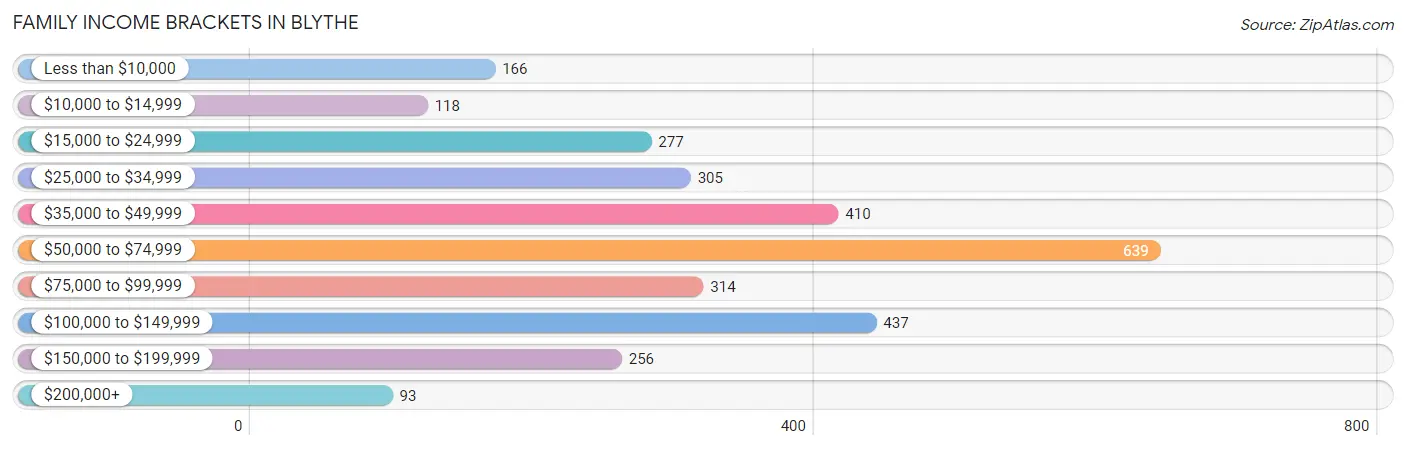
Family Income Brackets in Blythe
According to the Blythe family income data, there are 639 families falling into the $50,000 to $74,999 income range, which is the most common income bracket and makes up 21.2% of all families. Conversely, the $200,000+ income bracket is the least frequent group with only 93 families (3.1%) belonging to this category.
| Income Bracket | # Families | % Families |
| Less than $10,000 | 166 | 5.5% |
| $10,000 to $14,999 | 118 | 3.9% |
| $15,000 to $24,999 | 277 | 9.2% |
| $25,000 to $34,999 | 305 | 10.1% |
| $35,000 to $49,999 | 410 | 13.6% |
| $50,000 to $74,999 | 639 | 21.2% |
| $75,000 to $99,999 | 314 | 10.4% |
| $100,000 to $149,999 | 437 | 14.5% |
| $150,000 to $199,999 | 256 | 8.5% |
| $200,000+ | 93 | 3.1% |
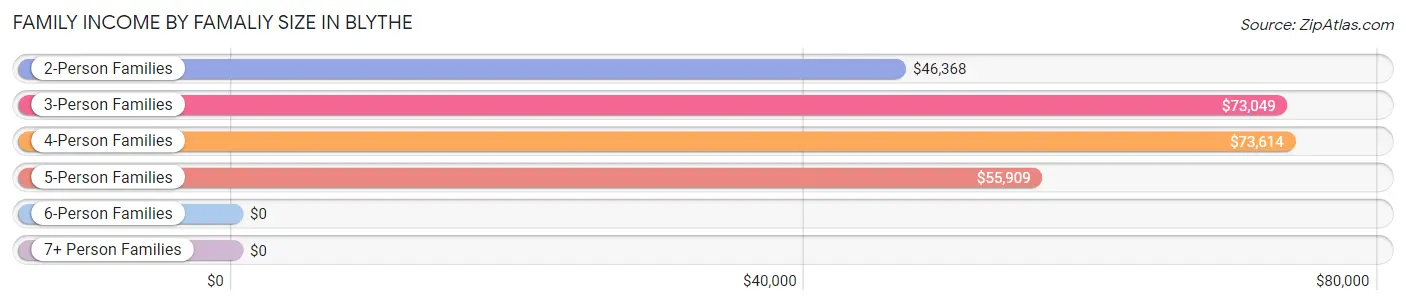
Family Income by Famaliy Size in Blythe
4-person families (673 | 22.3%) account for the highest median family income in Blythe with $73,614 per family, while 3-person families (759 | 25.2%) have the highest median income of $24,350 per family member.
| Income Bracket | # Families | Median Income |
| 2-Person Families | 1,098 (36.4%) | $46,368 |
| 3-Person Families | 759 (25.2%) | $73,049 |
| 4-Person Families | 673 (22.3%) | $73,614 |
| 5-Person Families | 308 (10.2%) | $55,909 |
| 6-Person Families | 110 (3.6%) | $0 |
| 7+ Person Families | 68 (2.2%) | $0 |
| Total | 3,016 (100.0%) | $58,415 |
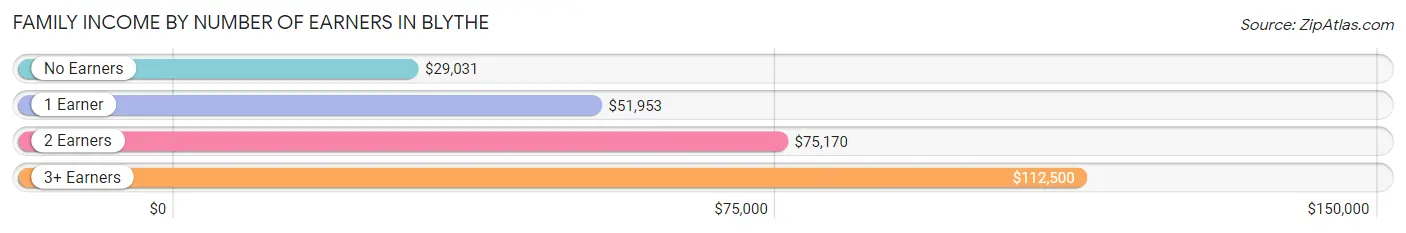
Family Income by Number of Earners in Blythe
The median family income in Blythe is $58,415, with families comprising 3+ earners (302) having the highest median family income of $112,500, while families with no earners (717) have the lowest median family income of $29,031, accounting for 10.0% and 23.8% of families, respectively.
| Number of Earners | # Families | Median Income |
| No Earners | 717 (23.8%) | $29,031 |
| 1 Earner | 1,078 (35.7%) | $51,953 |
| 2 Earners | 919 (30.5%) | $75,170 |
| 3+ Earners | 302 (10.0%) | $112,500 |
| Total | 3,016 (100.0%) | $58,415 |
Household Income in Blythe
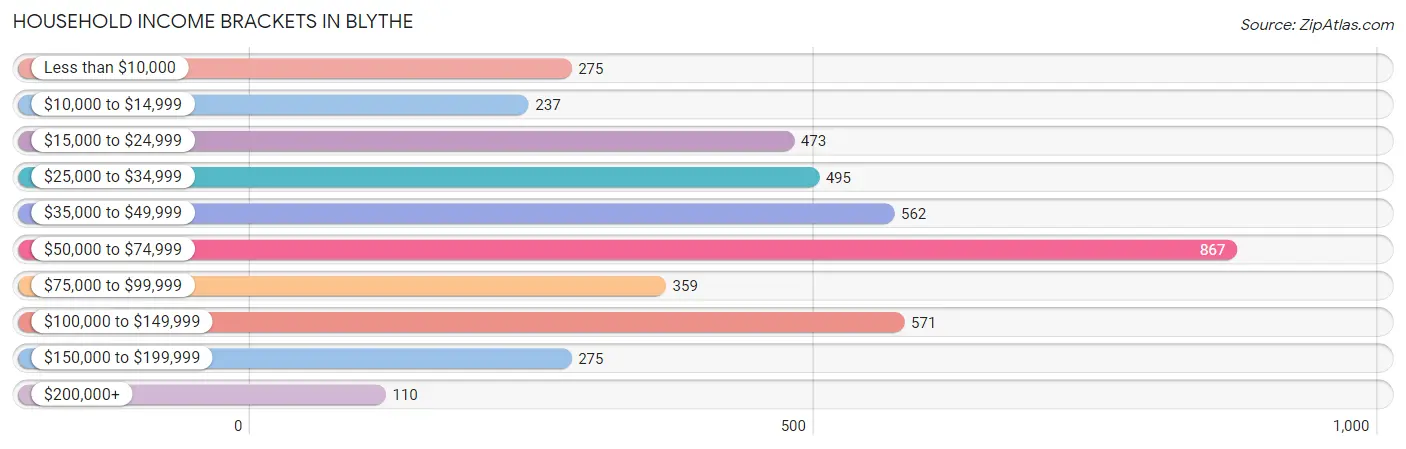
Household Income Brackets in Blythe
With 867 households falling in the category, the $50,000 to $74,999 income range is the most frequent in Blythe, accounting for 20.5% of all households. In contrast, only 110 households (2.6%) fall into the $200,000+ income bracket, making it the least populous group.
| Income Bracket | # Households | % Households |
| Less than $10,000 | 275 | 6.5% |
| $10,000 to $14,999 | 237 | 5.6% |
| $15,000 to $24,999 | 473 | 11.2% |
| $25,000 to $34,999 | 495 | 11.7% |
| $35,000 to $49,999 | 562 | 13.3% |
| $50,000 to $74,999 | 867 | 20.5% |
| $75,000 to $99,999 | 359 | 8.5% |
| $100,000 to $149,999 | 571 | 13.5% |
| $150,000 to $199,999 | 275 | 6.5% |
| $200,000+ | 110 | 2.6% |
Household Income by Householder Age in Blythe
The median household income in Blythe is $52,377, with the highest median household income of $65,893 found in the 45 to 64 years age bracket for the primary householder. A total of 1,472 households (34.8%) fall into this category. Meanwhile, the 65+ years age bracket for the primary householder has the lowest median household income of $32,067, with 964 households (22.8%) in this group.
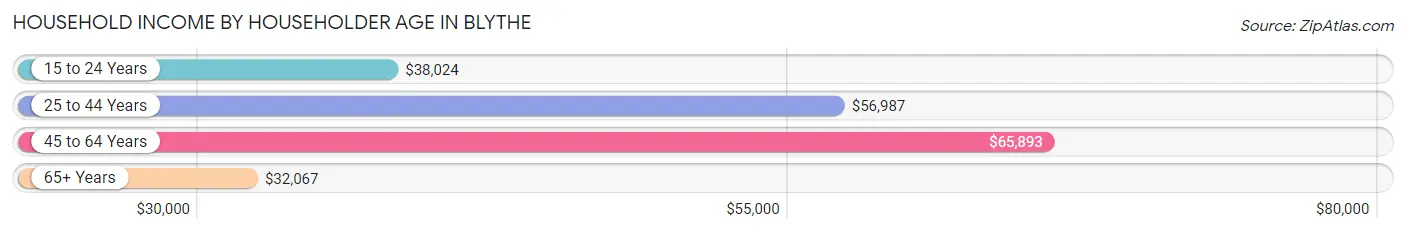
| Income Bracket | # Households | Median Income |
| 15 to 24 Years | 193 (4.6%) | $38,024 |
| 25 to 44 Years | 1,598 (37.8%) | $56,987 |
| 45 to 64 Years | 1,472 (34.8%) | $65,893 |
| 65+ Years | 964 (22.8%) | $32,067 |
| Total | 4,227 (100.0%) | $52,377 |
Poverty in Blythe
Income Below Poverty by Sex and Age in Blythe
With 20.0% poverty level for males and 25.5% for females among the residents of Blythe, under 5 year old males and 16 and 17 year old females are the most vulnerable to poverty, with 324 males (55.2%) and 84 females (66.1%) in their respective age groups living below the poverty level.
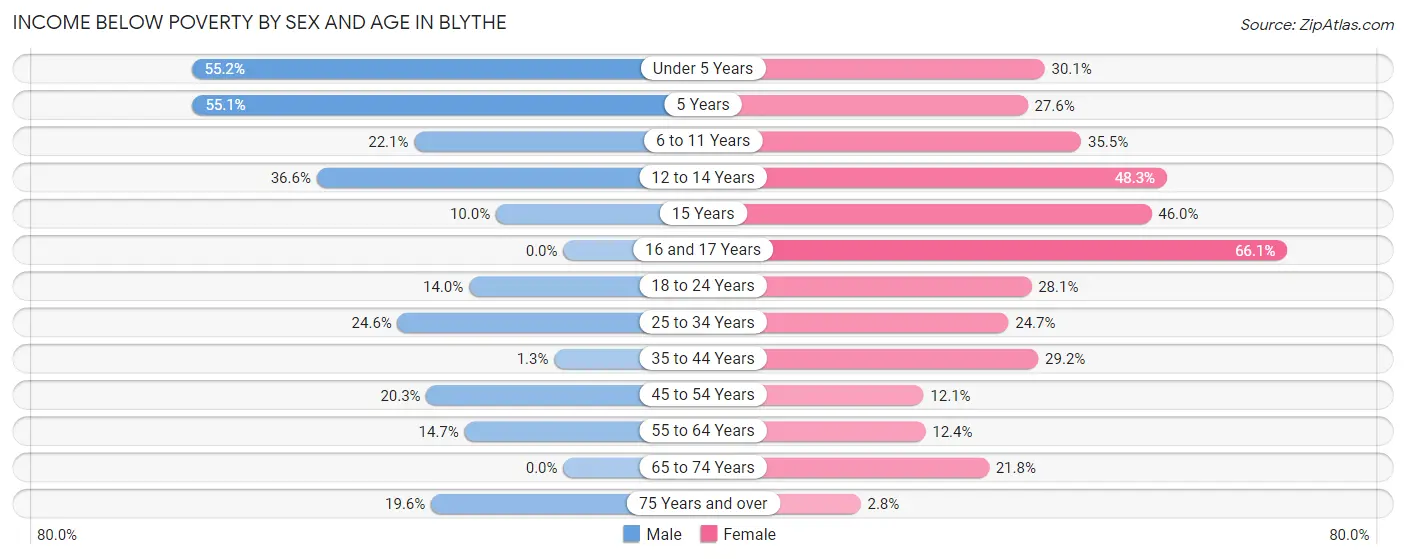
| Age Bracket | Male | Female |
| Under 5 Years | 324 (55.2%) | 140 (30.1%) |
| 5 Years | 38 (55.1%) | 51 (27.6%) |
| 6 to 11 Years | 87 (22.1%) | 221 (35.5%) |
| 12 to 14 Years | 141 (36.6%) | 140 (48.3%) |
| 15 Years | 7 (10.0%) | 91 (46.0%) |
| 16 and 17 Years | 0 (0.0%) | 84 (66.1%) |
| 18 to 24 Years | 99 (14.0%) | 128 (28.1%) |
| 25 to 34 Years | 200 (24.6%) | 217 (24.7%) |
| 35 to 44 Years | 9 (1.3%) | 214 (29.2%) |
| 45 to 54 Years | 122 (20.3%) | 75 (12.1%) |
| 55 to 64 Years | 84 (14.7%) | 79 (12.4%) |
| 65 to 74 Years | 0 (0.0%) | 122 (21.8%) |
| 75 Years and over | 76 (19.6%) | 11 (2.8%) |
| Total | 1,187 (20.0%) | 1,573 (25.5%) |
Income Above Poverty by Sex and Age in Blythe
According to the poverty statistics in Blythe, males aged 16 and 17 years and females aged 75 years and over are the age groups that are most secure financially, with 100.0% of males and 97.2% of females in these age groups living above the poverty line.
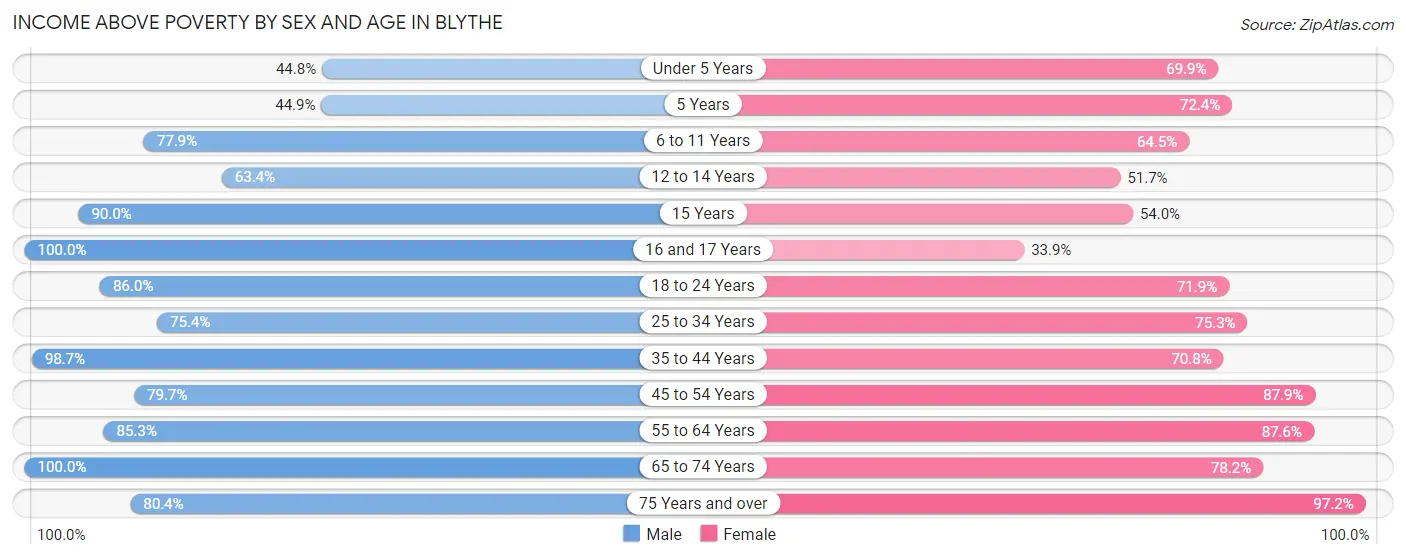
| Age Bracket | Male | Female |
| Under 5 Years | 263 (44.8%) | 325 (69.9%) |
| 5 Years | 31 (44.9%) | 134 (72.4%) |
| 6 to 11 Years | 306 (77.9%) | 401 (64.5%) |
| 12 to 14 Years | 244 (63.4%) | 150 (51.7%) |
| 15 Years | 63 (90.0%) | 107 (54.0%) |
| 16 and 17 Years | 318 (100.0%) | 43 (33.9%) |
| 18 to 24 Years | 608 (86.0%) | 327 (71.9%) |
| 25 to 34 Years | 613 (75.4%) | 661 (75.3%) |
| 35 to 44 Years | 661 (98.7%) | 520 (70.8%) |
| 45 to 54 Years | 478 (79.7%) | 544 (87.9%) |
| 55 to 64 Years | 489 (85.3%) | 558 (87.6%) |
| 65 to 74 Years | 359 (100.0%) | 437 (78.2%) |
| 75 Years and over | 311 (80.4%) | 385 (97.2%) |
| Total | 4,744 (80.0%) | 4,592 (74.5%) |
Income Below Poverty Among Married-Couple Families in Blythe
The poverty statistics for married-couple families in Blythe show that 6.5% or 118 of the total 1,815 families live below the poverty line. Families with no children have the highest poverty rate of 7.8%, comprising of 90 families. On the other hand, families with 3 or 4 children have the lowest poverty rate of 0.0%, which includes 0 families.
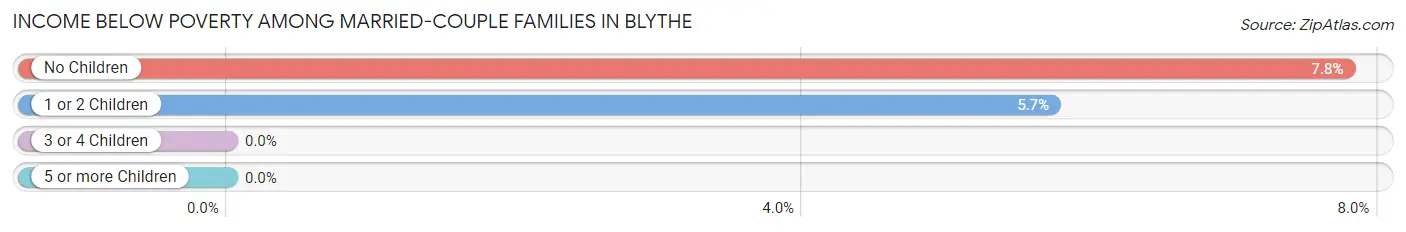
| Children | Above Poverty | Below Poverty |
| No Children | 1,067 (92.2%) | 90 (7.8%) |
| 1 or 2 Children | 461 (94.3%) | 28 (5.7%) |
| 3 or 4 Children | 142 (100.0%) | 0 (0.0%) |
| 5 or more Children | 27 (100.0%) | 0 (0.0%) |
| Total | 1,697 (93.5%) | 118 (6.5%) |
Income Below Poverty Among Single-Parent Households in Blythe
According to the poverty data in Blythe, 24.4% or 71 single-father households and 39.7% or 361 single-mother households are living below the poverty line. Among single-father households, those with 3 or 4 children have the highest poverty rate, with 63 households (45.0%) experiencing poverty. Likewise, among single-mother households, those with 5 or more children have the highest poverty rate, with 37 households (100.0%) falling below the poverty line.
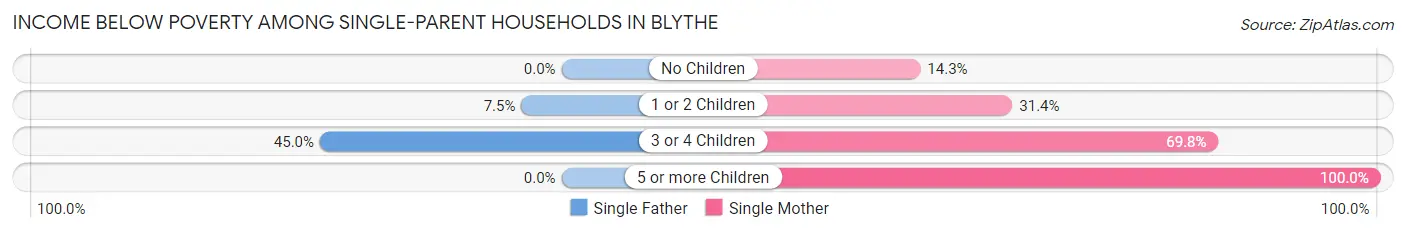
| Children | Single Father | Single Mother |
| No Children | 0 (0.0%) | 20 (14.3%) |
| 1 or 2 Children | 8 (7.5%) | 170 (31.4%) |
| 3 or 4 Children | 63 (45.0%) | 134 (69.8%) |
| 5 or more Children | 0 (0.0%) | 37 (100.0%) |
| Total | 71 (24.4%) | 361 (39.7%) |
Income Below Poverty Among Married-Couple vs Single-Parent Households in Blythe
The poverty data for Blythe shows that 118 of the married-couple family households (6.5%) and 432 of the single-parent households (36.0%) are living below the poverty level. Within the married-couple family households, those with no children have the highest poverty rate, with 90 households (7.8%) falling below the poverty line. Among the single-parent households, those with 5 or more children have the highest poverty rate, with 37 household (100.0%) living below poverty.
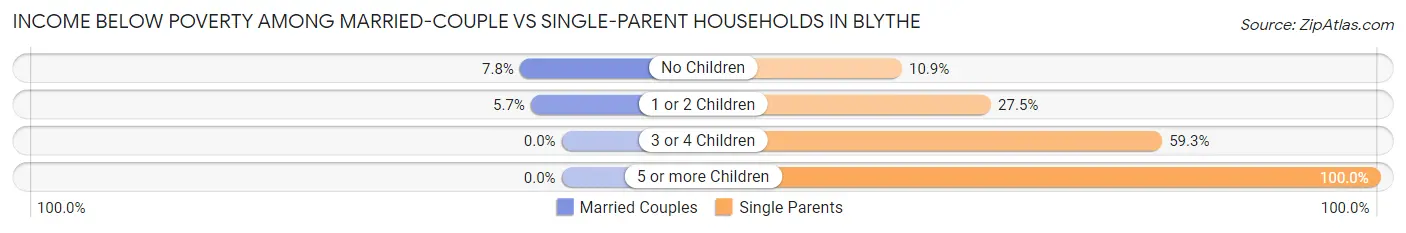
| Children | Married-Couple Families | Single-Parent Households |
| No Children | 90 (7.8%) | 20 (10.9%) |
| 1 or 2 Children | 28 (5.7%) | 178 (27.5%) |
| 3 or 4 Children | 0 (0.0%) | 197 (59.3%) |
| 5 or more Children | 0 (0.0%) | 37 (100.0%) |
| Total | 118 (6.5%) | 432 (36.0%) |
Race in Blythe
The most populous races in Blythe are Hispanic or Latino (10,554 | 58.8%), White / Caucasian (6,882 | 38.3%), and Some other Race (6,068 | 33.8%).
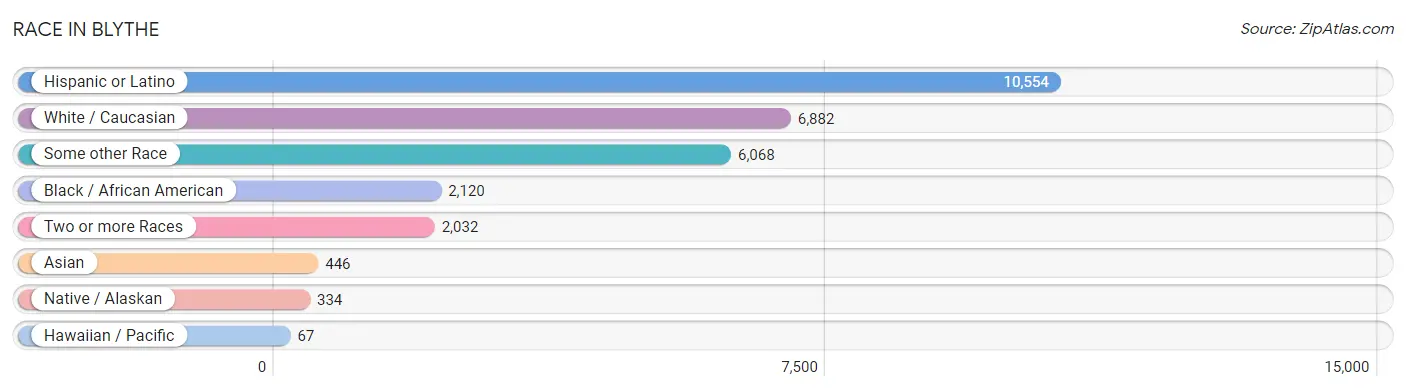
| Race | # Population | % Population |
| Asian | 446 | 2.5% |
| Black / African American | 2,120 | 11.8% |
| Hawaiian / Pacific | 67 | 0.4% |
| Hispanic or Latino | 10,554 | 58.8% |
| Native / Alaskan | 334 | 1.9% |
| White / Caucasian | 6,882 | 38.3% |
| Two or more Races | 2,032 | 11.3% |
| Some other Race | 6,068 | 33.8% |
| Total | 17,949 | 100.0% |
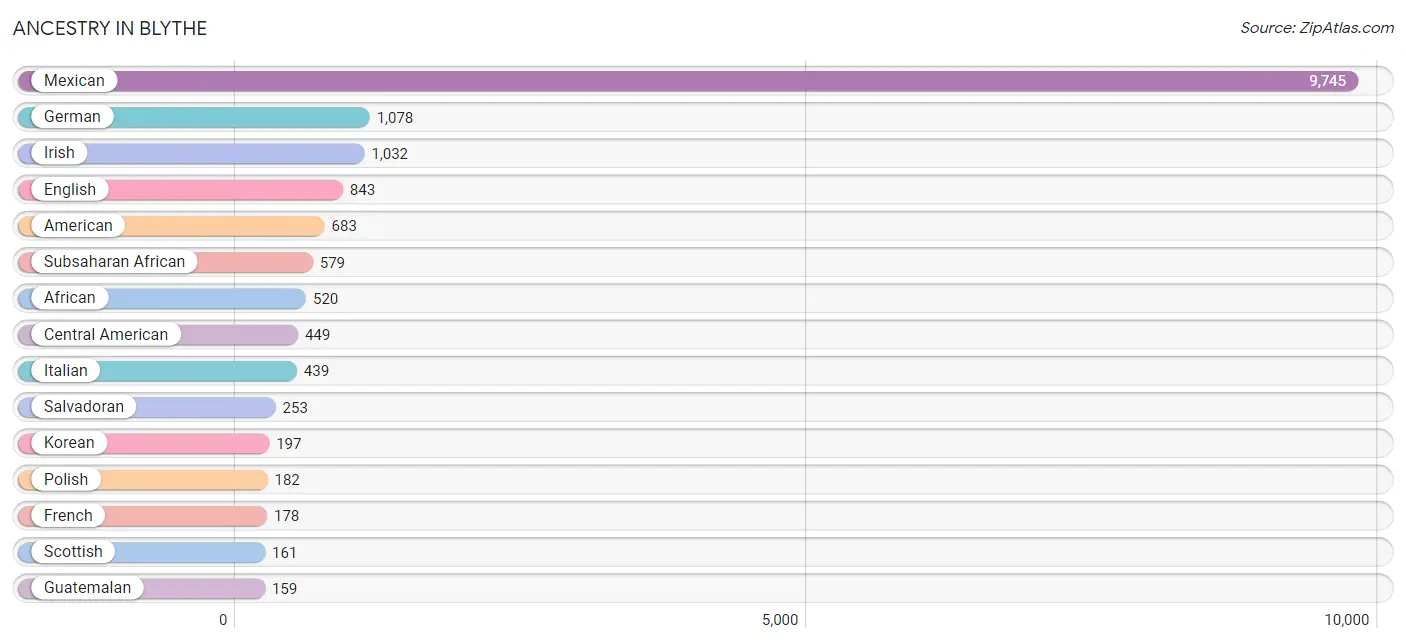
Ancestry in Blythe
The most populous ancestries reported in Blythe are Mexican (9,745 | 54.3%), German (1,078 | 6.0%), Irish (1,032 | 5.8%), English (843 | 4.7%), and American (683 | 3.8%), together accounting for 74.6% of all Blythe residents.
| Ancestry | # Population | % Population |
| African | 520 | 2.9% |
| Alaska Native | 7 | 0.0% |
| American | 683 | 3.8% |
| Apache | 5 | 0.0% |
| Arab | 32 | 0.2% |
| Argentinean | 5 | 0.0% |
| Armenian | 22 | 0.1% |
| Austrian | 74 | 0.4% |
| Basque | 42 | 0.2% |
| Belgian | 7 | 0.0% |
| Bhutanese | 18 | 0.1% |
| Blackfeet | 10 | 0.1% |
| British | 6 | 0.0% |
| Burmese | 28 | 0.2% |
| Canadian | 19 | 0.1% |
| Cape Verdean | 9 | 0.1% |
| Central American | 449 | 2.5% |
| Central American Indian | 22 | 0.1% |
| Cherokee | 141 | 0.8% |
| Chinese | 23 | 0.1% |
| Chippewa | 15 | 0.1% |
| Colombian | 16 | 0.1% |
| Comanche | 15 | 0.1% |
| Costa Rican | 6 | 0.0% |
| Cuban | 64 | 0.4% |
| Czech | 5 | 0.0% |
| Czechoslovakian | 13 | 0.1% |
| Danish | 7 | 0.0% |
| Dutch | 44 | 0.3% |
| Eastern European | 17 | 0.1% |
| Ecuadorian | 14 | 0.1% |
| English | 843 | 4.7% |
| Ethiopian | 18 | 0.1% |
| European | 97 | 0.5% |
| French | 178 | 1.0% |
| German | 1,078 | 6.0% |
| Greek | 6 | 0.0% |
| Guatemalan | 159 | 0.9% |
| Haitian | 7 | 0.0% |
| Hungarian | 18 | 0.1% |
| Indian (Asian) | 41 | 0.2% |
| Iranian | 4 | 0.0% |
| Irish | 1,032 | 5.8% |
| Iroquois | 10 | 0.1% |
| Italian | 439 | 2.5% |
| Jamaican | 48 | 0.3% |
| Japanese | 20 | 0.1% |
| Korean | 197 | 1.1% |
| Lebanese | 4 | 0.0% |
| Malaysian | 3 | 0.0% |
| Mexican | 9,745 | 54.3% |
| Mexican American Indian | 57 | 0.3% |
| Native Hawaiian | 30 | 0.2% |
| Navajo | 2 | 0.0% |
| Nicaraguan | 31 | 0.2% |
| Nigerian | 32 | 0.2% |
| Northern European | 28 | 0.2% |
| Norwegian | 130 | 0.7% |
| Pakistani | 10 | 0.1% |
| Palestinian | 5 | 0.0% |
| Peruvian | 7 | 0.0% |
| Polish | 182 | 1.0% |
| Portuguese | 27 | 0.2% |
| Potawatomi | 4 | 0.0% |
| Pueblo | 16 | 0.1% |
| Puerto Rican | 42 | 0.2% |
| Russian | 79 | 0.4% |
| Salvadoran | 253 | 1.4% |
| Samoan | 21 | 0.1% |
| Scandinavian | 4 | 0.0% |
| Scotch-Irish | 17 | 0.1% |
| Scottish | 161 | 0.9% |
| South American | 47 | 0.3% |
| Spaniard | 62 | 0.4% |
| Spanish | 18 | 0.1% |
| Sri Lankan | 18 | 0.1% |
| Subsaharan African | 579 | 3.2% |
| Swedish | 40 | 0.2% |
| Thai | 157 | 0.9% |
| Tongan | 11 | 0.1% |
| Ukrainian | 33 | 0.2% |
| Uruguayan | 5 | 0.0% |
| Welsh | 52 | 0.3% |
| Yaqui | 83 | 0.5% | View All 84 Rows |
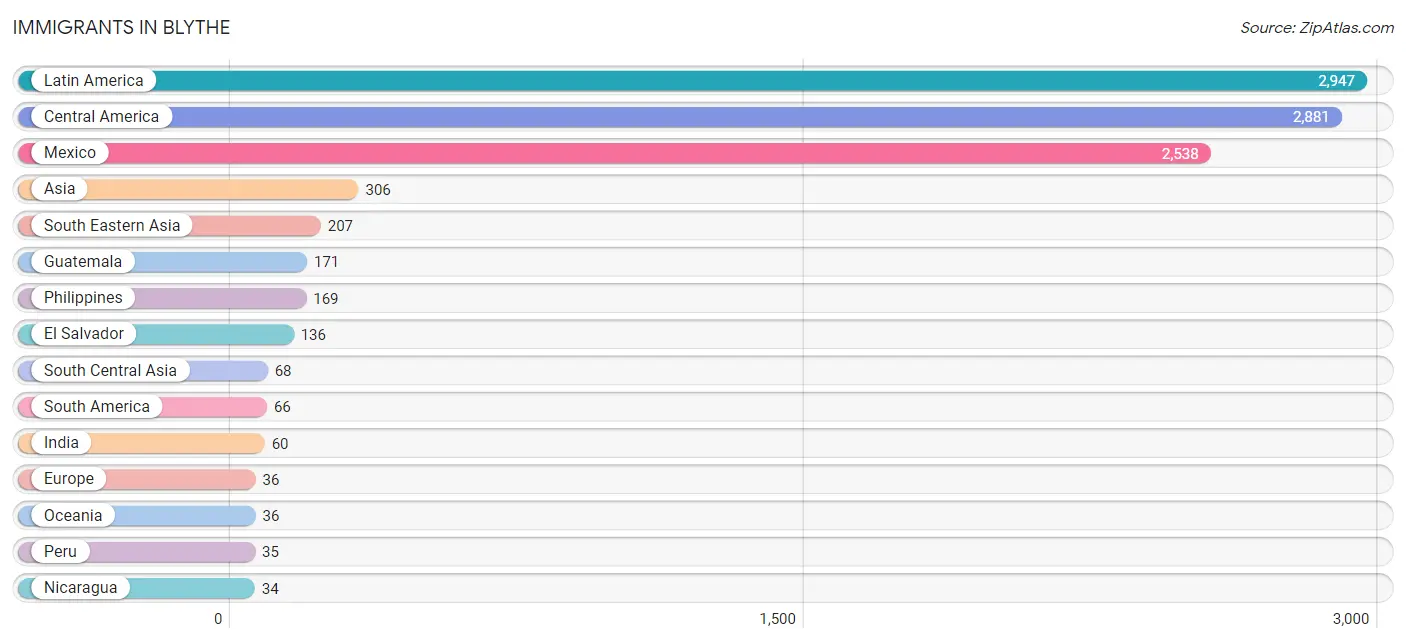
Immigrants in Blythe
The most numerous immigrant groups reported in Blythe came from Latin America (2,947 | 16.4%), Central America (2,881 | 16.1%), Mexico (2,538 | 14.1%), Asia (306 | 1.7%), and South Eastern Asia (207 | 1.1%), together accounting for 49.5% of all Blythe residents.
| Immigration Origin | # Population | % Population |
| Africa | 25 | 0.1% |
| Armenia | 10 | 0.1% |
| Asia | 306 | 1.7% |
| Cambodia | 7 | 0.0% |
| Canada | 21 | 0.1% |
| Central America | 2,881 | 16.1% |
| Colombia | 10 | 0.1% |
| Eastern Africa | 12 | 0.1% |
| Eastern Asia | 21 | 0.1% |
| Eastern Europe | 18 | 0.1% |
| Ecuador | 10 | 0.1% |
| Egypt | 5 | 0.0% |
| El Salvador | 136 | 0.8% |
| Ethiopia | 12 | 0.1% |
| Europe | 36 | 0.2% |
| France | 9 | 0.1% |
| Germany | 9 | 0.1% |
| Guatemala | 171 | 0.9% |
| Honduras | 2 | 0.0% |
| India | 60 | 0.3% |
| Iran | 8 | 0.0% |
| Korea | 21 | 0.1% |
| Laos | 3 | 0.0% |
| Latin America | 2,947 | 16.4% |
| Latvia | 9 | 0.1% |
| Mexico | 2,538 | 14.1% |
| Nicaragua | 34 | 0.2% |
| Northern Africa | 5 | 0.0% |
| Oceania | 36 | 0.2% |
| Peru | 35 | 0.2% |
| Philippines | 169 | 0.9% |
| South America | 66 | 0.4% |
| South Central Asia | 68 | 0.4% |
| South Eastern Asia | 207 | 1.1% |
| Thailand | 10 | 0.1% |
| Venezuela | 11 | 0.1% |
| Vietnam | 18 | 0.1% |
| Western Asia | 10 | 0.1% |
| Western Europe | 18 | 0.1% | View All 39 Rows |
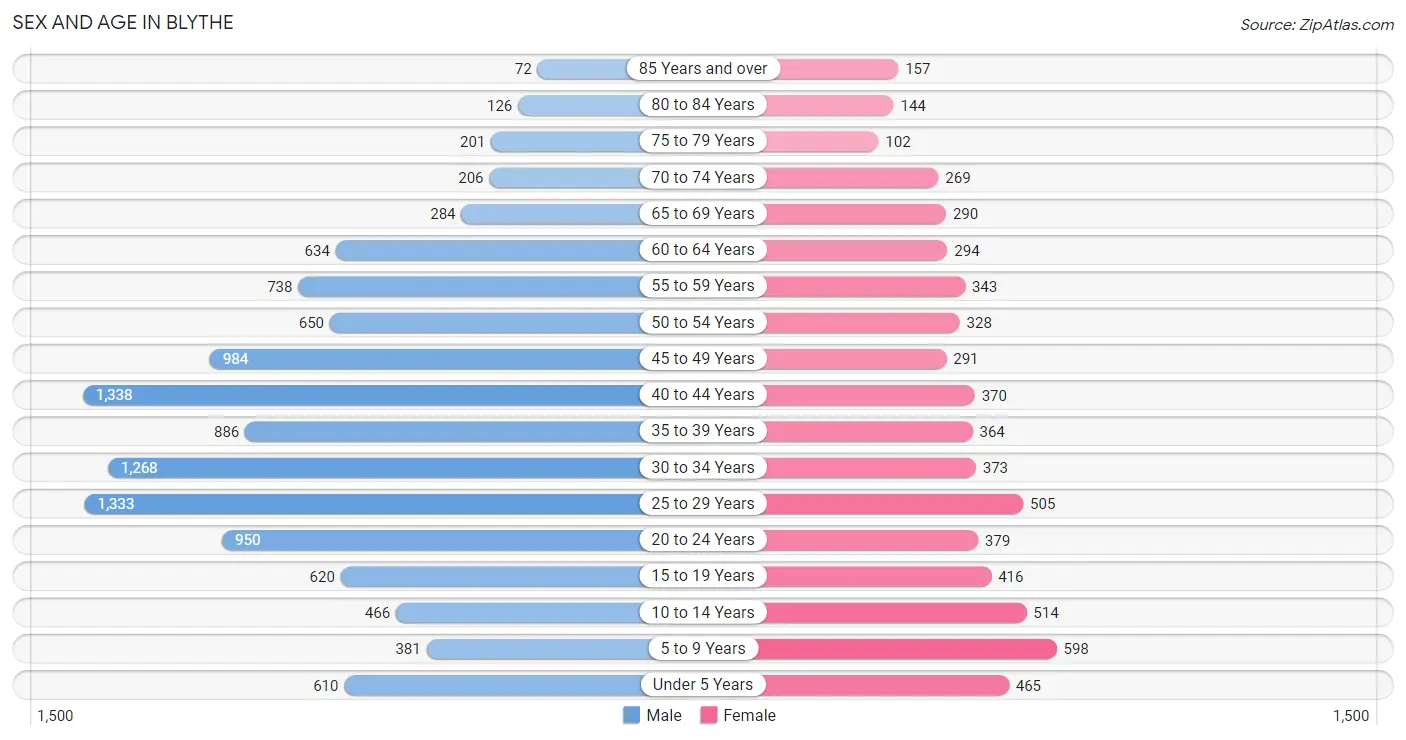
Sex and Age in Blythe
Sex and Age in Blythe
The most populous age groups in Blythe are 40 to 44 Years (1,338 | 11.4%) for men and 5 to 9 Years (598 | 9.6%) for women.
| Age Bracket | Male | Female |
| Under 5 Years | 610 (5.2%) | 465 (7.5%) |
| 5 to 9 Years | 381 (3.2%) | 598 (9.6%) |
| 10 to 14 Years | 466 (4.0%) | 514 (8.3%) |
| 15 to 19 Years | 620 (5.3%) | 416 (6.7%) |
| 20 to 24 Years | 950 (8.1%) | 379 (6.1%) |
| 25 to 29 Years | 1,333 (11.4%) | 505 (8.1%) |
| 30 to 34 Years | 1,268 (10.8%) | 373 (6.0%) |
| 35 to 39 Years | 886 (7.5%) | 364 (5.9%) |
| 40 to 44 Years | 1,338 (11.4%) | 370 (6.0%) |
| 45 to 49 Years | 984 (8.4%) | 291 (4.7%) |
| 50 to 54 Years | 650 (5.5%) | 328 (5.3%) |
| 55 to 59 Years | 738 (6.3%) | 343 (5.5%) |
| 60 to 64 Years | 634 (5.4%) | 294 (4.7%) |
| 65 to 69 Years | 284 (2.4%) | 290 (4.7%) |
| 70 to 74 Years | 206 (1.8%) | 269 (4.3%) |
| 75 to 79 Years | 201 (1.7%) | 102 (1.6%) |
| 80 to 84 Years | 126 (1.1%) | 144 (2.3%) |
| 85 Years and over | 72 (0.6%) | 157 (2.5%) |
| Total | 11,747 (100.0%) | 6,202 (100.0%) |
Families and Households in Blythe
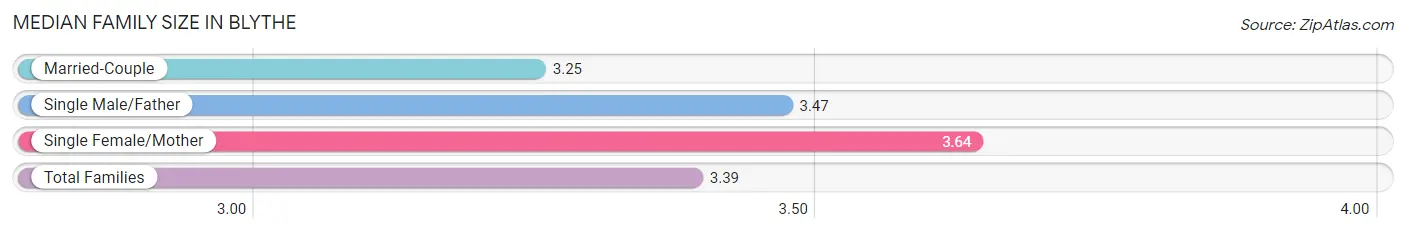
Median Family Size in Blythe
The median family size in Blythe is 3.39 persons per family, with single female/mother families (910 | 30.2%) accounting for the largest median family size of 3.64 persons per family. On the other hand, married-couple families (1,815 | 60.2%) represent the smallest median family size with 3.25 persons per family.
| Family Type | # Families | Family Size |
| Married-Couple | 1,815 (60.2%) | 3.25 |
| Single Male/Father | 291 (9.7%) | 3.47 |
| Single Female/Mother | 910 (30.2%) | 3.64 |
| Total Families | 3,016 (100.0%) | 3.39 |
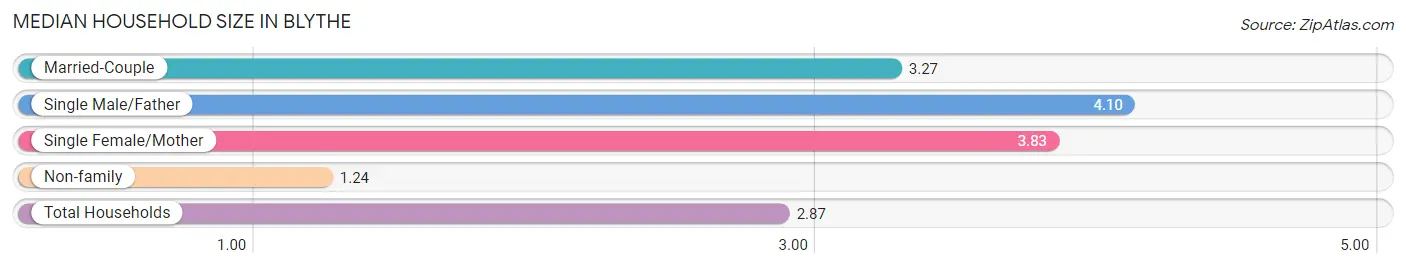
Median Household Size in Blythe
The median household size in Blythe is 2.87 persons per household, with single male/father households (291 | 6.9%) accounting for the largest median household size of 4.1 persons per household. non-family households (1,211 | 28.6%) represent the smallest median household size with 1.24 persons per household.
| Household Type | # Households | Household Size |
| Married-Couple | 1,815 (42.9%) | 3.27 |
| Single Male/Father | 291 (6.9%) | 4.10 |
| Single Female/Mother | 910 (21.5%) | 3.83 |
| Non-family | 1,211 (28.6%) | 1.24 |
| Total Households | 4,227 (100.0%) | 2.87 |
Household Size by Marriage Status in Blythe
Out of a total of 4,227 households in Blythe, 3,016 (71.4%) are family households, while 1,211 (28.6%) are nonfamily households. The most numerous type of family households are 2-person households, comprising 1,019, and the most common type of nonfamily households are 1-person households, comprising 943.
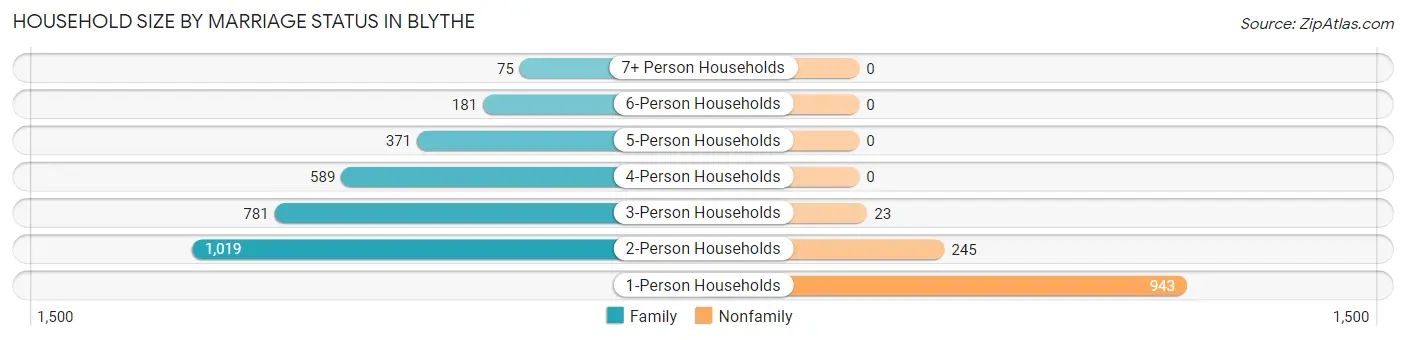
| Household Size | Family Households | Nonfamily Households |
| 1-Person Households | - | 943 (22.3%) |
| 2-Person Households | 1,019 (24.1%) | 245 (5.8%) |
| 3-Person Households | 781 (18.5%) | 23 (0.5%) |
| 4-Person Households | 589 (13.9%) | 0 (0.0%) |
| 5-Person Households | 371 (8.8%) | 0 (0.0%) |
| 6-Person Households | 181 (4.3%) | 0 (0.0%) |
| 7+ Person Households | 75 (1.8%) | 0 (0.0%) |
| Total | 3,016 (71.4%) | 1,211 (28.6%) |
Female Fertility in Blythe
Fertility by Age in Blythe
Average fertility rate in Blythe is 72.0 births per 1,000 women. Women in the age bracket of 20 to 34 years have the highest fertility rate with 126.0 births per 1,000 women. Women in the age bracket of 20 to 34 years acount for 78.7% of all women with births.
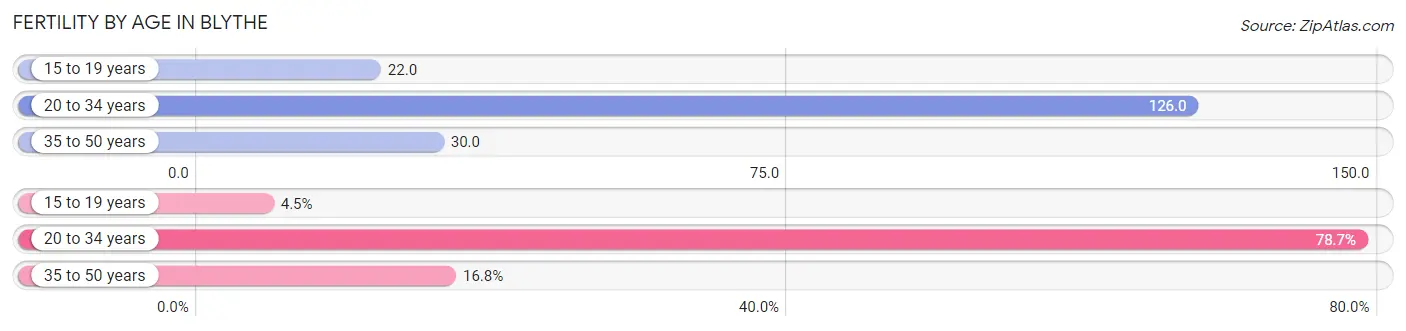
| Age Bracket | Women with Births | Births / 1,000 Women |
| 15 to 19 years | 9 (4.5%) | 22.0 |
| 20 to 34 years | 159 (78.7%) | 126.0 |
| 35 to 50 years | 34 (16.8%) | 30.0 |
| Total | 202 (100.0%) | 72.0 |
Fertility by Age by Marriage Status in Blythe
33.7% of women with births (202) in Blythe are married. The highest percentage of unmarried women with births falls into 15 to 19 years age bracket with 100.0% of them unmarried at the time of birth, while the lowest percentage of unmarried women with births belong to 35 to 50 years age bracket with 20.6% of them unmarried.
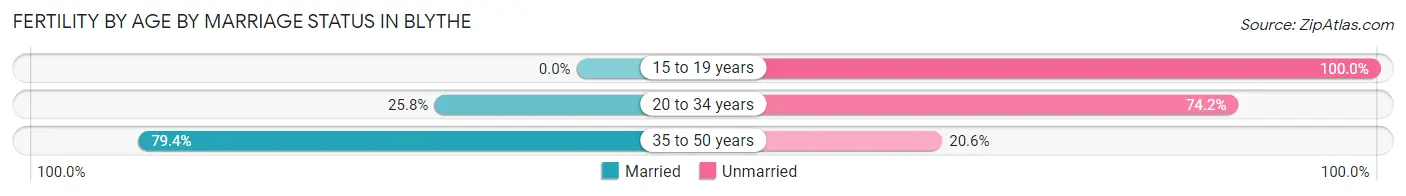
| Age Bracket | Married | Unmarried |
| 15 to 19 years | 0 (0.0%) | 9 (100.0%) |
| 20 to 34 years | 41 (25.8%) | 118 (74.2%) |
| 35 to 50 years | 27 (79.4%) | 7 (20.6%) |
| Total | 68 (33.7%) | 134 (66.3%) |
Fertility by Education in Blythe
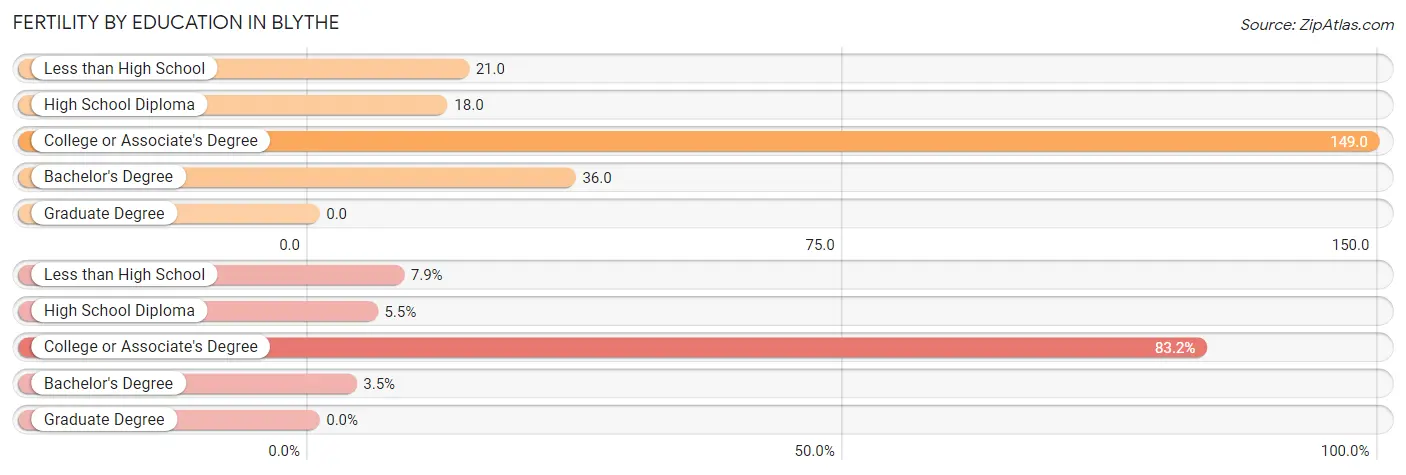
| Educational Attainment | Women with Births | Births / 1,000 Women |
| Less than High School | 16 (7.9%) | 21.0 |
| High School Diploma | 11 (5.4%) | 18.0 |
| College or Associate's Degree | 168 (83.2%) | 149.0 |
| Bachelor's Degree | 7 (3.5%) | 36.0 |
| Graduate Degree | 0 (0.0%) | 0.0 |
| Total | 202 (100.0%) | 72.0 |
Fertility by Education by Marriage Status in Blythe
66.3% of women with births in Blythe are unmarried. Women with the educational attainment of less than high school are most likely to be married with 100.0% of them married at childbirth, while women with the educational attainment of high school diploma are least likely to be married with 100.0% of them unmarried at childbirth.
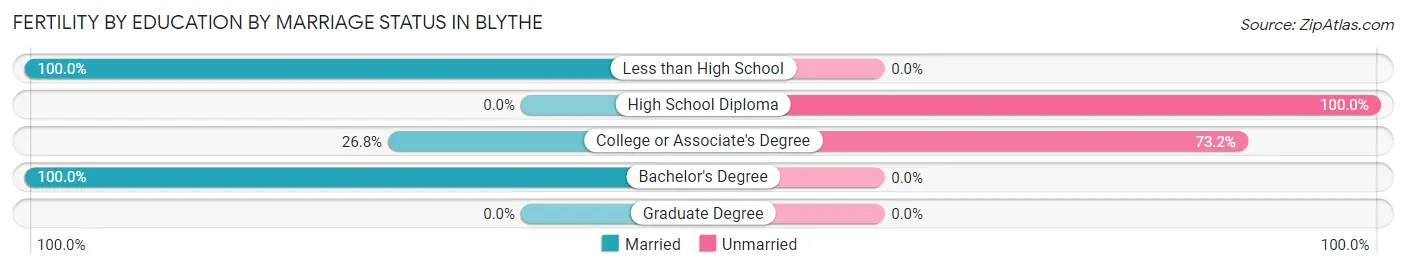
| Educational Attainment | Married | Unmarried |
| Less than High School | 16 (100.0%) | 0 (0.0%) |
| High School Diploma | 0 (0.0%) | 11 (100.0%) |
| College or Associate's Degree | 45 (26.8%) | 123 (73.2%) |
| Bachelor's Degree | 7 (100.0%) | 0 (0.0%) |
| Graduate Degree | 0 (0.0%) | 0 (0.0%) |
| Total | 68 (33.7%) | 134 (66.3%) |
Employment Characteristics in Blythe
Employment by Class of Employer in Blythe
Among the 4,444 employed individuals in Blythe, private company employees (2,488 | 56.0%), state government employees (834 | 18.8%), and local government employees (393 | 8.8%) make up the most common classes of employment.
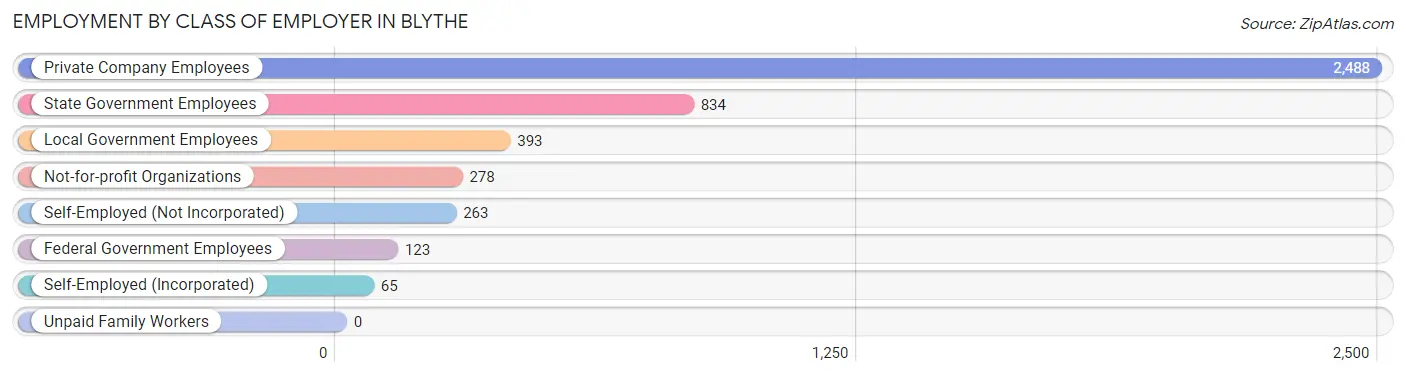
| Employer Class | # Employees | % Employees |
| Private Company Employees | 2,488 | 56.0% |
| Self-Employed (Incorporated) | 65 | 1.5% |
| Self-Employed (Not Incorporated) | 263 | 5.9% |
| Not-for-profit Organizations | 278 | 6.3% |
| Local Government Employees | 393 | 8.8% |
| State Government Employees | 834 | 18.8% |
| Federal Government Employees | 123 | 2.8% |
| Unpaid Family Workers | 0 | 0.0% |
| Total | 4,444 | 100.0% |
Employment Status by Age in Blythe
According to the labor force statistics for Blythe, out of the total population over 16 years of age (14,647), 33.6% or 4,921 individuals are in the labor force, with 7.9% or 389 of them unemployed. The age group with the highest labor force participation rate is 20 to 24 years, with 45.1% or 599 individuals in the labor force. Within the labor force, the 16 to 19 years age range has the highest percentage of unemployed individuals, with 18.3% or 33 of them being unemployed.
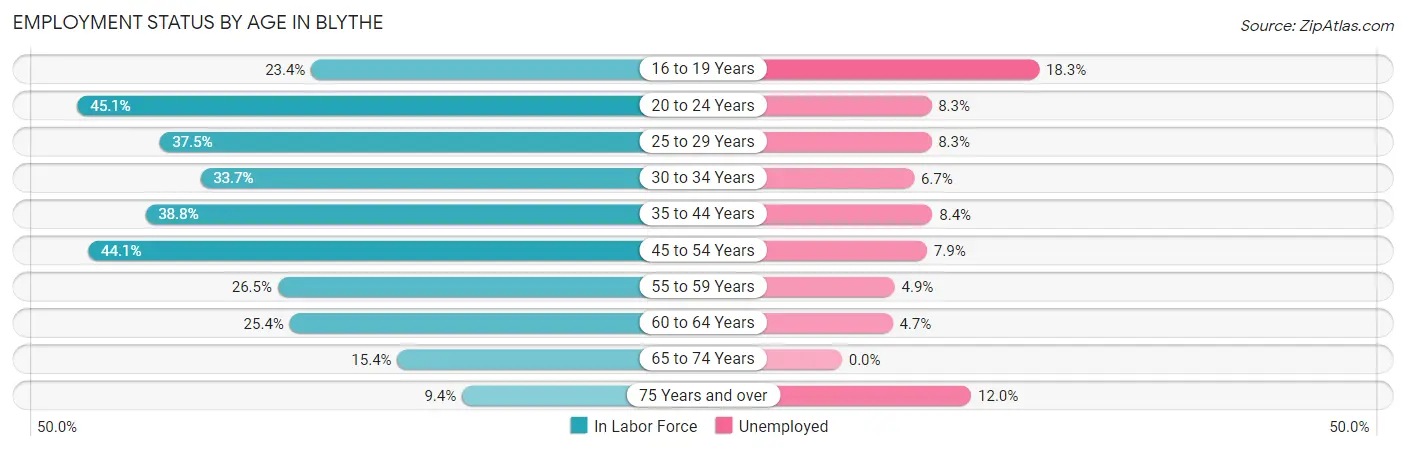
| Age Bracket | In Labor Force | Unemployed |
| 16 to 19 Years | 180 (23.4%) | 33 (18.3%) |
| 20 to 24 Years | 599 (45.1%) | 50 (8.3%) |
| 25 to 29 Years | 689 (37.5%) | 57 (8.3%) |
| 30 to 34 Years | 553 (33.7%) | 37 (6.7%) |
| 35 to 44 Years | 1,148 (38.8%) | 96 (8.4%) |
| 45 to 54 Years | 994 (44.1%) | 79 (7.9%) |
| 55 to 59 Years | 286 (26.5%) | 14 (4.9%) |
| 60 to 64 Years | 236 (25.4%) | 11 (4.7%) |
| 65 to 74 Years | 162 (15.4%) | 0 (0.0%) |
| 75 Years and over | 75 (9.4%) | 9 (12.0%) |
| Total | 4,921 (33.6%) | 389 (7.9%) |
Employment Status by Educational Attainment in Blythe
According to labor force statistics for Blythe, 36.5% of individuals (3,905) out of the total population between 25 and 64 years of age (10,699) are in the labor force, with 7.5% or 293 of them being unemployed. The group with the highest labor force participation rate are those with the educational attainment of bachelor's degree or higher, with 58.5% or 498 individuals in the labor force. Within the labor force, individuals with less than high school education have the highest percentage of unemployment, with 16.6% or 152 of them being unemployed.
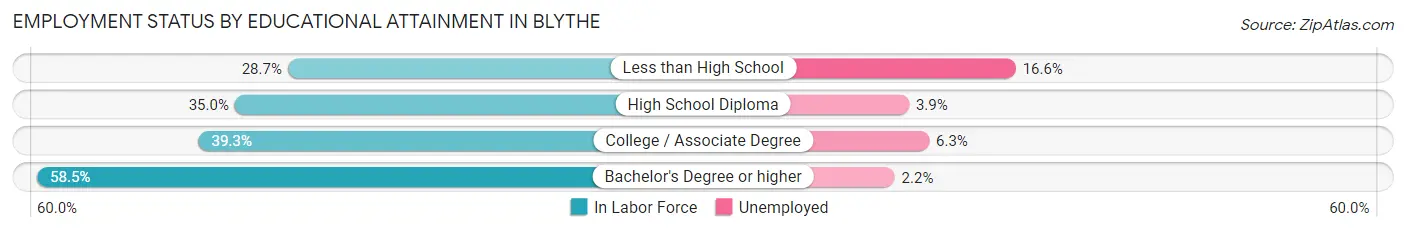
| Educational Attainment | In Labor Force | Unemployed |
| Less than High School | 914 (28.7%) | 529 (16.6%) |
| High School Diploma | 1,010 (35.0%) | 113 (3.9%) |
| College / Associate Degree | 1,484 (39.3%) | 238 (6.3%) |
| Bachelor's Degree or higher | 498 (58.5%) | 19 (2.2%) |
| Total | 3,905 (36.5%) | 802 (7.5%) |
Employment Occupations by Sex in Blythe
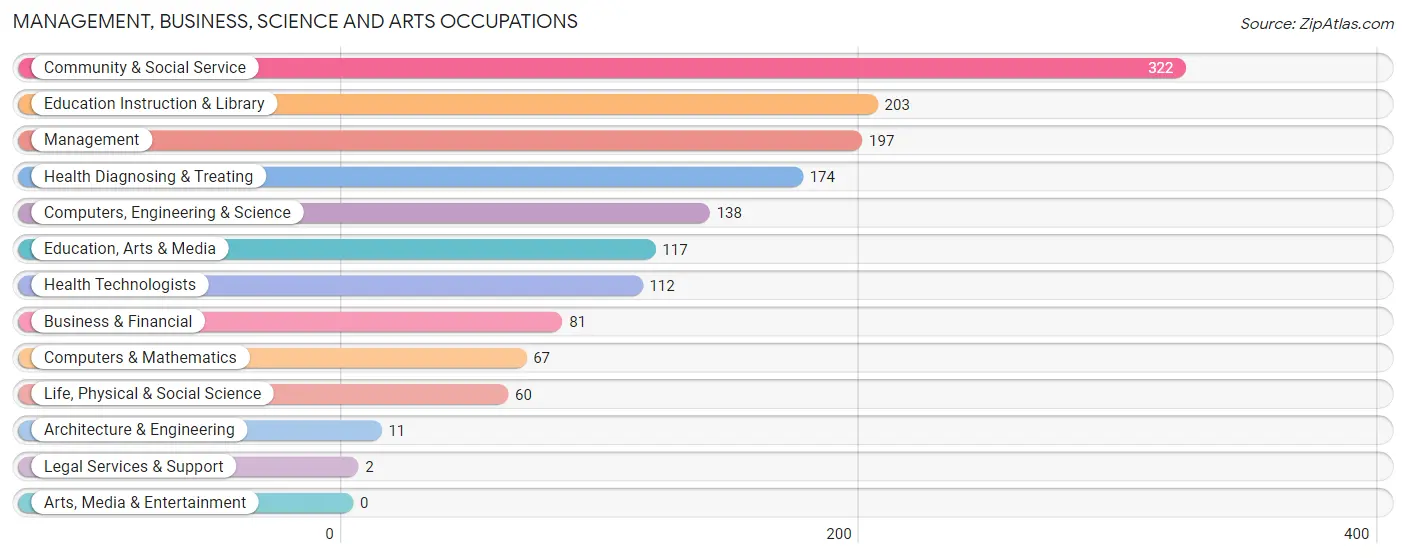
Management, Business, Science and Arts Occupations
The most common Management, Business, Science and Arts occupations in Blythe are Community & Social Service (322 | 7.1%), Education Instruction & Library (203 | 4.5%), Management (197 | 4.3%), Health Diagnosing & Treating (174 | 3.8%), and Computers, Engineering & Science (138 | 3.0%).
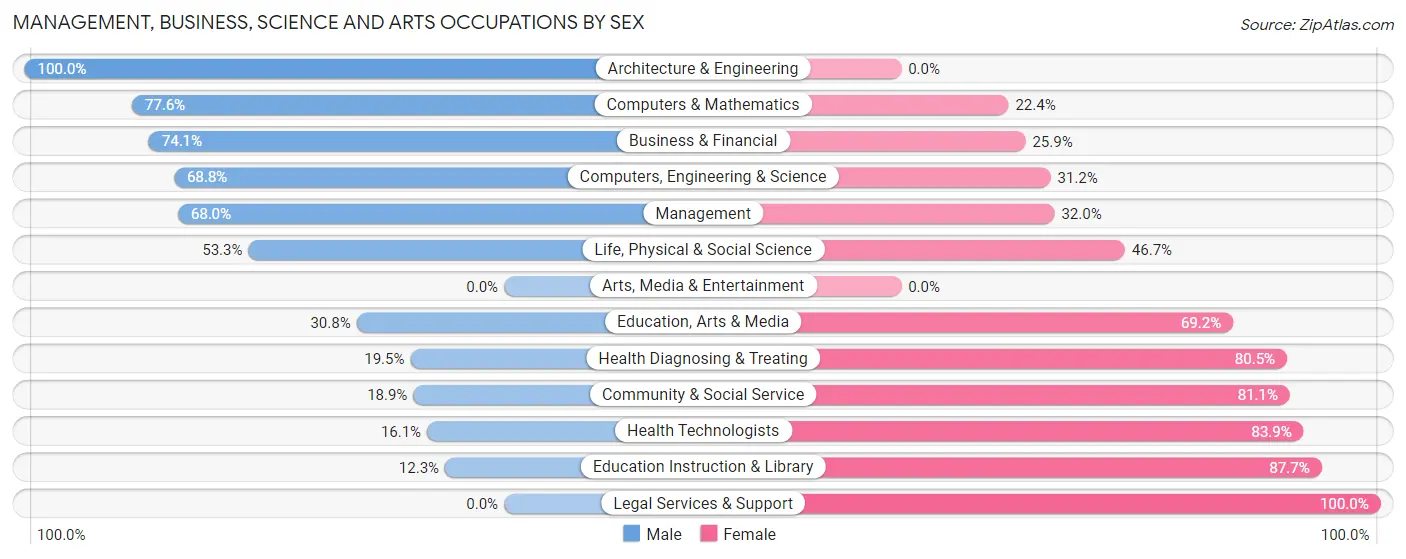
Management, Business, Science and Arts Occupations by Sex
Within the Management, Business, Science and Arts occupations in Blythe, the most male-oriented occupations are Architecture & Engineering (100.0%), Computers & Mathematics (77.6%), and Business & Financial (74.1%), while the most female-oriented occupations are Legal Services & Support (100.0%), Education Instruction & Library (87.7%), and Health Technologists (83.9%).
| Occupation | Male | Female |
| Management | 134 (68.0%) | 63 (32.0%) |
| Business & Financial | 60 (74.1%) | 21 (25.9%) |
| Computers, Engineering & Science | 95 (68.8%) | 43 (31.2%) |
| Computers & Mathematics | 52 (77.6%) | 15 (22.4%) |
| Architecture & Engineering | 11 (100.0%) | 0 (0.0%) |
| Life, Physical & Social Science | 32 (53.3%) | 28 (46.7%) |
| Community & Social Service | 61 (18.9%) | 261 (81.1%) |
| Education, Arts & Media | 36 (30.8%) | 81 (69.2%) |
| Legal Services & Support | 0 (0.0%) | 2 (100.0%) |
| Education Instruction & Library | 25 (12.3%) | 178 (87.7%) |
| Arts, Media & Entertainment | 0 (0.0%) | 0 (0.0%) |
| Health Diagnosing & Treating | 34 (19.5%) | 140 (80.5%) |
| Health Technologists | 18 (16.1%) | 94 (83.9%) |
| Total (Category) | 384 (42.1%) | 528 (57.9%) |
| Total (Overall) | 2,369 (52.2%) | 2,168 (47.8%) |
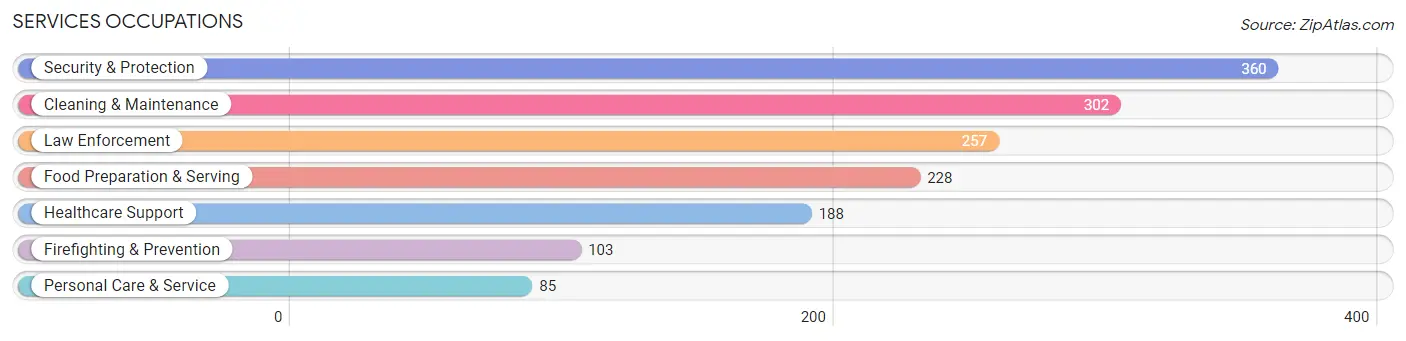
Services Occupations
The most common Services occupations in Blythe are Security & Protection (360 | 7.9%), Cleaning & Maintenance (302 | 6.7%), Law Enforcement (257 | 5.7%), Food Preparation & Serving (228 | 5.0%), and Healthcare Support (188 | 4.1%).
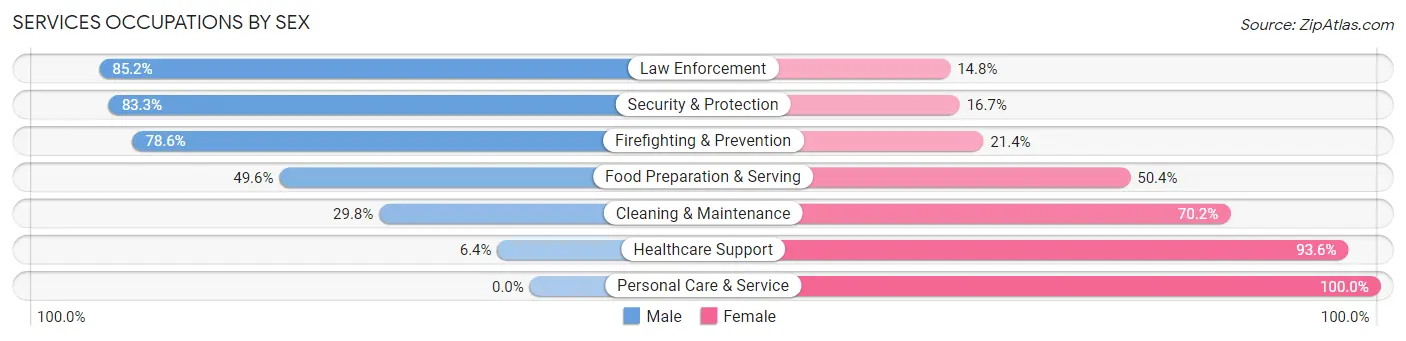
Services Occupations by Sex
Within the Services occupations in Blythe, the most male-oriented occupations are Law Enforcement (85.2%), Security & Protection (83.3%), and Firefighting & Prevention (78.6%), while the most female-oriented occupations are Personal Care & Service (100.0%), Healthcare Support (93.6%), and Cleaning & Maintenance (70.2%).
| Occupation | Male | Female |
| Healthcare Support | 12 (6.4%) | 176 (93.6%) |
| Security & Protection | 300 (83.3%) | 60 (16.7%) |
| Firefighting & Prevention | 81 (78.6%) | 22 (21.4%) |
| Law Enforcement | 219 (85.2%) | 38 (14.8%) |
| Food Preparation & Serving | 113 (49.6%) | 115 (50.4%) |
| Cleaning & Maintenance | 90 (29.8%) | 212 (70.2%) |
| Personal Care & Service | 0 (0.0%) | 85 (100.0%) |
| Total (Category) | 515 (44.3%) | 648 (55.7%) |
| Total (Overall) | 2,369 (52.2%) | 2,168 (47.8%) |
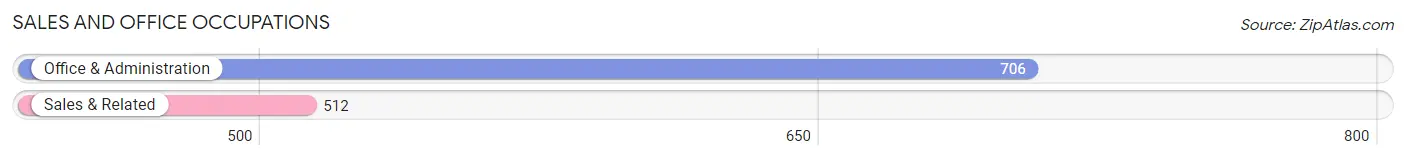
Sales and Office Occupations
The most common Sales and Office occupations in Blythe are Office & Administration (706 | 15.6%), and Sales & Related (512 | 11.3%).
Sales and Office Occupations by Sex
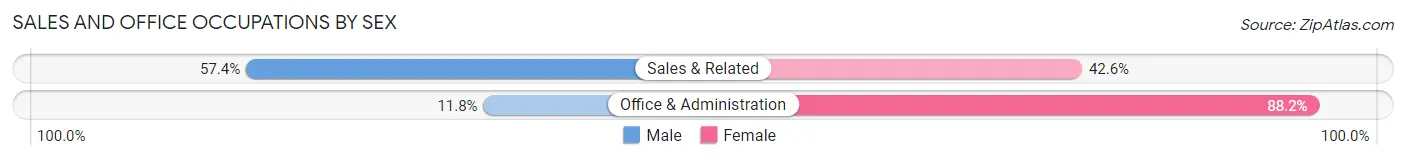
| Occupation | Male | Female |
| Sales & Related | 294 (57.4%) | 218 (42.6%) |
| Office & Administration | 83 (11.8%) | 623 (88.2%) |
| Total (Category) | 377 (30.9%) | 841 (69.1%) |
| Total (Overall) | 2,369 (52.2%) | 2,168 (47.8%) |
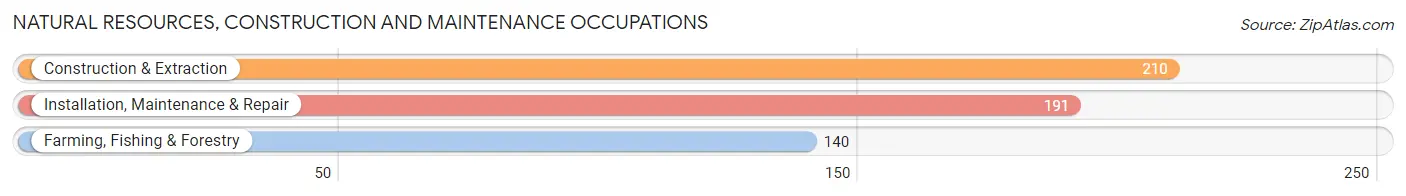
Natural Resources, Construction and Maintenance Occupations
The most common Natural Resources, Construction and Maintenance occupations in Blythe are Construction & Extraction (210 | 4.6%), Installation, Maintenance & Repair (191 | 4.2%), and Farming, Fishing & Forestry (140 | 3.1%).
Natural Resources, Construction and Maintenance Occupations by Sex
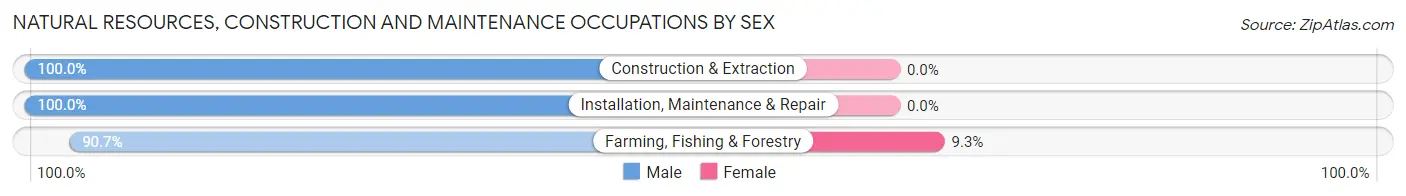
| Occupation | Male | Female |
| Farming, Fishing & Forestry | 127 (90.7%) | 13 (9.3%) |
| Construction & Extraction | 210 (100.0%) | 0 (0.0%) |
| Installation, Maintenance & Repair | 191 (100.0%) | 0 (0.0%) |
| Total (Category) | 528 (97.6%) | 13 (2.4%) |
| Total (Overall) | 2,369 (52.2%) | 2,168 (47.8%) |
Production, Transportation and Moving Occupations
The most common Production, Transportation and Moving occupations in Blythe are Transportation (263 | 5.8%), Production (230 | 5.1%), and Material Moving (210 | 4.6%).
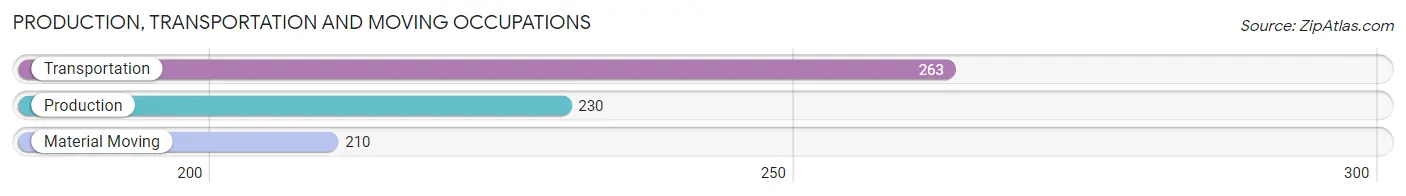
Production, Transportation and Moving Occupations by Sex
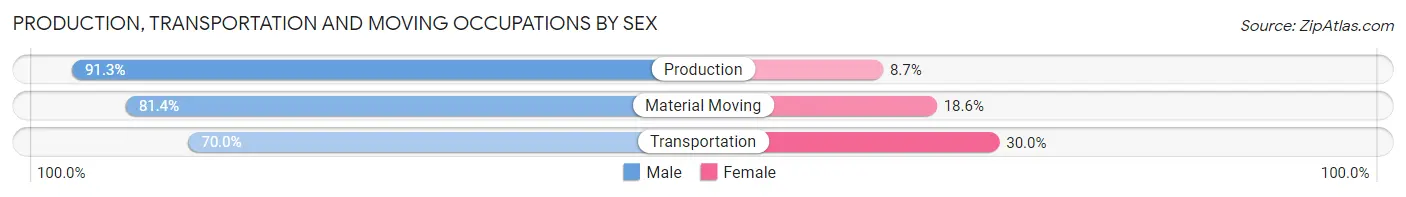
| Occupation | Male | Female |
| Production | 210 (91.3%) | 20 (8.7%) |
| Transportation | 184 (70.0%) | 79 (30.0%) |
| Material Moving | 171 (81.4%) | 39 (18.6%) |
| Total (Category) | 565 (80.4%) | 138 (19.6%) |
| Total (Overall) | 2,369 (52.2%) | 2,168 (47.8%) |
Employment Industries by Sex in Blythe
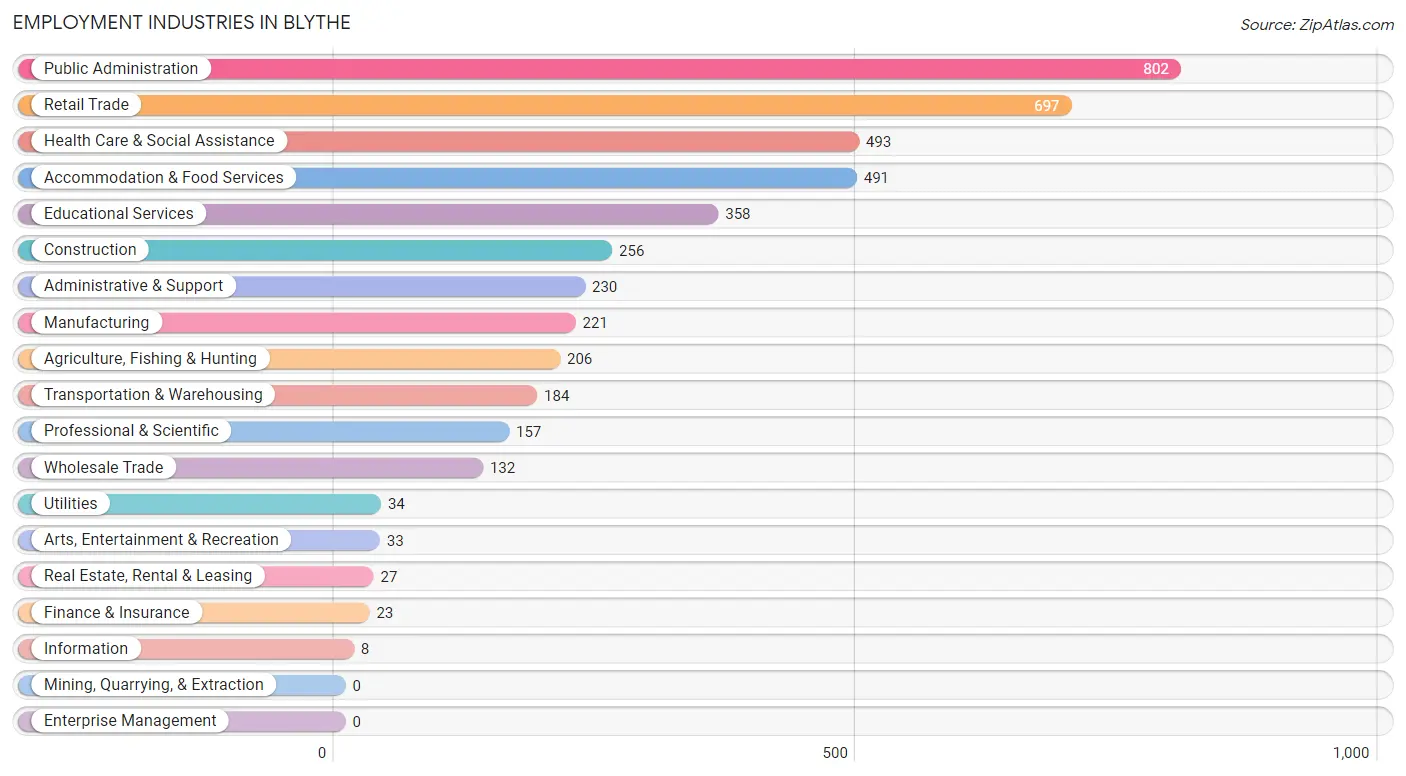
Employment Industries in Blythe
The major employment industries in Blythe include Public Administration (802 | 17.7%), Retail Trade (697 | 15.4%), Health Care & Social Assistance (493 | 10.9%), Accommodation & Food Services (491 | 10.8%), and Educational Services (358 | 7.9%).
Employment Industries by Sex in Blythe
The Blythe industries that see more men than women are Information (100.0%), Construction (95.7%), and Wholesale Trade (90.1%), whereas the industries that tend to have a higher number of women are Educational Services (95.3%), Finance & Insurance (82.6%), and Health Care & Social Assistance (80.5%).
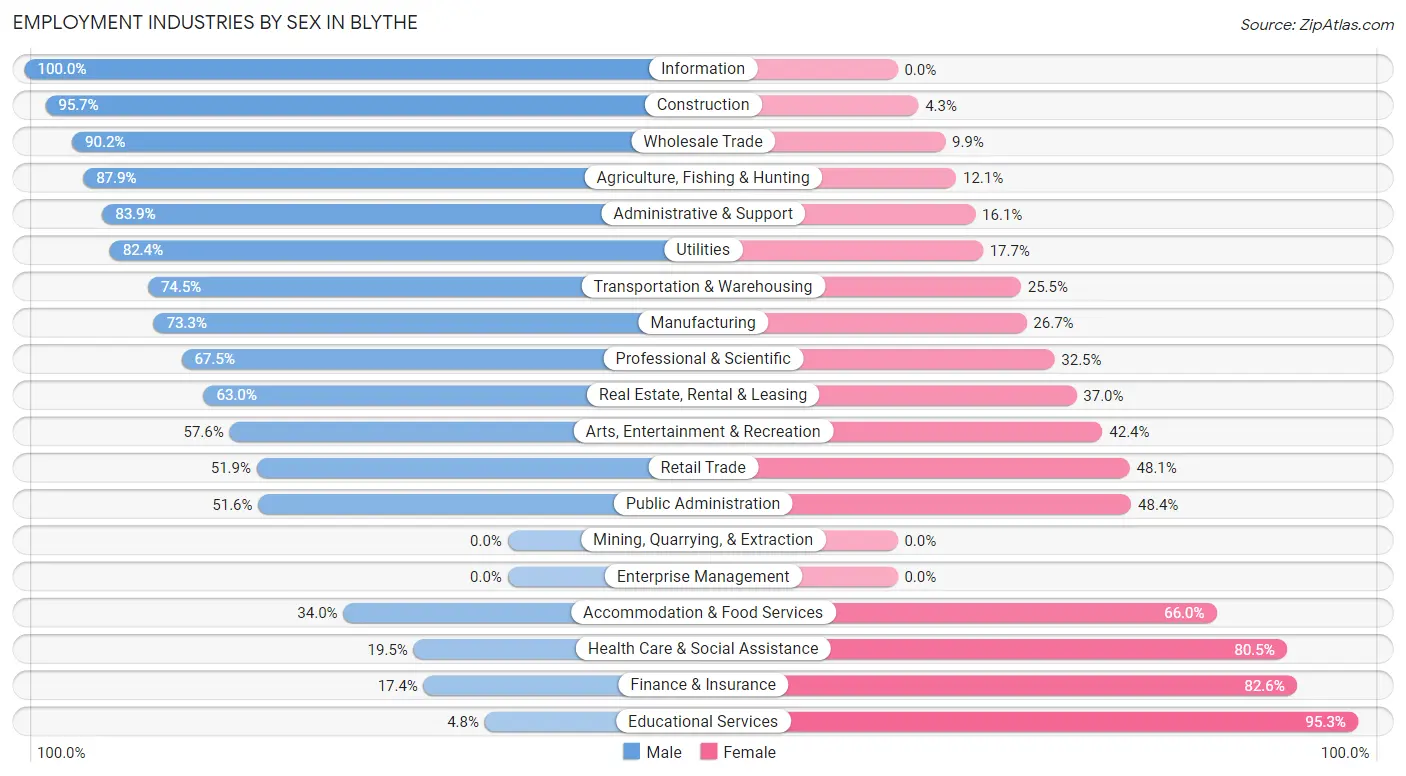
| Industry | Male | Female |
| Agriculture, Fishing & Hunting | 181 (87.9%) | 25 (12.1%) |
| Mining, Quarrying, & Extraction | 0 (0.0%) | 0 (0.0%) |
| Construction | 245 (95.7%) | 11 (4.3%) |
| Manufacturing | 162 (73.3%) | 59 (26.7%) |
| Wholesale Trade | 119 (90.1%) | 13 (9.9%) |
| Retail Trade | 362 (51.9%) | 335 (48.1%) |
| Transportation & Warehousing | 137 (74.5%) | 47 (25.5%) |
| Utilities | 28 (82.4%) | 6 (17.6%) |
| Information | 8 (100.0%) | 0 (0.0%) |
| Finance & Insurance | 4 (17.4%) | 19 (82.6%) |
| Real Estate, Rental & Leasing | 17 (63.0%) | 10 (37.0%) |
| Professional & Scientific | 106 (67.5%) | 51 (32.5%) |
| Enterprise Management | 0 (0.0%) | 0 (0.0%) |
| Administrative & Support | 193 (83.9%) | 37 (16.1%) |
| Educational Services | 17 (4.8%) | 341 (95.3%) |
| Health Care & Social Assistance | 96 (19.5%) | 397 (80.5%) |
| Arts, Entertainment & Recreation | 19 (57.6%) | 14 (42.4%) |
| Accommodation & Food Services | 167 (34.0%) | 324 (66.0%) |
| Public Administration | 414 (51.6%) | 388 (48.4%) |
| Total | 2,369 (52.2%) | 2,168 (47.8%) |
Education in Blythe
School Enrollment in Blythe
The most common levels of schooling among the 5,267 students in Blythe are college / undergraduate (1,732 | 32.9%), high school (1,250 | 23.7%), and middle school (862 | 16.4%).
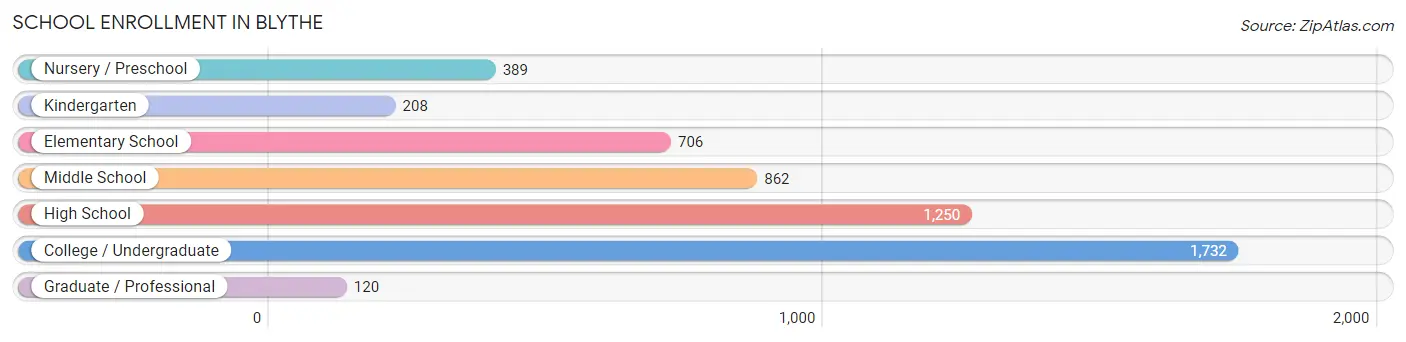
| School Level | # Students | % Students |
| Nursery / Preschool | 389 | 7.4% |
| Kindergarten | 208 | 4.0% |
| Elementary School | 706 | 13.4% |
| Middle School | 862 | 16.4% |
| High School | 1,250 | 23.7% |
| College / Undergraduate | 1,732 | 32.9% |
| Graduate / Professional | 120 | 2.3% |
| Total | 5,267 | 100.0% |
School Enrollment by Age by Funding Source in Blythe
Out of a total of 5,267 students who are enrolled in schools in Blythe, 411 (7.8%) attend a private institution, while the remaining 4,856 (92.2%) are enrolled in public schools. The age group of 25 to 34 year olds has the highest likelihood of being enrolled in private schools, with 148 (18.1% in the age bracket) enrolled. Conversely, the age group of 10 to 14 year olds has the lowest likelihood of being enrolled in a private school, with 979 (99.9% in the age bracket) attending a public institution.
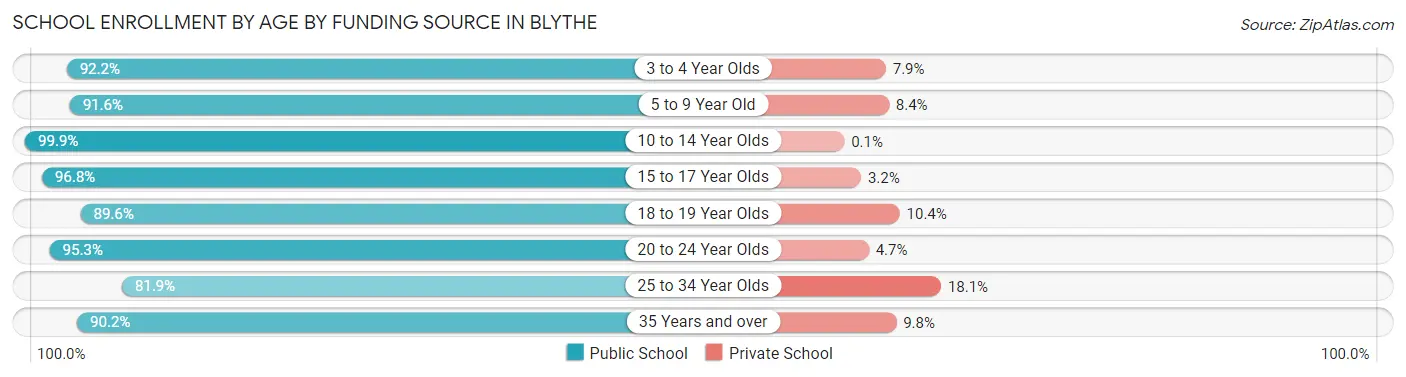
| Age Bracket | Public School | Private School |
| 3 to 4 Year Olds | 270 (92.1%) | 23 (7.9%) |
| 5 to 9 Year Old | 849 (91.6%) | 78 (8.4%) |
| 10 to 14 Year Olds | 979 (99.9%) | 1 (0.1%) |
| 15 to 17 Year Olds | 690 (96.8%) | 23 (3.2%) |
| 18 to 19 Year Olds | 129 (89.6%) | 15 (10.4%) |
| 20 to 24 Year Olds | 286 (95.3%) | 14 (4.7%) |
| 25 to 34 Year Olds | 669 (81.9%) | 148 (18.1%) |
| 35 Years and over | 986 (90.2%) | 107 (9.8%) |
| Total | 4,856 (92.2%) | 411 (7.8%) |
Educational Attainment by Field of Study in Blythe
Education (186 | 16.1%), business (185 | 16.0%), science & technology (128 | 11.0%), arts & humanities (112 | 9.7%), and bio, nature & agricultural (94 | 8.1%) are the most common fields of study among 1,159 individuals in Blythe who have obtained a bachelor's degree or higher.
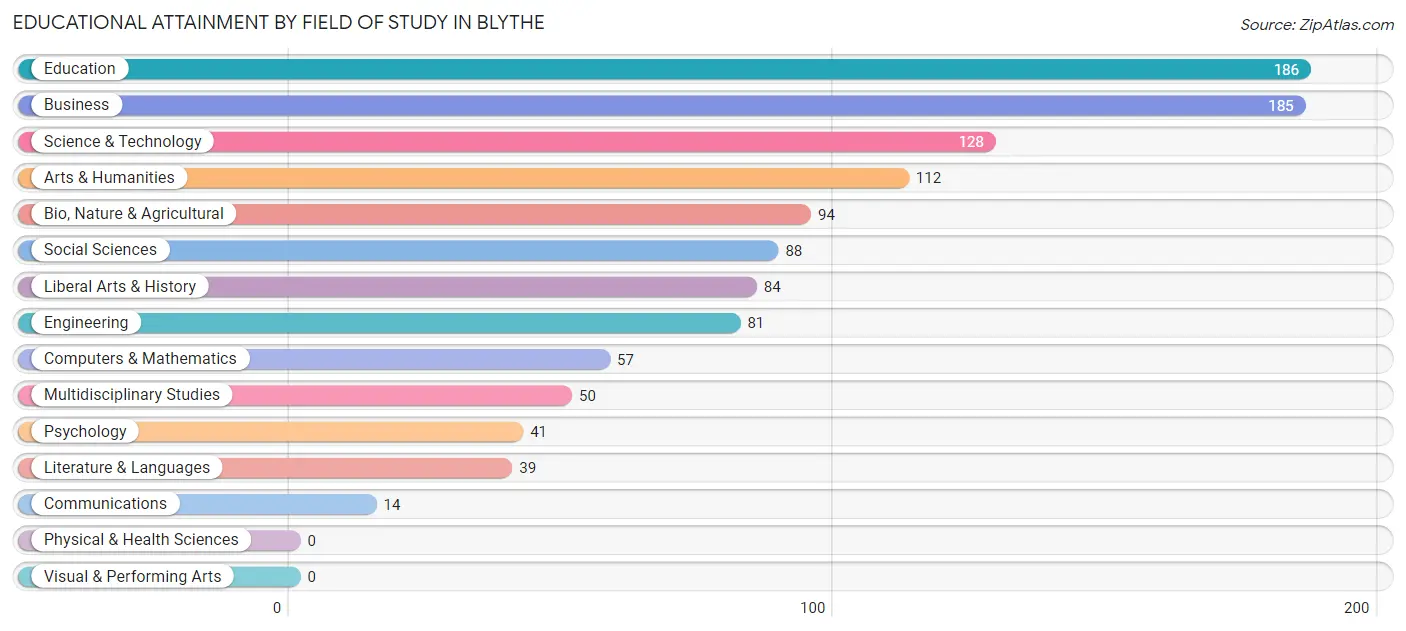
| Field of Study | # Graduates | % Graduates |
| Computers & Mathematics | 57 | 4.9% |
| Bio, Nature & Agricultural | 94 | 8.1% |
| Physical & Health Sciences | 0 | 0.0% |
| Psychology | 41 | 3.5% |
| Social Sciences | 88 | 7.6% |
| Engineering | 81 | 7.0% |
| Multidisciplinary Studies | 50 | 4.3% |
| Science & Technology | 128 | 11.0% |
| Business | 185 | 16.0% |
| Education | 186 | 16.1% |
| Literature & Languages | 39 | 3.4% |
| Liberal Arts & History | 84 | 7.2% |
| Visual & Performing Arts | 0 | 0.0% |
| Communications | 14 | 1.2% |
| Arts & Humanities | 112 | 9.7% |
| Total | 1,159 | 100.0% |
Transportation & Commute in Blythe
Vehicle Availability by Sex in Blythe
The most prevalent vehicle ownership categories in Blythe are males with 2 vehicles (894, accounting for 38.5%) and females with 2 vehicles (774, making up 42.3%).
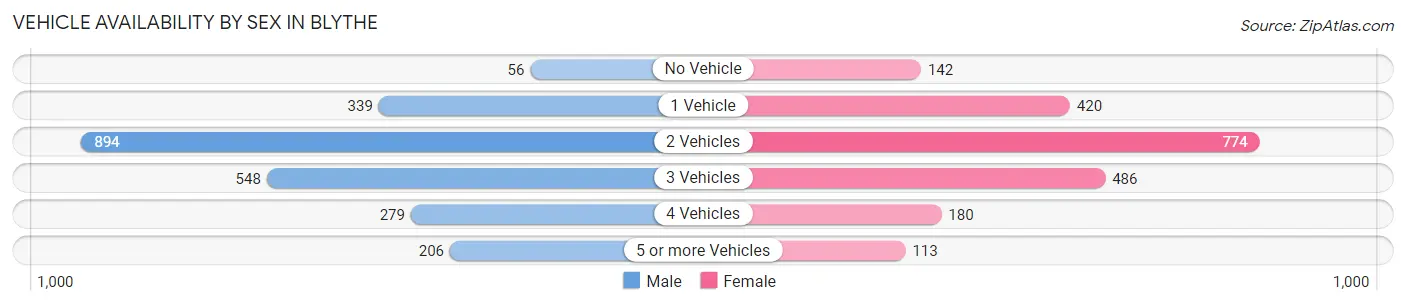
| Vehicles Available | Male | Female |
| No Vehicle | 56 (2.4%) | 142 (6.7%) |
| 1 Vehicle | 339 (14.6%) | 420 (19.9%) |
| 2 Vehicles | 894 (38.5%) | 774 (36.6%) |
| 3 Vehicles | 548 (23.6%) | 486 (23.0%) |
| 4 Vehicles | 279 (12.0%) | 180 (8.5%) |
| 5 or more Vehicles | 206 (8.9%) | 113 (5.3%) |
| Total | 2,322 (100.0%) | 2,115 (100.0%) |
Commute Time in Blythe
The most frequently occuring commute durations in Blythe are 5 to 9 minutes (1,486 commuters, 34.3%), 10 to 14 minutes (796 commuters, 18.4%), and less than 5 minutes (490 commuters, 11.3%).
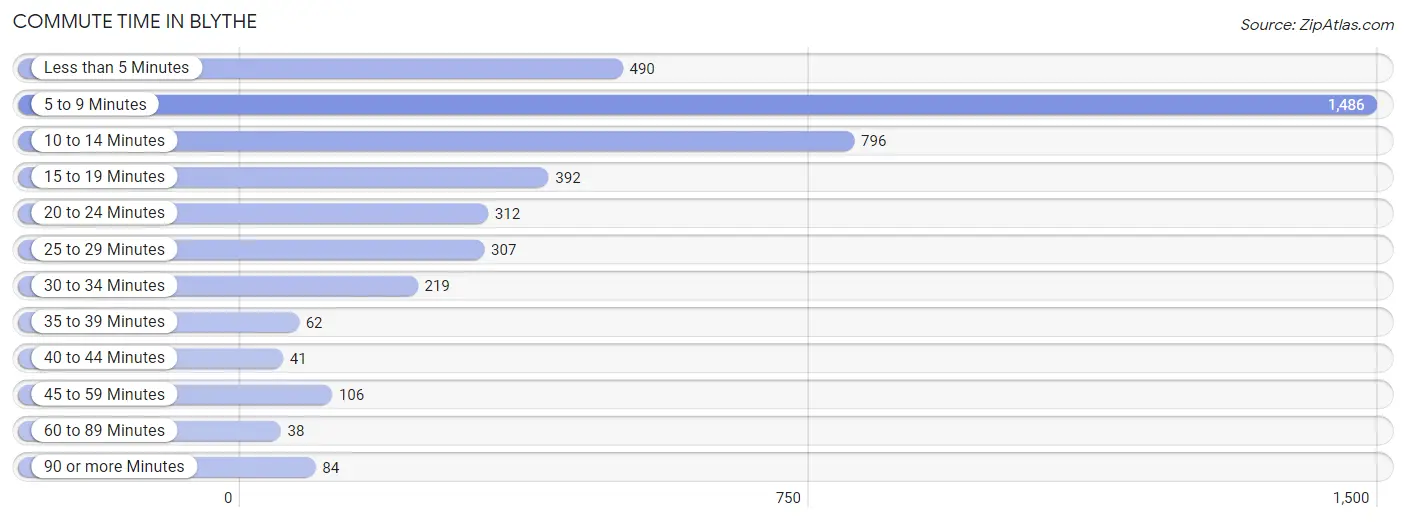
| Commute Time | # Commuters | % Commuters |
| Less than 5 Minutes | 490 | 11.3% |
| 5 to 9 Minutes | 1,486 | 34.3% |
| 10 to 14 Minutes | 796 | 18.4% |
| 15 to 19 Minutes | 392 | 9.0% |
| 20 to 24 Minutes | 312 | 7.2% |
| 25 to 29 Minutes | 307 | 7.1% |
| 30 to 34 Minutes | 219 | 5.1% |
| 35 to 39 Minutes | 62 | 1.4% |
| 40 to 44 Minutes | 41 | 0.9% |
| 45 to 59 Minutes | 106 | 2.5% |
| 60 to 89 Minutes | 38 | 0.9% |
| 90 or more Minutes | 84 | 1.9% |
Commute Time by Sex in Blythe
The most common commute times in Blythe are 5 to 9 minutes (718 commuters, 31.4%) for males and 5 to 9 minutes (768 commuters, 37.6%) for females.
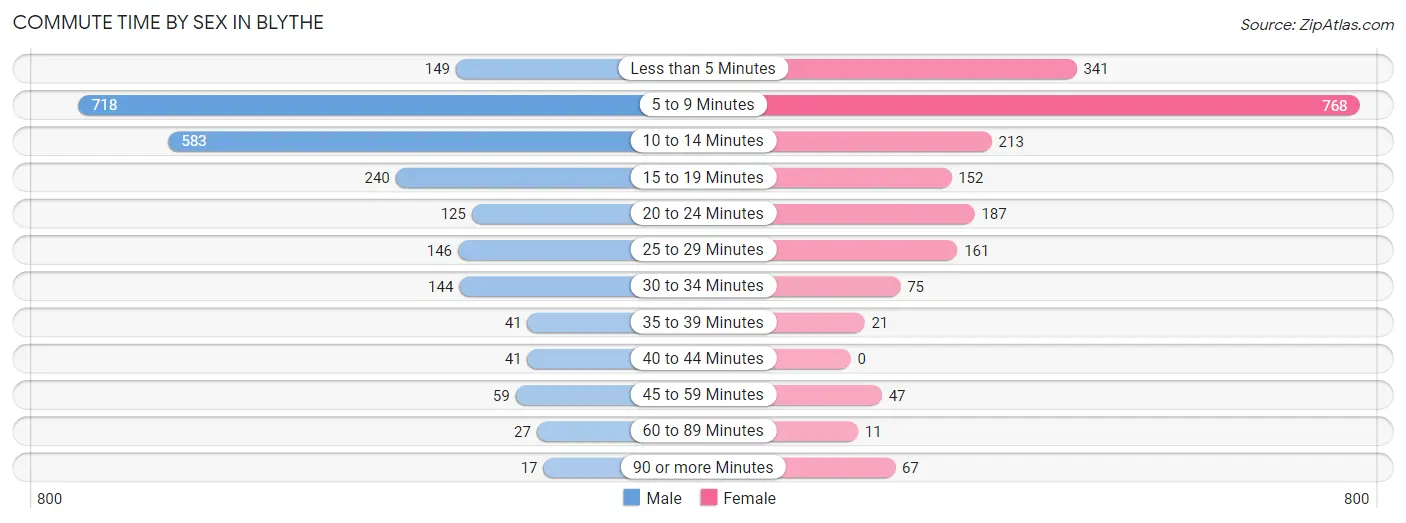
| Commute Time | Male | Female |
| Less than 5 Minutes | 149 (6.5%) | 341 (16.7%) |
| 5 to 9 Minutes | 718 (31.4%) | 768 (37.6%) |
| 10 to 14 Minutes | 583 (25.5%) | 213 (10.4%) |
| 15 to 19 Minutes | 240 (10.5%) | 152 (7.4%) |
| 20 to 24 Minutes | 125 (5.5%) | 187 (9.1%) |
| 25 to 29 Minutes | 146 (6.4%) | 161 (7.9%) |
| 30 to 34 Minutes | 144 (6.3%) | 75 (3.7%) |
| 35 to 39 Minutes | 41 (1.8%) | 21 (1.0%) |
| 40 to 44 Minutes | 41 (1.8%) | 0 (0.0%) |
| 45 to 59 Minutes | 59 (2.6%) | 47 (2.3%) |
| 60 to 89 Minutes | 27 (1.2%) | 11 (0.5%) |
| 90 or more Minutes | 17 (0.7%) | 67 (3.3%) |
Time of Departure to Work by Sex in Blythe
The most frequent times of departure to work in Blythe are 5:30 AM to 5:59 AM (319, 13.9%) for males and 7:00 AM to 7:29 AM (397, 19.4%) for females.
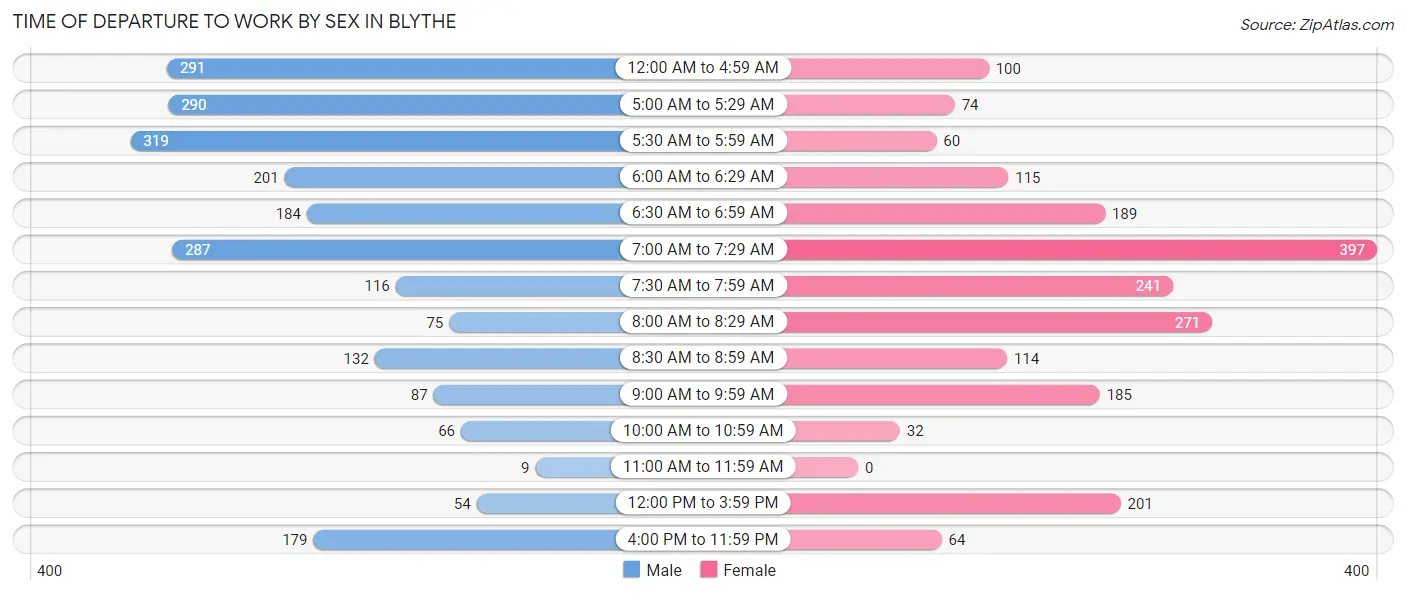
| Time of Departure | Male | Female |
| 12:00 AM to 4:59 AM | 291 (12.7%) | 100 (4.9%) |
| 5:00 AM to 5:29 AM | 290 (12.7%) | 74 (3.6%) |
| 5:30 AM to 5:59 AM | 319 (13.9%) | 60 (2.9%) |
| 6:00 AM to 6:29 AM | 201 (8.8%) | 115 (5.6%) |
| 6:30 AM to 6:59 AM | 184 (8.0%) | 189 (9.2%) |
| 7:00 AM to 7:29 AM | 287 (12.5%) | 397 (19.4%) |
| 7:30 AM to 7:59 AM | 116 (5.1%) | 241 (11.8%) |
| 8:00 AM to 8:29 AM | 75 (3.3%) | 271 (13.3%) |
| 8:30 AM to 8:59 AM | 132 (5.8%) | 114 (5.6%) |
| 9:00 AM to 9:59 AM | 87 (3.8%) | 185 (9.1%) |
| 10:00 AM to 10:59 AM | 66 (2.9%) | 32 (1.6%) |
| 11:00 AM to 11:59 AM | 9 (0.4%) | 0 (0.0%) |
| 12:00 PM to 3:59 PM | 54 (2.4%) | 201 (9.8%) |
| 4:00 PM to 11:59 PM | 179 (7.8%) | 64 (3.1%) |
| Total | 2,290 (100.0%) | 2,043 (100.0%) |
Housing Occupancy in Blythe
Occupancy by Ownership in Blythe
Of the total 4,227 dwellings in Blythe, owner-occupied units account for 2,369 (56.0%), while renter-occupied units make up 1,858 (44.0%).
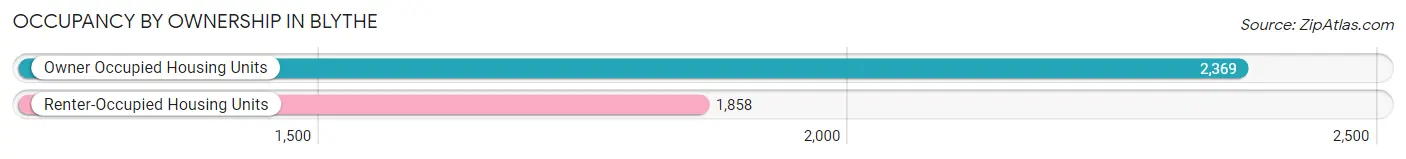
| Occupancy | # Housing Units | % Housing Units |
| Owner Occupied Housing Units | 2,369 | 56.0% |
| Renter-Occupied Housing Units | 1,858 | 44.0% |
| Total Occupied Housing Units | 4,227 | 100.0% |
Occupancy by Household Size in Blythe
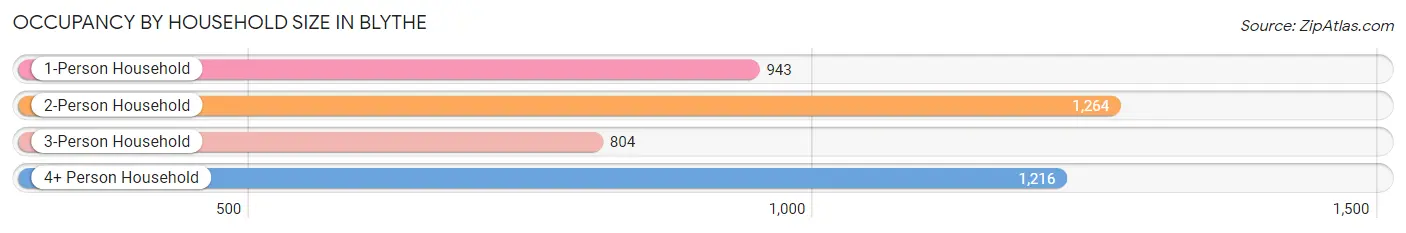
| Household Size | # Housing Units | % Housing Units |
| 1-Person Household | 943 | 22.3% |
| 2-Person Household | 1,264 | 29.9% |
| 3-Person Household | 804 | 19.0% |
| 4+ Person Household | 1,216 | 28.8% |
| Total Housing Units | 4,227 | 100.0% |
Occupancy by Ownership by Household Size in Blythe
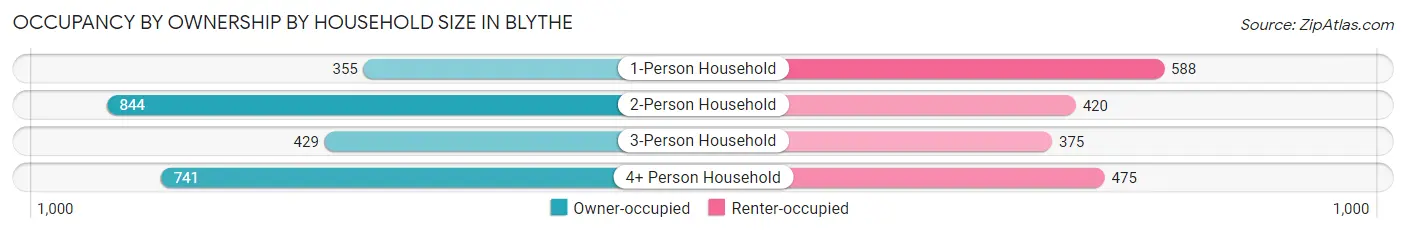
| Household Size | Owner-occupied | Renter-occupied |
| 1-Person Household | 355 (37.7%) | 588 (62.4%) |
| 2-Person Household | 844 (66.8%) | 420 (33.2%) |
| 3-Person Household | 429 (53.4%) | 375 (46.6%) |
| 4+ Person Household | 741 (60.9%) | 475 (39.1%) |
| Total Housing Units | 2,369 (56.0%) | 1,858 (44.0%) |
Occupancy by Educational Attainment in Blythe
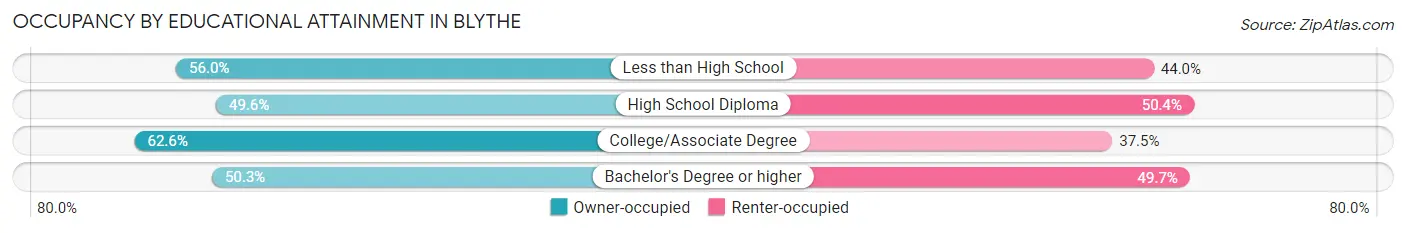
| Household Size | Owner-occupied | Renter-occupied |
| Less than High School | 582 (56.0%) | 458 (44.0%) |
| High School Diploma | 538 (49.6%) | 546 (50.4%) |
| College/Associate Degree | 977 (62.5%) | 585 (37.4%) |
| Bachelor's Degree or higher | 272 (50.3%) | 269 (49.7%) |
Occupancy by Age of Householder in Blythe
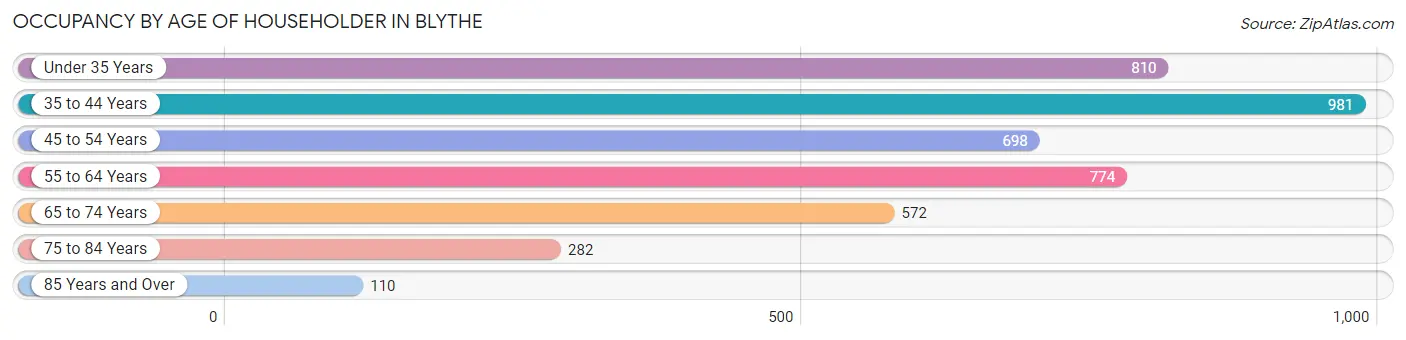
| Age Bracket | # Households | % Households |
| Under 35 Years | 810 | 19.2% |
| 35 to 44 Years | 981 | 23.2% |
| 45 to 54 Years | 698 | 16.5% |
| 55 to 64 Years | 774 | 18.3% |
| 65 to 74 Years | 572 | 13.5% |
| 75 to 84 Years | 282 | 6.7% |
| 85 Years and Over | 110 | 2.6% |
| Total | 4,227 | 100.0% |
Housing Finances in Blythe
Median Income by Occupancy in Blythe
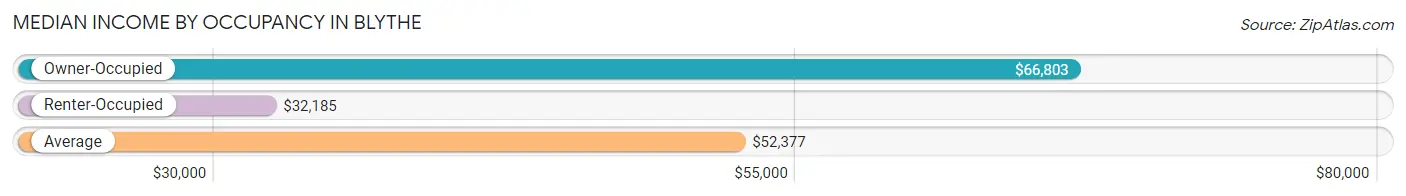
| Occupancy Type | # Households | Median Income |
| Owner-Occupied | 2,369 (56.0%) | $66,803 |
| Renter-Occupied | 1,858 (44.0%) | $32,185 |
| Average | 4,227 (100.0%) | $52,377 |
Occupancy by Householder Income Bracket in Blythe
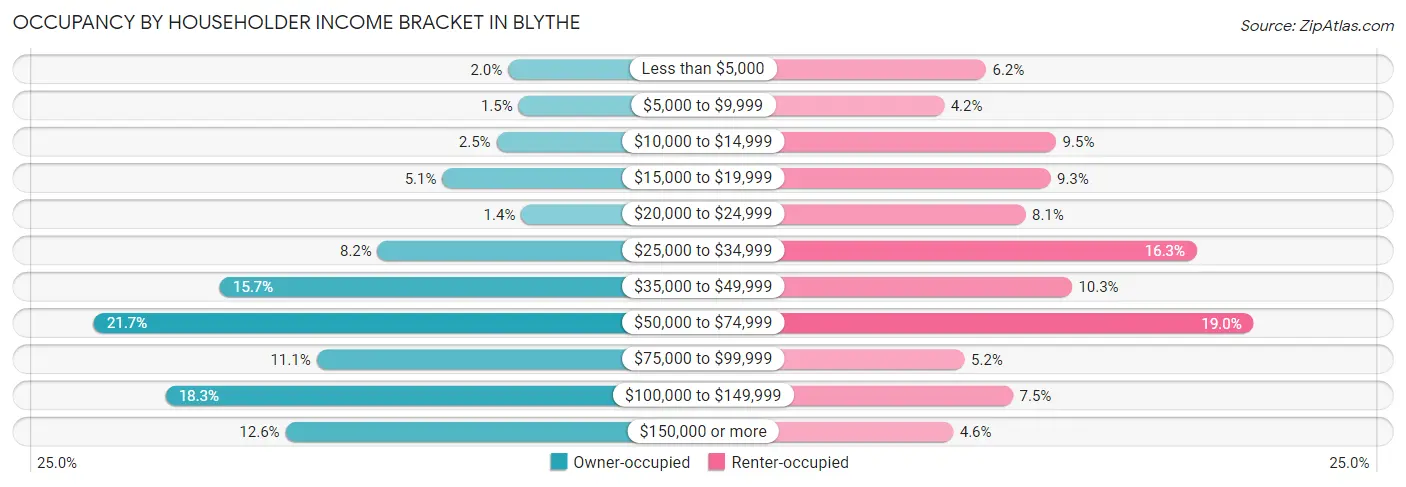
| Income Bracket | Owner-occupied | Renter-occupied |
| Less than $5,000 | 47 (2.0%) | 115 (6.2%) |
| $5,000 to $9,999 | 35 (1.5%) | 78 (4.2%) |
| $10,000 to $14,999 | 60 (2.5%) | 177 (9.5%) |
| $15,000 to $19,999 | 121 (5.1%) | 172 (9.3%) |
| $20,000 to $24,999 | 32 (1.3%) | 150 (8.1%) |
| $25,000 to $34,999 | 194 (8.2%) | 302 (16.3%) |
| $35,000 to $49,999 | 372 (15.7%) | 191 (10.3%) |
| $50,000 to $74,999 | 514 (21.7%) | 352 (19.0%) |
| $75,000 to $99,999 | 263 (11.1%) | 96 (5.2%) |
| $100,000 to $149,999 | 433 (18.3%) | 139 (7.5%) |
| $150,000 or more | 298 (12.6%) | 86 (4.6%) |
| Total | 2,369 (100.0%) | 1,858 (100.0%) |
Monthly Housing Cost Tiers in Blythe
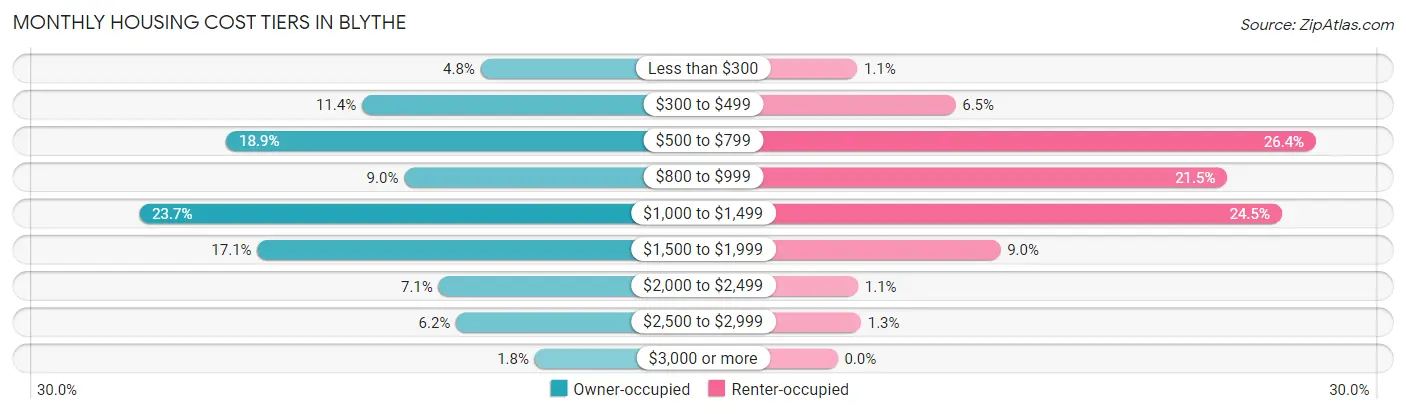
| Monthly Cost | Owner-occupied | Renter-occupied |
| Less than $300 | 114 (4.8%) | 20 (1.1%) |
| $300 to $499 | 269 (11.4%) | 121 (6.5%) |
| $500 to $799 | 447 (18.9%) | 491 (26.4%) |
| $800 to $999 | 214 (9.0%) | 400 (21.5%) |
| $1,000 to $1,499 | 561 (23.7%) | 456 (24.5%) |
| $1,500 to $1,999 | 406 (17.1%) | 167 (9.0%) |
| $2,000 to $2,499 | 169 (7.1%) | 21 (1.1%) |
| $2,500 to $2,999 | 146 (6.2%) | 24 (1.3%) |
| $3,000 or more | 43 (1.8%) | 0 (0.0%) |
| Total | 2,369 (100.0%) | 1,858 (100.0%) |
Physical Housing Characteristics in Blythe
Housing Structures in Blythe
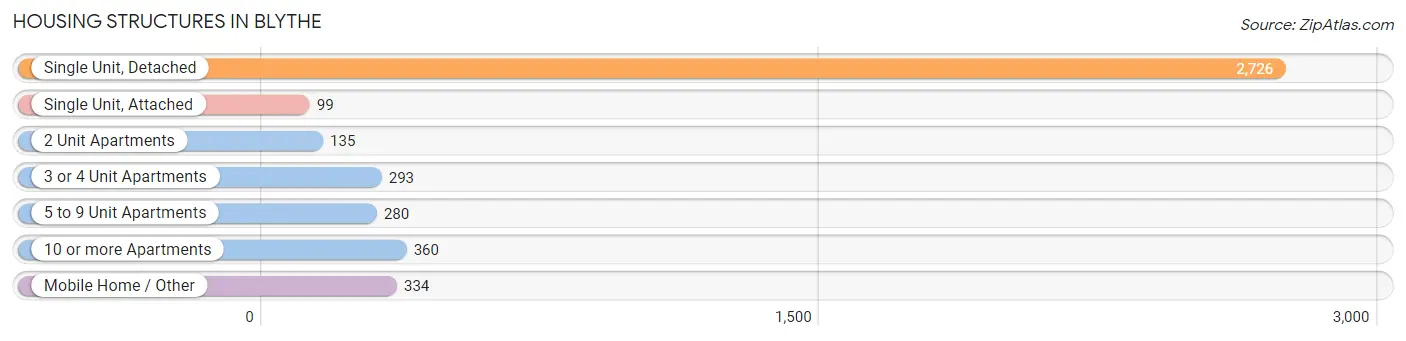
| Structure Type | # Housing Units | % Housing Units |
| Single Unit, Detached | 2,726 | 64.5% |
| Single Unit, Attached | 99 | 2.3% |
| 2 Unit Apartments | 135 | 3.2% |
| 3 or 4 Unit Apartments | 293 | 6.9% |
| 5 to 9 Unit Apartments | 280 | 6.6% |
| 10 or more Apartments | 360 | 8.5% |
| Mobile Home / Other | 334 | 7.9% |
| Total | 4,227 | 100.0% |
Housing Structures by Occupancy in Blythe
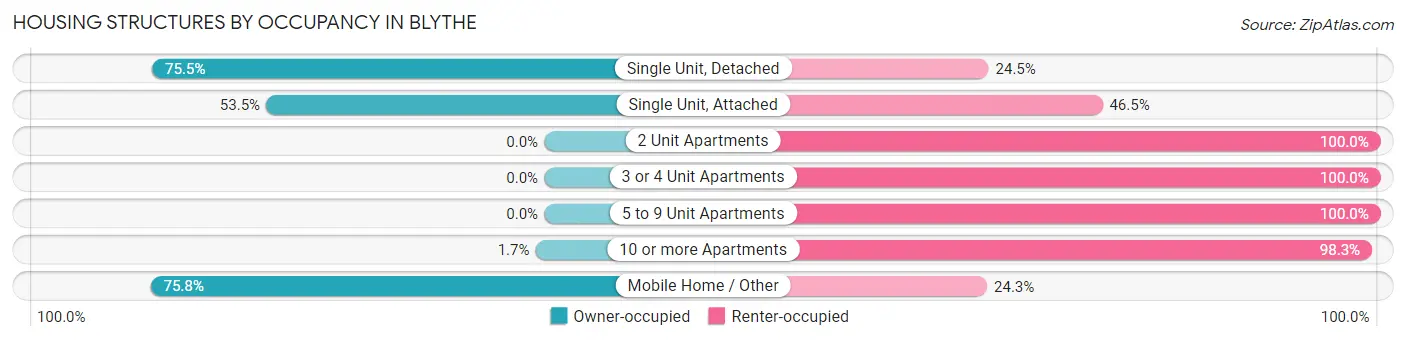
| Structure Type | Owner-occupied | Renter-occupied |
| Single Unit, Detached | 2,057 (75.5%) | 669 (24.5%) |
| Single Unit, Attached | 53 (53.5%) | 46 (46.5%) |
| 2 Unit Apartments | 0 (0.0%) | 135 (100.0%) |
| 3 or 4 Unit Apartments | 0 (0.0%) | 293 (100.0%) |
| 5 to 9 Unit Apartments | 0 (0.0%) | 280 (100.0%) |
| 10 or more Apartments | 6 (1.7%) | 354 (98.3%) |
| Mobile Home / Other | 253 (75.7%) | 81 (24.2%) |
| Total | 2,369 (56.0%) | 1,858 (44.0%) |
Housing Structures by Number of Rooms in Blythe
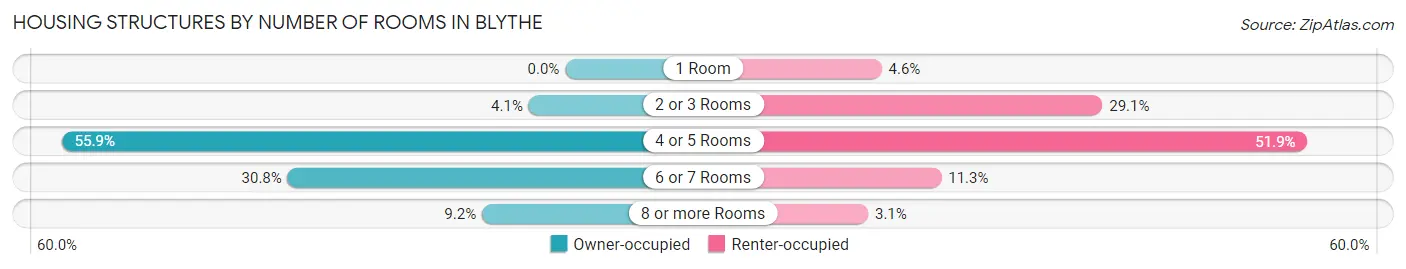
| Number of Rooms | Owner-occupied | Renter-occupied |
| 1 Room | 0 (0.0%) | 86 (4.6%) |
| 2 or 3 Rooms | 96 (4.1%) | 541 (29.1%) |
| 4 or 5 Rooms | 1,324 (55.9%) | 964 (51.9%) |
| 6 or 7 Rooms | 730 (30.8%) | 209 (11.3%) |
| 8 or more Rooms | 219 (9.2%) | 58 (3.1%) |
| Total | 2,369 (100.0%) | 1,858 (100.0%) |
Housing Structure by Heating Type in Blythe
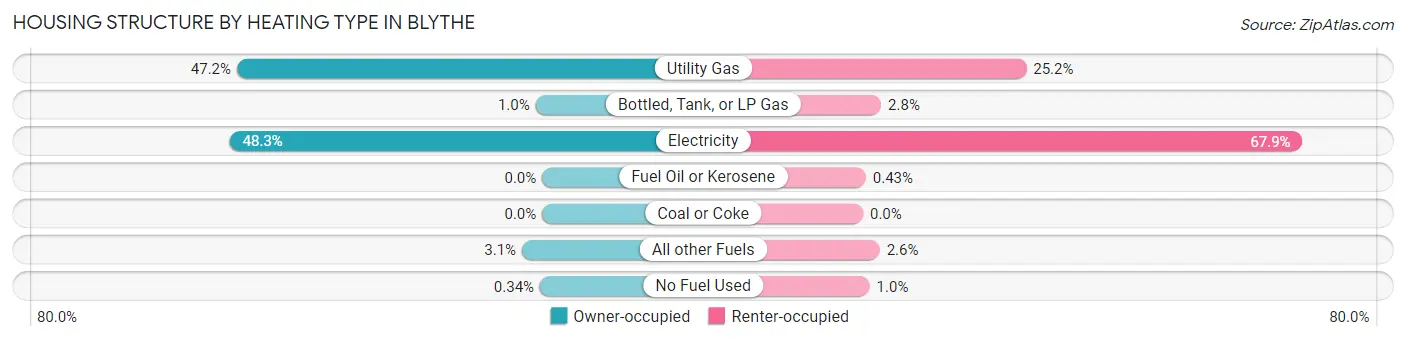
| Heating Type | Owner-occupied | Renter-occupied |
| Utility Gas | 1,118 (47.2%) | 469 (25.2%) |
| Bottled, Tank, or LP Gas | 24 (1.0%) | 52 (2.8%) |
| Electricity | 1,145 (48.3%) | 1,262 (67.9%) |
| Fuel Oil or Kerosene | 0 (0.0%) | 8 (0.4%) |
| Coal or Coke | 0 (0.0%) | 0 (0.0%) |
| All other Fuels | 74 (3.1%) | 48 (2.6%) |
| No Fuel Used | 8 (0.3%) | 19 (1.0%) |
| Total | 2,369 (100.0%) | 1,858 (100.0%) |
Household Vehicle Usage in Blythe
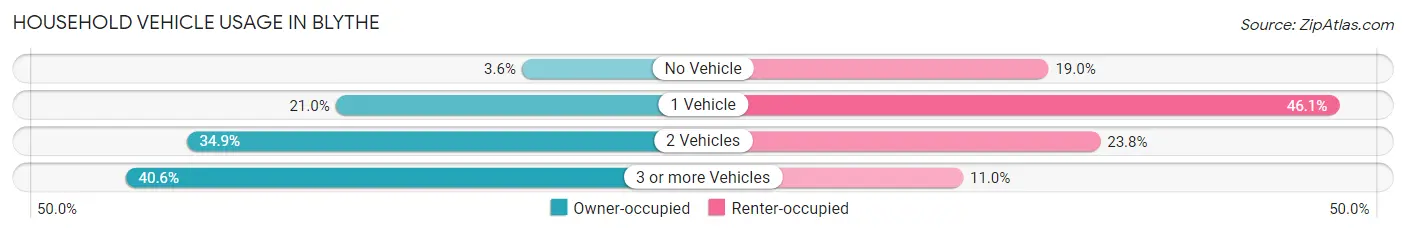
| Vehicles per Household | Owner-occupied | Renter-occupied |
| No Vehicle | 85 (3.6%) | 353 (19.0%) |
| 1 Vehicle | 497 (21.0%) | 857 (46.1%) |
| 2 Vehicles | 826 (34.9%) | 443 (23.8%) |
| 3 or more Vehicles | 961 (40.6%) | 205 (11.0%) |
| Total | 2,369 (100.0%) | 1,858 (100.0%) |
Real Estate & Mortgages in Blythe
Real Estate and Mortgage Overview in Blythe
| Characteristic | Without Mortgage | With Mortgage |
| Housing Units | 807 | 1,562 |
| Median Property Value | $159,100 | $207,300 |
| Median Household Income | $42,961 | $215 |
| Monthly Housing Costs | $515 | $43 |
| Real Estate Taxes | $1,093 | $43 |
Property Value by Mortgage Status in Blythe
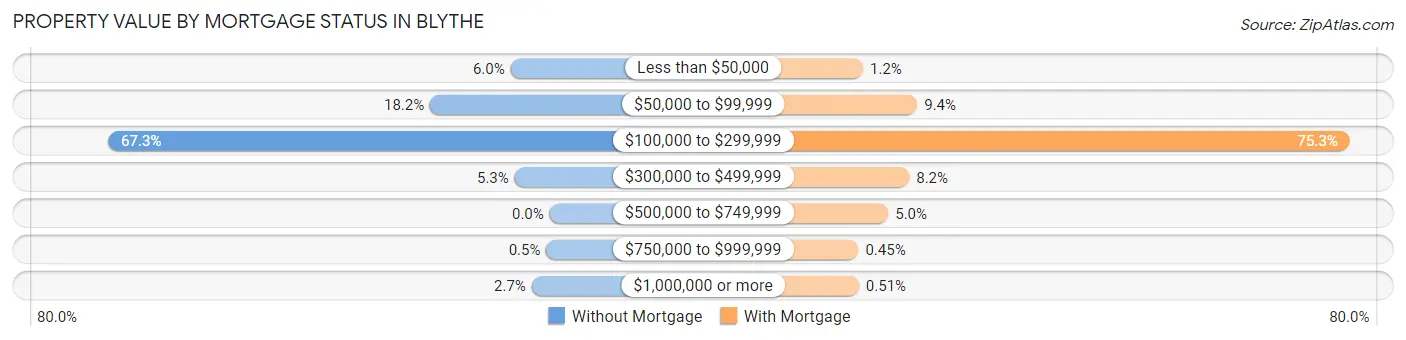
| Property Value | Without Mortgage | With Mortgage |
| Less than $50,000 | 48 (5.9%) | 18 (1.1%) |
| $50,000 to $99,999 | 147 (18.2%) | 147 (9.4%) |
| $100,000 to $299,999 | 543 (67.3%) | 1,176 (75.3%) |
| $300,000 to $499,999 | 43 (5.3%) | 128 (8.2%) |
| $500,000 to $749,999 | 0 (0.0%) | 78 (5.0%) |
| $750,000 to $999,999 | 4 (0.5%) | 7 (0.4%) |
| $1,000,000 or more | 22 (2.7%) | 8 (0.5%) |
| Total | 807 (100.0%) | 1,562 (100.0%) |
Household Income by Mortgage Status in Blythe
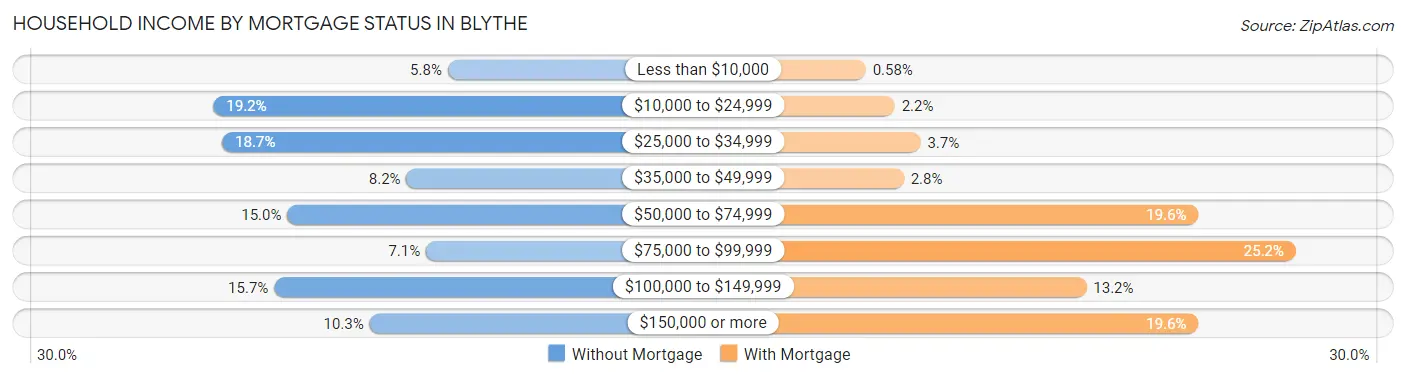
| Household Income | Without Mortgage | With Mortgage |
| Less than $10,000 | 47 (5.8%) | 9 (0.6%) |
| $10,000 to $24,999 | 155 (19.2%) | 35 (2.2%) |
| $25,000 to $34,999 | 151 (18.7%) | 58 (3.7%) |
| $35,000 to $49,999 | 66 (8.2%) | 43 (2.8%) |
| $50,000 to $74,999 | 121 (15.0%) | 306 (19.6%) |
| $75,000 to $99,999 | 57 (7.1%) | 393 (25.2%) |
| $100,000 to $149,999 | 127 (15.7%) | 206 (13.2%) |
| $150,000 or more | 83 (10.3%) | 306 (19.6%) |
| Total | 807 (100.0%) | 1,562 (100.0%) |
Property Value to Household Income Ratio in Blythe
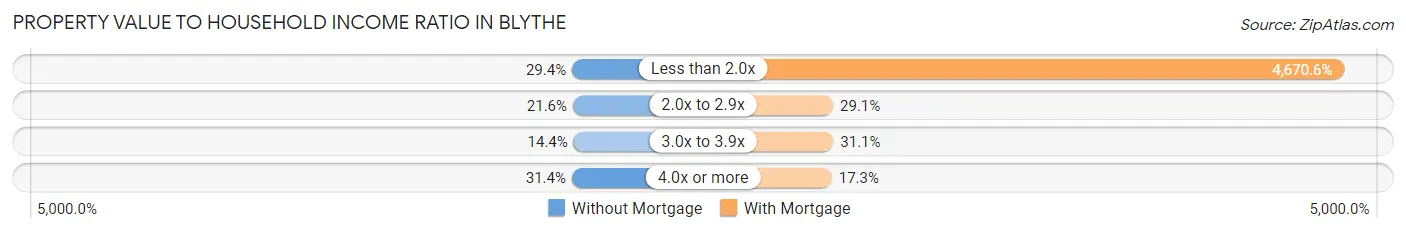
| Value-to-Income Ratio | Without Mortgage | With Mortgage |
| Less than 2.0x | 237 (29.4%) | 72,955 (4,670.6%) |
| 2.0x to 2.9x | 174 (21.6%) | 455 (29.1%) |
| 3.0x to 3.9x | 116 (14.4%) | 486 (31.1%) |
| 4.0x or more | 253 (31.4%) | 270 (17.3%) |
| Total | 807 (100.0%) | 1,562 (100.0%) |
Real Estate Taxes by Mortgage Status in Blythe
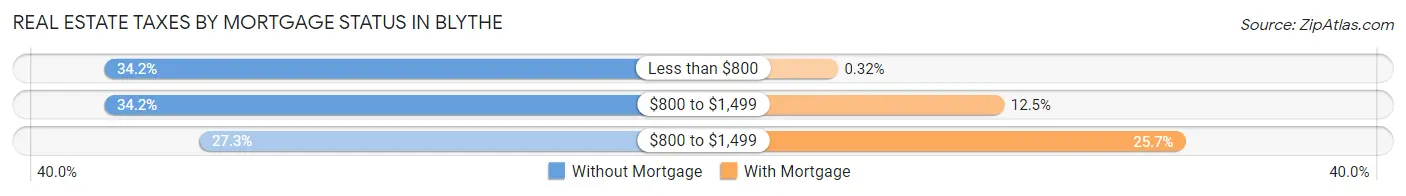
| Property Taxes | Without Mortgage | With Mortgage |
| Less than $800 | 276 (34.2%) | 5 (0.3%) |
| $800 to $1,499 | 276 (34.2%) | 195 (12.5%) |
| $800 to $1,499 | 220 (27.3%) | 402 (25.7%) |
| Total | 807 (100.0%) | 1,562 (100.0%) |
Health & Disability in Blythe
Health Insurance Coverage by Age in Blythe
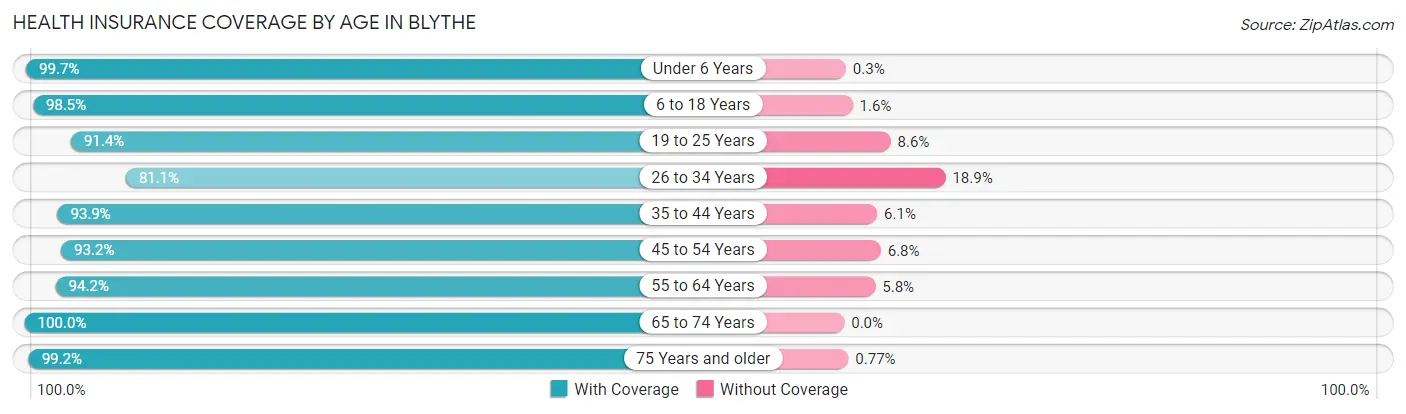
| Age Bracket | With Coverage | Without Coverage |
| Under 6 Years | 1,325 (99.7%) | 4 (0.3%) |
| 6 to 18 Years | 2,475 (98.5%) | 39 (1.5%) |
| 19 to 25 Years | 1,131 (91.4%) | 107 (8.6%) |
| 26 to 34 Years | 1,247 (81.1%) | 290 (18.9%) |
| 35 to 44 Years | 1,318 (93.9%) | 86 (6.1%) |
| 45 to 54 Years | 1,136 (93.2%) | 83 (6.8%) |
| 55 to 64 Years | 1,140 (94.2%) | 70 (5.8%) |
| 65 to 74 Years | 918 (100.0%) | 0 (0.0%) |
| 75 Years and older | 777 (99.2%) | 6 (0.8%) |
| Total | 11,467 (94.4%) | 685 (5.6%) |
Health Insurance Coverage by Citizenship Status in Blythe
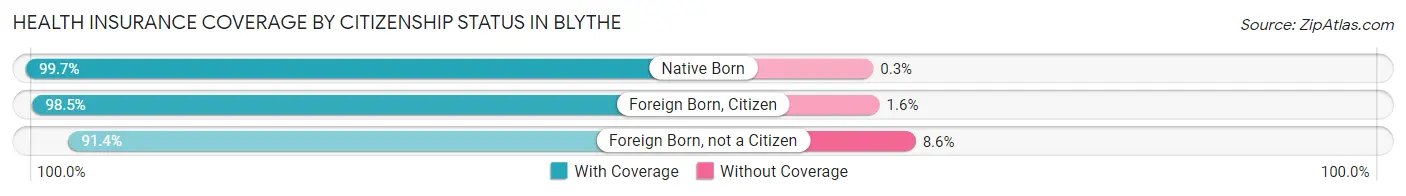
| Citizenship Status | With Coverage | Without Coverage |
| Native Born | 1,325 (99.7%) | 4 (0.3%) |
| Foreign Born, Citizen | 2,475 (98.5%) | 39 (1.5%) |
| Foreign Born, not a Citizen | 1,131 (91.4%) | 107 (8.6%) |
Health Insurance Coverage by Household Income in Blythe
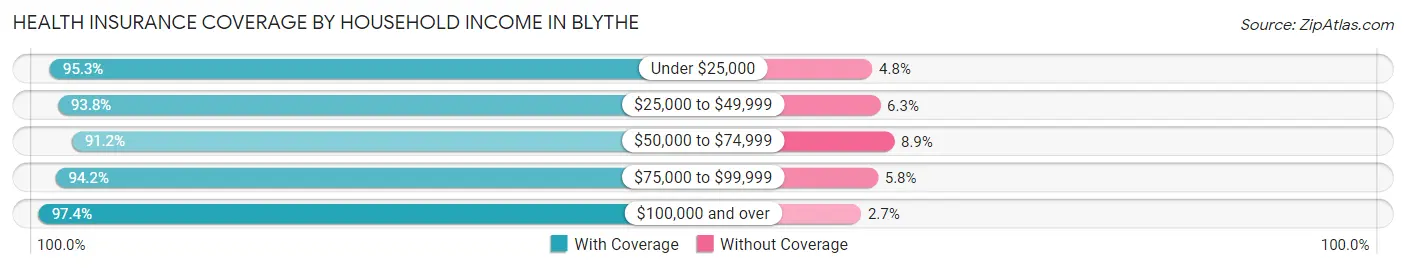
| Household Income | With Coverage | Without Coverage |
| Under $25,000 | 2,024 (95.3%) | 101 (4.8%) |
| $25,000 to $49,999 | 2,534 (93.8%) | 169 (6.2%) |
| $50,000 to $74,999 | 2,625 (91.1%) | 255 (8.8%) |
| $75,000 to $99,999 | 1,137 (94.2%) | 70 (5.8%) |
| $100,000 and over | 3,119 (97.4%) | 85 (2.6%) |
Public vs Private Health Insurance Coverage by Age in Blythe
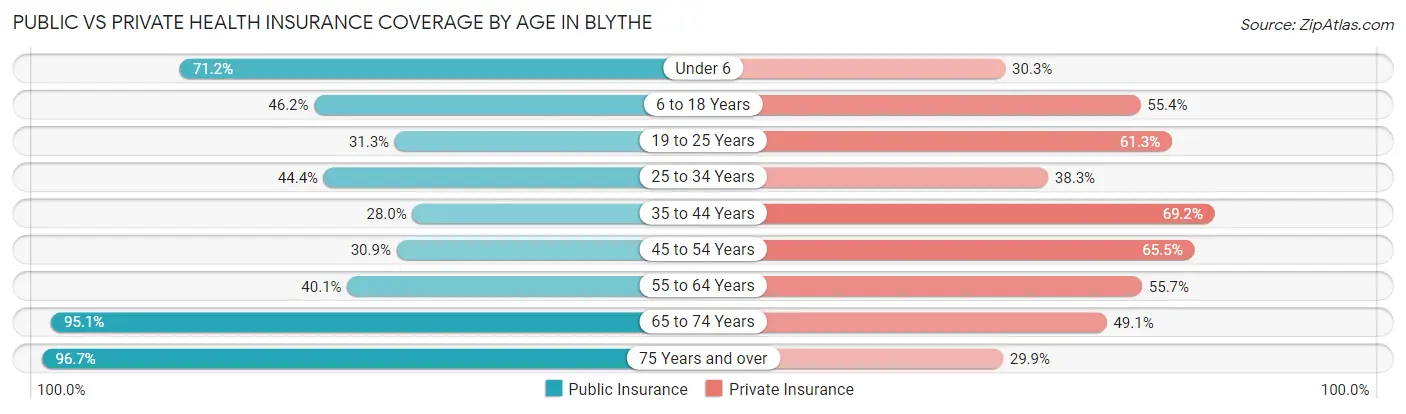
| Age Bracket | Public Insurance | Private Insurance |
| Under 6 | 946 (71.2%) | 403 (30.3%) |
| 6 to 18 Years | 1,162 (46.2%) | 1,393 (55.4%) |
| 19 to 25 Years | 387 (31.3%) | 759 (61.3%) |
| 25 to 34 Years | 683 (44.4%) | 588 (38.3%) |
| 35 to 44 Years | 393 (28.0%) | 972 (69.2%) |
| 45 to 54 Years | 377 (30.9%) | 798 (65.5%) |
| 55 to 64 Years | 485 (40.1%) | 674 (55.7%) |
| 65 to 74 Years | 873 (95.1%) | 451 (49.1%) |
| 75 Years and over | 757 (96.7%) | 234 (29.9%) |
| Total | 6,063 (49.9%) | 6,272 (51.6%) |
Disability Status by Sex by Age in Blythe
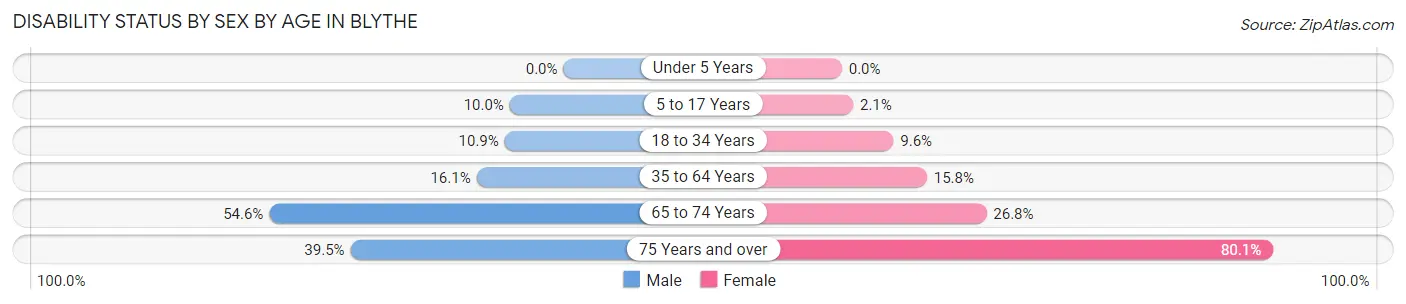
| Age Bracket | Male | Female |
| Under 5 Years | 0 (0.0%) | 0 (0.0%) |
| 5 to 17 Years | 123 (10.0%) | 30 (2.1%) |
| 18 to 34 Years | 166 (10.9%) | 129 (9.6%) |
| 35 to 64 Years | 297 (16.1%) | 314 (15.8%) |
| 65 to 74 Years | 196 (54.6%) | 150 (26.8%) |
| 75 Years and over | 153 (39.5%) | 317 (80.0%) |
Disability Class by Sex by Age in Blythe
Disability Class: Hearing Difficulty
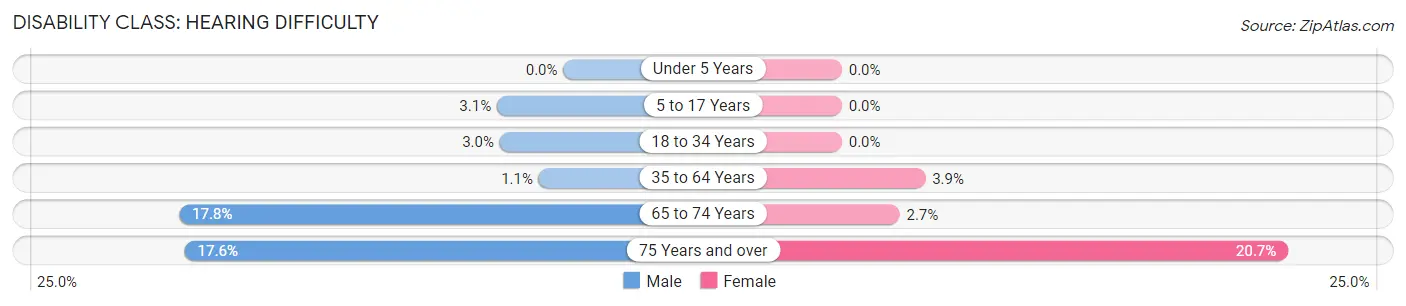
| Age Bracket | Male | Female |
| Under 5 Years | 0 (0.0%) | 0 (0.0%) |
| 5 to 17 Years | 38 (3.1%) | 0 (0.0%) |
| 18 to 34 Years | 45 (2.9%) | 0 (0.0%) |
| 35 to 64 Years | 21 (1.1%) | 77 (3.9%) |
| 65 to 74 Years | 64 (17.8%) | 15 (2.7%) |
| 75 Years and over | 68 (17.6%) | 82 (20.7%) |
Disability Class: Vision Difficulty
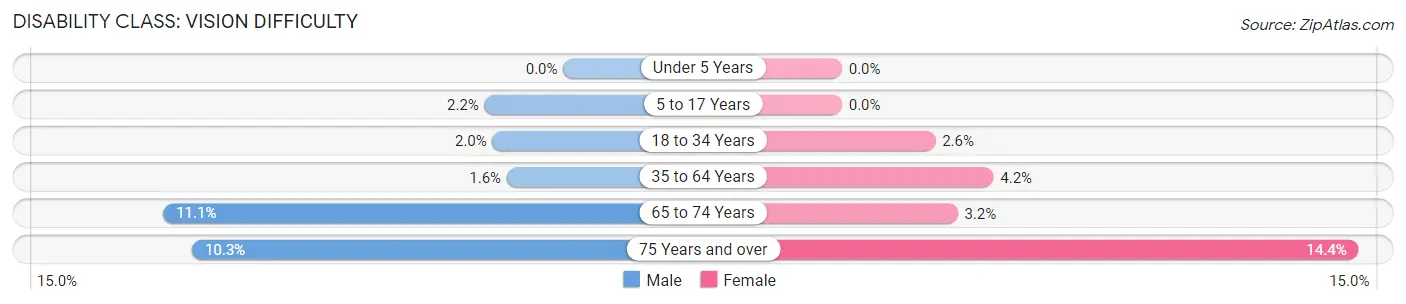
| Age Bracket | Male | Female |
| Under 5 Years | 0 (0.0%) | 0 (0.0%) |
| 5 to 17 Years | 27 (2.2%) | 0 (0.0%) |
| 18 to 34 Years | 30 (2.0%) | 35 (2.6%) |
| 35 to 64 Years | 29 (1.6%) | 84 (4.2%) |
| 65 to 74 Years | 40 (11.1%) | 18 (3.2%) |
| 75 Years and over | 40 (10.3%) | 57 (14.4%) |
Disability Class: Cognitive Difficulty
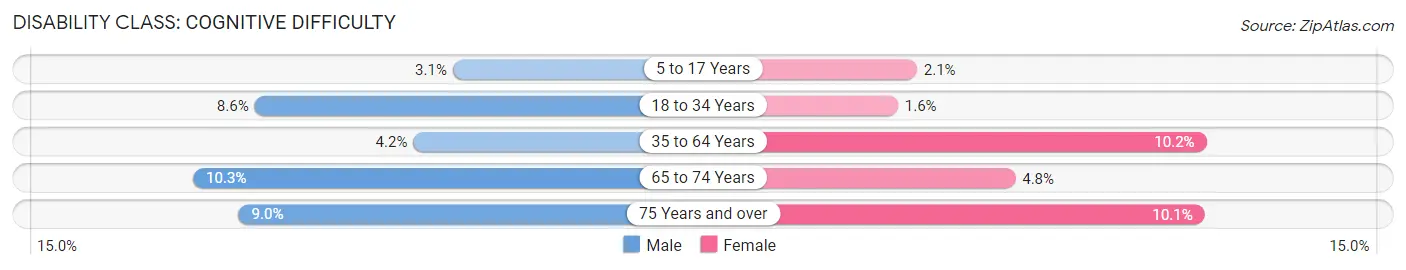
| Age Bracket | Male | Female |
| 5 to 17 Years | 38 (3.1%) | 30 (2.1%) |
| 18 to 34 Years | 131 (8.6%) | 21 (1.6%) |
| 35 to 64 Years | 77 (4.2%) | 202 (10.2%) |
| 65 to 74 Years | 37 (10.3%) | 27 (4.8%) |
| 75 Years and over | 35 (9.0%) | 40 (10.1%) |
Disability Class: Ambulatory Difficulty
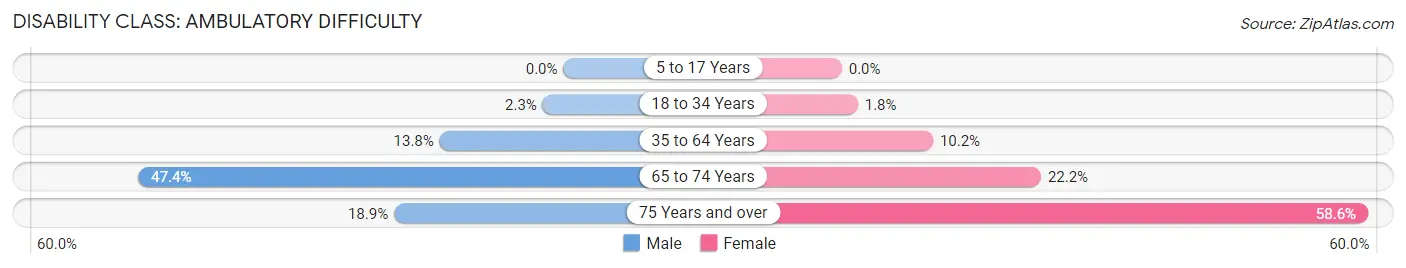
| Age Bracket | Male | Female |
| 5 to 17 Years | 0 (0.0%) | 0 (0.0%) |
| 18 to 34 Years | 35 (2.3%) | 24 (1.8%) |
| 35 to 64 Years | 254 (13.8%) | 202 (10.2%) |
| 65 to 74 Years | 170 (47.3%) | 124 (22.2%) |
| 75 Years and over | 73 (18.9%) | 232 (58.6%) |
Disability Class: Self-Care Difficulty
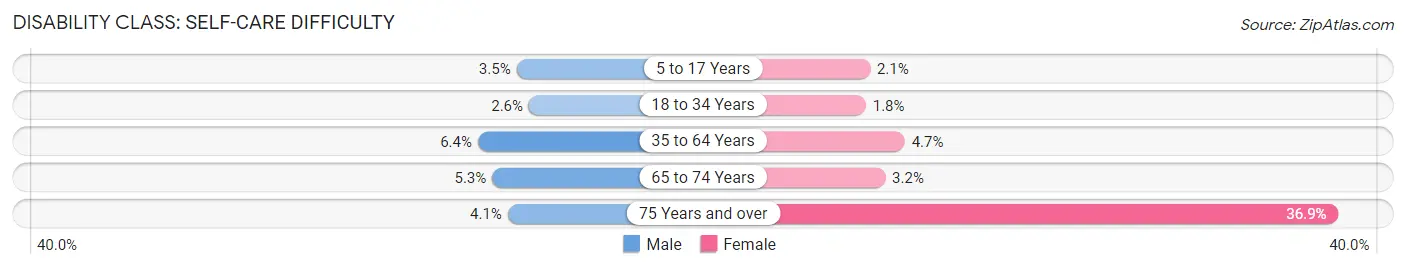
| Age Bracket | Male | Female |
| 5 to 17 Years | 43 (3.5%) | 30 (2.1%) |
| 18 to 34 Years | 39 (2.6%) | 24 (1.8%) |
| 35 to 64 Years | 117 (6.4%) | 93 (4.7%) |
| 65 to 74 Years | 19 (5.3%) | 18 (3.2%) |
| 75 Years and over | 16 (4.1%) | 146 (36.9%) |
Technology Access in Blythe
Computing Device Access in Blythe
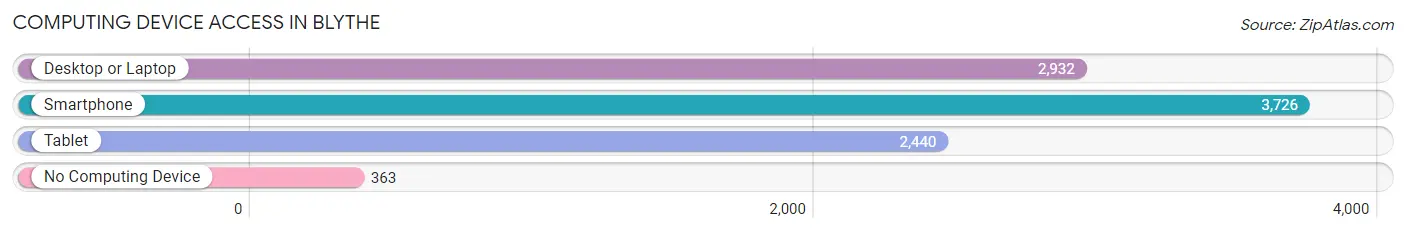
| Device Type | # Households | % Households |
| Desktop or Laptop | 2,932 | 69.4% |
| Smartphone | 3,726 | 88.1% |
| Tablet | 2,440 | 57.7% |
| No Computing Device | 363 | 8.6% |
| Total | 4,227 | 100.0% |
Internet Access in Blythe
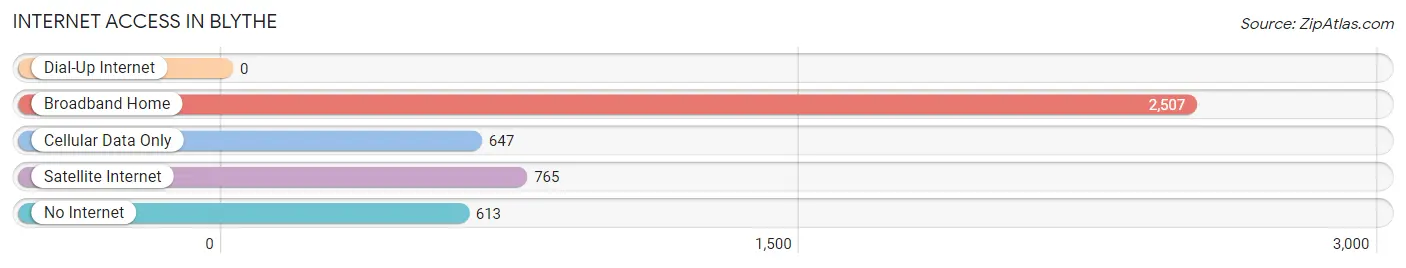
| Internet Type | # Households | % Households |
| Dial-Up Internet | 0 | 0.0% |
| Broadband Home | 2,507 | 59.3% |
| Cellular Data Only | 647 | 15.3% |
| Satellite Internet | 765 | 18.1% |
| No Internet | 613 | 14.5% |
| Total | 4,227 | 100.0% |
Blythe Summary
Blythe is a city located in Riverside County, California, United States. It is situated on the Colorado River, near the Arizona border. The population was 20,817 at the 2010 census. Blythe was named after Thomas H. Blythe, a San Francisco financier and banker.
Geography
Blythe is located at 33°40'55" North, 114°38'10" West (33.6818, -114.6362). It is located in the Palo Verde Valley of the Lower Colorado River Valley region, an area of high desert land. The city is in the Colorado Desert, in the Sonoran Desert ecoregion.
The city is about 230 miles (370 km) east of Los Angeles, California, and about 115 miles (185 km) west of Phoenix, Arizona. Blythe is located at the junction of Interstate 10 and US 95.
Climate
Blythe has a hot desert climate (Köppen climate classification BWh). Summers are extremely hot and dry, with temperatures often exceeding 110 °F (43 °C). Winters are mild, with temperatures rarely dropping below 40 °F (4 °C). The area receives an average of 4.6 inches (117 mm) of precipitation annually, mostly in the winter months.
Demographics
As of the census of 2000, there were 20,817 people, 6,845 households, and 5,039 families residing in the city. The population density was 1,082.2 people per square mile (417.9/km²). There were 7,837 housing units at an average density of 412.2 per square mile (159.2/km²). The racial makeup of the city was 68.2% White, 4.2% African American, 1.3% Native American, 0.7% Asian, 0.2% Pacific Islander, 22.2% from other races, and 3.2% from two or more races. Hispanic or Latino of any race were 44.3% of the population.
Economy
Blythe's economy is largely based on agriculture, tourism, and retail. The city is home to several large agricultural operations, including the Palo Verde Valley Cotton Growers Association, which is the largest cotton producer in California. The city is also home to several large retail stores, including Walmart, Target, and Home Depot.
Tourism is also an important part of the local economy. Blythe is located near several popular tourist attractions, including the Colorado River, the Palo Verde Valley National Wildlife Refuge, and the Imperial Sand Dunes.
The city is also home to several manufacturing and industrial operations, including a large solar panel manufacturing plant.
Conclusion
Blythe is a city located in Riverside County, California, United States. It is situated on the Colorado River, near the Arizona border. The population was 20,817 at the 2010 census. Blythe has a hot desert climate and is home to several large agricultural operations, retail stores, and tourist attractions. The city's economy is largely based on agriculture, tourism, and retail. Blythe is also home to several manufacturing and industrial operations, including a large solar panel manufacturing plant.
Common Questions
What is Per Capita Income in Blythe?
Per Capita income in Blythe is $18,085.
What is the Median Family Income in Blythe?
Median Family Income in Blythe is $58,415.
What is the Median Household income in Blythe?
Median Household Income in Blythe is $52,377.
What is Income or Wage Gap in Blythe?
Income or Wage Gap in Blythe is 12.8%.
Women in Blythe earn 87.2 cents for every dollar earned by a man.
What is Inequality or Gini Index in Blythe?
Inequality or Gini Index in Blythe is 0.46.
What is the Total Population of Blythe?
Total Population of Blythe is 17,949.
What is the Total Male Population of Blythe?
Total Male Population of Blythe is 11,747.
What is the Total Female Population of Blythe?
Total Female Population of Blythe is 6,202.
What is the Ratio of Males per 100 Females in Blythe?
There are 189.41 Males per 100 Females in Blythe.
What is the Ratio of Females per 100 Males in Blythe?
There are 52.80 Females per 100 Males in Blythe.
What is the Median Population Age in Blythe?
Median Population Age in Blythe is 35.4 Years.
What is the Average Family Size in Blythe
Average Family Size in Blythe is 3.4 People.
What is the Average Household Size in Blythe
Average Household Size in Blythe is 2.9 People.
How Large is the Labor Force in Blythe?
There are 4,921 People in the Labor Forcein in Blythe.
What is the Percentage of People in the Labor Force in Blythe?
33.6% of People are in the Labor Force in Blythe.
What is the Unemployment Rate in Blythe?
Unemployment Rate in Blythe is 7.9%.