Zip Codes with the Highest Percentage of Population Employed in Transportation & Warehousing in Beverly Hills, CA
RELATED REPORTS & OPTIONS
Transportation & Warehousing
Beverly Hills
Compare Zip Codes
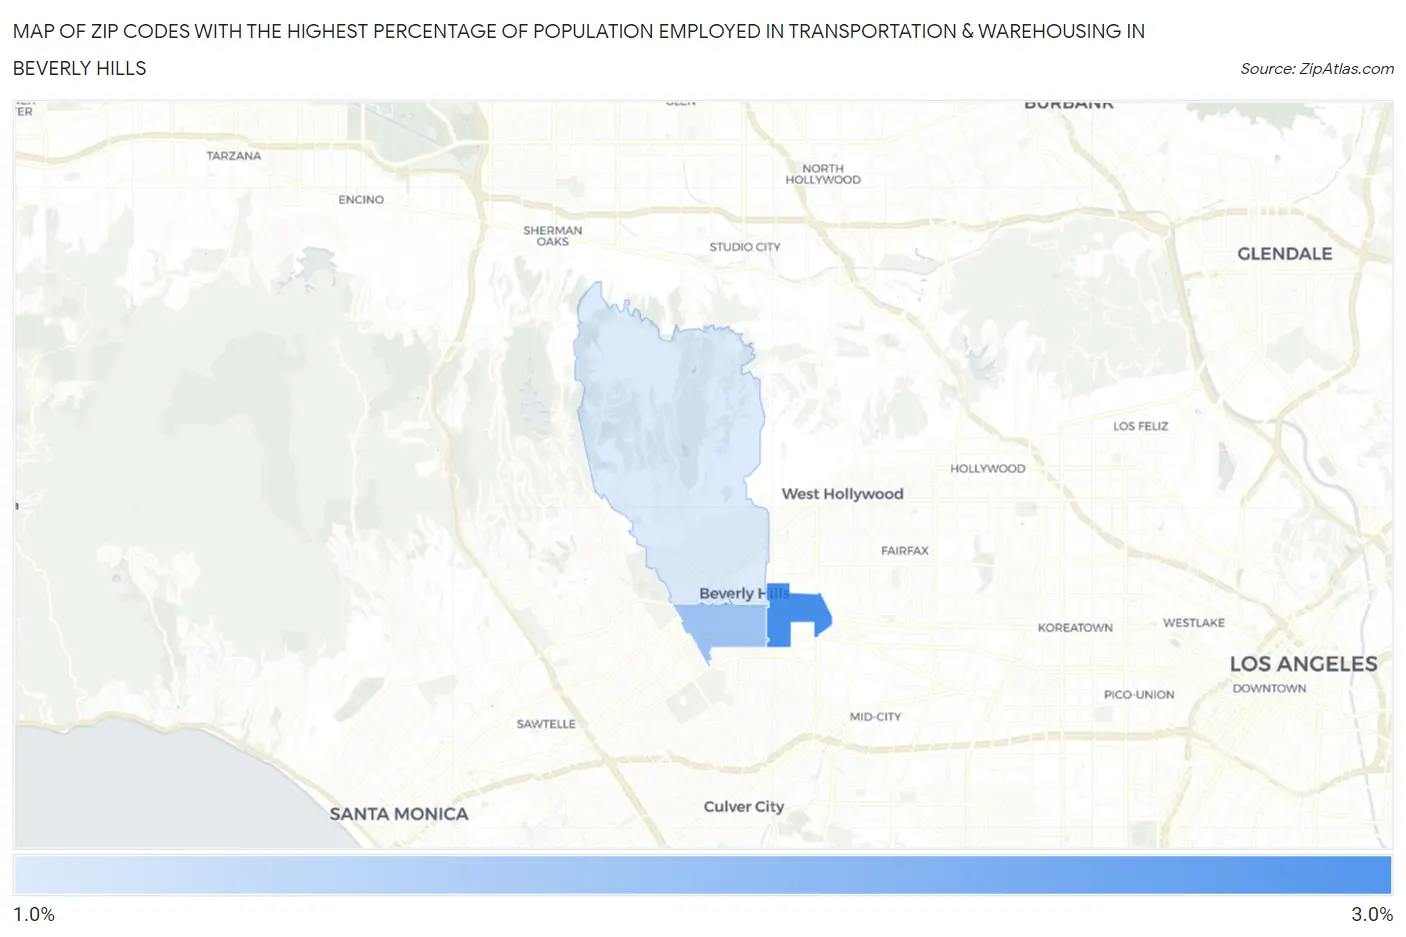
Map of Zip Codes with the Highest Percentage of Population Employed in Transportation & Warehousing in Beverly Hills
0.0%
3.0%
Zip Codes with the Highest Percentage of Population Employed in Transportation & Warehousing in Beverly Hills, CA
| Zip Code | % Employed | vs State | vs National | |
| 1. | 90211 | 2.5% | 5.1%(-2.59)#1,109 | 4.9%(-2.41)#22,228 |
| 2. | 90212 | 2.1% | 5.1%(-3.04)#1,226 | 4.9%(-2.86)#23,968 |
| 3. | 90210 | 1.8% | 5.1%(-3.36)#1,303 | 4.9%(-3.17)#25,044 |
1
Common Questions
What are the Top Zip Codes with the Highest Percentage of Population Employed in Transportation & Warehousing in Beverly Hills, CA?
Top Zip Codes with the Highest Percentage of Population Employed in Transportation & Warehousing in Beverly Hills, CA are:
What zip code has the Highest Percentage of Population Employed in Transportation & Warehousing in Beverly Hills, CA?
90211 has the Highest Percentage of Population Employed in Transportation & Warehousing in Beverly Hills, CA with 2.5%.
What is the Percentage of Population Employed in Transportation & Warehousing in Beverly Hills, CA?
Percentage of Population Employed in Transportation & Warehousing in Beverly Hills is 1.9%.
What is the Percentage of Population Employed in Transportation & Warehousing in California?
Percentage of Population Employed in Transportation & Warehousing in California is 5.1%.
What is the Percentage of Population Employed in Transportation & Warehousing in the United States?
Percentage of Population Employed in Transportation & Warehousing in the United States is 4.9%.