Banning, CA Map & Demographics
Banning Map
Banning Overview
$28,951
PER CAPITA INCOME
$57,407
AVG FAMILY INCOME
$54,083
AVG HOUSEHOLD INCOME
30.9%
WAGE / INCOME GAP [ % ]
69.1¢/ $1
WAGE / INCOME GAP [ $ ]
$10,632
FAMILY INCOME DEFICIT
0.46
INEQUALITY / GINI INDEX
29,929
TOTAL POPULATION
14,642
MALE POPULATION
15,287
FEMALE POPULATION
95.78
MALES / 100 FEMALES
104.41
FEMALES / 100 MALES
42.8
MEDIAN AGE
3.3
AVG FAMILY SIZE
2.7
AVG HOUSEHOLD SIZE
11,447
LABOR FORCE [ PEOPLE ]
48.4%
PERCENT IN LABOR FORCE
8.4%
UNEMPLOYMENT RATE
Banning Zip Codes
Banning Area Codes
Income in Banning
Income Overview in Banning
Per Capita Income in Banning is $28,951, while median incomes of families and households are $57,407 and $54,083 respectively.
| Characteristic | Number | Measure |
| Per Capita Income | 29,929 | $28,951 |
| Median Family Income | 7,550 | $57,407 |
| Mean Family Income | 7,550 | $76,855 |
| Median Household Income | 11,069 | $54,083 |
| Mean Household Income | 11,069 | $74,861 |
| Income Deficit | 7,550 | $10,632 |
| Wage / Income Gap (%) | 29,929 | 30.88% |
| Wage / Income Gap ($) | 29,929 | 69.12¢ per $1 |
| Gini / Inequality Index | 29,929 | 0.46 |
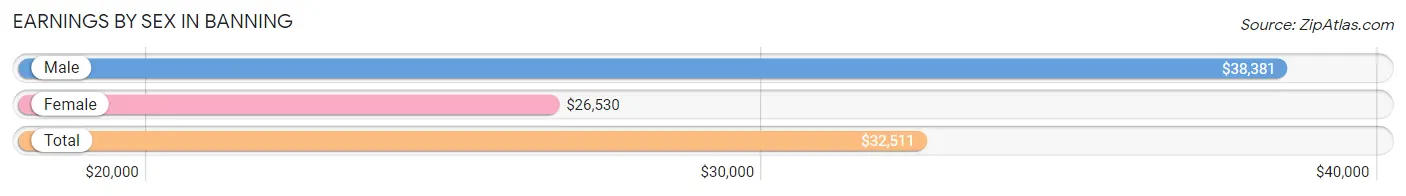
Earnings by Sex in Banning
Average Earnings in Banning are $32,511, $38,381 for men and $26,530 for women, a difference of 30.9%.
| Sex | Number | Average Earnings |
| Male | 6,069 (52.1%) | $38,381 |
| Female | 5,580 (47.9%) | $26,530 |
| Total | 11,649 (100.0%) | $32,511 |
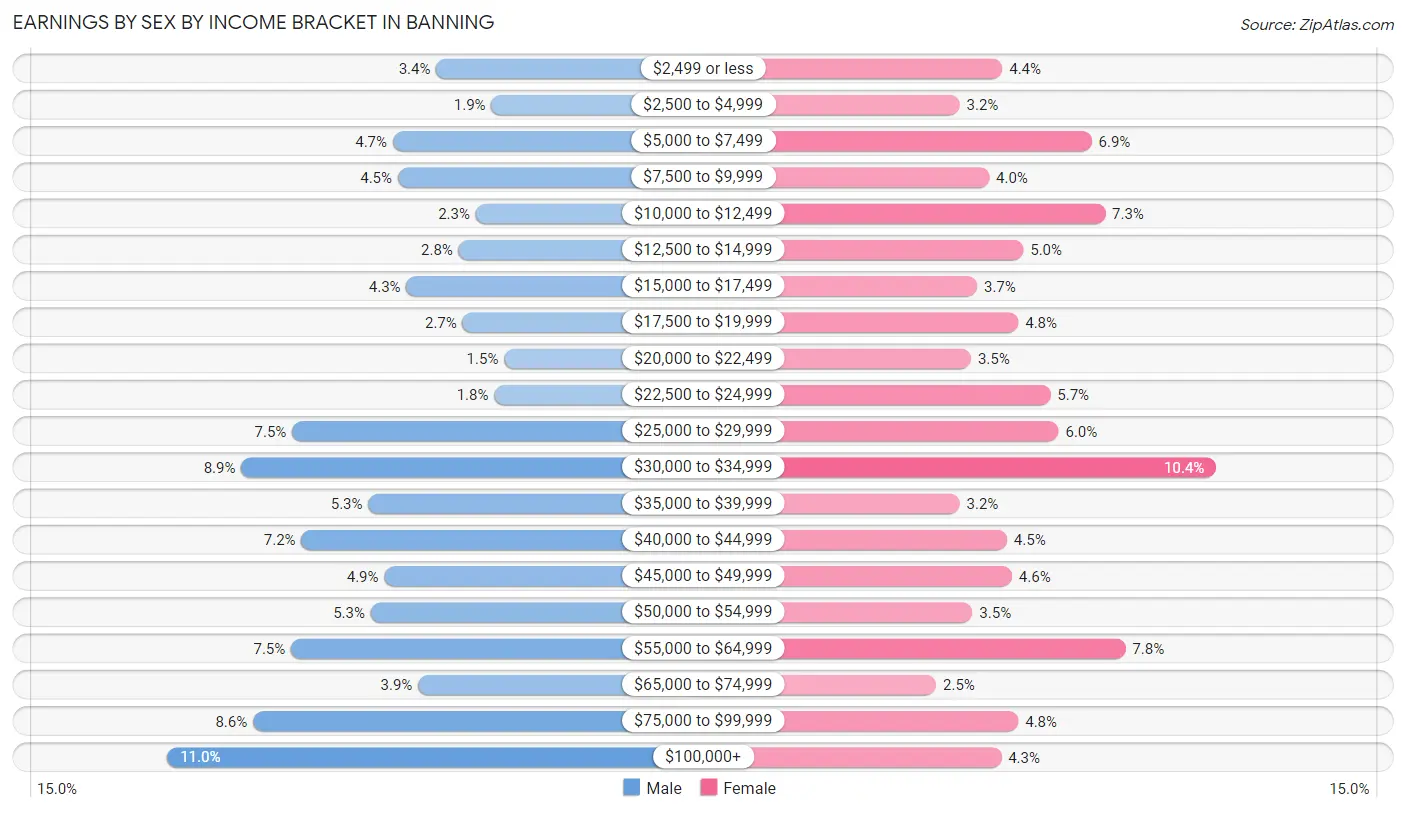
Earnings by Sex by Income Bracket in Banning
The most common earnings brackets in Banning are $100,000+ for men (667 | 11.0%) and $30,000 to $34,999 for women (579 | 10.4%).
| Income | Male | Female |
| $2,499 or less | 208 (3.4%) | 244 (4.4%) |
| $2,500 to $4,999 | 114 (1.9%) | 177 (3.2%) |
| $5,000 to $7,499 | 282 (4.6%) | 384 (6.9%) |
| $7,500 to $9,999 | 274 (4.5%) | 223 (4.0%) |
| $10,000 to $12,499 | 141 (2.3%) | 405 (7.3%) |
| $12,500 to $14,999 | 170 (2.8%) | 277 (5.0%) |
| $15,000 to $17,499 | 259 (4.3%) | 204 (3.7%) |
| $17,500 to $19,999 | 163 (2.7%) | 269 (4.8%) |
| $20,000 to $22,499 | 92 (1.5%) | 195 (3.5%) |
| $22,500 to $24,999 | 109 (1.8%) | 319 (5.7%) |
| $25,000 to $29,999 | 454 (7.5%) | 332 (5.9%) |
| $30,000 to $34,999 | 541 (8.9%) | 579 (10.4%) |
| $35,000 to $39,999 | 324 (5.3%) | 177 (3.2%) |
| $40,000 to $44,999 | 438 (7.2%) | 251 (4.5%) |
| $45,000 to $49,999 | 297 (4.9%) | 259 (4.6%) |
| $50,000 to $54,999 | 320 (5.3%) | 197 (3.5%) |
| $55,000 to $64,999 | 456 (7.5%) | 437 (7.8%) |
| $65,000 to $74,999 | 239 (3.9%) | 140 (2.5%) |
| $75,000 to $99,999 | 521 (8.6%) | 269 (4.8%) |
| $100,000+ | 667 (11.0%) | 242 (4.3%) |
| Total | 6,069 (100.0%) | 5,580 (100.0%) |
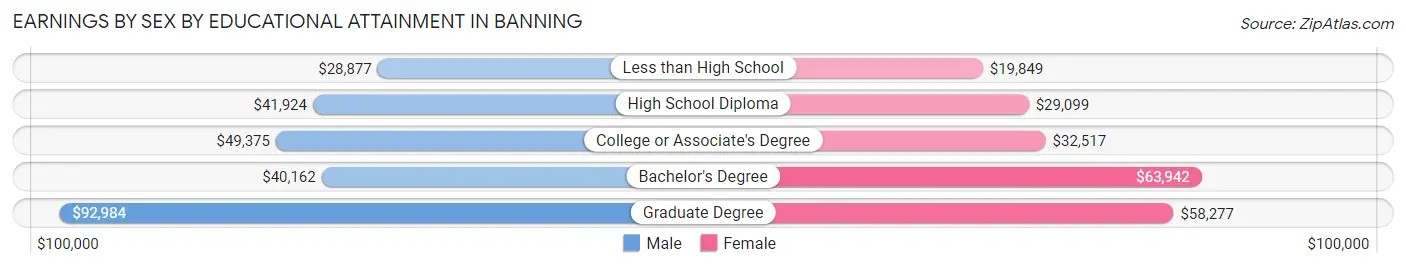
Earnings by Sex by Educational Attainment in Banning
Average earnings in Banning are $42,007 for men and $31,006 for women, a difference of 26.2%. Men with an educational attainment of graduate degree enjoy the highest average annual earnings of $92,984, while those with less than high school education earn the least with $28,877. Women with an educational attainment of bachelor's degree earn the most with the average annual earnings of $63,942, while those with less than high school education have the smallest earnings of $19,849.
| Educational Attainment | Male Income | Female Income |
| Less than High School | $28,877 | $19,849 |
| High School Diploma | $41,924 | $29,099 |
| College or Associate's Degree | $49,375 | $32,517 |
| Bachelor's Degree | $40,162 | $63,942 |
| Graduate Degree | $92,984 | $58,277 |
| Total | $42,007 | $31,006 |
Family Income in Banning
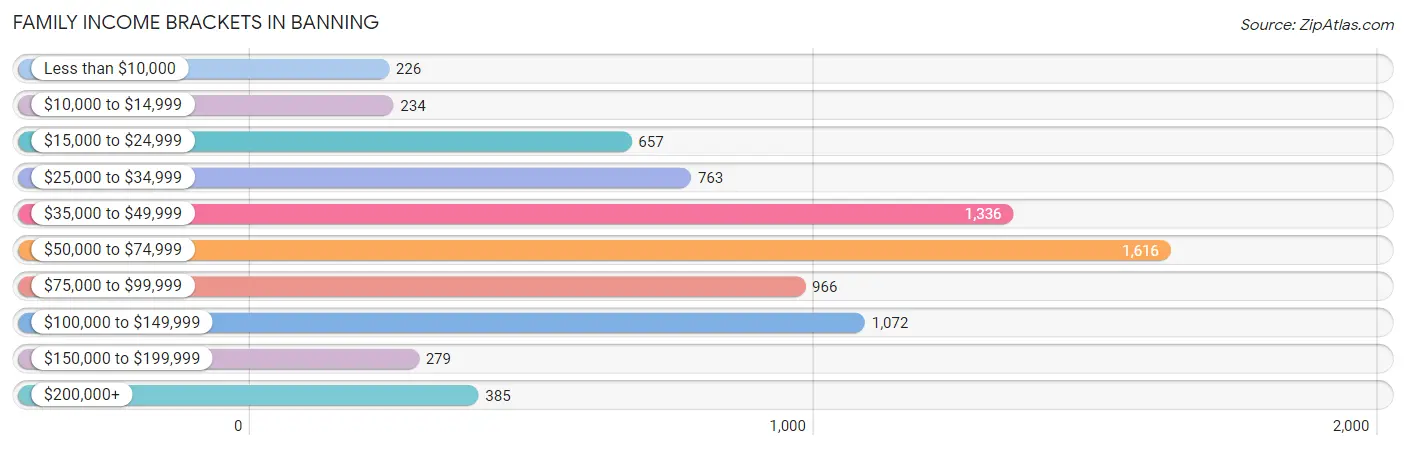
Family Income Brackets in Banning
According to the Banning family income data, there are 1,616 families falling into the $50,000 to $74,999 income range, which is the most common income bracket and makes up 21.4% of all families. Conversely, the less than $10,000 income bracket is the least frequent group with only 226 families (3.0%) belonging to this category.
| Income Bracket | # Families | % Families |
| Less than $10,000 | 226 | 3.0% |
| $10,000 to $14,999 | 234 | 3.1% |
| $15,000 to $24,999 | 657 | 8.7% |
| $25,000 to $34,999 | 763 | 10.1% |
| $35,000 to $49,999 | 1,336 | 17.7% |
| $50,000 to $74,999 | 1,616 | 21.4% |
| $75,000 to $99,999 | 966 | 12.8% |
| $100,000 to $149,999 | 1,072 | 14.2% |
| $150,000 to $199,999 | 279 | 3.7% |
| $200,000+ | 385 | 5.1% |
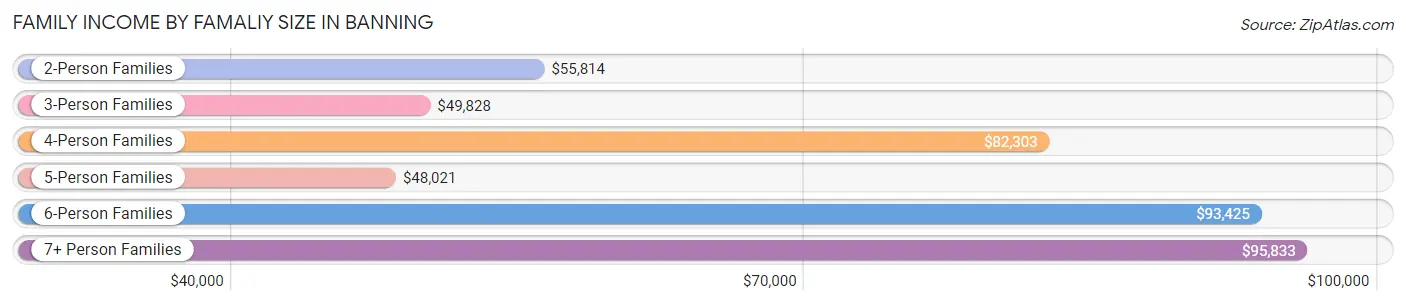
Family Income by Famaliy Size in Banning
7+ person families (194 | 2.6%) account for the highest median family income in Banning with $95,833 per family, while 2-person families (3,685 | 48.8%) have the highest median income of $27,907 per family member.
| Income Bracket | # Families | Median Income |
| 2-Person Families | 3,685 (48.8%) | $55,814 |
| 3-Person Families | 1,481 (19.6%) | $49,828 |
| 4-Person Families | 1,331 (17.6%) | $82,303 |
| 5-Person Families | 544 (7.2%) | $48,021 |
| 6-Person Families | 315 (4.2%) | $93,425 |
| 7+ Person Families | 194 (2.6%) | $95,833 |
| Total | 7,550 (100.0%) | $57,407 |
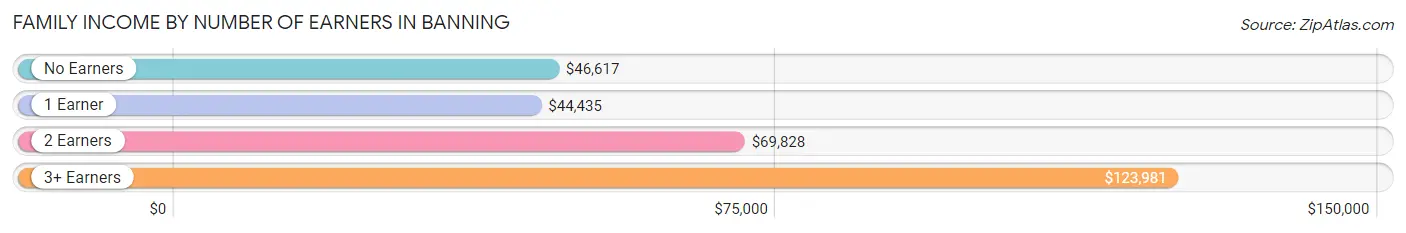
Family Income by Number of Earners in Banning
The median family income in Banning is $57,407, with families comprising 3+ earners (752) having the highest median family income of $123,981, while families with 1 earner (2,430) have the lowest median family income of $44,435, accounting for 10.0% and 32.2% of families, respectively.
| Number of Earners | # Families | Median Income |
| No Earners | 2,424 (32.1%) | $46,617 |
| 1 Earner | 2,430 (32.2%) | $44,435 |
| 2 Earners | 1,944 (25.8%) | $69,828 |
| 3+ Earners | 752 (10.0%) | $123,981 |
| Total | 7,550 (100.0%) | $57,407 |
Household Income in Banning
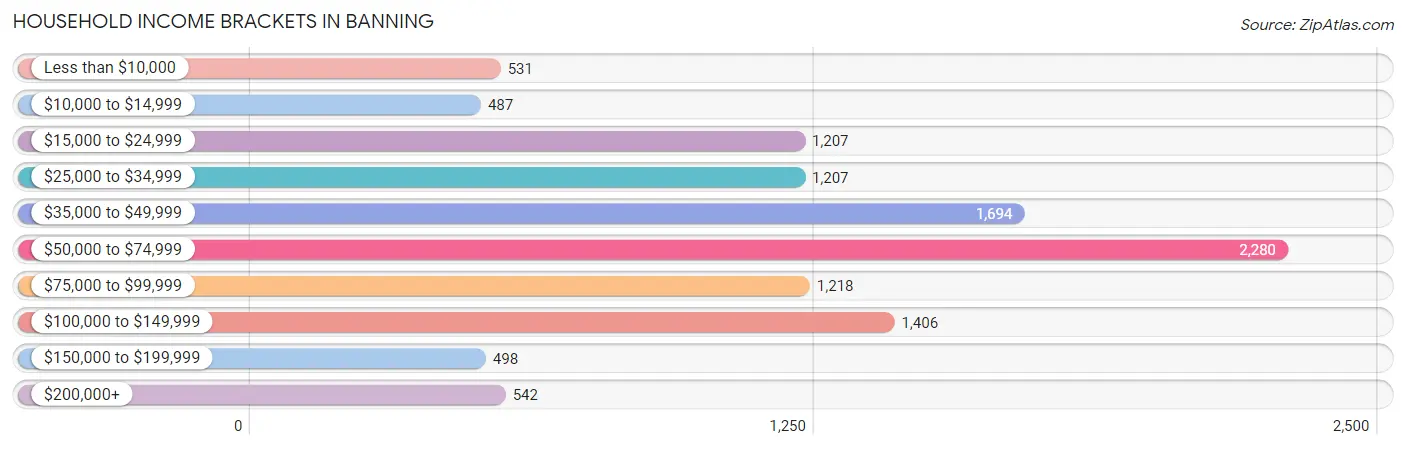
Household Income Brackets in Banning
With 2,280 households falling in the category, the $50,000 to $74,999 income range is the most frequent in Banning, accounting for 20.6% of all households. In contrast, only 487 households (4.4%) fall into the $10,000 to $14,999 income bracket, making it the least populous group.
| Income Bracket | # Households | % Households |
| Less than $10,000 | 531 | 4.8% |
| $10,000 to $14,999 | 487 | 4.4% |
| $15,000 to $24,999 | 1,207 | 10.9% |
| $25,000 to $34,999 | 1,207 | 10.9% |
| $35,000 to $49,999 | 1,694 | 15.3% |
| $50,000 to $74,999 | 2,280 | 20.6% |
| $75,000 to $99,999 | 1,218 | 11.0% |
| $100,000 to $149,999 | 1,406 | 12.7% |
| $150,000 to $199,999 | 498 | 4.5% |
| $200,000+ | 542 | 4.9% |
Household Income by Householder Age in Banning
The median household income in Banning is $54,083, with the highest median household income of $63,986 found in the 25 to 44 years age bracket for the primary householder. A total of 2,486 households (22.5%) fall into this category. Meanwhile, the 65+ years age bracket for the primary householder has the lowest median household income of $46,753, with 5,149 households (46.5%) in this group.
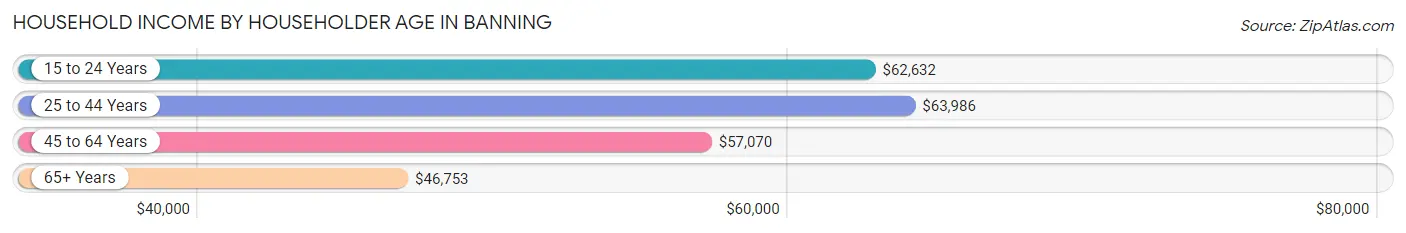
| Income Bracket | # Households | Median Income |
| 15 to 24 Years | 110 (1.0%) | $62,632 |
| 25 to 44 Years | 2,486 (22.5%) | $63,986 |
| 45 to 64 Years | 3,324 (30.0%) | $57,070 |
| 65+ Years | 5,149 (46.5%) | $46,753 |
| Total | 11,069 (100.0%) | $54,083 |
Poverty in Banning
Income Below Poverty by Sex and Age in Banning
With 18.9% poverty level for males and 18.9% for females among the residents of Banning, 15 year old males and 12 to 14 year old females are the most vulnerable to poverty, with 119 males (62.3%) and 241 females (38.4%) in their respective age groups living below the poverty level.
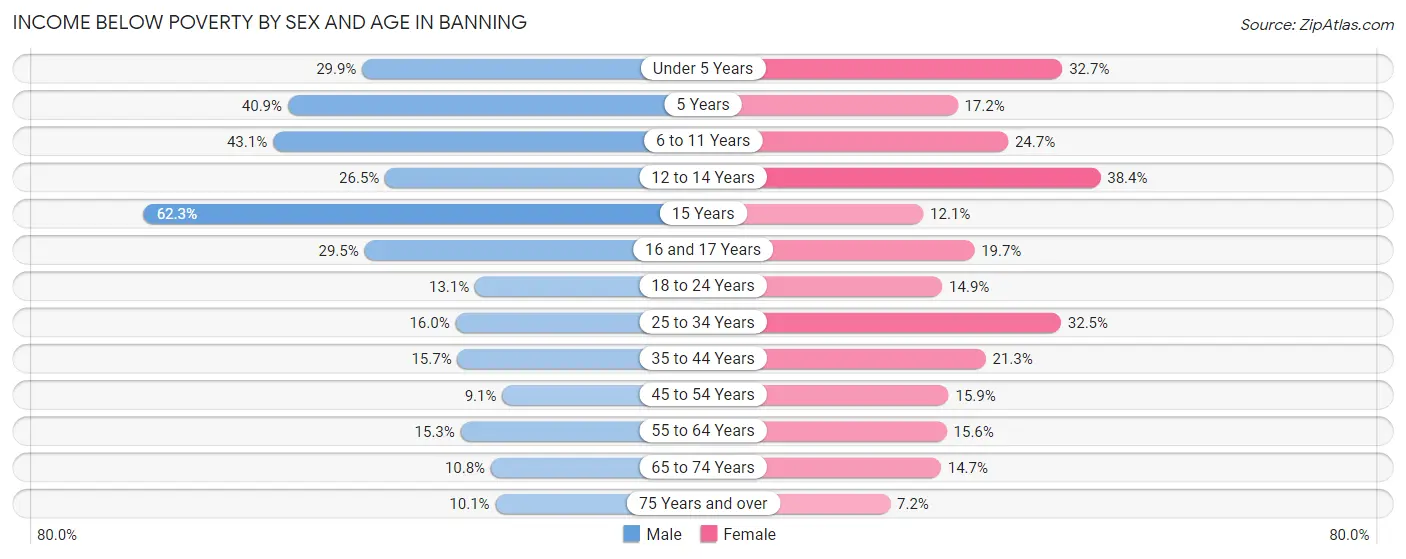
| Age Bracket | Male | Female |
| Under 5 Years | 290 (29.9%) | 273 (32.7%) |
| 5 Years | 63 (40.9%) | 39 (17.2%) |
| 6 to 11 Years | 592 (43.1%) | 228 (24.7%) |
| 12 to 14 Years | 200 (26.5%) | 241 (38.4%) |
| 15 Years | 119 (62.3%) | 25 (12.1%) |
| 16 and 17 Years | 116 (29.5%) | 58 (19.7%) |
| 18 to 24 Years | 143 (13.1%) | 157 (14.9%) |
| 25 to 34 Years | 258 (16.0%) | 580 (32.5%) |
| 35 to 44 Years | 252 (15.7%) | 326 (21.3%) |
| 45 to 54 Years | 142 (9.1%) | 205 (15.9%) |
| 55 to 64 Years | 214 (15.3%) | 267 (15.6%) |
| 65 to 74 Years | 173 (10.7%) | 256 (14.7%) |
| 75 Years and over | 182 (10.1%) | 212 (7.2%) |
| Total | 2,744 (18.9%) | 2,867 (18.9%) |
Income Above Poverty by Sex and Age in Banning
According to the poverty statistics in Banning, males aged 45 to 54 years and females aged 75 years and over are the age groups that are most secure financially, with 90.9% of males and 92.8% of females in these age groups living above the poverty line.
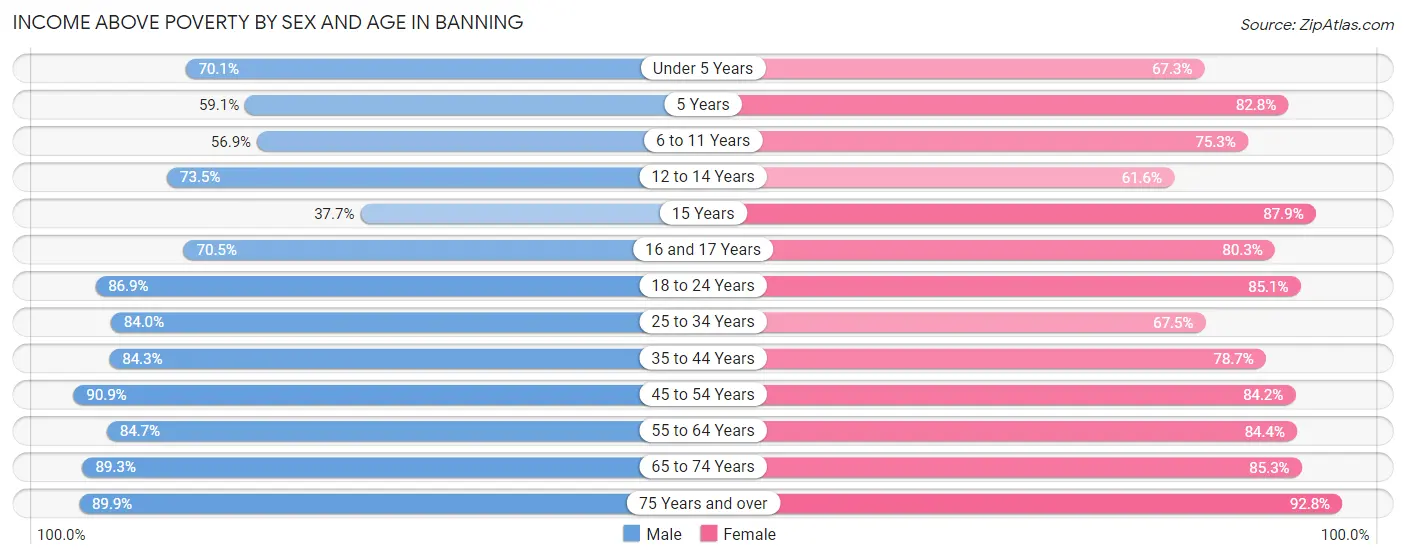
| Age Bracket | Male | Female |
| Under 5 Years | 681 (70.1%) | 561 (67.3%) |
| 5 Years | 91 (59.1%) | 188 (82.8%) |
| 6 to 11 Years | 781 (56.9%) | 696 (75.3%) |
| 12 to 14 Years | 556 (73.5%) | 387 (61.6%) |
| 15 Years | 72 (37.7%) | 182 (87.9%) |
| 16 and 17 Years | 277 (70.5%) | 237 (80.3%) |
| 18 to 24 Years | 948 (86.9%) | 897 (85.1%) |
| 25 to 34 Years | 1,352 (84.0%) | 1,203 (67.5%) |
| 35 to 44 Years | 1,351 (84.3%) | 1,202 (78.7%) |
| 45 to 54 Years | 1,423 (90.9%) | 1,088 (84.2%) |
| 55 to 64 Years | 1,188 (84.7%) | 1,449 (84.4%) |
| 65 to 74 Years | 1,437 (89.2%) | 1,485 (85.3%) |
| 75 Years and over | 1,621 (89.9%) | 2,745 (92.8%) |
| Total | 11,778 (81.1%) | 12,320 (81.1%) |
Income Below Poverty Among Married-Couple Families in Banning
The poverty statistics for married-couple families in Banning show that 8.4% or 409 of the total 4,863 families live below the poverty line. Families with 3 or 4 children have the highest poverty rate of 21.9%, comprising of 88 families. On the other hand, families with 5 or more children have the lowest poverty rate of 0.0%, which includes 0 families.
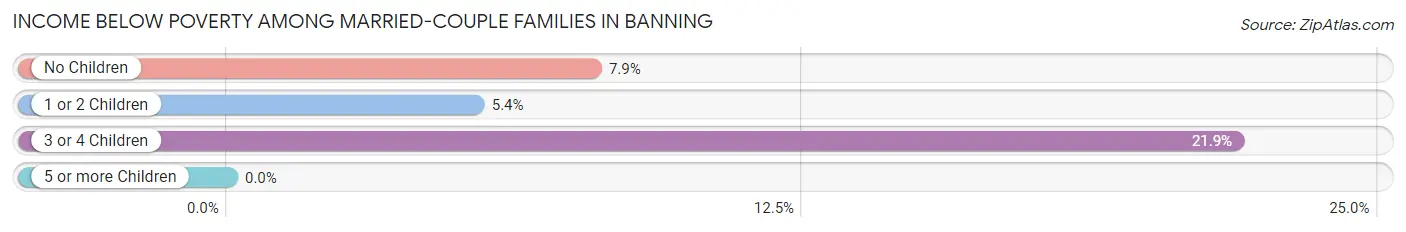
| Children | Above Poverty | Below Poverty |
| No Children | 3,000 (92.1%) | 258 (7.9%) |
| 1 or 2 Children | 1,110 (94.6%) | 63 (5.4%) |
| 3 or 4 Children | 314 (78.1%) | 88 (21.9%) |
| 5 or more Children | 30 (100.0%) | 0 (0.0%) |
| Total | 4,454 (91.6%) | 409 (8.4%) |
Income Below Poverty Among Single-Parent Households in Banning
According to the poverty data in Banning, 21.3% or 193 single-father households and 30.0% or 535 single-mother households are living below the poverty line. Among single-father households, those with 1 or 2 children have the highest poverty rate, with 172 households (39.6%) experiencing poverty. Likewise, among single-mother households, those with 5 or more children have the highest poverty rate, with 29 households (100.0%) falling below the poverty line.
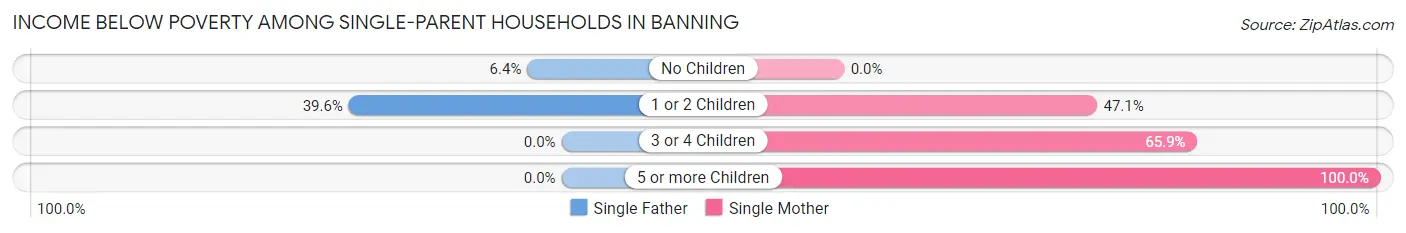
| Children | Single Father | Single Mother |
| No Children | 21 (6.4%) | 0 (0.0%) |
| 1 or 2 Children | 172 (39.6%) | 309 (47.1%) |
| 3 or 4 Children | 0 (0.0%) | 197 (65.9%) |
| 5 or more Children | 0 (0.0%) | 29 (100.0%) |
| Total | 193 (21.3%) | 535 (30.0%) |
Income Below Poverty Among Married-Couple vs Single-Parent Households in Banning
The poverty data for Banning shows that 409 of the married-couple family households (8.4%) and 728 of the single-parent households (27.1%) are living below the poverty level. Within the married-couple family households, those with 3 or 4 children have the highest poverty rate, with 88 households (21.9%) falling below the poverty line. Among the single-parent households, those with 5 or more children have the highest poverty rate, with 29 household (93.5%) living below poverty.
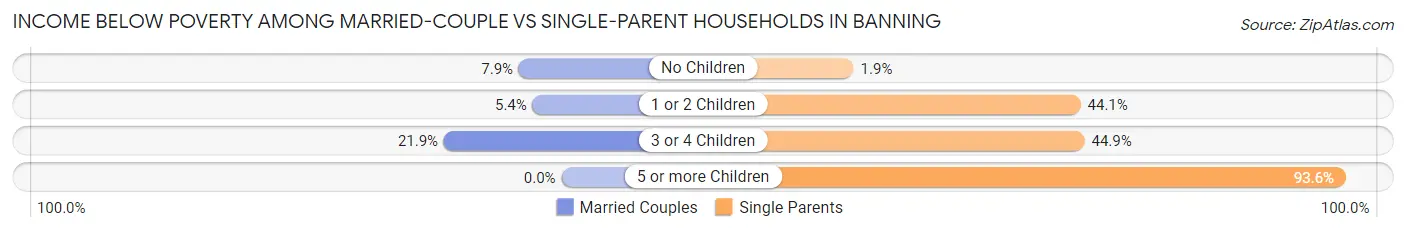
| Children | Married-Couple Families | Single-Parent Households |
| No Children | 258 (7.9%) | 21 (1.9%) |
| 1 or 2 Children | 63 (5.4%) | 481 (44.1%) |
| 3 or 4 Children | 88 (21.9%) | 197 (44.9%) |
| 5 or more Children | 0 (0.0%) | 29 (93.5%) |
| Total | 409 (8.4%) | 728 (27.1%) |
Race in Banning
The most populous races in Banning are Hispanic or Latino (14,708 | 49.1%), White / Caucasian (14,591 | 48.7%), and Some other Race (5,765 | 19.3%).
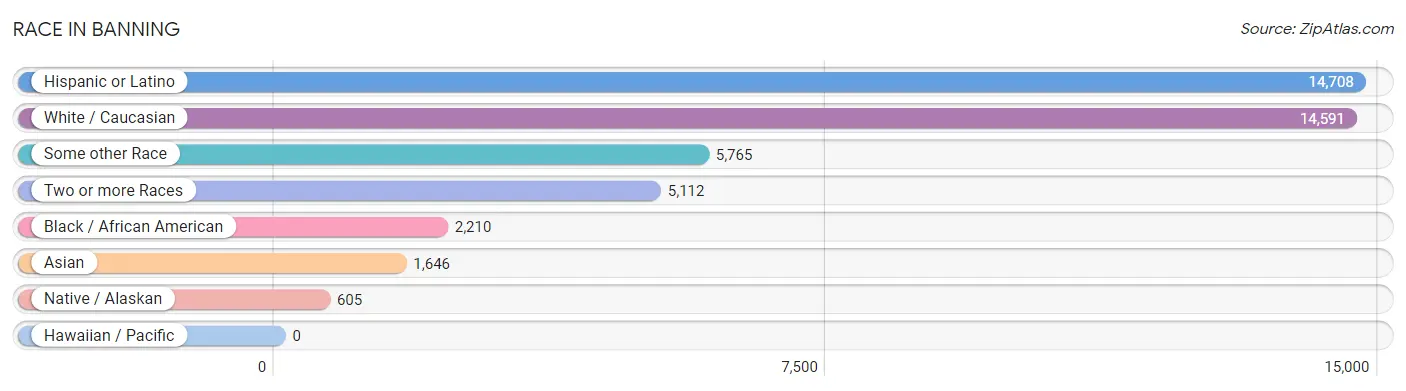
| Race | # Population | % Population |
| Asian | 1,646 | 5.5% |
| Black / African American | 2,210 | 7.4% |
| Hawaiian / Pacific | 0 | 0.0% |
| Hispanic or Latino | 14,708 | 49.1% |
| Native / Alaskan | 605 | 2.0% |
| White / Caucasian | 14,591 | 48.7% |
| Two or more Races | 5,112 | 17.1% |
| Some other Race | 5,765 | 19.3% |
| Total | 29,929 | 100.0% |
Ancestry in Banning
The most populous ancestries reported in Banning are Mexican (13,721 | 45.9%), English (2,570 | 8.6%), German (2,257 | 7.5%), Irish (1,709 | 5.7%), and Italian (875 | 2.9%), together accounting for 70.6% of all Banning residents.
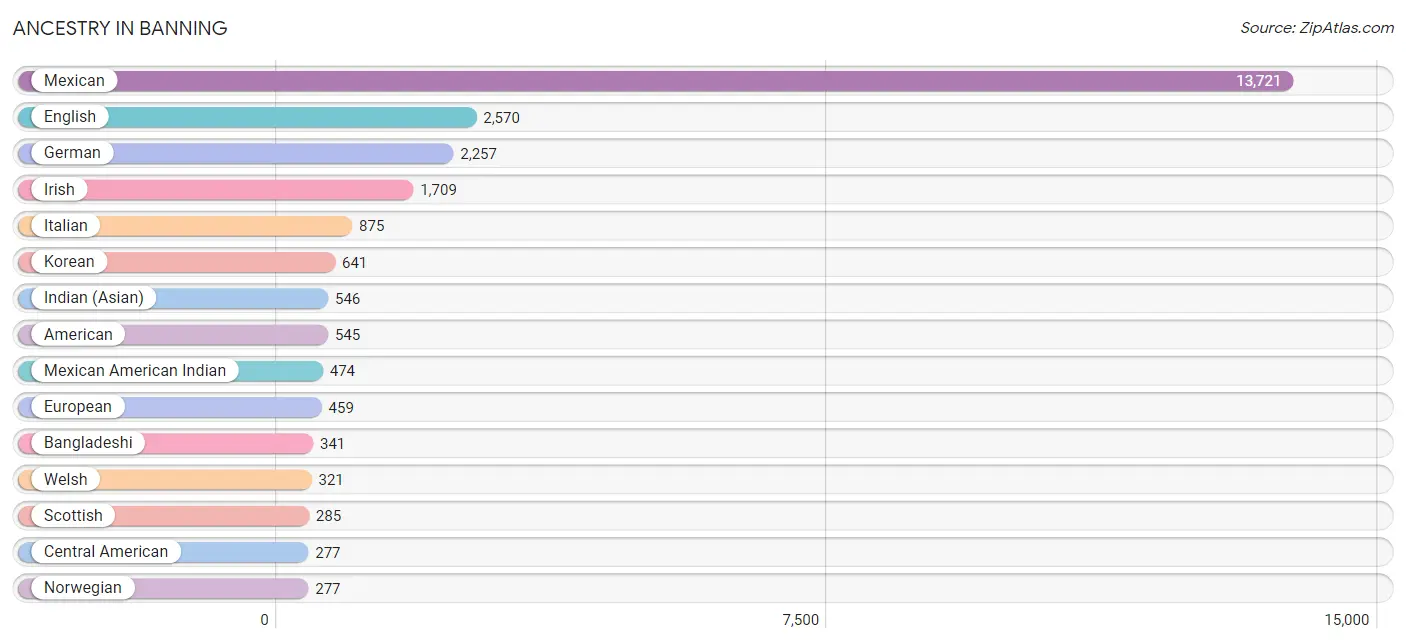
| Ancestry | # Population | % Population |
| African | 97 | 0.3% |
| American | 545 | 1.8% |
| Apache | 20 | 0.1% |
| Arab | 14 | 0.1% |
| Argentinean | 13 | 0.0% |
| Austrian | 34 | 0.1% |
| Bangladeshi | 341 | 1.1% |
| Basque | 30 | 0.1% |
| Belizean | 7 | 0.0% |
| Bhutanese | 81 | 0.3% |
| Blackfeet | 5 | 0.0% |
| British | 109 | 0.4% |
| Burmese | 122 | 0.4% |
| Canadian | 91 | 0.3% |
| Central American | 277 | 0.9% |
| Central American Indian | 140 | 0.5% |
| Cherokee | 52 | 0.2% |
| Chippewa | 6 | 0.0% |
| Choctaw | 25 | 0.1% |
| Colombian | 59 | 0.2% |
| Croatian | 35 | 0.1% |
| Cuban | 51 | 0.2% |
| Czech | 33 | 0.1% |
| Czechoslovakian | 15 | 0.1% |
| Danish | 53 | 0.2% |
| Dominican | 43 | 0.1% |
| Dutch | 158 | 0.5% |
| Eastern European | 39 | 0.1% |
| Egyptian | 7 | 0.0% |
| English | 2,570 | 8.6% |
| European | 459 | 1.5% |
| Filipino | 15 | 0.1% |
| Finnish | 8 | 0.0% |
| French | 269 | 0.9% |
| French Canadian | 21 | 0.1% |
| German | 2,257 | 7.5% |
| Greek | 105 | 0.4% |
| Guatemalan | 38 | 0.1% |
| Hungarian | 140 | 0.5% |
| Indian (Asian) | 546 | 1.8% |
| Iranian | 6 | 0.0% |
| Irish | 1,709 | 5.7% |
| Iroquois | 6 | 0.0% |
| Italian | 875 | 2.9% |
| Jamaican | 70 | 0.2% |
| Korean | 641 | 2.1% |
| Laotian | 7 | 0.0% |
| Lithuanian | 32 | 0.1% |
| Malaysian | 61 | 0.2% |
| Mexican | 13,721 | 45.9% |
| Mexican American Indian | 474 | 1.6% |
| Nicaraguan | 5 | 0.0% |
| Nigerian | 32 | 0.1% |
| Northern European | 43 | 0.1% |
| Norwegian | 277 | 0.9% |
| Ottawa | 2 | 0.0% |
| Pakistani | 9 | 0.0% |
| Palestinian | 7 | 0.0% |
| Pima | 17 | 0.1% |
| Polish | 238 | 0.8% |
| Portuguese | 130 | 0.4% |
| Pueblo | 43 | 0.1% |
| Puerto Rican | 228 | 0.8% |
| Russian | 151 | 0.5% |
| Salvadoran | 201 | 0.7% |
| Scandinavian | 198 | 0.7% |
| Scotch-Irish | 265 | 0.9% |
| Scottish | 285 | 0.9% |
| Slovak | 23 | 0.1% |
| South African | 15 | 0.1% |
| South American | 72 | 0.2% |
| Spaniard | 78 | 0.3% |
| Spanish | 105 | 0.4% |
| Sri Lankan | 83 | 0.3% |
| Subsaharan African | 144 | 0.5% |
| Swedish | 139 | 0.5% |
| Swiss | 33 | 0.1% |
| Ute | 6 | 0.0% |
| Welsh | 321 | 1.1% |
| Yaqui | 27 | 0.1% |
| Yugoslavian | 31 | 0.1% | View All 81 Rows |
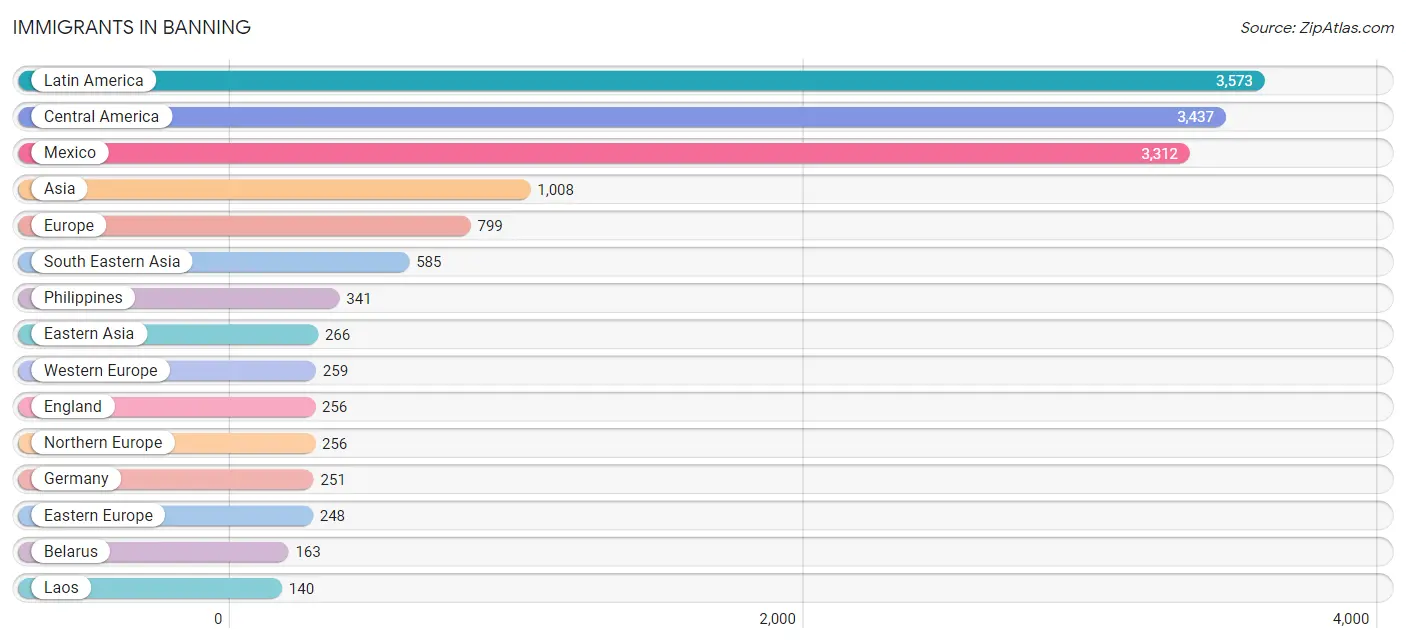
Immigrants in Banning
The most numerous immigrant groups reported in Banning came from Latin America (3,573 | 11.9%), Central America (3,437 | 11.5%), Mexico (3,312 | 11.1%), Asia (1,008 | 3.4%), and Europe (799 | 2.7%), together accounting for 40.5% of all Banning residents.
| Immigration Origin | # Population | % Population |
| Africa | 87 | 0.3% |
| Argentina | 41 | 0.1% |
| Asia | 1,008 | 3.4% |
| Belarus | 163 | 0.5% |
| Belize | 7 | 0.0% |
| Canada | 50 | 0.2% |
| Caribbean | 15 | 0.1% |
| Central America | 3,437 | 11.5% |
| China | 118 | 0.4% |
| Colombia | 80 | 0.3% |
| Croatia | 31 | 0.1% |
| Cuba | 4 | 0.0% |
| Eastern Asia | 266 | 0.9% |
| Eastern Europe | 248 | 0.8% |
| Egypt | 7 | 0.0% |
| El Salvador | 42 | 0.1% |
| England | 256 | 0.9% |
| Europe | 799 | 2.7% |
| France | 8 | 0.0% |
| Germany | 251 | 0.8% |
| Greece | 16 | 0.1% |
| Guatemala | 43 | 0.1% |
| Honduras | 33 | 0.1% |
| Hungary | 54 | 0.2% |
| India | 22 | 0.1% |
| Jamaica | 11 | 0.0% |
| Japan | 29 | 0.1% |
| Korea | 119 | 0.4% |
| Laos | 140 | 0.5% |
| Latin America | 3,573 | 11.9% |
| Mexico | 3,312 | 11.1% |
| Nigeria | 65 | 0.2% |
| Northern Africa | 7 | 0.0% |
| Northern Europe | 256 | 0.9% |
| Pakistan | 86 | 0.3% |
| Philippines | 341 | 1.1% |
| Portugal | 20 | 0.1% |
| South Africa | 15 | 0.1% |
| South America | 121 | 0.4% |
| South Central Asia | 108 | 0.4% |
| South Eastern Asia | 585 | 1.9% |
| Southern Europe | 36 | 0.1% |
| Taiwan | 54 | 0.2% |
| Thailand | 29 | 0.1% |
| Vietnam | 75 | 0.3% |
| Western Africa | 65 | 0.2% |
| Western Europe | 259 | 0.9% | View All 47 Rows |
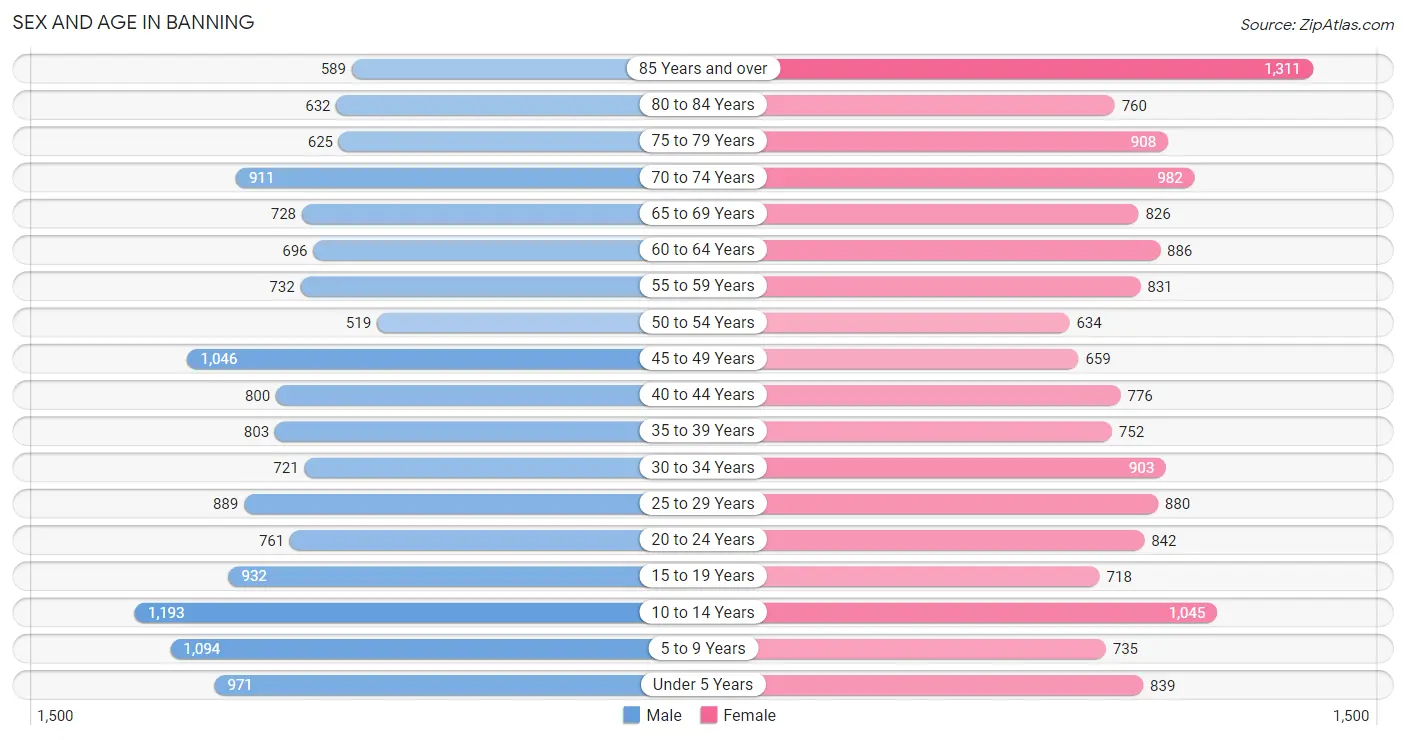
Sex and Age in Banning
Sex and Age in Banning
The most populous age groups in Banning are 10 to 14 Years (1,193 | 8.2%) for men and 85 Years and over (1,311 | 8.6%) for women.
| Age Bracket | Male | Female |
| Under 5 Years | 971 (6.6%) | 839 (5.5%) |
| 5 to 9 Years | 1,094 (7.5%) | 735 (4.8%) |
| 10 to 14 Years | 1,193 (8.2%) | 1,045 (6.8%) |
| 15 to 19 Years | 932 (6.4%) | 718 (4.7%) |
| 20 to 24 Years | 761 (5.2%) | 842 (5.5%) |
| 25 to 29 Years | 889 (6.1%) | 880 (5.8%) |
| 30 to 34 Years | 721 (4.9%) | 903 (5.9%) |
| 35 to 39 Years | 803 (5.5%) | 752 (4.9%) |
| 40 to 44 Years | 800 (5.5%) | 776 (5.1%) |
| 45 to 49 Years | 1,046 (7.1%) | 659 (4.3%) |
| 50 to 54 Years | 519 (3.5%) | 634 (4.2%) |
| 55 to 59 Years | 732 (5.0%) | 831 (5.4%) |
| 60 to 64 Years | 696 (4.8%) | 886 (5.8%) |
| 65 to 69 Years | 728 (5.0%) | 826 (5.4%) |
| 70 to 74 Years | 911 (6.2%) | 982 (6.4%) |
| 75 to 79 Years | 625 (4.3%) | 908 (5.9%) |
| 80 to 84 Years | 632 (4.3%) | 760 (5.0%) |
| 85 Years and over | 589 (4.0%) | 1,311 (8.6%) |
| Total | 14,642 (100.0%) | 15,287 (100.0%) |
Families and Households in Banning
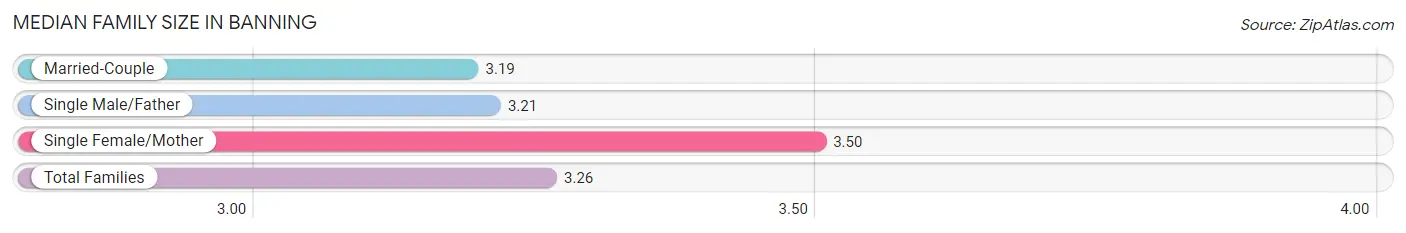
Median Family Size in Banning
The median family size in Banning is 3.26 persons per family, with single female/mother families (1,782 | 23.6%) accounting for the largest median family size of 3.5 persons per family. On the other hand, married-couple families (4,863 | 64.4%) represent the smallest median family size with 3.19 persons per family.
| Family Type | # Families | Family Size |
| Married-Couple | 4,863 (64.4%) | 3.19 |
| Single Male/Father | 905 (12.0%) | 3.21 |
| Single Female/Mother | 1,782 (23.6%) | 3.50 |
| Total Families | 7,550 (100.0%) | 3.26 |
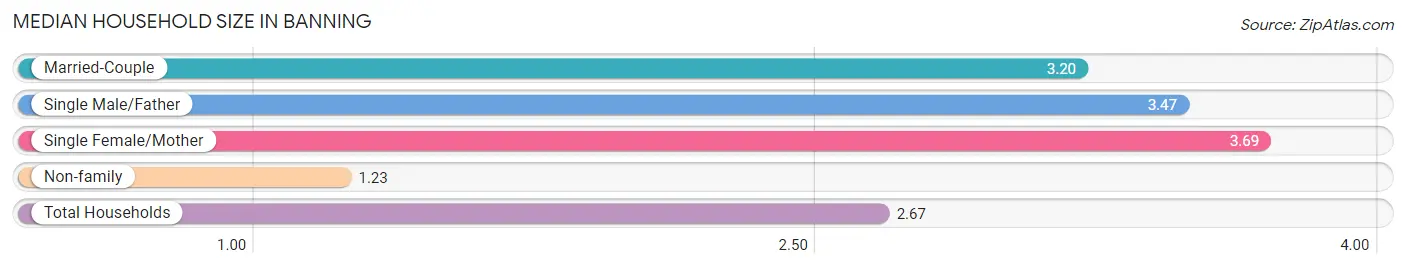
Median Household Size in Banning
The median household size in Banning is 2.67 persons per household, with single female/mother households (1,782 | 16.1%) accounting for the largest median household size of 3.69 persons per household. non-family households (3,519 | 31.8%) represent the smallest median household size with 1.23 persons per household.
| Household Type | # Households | Household Size |
| Married-Couple | 4,863 (43.9%) | 3.20 |
| Single Male/Father | 905 (8.2%) | 3.47 |
| Single Female/Mother | 1,782 (16.1%) | 3.69 |
| Non-family | 3,519 (31.8%) | 1.23 |
| Total Households | 11,069 (100.0%) | 2.67 |
Household Size by Marriage Status in Banning
Out of a total of 11,069 households in Banning, 7,550 (68.2%) are family households, while 3,519 (31.8%) are nonfamily households. The most numerous type of family households are 2-person households, comprising 3,570, and the most common type of nonfamily households are 1-person households, comprising 2,889.
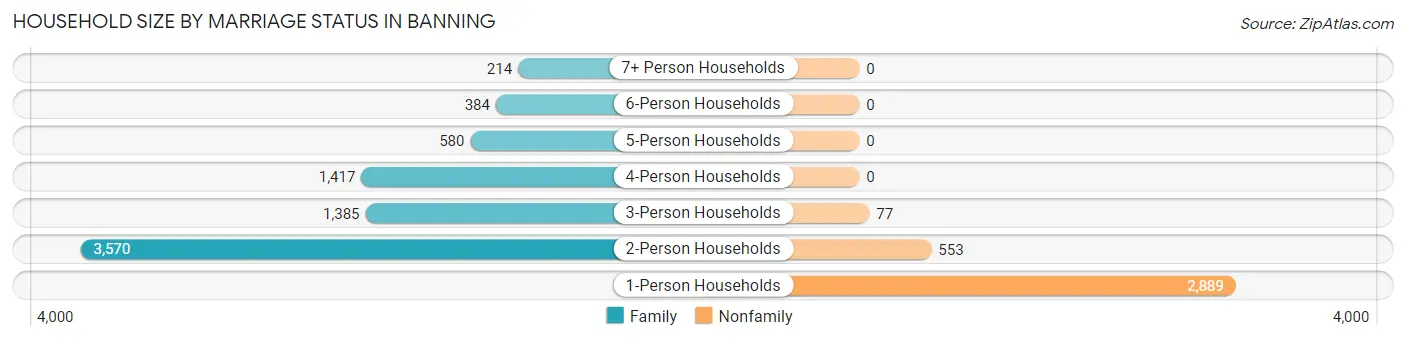
| Household Size | Family Households | Nonfamily Households |
| 1-Person Households | - | 2,889 (26.1%) |
| 2-Person Households | 3,570 (32.3%) | 553 (5.0%) |
| 3-Person Households | 1,385 (12.5%) | 77 (0.7%) |
| 4-Person Households | 1,417 (12.8%) | 0 (0.0%) |
| 5-Person Households | 580 (5.2%) | 0 (0.0%) |
| 6-Person Households | 384 (3.5%) | 0 (0.0%) |
| 7+ Person Households | 214 (1.9%) | 0 (0.0%) |
| Total | 7,550 (68.2%) | 3,519 (31.8%) |
Female Fertility in Banning
Fertility by Age in Banning
Average fertility rate in Banning is 103.0 births per 1,000 women. Women in the age bracket of 20 to 34 years have the highest fertility rate with 193.0 births per 1,000 women. Women in the age bracket of 20 to 34 years acount for 87.7% of all women with births.
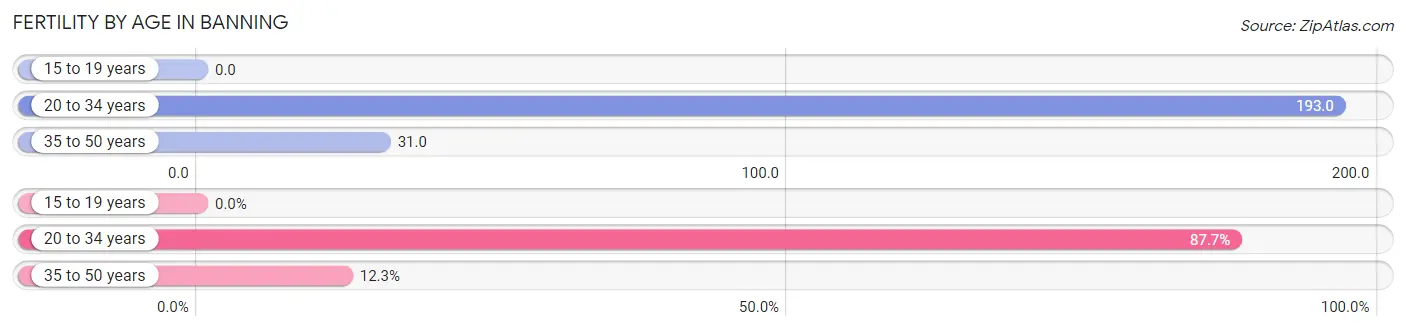
| Age Bracket | Women with Births | Births / 1,000 Women |
| 15 to 19 years | 0 (0.0%) | 0.0 |
| 20 to 34 years | 507 (87.7%) | 193.0 |
| 35 to 50 years | 71 (12.3%) | 31.0 |
| Total | 578 (100.0%) | 103.0 |
Fertility by Age by Marriage Status in Banning
58.3% of women with births (578) in Banning are married. The highest percentage of unmarried women with births falls into 20 to 34 years age bracket with 47.5% of them unmarried at the time of birth, while the lowest percentage of unmarried women with births belong to 35 to 50 years age bracket with 0.0% of them unmarried.
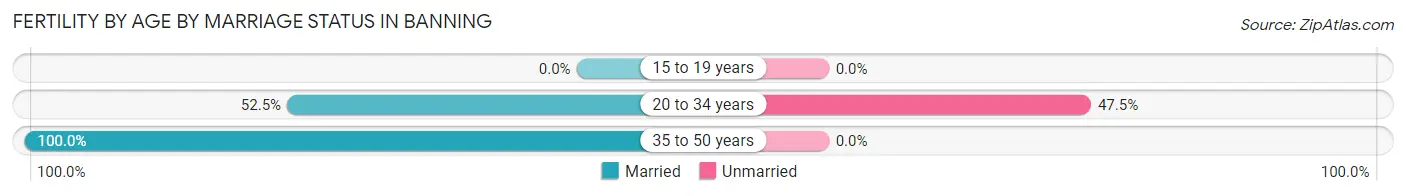
| Age Bracket | Married | Unmarried |
| 15 to 19 years | 0 (0.0%) | 0 (0.0%) |
| 20 to 34 years | 266 (52.5%) | 241 (47.5%) |
| 35 to 50 years | 71 (100.0%) | 0 (0.0%) |
| Total | 337 (58.3%) | 241 (41.7%) |
Fertility by Education in Banning
Average fertility rate in Banning is 103.0 births per 1,000 women. Women with the education attainment of bachelor's degree have the highest fertility rate of 154.0 births per 1,000 women, while women with the education attainment of less than high school have the lowest fertility at 9.0 births per 1,000 women. Women with the education attainment of college or associate's degree represent 51.9% of all women with births.
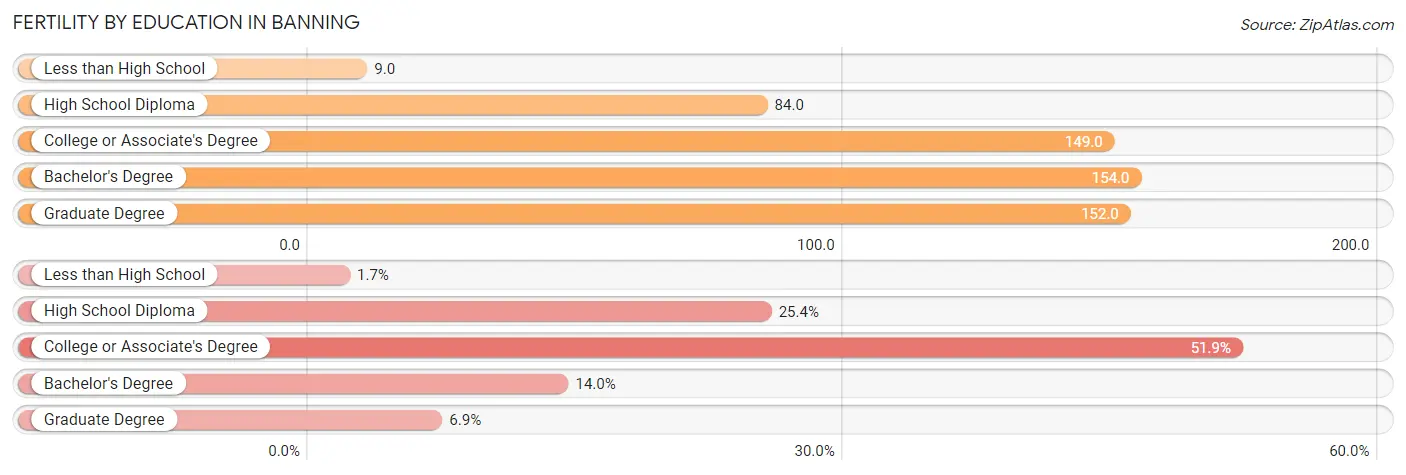
| Educational Attainment | Women with Births | Births / 1,000 Women |
| Less than High School | 10 (1.7%) | 9.0 |
| High School Diploma | 147 (25.4%) | 84.0 |
| College or Associate's Degree | 300 (51.9%) | 149.0 |
| Bachelor's Degree | 81 (14.0%) | 154.0 |
| Graduate Degree | 40 (6.9%) | 152.0 |
| Total | 578 (100.0%) | 103.0 |
Fertility by Education by Marriage Status in Banning
41.7% of women with births in Banning are unmarried. Women with the educational attainment of less than high school are most likely to be married with 100.0% of them married at childbirth, while women with the educational attainment of high school diploma are least likely to be married with 63.9% of them unmarried at childbirth.
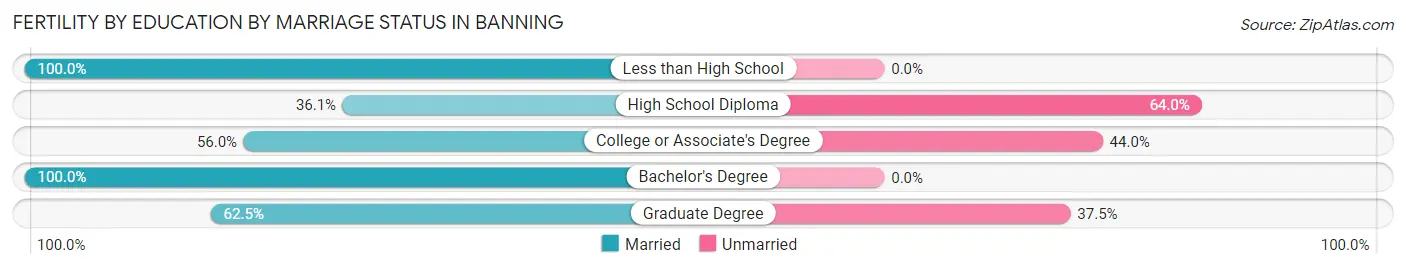
| Educational Attainment | Married | Unmarried |
| Less than High School | 10 (100.0%) | 0 (0.0%) |
| High School Diploma | 53 (36.0%) | 94 (63.9%) |
| College or Associate's Degree | 168 (56.0%) | 132 (44.0%) |
| Bachelor's Degree | 81 (100.0%) | 0 (0.0%) |
| Graduate Degree | 25 (62.5%) | 15 (37.5%) |
| Total | 337 (58.3%) | 241 (41.7%) |
Employment Characteristics in Banning
Employment by Class of Employer in Banning
Among the 10,329 employed individuals in Banning, private company employees (7,031 | 68.1%), local government employees (1,108 | 10.7%), and not-for-profit organizations (775 | 7.5%) make up the most common classes of employment.
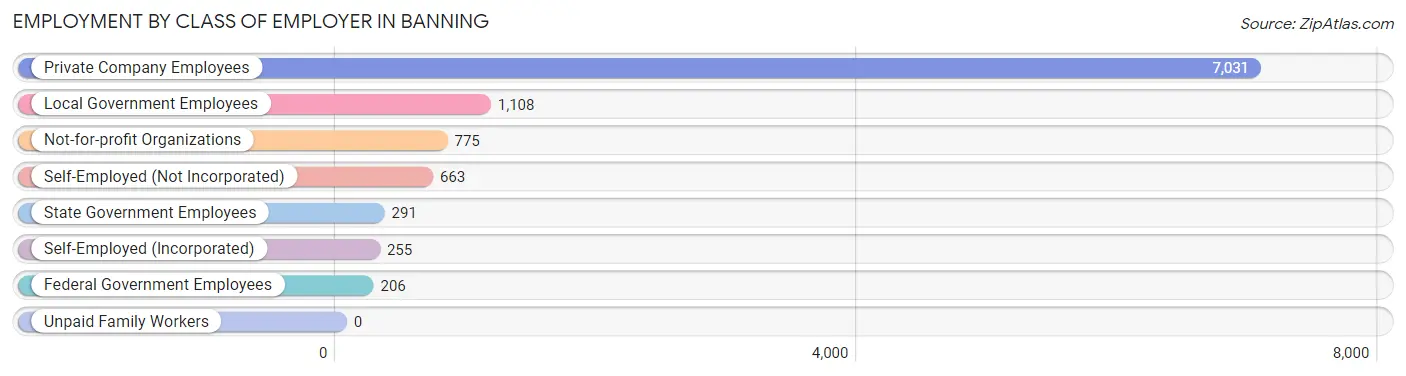
| Employer Class | # Employees | % Employees |
| Private Company Employees | 7,031 | 68.1% |
| Self-Employed (Incorporated) | 255 | 2.5% |
| Self-Employed (Not Incorporated) | 663 | 6.4% |
| Not-for-profit Organizations | 775 | 7.5% |
| Local Government Employees | 1,108 | 10.7% |
| State Government Employees | 291 | 2.8% |
| Federal Government Employees | 206 | 2.0% |
| Unpaid Family Workers | 0 | 0.0% |
| Total | 10,329 | 100.0% |
Employment Status by Age in Banning
According to the labor force statistics for Banning, out of the total population over 16 years of age (23,650), 48.4% or 11,447 individuals are in the labor force, with 8.4% or 962 of them unemployed. The age group with the highest labor force participation rate is 20 to 24 years, with 87.5% or 1,403 individuals in the labor force. Within the labor force, the 16 to 19 years age range has the highest percentage of unemployed individuals, with 29.8% or 131 of them being unemployed.
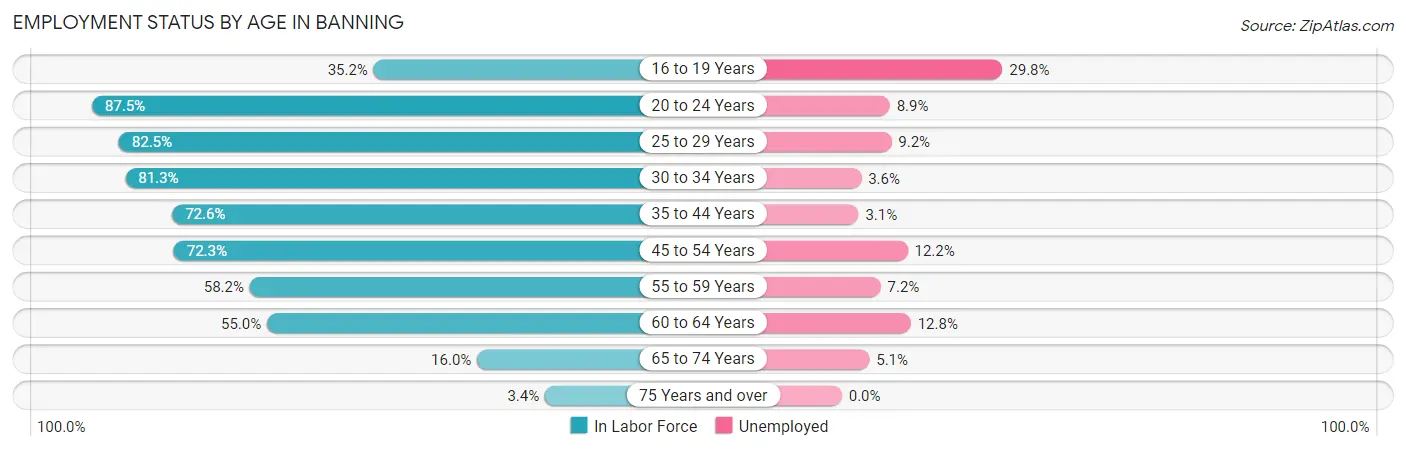
| Age Bracket | In Labor Force | Unemployed |
| 16 to 19 Years | 439 (35.2%) | 131 (29.8%) |
| 20 to 24 Years | 1,403 (87.5%) | 125 (8.9%) |
| 25 to 29 Years | 1,459 (82.5%) | 134 (9.2%) |
| 30 to 34 Years | 1,320 (81.3%) | 48 (3.6%) |
| 35 to 44 Years | 2,273 (72.6%) | 70 (3.1%) |
| 45 to 54 Years | 2,066 (72.3%) | 252 (12.2%) |
| 55 to 59 Years | 910 (58.2%) | 66 (7.2%) |
| 60 to 64 Years | 870 (55.0%) | 111 (12.8%) |
| 65 to 74 Years | 552 (16.0%) | 28 (5.1%) |
| 75 Years and over | 164 (3.4%) | 0 (0.0%) |
| Total | 11,447 (48.4%) | 962 (8.4%) |
Employment Status by Educational Attainment in Banning
According to labor force statistics for Banning, 71.0% of individuals (8,894) out of the total population between 25 and 64 years of age (12,527) are in the labor force, with 7.7% or 685 of them being unemployed. The group with the highest labor force participation rate are those with the educational attainment of bachelor's degree or higher, with 82.0% or 1,409 individuals in the labor force. Within the labor force, individuals with high school diploma education have the highest percentage of unemployment, with 10.6% or 317 of them being unemployed.
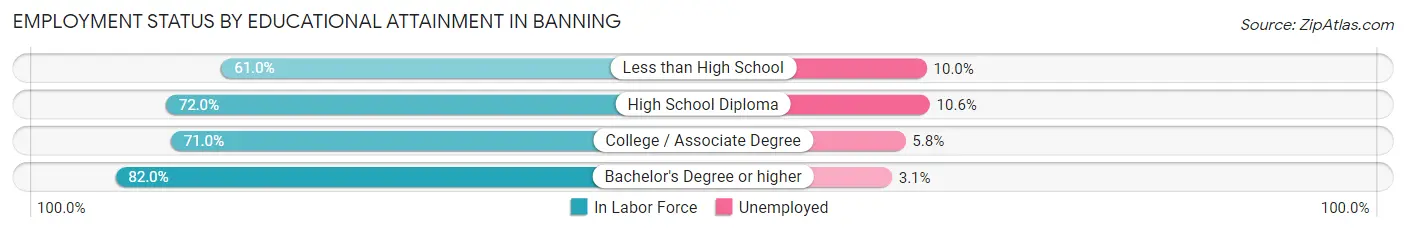
| Educational Attainment | In Labor Force | Unemployed |
| Less than High School | 1,389 (61.0%) | 228 (10.0%) |
| High School Diploma | 2,986 (72.0%) | 440 (10.6%) |
| College / Associate Degree | 3,113 (71.0%) | 254 (5.8%) |
| Bachelor's Degree or higher | 1,409 (82.0%) | 53 (3.1%) |
| Total | 8,894 (71.0%) | 965 (7.7%) |
Employment Occupations by Sex in Banning
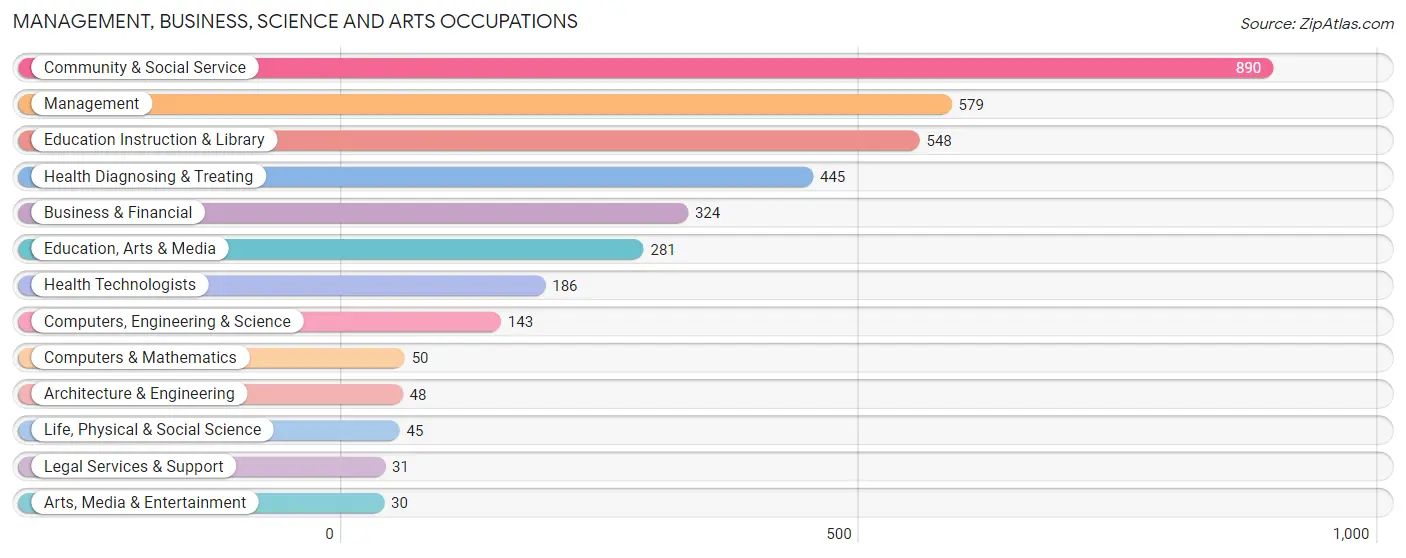
Management, Business, Science and Arts Occupations
The most common Management, Business, Science and Arts occupations in Banning are Community & Social Service (890 | 8.5%), Management (579 | 5.5%), Education Instruction & Library (548 | 5.2%), Health Diagnosing & Treating (445 | 4.3%), and Business & Financial (324 | 3.1%).
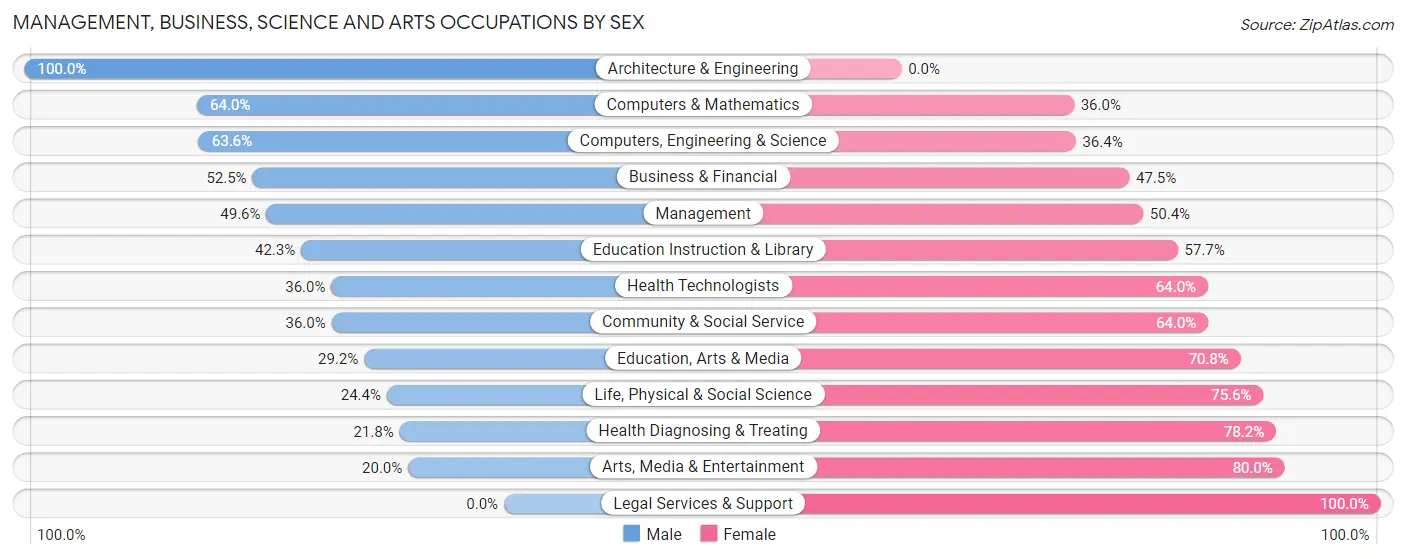
Management, Business, Science and Arts Occupations by Sex
Within the Management, Business, Science and Arts occupations in Banning, the most male-oriented occupations are Architecture & Engineering (100.0%), Computers & Mathematics (64.0%), and Computers, Engineering & Science (63.6%), while the most female-oriented occupations are Legal Services & Support (100.0%), Arts, Media & Entertainment (80.0%), and Health Diagnosing & Treating (78.2%).
| Occupation | Male | Female |
| Management | 287 (49.6%) | 292 (50.4%) |
| Business & Financial | 170 (52.5%) | 154 (47.5%) |
| Computers, Engineering & Science | 91 (63.6%) | 52 (36.4%) |
| Computers & Mathematics | 32 (64.0%) | 18 (36.0%) |
| Architecture & Engineering | 48 (100.0%) | 0 (0.0%) |
| Life, Physical & Social Science | 11 (24.4%) | 34 (75.6%) |
| Community & Social Service | 320 (36.0%) | 570 (64.0%) |
| Education, Arts & Media | 82 (29.2%) | 199 (70.8%) |
| Legal Services & Support | 0 (0.0%) | 31 (100.0%) |
| Education Instruction & Library | 232 (42.3%) | 316 (57.7%) |
| Arts, Media & Entertainment | 6 (20.0%) | 24 (80.0%) |
| Health Diagnosing & Treating | 97 (21.8%) | 348 (78.2%) |
| Health Technologists | 67 (36.0%) | 119 (64.0%) |
| Total (Category) | 965 (40.5%) | 1,416 (59.5%) |
| Total (Overall) | 5,531 (52.8%) | 4,949 (47.2%) |
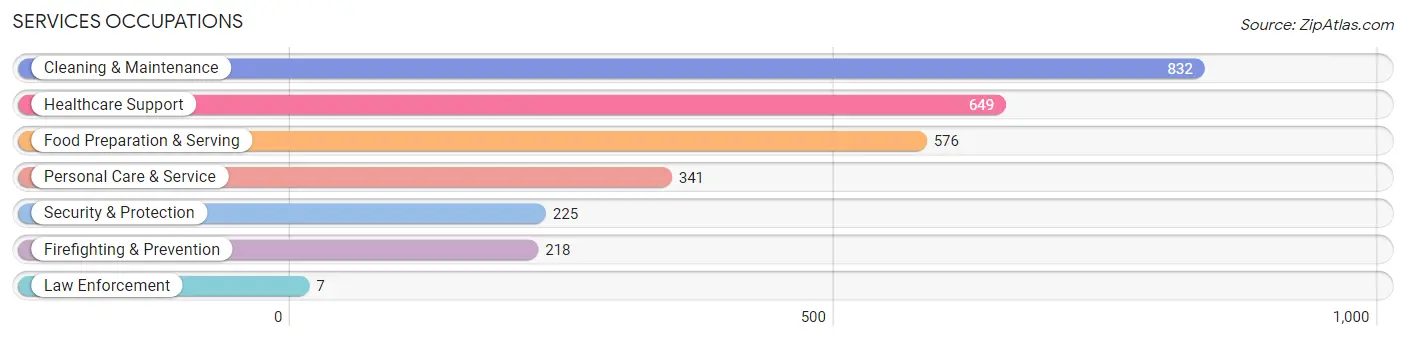
Services Occupations
The most common Services occupations in Banning are Cleaning & Maintenance (832 | 7.9%), Healthcare Support (649 | 6.2%), Food Preparation & Serving (576 | 5.5%), Personal Care & Service (341 | 3.3%), and Security & Protection (225 | 2.1%).
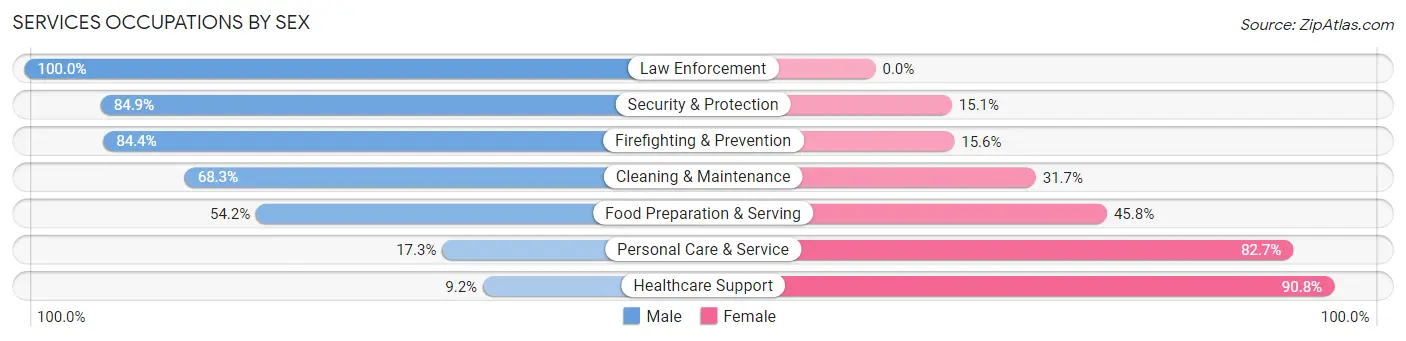
Services Occupations by Sex
Within the Services occupations in Banning, the most male-oriented occupations are Law Enforcement (100.0%), Security & Protection (84.9%), and Firefighting & Prevention (84.4%), while the most female-oriented occupations are Healthcare Support (90.8%), Personal Care & Service (82.7%), and Food Preparation & Serving (45.8%).
| Occupation | Male | Female |
| Healthcare Support | 60 (9.2%) | 589 (90.8%) |
| Security & Protection | 191 (84.9%) | 34 (15.1%) |
| Firefighting & Prevention | 184 (84.4%) | 34 (15.6%) |
| Law Enforcement | 7 (100.0%) | 0 (0.0%) |
| Food Preparation & Serving | 312 (54.2%) | 264 (45.8%) |
| Cleaning & Maintenance | 568 (68.3%) | 264 (31.7%) |
| Personal Care & Service | 59 (17.3%) | 282 (82.7%) |
| Total (Category) | 1,190 (45.4%) | 1,433 (54.6%) |
| Total (Overall) | 5,531 (52.8%) | 4,949 (47.2%) |
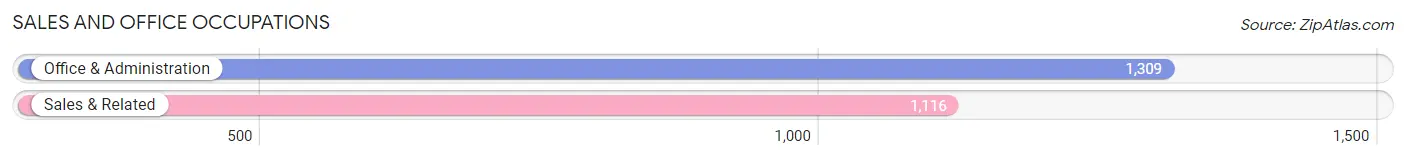
Sales and Office Occupations
The most common Sales and Office occupations in Banning are Office & Administration (1,309 | 12.5%), and Sales & Related (1,116 | 10.6%).
Sales and Office Occupations by Sex
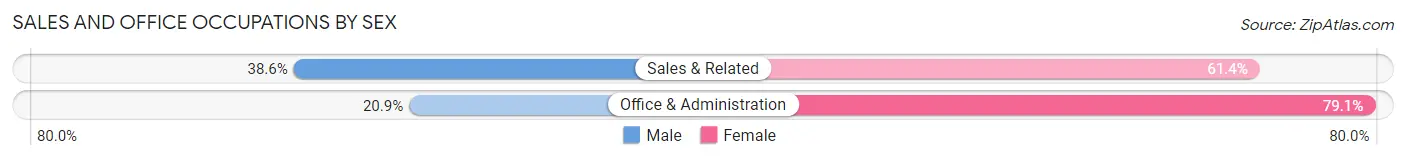
| Occupation | Male | Female |
| Sales & Related | 431 (38.6%) | 685 (61.4%) |
| Office & Administration | 273 (20.9%) | 1,036 (79.1%) |
| Total (Category) | 704 (29.0%) | 1,721 (71.0%) |
| Total (Overall) | 5,531 (52.8%) | 4,949 (47.2%) |
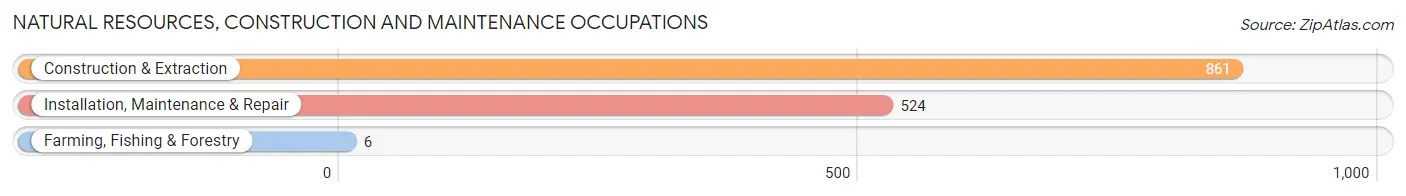
Natural Resources, Construction and Maintenance Occupations
The most common Natural Resources, Construction and Maintenance occupations in Banning are Construction & Extraction (861 | 8.2%), Installation, Maintenance & Repair (524 | 5.0%), and Farming, Fishing & Forestry (6 | 0.1%).
Natural Resources, Construction and Maintenance Occupations by Sex
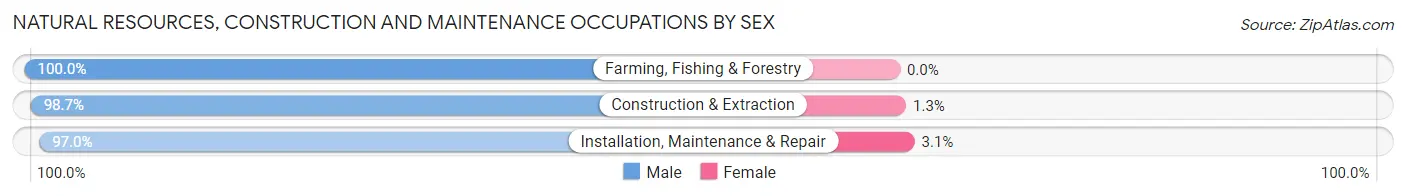
| Occupation | Male | Female |
| Farming, Fishing & Forestry | 6 (100.0%) | 0 (0.0%) |
| Construction & Extraction | 850 (98.7%) | 11 (1.3%) |
| Installation, Maintenance & Repair | 508 (97.0%) | 16 (3.0%) |
| Total (Category) | 1,364 (98.1%) | 27 (1.9%) |
| Total (Overall) | 5,531 (52.8%) | 4,949 (47.2%) |
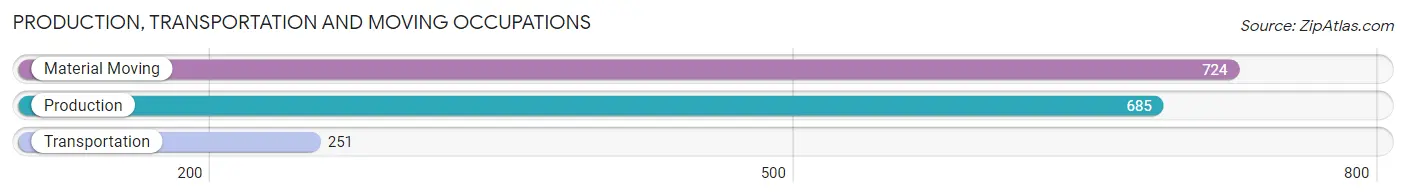
Production, Transportation and Moving Occupations
The most common Production, Transportation and Moving occupations in Banning are Material Moving (724 | 6.9%), Production (685 | 6.5%), and Transportation (251 | 2.4%).
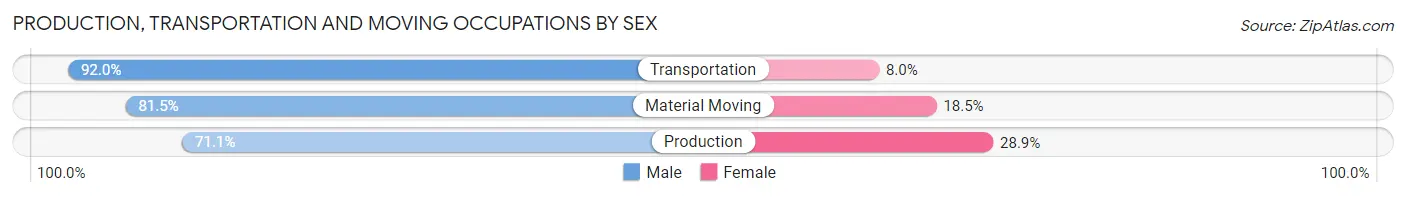
Production, Transportation and Moving Occupations by Sex
| Occupation | Male | Female |
| Production | 487 (71.1%) | 198 (28.9%) |
| Transportation | 231 (92.0%) | 20 (8.0%) |
| Material Moving | 590 (81.5%) | 134 (18.5%) |
| Total (Category) | 1,308 (78.8%) | 352 (21.2%) |
| Total (Overall) | 5,531 (52.8%) | 4,949 (47.2%) |
Employment Industries by Sex in Banning
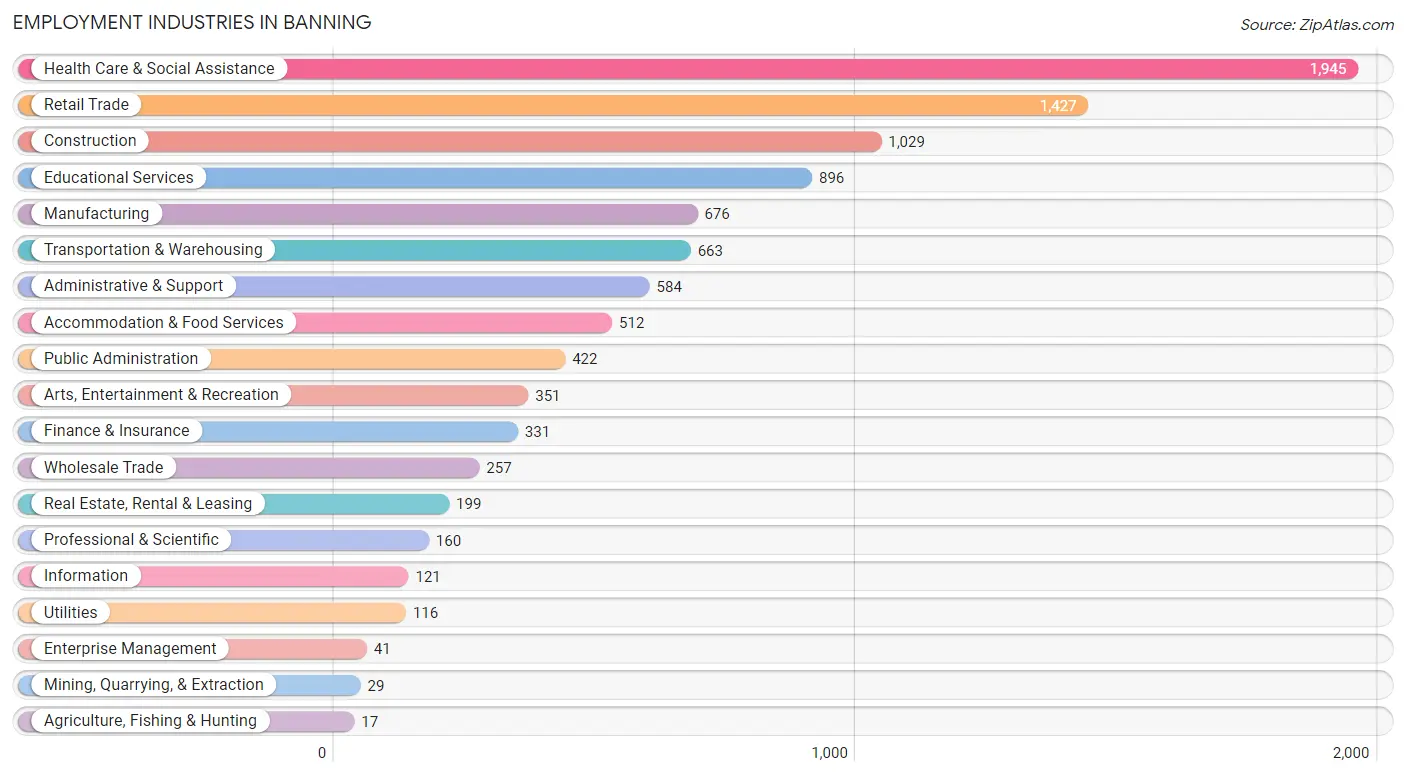
Employment Industries in Banning
The major employment industries in Banning include Health Care & Social Assistance (1,945 | 18.6%), Retail Trade (1,427 | 13.6%), Construction (1,029 | 9.8%), Educational Services (896 | 8.6%), and Manufacturing (676 | 6.5%).
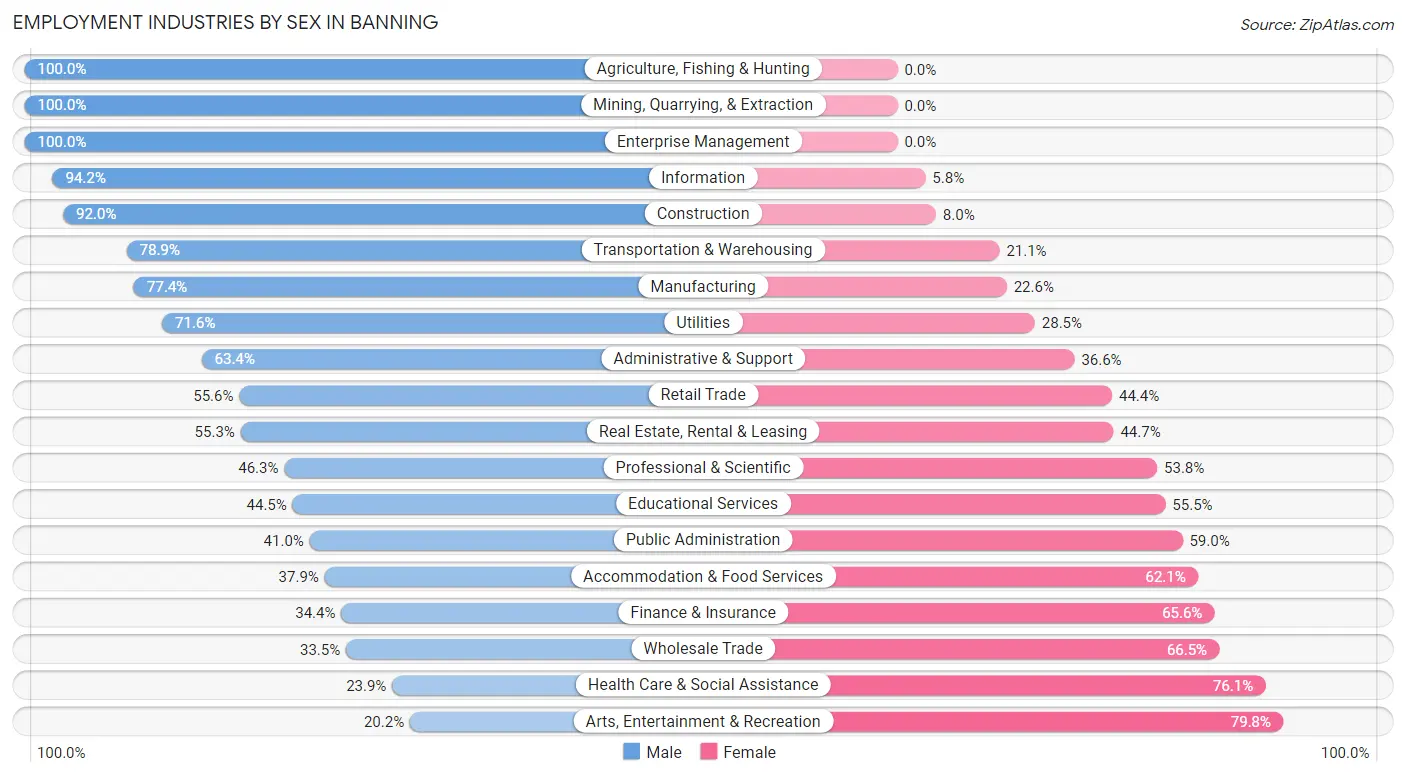
Employment Industries by Sex in Banning
The Banning industries that see more men than women are Agriculture, Fishing & Hunting (100.0%), Mining, Quarrying, & Extraction (100.0%), and Enterprise Management (100.0%), whereas the industries that tend to have a higher number of women are Arts, Entertainment & Recreation (79.8%), Health Care & Social Assistance (76.1%), and Wholesale Trade (66.5%).
| Industry | Male | Female |
| Agriculture, Fishing & Hunting | 17 (100.0%) | 0 (0.0%) |
| Mining, Quarrying, & Extraction | 29 (100.0%) | 0 (0.0%) |
| Construction | 947 (92.0%) | 82 (8.0%) |
| Manufacturing | 523 (77.4%) | 153 (22.6%) |
| Wholesale Trade | 86 (33.5%) | 171 (66.5%) |
| Retail Trade | 793 (55.6%) | 634 (44.4%) |
| Transportation & Warehousing | 523 (78.9%) | 140 (21.1%) |
| Utilities | 83 (71.6%) | 33 (28.4%) |
| Information | 114 (94.2%) | 7 (5.8%) |
| Finance & Insurance | 114 (34.4%) | 217 (65.6%) |
| Real Estate, Rental & Leasing | 110 (55.3%) | 89 (44.7%) |
| Professional & Scientific | 74 (46.3%) | 86 (53.7%) |
| Enterprise Management | 41 (100.0%) | 0 (0.0%) |
| Administrative & Support | 370 (63.4%) | 214 (36.6%) |
| Educational Services | 399 (44.5%) | 497 (55.5%) |
| Health Care & Social Assistance | 465 (23.9%) | 1,480 (76.1%) |
| Arts, Entertainment & Recreation | 71 (20.2%) | 280 (79.8%) |
| Accommodation & Food Services | 194 (37.9%) | 318 (62.1%) |
| Public Administration | 173 (41.0%) | 249 (59.0%) |
| Total | 5,531 (52.8%) | 4,949 (47.2%) |
Education in Banning
School Enrollment in Banning
The most common levels of schooling among the 6,617 students in Banning are middle school (1,706 | 25.8%), high school (1,655 | 25.0%), and elementary school (1,488 | 22.5%).
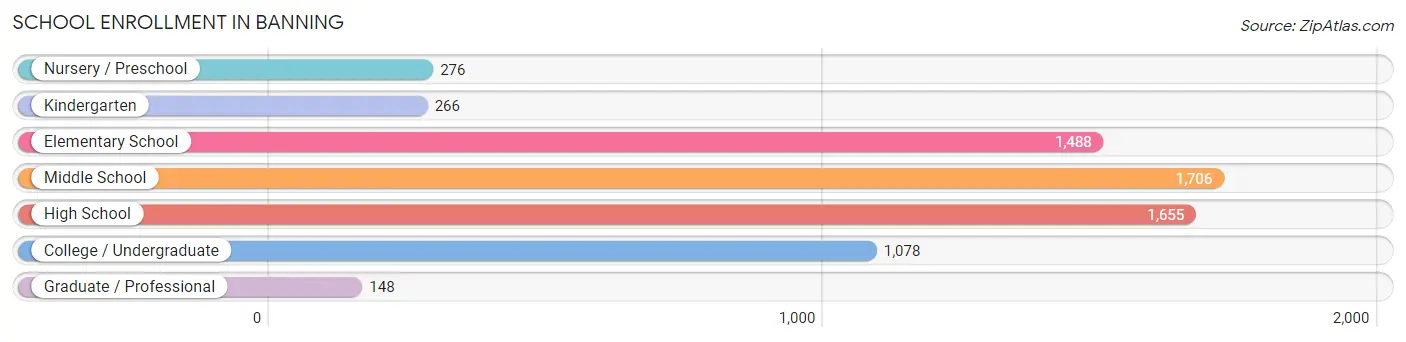
| School Level | # Students | % Students |
| Nursery / Preschool | 276 | 4.2% |
| Kindergarten | 266 | 4.0% |
| Elementary School | 1,488 | 22.5% |
| Middle School | 1,706 | 25.8% |
| High School | 1,655 | 25.0% |
| College / Undergraduate | 1,078 | 16.3% |
| Graduate / Professional | 148 | 2.2% |
| Total | 6,617 | 100.0% |
School Enrollment by Age by Funding Source in Banning
Out of a total of 6,617 students who are enrolled in schools in Banning, 516 (7.8%) attend a private institution, while the remaining 6,101 (92.2%) are enrolled in public schools. The age group of 35 years and over has the highest likelihood of being enrolled in private schools, with 126 (36.6% in the age bracket) enrolled. Conversely, the age group of 10 to 14 year olds has the lowest likelihood of being enrolled in a private school, with 2,197 (98.6% in the age bracket) attending a public institution.
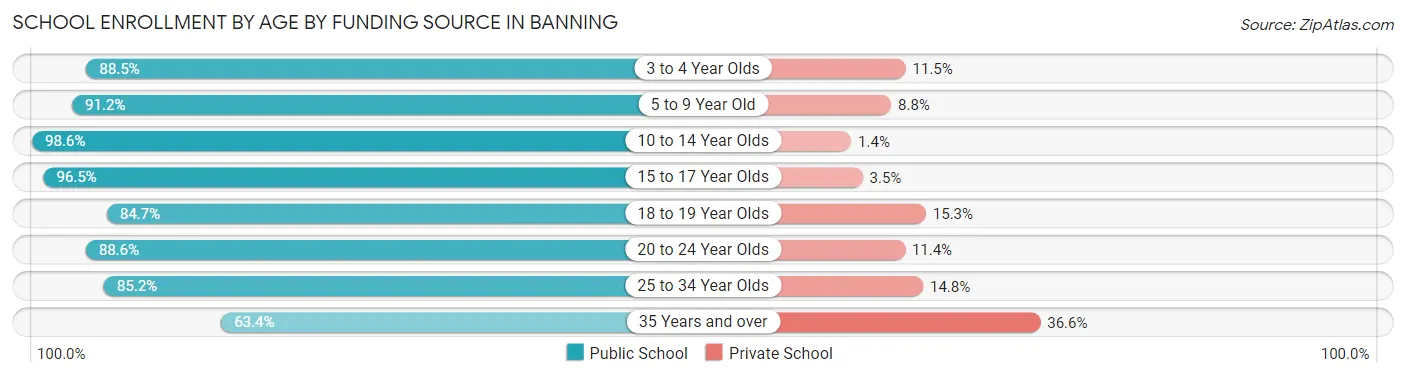
| Age Bracket | Public School | Private School |
| 3 to 4 Year Olds | 169 (88.5%) | 22 (11.5%) |
| 5 to 9 Year Old | 1,546 (91.2%) | 150 (8.8%) |
| 10 to 14 Year Olds | 2,197 (98.6%) | 31 (1.4%) |
| 15 to 17 Year Olds | 1,042 (96.5%) | 38 (3.5%) |
| 18 to 19 Year Olds | 271 (84.7%) | 49 (15.3%) |
| 20 to 24 Year Olds | 264 (88.6%) | 34 (11.4%) |
| 25 to 34 Year Olds | 392 (85.2%) | 68 (14.8%) |
| 35 Years and over | 218 (63.4%) | 126 (36.6%) |
| Total | 6,101 (92.2%) | 516 (7.8%) |
Educational Attainment by Field of Study in Banning
Business (697 | 19.4%), social sciences (508 | 14.1%), education (440 | 12.2%), science & technology (397 | 11.0%), and engineering (300 | 8.3%) are the most common fields of study among 3,595 individuals in Banning who have obtained a bachelor's degree or higher.
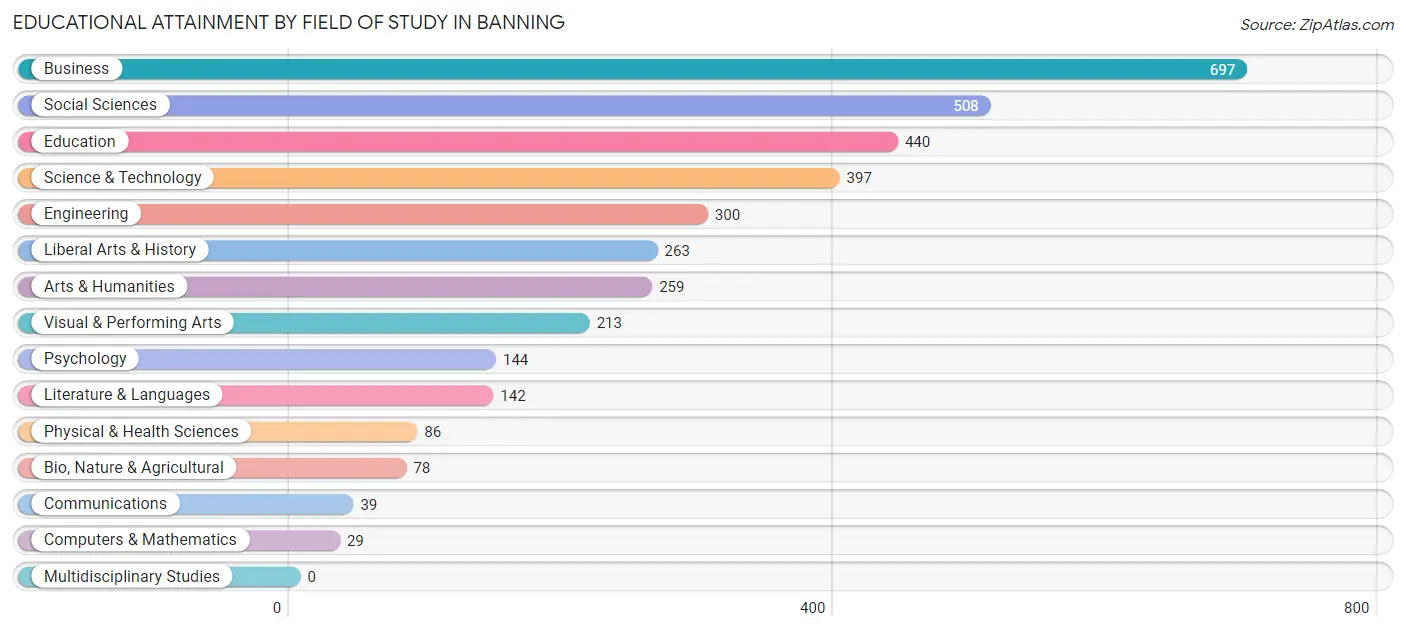
| Field of Study | # Graduates | % Graduates |
| Computers & Mathematics | 29 | 0.8% |
| Bio, Nature & Agricultural | 78 | 2.2% |
| Physical & Health Sciences | 86 | 2.4% |
| Psychology | 144 | 4.0% |
| Social Sciences | 508 | 14.1% |
| Engineering | 300 | 8.3% |
| Multidisciplinary Studies | 0 | 0.0% |
| Science & Technology | 397 | 11.0% |
| Business | 697 | 19.4% |
| Education | 440 | 12.2% |
| Literature & Languages | 142 | 4.0% |
| Liberal Arts & History | 263 | 7.3% |
| Visual & Performing Arts | 213 | 5.9% |
| Communications | 39 | 1.1% |
| Arts & Humanities | 259 | 7.2% |
| Total | 3,595 | 100.0% |
Transportation & Commute in Banning
Vehicle Availability by Sex in Banning
The most prevalent vehicle ownership categories in Banning are males with 2 vehicles (2,059, accounting for 37.8%) and females with 2 vehicles (1,627, making up 42.5%).
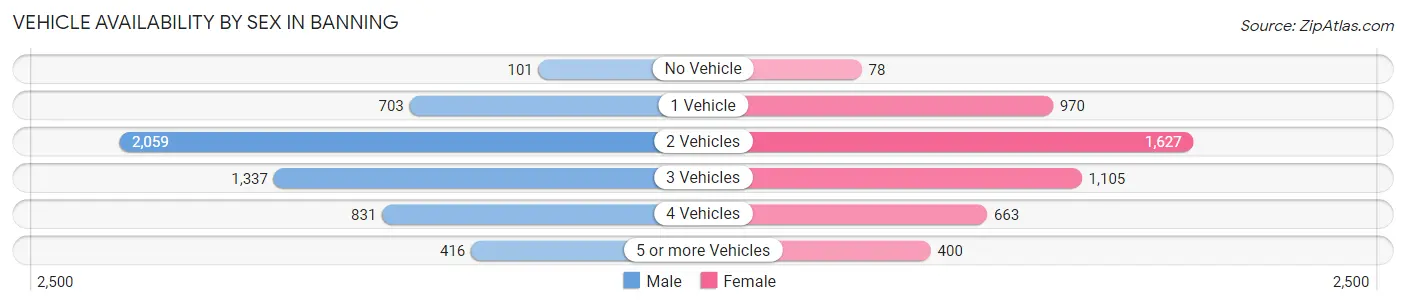
| Vehicles Available | Male | Female |
| No Vehicle | 101 (1.8%) | 78 (1.6%) |
| 1 Vehicle | 703 (12.9%) | 970 (20.0%) |
| 2 Vehicles | 2,059 (37.8%) | 1,627 (33.6%) |
| 3 Vehicles | 1,337 (24.5%) | 1,105 (22.8%) |
| 4 Vehicles | 831 (15.3%) | 663 (13.7%) |
| 5 or more Vehicles | 416 (7.6%) | 400 (8.3%) |
| Total | 5,447 (100.0%) | 4,843 (100.0%) |
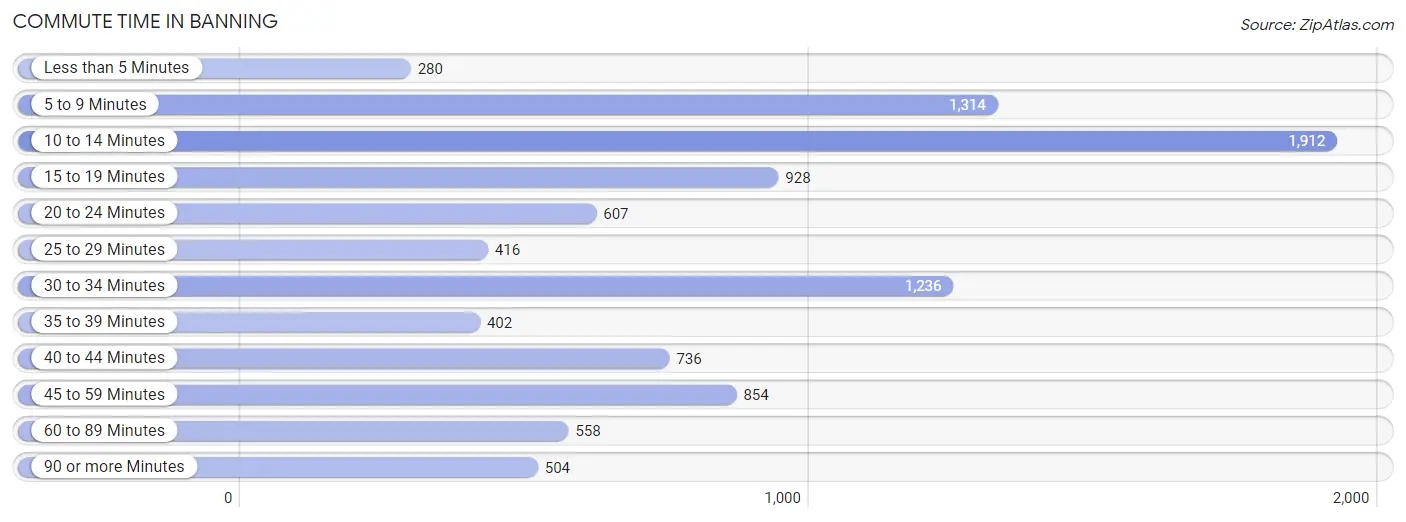
Commute Time in Banning
The most frequently occuring commute durations in Banning are 10 to 14 minutes (1,912 commuters, 19.6%), 5 to 9 minutes (1,314 commuters, 13.5%), and 30 to 34 minutes (1,236 commuters, 12.7%).
| Commute Time | # Commuters | % Commuters |
| Less than 5 Minutes | 280 | 2.9% |
| 5 to 9 Minutes | 1,314 | 13.5% |
| 10 to 14 Minutes | 1,912 | 19.6% |
| 15 to 19 Minutes | 928 | 9.5% |
| 20 to 24 Minutes | 607 | 6.2% |
| 25 to 29 Minutes | 416 | 4.3% |
| 30 to 34 Minutes | 1,236 | 12.7% |
| 35 to 39 Minutes | 402 | 4.1% |
| 40 to 44 Minutes | 736 | 7.5% |
| 45 to 59 Minutes | 854 | 8.8% |
| 60 to 89 Minutes | 558 | 5.7% |
| 90 or more Minutes | 504 | 5.2% |
Commute Time by Sex in Banning
The most common commute times in Banning are 10 to 14 minutes (1,004 commuters, 19.4%) for males and 10 to 14 minutes (908 commuters, 19.9%) for females.
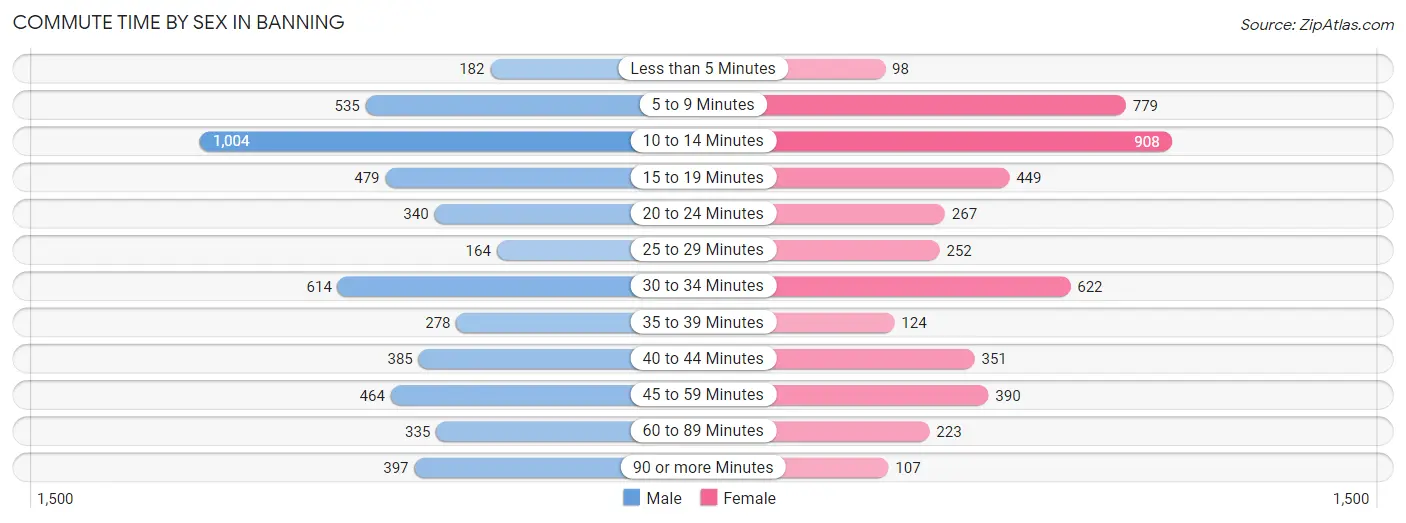
| Commute Time | Male | Female |
| Less than 5 Minutes | 182 (3.5%) | 98 (2.1%) |
| 5 to 9 Minutes | 535 (10.3%) | 779 (17.1%) |
| 10 to 14 Minutes | 1,004 (19.4%) | 908 (19.9%) |
| 15 to 19 Minutes | 479 (9.2%) | 449 (9.8%) |
| 20 to 24 Minutes | 340 (6.6%) | 267 (5.8%) |
| 25 to 29 Minutes | 164 (3.2%) | 252 (5.5%) |
| 30 to 34 Minutes | 614 (11.9%) | 622 (13.6%) |
| 35 to 39 Minutes | 278 (5.4%) | 124 (2.7%) |
| 40 to 44 Minutes | 385 (7.4%) | 351 (7.7%) |
| 45 to 59 Minutes | 464 (9.0%) | 390 (8.5%) |
| 60 to 89 Minutes | 335 (6.5%) | 223 (4.9%) |
| 90 or more Minutes | 397 (7.7%) | 107 (2.3%) |
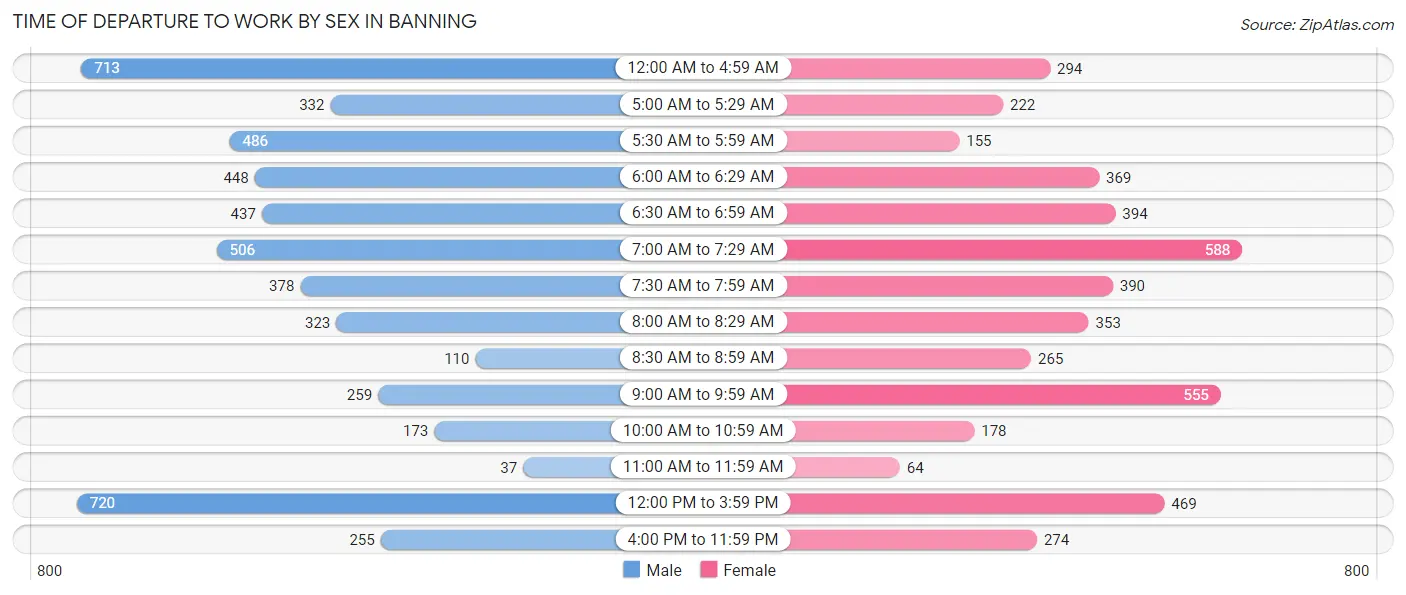
Time of Departure to Work by Sex in Banning
The most frequent times of departure to work in Banning are 12:00 PM to 3:59 PM (720, 13.9%) for males and 7:00 AM to 7:29 AM (588, 12.9%) for females.
| Time of Departure | Male | Female |
| 12:00 AM to 4:59 AM | 713 (13.8%) | 294 (6.4%) |
| 5:00 AM to 5:29 AM | 332 (6.4%) | 222 (4.9%) |
| 5:30 AM to 5:59 AM | 486 (9.4%) | 155 (3.4%) |
| 6:00 AM to 6:29 AM | 448 (8.6%) | 369 (8.1%) |
| 6:30 AM to 6:59 AM | 437 (8.4%) | 394 (8.6%) |
| 7:00 AM to 7:29 AM | 506 (9.8%) | 588 (12.9%) |
| 7:30 AM to 7:59 AM | 378 (7.3%) | 390 (8.5%) |
| 8:00 AM to 8:29 AM | 323 (6.2%) | 353 (7.7%) |
| 8:30 AM to 8:59 AM | 110 (2.1%) | 265 (5.8%) |
| 9:00 AM to 9:59 AM | 259 (5.0%) | 555 (12.1%) |
| 10:00 AM to 10:59 AM | 173 (3.3%) | 178 (3.9%) |
| 11:00 AM to 11:59 AM | 37 (0.7%) | 64 (1.4%) |
| 12:00 PM to 3:59 PM | 720 (13.9%) | 469 (10.3%) |
| 4:00 PM to 11:59 PM | 255 (4.9%) | 274 (6.0%) |
| Total | 5,177 (100.0%) | 4,570 (100.0%) |
Housing Occupancy in Banning
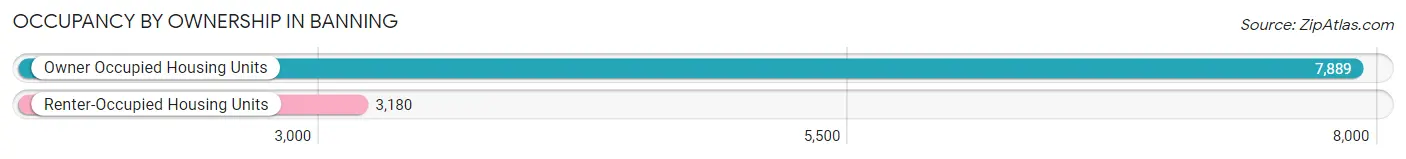
Occupancy by Ownership in Banning
Of the total 11,069 dwellings in Banning, owner-occupied units account for 7,889 (71.3%), while renter-occupied units make up 3,180 (28.7%).
| Occupancy | # Housing Units | % Housing Units |
| Owner Occupied Housing Units | 7,889 | 71.3% |
| Renter-Occupied Housing Units | 3,180 | 28.7% |
| Total Occupied Housing Units | 11,069 | 100.0% |
Occupancy by Household Size in Banning
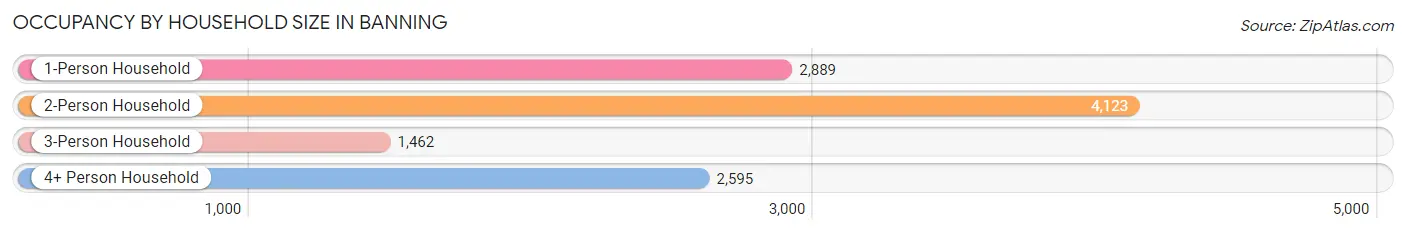
| Household Size | # Housing Units | % Housing Units |
| 1-Person Household | 2,889 | 26.1% |
| 2-Person Household | 4,123 | 37.2% |
| 3-Person Household | 1,462 | 13.2% |
| 4+ Person Household | 2,595 | 23.4% |
| Total Housing Units | 11,069 | 100.0% |
Occupancy by Ownership by Household Size in Banning
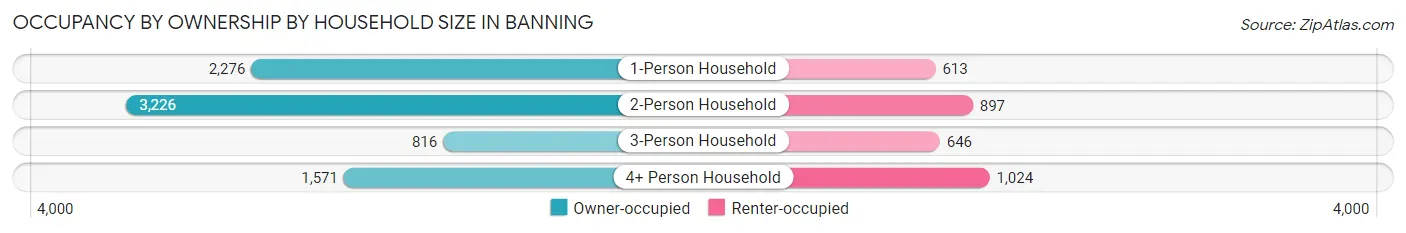
| Household Size | Owner-occupied | Renter-occupied |
| 1-Person Household | 2,276 (78.8%) | 613 (21.2%) |
| 2-Person Household | 3,226 (78.2%) | 897 (21.8%) |
| 3-Person Household | 816 (55.8%) | 646 (44.2%) |
| 4+ Person Household | 1,571 (60.5%) | 1,024 (39.5%) |
| Total Housing Units | 7,889 (71.3%) | 3,180 (28.7%) |
Occupancy by Educational Attainment in Banning
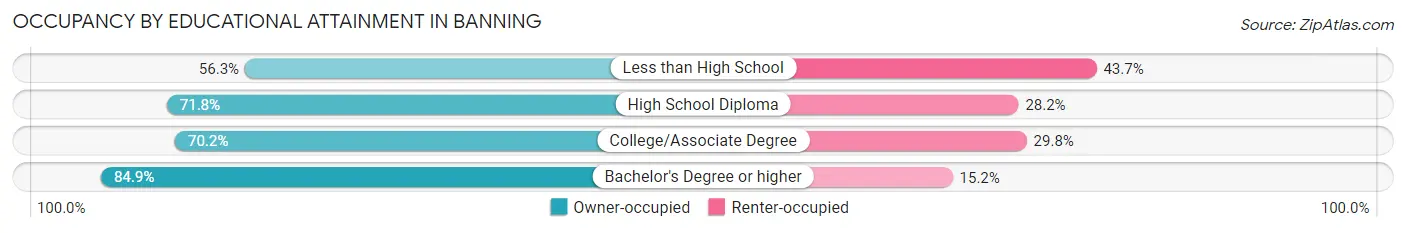
| Household Size | Owner-occupied | Renter-occupied |
| Less than High School | 980 (56.3%) | 760 (43.7%) |
| High School Diploma | 2,357 (71.8%) | 926 (28.2%) |
| College/Associate Degree | 2,760 (70.2%) | 1,174 (29.8%) |
| Bachelor's Degree or higher | 1,792 (84.9%) | 320 (15.1%) |
Occupancy by Age of Householder in Banning
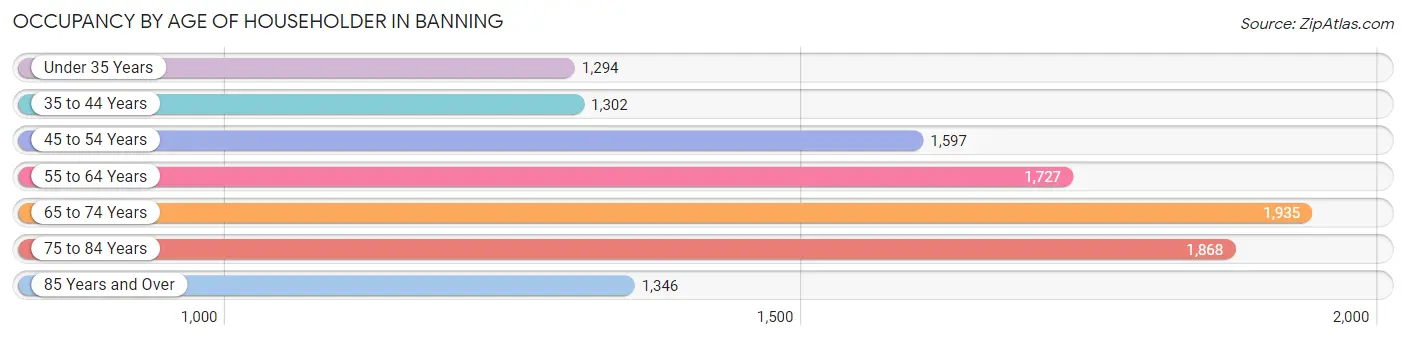
| Age Bracket | # Households | % Households |
| Under 35 Years | 1,294 | 11.7% |
| 35 to 44 Years | 1,302 | 11.8% |
| 45 to 54 Years | 1,597 | 14.4% |
| 55 to 64 Years | 1,727 | 15.6% |
| 65 to 74 Years | 1,935 | 17.5% |
| 75 to 84 Years | 1,868 | 16.9% |
| 85 Years and Over | 1,346 | 12.2% |
| Total | 11,069 | 100.0% |
Housing Finances in Banning
Median Income by Occupancy in Banning
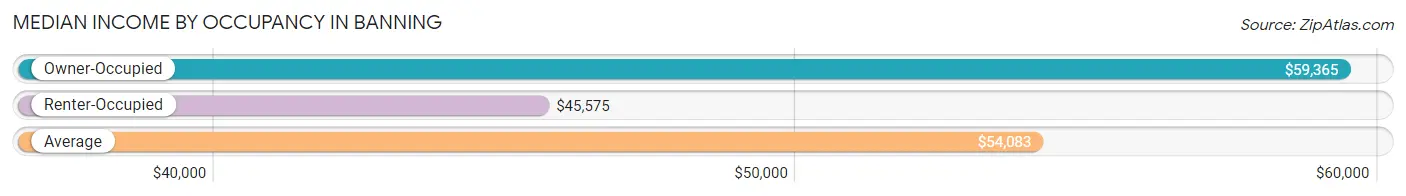
| Occupancy Type | # Households | Median Income |
| Owner-Occupied | 7,889 (71.3%) | $59,365 |
| Renter-Occupied | 3,180 (28.7%) | $45,575 |
| Average | 11,069 (100.0%) | $54,083 |
Occupancy by Householder Income Bracket in Banning
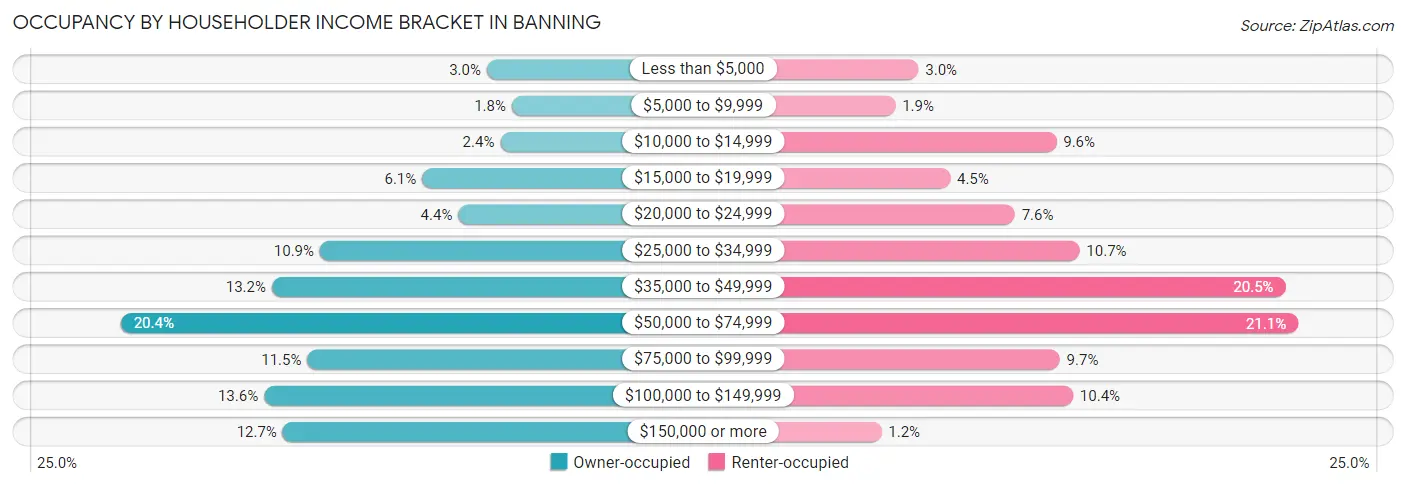
| Income Bracket | Owner-occupied | Renter-occupied |
| Less than $5,000 | 236 (3.0%) | 95 (3.0%) |
| $5,000 to $9,999 | 142 (1.8%) | 60 (1.9%) |
| $10,000 to $14,999 | 185 (2.4%) | 304 (9.6%) |
| $15,000 to $19,999 | 479 (6.1%) | 143 (4.5%) |
| $20,000 to $24,999 | 343 (4.3%) | 241 (7.6%) |
| $25,000 to $34,999 | 863 (10.9%) | 339 (10.7%) |
| $35,000 to $49,999 | 1,044 (13.2%) | 651 (20.5%) |
| $50,000 to $74,999 | 1,611 (20.4%) | 670 (21.1%) |
| $75,000 to $99,999 | 910 (11.5%) | 309 (9.7%) |
| $100,000 to $149,999 | 1,073 (13.6%) | 329 (10.3%) |
| $150,000 or more | 1,003 (12.7%) | 39 (1.2%) |
| Total | 7,889 (100.0%) | 3,180 (100.0%) |
Monthly Housing Cost Tiers in Banning
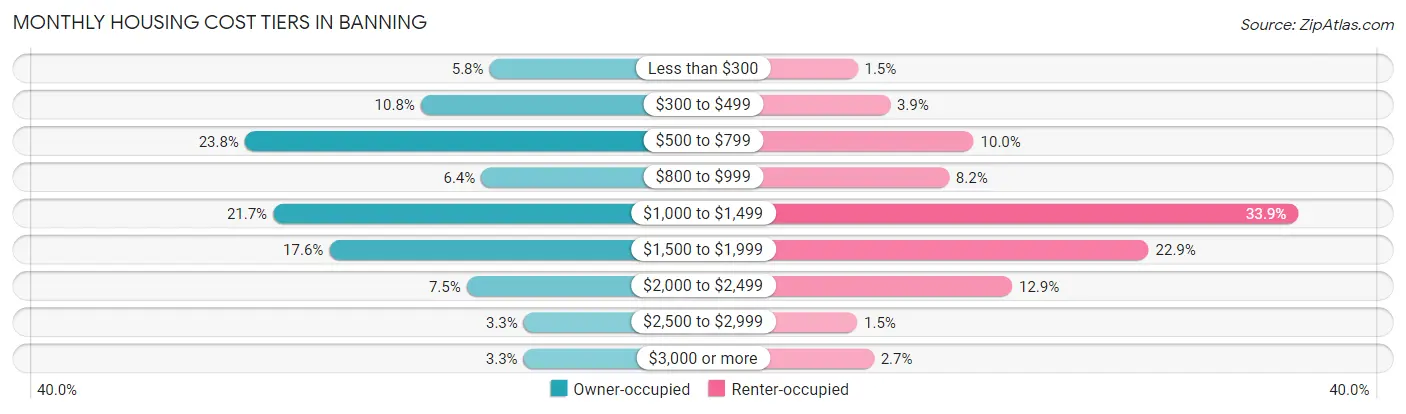
| Monthly Cost | Owner-occupied | Renter-occupied |
| Less than $300 | 455 (5.8%) | 47 (1.5%) |
| $300 to $499 | 854 (10.8%) | 123 (3.9%) |
| $500 to $799 | 1,877 (23.8%) | 319 (10.0%) |
| $800 to $999 | 503 (6.4%) | 261 (8.2%) |
| $1,000 to $1,499 | 1,713 (21.7%) | 1,079 (33.9%) |
| $1,500 to $1,999 | 1,386 (17.6%) | 729 (22.9%) |
| $2,000 to $2,499 | 588 (7.4%) | 409 (12.9%) |
| $2,500 to $2,999 | 256 (3.3%) | 46 (1.5%) |
| $3,000 or more | 257 (3.3%) | 85 (2.7%) |
| Total | 7,889 (100.0%) | 3,180 (100.0%) |
Physical Housing Characteristics in Banning
Housing Structures in Banning
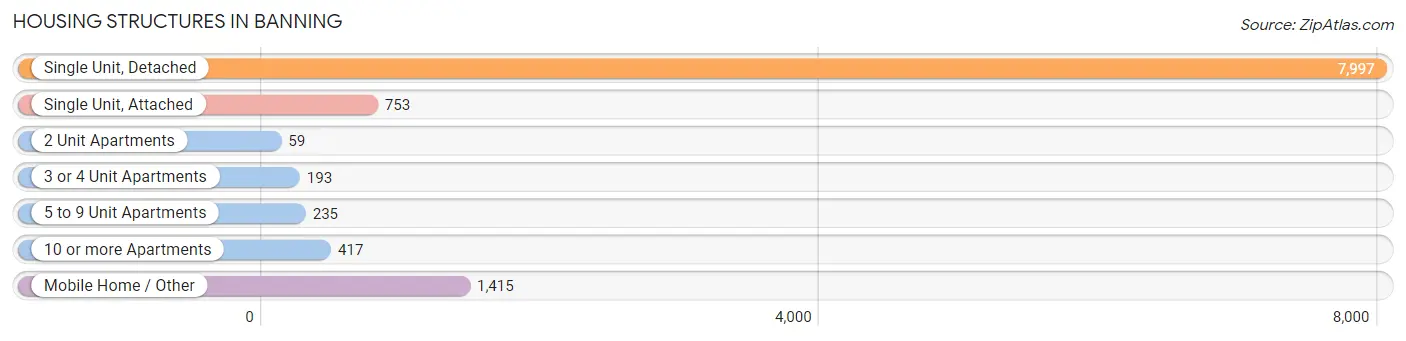
| Structure Type | # Housing Units | % Housing Units |
| Single Unit, Detached | 7,997 | 72.3% |
| Single Unit, Attached | 753 | 6.8% |
| 2 Unit Apartments | 59 | 0.5% |
| 3 or 4 Unit Apartments | 193 | 1.7% |
| 5 to 9 Unit Apartments | 235 | 2.1% |
| 10 or more Apartments | 417 | 3.8% |
| Mobile Home / Other | 1,415 | 12.8% |
| Total | 11,069 | 100.0% |
Housing Structures by Occupancy in Banning
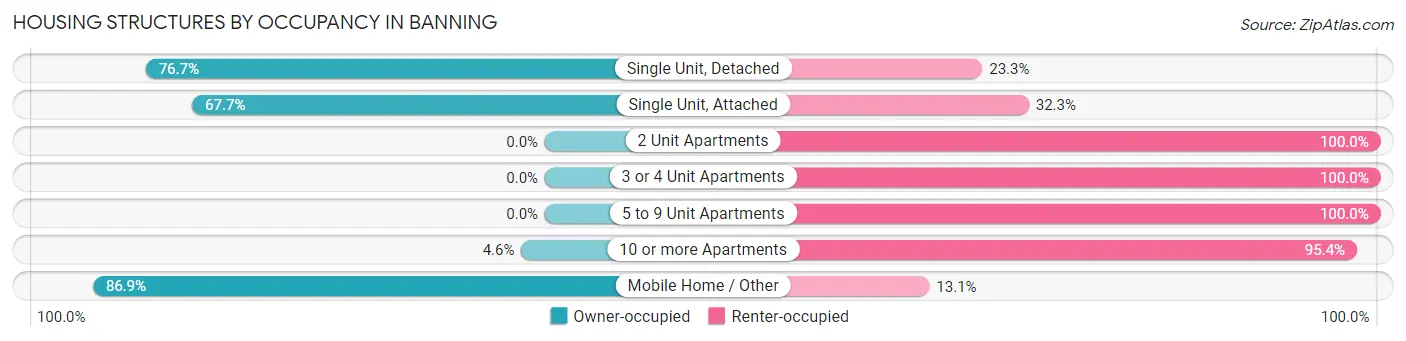
| Structure Type | Owner-occupied | Renter-occupied |
| Single Unit, Detached | 6,131 (76.7%) | 1,866 (23.3%) |
| Single Unit, Attached | 510 (67.7%) | 243 (32.3%) |
| 2 Unit Apartments | 0 (0.0%) | 59 (100.0%) |
| 3 or 4 Unit Apartments | 0 (0.0%) | 193 (100.0%) |
| 5 to 9 Unit Apartments | 0 (0.0%) | 235 (100.0%) |
| 10 or more Apartments | 19 (4.6%) | 398 (95.4%) |
| Mobile Home / Other | 1,229 (86.9%) | 186 (13.1%) |
| Total | 7,889 (71.3%) | 3,180 (28.7%) |
Housing Structures by Number of Rooms in Banning
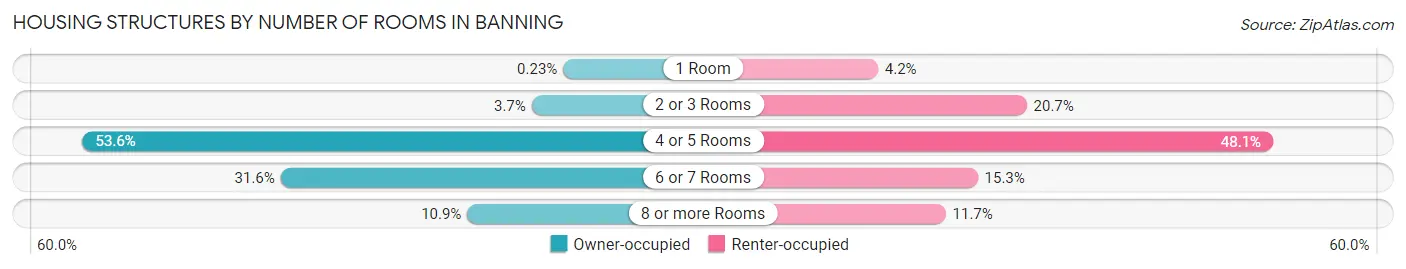
| Number of Rooms | Owner-occupied | Renter-occupied |
| 1 Room | 18 (0.2%) | 134 (4.2%) |
| 2 or 3 Rooms | 294 (3.7%) | 659 (20.7%) |
| 4 or 5 Rooms | 4,227 (53.6%) | 1,528 (48.0%) |
| 6 or 7 Rooms | 2,492 (31.6%) | 486 (15.3%) |
| 8 or more Rooms | 858 (10.9%) | 373 (11.7%) |
| Total | 7,889 (100.0%) | 3,180 (100.0%) |
Housing Structure by Heating Type in Banning
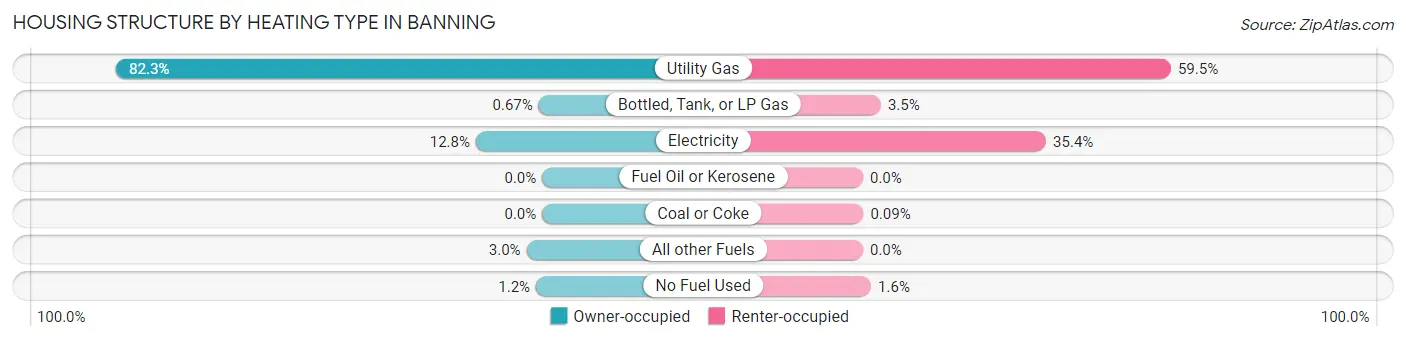
| Heating Type | Owner-occupied | Renter-occupied |
| Utility Gas | 6,493 (82.3%) | 1,892 (59.5%) |
| Bottled, Tank, or LP Gas | 53 (0.7%) | 110 (3.5%) |
| Electricity | 1,011 (12.8%) | 1,125 (35.4%) |
| Fuel Oil or Kerosene | 0 (0.0%) | 0 (0.0%) |
| Coal or Coke | 0 (0.0%) | 3 (0.1%) |
| All other Fuels | 238 (3.0%) | 0 (0.0%) |
| No Fuel Used | 94 (1.2%) | 50 (1.6%) |
| Total | 7,889 (100.0%) | 3,180 (100.0%) |
Household Vehicle Usage in Banning
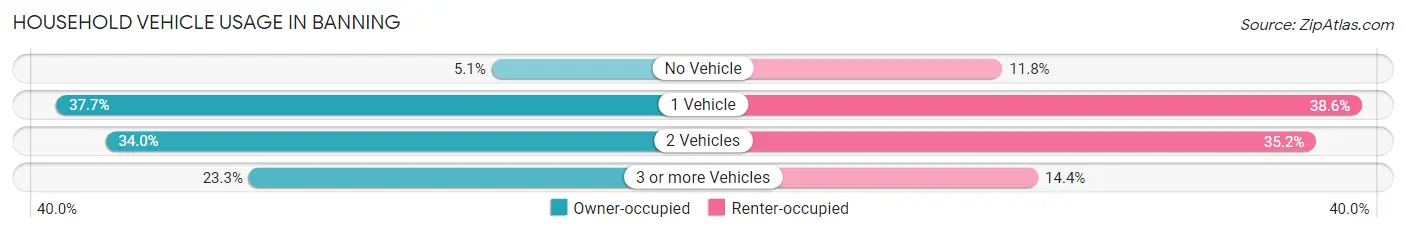
| Vehicles per Household | Owner-occupied | Renter-occupied |
| No Vehicle | 405 (5.1%) | 374 (11.8%) |
| 1 Vehicle | 2,970 (37.7%) | 1,228 (38.6%) |
| 2 Vehicles | 2,679 (34.0%) | 1,119 (35.2%) |
| 3 or more Vehicles | 1,835 (23.3%) | 459 (14.4%) |
| Total | 7,889 (100.0%) | 3,180 (100.0%) |
Real Estate & Mortgages in Banning
Real Estate and Mortgage Overview in Banning
| Characteristic | Without Mortgage | With Mortgage |
| Housing Units | 3,908 | 3,981 |
| Median Property Value | $276,900 | $313,600 |
| Median Household Income | $48,921 | $697 |
| Monthly Housing Costs | $634 | $249 |
| Real Estate Taxes | $2,365 | $105 |
Property Value by Mortgage Status in Banning
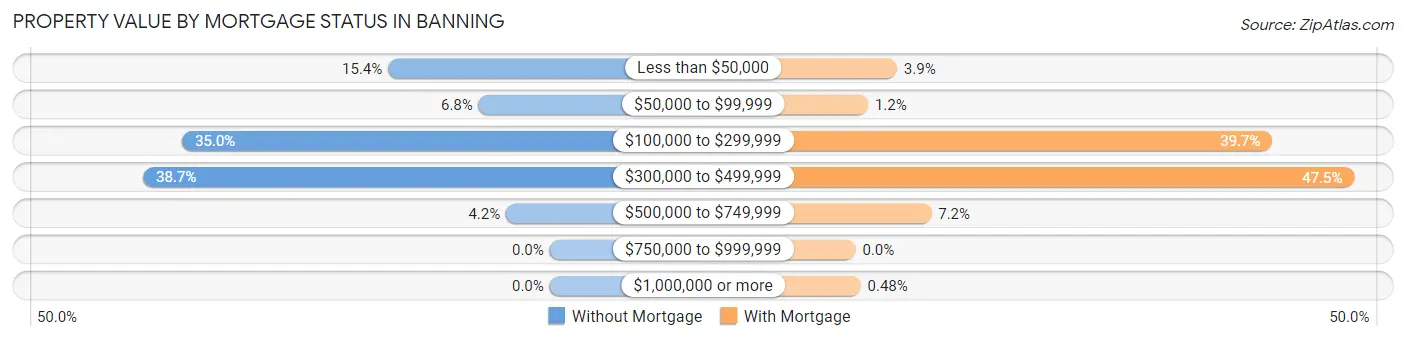
| Property Value | Without Mortgage | With Mortgage |
| Less than $50,000 | 601 (15.4%) | 157 (3.9%) |
| $50,000 to $99,999 | 264 (6.8%) | 47 (1.2%) |
| $100,000 to $299,999 | 1,368 (35.0%) | 1,580 (39.7%) |
| $300,000 to $499,999 | 1,513 (38.7%) | 1,891 (47.5%) |
| $500,000 to $749,999 | 162 (4.2%) | 287 (7.2%) |
| $750,000 to $999,999 | 0 (0.0%) | 0 (0.0%) |
| $1,000,000 or more | 0 (0.0%) | 19 (0.5%) |
| Total | 3,908 (100.0%) | 3,981 (100.0%) |
Household Income by Mortgage Status in Banning
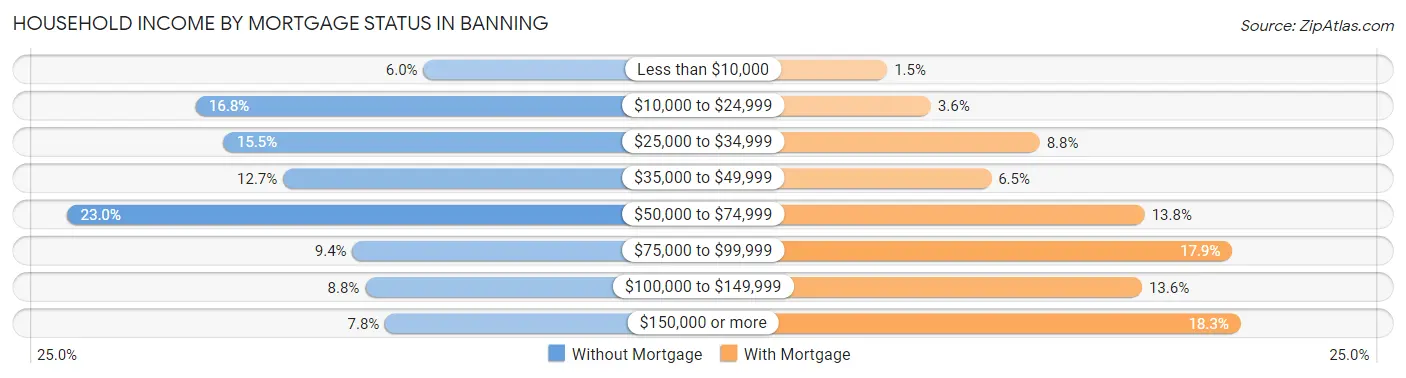
| Household Income | Without Mortgage | With Mortgage |
| Less than $10,000 | 235 (6.0%) | 60 (1.5%) |
| $10,000 to $24,999 | 658 (16.8%) | 143 (3.6%) |
| $25,000 to $34,999 | 606 (15.5%) | 349 (8.8%) |
| $35,000 to $49,999 | 496 (12.7%) | 257 (6.5%) |
| $50,000 to $74,999 | 897 (23.0%) | 548 (13.8%) |
| $75,000 to $99,999 | 367 (9.4%) | 714 (17.9%) |
| $100,000 to $149,999 | 343 (8.8%) | 543 (13.6%) |
| $150,000 or more | 306 (7.8%) | 730 (18.3%) |
| Total | 3,908 (100.0%) | 3,981 (100.0%) |
Property Value to Household Income Ratio in Banning
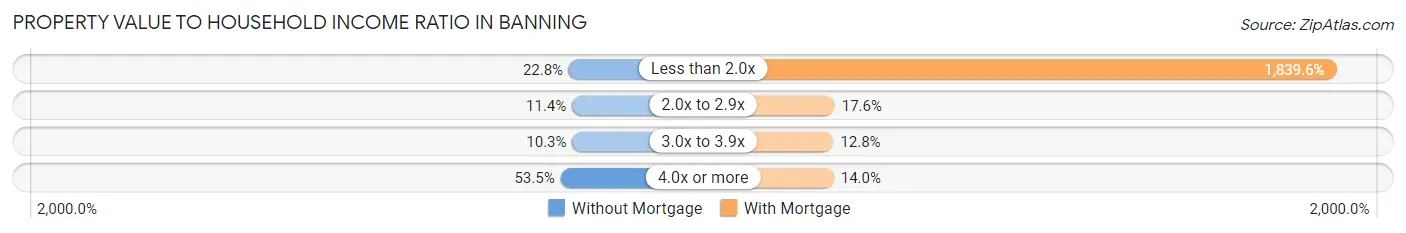
| Value-to-Income Ratio | Without Mortgage | With Mortgage |
| Less than 2.0x | 892 (22.8%) | 73,233 (1,839.6%) |
| 2.0x to 2.9x | 444 (11.4%) | 702 (17.6%) |
| 3.0x to 3.9x | 402 (10.3%) | 511 (12.8%) |
| 4.0x or more | 2,091 (53.5%) | 556 (14.0%) |
| Total | 3,908 (100.0%) | 3,981 (100.0%) |
Real Estate Taxes by Mortgage Status in Banning
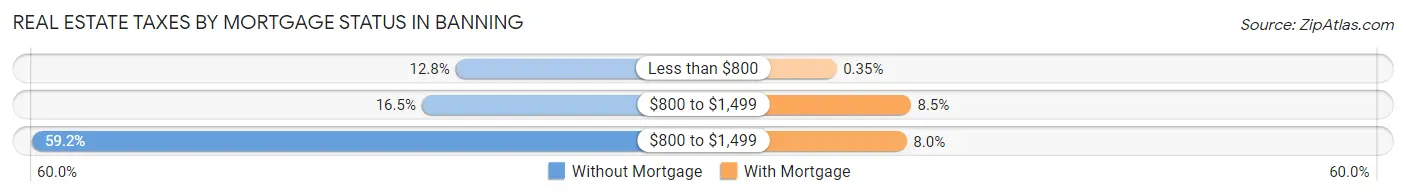
| Property Taxes | Without Mortgage | With Mortgage |
| Less than $800 | 499 (12.8%) | 14 (0.4%) |
| $800 to $1,499 | 644 (16.5%) | 338 (8.5%) |
| $800 to $1,499 | 2,313 (59.2%) | 320 (8.0%) |
| Total | 3,908 (100.0%) | 3,981 (100.0%) |
Health & Disability in Banning
Health Insurance Coverage by Age in Banning
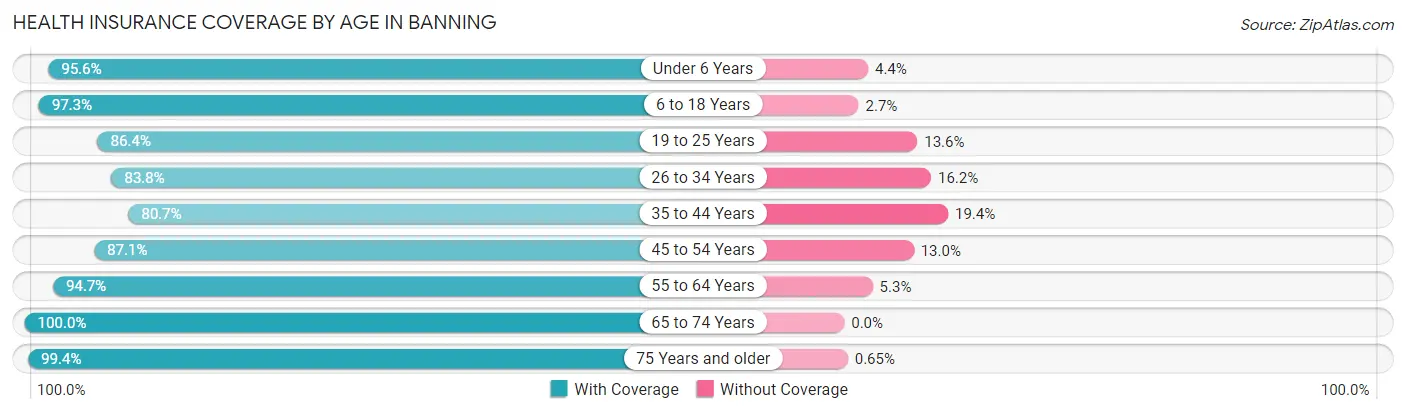
| Age Bracket | With Coverage | Without Coverage |
| Under 6 Years | 2,094 (95.6%) | 97 (4.4%) |
| 6 to 18 Years | 4,897 (97.3%) | 134 (2.7%) |
| 19 to 25 Years | 1,853 (86.4%) | 292 (13.6%) |
| 26 to 34 Years | 2,617 (83.8%) | 505 (16.2%) |
| 35 to 44 Years | 2,522 (80.6%) | 605 (19.4%) |
| 45 to 54 Years | 2,488 (87.1%) | 370 (13.0%) |
| 55 to 64 Years | 2,953 (94.7%) | 165 (5.3%) |
| 65 to 74 Years | 3,351 (100.0%) | 0 (0.0%) |
| 75 Years and older | 4,729 (99.4%) | 31 (0.6%) |
| Total | 27,504 (92.6%) | 2,199 (7.4%) |
Health Insurance Coverage by Citizenship Status in Banning

| Citizenship Status | With Coverage | Without Coverage |
| Native Born | 2,094 (95.6%) | 97 (4.4%) |
| Foreign Born, Citizen | 4,897 (97.3%) | 134 (2.7%) |
| Foreign Born, not a Citizen | 1,853 (86.4%) | 292 (13.6%) |
Health Insurance Coverage by Household Income in Banning
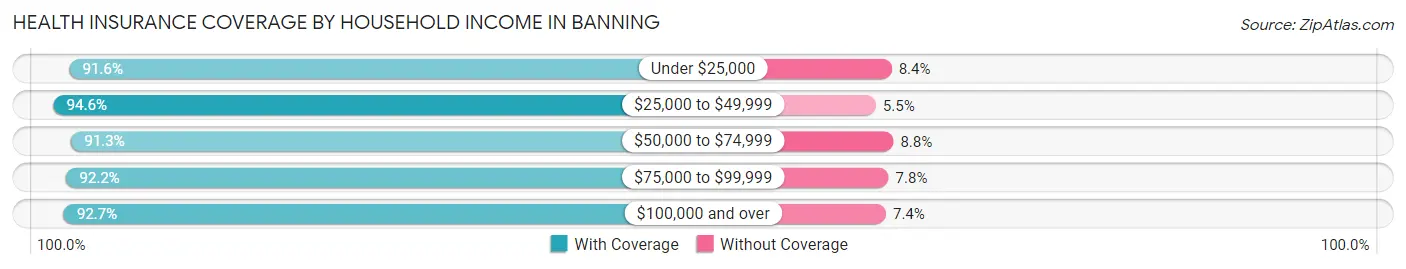
| Household Income | With Coverage | Without Coverage |
| Under $25,000 | 4,319 (91.6%) | 397 (8.4%) |
| $25,000 to $49,999 | 6,700 (94.6%) | 386 (5.4%) |
| $50,000 to $74,999 | 5,436 (91.2%) | 521 (8.7%) |
| $75,000 to $99,999 | 3,317 (92.2%) | 282 (7.8%) |
| $100,000 and over | 7,628 (92.6%) | 605 (7.3%) |
Public vs Private Health Insurance Coverage by Age in Banning
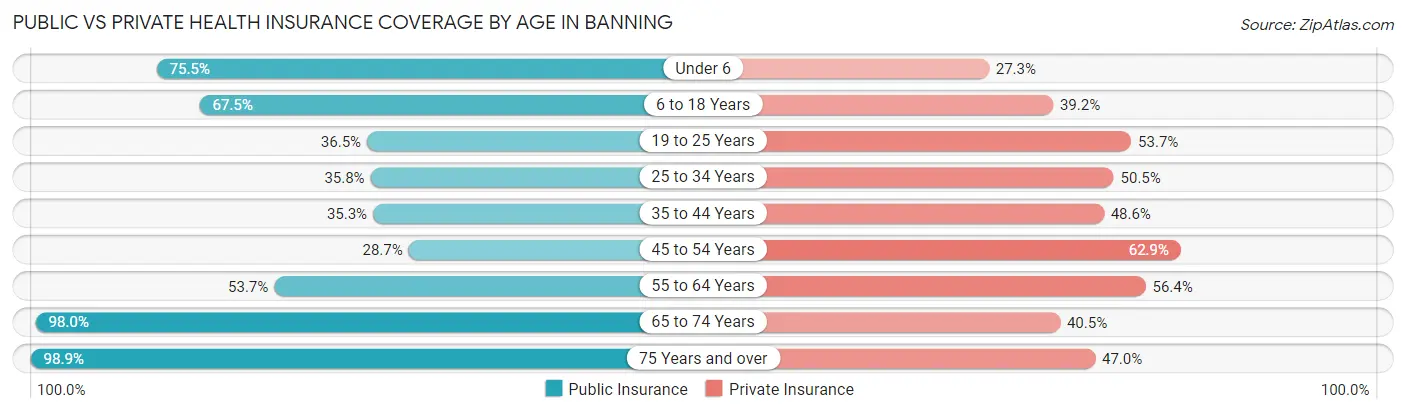
| Age Bracket | Public Insurance | Private Insurance |
| Under 6 | 1,654 (75.5%) | 598 (27.3%) |
| 6 to 18 Years | 3,397 (67.5%) | 1,972 (39.2%) |
| 19 to 25 Years | 782 (36.5%) | 1,152 (53.7%) |
| 25 to 34 Years | 1,118 (35.8%) | 1,575 (50.4%) |
| 35 to 44 Years | 1,105 (35.3%) | 1,520 (48.6%) |
| 45 to 54 Years | 821 (28.7%) | 1,798 (62.9%) |
| 55 to 64 Years | 1,674 (53.7%) | 1,758 (56.4%) |
| 65 to 74 Years | 3,283 (98.0%) | 1,357 (40.5%) |
| 75 Years and over | 4,706 (98.9%) | 2,237 (47.0%) |
| Total | 18,540 (62.4%) | 13,967 (47.0%) |
Disability Status by Sex by Age in Banning
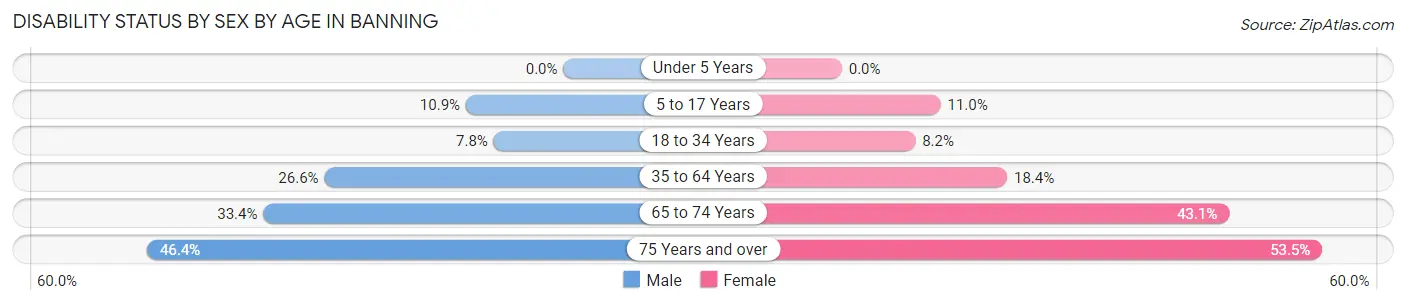
| Age Bracket | Male | Female |
| Under 5 Years | 0 (0.0%) | 0 (0.0%) |
| 5 to 17 Years | 311 (10.8%) | 251 (11.0%) |
| 18 to 34 Years | 209 (7.8%) | 232 (8.2%) |
| 35 to 64 Years | 1,215 (26.6%) | 835 (18.4%) |
| 65 to 74 Years | 538 (33.4%) | 751 (43.1%) |
| 75 Years and over | 836 (46.4%) | 1,582 (53.5%) |
Disability Class by Sex by Age in Banning
Disability Class: Hearing Difficulty
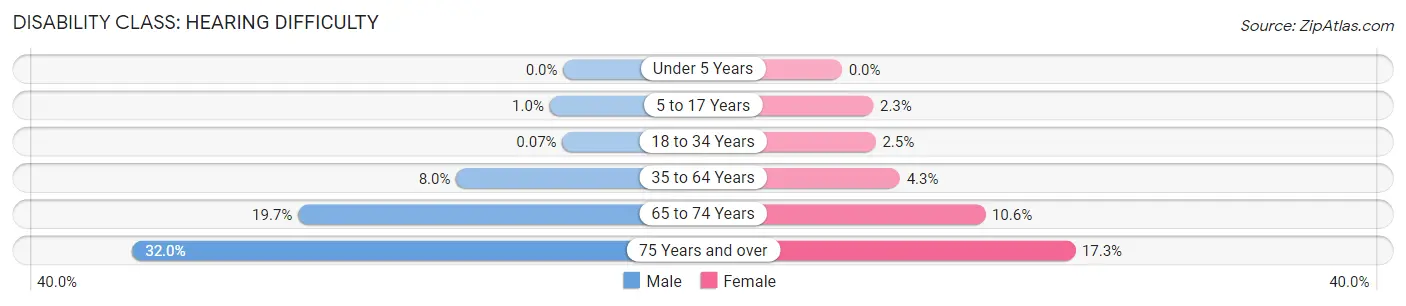
| Age Bracket | Male | Female |
| Under 5 Years | 0 (0.0%) | 0 (0.0%) |
| 5 to 17 Years | 29 (1.0%) | 53 (2.3%) |
| 18 to 34 Years | 2 (0.1%) | 71 (2.5%) |
| 35 to 64 Years | 363 (8.0%) | 195 (4.3%) |
| 65 to 74 Years | 317 (19.7%) | 185 (10.6%) |
| 75 Years and over | 577 (32.0%) | 512 (17.3%) |
Disability Class: Vision Difficulty
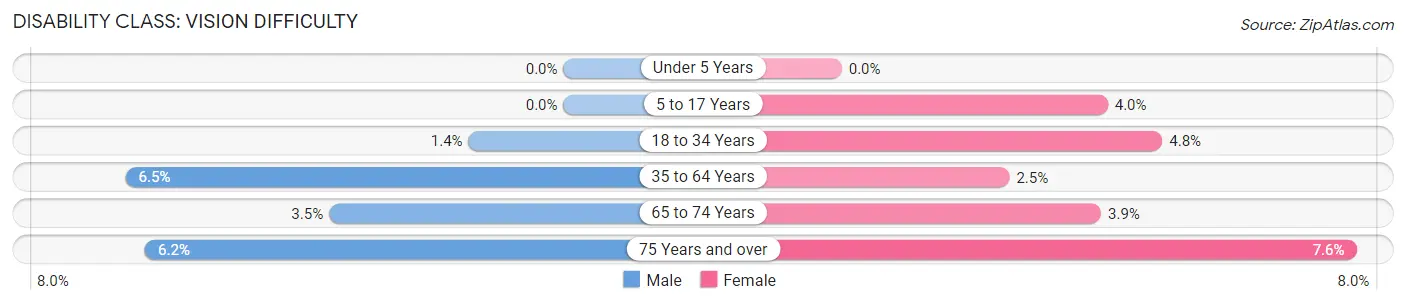
| Age Bracket | Male | Female |
| Under 5 Years | 0 (0.0%) | 0 (0.0%) |
| 5 to 17 Years | 0 (0.0%) | 90 (4.0%) |
| 18 to 34 Years | 38 (1.4%) | 135 (4.8%) |
| 35 to 64 Years | 297 (6.5%) | 113 (2.5%) |
| 65 to 74 Years | 56 (3.5%) | 67 (3.8%) |
| 75 Years and over | 112 (6.2%) | 226 (7.6%) |
Disability Class: Cognitive Difficulty
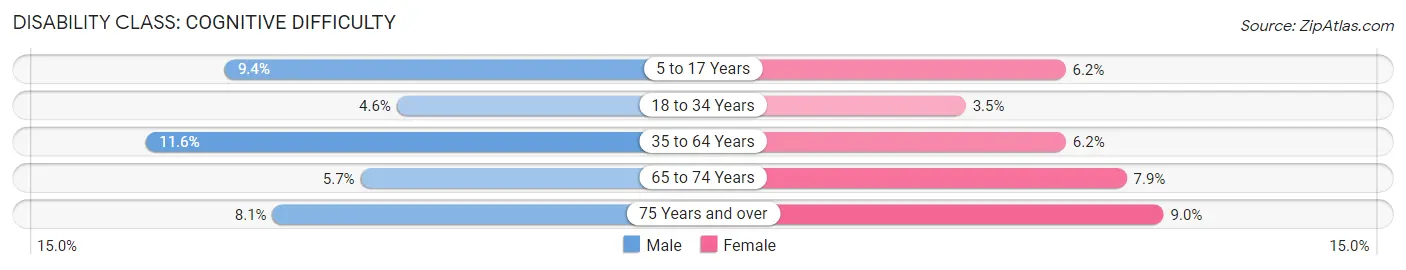
| Age Bracket | Male | Female |
| 5 to 17 Years | 270 (9.4%) | 142 (6.2%) |
| 18 to 34 Years | 125 (4.6%) | 98 (3.5%) |
| 35 to 64 Years | 530 (11.6%) | 283 (6.2%) |
| 65 to 74 Years | 91 (5.7%) | 138 (7.9%) |
| 75 Years and over | 146 (8.1%) | 265 (9.0%) |
Disability Class: Ambulatory Difficulty
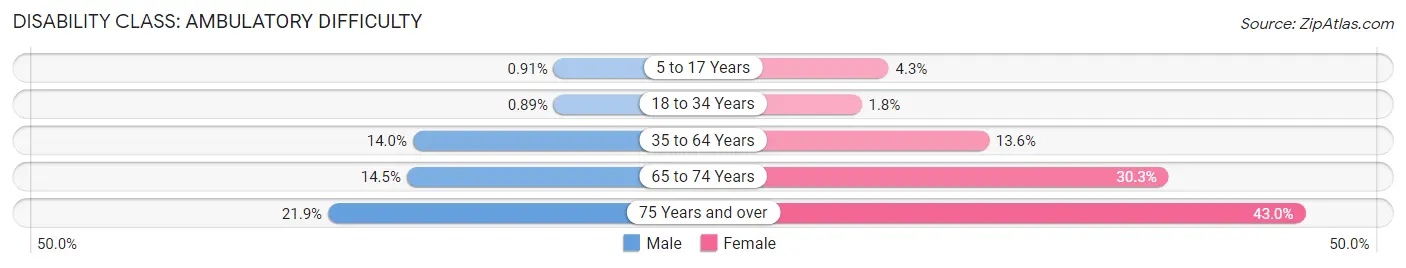
| Age Bracket | Male | Female |
| 5 to 17 Years | 26 (0.9%) | 99 (4.3%) |
| 18 to 34 Years | 24 (0.9%) | 52 (1.8%) |
| 35 to 64 Years | 638 (14.0%) | 619 (13.6%) |
| 65 to 74 Years | 234 (14.5%) | 528 (30.3%) |
| 75 Years and over | 394 (21.8%) | 1,272 (43.0%) |
Disability Class: Self-Care Difficulty
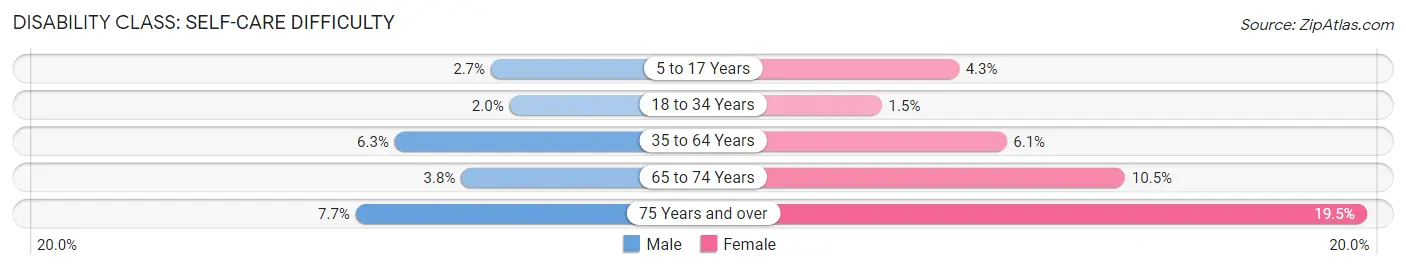
| Age Bracket | Male | Female |
| 5 to 17 Years | 77 (2.7%) | 99 (4.3%) |
| 18 to 34 Years | 54 (2.0%) | 42 (1.5%) |
| 35 to 64 Years | 286 (6.3%) | 277 (6.1%) |
| 65 to 74 Years | 61 (3.8%) | 183 (10.5%) |
| 75 Years and over | 139 (7.7%) | 576 (19.5%) |
Technology Access in Banning
Computing Device Access in Banning
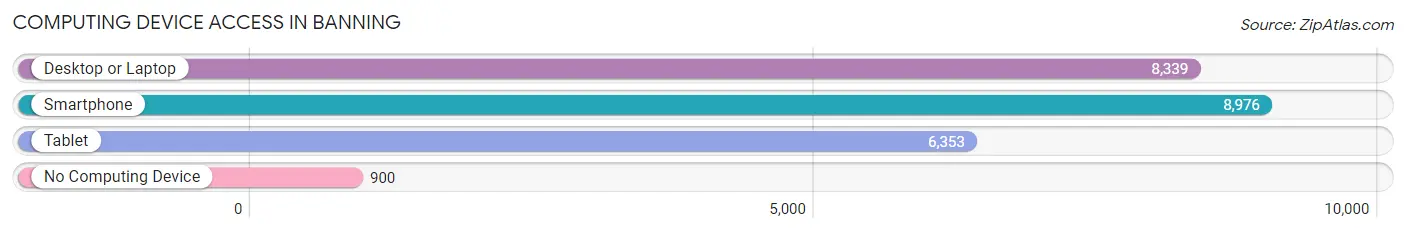
| Device Type | # Households | % Households |
| Desktop or Laptop | 8,339 | 75.3% |
| Smartphone | 8,976 | 81.1% |
| Tablet | 6,353 | 57.4% |
| No Computing Device | 900 | 8.1% |
| Total | 11,069 | 100.0% |
Internet Access in Banning
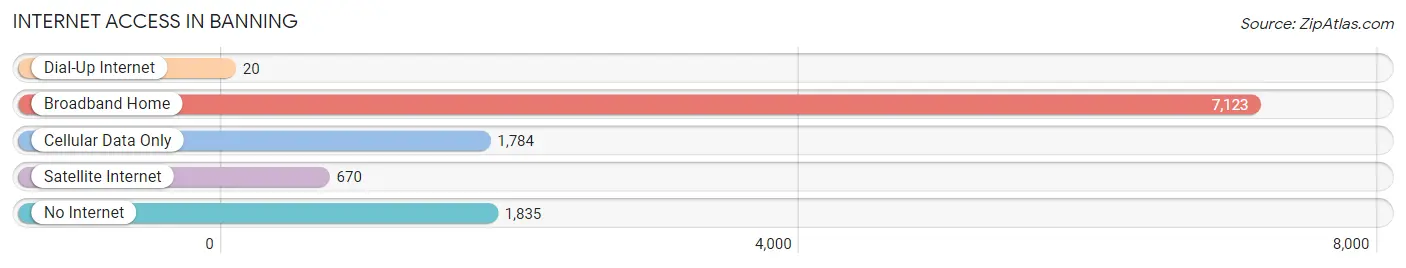
| Internet Type | # Households | % Households |
| Dial-Up Internet | 20 | 0.2% |
| Broadband Home | 7,123 | 64.3% |
| Cellular Data Only | 1,784 | 16.1% |
| Satellite Internet | 670 | 6.0% |
| No Internet | 1,835 | 16.6% |
| Total | 11,069 | 100.0% |
Banning Summary
Banning is a city located in Riverside County, California, United States. The city is situated in the San Gorgonio Pass, which is a mountain pass located between the San Bernardino Mountains and the San Jacinto Mountains. The city is located approximately 94 miles east of Los Angeles and is part of the Greater Los Angeles Area. As of the 2010 census, the population of Banning was 29,603.
History
Banning was founded in 1864 by Phineas Banning, a stagecoach and freight wagon operator. The city was named after him and was incorporated in 1913. Banning was originally a railroad town, and the Southern Pacific Railroad was the main employer in the area. The city was also a major stop on the Butterfield Overland Mail route.
In the early 1900s, Banning became a popular tourist destination due to its proximity to the San Gorgonio Pass. The city was also known for its mineral springs, which were believed to have healing properties.
Geography
Banning is located in Riverside County, California, at the base of the San Gorgonio Pass. The city is situated between the San Bernardino Mountains to the north and the San Jacinto Mountains to the south. The city covers an area of 16.2 square miles and has an elevation of 1,841 feet.
The climate in Banning is semi-arid, with hot summers and mild winters. The average annual temperature is 68°F, and the average annual precipitation is 8.5 inches.
Economy
Banning’s economy is largely based on tourism and retail. The city is home to several casinos, including the Morongo Casino Resort & Spa, which is one of the largest casinos in the state. The city is also home to several retail stores, including Walmart, Target, and Home Depot.
The city is also home to several manufacturing companies, including the Banning Manufacturing Company, which produces industrial equipment. The city is also home to several agricultural companies, including the Banning Packing Company, which produces citrus fruits.
Demographics
As of the 2010 census, the population of Banning was 29,603. The racial makeup of the city was 68.2% White, 1.3% African American, 0.9% Native American, 1.3% Asian, 0.2% Pacific Islander, 24.2% from other races, and 4.1% from two or more races. Hispanic or Latino of any race were 44.3% of the population.
The median household income in Banning was $41,945, and the median family income was $48,845. The per capita income was $19,845. About 17.2% of the population was below the poverty line.
Common Questions
What is Per Capita Income in Banning?
Per Capita income in Banning is $28,951.
What is the Median Family Income in Banning?
Median Family Income in Banning is $57,407.
What is the Median Household income in Banning?
Median Household Income in Banning is $54,083.
What is Income or Wage Gap in Banning?
Income or Wage Gap in Banning is 30.9%.
Women in Banning earn 69.1 cents for every dollar earned by a man.
What is Family Income Deficit in Banning?
Family Income Deficit in Banning is $10,632.
Families that are below poverty line in Banning earn $10,632 less on average than the poverty threshold level.
What is Inequality or Gini Index in Banning?
Inequality or Gini Index in Banning is 0.46.
What is the Total Population of Banning?
Total Population of Banning is 29,929.
What is the Total Male Population of Banning?
Total Male Population of Banning is 14,642.
What is the Total Female Population of Banning?
Total Female Population of Banning is 15,287.
What is the Ratio of Males per 100 Females in Banning?
There are 95.78 Males per 100 Females in Banning.
What is the Ratio of Females per 100 Males in Banning?
There are 104.41 Females per 100 Males in Banning.
What is the Median Population Age in Banning?
Median Population Age in Banning is 42.8 Years.
What is the Average Family Size in Banning
Average Family Size in Banning is 3.3 People.
What is the Average Household Size in Banning
Average Household Size in Banning is 2.7 People.
How Large is the Labor Force in Banning?
There are 11,447 People in the Labor Forcein in Banning.
What is the Percentage of People in the Labor Force in Banning?
48.4% of People are in the Labor Force in Banning.
What is the Unemployment Rate in Banning?
Unemployment Rate in Banning is 8.4%.