Aliso Viejo, CA Map & Demographics
Aliso Viejo Map
Aliso Viejo Overview
$59,852
PER CAPITA INCOME
$153,877
AVG FAMILY INCOME
$131,708
AVG HOUSEHOLD INCOME
27.0%
WAGE / INCOME GAP [ % ]
73.0¢/ $1
WAGE / INCOME GAP [ $ ]
0.40
INEQUALITY / GINI INDEX
51,896
TOTAL POPULATION
25,069
MALE POPULATION
26,827
FEMALE POPULATION
93.45
MALES / 100 FEMALES
107.01
FEMALES / 100 MALES
37.9
MEDIAN AGE
3.2
AVG FAMILY SIZE
2.7
AVG HOUSEHOLD SIZE
30,539
LABOR FORCE [ PEOPLE ]
75.3%
PERCENT IN LABOR FORCE
3.8%
UNEMPLOYMENT RATE
Aliso Viejo Zip Codes
Income in Aliso Viejo
Income Overview in Aliso Viejo
Per Capita Income in Aliso Viejo is $59,852, while median incomes of families and households are $153,877 and $131,708 respectively.
| Characteristic | Number | Measure |
| Per Capita Income | 51,896 | $59,852 |
| Median Family Income | 13,215 | $153,877 |
| Mean Family Income | 13,215 | $176,662 |
| Median Household Income | 19,300 | $131,708 |
| Mean Household Income | 19,300 | $158,017 |
| Income Deficit | 13,215 | $0 |
| Wage / Income Gap (%) | 51,896 | 26.96% |
| Wage / Income Gap ($) | 51,896 | 73.04¢ per $1 |
| Gini / Inequality Index | 51,896 | 0.40 |
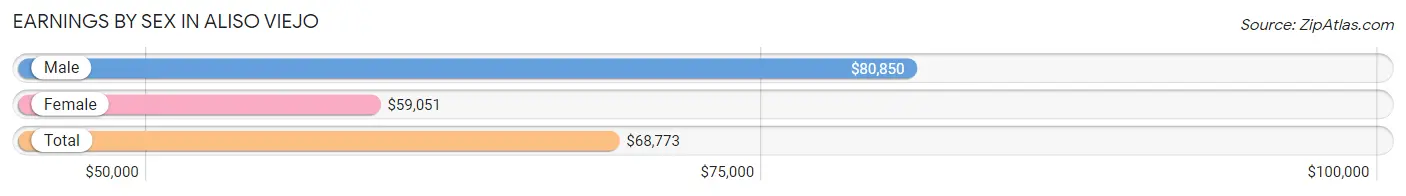
Earnings by Sex in Aliso Viejo
Average Earnings in Aliso Viejo are $68,773, $80,850 for men and $59,051 for women, a difference of 27.0%.
| Sex | Number | Average Earnings |
| Male | 16,495 (52.9%) | $80,850 |
| Female | 14,669 (47.1%) | $59,051 |
| Total | 31,164 (100.0%) | $68,773 |
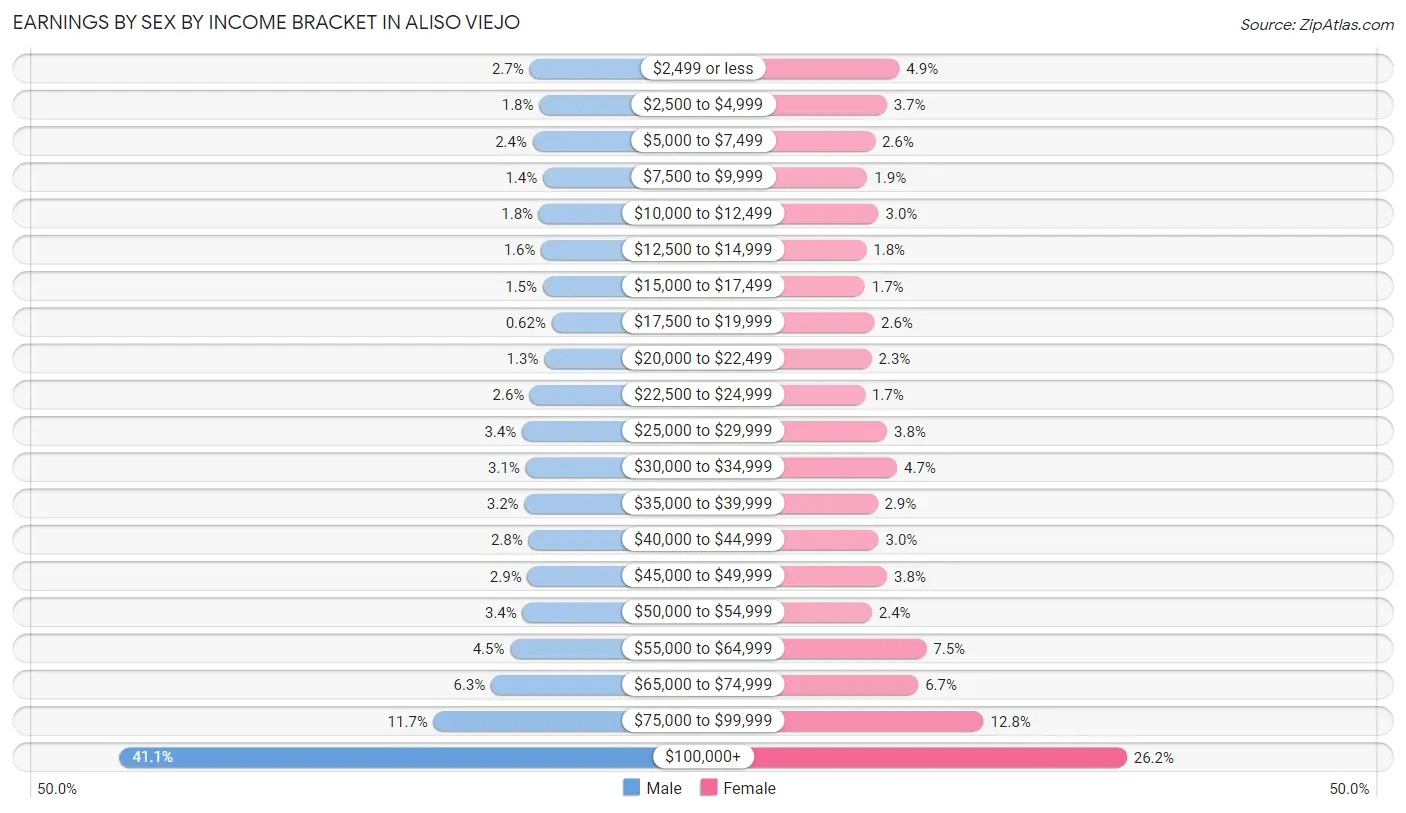
Earnings by Sex by Income Bracket in Aliso Viejo
The most common earnings brackets in Aliso Viejo are $100,000+ for men (6,777 | 41.1%) and $100,000+ for women (3,848 | 26.2%).
| Income | Male | Female |
| $2,499 or less | 446 (2.7%) | 723 (4.9%) |
| $2,500 to $4,999 | 294 (1.8%) | 549 (3.7%) |
| $5,000 to $7,499 | 395 (2.4%) | 387 (2.6%) |
| $7,500 to $9,999 | 236 (1.4%) | 283 (1.9%) |
| $10,000 to $12,499 | 301 (1.8%) | 437 (3.0%) |
| $12,500 to $14,999 | 264 (1.6%) | 268 (1.8%) |
| $15,000 to $17,499 | 239 (1.5%) | 248 (1.7%) |
| $17,500 to $19,999 | 103 (0.6%) | 375 (2.6%) |
| $20,000 to $22,499 | 217 (1.3%) | 340 (2.3%) |
| $22,500 to $24,999 | 435 (2.6%) | 250 (1.7%) |
| $25,000 to $29,999 | 561 (3.4%) | 555 (3.8%) |
| $30,000 to $34,999 | 505 (3.1%) | 691 (4.7%) |
| $35,000 to $39,999 | 524 (3.2%) | 422 (2.9%) |
| $40,000 to $44,999 | 461 (2.8%) | 437 (3.0%) |
| $45,000 to $49,999 | 476 (2.9%) | 555 (3.8%) |
| $50,000 to $54,999 | 552 (3.4%) | 345 (2.4%) |
| $55,000 to $64,999 | 742 (4.5%) | 1,093 (7.4%) |
| $65,000 to $74,999 | 1,040 (6.3%) | 982 (6.7%) |
| $75,000 to $99,999 | 1,927 (11.7%) | 1,881 (12.8%) |
| $100,000+ | 6,777 (41.1%) | 3,848 (26.2%) |
| Total | 16,495 (100.0%) | 14,669 (100.0%) |
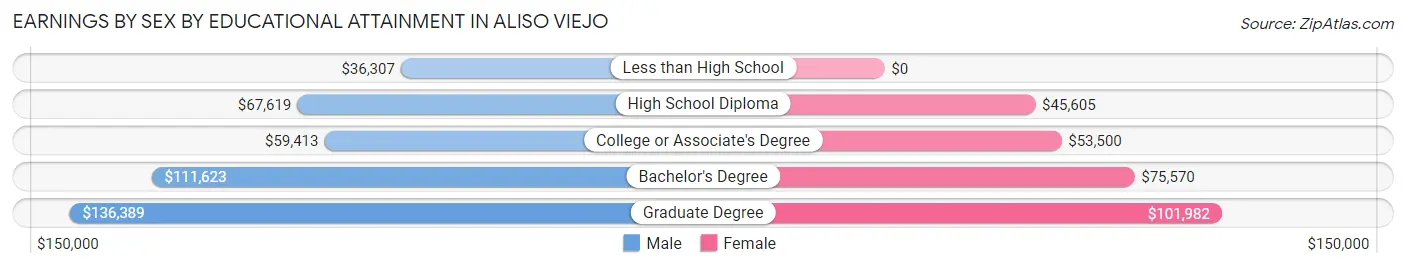
Earnings by Sex by Educational Attainment in Aliso Viejo
Average earnings in Aliso Viejo are $93,082 for men and $67,131 for women, a difference of 27.9%. Men with an educational attainment of graduate degree enjoy the highest average annual earnings of $136,389, while those with less than high school education earn the least with $36,307. Women with an educational attainment of graduate degree earn the most with the average annual earnings of $101,982, while those with high school diploma education have the smallest earnings of $45,605.
| Educational Attainment | Male Income | Female Income |
| Less than High School | $36,307 | $0 |
| High School Diploma | $67,619 | $45,605 |
| College or Associate's Degree | $59,413 | $53,500 |
| Bachelor's Degree | $111,623 | $75,570 |
| Graduate Degree | $136,389 | $101,982 |
| Total | $93,082 | $67,131 |
Family Income in Aliso Viejo
Family Income Brackets in Aliso Viejo
According to the Aliso Viejo family income data, there are 4,004 families falling into the $200,000+ income range, which is the most common income bracket and makes up 30.3% of all families. Conversely, the $10,000 to $14,999 income bracket is the least frequent group with only 119 families (0.9%) belonging to this category.
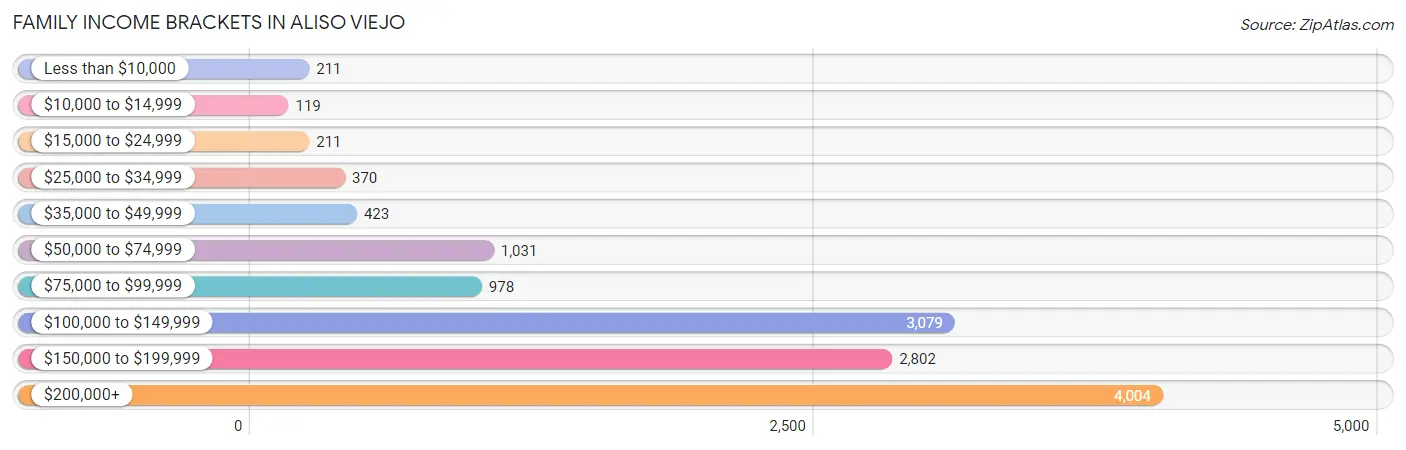
| Income Bracket | # Families | % Families |
| Less than $10,000 | 211 | 1.6% |
| $10,000 to $14,999 | 119 | 0.9% |
| $15,000 to $24,999 | 211 | 1.6% |
| $25,000 to $34,999 | 370 | 2.8% |
| $35,000 to $49,999 | 423 | 3.2% |
| $50,000 to $74,999 | 1,031 | 7.8% |
| $75,000 to $99,999 | 978 | 7.4% |
| $100,000 to $149,999 | 3,079 | 23.3% |
| $150,000 to $199,999 | 2,802 | 21.2% |
| $200,000+ | 4,004 | 30.3% |
Family Income by Famaliy Size in Aliso Viejo
7+ person families (118 | 0.9%) account for the highest median family income in Aliso Viejo with $250,001 per family, while 2-person families (5,080 | 38.4%) have the highest median income of $72,515 per family member.
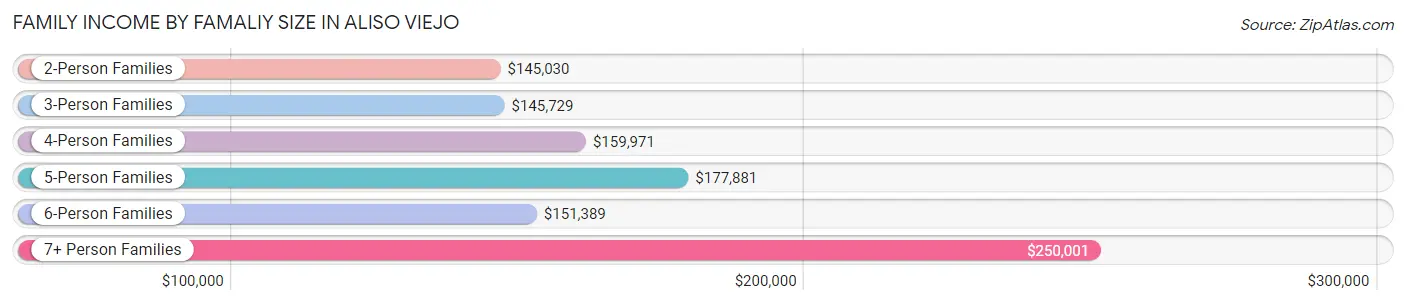
| Income Bracket | # Families | Median Income |
| 2-Person Families | 5,080 (38.4%) | $145,030 |
| 3-Person Families | 3,488 (26.4%) | $145,729 |
| 4-Person Families | 3,084 (23.3%) | $159,971 |
| 5-Person Families | 1,089 (8.2%) | $177,881 |
| 6-Person Families | 356 (2.7%) | $151,389 |
| 7+ Person Families | 118 (0.9%) | $250,001 |
| Total | 13,215 (100.0%) | $153,877 |
Family Income by Number of Earners in Aliso Viejo
The median family income in Aliso Viejo is $153,877, with families comprising 3+ earners (1,649) having the highest median family income of $178,750, while families with no earners (532) have the lowest median family income of $62,727, accounting for 12.5% and 4.0% of families, respectively.
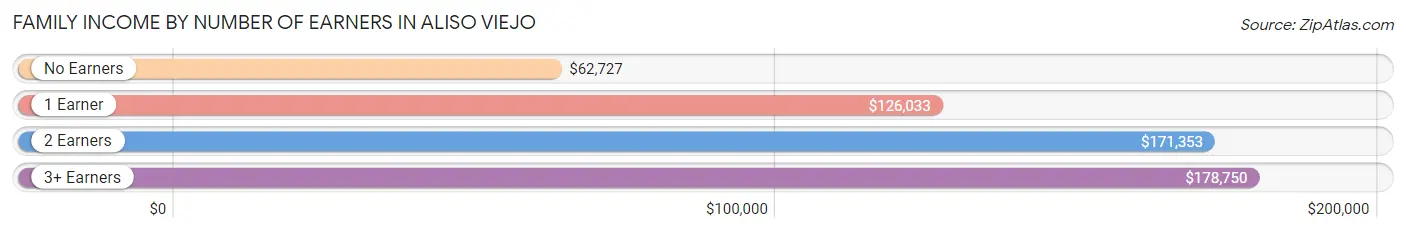
| Number of Earners | # Families | Median Income |
| No Earners | 532 (4.0%) | $62,727 |
| 1 Earner | 4,062 (30.7%) | $126,033 |
| 2 Earners | 6,972 (52.8%) | $171,353 |
| 3+ Earners | 1,649 (12.5%) | $178,750 |
| Total | 13,215 (100.0%) | $153,877 |
Household Income in Aliso Viejo
Household Income Brackets in Aliso Viejo
With 4,825 households falling in the category, the $200,000+ income range is the most frequent in Aliso Viejo, accounting for 25.0% of all households. In contrast, only 154 households (0.8%) fall into the $10,000 to $14,999 income bracket, making it the least populous group.
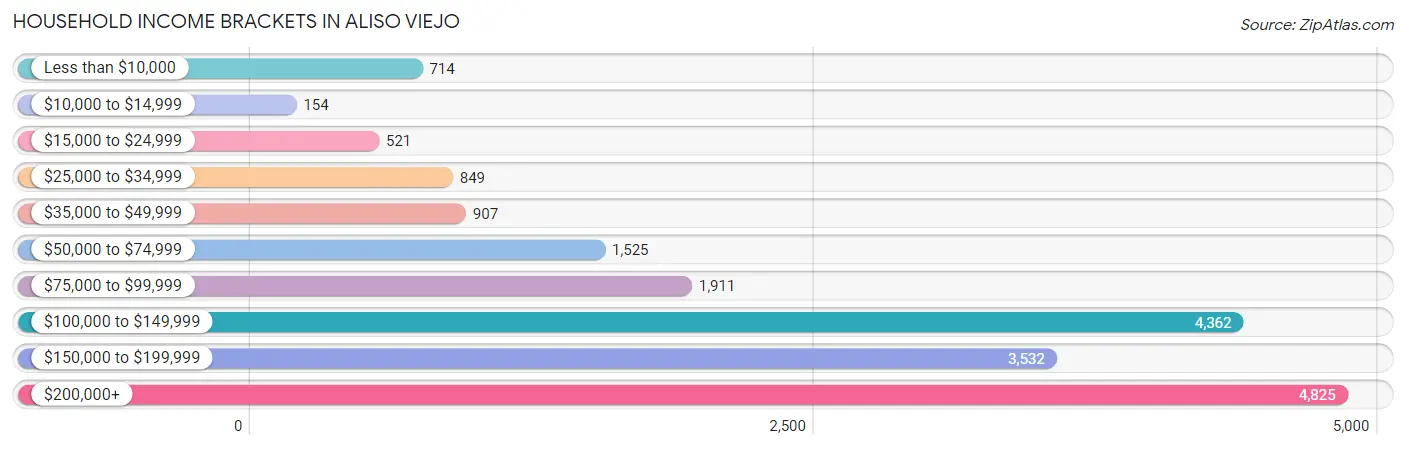
| Income Bracket | # Households | % Households |
| Less than $10,000 | 714 | 3.7% |
| $10,000 to $14,999 | 154 | 0.8% |
| $15,000 to $24,999 | 521 | 2.7% |
| $25,000 to $34,999 | 849 | 4.4% |
| $35,000 to $49,999 | 907 | 4.7% |
| $50,000 to $74,999 | 1,525 | 7.9% |
| $75,000 to $99,999 | 1,911 | 9.9% |
| $100,000 to $149,999 | 4,362 | 22.6% |
| $150,000 to $199,999 | 3,532 | 18.3% |
| $200,000+ | 4,825 | 25.0% |
Household Income by Householder Age in Aliso Viejo
The median household income in Aliso Viejo is $131,708, with the highest median household income of $151,781 found in the 45 to 64 years age bracket for the primary householder. A total of 8,762 households (45.4%) fall into this category. Meanwhile, the 15 to 24 years age bracket for the primary householder has the lowest median household income of $0, with 303 households (1.6%) in this group.
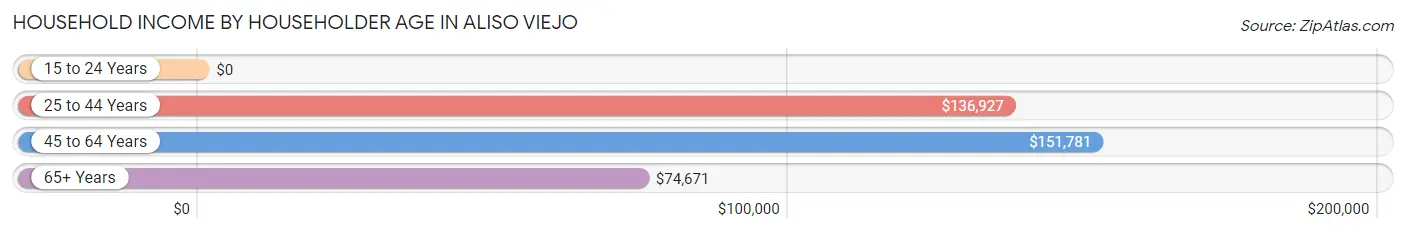
| Income Bracket | # Households | Median Income |
| 15 to 24 Years | 303 (1.6%) | $0 |
| 25 to 44 Years | 7,138 (37.0%) | $136,927 |
| 45 to 64 Years | 8,762 (45.4%) | $151,781 |
| 65+ Years | 3,097 (16.1%) | $74,671 |
| Total | 19,300 (100.0%) | $131,708 |
Poverty in Aliso Viejo
Income Below Poverty by Sex and Age in Aliso Viejo
With 4.5% poverty level for males and 5.3% for females among the residents of Aliso Viejo, 75 year old and over males and 75 year old and over females are the most vulnerable to poverty, with 100 males (11.8%) and 175 females (12.6%) in their respective age groups living below the poverty level.
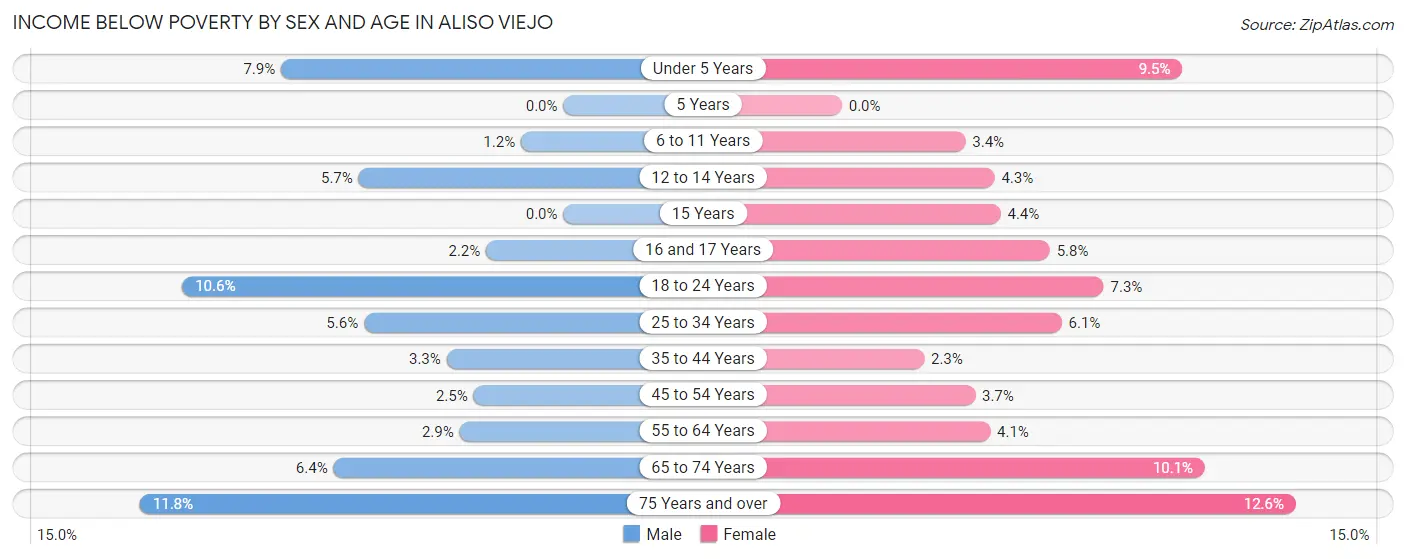
| Age Bracket | Male | Female |
| Under 5 Years | 130 (7.9%) | 176 (9.5%) |
| 5 Years | 0 (0.0%) | 0 (0.0%) |
| 6 to 11 Years | 21 (1.2%) | 72 (3.4%) |
| 12 to 14 Years | 76 (5.7%) | 55 (4.3%) |
| 15 Years | 0 (0.0%) | 10 (4.4%) |
| 16 and 17 Years | 17 (2.1%) | 40 (5.8%) |
| 18 to 24 Years | 185 (10.6%) | 138 (7.3%) |
| 25 to 34 Years | 184 (5.6%) | 197 (6.1%) |
| 35 to 44 Years | 134 (3.3%) | 102 (2.3%) |
| 45 to 54 Years | 104 (2.5%) | 149 (3.7%) |
| 55 to 64 Years | 92 (2.9%) | 144 (4.1%) |
| 65 to 74 Years | 82 (6.4%) | 153 (10.1%) |
| 75 Years and over | 100 (11.8%) | 175 (12.6%) |
| Total | 1,125 (4.5%) | 1,411 (5.3%) |
Income Above Poverty by Sex and Age in Aliso Viejo
According to the poverty statistics in Aliso Viejo, males aged 5 years and females aged 5 years are the age groups that are most secure financially, with 100.0% of males and 100.0% of females in these age groups living above the poverty line.
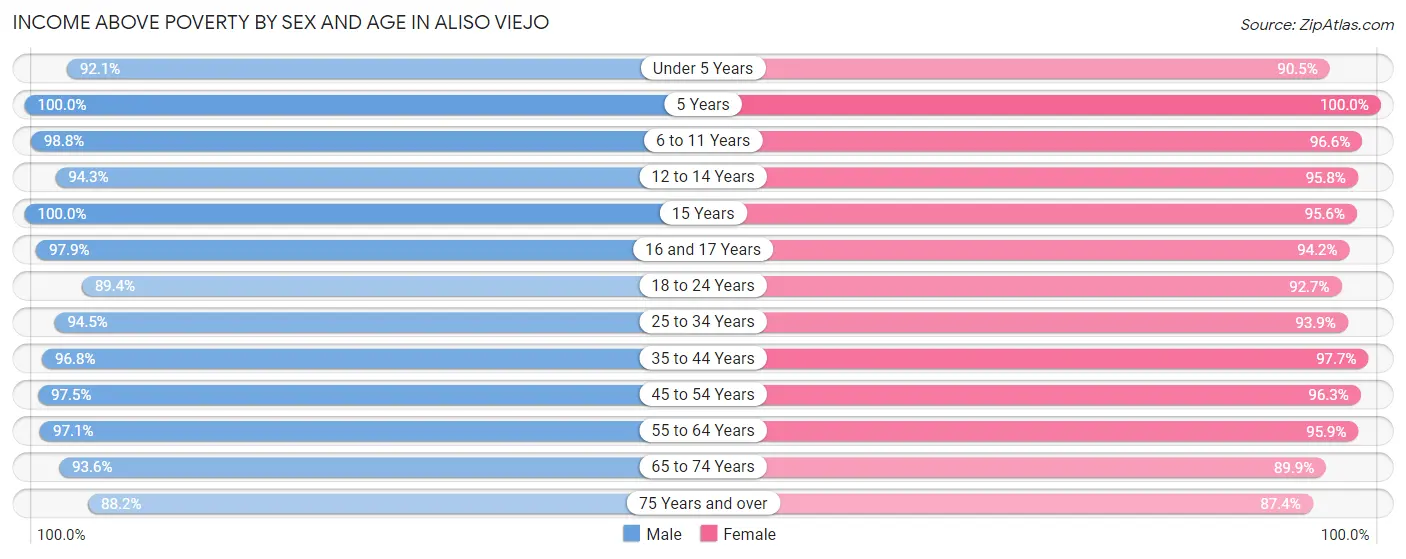
| Age Bracket | Male | Female |
| Under 5 Years | 1,524 (92.1%) | 1,681 (90.5%) |
| 5 Years | 259 (100.0%) | 350 (100.0%) |
| 6 to 11 Years | 1,763 (98.8%) | 2,024 (96.6%) |
| 12 to 14 Years | 1,257 (94.3%) | 1,238 (95.8%) |
| 15 Years | 334 (100.0%) | 216 (95.6%) |
| 16 and 17 Years | 774 (97.9%) | 651 (94.2%) |
| 18 to 24 Years | 1,559 (89.4%) | 1,756 (92.7%) |
| 25 to 34 Years | 3,133 (94.5%) | 3,022 (93.9%) |
| 35 to 44 Years | 3,984 (96.8%) | 4,355 (97.7%) |
| 45 to 54 Years | 4,060 (97.5%) | 3,869 (96.3%) |
| 55 to 64 Years | 3,089 (97.1%) | 3,341 (95.9%) |
| 65 to 74 Years | 1,200 (93.6%) | 1,360 (89.9%) |
| 75 Years and over | 748 (88.2%) | 1,209 (87.4%) |
| Total | 23,684 (95.5%) | 25,072 (94.7%) |
Income Below Poverty Among Married-Couple Families in Aliso Viejo
The poverty statistics for married-couple families in Aliso Viejo show that 3.0% or 308 of the total 10,401 families live below the poverty line. Families with 3 or 4 children have the highest poverty rate of 5.6%, comprising of 45 families. On the other hand, families with 5 or more children have the lowest poverty rate of 0.0%, which includes 0 families.
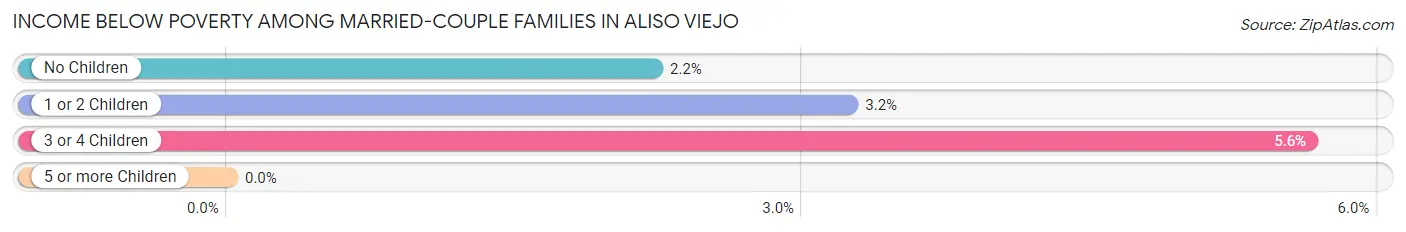
| Children | Above Poverty | Below Poverty |
| No Children | 4,502 (97.8%) | 102 (2.2%) |
| 1 or 2 Children | 4,810 (96.8%) | 161 (3.2%) |
| 3 or 4 Children | 753 (94.4%) | 45 (5.6%) |
| 5 or more Children | 28 (100.0%) | 0 (0.0%) |
| Total | 10,093 (97.0%) | 308 (3.0%) |
Income Below Poverty Among Single-Parent Households in Aliso Viejo
According to the poverty data in Aliso Viejo, 1.3% or 10 single-father households and 5.1% or 103 single-mother households are living below the poverty line. Among single-father households, those with 1 or 2 children have the highest poverty rate, with 10 households (3.5%) experiencing poverty. Likewise, among single-mother households, those with 3 or 4 children have the highest poverty rate, with 19 households (23.2%) falling below the poverty line.
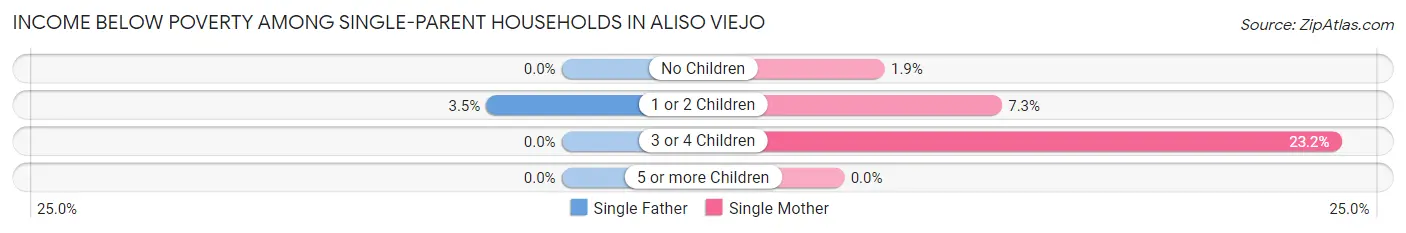
| Children | Single Father | Single Mother |
| No Children | 0 (0.0%) | 20 (1.9%) |
| 1 or 2 Children | 10 (3.5%) | 64 (7.3%) |
| 3 or 4 Children | 0 (0.0%) | 19 (23.2%) |
| 5 or more Children | 0 (0.0%) | 0 (0.0%) |
| Total | 10 (1.3%) | 103 (5.1%) |
Income Below Poverty Among Married-Couple vs Single-Parent Households in Aliso Viejo
The poverty data for Aliso Viejo shows that 308 of the married-couple family households (3.0%) and 113 of the single-parent households (4.0%) are living below the poverty level. Within the married-couple family households, those with 3 or 4 children have the highest poverty rate, with 45 households (5.6%) falling below the poverty line. Among the single-parent households, those with 3 or 4 children have the highest poverty rate, with 19 household (17.0%) living below poverty.
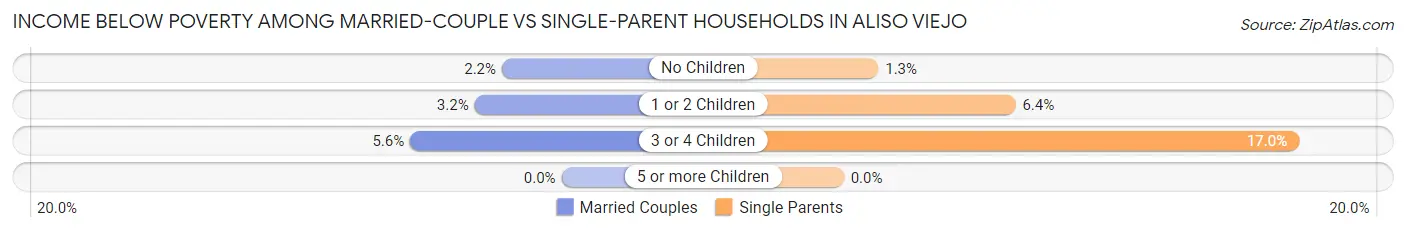
| Children | Married-Couple Families | Single-Parent Households |
| No Children | 102 (2.2%) | 20 (1.3%) |
| 1 or 2 Children | 161 (3.2%) | 74 (6.4%) |
| 3 or 4 Children | 45 (5.6%) | 19 (17.0%) |
| 5 or more Children | 0 (0.0%) | 0 (0.0%) |
| Total | 308 (3.0%) | 113 (4.0%) |
Race in Aliso Viejo
The most populous races in Aliso Viejo are White / Caucasian (32,776 | 63.2%), Hispanic or Latino (10,392 | 20.0%), and Asian (8,328 | 16.1%).
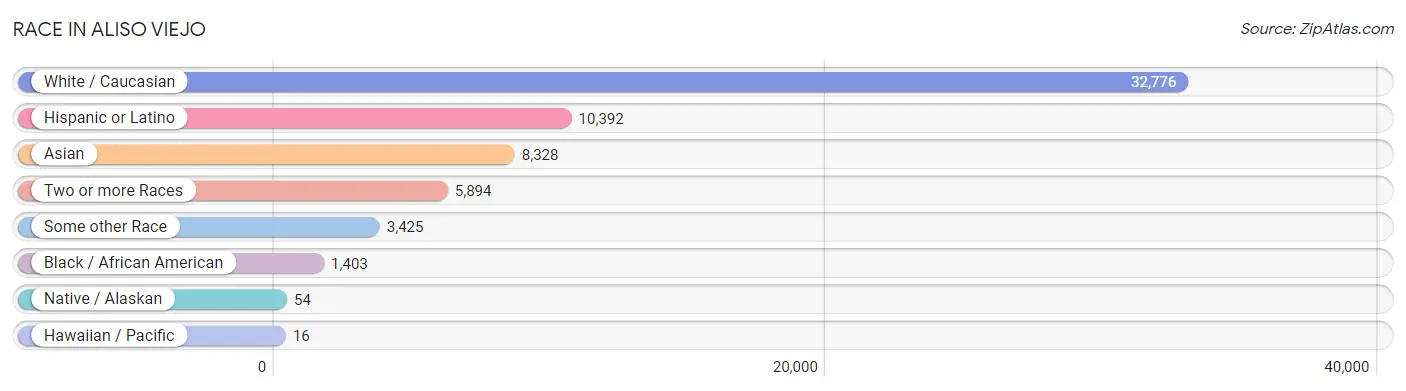
| Race | # Population | % Population |
| Asian | 8,328 | 16.1% |
| Black / African American | 1,403 | 2.7% |
| Hawaiian / Pacific | 16 | 0.0% |
| Hispanic or Latino | 10,392 | 20.0% |
| Native / Alaskan | 54 | 0.1% |
| White / Caucasian | 32,776 | 63.2% |
| Two or more Races | 5,894 | 11.4% |
| Some other Race | 3,425 | 6.6% |
| Total | 51,896 | 100.0% |
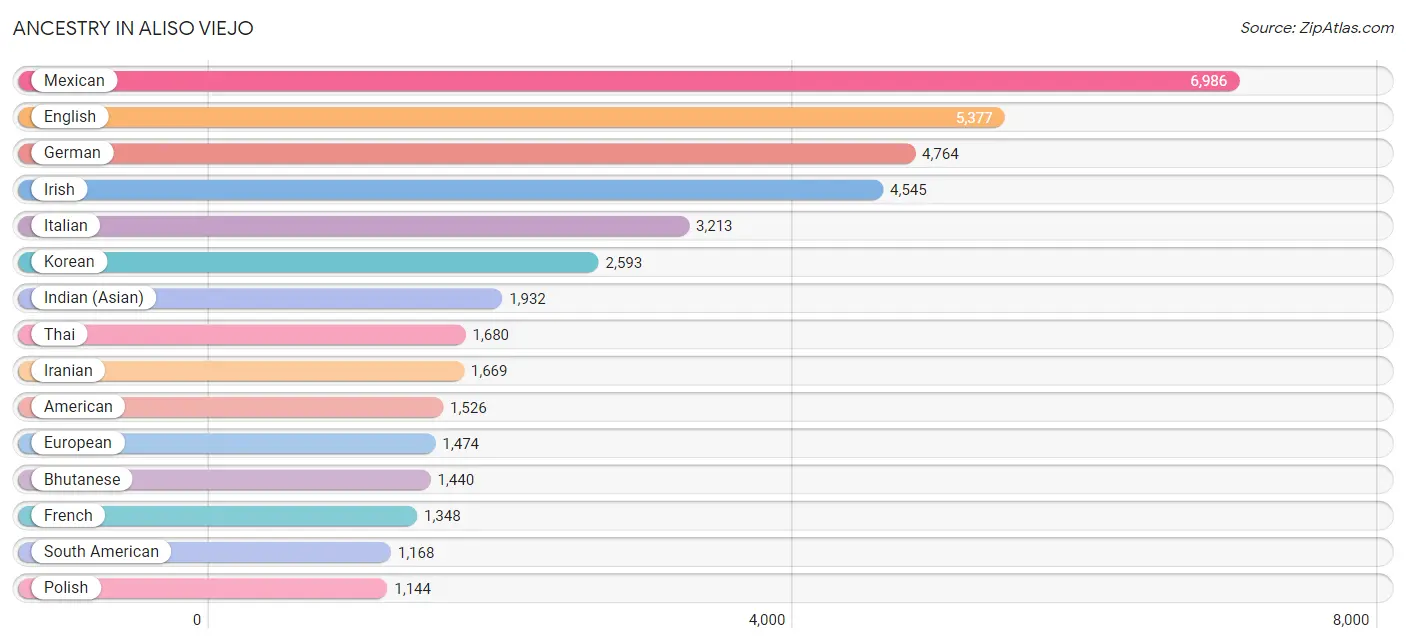
Ancestry in Aliso Viejo
The most populous ancestries reported in Aliso Viejo are Mexican (6,986 | 13.5%), English (5,377 | 10.4%), German (4,764 | 9.2%), Irish (4,545 | 8.8%), and Italian (3,213 | 6.2%), together accounting for 48.0% of all Aliso Viejo residents.
| Ancestry | # Population | % Population |
| Afghan | 49 | 0.1% |
| African | 233 | 0.4% |
| Albanian | 80 | 0.2% |
| American | 1,526 | 2.9% |
| Apache | 53 | 0.1% |
| Arab | 847 | 1.6% |
| Argentinean | 185 | 0.4% |
| Armenian | 369 | 0.7% |
| Assyrian / Chaldean / Syriac | 113 | 0.2% |
| Australian | 59 | 0.1% |
| Austrian | 68 | 0.1% |
| Barbadian | 13 | 0.0% |
| Basque | 10 | 0.0% |
| Belgian | 85 | 0.2% |
| Belizean | 8 | 0.0% |
| Bhutanese | 1,440 | 2.8% |
| Blackfeet | 23 | 0.0% |
| Brazilian | 43 | 0.1% |
| British | 641 | 1.2% |
| British West Indian | 22 | 0.0% |
| Burmese | 893 | 1.7% |
| Canadian | 354 | 0.7% |
| Central American | 1,000 | 1.9% |
| Central American Indian | 80 | 0.2% |
| Cherokee | 116 | 0.2% |
| Chilean | 36 | 0.1% |
| Chinese | 10 | 0.0% |
| Choctaw | 18 | 0.0% |
| Colombian | 469 | 0.9% |
| Costa Rican | 218 | 0.4% |
| Creek | 29 | 0.1% |
| Croatian | 55 | 0.1% |
| Cuban | 314 | 0.6% |
| Czech | 266 | 0.5% |
| Czechoslovakian | 14 | 0.0% |
| Danish | 257 | 0.5% |
| Dominican | 35 | 0.1% |
| Dutch | 584 | 1.1% |
| Eastern European | 201 | 0.4% |
| Ecuadorian | 148 | 0.3% |
| Egyptian | 189 | 0.4% |
| English | 5,377 | 10.4% |
| European | 1,474 | 2.8% |
| Filipino | 265 | 0.5% |
| Finnish | 69 | 0.1% |
| French | 1,348 | 2.6% |
| French Canadian | 300 | 0.6% |
| German | 4,764 | 9.2% |
| Greek | 453 | 0.9% |
| Guamanian / Chamorro | 24 | 0.1% |
| Guatemalan | 163 | 0.3% |
| Hmong | 13 | 0.0% |
| Honduran | 59 | 0.1% |
| Hungarian | 342 | 0.7% |
| Icelander | 18 | 0.0% |
| Indian (Asian) | 1,932 | 3.7% |
| Indonesian | 5 | 0.0% |
| Iranian | 1,669 | 3.2% |
| Iraqi | 12 | 0.0% |
| Irish | 4,545 | 8.8% |
| Israeli | 90 | 0.2% |
| Italian | 3,213 | 6.2% |
| Jamaican | 33 | 0.1% |
| Japanese | 33 | 0.1% |
| Korean | 2,593 | 5.0% |
| Laotian | 53 | 0.1% |
| Latvian | 11 | 0.0% |
| Lebanese | 498 | 1.0% |
| Lithuanian | 56 | 0.1% |
| Malaysian | 7 | 0.0% |
| Mexican | 6,986 | 13.5% |
| Mexican American Indian | 93 | 0.2% |
| Native Hawaiian | 280 | 0.5% |
| Navajo | 7 | 0.0% |
| New Zealander | 30 | 0.1% |
| Nicaraguan | 68 | 0.1% |
| Nigerian | 88 | 0.2% |
| Northern European | 123 | 0.2% |
| Norwegian | 672 | 1.3% |
| Okinawan | 24 | 0.1% |
| Pakistani | 58 | 0.1% |
| Palestinian | 6 | 0.0% |
| Paraguayan | 29 | 0.1% |
| Pennsylvania German | 36 | 0.1% |
| Peruvian | 145 | 0.3% |
| Polish | 1,144 | 2.2% |
| Portuguese | 342 | 0.7% |
| Puerto Rican | 161 | 0.3% |
| Romanian | 166 | 0.3% |
| Russian | 964 | 1.9% |
| Salvadoran | 492 | 0.9% |
| Samoan | 26 | 0.1% |
| Scandinavian | 120 | 0.2% |
| Scotch-Irish | 312 | 0.6% |
| Scottish | 896 | 1.7% |
| Serbian | 42 | 0.1% |
| Slavic | 42 | 0.1% |
| Slovak | 43 | 0.1% |
| South African | 35 | 0.1% |
| South American | 1,168 | 2.2% |
| Spaniard | 313 | 0.6% |
| Spanish | 321 | 0.6% |
| Sri Lankan | 978 | 1.9% |
| Subsaharan African | 408 | 0.8% |
| Sudanese | 52 | 0.1% |
| Swedish | 524 | 1.0% |
| Swiss | 125 | 0.2% |
| Syrian | 26 | 0.1% |
| Thai | 1,680 | 3.2% |
| Turkish | 87 | 0.2% |
| Ukrainian | 469 | 0.9% |
| Venezuelan | 156 | 0.3% |
| Welsh | 106 | 0.2% |
| Yugoslavian | 64 | 0.1% | View All 114 Rows |
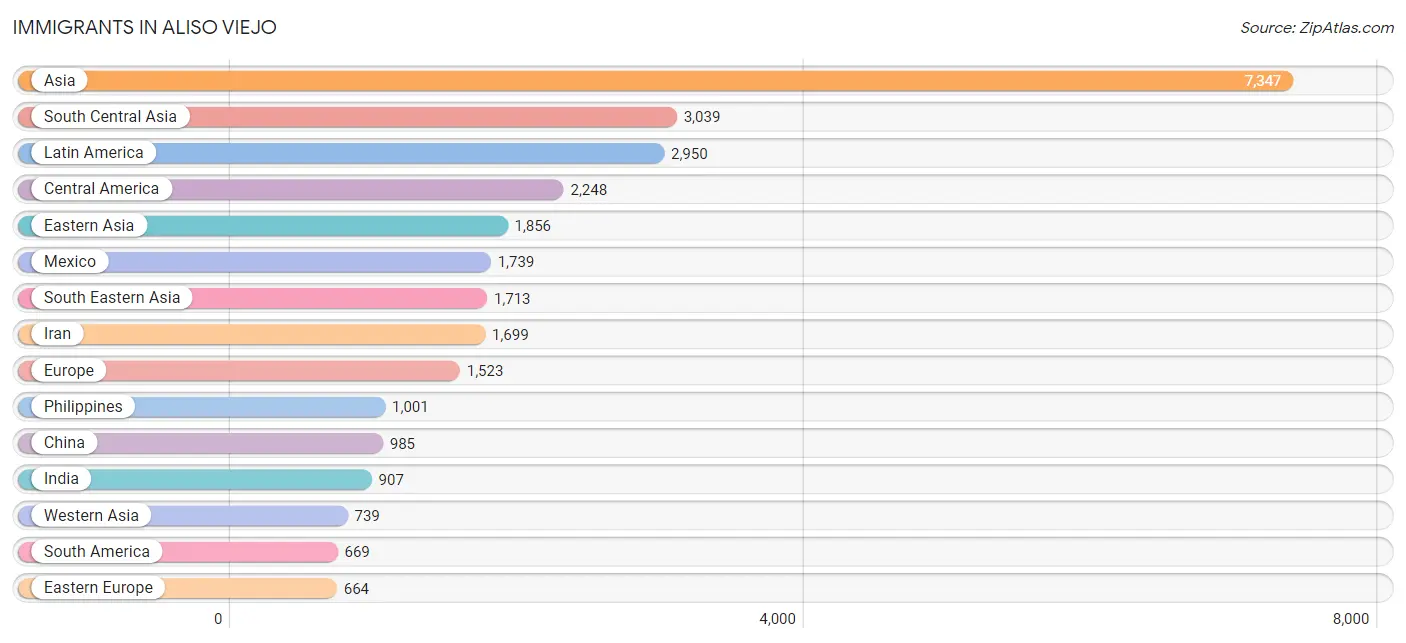
Immigrants in Aliso Viejo
The most numerous immigrant groups reported in Aliso Viejo came from Asia (7,347 | 14.2%), South Central Asia (3,039 | 5.9%), Latin America (2,950 | 5.7%), Central America (2,248 | 4.3%), and Eastern Asia (1,856 | 3.6%), together accounting for 33.6% of all Aliso Viejo residents.
| Immigration Origin | # Population | % Population |
| Afghanistan | 24 | 0.1% |
| Africa | 308 | 0.6% |
| Argentina | 104 | 0.2% |
| Armenia | 31 | 0.1% |
| Asia | 7,347 | 14.2% |
| Australia | 55 | 0.1% |
| Austria | 12 | 0.0% |
| Belgium | 11 | 0.0% |
| Belize | 8 | 0.0% |
| Brazil | 47 | 0.1% |
| Cambodia | 16 | 0.0% |
| Canada | 305 | 0.6% |
| Caribbean | 33 | 0.1% |
| Central America | 2,248 | 4.3% |
| Chile | 36 | 0.1% |
| China | 985 | 1.9% |
| Colombia | 252 | 0.5% |
| Costa Rica | 134 | 0.3% |
| Cuba | 23 | 0.0% |
| Denmark | 19 | 0.0% |
| Eastern Africa | 24 | 0.1% |
| Eastern Asia | 1,856 | 3.6% |
| Eastern Europe | 664 | 1.3% |
| Ecuador | 11 | 0.0% |
| Egypt | 157 | 0.3% |
| El Salvador | 235 | 0.4% |
| England | 203 | 0.4% |
| Europe | 1,523 | 2.9% |
| France | 63 | 0.1% |
| Germany | 233 | 0.4% |
| Guatemala | 27 | 0.1% |
| Honduras | 59 | 0.1% |
| Hong Kong | 86 | 0.2% |
| Hungary | 16 | 0.0% |
| India | 907 | 1.8% |
| Indonesia | 66 | 0.1% |
| Iran | 1,699 | 3.3% |
| Iraq | 12 | 0.0% |
| Ireland | 16 | 0.0% |
| Israel | 90 | 0.2% |
| Italy | 161 | 0.3% |
| Jamaica | 10 | 0.0% |
| Japan | 382 | 0.7% |
| Kenya | 24 | 0.1% |
| Korea | 489 | 0.9% |
| Latin America | 2,950 | 5.7% |
| Latvia | 11 | 0.0% |
| Lebanon | 340 | 0.7% |
| Malaysia | 49 | 0.1% |
| Mexico | 1,739 | 3.4% |
| Nepal | 42 | 0.1% |
| Netherlands | 37 | 0.1% |
| Nicaragua | 46 | 0.1% |
| Northern Africa | 209 | 0.4% |
| Northern Europe | 297 | 0.6% |
| Oceania | 55 | 0.1% |
| Pakistan | 248 | 0.5% |
| Peru | 128 | 0.3% |
| Philippines | 1,001 | 1.9% |
| Poland | 44 | 0.1% |
| Portugal | 16 | 0.0% |
| Romania | 84 | 0.2% |
| Russia | 299 | 0.6% |
| Saudi Arabia | 21 | 0.0% |
| Singapore | 23 | 0.0% |
| South Africa | 35 | 0.1% |
| South America | 669 | 1.3% |
| South Central Asia | 3,039 | 5.9% |
| South Eastern Asia | 1,713 | 3.3% |
| Southern Europe | 184 | 0.4% |
| Spain | 7 | 0.0% |
| Sri Lanka | 119 | 0.2% |
| Sudan | 52 | 0.1% |
| Switzerland | 22 | 0.0% |
| Syria | 52 | 0.1% |
| Taiwan | 392 | 0.8% |
| Thailand | 73 | 0.1% |
| Turkey | 40 | 0.1% |
| Ukraine | 197 | 0.4% |
| Venezuela | 79 | 0.2% |
| Vietnam | 477 | 0.9% |
| Western Africa | 40 | 0.1% |
| Western Asia | 739 | 1.4% |
| Western Europe | 378 | 0.7% | View All 84 Rows |
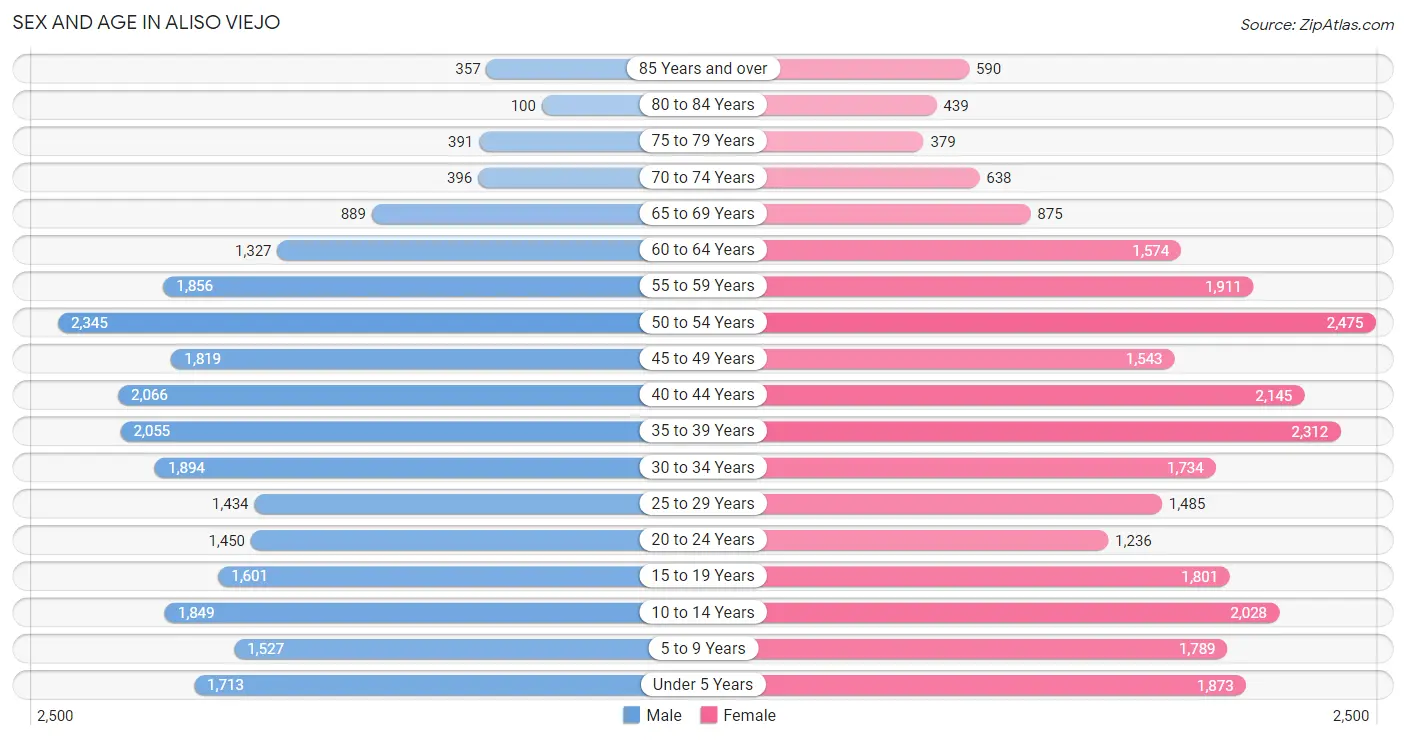
Sex and Age in Aliso Viejo
Sex and Age in Aliso Viejo
The most populous age groups in Aliso Viejo are 50 to 54 Years (2,345 | 9.3%) for men and 50 to 54 Years (2,475 | 9.2%) for women.
| Age Bracket | Male | Female |
| Under 5 Years | 1,713 (6.8%) | 1,873 (7.0%) |
| 5 to 9 Years | 1,527 (6.1%) | 1,789 (6.7%) |
| 10 to 14 Years | 1,849 (7.4%) | 2,028 (7.6%) |
| 15 to 19 Years | 1,601 (6.4%) | 1,801 (6.7%) |
| 20 to 24 Years | 1,450 (5.8%) | 1,236 (4.6%) |
| 25 to 29 Years | 1,434 (5.7%) | 1,485 (5.5%) |
| 30 to 34 Years | 1,894 (7.6%) | 1,734 (6.5%) |
| 35 to 39 Years | 2,055 (8.2%) | 2,312 (8.6%) |
| 40 to 44 Years | 2,066 (8.2%) | 2,145 (8.0%) |
| 45 to 49 Years | 1,819 (7.3%) | 1,543 (5.8%) |
| 50 to 54 Years | 2,345 (9.3%) | 2,475 (9.2%) |
| 55 to 59 Years | 1,856 (7.4%) | 1,911 (7.1%) |
| 60 to 64 Years | 1,327 (5.3%) | 1,574 (5.9%) |
| 65 to 69 Years | 889 (3.5%) | 875 (3.3%) |
| 70 to 74 Years | 396 (1.6%) | 638 (2.4%) |
| 75 to 79 Years | 391 (1.6%) | 379 (1.4%) |
| 80 to 84 Years | 100 (0.4%) | 439 (1.6%) |
| 85 Years and over | 357 (1.4%) | 590 (2.2%) |
| Total | 25,069 (100.0%) | 26,827 (100.0%) |
Families and Households in Aliso Viejo
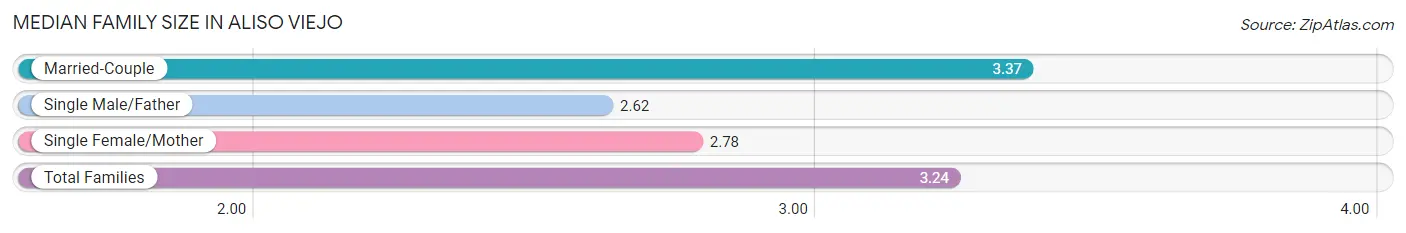
Median Family Size in Aliso Viejo
The median family size in Aliso Viejo is 3.24 persons per family, with married-couple families (10,401 | 78.7%) accounting for the largest median family size of 3.37 persons per family. On the other hand, single male/father families (794 | 6.0%) represent the smallest median family size with 2.62 persons per family.
| Family Type | # Families | Family Size |
| Married-Couple | 10,401 (78.7%) | 3.37 |
| Single Male/Father | 794 (6.0%) | 2.62 |
| Single Female/Mother | 2,020 (15.3%) | 2.78 |
| Total Families | 13,215 (100.0%) | 3.24 |
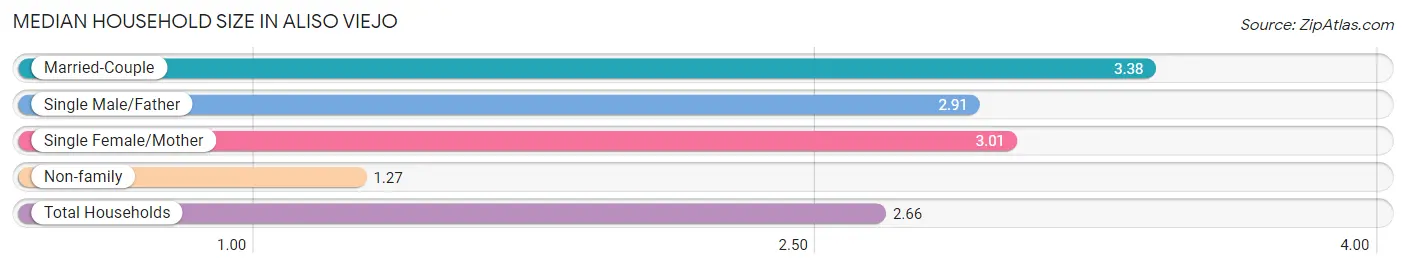
Median Household Size in Aliso Viejo
The median household size in Aliso Viejo is 2.66 persons per household, with married-couple households (10,401 | 53.9%) accounting for the largest median household size of 3.38 persons per household. non-family households (6,085 | 31.5%) represent the smallest median household size with 1.27 persons per household.
| Household Type | # Households | Household Size |
| Married-Couple | 10,401 (53.9%) | 3.38 |
| Single Male/Father | 794 (4.1%) | 2.91 |
| Single Female/Mother | 2,020 (10.5%) | 3.01 |
| Non-family | 6,085 (31.5%) | 1.27 |
| Total Households | 19,300 (100.0%) | 2.66 |
Household Size by Marriage Status in Aliso Viejo
Out of a total of 19,300 households in Aliso Viejo, 13,215 (68.5%) are family households, while 6,085 (31.5%) are nonfamily households. The most numerous type of family households are 2-person households, comprising 4,811, and the most common type of nonfamily households are 1-person households, comprising 4,787.
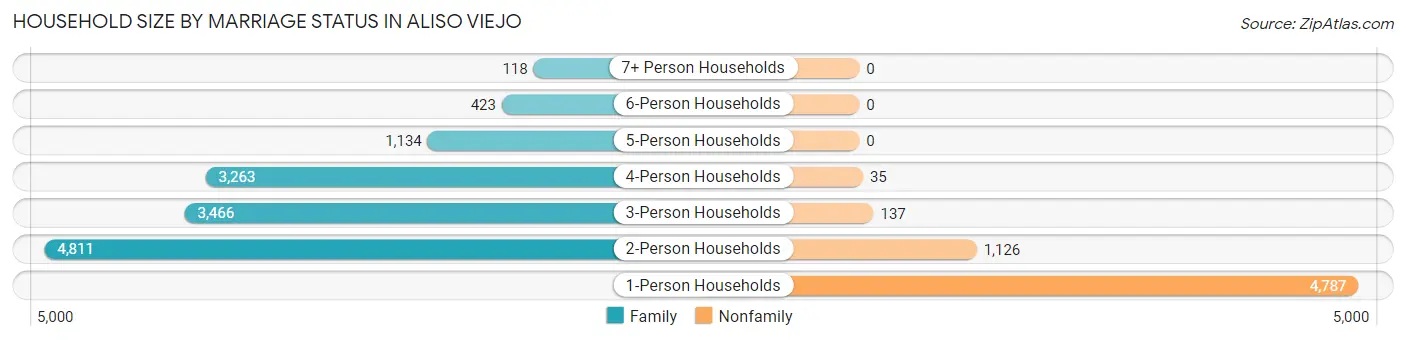
| Household Size | Family Households | Nonfamily Households |
| 1-Person Households | - | 4,787 (24.8%) |
| 2-Person Households | 4,811 (24.9%) | 1,126 (5.8%) |
| 3-Person Households | 3,466 (18.0%) | 137 (0.7%) |
| 4-Person Households | 3,263 (16.9%) | 35 (0.2%) |
| 5-Person Households | 1,134 (5.9%) | 0 (0.0%) |
| 6-Person Households | 423 (2.2%) | 0 (0.0%) |
| 7+ Person Households | 118 (0.6%) | 0 (0.0%) |
| Total | 13,215 (68.5%) | 6,085 (31.5%) |
Female Fertility in Aliso Viejo
Fertility by Age in Aliso Viejo
Average fertility rate in Aliso Viejo is 59.0 births per 1,000 women. Women in the age bracket of 20 to 34 years have the highest fertility rate with 94.0 births per 1,000 women. Women in the age bracket of 20 to 34 years acount for 55.8% of all women with births.
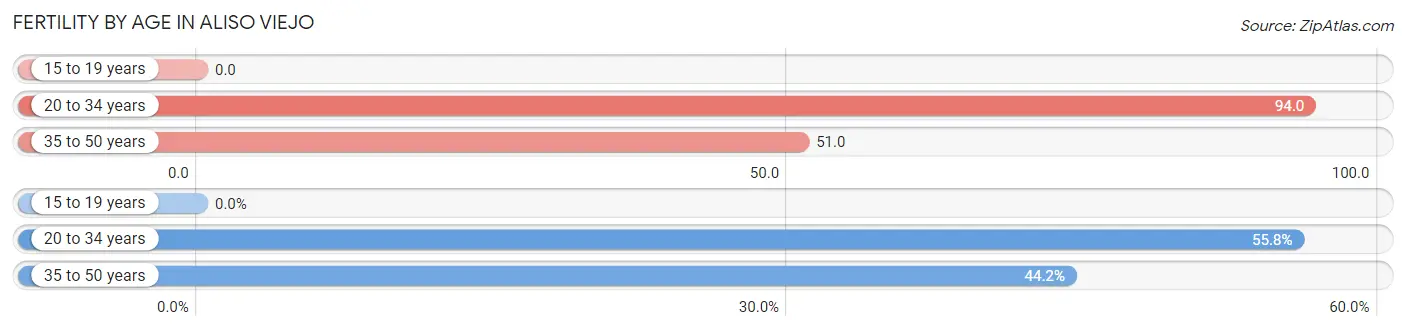
| Age Bracket | Women with Births | Births / 1,000 Women |
| 15 to 19 years | 0 (0.0%) | 0.0 |
| 20 to 34 years | 419 (55.8%) | 94.0 |
| 35 to 50 years | 332 (44.2%) | 51.0 |
| Total | 751 (100.0%) | 59.0 |
Fertility by Age by Marriage Status in Aliso Viejo
92.0% of women with births (751) in Aliso Viejo are married. The highest percentage of unmarried women with births falls into 20 to 34 years age bracket with 12.9% of them unmarried at the time of birth, while the lowest percentage of unmarried women with births belong to 35 to 50 years age bracket with 1.8% of them unmarried.
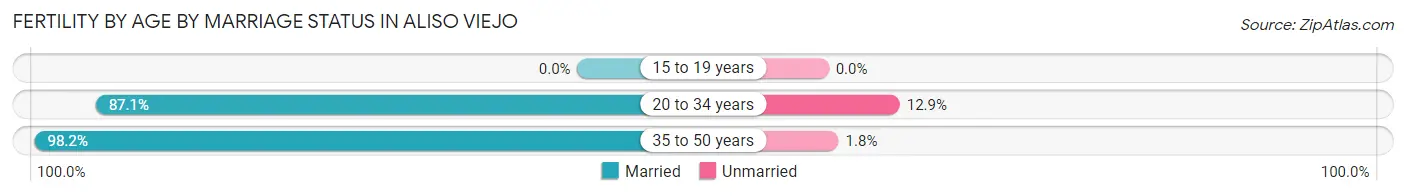
| Age Bracket | Married | Unmarried |
| 15 to 19 years | 0 (0.0%) | 0 (0.0%) |
| 20 to 34 years | 365 (87.1%) | 54 (12.9%) |
| 35 to 50 years | 326 (98.2%) | 6 (1.8%) |
| Total | 691 (92.0%) | 60 (8.0%) |
Fertility by Education in Aliso Viejo
Average fertility rate in Aliso Viejo is 59.0 births per 1,000 women. Women with the education attainment of bachelor's degree have the highest fertility rate of 106.0 births per 1,000 women, while women with the education attainment of less than high school have the lowest fertility at 27.0 births per 1,000 women. Women with the education attainment of bachelor's degree represent 58.6% of all women with births.
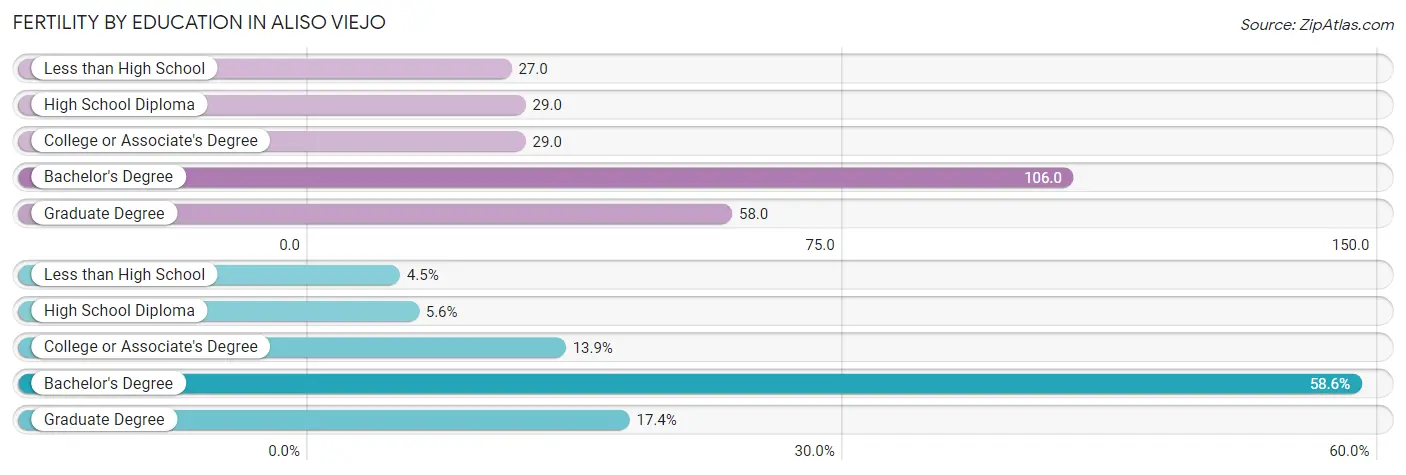
| Educational Attainment | Women with Births | Births / 1,000 Women |
| Less than High School | 34 (4.5%) | 27.0 |
| High School Diploma | 42 (5.6%) | 29.0 |
| College or Associate's Degree | 104 (13.9%) | 29.0 |
| Bachelor's Degree | 440 (58.6%) | 106.0 |
| Graduate Degree | 131 (17.4%) | 58.0 |
| Total | 751 (100.0%) | 59.0 |
Fertility by Education by Marriage Status in Aliso Viejo
8.0% of women with births in Aliso Viejo are unmarried. Women with the educational attainment of less than high school are most likely to be married with 100.0% of them married at childbirth, while women with the educational attainment of bachelor's degree are least likely to be married with 11.1% of them unmarried at childbirth.
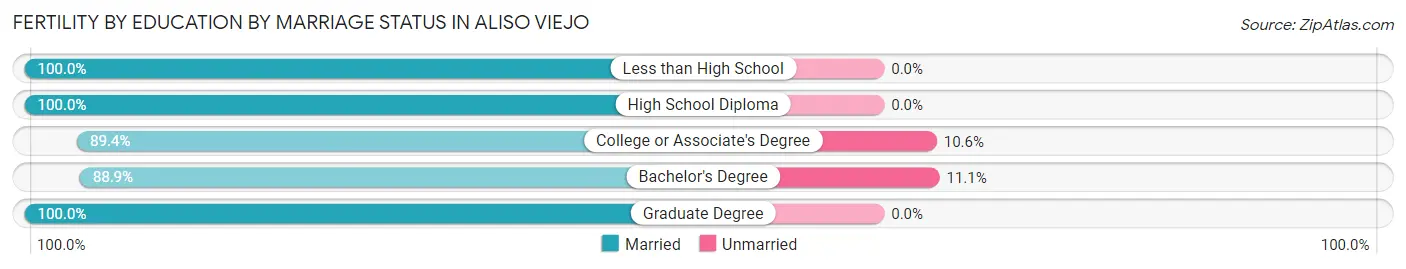
| Educational Attainment | Married | Unmarried |
| Less than High School | 34 (100.0%) | 0 (0.0%) |
| High School Diploma | 42 (100.0%) | 0 (0.0%) |
| College or Associate's Degree | 93 (89.4%) | 11 (10.6%) |
| Bachelor's Degree | 391 (88.9%) | 49 (11.1%) |
| Graduate Degree | 131 (100.0%) | 0 (0.0%) |
| Total | 691 (92.0%) | 60 (8.0%) |
Employment Characteristics in Aliso Viejo
Employment by Class of Employer in Aliso Viejo
Among the 28,917 employed individuals in Aliso Viejo, private company employees (20,836 | 72.1%), self-employed (not incorporated) (2,104 | 7.3%), and not-for-profit organizations (1,886 | 6.5%) make up the most common classes of employment.
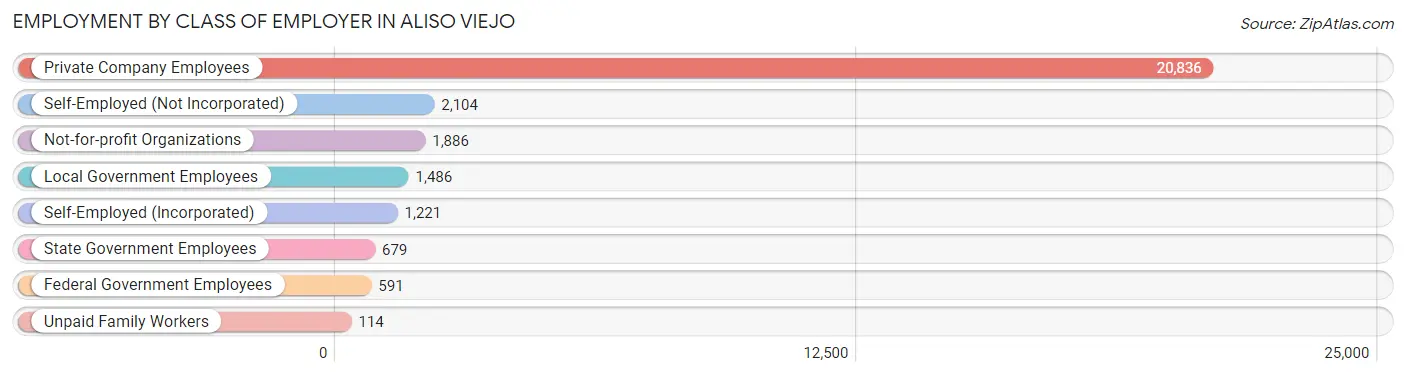
| Employer Class | # Employees | % Employees |
| Private Company Employees | 20,836 | 72.1% |
| Self-Employed (Incorporated) | 1,221 | 4.2% |
| Self-Employed (Not Incorporated) | 2,104 | 7.3% |
| Not-for-profit Organizations | 1,886 | 6.5% |
| Local Government Employees | 1,486 | 5.1% |
| State Government Employees | 679 | 2.4% |
| Federal Government Employees | 591 | 2.0% |
| Unpaid Family Workers | 114 | 0.4% |
| Total | 28,917 | 100.0% |
Employment Status by Age in Aliso Viejo
According to the labor force statistics for Aliso Viejo, out of the total population over 16 years of age (40,557), 75.3% or 30,539 individuals are in the labor force, with 3.8% or 1,160 of them unemployed. The age group with the highest labor force participation rate is 25 to 29 years, with 91.3% or 2,665 individuals in the labor force. Within the labor force, the 75 years and over age range has the highest percentage of unemployed individuals, with 11.7% or 41 of them being unemployed.
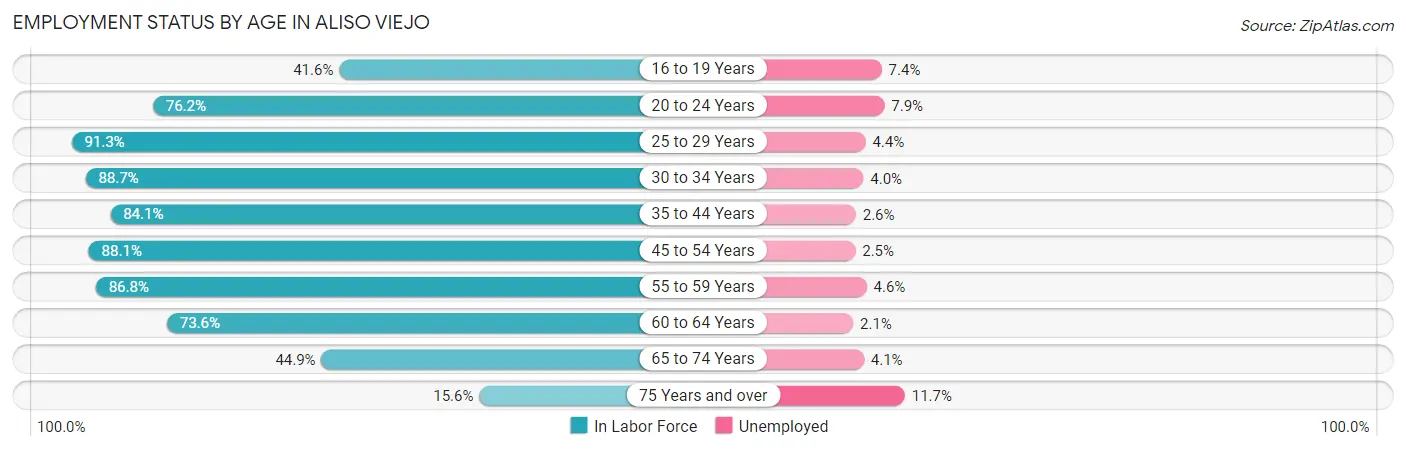
| Age Bracket | In Labor Force | Unemployed |
| 16 to 19 Years | 1,182 (41.6%) | 87 (7.4%) |
| 20 to 24 Years | 2,047 (76.2%) | 162 (7.9%) |
| 25 to 29 Years | 2,665 (91.3%) | 117 (4.4%) |
| 30 to 34 Years | 3,218 (88.7%) | 129 (4.0%) |
| 35 to 44 Years | 7,214 (84.1%) | 188 (2.6%) |
| 45 to 54 Years | 7,208 (88.1%) | 180 (2.5%) |
| 55 to 59 Years | 3,270 (86.8%) | 150 (4.6%) |
| 60 to 64 Years | 2,135 (73.6%) | 45 (2.1%) |
| 65 to 74 Years | 1,256 (44.9%) | 51 (4.1%) |
| 75 Years and over | 352 (15.6%) | 41 (11.7%) |
| Total | 30,539 (75.3%) | 1,160 (3.8%) |
Employment Status by Educational Attainment in Aliso Viejo
According to labor force statistics for Aliso Viejo, 85.8% of individuals (25,719) out of the total population between 25 and 64 years of age (29,975) are in the labor force, with 3.1% or 797 of them being unemployed. The group with the highest labor force participation rate are those with the educational attainment of college / associate degree, with 87.0% or 7,432 individuals in the labor force. Within the labor force, individuals with bachelor's degree or higher education have the highest percentage of unemployment, with 3.6% or 543 of them being unemployed.
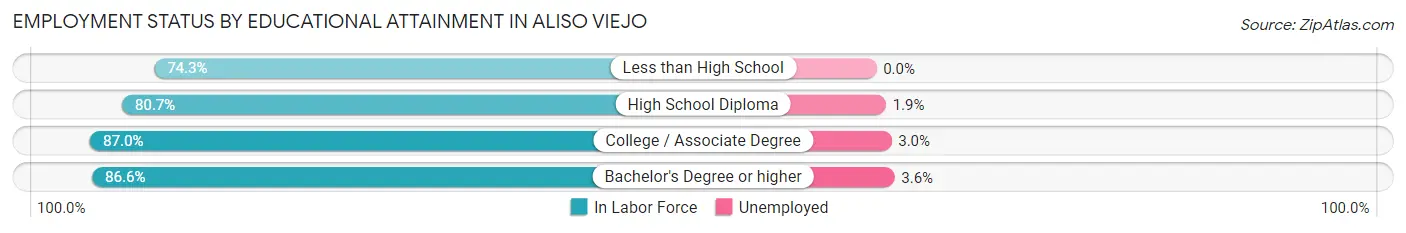
| Educational Attainment | In Labor Force | Unemployed |
| Less than High School | 660 (74.3%) | 0 (0.0%) |
| High School Diploma | 2,515 (80.7%) | 59 (1.9%) |
| College / Associate Degree | 7,432 (87.0%) | 256 (3.0%) |
| Bachelor's Degree or higher | 15,093 (86.6%) | 627 (3.6%) |
| Total | 25,719 (85.8%) | 929 (3.1%) |
Employment Occupations by Sex in Aliso Viejo
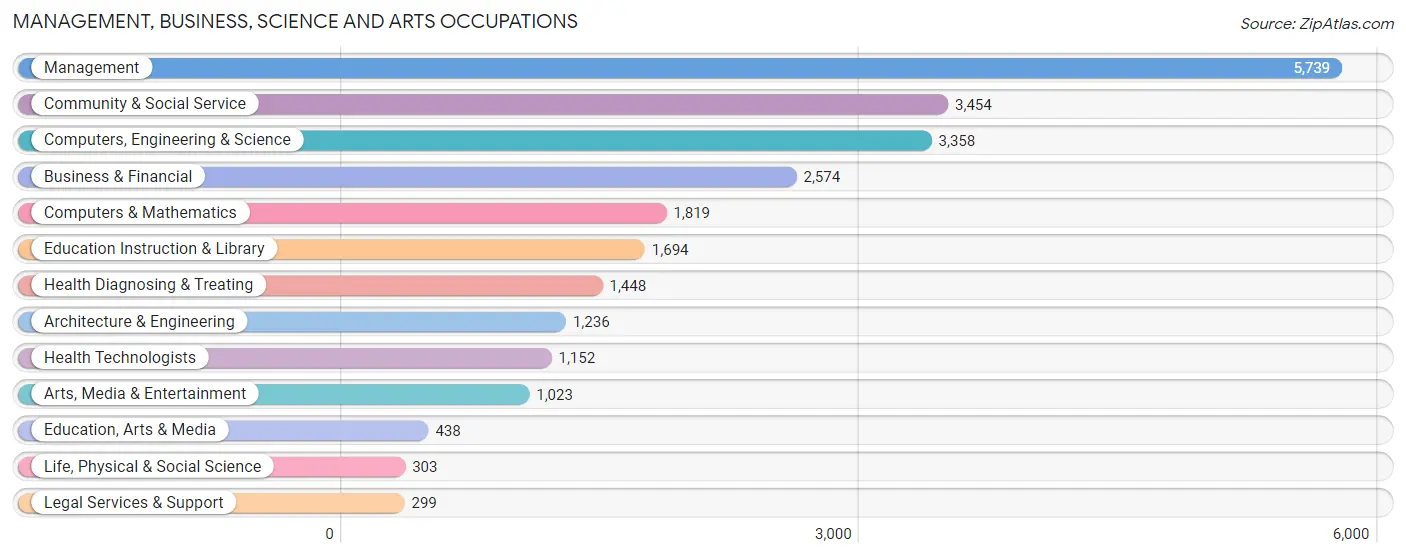
Management, Business, Science and Arts Occupations
The most common Management, Business, Science and Arts occupations in Aliso Viejo are Management (5,739 | 19.5%), Community & Social Service (3,454 | 11.8%), Computers, Engineering & Science (3,358 | 11.4%), Business & Financial (2,574 | 8.8%), and Computers & Mathematics (1,819 | 6.2%).
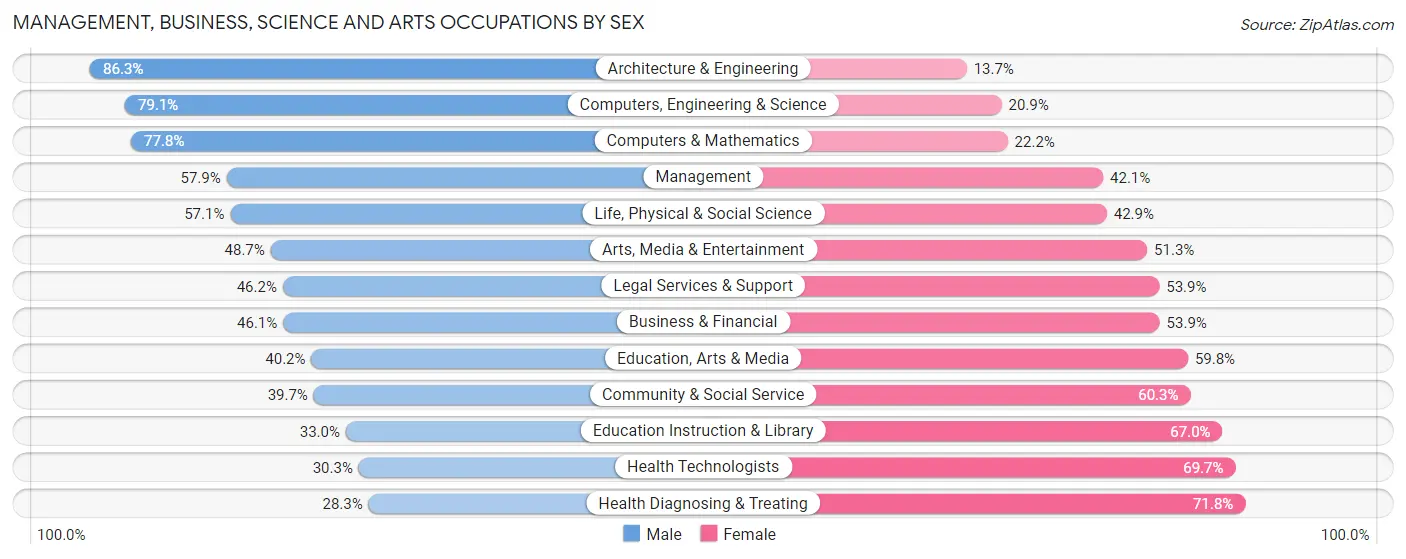
Management, Business, Science and Arts Occupations by Sex
Within the Management, Business, Science and Arts occupations in Aliso Viejo, the most male-oriented occupations are Architecture & Engineering (86.3%), Computers, Engineering & Science (79.1%), and Computers & Mathematics (77.8%), while the most female-oriented occupations are Health Diagnosing & Treating (71.8%), Health Technologists (69.7%), and Education Instruction & Library (67.0%).
| Occupation | Male | Female |
| Management | 3,321 (57.9%) | 2,418 (42.1%) |
| Business & Financial | 1,186 (46.1%) | 1,388 (53.9%) |
| Computers, Engineering & Science | 2,655 (79.1%) | 703 (20.9%) |
| Computers & Mathematics | 1,415 (77.8%) | 404 (22.2%) |
| Architecture & Engineering | 1,067 (86.3%) | 169 (13.7%) |
| Life, Physical & Social Science | 173 (57.1%) | 130 (42.9%) |
| Community & Social Service | 1,371 (39.7%) | 2,083 (60.3%) |
| Education, Arts & Media | 176 (40.2%) | 262 (59.8%) |
| Legal Services & Support | 138 (46.2%) | 161 (53.8%) |
| Education Instruction & Library | 559 (33.0%) | 1,135 (67.0%) |
| Arts, Media & Entertainment | 498 (48.7%) | 525 (51.3%) |
| Health Diagnosing & Treating | 409 (28.2%) | 1,039 (71.8%) |
| Health Technologists | 349 (30.3%) | 803 (69.7%) |
| Total (Category) | 8,942 (54.0%) | 7,631 (46.0%) |
| Total (Overall) | 15,573 (53.0%) | 13,801 (47.0%) |
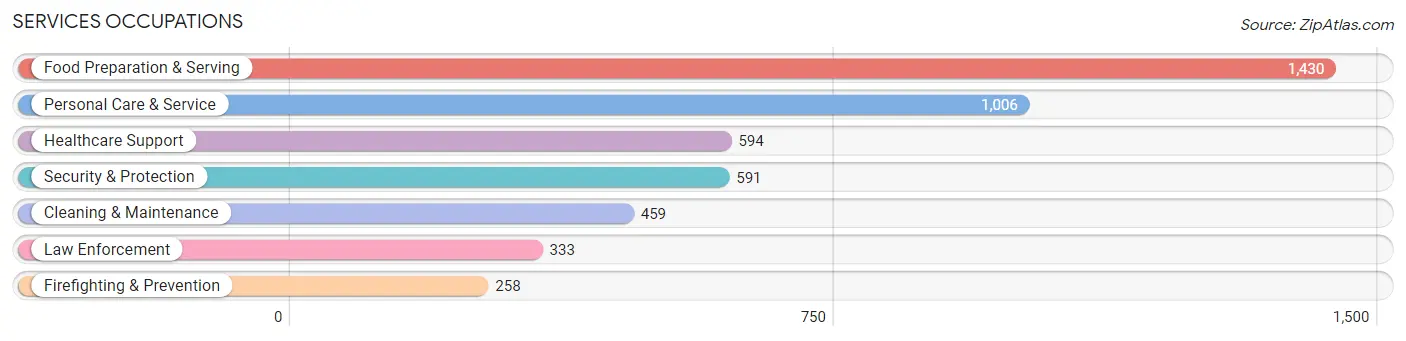
Services Occupations
The most common Services occupations in Aliso Viejo are Food Preparation & Serving (1,430 | 4.9%), Personal Care & Service (1,006 | 3.4%), Healthcare Support (594 | 2.0%), Security & Protection (591 | 2.0%), and Cleaning & Maintenance (459 | 1.6%).
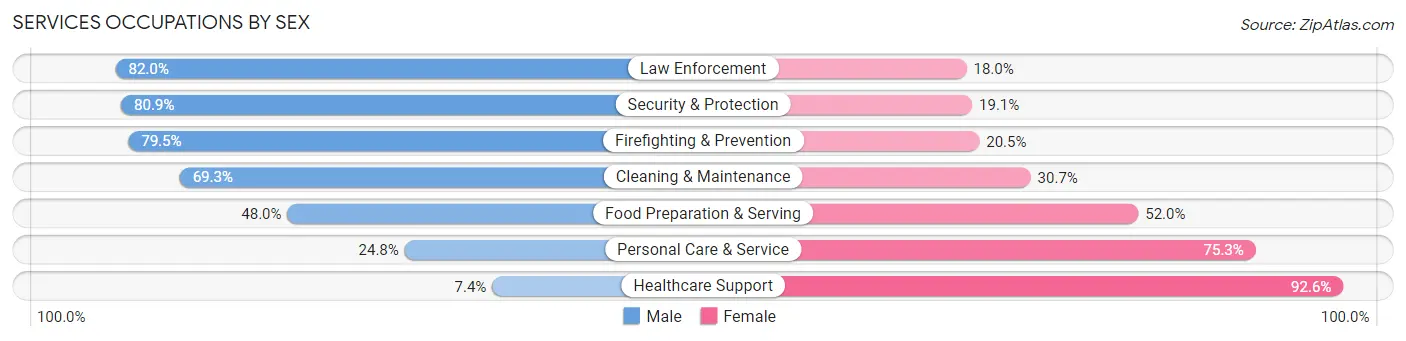
Services Occupations by Sex
Within the Services occupations in Aliso Viejo, the most male-oriented occupations are Law Enforcement (82.0%), Security & Protection (80.9%), and Firefighting & Prevention (79.5%), while the most female-oriented occupations are Healthcare Support (92.6%), Personal Care & Service (75.2%), and Food Preparation & Serving (52.0%).
| Occupation | Male | Female |
| Healthcare Support | 44 (7.4%) | 550 (92.6%) |
| Security & Protection | 478 (80.9%) | 113 (19.1%) |
| Firefighting & Prevention | 205 (79.5%) | 53 (20.5%) |
| Law Enforcement | 273 (82.0%) | 60 (18.0%) |
| Food Preparation & Serving | 686 (48.0%) | 744 (52.0%) |
| Cleaning & Maintenance | 318 (69.3%) | 141 (30.7%) |
| Personal Care & Service | 249 (24.7%) | 757 (75.2%) |
| Total (Category) | 1,775 (43.5%) | 2,305 (56.5%) |
| Total (Overall) | 15,573 (53.0%) | 13,801 (47.0%) |
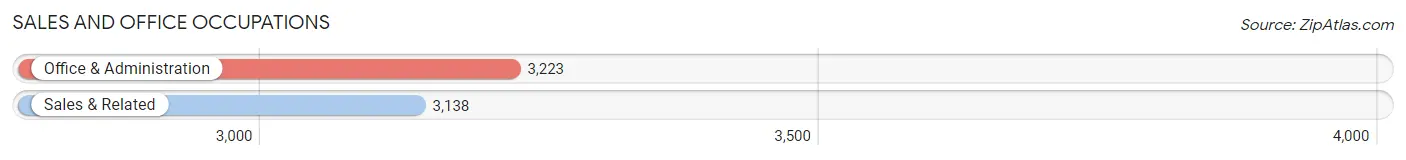
Sales and Office Occupations
The most common Sales and Office occupations in Aliso Viejo are Office & Administration (3,223 | 11.0%), and Sales & Related (3,138 | 10.7%).
Sales and Office Occupations by Sex
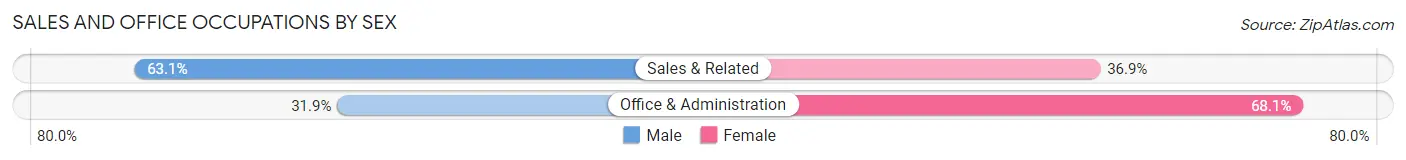
| Occupation | Male | Female |
| Sales & Related | 1,981 (63.1%) | 1,157 (36.9%) |
| Office & Administration | 1,028 (31.9%) | 2,195 (68.1%) |
| Total (Category) | 3,009 (47.3%) | 3,352 (52.7%) |
| Total (Overall) | 15,573 (53.0%) | 13,801 (47.0%) |
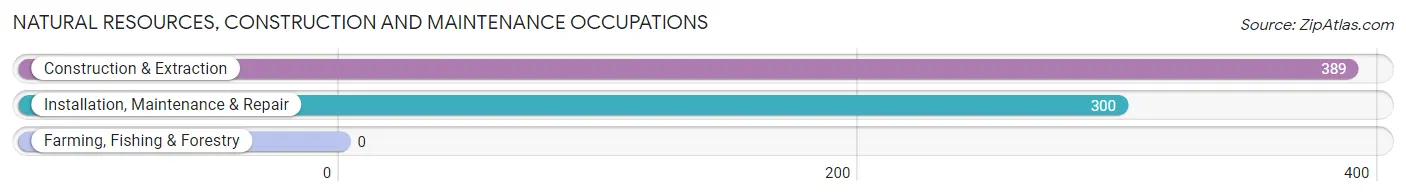
Natural Resources, Construction and Maintenance Occupations
The most common Natural Resources, Construction and Maintenance occupations in Aliso Viejo are Construction & Extraction (389 | 1.3%), and Installation, Maintenance & Repair (300 | 1.0%).
Natural Resources, Construction and Maintenance Occupations by Sex
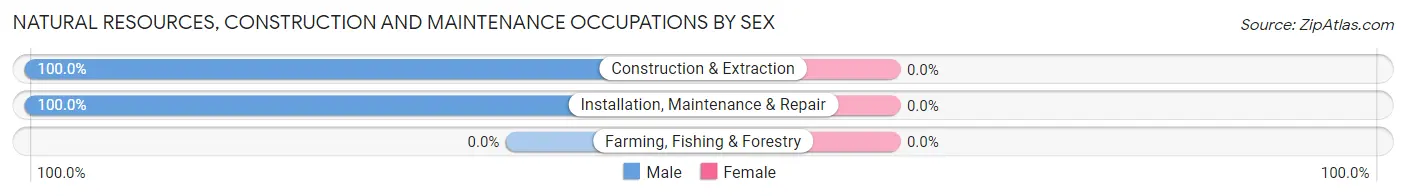
| Occupation | Male | Female |
| Farming, Fishing & Forestry | 0 (0.0%) | 0 (0.0%) |
| Construction & Extraction | 389 (100.0%) | 0 (0.0%) |
| Installation, Maintenance & Repair | 300 (100.0%) | 0 (0.0%) |
| Total (Category) | 689 (100.0%) | 0 (0.0%) |
| Total (Overall) | 15,573 (53.0%) | 13,801 (47.0%) |
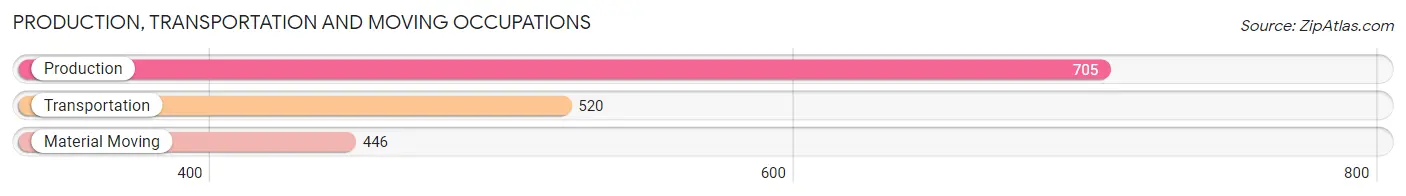
Production, Transportation and Moving Occupations
The most common Production, Transportation and Moving occupations in Aliso Viejo are Production (705 | 2.4%), Transportation (520 | 1.8%), and Material Moving (446 | 1.5%).
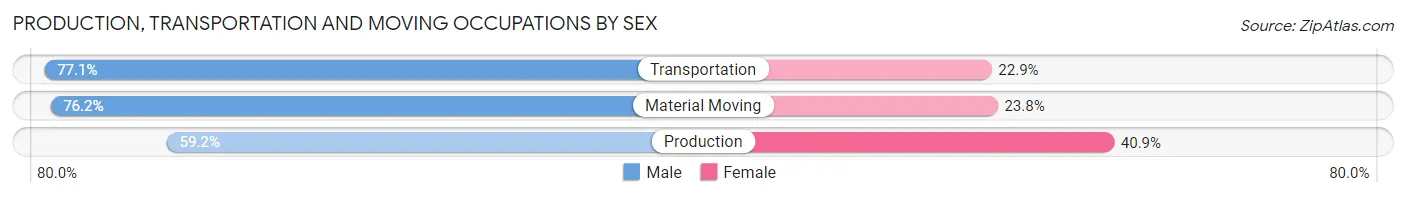
Production, Transportation and Moving Occupations by Sex
| Occupation | Male | Female |
| Production | 417 (59.2%) | 288 (40.8%) |
| Transportation | 401 (77.1%) | 119 (22.9%) |
| Material Moving | 340 (76.2%) | 106 (23.8%) |
| Total (Category) | 1,158 (69.3%) | 513 (30.7%) |
| Total (Overall) | 15,573 (53.0%) | 13,801 (47.0%) |
Employment Industries by Sex in Aliso Viejo
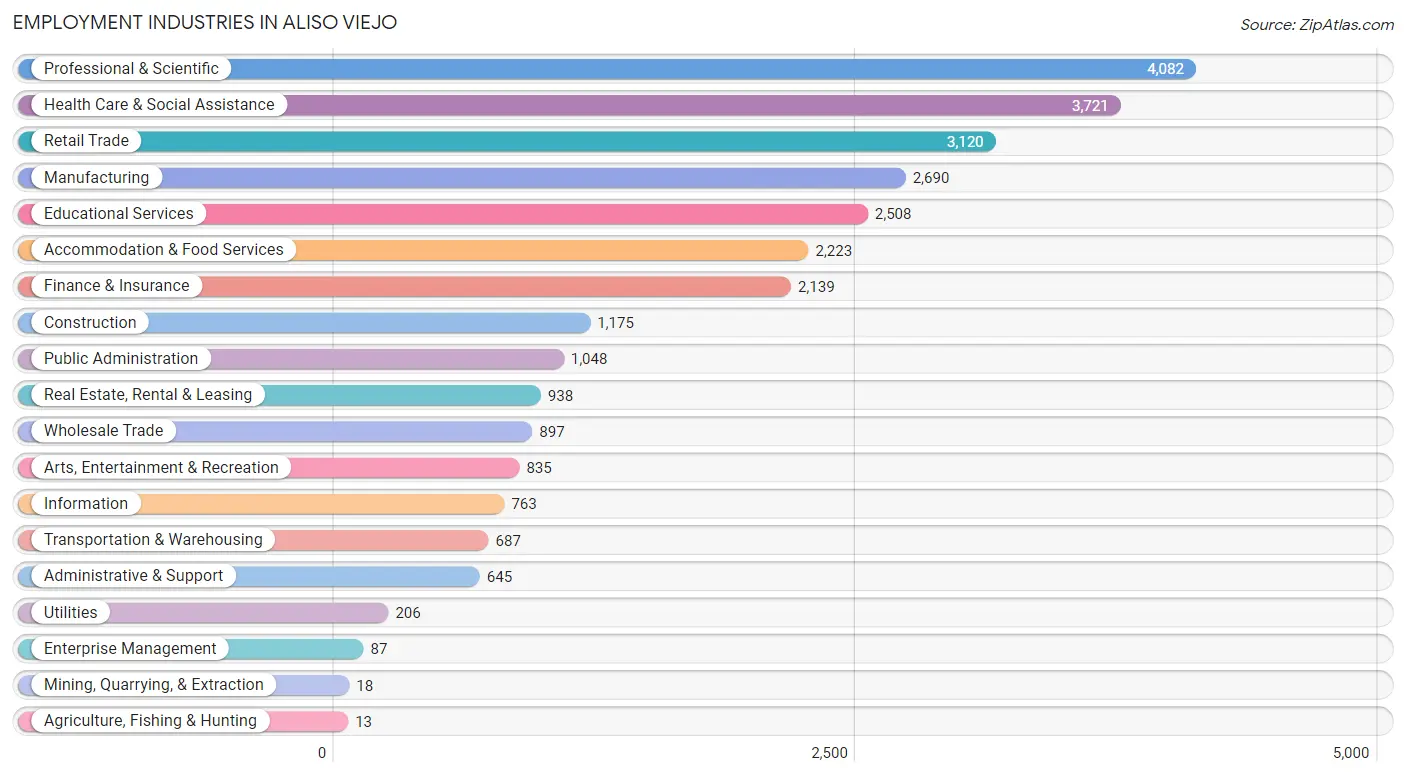
Employment Industries in Aliso Viejo
The major employment industries in Aliso Viejo include Professional & Scientific (4,082 | 13.9%), Health Care & Social Assistance (3,721 | 12.7%), Retail Trade (3,120 | 10.6%), Manufacturing (2,690 | 9.2%), and Educational Services (2,508 | 8.5%).
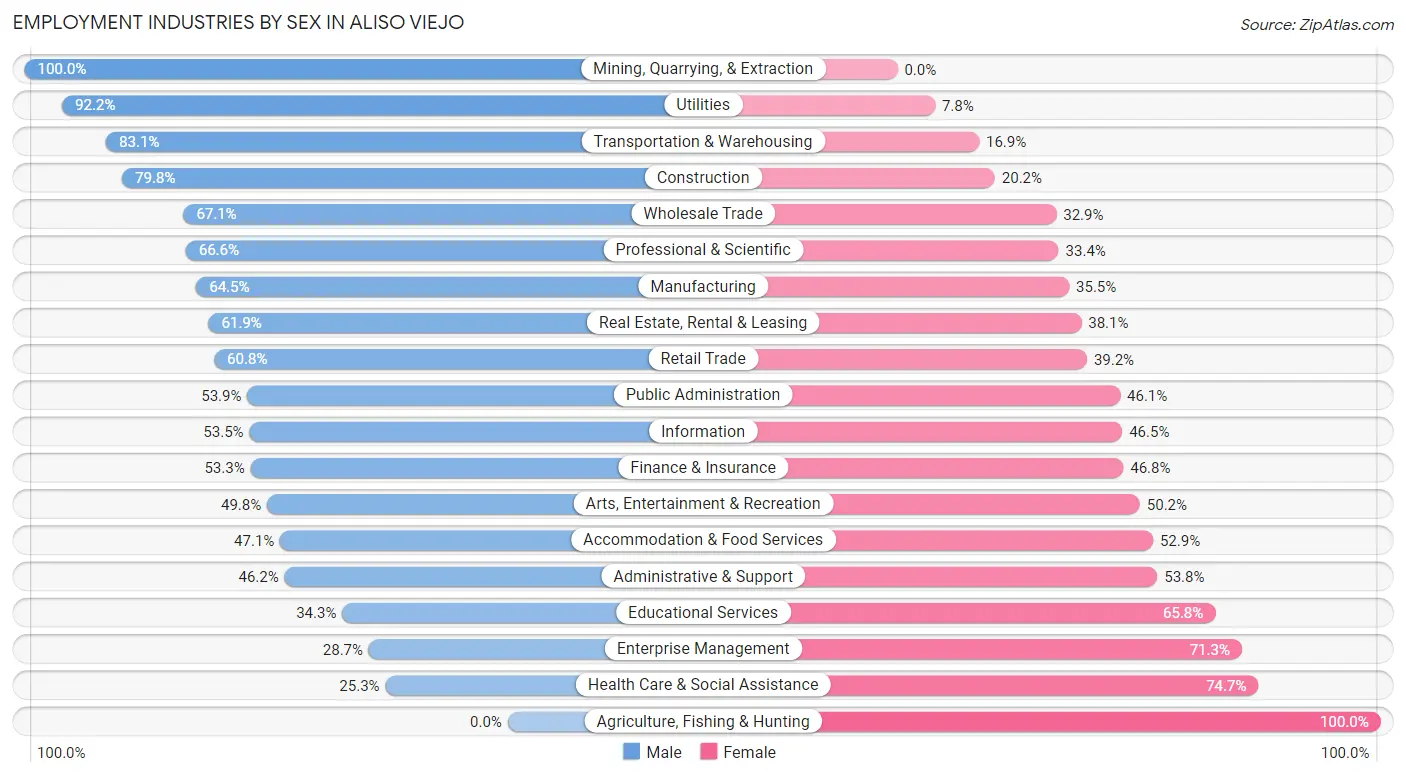
Employment Industries by Sex in Aliso Viejo
The Aliso Viejo industries that see more men than women are Mining, Quarrying, & Extraction (100.0%), Utilities (92.2%), and Transportation & Warehousing (83.1%), whereas the industries that tend to have a higher number of women are Agriculture, Fishing & Hunting (100.0%), Health Care & Social Assistance (74.7%), and Enterprise Management (71.3%).
| Industry | Male | Female |
| Agriculture, Fishing & Hunting | 0 (0.0%) | 13 (100.0%) |
| Mining, Quarrying, & Extraction | 18 (100.0%) | 0 (0.0%) |
| Construction | 938 (79.8%) | 237 (20.2%) |
| Manufacturing | 1,734 (64.5%) | 956 (35.5%) |
| Wholesale Trade | 602 (67.1%) | 295 (32.9%) |
| Retail Trade | 1,896 (60.8%) | 1,224 (39.2%) |
| Transportation & Warehousing | 571 (83.1%) | 116 (16.9%) |
| Utilities | 190 (92.2%) | 16 (7.8%) |
| Information | 408 (53.5%) | 355 (46.5%) |
| Finance & Insurance | 1,139 (53.2%) | 1,000 (46.8%) |
| Real Estate, Rental & Leasing | 581 (61.9%) | 357 (38.1%) |
| Professional & Scientific | 2,720 (66.6%) | 1,362 (33.4%) |
| Enterprise Management | 25 (28.7%) | 62 (71.3%) |
| Administrative & Support | 298 (46.2%) | 347 (53.8%) |
| Educational Services | 859 (34.3%) | 1,649 (65.7%) |
| Health Care & Social Assistance | 942 (25.3%) | 2,779 (74.7%) |
| Arts, Entertainment & Recreation | 416 (49.8%) | 419 (50.2%) |
| Accommodation & Food Services | 1,047 (47.1%) | 1,176 (52.9%) |
| Public Administration | 565 (53.9%) | 483 (46.1%) |
| Total | 15,573 (53.0%) | 13,801 (47.0%) |
Education in Aliso Viejo
School Enrollment in Aliso Viejo
The most common levels of schooling among the 14,438 students in Aliso Viejo are college / undergraduate (3,481 | 24.1%), middle school (3,054 | 21.1%), and high school (2,854 | 19.8%).
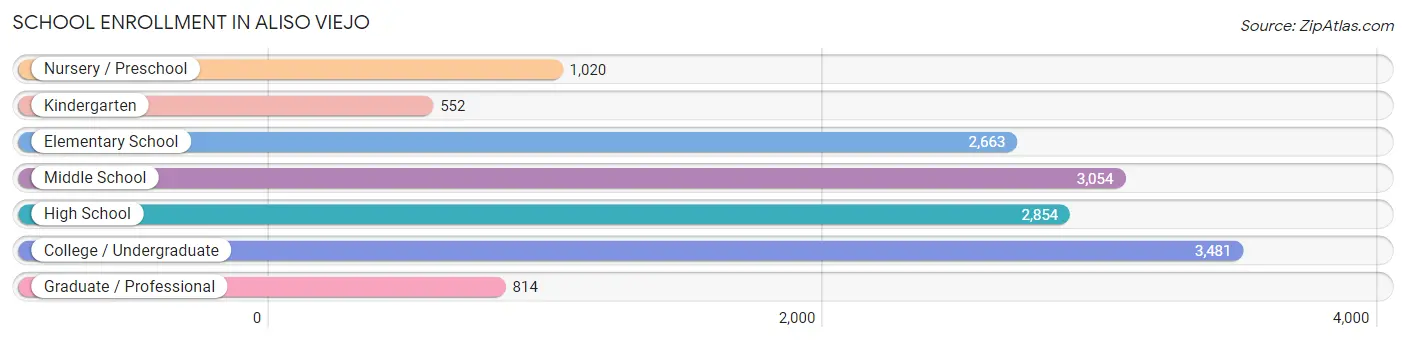
| School Level | # Students | % Students |
| Nursery / Preschool | 1,020 | 7.1% |
| Kindergarten | 552 | 3.8% |
| Elementary School | 2,663 | 18.4% |
| Middle School | 3,054 | 21.1% |
| High School | 2,854 | 19.8% |
| College / Undergraduate | 3,481 | 24.1% |
| Graduate / Professional | 814 | 5.6% |
| Total | 14,438 | 100.0% |
School Enrollment by Age by Funding Source in Aliso Viejo
Out of a total of 14,438 students who are enrolled in schools in Aliso Viejo, 2,267 (15.7%) attend a private institution, while the remaining 12,171 (84.3%) are enrolled in public schools. The age group of 3 to 4 year olds has the highest likelihood of being enrolled in private schools, with 573 (71.2% in the age bracket) enrolled. Conversely, the age group of 10 to 14 year olds has the lowest likelihood of being enrolled in a private school, with 3,634 (94.4% in the age bracket) attending a public institution.
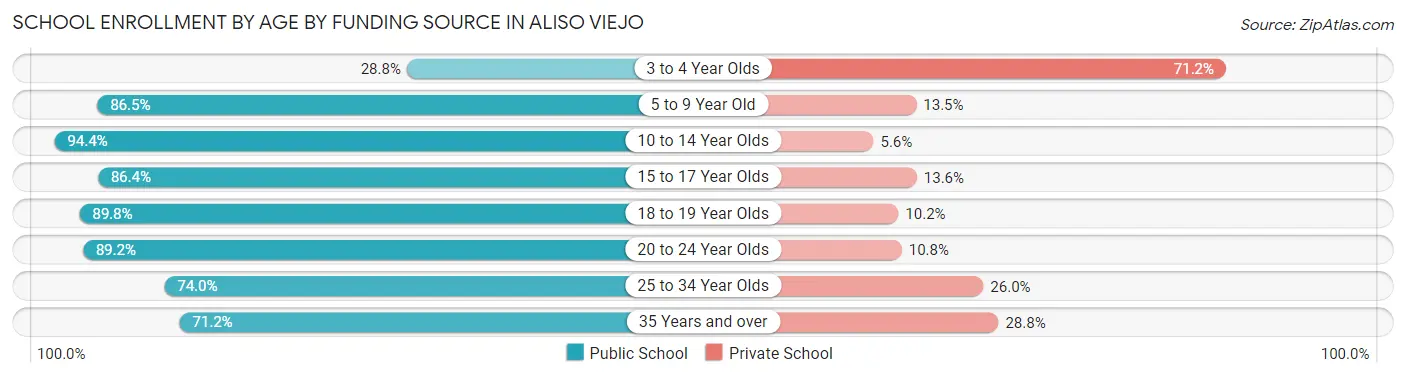
| Age Bracket | Public School | Private School |
| 3 to 4 Year Olds | 232 (28.8%) | 573 (71.2%) |
| 5 to 9 Year Old | 2,751 (86.5%) | 431 (13.5%) |
| 10 to 14 Year Olds | 3,634 (94.4%) | 214 (5.6%) |
| 15 to 17 Year Olds | 1,742 (86.4%) | 275 (13.6%) |
| 18 to 19 Year Olds | 1,048 (89.8%) | 119 (10.2%) |
| 20 to 24 Year Olds | 1,539 (89.2%) | 187 (10.8%) |
| 25 to 34 Year Olds | 665 (74.0%) | 234 (26.0%) |
| 35 Years and over | 565 (71.2%) | 229 (28.8%) |
| Total | 12,171 (84.3%) | 2,267 (15.7%) |
Educational Attainment by Field of Study in Aliso Viejo
Business (4,820 | 22.7%), engineering (2,406 | 11.3%), social sciences (1,982 | 9.3%), science & technology (1,495 | 7.0%), and computers & mathematics (1,458 | 6.9%) are the most common fields of study among 21,232 individuals in Aliso Viejo who have obtained a bachelor's degree or higher.
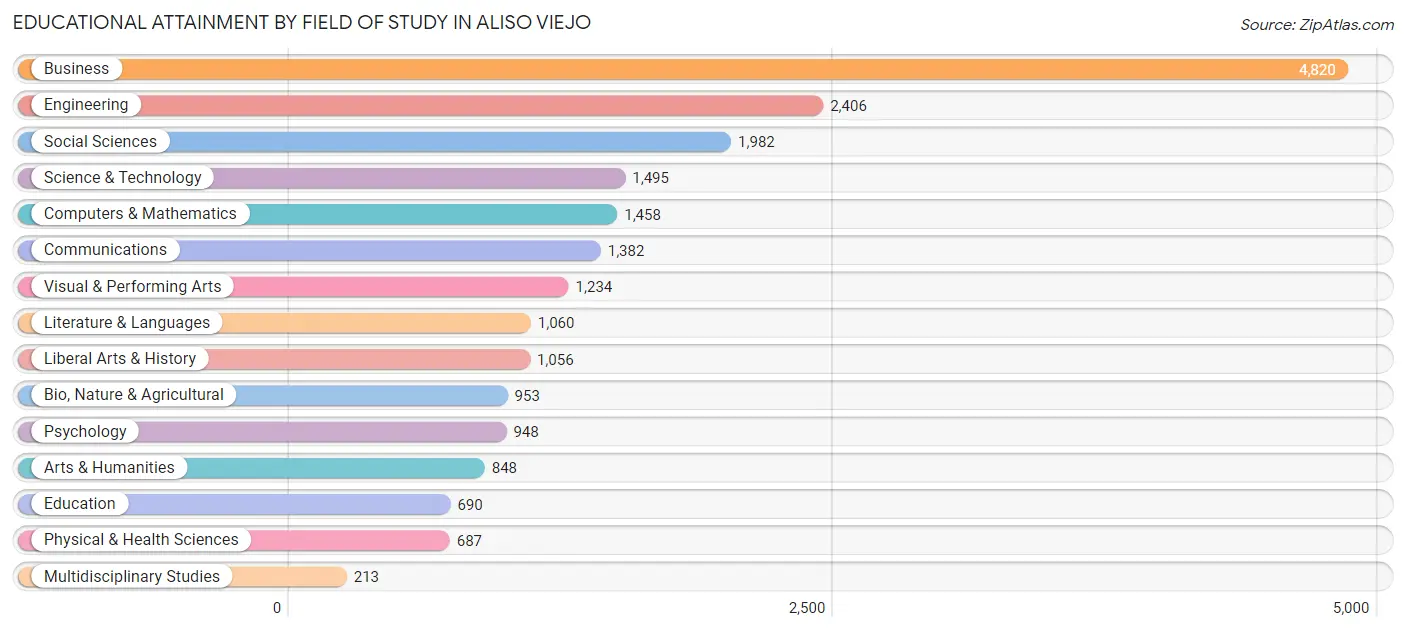
| Field of Study | # Graduates | % Graduates |
| Computers & Mathematics | 1,458 | 6.9% |
| Bio, Nature & Agricultural | 953 | 4.5% |
| Physical & Health Sciences | 687 | 3.2% |
| Psychology | 948 | 4.5% |
| Social Sciences | 1,982 | 9.3% |
| Engineering | 2,406 | 11.3% |
| Multidisciplinary Studies | 213 | 1.0% |
| Science & Technology | 1,495 | 7.0% |
| Business | 4,820 | 22.7% |
| Education | 690 | 3.3% |
| Literature & Languages | 1,060 | 5.0% |
| Liberal Arts & History | 1,056 | 5.0% |
| Visual & Performing Arts | 1,234 | 5.8% |
| Communications | 1,382 | 6.5% |
| Arts & Humanities | 848 | 4.0% |
| Total | 21,232 | 100.0% |
Transportation & Commute in Aliso Viejo
Vehicle Availability by Sex in Aliso Viejo
The most prevalent vehicle ownership categories in Aliso Viejo are males with 2 vehicles (8,194, accounting for 53.4%) and females with 2 vehicles (7,010, making up 61.1%).
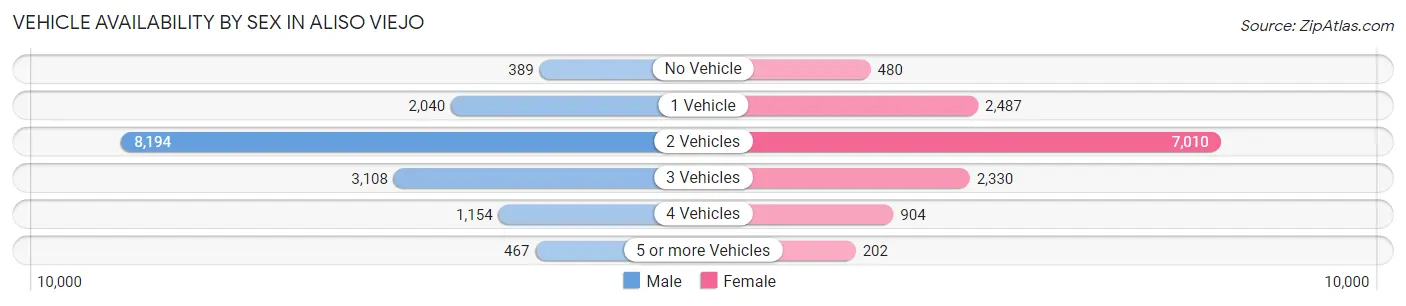
| Vehicles Available | Male | Female |
| No Vehicle | 389 (2.5%) | 480 (3.6%) |
| 1 Vehicle | 2,040 (13.3%) | 2,487 (18.5%) |
| 2 Vehicles | 8,194 (53.4%) | 7,010 (52.3%) |
| 3 Vehicles | 3,108 (20.2%) | 2,330 (17.4%) |
| 4 Vehicles | 1,154 (7.5%) | 904 (6.7%) |
| 5 or more Vehicles | 467 (3.0%) | 202 (1.5%) |
| Total | 15,352 (100.0%) | 13,413 (100.0%) |
Commute Time in Aliso Viejo
The most frequently occuring commute durations in Aliso Viejo are 30 to 34 minutes (3,851 commuters, 16.9%), 15 to 19 minutes (3,667 commuters, 16.1%), and 20 to 24 minutes (3,580 commuters, 15.7%).
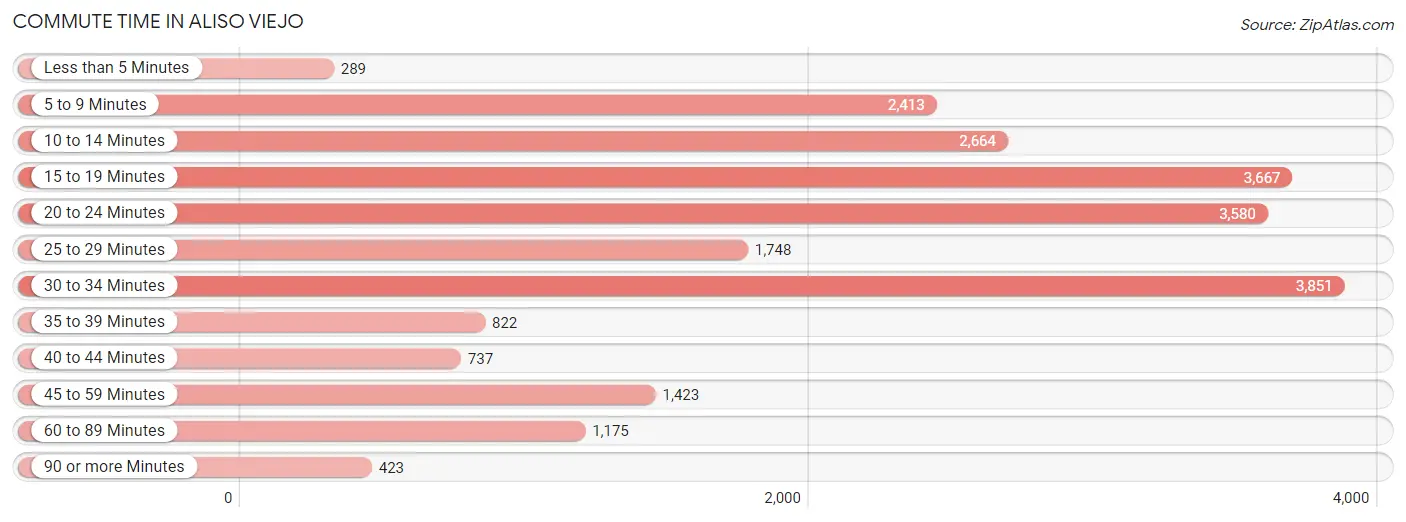
| Commute Time | # Commuters | % Commuters |
| Less than 5 Minutes | 289 | 1.3% |
| 5 to 9 Minutes | 2,413 | 10.6% |
| 10 to 14 Minutes | 2,664 | 11.7% |
| 15 to 19 Minutes | 3,667 | 16.1% |
| 20 to 24 Minutes | 3,580 | 15.7% |
| 25 to 29 Minutes | 1,748 | 7.7% |
| 30 to 34 Minutes | 3,851 | 16.9% |
| 35 to 39 Minutes | 822 | 3.6% |
| 40 to 44 Minutes | 737 | 3.2% |
| 45 to 59 Minutes | 1,423 | 6.2% |
| 60 to 89 Minutes | 1,175 | 5.2% |
| 90 or more Minutes | 423 | 1.9% |
Commute Time by Sex in Aliso Viejo
The most common commute times in Aliso Viejo are 15 to 19 minutes (2,006 commuters, 16.7%) for males and 30 to 34 minutes (2,113 commuters, 19.6%) for females.
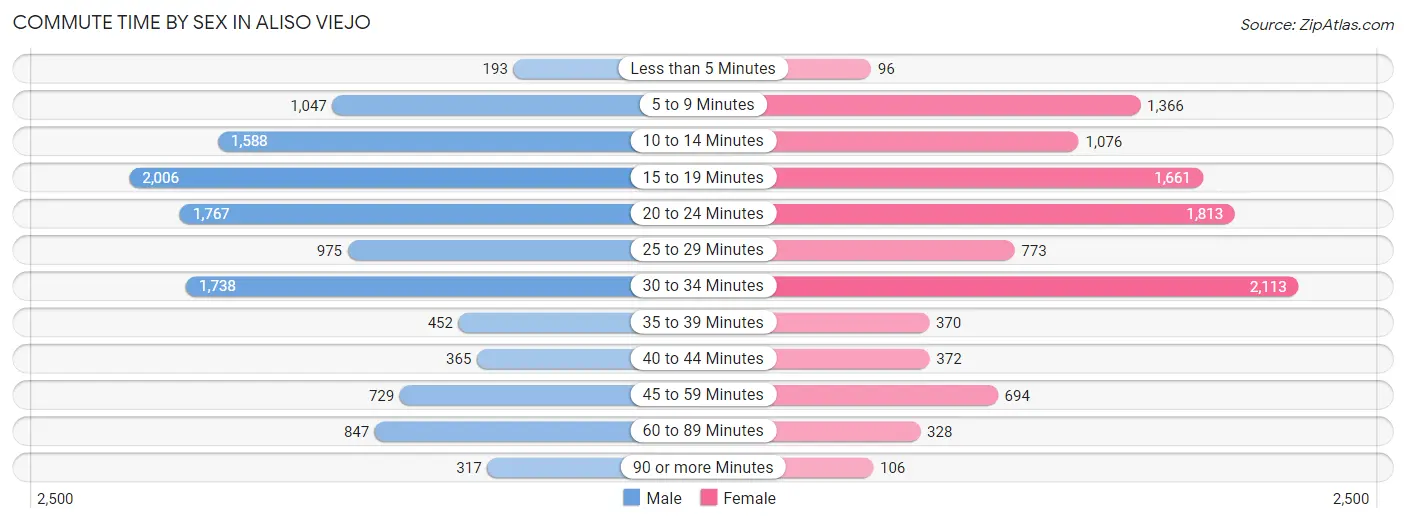
| Commute Time | Male | Female |
| Less than 5 Minutes | 193 (1.6%) | 96 (0.9%) |
| 5 to 9 Minutes | 1,047 (8.7%) | 1,366 (12.7%) |
| 10 to 14 Minutes | 1,588 (13.2%) | 1,076 (10.0%) |
| 15 to 19 Minutes | 2,006 (16.7%) | 1,661 (15.4%) |
| 20 to 24 Minutes | 1,767 (14.7%) | 1,813 (16.8%) |
| 25 to 29 Minutes | 975 (8.1%) | 773 (7.2%) |
| 30 to 34 Minutes | 1,738 (14.4%) | 2,113 (19.6%) |
| 35 to 39 Minutes | 452 (3.8%) | 370 (3.4%) |
| 40 to 44 Minutes | 365 (3.0%) | 372 (3.5%) |
| 45 to 59 Minutes | 729 (6.1%) | 694 (6.5%) |
| 60 to 89 Minutes | 847 (7.0%) | 328 (3.0%) |
| 90 or more Minutes | 317 (2.6%) | 106 (1.0%) |
Time of Departure to Work by Sex in Aliso Viejo
The most frequent times of departure to work in Aliso Viejo are 7:00 AM to 7:29 AM (1,848, 15.4%) for males and 8:00 AM to 8:29 AM (1,984, 18.4%) for females.
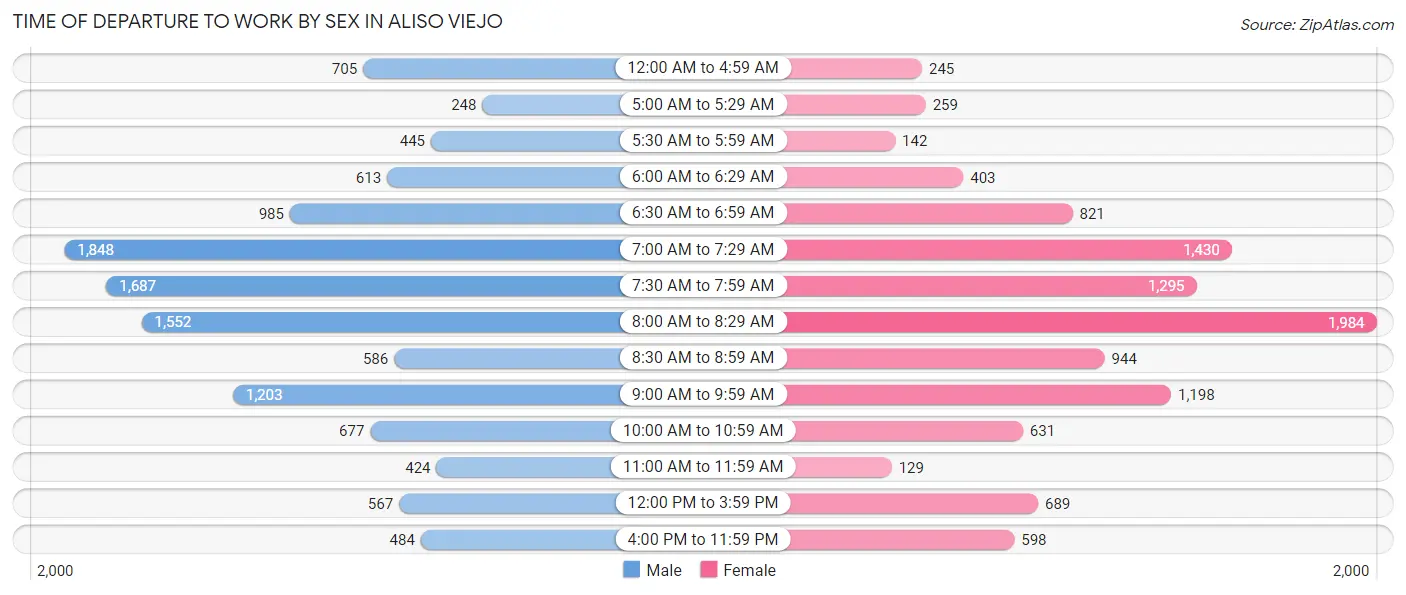
| Time of Departure | Male | Female |
| 12:00 AM to 4:59 AM | 705 (5.9%) | 245 (2.3%) |
| 5:00 AM to 5:29 AM | 248 (2.1%) | 259 (2.4%) |
| 5:30 AM to 5:59 AM | 445 (3.7%) | 142 (1.3%) |
| 6:00 AM to 6:29 AM | 613 (5.1%) | 403 (3.7%) |
| 6:30 AM to 6:59 AM | 985 (8.2%) | 821 (7.6%) |
| 7:00 AM to 7:29 AM | 1,848 (15.4%) | 1,430 (13.3%) |
| 7:30 AM to 7:59 AM | 1,687 (14.0%) | 1,295 (12.0%) |
| 8:00 AM to 8:29 AM | 1,552 (12.9%) | 1,984 (18.4%) |
| 8:30 AM to 8:59 AM | 586 (4.9%) | 944 (8.8%) |
| 9:00 AM to 9:59 AM | 1,203 (10.0%) | 1,198 (11.1%) |
| 10:00 AM to 10:59 AM | 677 (5.6%) | 631 (5.9%) |
| 11:00 AM to 11:59 AM | 424 (3.5%) | 129 (1.2%) |
| 12:00 PM to 3:59 PM | 567 (4.7%) | 689 (6.4%) |
| 4:00 PM to 11:59 PM | 484 (4.0%) | 598 (5.6%) |
| Total | 12,024 (100.0%) | 10,768 (100.0%) |
Housing Occupancy in Aliso Viejo
Occupancy by Ownership in Aliso Viejo
Of the total 19,300 dwellings in Aliso Viejo, owner-occupied units account for 10,851 (56.2%), while renter-occupied units make up 8,449 (43.8%).
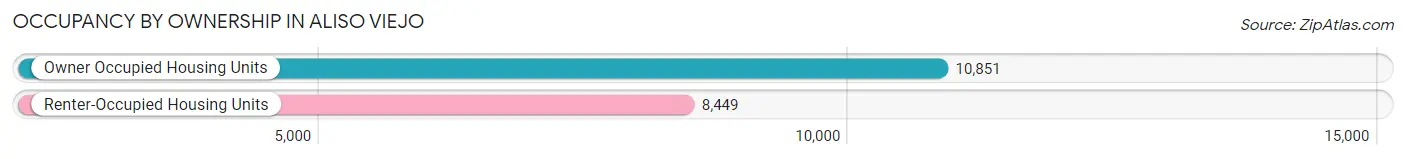
| Occupancy | # Housing Units | % Housing Units |
| Owner Occupied Housing Units | 10,851 | 56.2% |
| Renter-Occupied Housing Units | 8,449 | 43.8% |
| Total Occupied Housing Units | 19,300 | 100.0% |
Occupancy by Household Size in Aliso Viejo
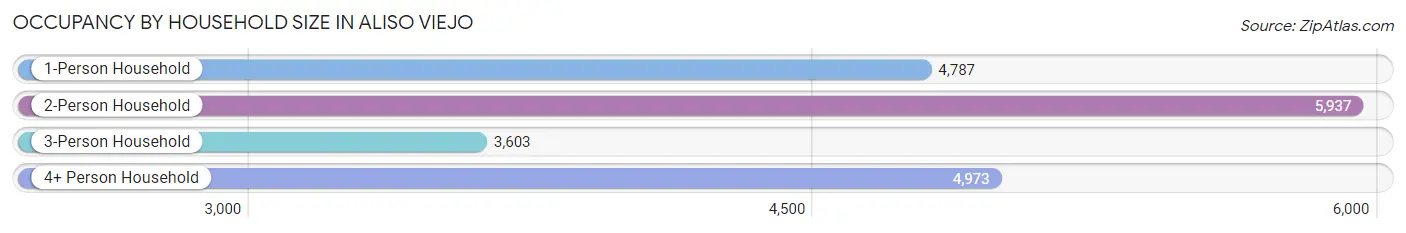
| Household Size | # Housing Units | % Housing Units |
| 1-Person Household | 4,787 | 24.8% |
| 2-Person Household | 5,937 | 30.8% |
| 3-Person Household | 3,603 | 18.7% |
| 4+ Person Household | 4,973 | 25.8% |
| Total Housing Units | 19,300 | 100.0% |
Occupancy by Ownership by Household Size in Aliso Viejo
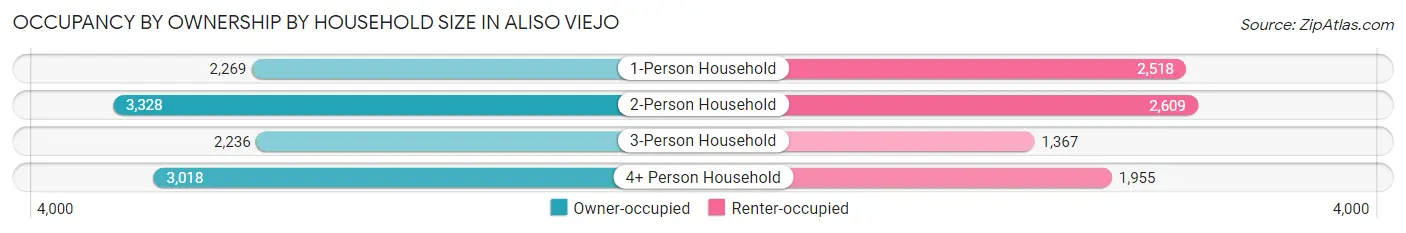
| Household Size | Owner-occupied | Renter-occupied |
| 1-Person Household | 2,269 (47.4%) | 2,518 (52.6%) |
| 2-Person Household | 3,328 (56.1%) | 2,609 (43.9%) |
| 3-Person Household | 2,236 (62.1%) | 1,367 (37.9%) |
| 4+ Person Household | 3,018 (60.7%) | 1,955 (39.3%) |
| Total Housing Units | 10,851 (56.2%) | 8,449 (43.8%) |
Occupancy by Educational Attainment in Aliso Viejo
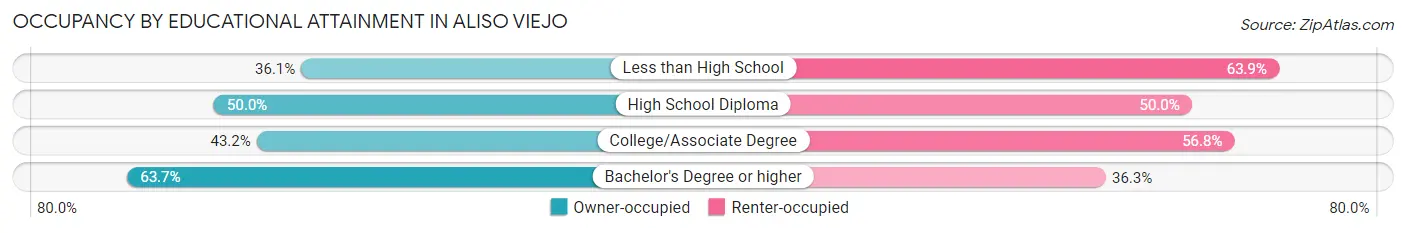
| Household Size | Owner-occupied | Renter-occupied |
| Less than High School | 146 (36.1%) | 258 (63.9%) |
| High School Diploma | 794 (50.0%) | 795 (50.0%) |
| College/Associate Degree | 2,349 (43.2%) | 3,087 (56.8%) |
| Bachelor's Degree or higher | 7,562 (63.7%) | 4,309 (36.3%) |
Occupancy by Age of Householder in Aliso Viejo
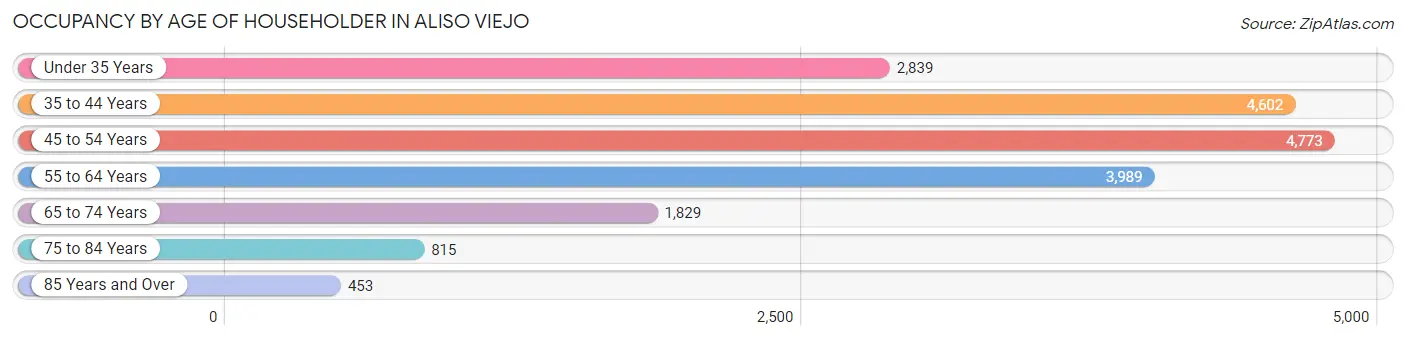
| Age Bracket | # Households | % Households |
| Under 35 Years | 2,839 | 14.7% |
| 35 to 44 Years | 4,602 | 23.8% |
| 45 to 54 Years | 4,773 | 24.7% |
| 55 to 64 Years | 3,989 | 20.7% |
| 65 to 74 Years | 1,829 | 9.5% |
| 75 to 84 Years | 815 | 4.2% |
| 85 Years and Over | 453 | 2.4% |
| Total | 19,300 | 100.0% |
Housing Finances in Aliso Viejo
Median Income by Occupancy in Aliso Viejo
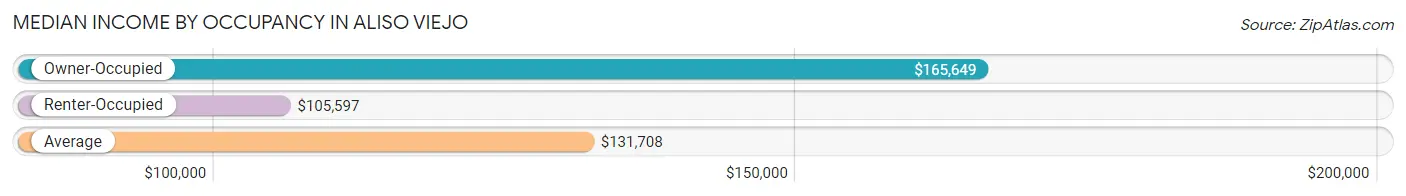
| Occupancy Type | # Households | Median Income |
| Owner-Occupied | 10,851 (56.2%) | $165,649 |
| Renter-Occupied | 8,449 (43.8%) | $105,597 |
| Average | 19,300 (100.0%) | $131,708 |
Occupancy by Householder Income Bracket in Aliso Viejo
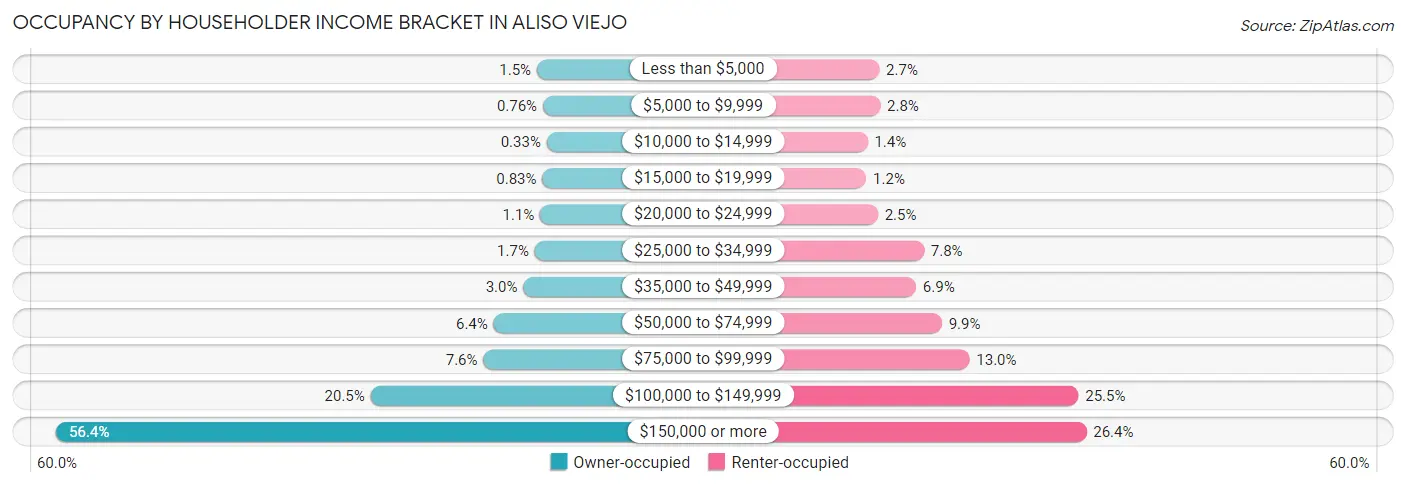
| Income Bracket | Owner-occupied | Renter-occupied |
| Less than $5,000 | 157 (1.5%) | 228 (2.7%) |
| $5,000 to $9,999 | 83 (0.8%) | 237 (2.8%) |
| $10,000 to $14,999 | 36 (0.3%) | 115 (1.4%) |
| $15,000 to $19,999 | 90 (0.8%) | 102 (1.2%) |
| $20,000 to $24,999 | 117 (1.1%) | 214 (2.5%) |
| $25,000 to $34,999 | 185 (1.7%) | 660 (7.8%) |
| $35,000 to $49,999 | 327 (3.0%) | 583 (6.9%) |
| $50,000 to $74,999 | 694 (6.4%) | 832 (9.9%) |
| $75,000 to $99,999 | 821 (7.6%) | 1,099 (13.0%) |
| $100,000 to $149,999 | 2,220 (20.5%) | 2,151 (25.5%) |
| $150,000 or more | 6,121 (56.4%) | 2,228 (26.4%) |
| Total | 10,851 (100.0%) | 8,449 (100.0%) |
Monthly Housing Cost Tiers in Aliso Viejo
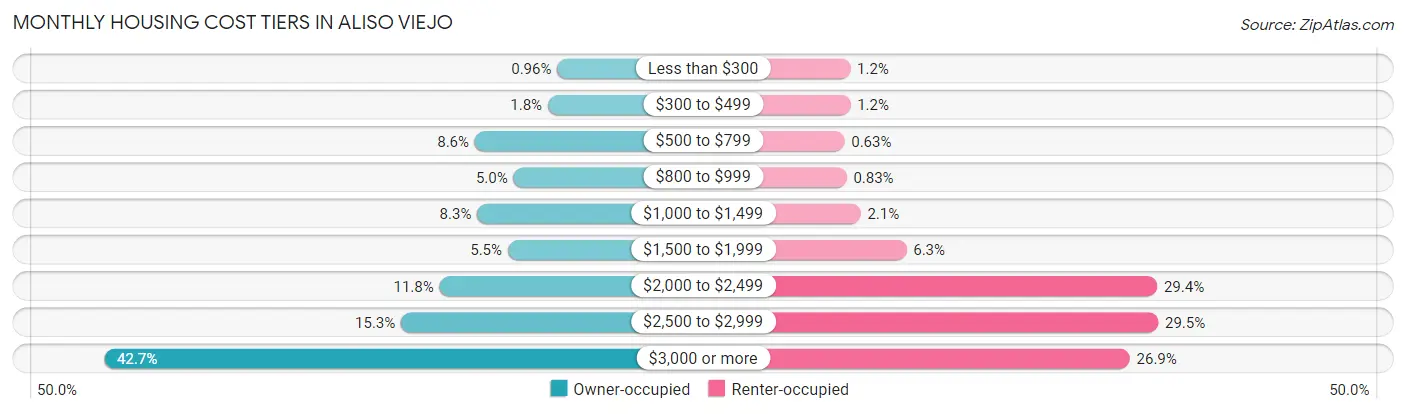
| Monthly Cost | Owner-occupied | Renter-occupied |
| Less than $300 | 104 (1.0%) | 99 (1.2%) |
| $300 to $499 | 198 (1.8%) | 100 (1.2%) |
| $500 to $799 | 928 (8.6%) | 53 (0.6%) |
| $800 to $999 | 542 (5.0%) | 70 (0.8%) |
| $1,000 to $1,499 | 904 (8.3%) | 179 (2.1%) |
| $1,500 to $1,999 | 598 (5.5%) | 536 (6.3%) |
| $2,000 to $2,499 | 1,280 (11.8%) | 2,486 (29.4%) |
| $2,500 to $2,999 | 1,665 (15.3%) | 2,494 (29.5%) |
| $3,000 or more | 4,632 (42.7%) | 2,273 (26.9%) |
| Total | 10,851 (100.0%) | 8,449 (100.0%) |
Physical Housing Characteristics in Aliso Viejo
Housing Structures in Aliso Viejo
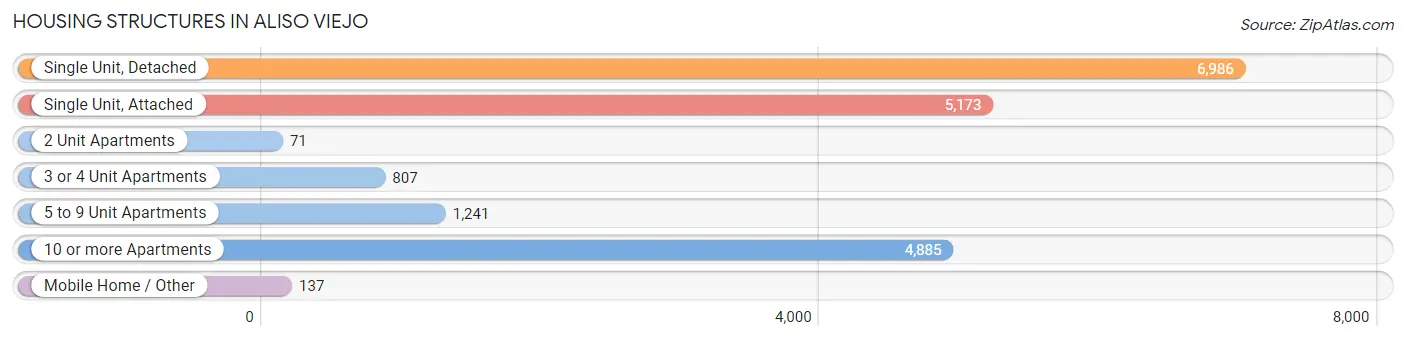
| Structure Type | # Housing Units | % Housing Units |
| Single Unit, Detached | 6,986 | 36.2% |
| Single Unit, Attached | 5,173 | 26.8% |
| 2 Unit Apartments | 71 | 0.4% |
| 3 or 4 Unit Apartments | 807 | 4.2% |
| 5 to 9 Unit Apartments | 1,241 | 6.4% |
| 10 or more Apartments | 4,885 | 25.3% |
| Mobile Home / Other | 137 | 0.7% |
| Total | 19,300 | 100.0% |
Housing Structures by Occupancy in Aliso Viejo
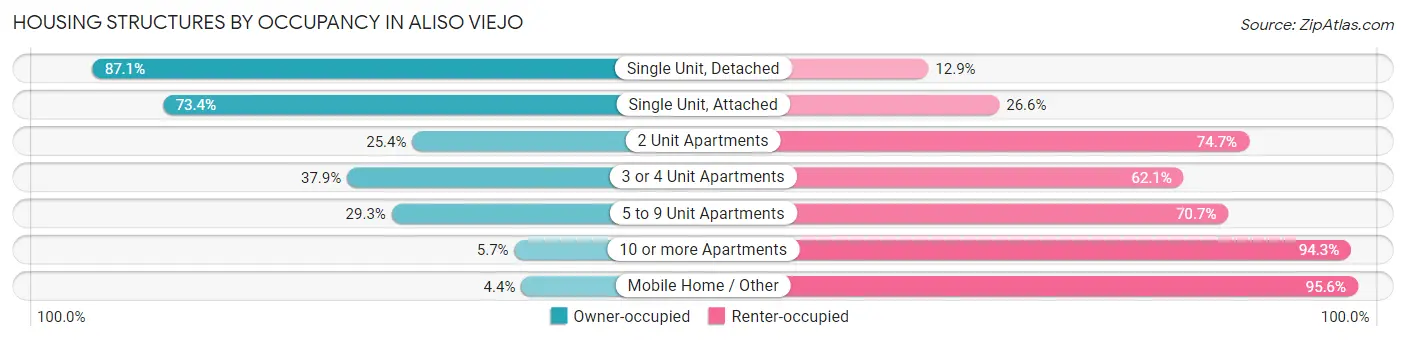
| Structure Type | Owner-occupied | Renter-occupied |
| Single Unit, Detached | 6,082 (87.1%) | 904 (12.9%) |
| Single Unit, Attached | 3,797 (73.4%) | 1,376 (26.6%) |
| 2 Unit Apartments | 18 (25.4%) | 53 (74.7%) |
| 3 or 4 Unit Apartments | 306 (37.9%) | 501 (62.1%) |
| 5 to 9 Unit Apartments | 364 (29.3%) | 877 (70.7%) |
| 10 or more Apartments | 278 (5.7%) | 4,607 (94.3%) |
| Mobile Home / Other | 6 (4.4%) | 131 (95.6%) |
| Total | 10,851 (56.2%) | 8,449 (43.8%) |
Housing Structures by Number of Rooms in Aliso Viejo
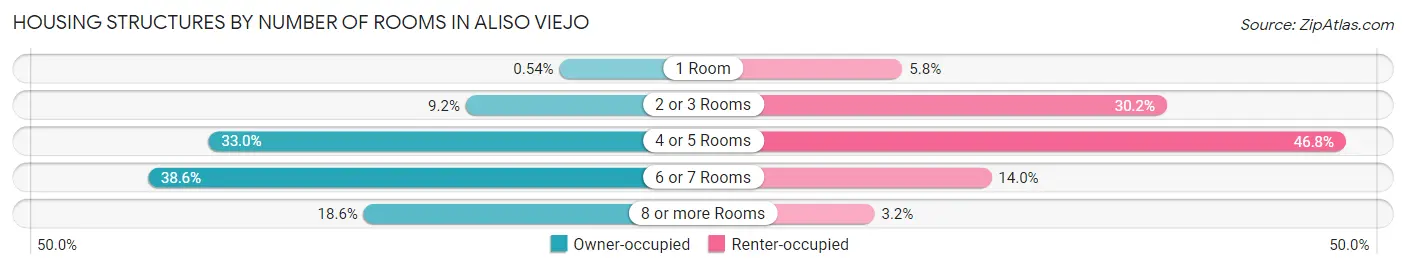
| Number of Rooms | Owner-occupied | Renter-occupied |
| 1 Room | 59 (0.5%) | 488 (5.8%) |
| 2 or 3 Rooms | 998 (9.2%) | 2,554 (30.2%) |
| 4 or 5 Rooms | 3,582 (33.0%) | 3,953 (46.8%) |
| 6 or 7 Rooms | 4,189 (38.6%) | 1,184 (14.0%) |
| 8 or more Rooms | 2,023 (18.6%) | 270 (3.2%) |
| Total | 10,851 (100.0%) | 8,449 (100.0%) |
Housing Structure by Heating Type in Aliso Viejo
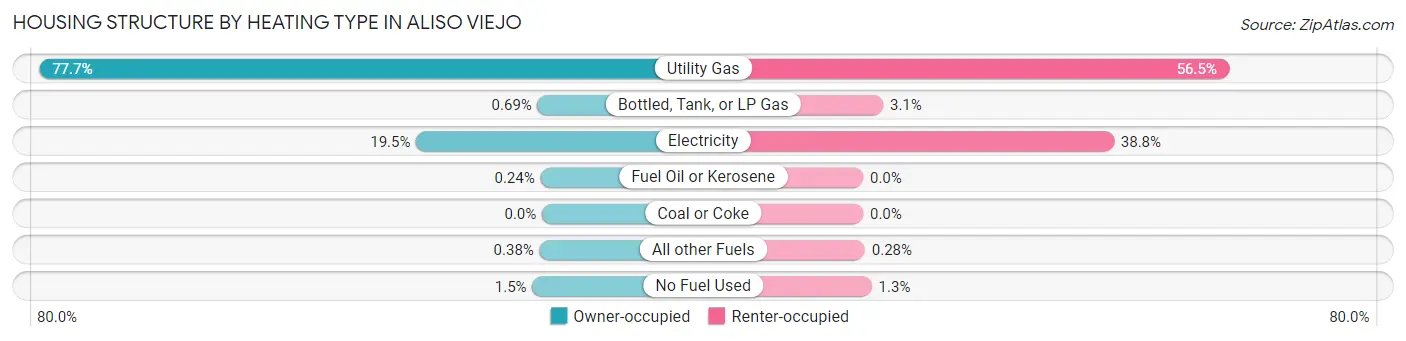
| Heating Type | Owner-occupied | Renter-occupied |
| Utility Gas | 8,435 (77.7%) | 4,776 (56.5%) |
| Bottled, Tank, or LP Gas | 75 (0.7%) | 261 (3.1%) |
| Electricity | 2,111 (19.5%) | 3,276 (38.8%) |
| Fuel Oil or Kerosene | 26 (0.2%) | 0 (0.0%) |
| Coal or Coke | 0 (0.0%) | 0 (0.0%) |
| All other Fuels | 41 (0.4%) | 24 (0.3%) |
| No Fuel Used | 163 (1.5%) | 112 (1.3%) |
| Total | 10,851 (100.0%) | 8,449 (100.0%) |
Household Vehicle Usage in Aliso Viejo
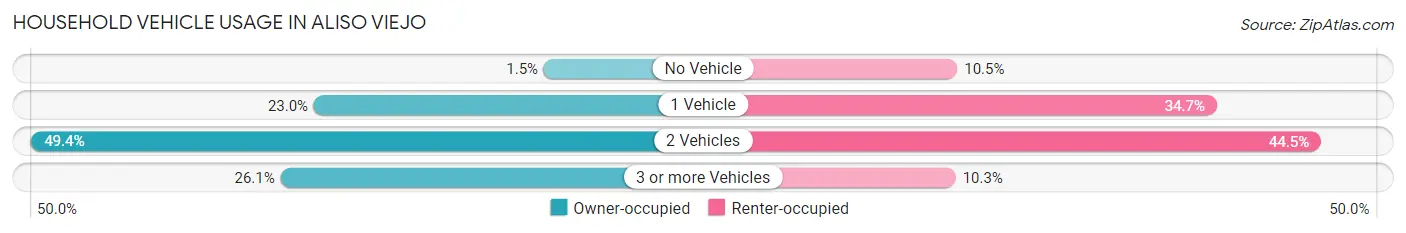
| Vehicles per Household | Owner-occupied | Renter-occupied |
| No Vehicle | 165 (1.5%) | 886 (10.5%) |
| 1 Vehicle | 2,495 (23.0%) | 2,933 (34.7%) |
| 2 Vehicles | 5,358 (49.4%) | 3,756 (44.5%) |
| 3 or more Vehicles | 2,833 (26.1%) | 874 (10.3%) |
| Total | 10,851 (100.0%) | 8,449 (100.0%) |
Real Estate & Mortgages in Aliso Viejo
Real Estate and Mortgage Overview in Aliso Viejo
| Characteristic | Without Mortgage | With Mortgage |
| Housing Units | 2,327 | 8,524 |
| Median Property Value | $802,800 | $822,300 |
| Median Household Income | $122,106 | $5,244 |
| Monthly Housing Costs | $814 | $4,632 |
| Real Estate Taxes | $4,711 | $169 |
Property Value by Mortgage Status in Aliso Viejo
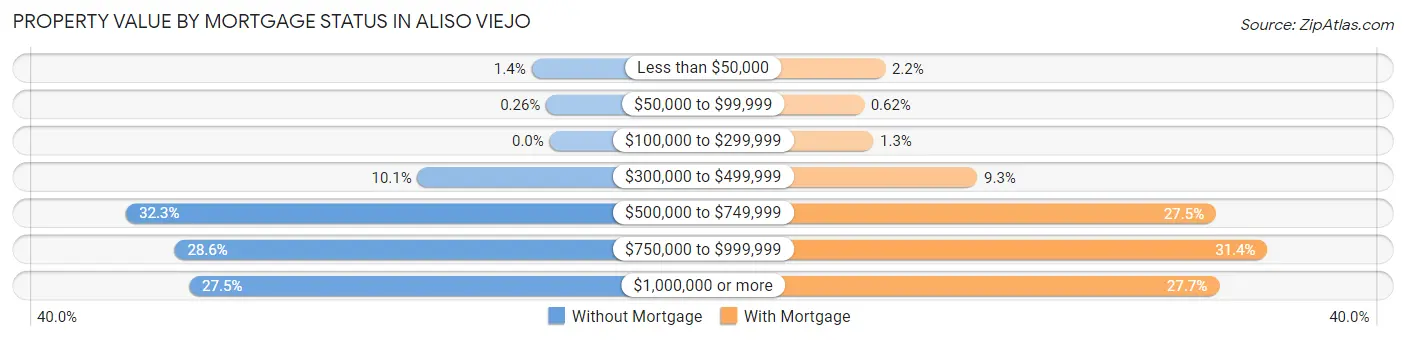
| Property Value | Without Mortgage | With Mortgage |
| Less than $50,000 | 32 (1.4%) | 191 (2.2%) |
| $50,000 to $99,999 | 6 (0.3%) | 53 (0.6%) |
| $100,000 to $299,999 | 0 (0.0%) | 114 (1.3%) |
| $300,000 to $499,999 | 234 (10.1%) | 789 (9.3%) |
| $500,000 to $749,999 | 751 (32.3%) | 2,341 (27.5%) |
| $750,000 to $999,999 | 665 (28.6%) | 2,675 (31.4%) |
| $1,000,000 or more | 639 (27.5%) | 2,361 (27.7%) |
| Total | 2,327 (100.0%) | 8,524 (100.0%) |
Household Income by Mortgage Status in Aliso Viejo
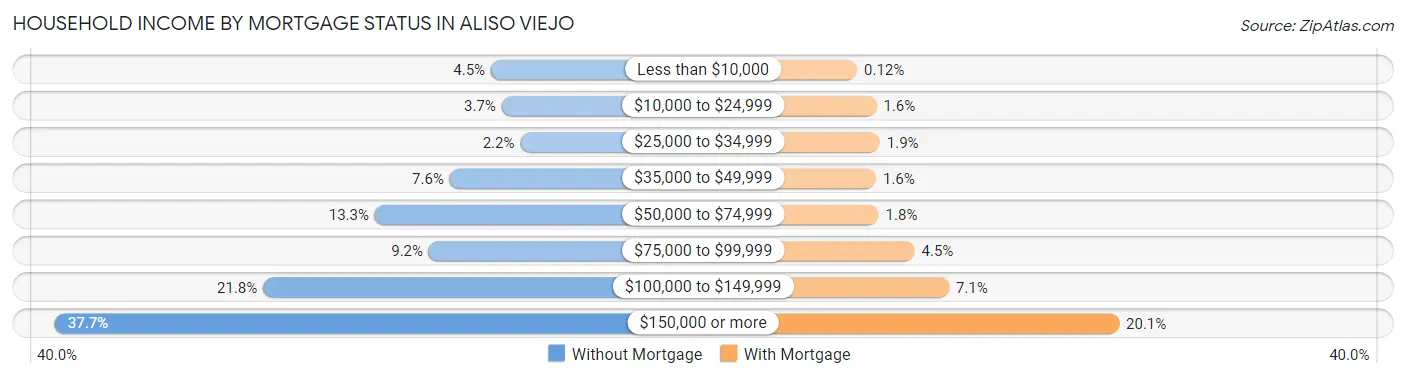
| Household Income | Without Mortgage | With Mortgage |
| Less than $10,000 | 104 (4.5%) | 10 (0.1%) |
| $10,000 to $24,999 | 85 (3.6%) | 136 (1.6%) |
| $25,000 to $34,999 | 52 (2.2%) | 158 (1.8%) |
| $35,000 to $49,999 | 177 (7.6%) | 133 (1.6%) |
| $50,000 to $74,999 | 310 (13.3%) | 150 (1.8%) |
| $75,000 to $99,999 | 214 (9.2%) | 384 (4.5%) |
| $100,000 to $149,999 | 508 (21.8%) | 607 (7.1%) |
| $150,000 or more | 877 (37.7%) | 1,712 (20.1%) |
| Total | 2,327 (100.0%) | 8,524 (100.0%) |
Property Value to Household Income Ratio in Aliso Viejo
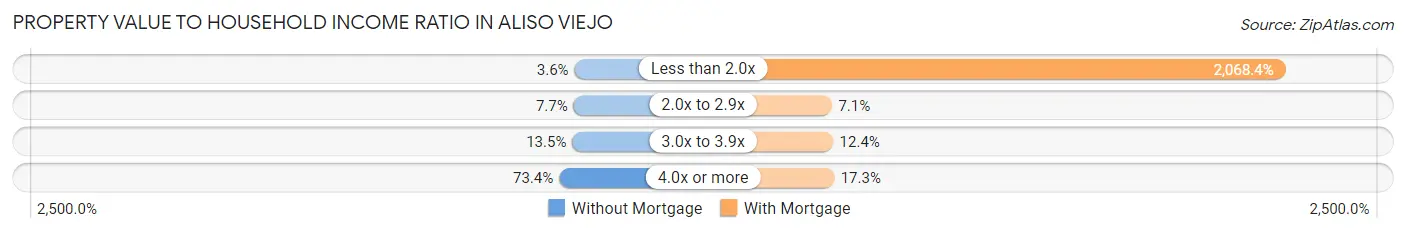
| Value-to-Income Ratio | Without Mortgage | With Mortgage |
| Less than 2.0x | 84 (3.6%) | 176,310 (2,068.4%) |
| 2.0x to 2.9x | 178 (7.6%) | 601 (7.0%) |
| 3.0x to 3.9x | 315 (13.5%) | 1,059 (12.4%) |
| 4.0x or more | 1,708 (73.4%) | 1,470 (17.2%) |
| Total | 2,327 (100.0%) | 8,524 (100.0%) |
Real Estate Taxes by Mortgage Status in Aliso Viejo
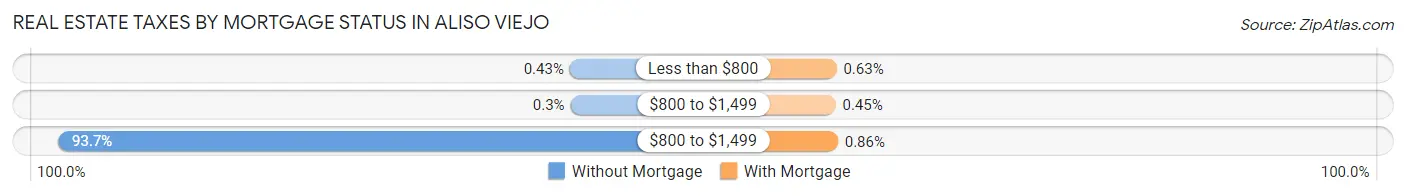
| Property Taxes | Without Mortgage | With Mortgage |
| Less than $800 | 10 (0.4%) | 54 (0.6%) |
| $800 to $1,499 | 7 (0.3%) | 38 (0.4%) |
| $800 to $1,499 | 2,181 (93.7%) | 73 (0.9%) |
| Total | 2,327 (100.0%) | 8,524 (100.0%) |
Health & Disability in Aliso Viejo
Health Insurance Coverage by Age in Aliso Viejo
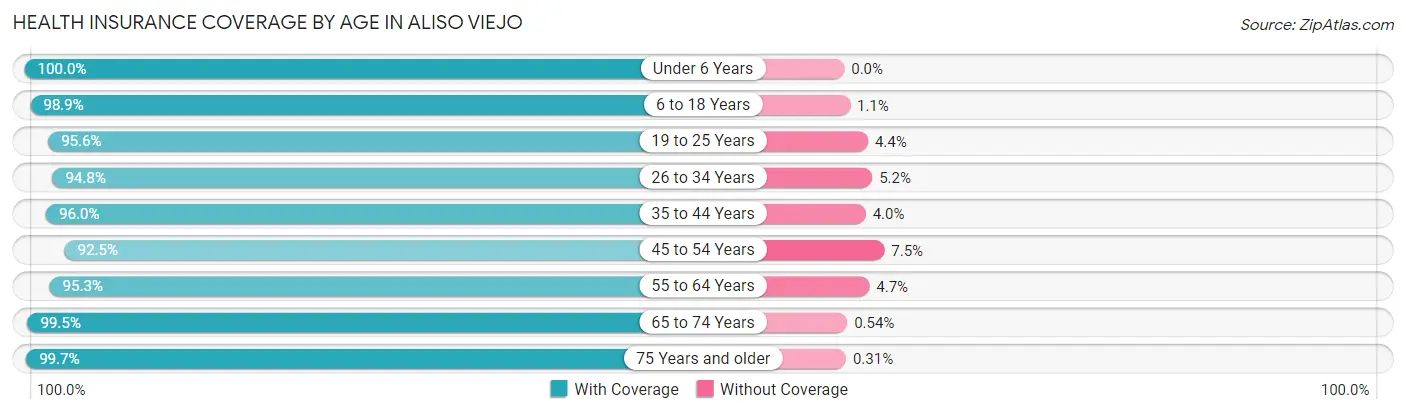
| Age Bracket | With Coverage | Without Coverage |
| Under 6 Years | 4,195 (100.0%) | 0 (0.0%) |
| 6 to 18 Years | 9,160 (98.9%) | 99 (1.1%) |
| 19 to 25 Years | 3,819 (95.6%) | 176 (4.4%) |
| 26 to 34 Years | 5,620 (94.8%) | 309 (5.2%) |
| 35 to 44 Years | 8,235 (96.0%) | 343 (4.0%) |
| 45 to 54 Years | 7,571 (92.5%) | 611 (7.5%) |
| 55 to 64 Years | 6,354 (95.3%) | 312 (4.7%) |
| 65 to 74 Years | 2,780 (99.5%) | 15 (0.5%) |
| 75 Years and older | 2,225 (99.7%) | 7 (0.3%) |
| Total | 49,959 (96.4%) | 1,872 (3.6%) |
Health Insurance Coverage by Citizenship Status in Aliso Viejo
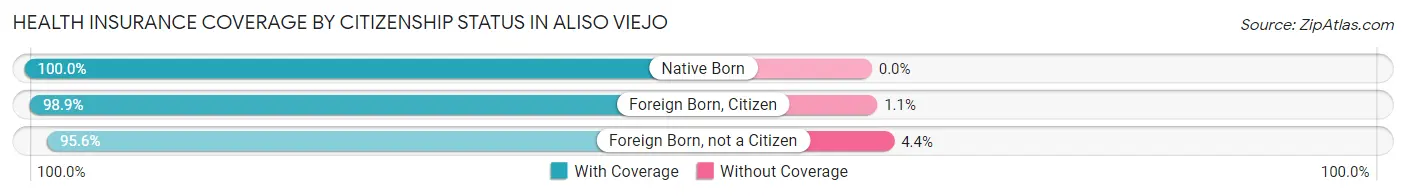
| Citizenship Status | With Coverage | Without Coverage |
| Native Born | 4,195 (100.0%) | 0 (0.0%) |
| Foreign Born, Citizen | 9,160 (98.9%) | 99 (1.1%) |
| Foreign Born, not a Citizen | 3,819 (95.6%) | 176 (4.4%) |
Health Insurance Coverage by Household Income in Aliso Viejo
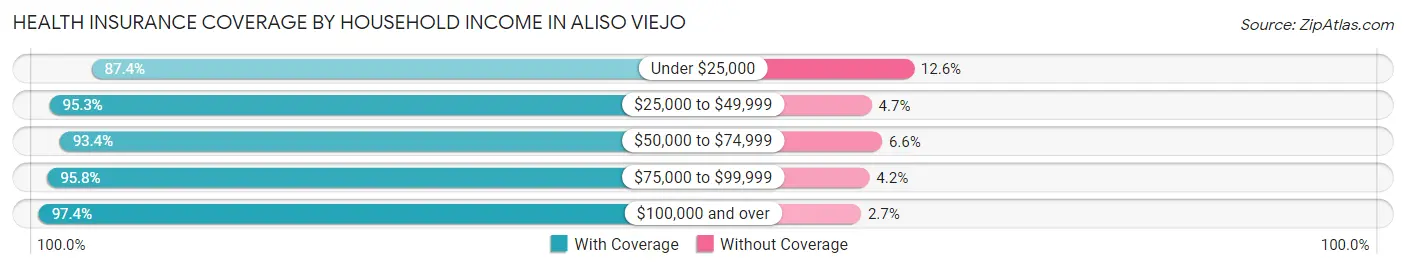
| Household Income | With Coverage | Without Coverage |
| Under $25,000 | 2,149 (87.4%) | 309 (12.6%) |
| $25,000 to $49,999 | 3,070 (95.3%) | 150 (4.7%) |
| $50,000 to $74,999 | 3,119 (93.4%) | 220 (6.6%) |
| $75,000 to $99,999 | 4,038 (95.8%) | 179 (4.2%) |
| $100,000 and over | 36,978 (97.4%) | 1,008 (2.6%) |
Public vs Private Health Insurance Coverage by Age in Aliso Viejo
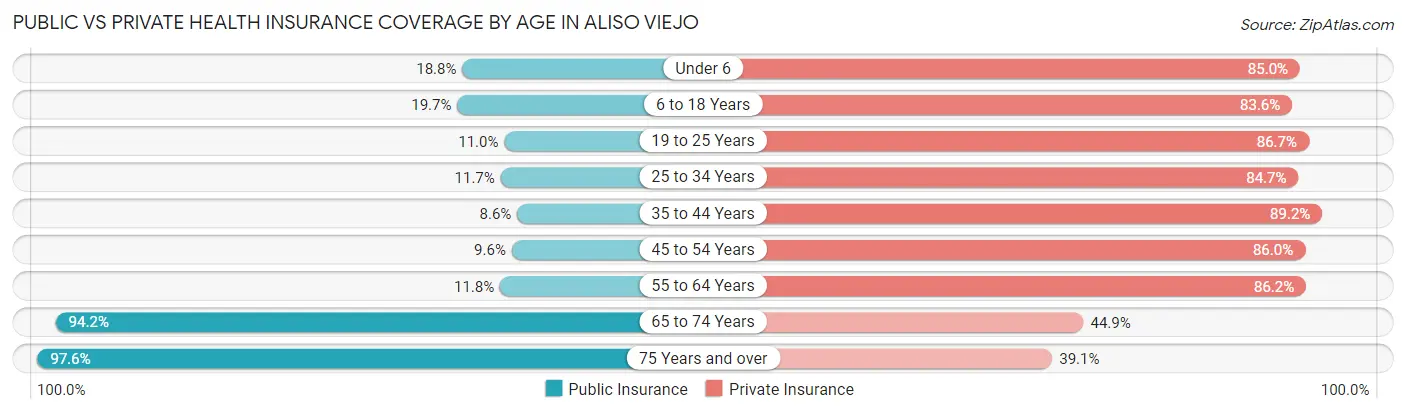
| Age Bracket | Public Insurance | Private Insurance |
| Under 6 | 787 (18.8%) | 3,567 (85.0%) |
| 6 to 18 Years | 1,823 (19.7%) | 7,739 (83.6%) |
| 19 to 25 Years | 438 (11.0%) | 3,463 (86.7%) |
| 25 to 34 Years | 691 (11.7%) | 5,023 (84.7%) |
| 35 to 44 Years | 735 (8.6%) | 7,648 (89.2%) |
| 45 to 54 Years | 784 (9.6%) | 7,034 (86.0%) |
| 55 to 64 Years | 783 (11.7%) | 5,744 (86.2%) |
| 65 to 74 Years | 2,634 (94.2%) | 1,254 (44.9%) |
| 75 Years and over | 2,179 (97.6%) | 872 (39.1%) |
| Total | 10,854 (20.9%) | 42,344 (81.7%) |
Disability Status by Sex by Age in Aliso Viejo
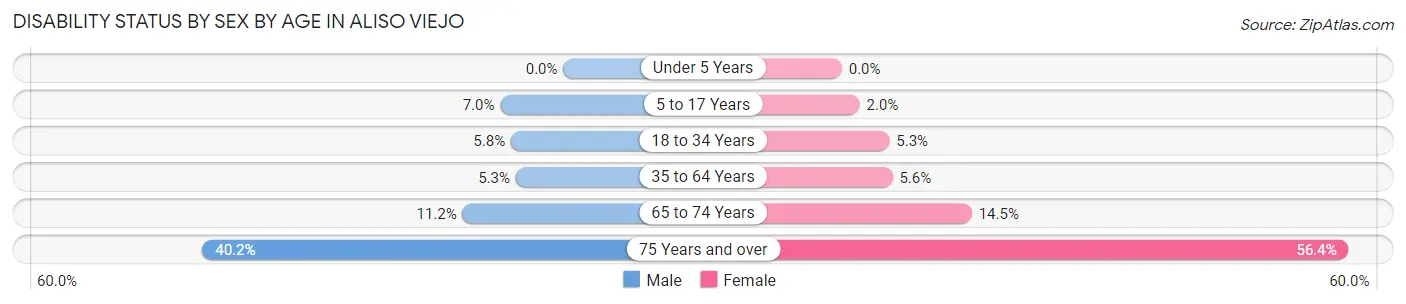
| Age Bracket | Male | Female |
| Under 5 Years | 0 (0.0%) | 0 (0.0%) |
| 5 to 17 Years | 316 (7.0%) | 94 (2.0%) |
| 18 to 34 Years | 305 (5.8%) | 282 (5.3%) |
| 35 to 64 Years | 607 (5.3%) | 674 (5.6%) |
| 65 to 74 Years | 144 (11.2%) | 219 (14.5%) |
| 75 Years and over | 341 (40.2%) | 781 (56.4%) |
Disability Class by Sex by Age in Aliso Viejo
Disability Class: Hearing Difficulty
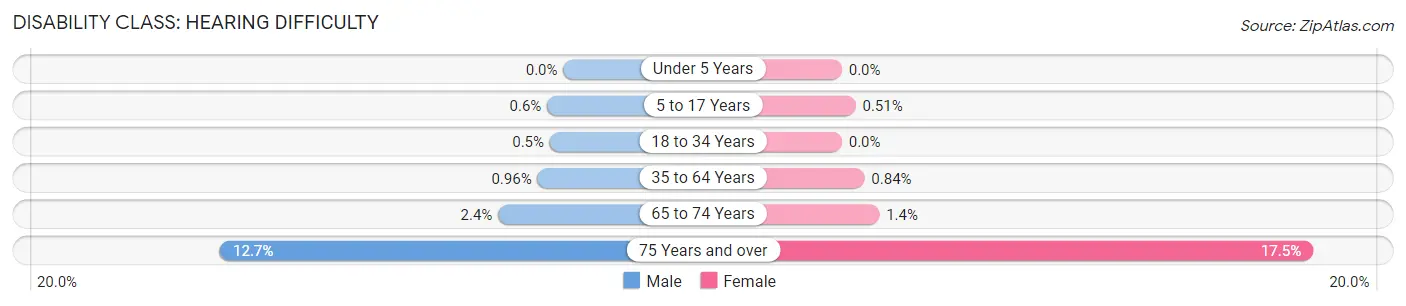
| Age Bracket | Male | Female |
| Under 5 Years | 0 (0.0%) | 0 (0.0%) |
| 5 to 17 Years | 27 (0.6%) | 24 (0.5%) |
| 18 to 34 Years | 26 (0.5%) | 0 (0.0%) |
| 35 to 64 Years | 110 (1.0%) | 100 (0.8%) |
| 65 to 74 Years | 31 (2.4%) | 21 (1.4%) |
| 75 Years and over | 108 (12.7%) | 242 (17.5%) |
Disability Class: Vision Difficulty
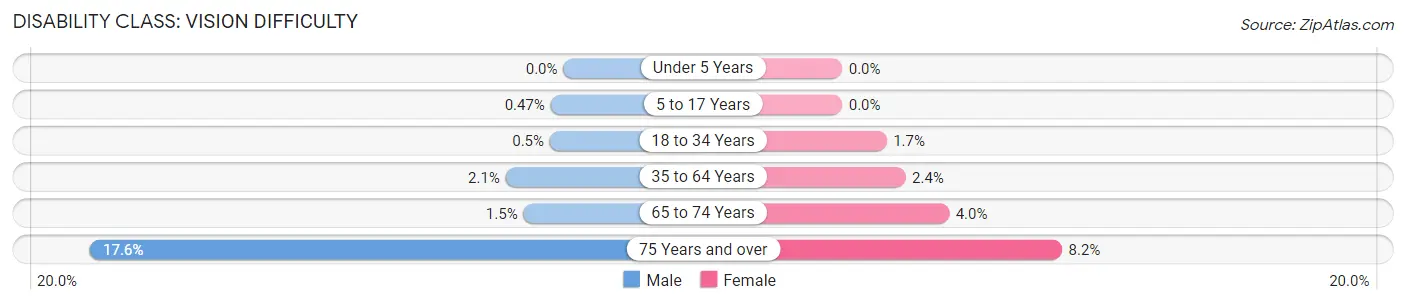
| Age Bracket | Male | Female |
| Under 5 Years | 0 (0.0%) | 0 (0.0%) |
| 5 to 17 Years | 21 (0.5%) | 0 (0.0%) |
| 18 to 34 Years | 26 (0.5%) | 88 (1.7%) |
| 35 to 64 Years | 245 (2.1%) | 281 (2.4%) |
| 65 to 74 Years | 19 (1.5%) | 60 (4.0%) |
| 75 Years and over | 149 (17.6%) | 113 (8.2%) |
Disability Class: Cognitive Difficulty
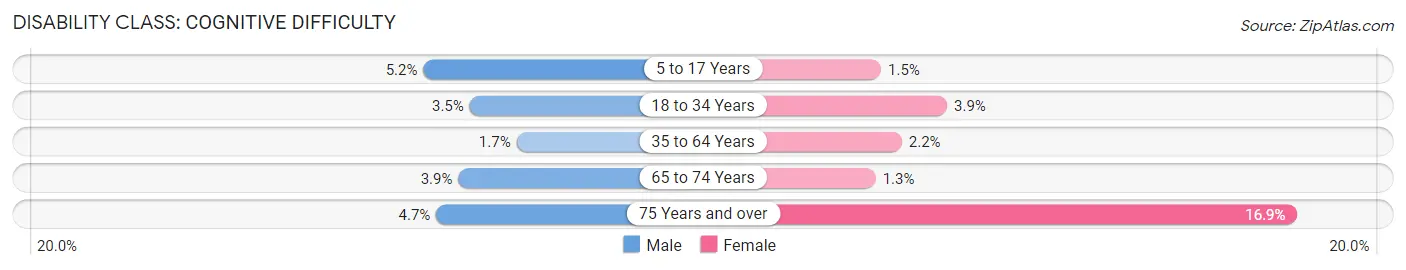
| Age Bracket | Male | Female |
| 5 to 17 Years | 234 (5.2%) | 69 (1.5%) |
| 18 to 34 Years | 182 (3.5%) | 208 (3.9%) |
| 35 to 64 Years | 199 (1.7%) | 267 (2.2%) |
| 65 to 74 Years | 50 (3.9%) | 19 (1.3%) |
| 75 Years and over | 40 (4.7%) | 234 (16.9%) |
Disability Class: Ambulatory Difficulty
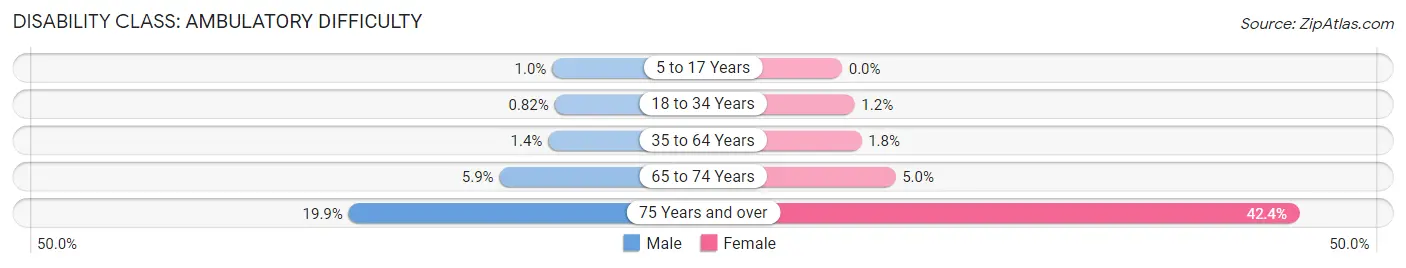
| Age Bracket | Male | Female |
| 5 to 17 Years | 47 (1.0%) | 0 (0.0%) |
| 18 to 34 Years | 43 (0.8%) | 62 (1.2%) |
| 35 to 64 Years | 162 (1.4%) | 215 (1.8%) |
| 65 to 74 Years | 76 (5.9%) | 75 (5.0%) |
| 75 Years and over | 169 (19.9%) | 587 (42.4%) |
Disability Class: Self-Care Difficulty
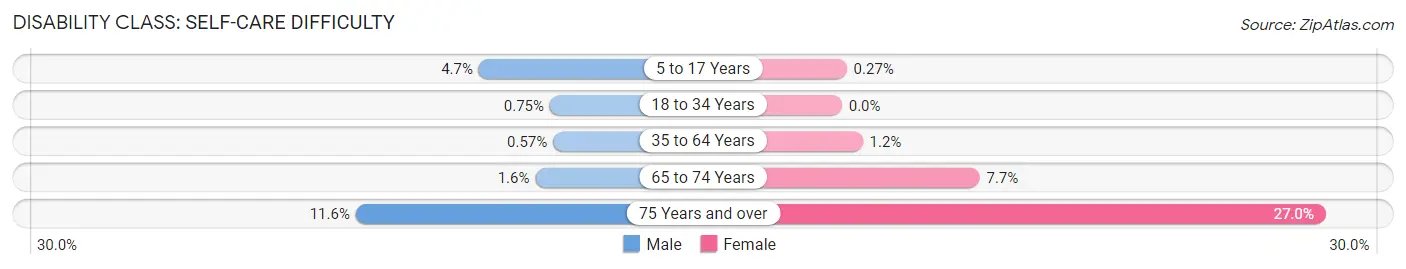
| Age Bracket | Male | Female |
| 5 to 17 Years | 212 (4.7%) | 13 (0.3%) |
| 18 to 34 Years | 39 (0.7%) | 0 (0.0%) |
| 35 to 64 Years | 65 (0.6%) | 139 (1.2%) |
| 65 to 74 Years | 20 (1.6%) | 116 (7.7%) |
| 75 Years and over | 98 (11.6%) | 373 (27.0%) |
Technology Access in Aliso Viejo
Computing Device Access in Aliso Viejo
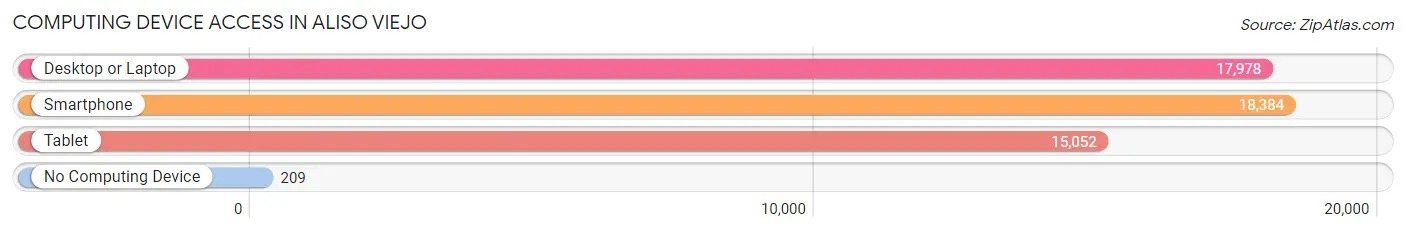
| Device Type | # Households | % Households |
| Desktop or Laptop | 17,978 | 93.1% |
| Smartphone | 18,384 | 95.3% |
| Tablet | 15,052 | 78.0% |
| No Computing Device | 209 | 1.1% |
| Total | 19,300 | 100.0% |
Internet Access in Aliso Viejo
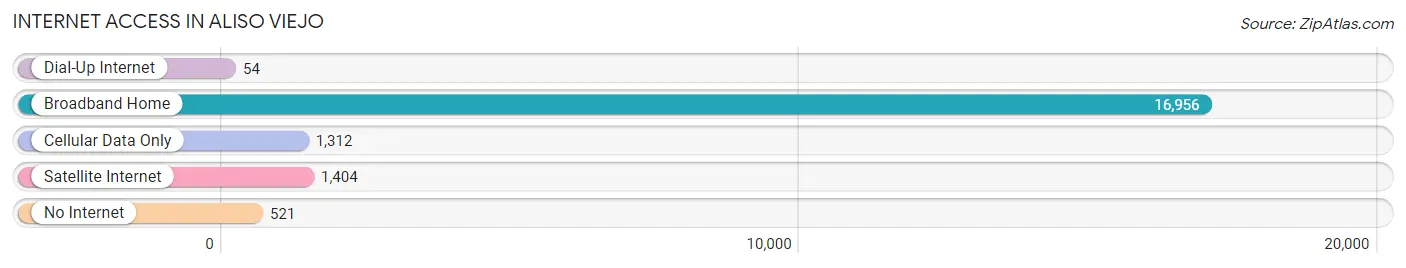
| Internet Type | # Households | % Households |
| Dial-Up Internet | 54 | 0.3% |
| Broadband Home | 16,956 | 87.8% |
| Cellular Data Only | 1,312 | 6.8% |
| Satellite Internet | 1,404 | 7.3% |
| No Internet | 521 | 2.7% |
| Total | 19,300 | 100.0% |
Aliso Viejo Summary
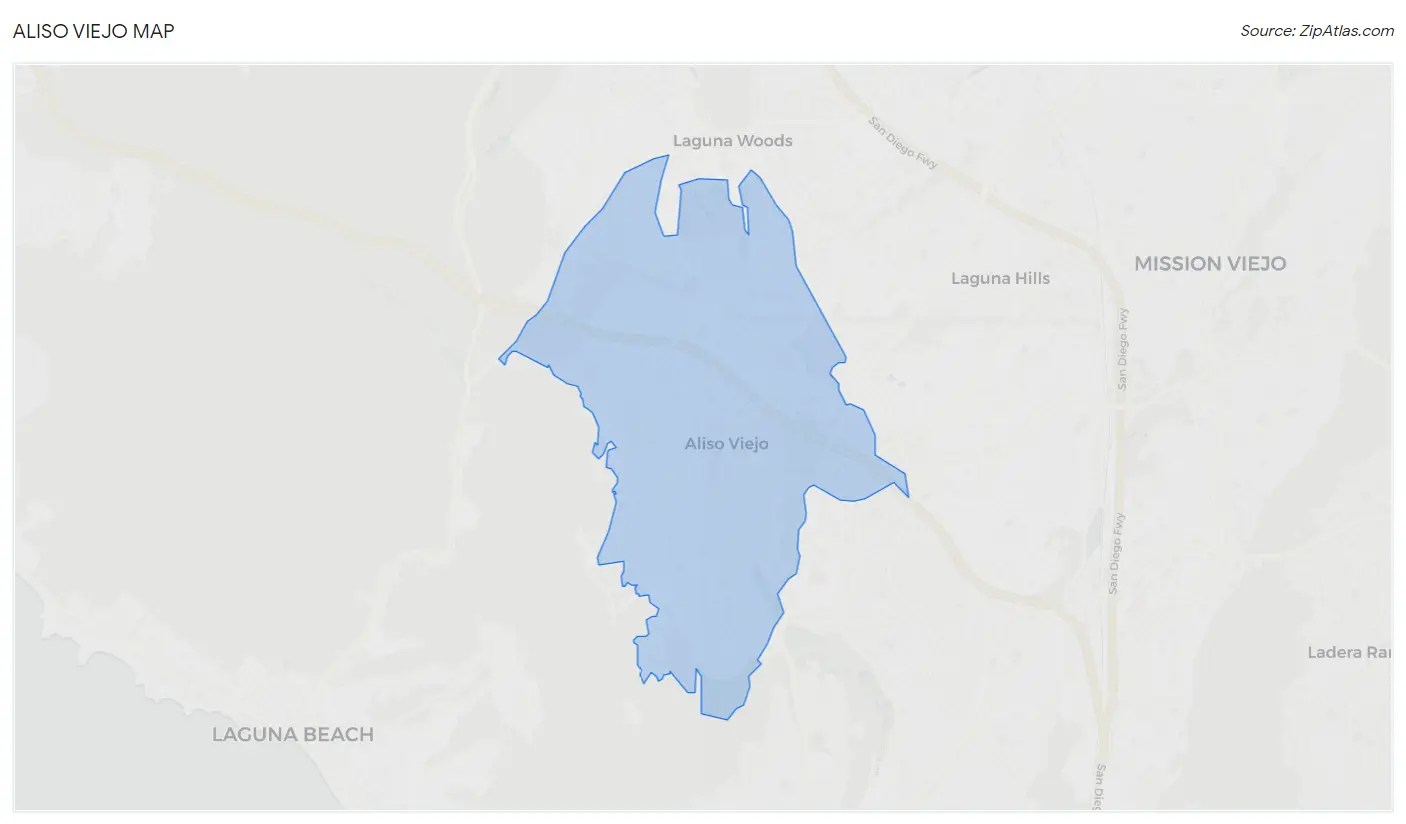
Aliso Viejo is a city located in Orange County, California. It is located in the San Joaquin Hills, and is bordered by Laguna Beach, Laguna Hills, Laguna Niguel, and Laguna Woods. The city was incorporated in 2001, and has a population of approximately 50,000 people.
History
The area that is now Aliso Viejo was originally inhabited by the Acjachemen Native American tribe. The area was later settled by Spanish missionaries in the late 1700s. In the early 1800s, the area was part of the Rancho Niguel Mexican land grant. In the late 1800s, the area was part of the Moulton Ranch, which was owned by the Moulton family. In 1976, the Moulton Ranch was purchased by the Mission Viejo Company, which developed the area into a planned community. The area was incorporated as the City of Aliso Viejo in 2001.
Geography
Aliso Viejo is located in the San Joaquin Hills, and is bordered by Laguna Beach, Laguna Hills, Laguna Niguel, and Laguna Woods. The city has a total area of 7.4 square miles, of which 7.3 square miles is land and 0.1 square miles is water. The city is located at an elevation of about 500 feet above sea level.
Economy
Aliso Viejo is home to a variety of businesses, including technology, finance, and healthcare companies. The city is also home to the headquarters of several major companies, including Allergan, Quest Diagnostics, and Soka University of America. The city also has a thriving retail sector, with several shopping centers and retail outlets.
Demographics
As of the 2010 census, Aliso Viejo had a population of 47,823 people. The racial makeup of the city was 75.3% White, 8.2% Asian, 6.2% Hispanic or Latino, 4.2% African American, 0.5% Native American, 0.1% Pacific Islander, and 5.5% from other races. The median household income in Aliso Viejo was $90,845, and the median family income was $103,844. The per capita income in Aliso Viejo was $37,845.
Conclusion
Aliso Viejo is a city located in Orange County, California. It was incorporated in 2001, and has a population of approximately 50,000 people. The city is located in the San Joaquin Hills, and is bordered by Laguna Beach, Laguna Hills, Laguna Niguel, and Laguna Woods. The economy of Aliso Viejo is diverse, with a variety of businesses, including technology, finance, and healthcare companies. The city also has a thriving retail sector, with several shopping centers and retail outlets. As of the 2010 census, Aliso Viejo had a population of 47,823 people, with a median household income of $90,845 and a median family income of $103,844.
Common Questions
What is Per Capita Income in Aliso Viejo?
Per Capita income in Aliso Viejo is $59,852.
What is the Median Family Income in Aliso Viejo?
Median Family Income in Aliso Viejo is $153,877.
What is the Median Household income in Aliso Viejo?
Median Household Income in Aliso Viejo is $131,708.
What is Income or Wage Gap in Aliso Viejo?
Income or Wage Gap in Aliso Viejo is 27.0%.
Women in Aliso Viejo earn 73.0 cents for every dollar earned by a man.
What is Inequality or Gini Index in Aliso Viejo?
Inequality or Gini Index in Aliso Viejo is 0.40.
What is the Total Population of Aliso Viejo?
Total Population of Aliso Viejo is 51,896.
What is the Total Male Population of Aliso Viejo?
Total Male Population of Aliso Viejo is 25,069.
What is the Total Female Population of Aliso Viejo?
Total Female Population of Aliso Viejo is 26,827.
What is the Ratio of Males per 100 Females in Aliso Viejo?
There are 93.45 Males per 100 Females in Aliso Viejo.
What is the Ratio of Females per 100 Males in Aliso Viejo?
There are 107.01 Females per 100 Males in Aliso Viejo.
What is the Median Population Age in Aliso Viejo?
Median Population Age in Aliso Viejo is 37.9 Years.
What is the Average Family Size in Aliso Viejo
Average Family Size in Aliso Viejo is 3.2 People.
What is the Average Household Size in Aliso Viejo
Average Household Size in Aliso Viejo is 2.7 People.
How Large is the Labor Force in Aliso Viejo?
There are 30,539 People in the Labor Forcein in Aliso Viejo.
What is the Percentage of People in the Labor Force in Aliso Viejo?
75.3% of People are in the Labor Force in Aliso Viejo.
What is the Unemployment Rate in Aliso Viejo?
Unemployment Rate in Aliso Viejo is 3.8%.