Young, AZ Map & Demographics
Young Map
Young Overview
$29,167
PER CAPITA INCOME
$95,446
AVG FAMILY INCOME
$47,000
AVG HOUSEHOLD INCOME
0.40
INEQUALITY / GINI INDEX
407
TOTAL POPULATION
210
MALE POPULATION
197
FEMALE POPULATION
106.60
MALES / 100 FEMALES
93.81
FEMALES / 100 MALES
60.4
MEDIAN AGE
2.7
AVG FAMILY SIZE
1.7
AVG HOUSEHOLD SIZE
118
LABOR FORCE [ PEOPLE ]
33.3%
PERCENT IN LABOR FORCE
Young Zip Codes
Young Area Codes
Income in Young
Income Overview in Young
Per Capita Income in Young is $29,167, while median incomes of families and households are $95,446 and $47,000 respectively.
| Characteristic | Number | Measure |
| Per Capita Income | 407 | $29,167 |
| Median Family Income | 95 | $95,446 |
| Mean Family Income | 95 | $84,733 |
| Median Household Income | 228 | $47,000 |
| Mean Household Income | 228 | $53,506 |
| Income Deficit | 95 | $0 |
| Wage / Income Gap (%) | 407 | 0.00% |
| Wage / Income Gap ($) | 407 | 100.00¢ per $1 |
| Gini / Inequality Index | 407 | 0.40 |
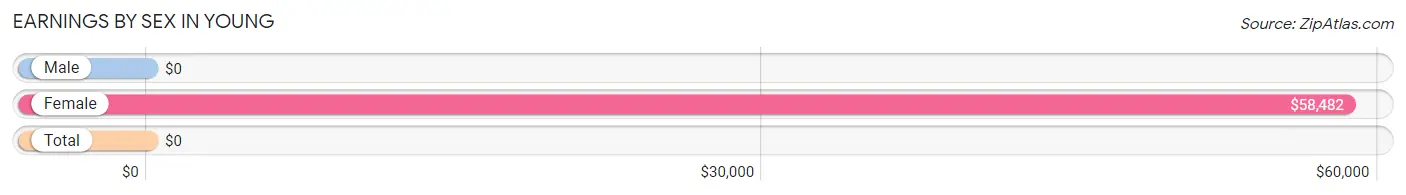
Earnings by Sex in Young
| Sex | Number | Average Earnings |
| Male | 81 (63.3%) | $0 |
| Female | 47 (36.7%) | $58,482 |
| Total | 128 (100.0%) | $0 |
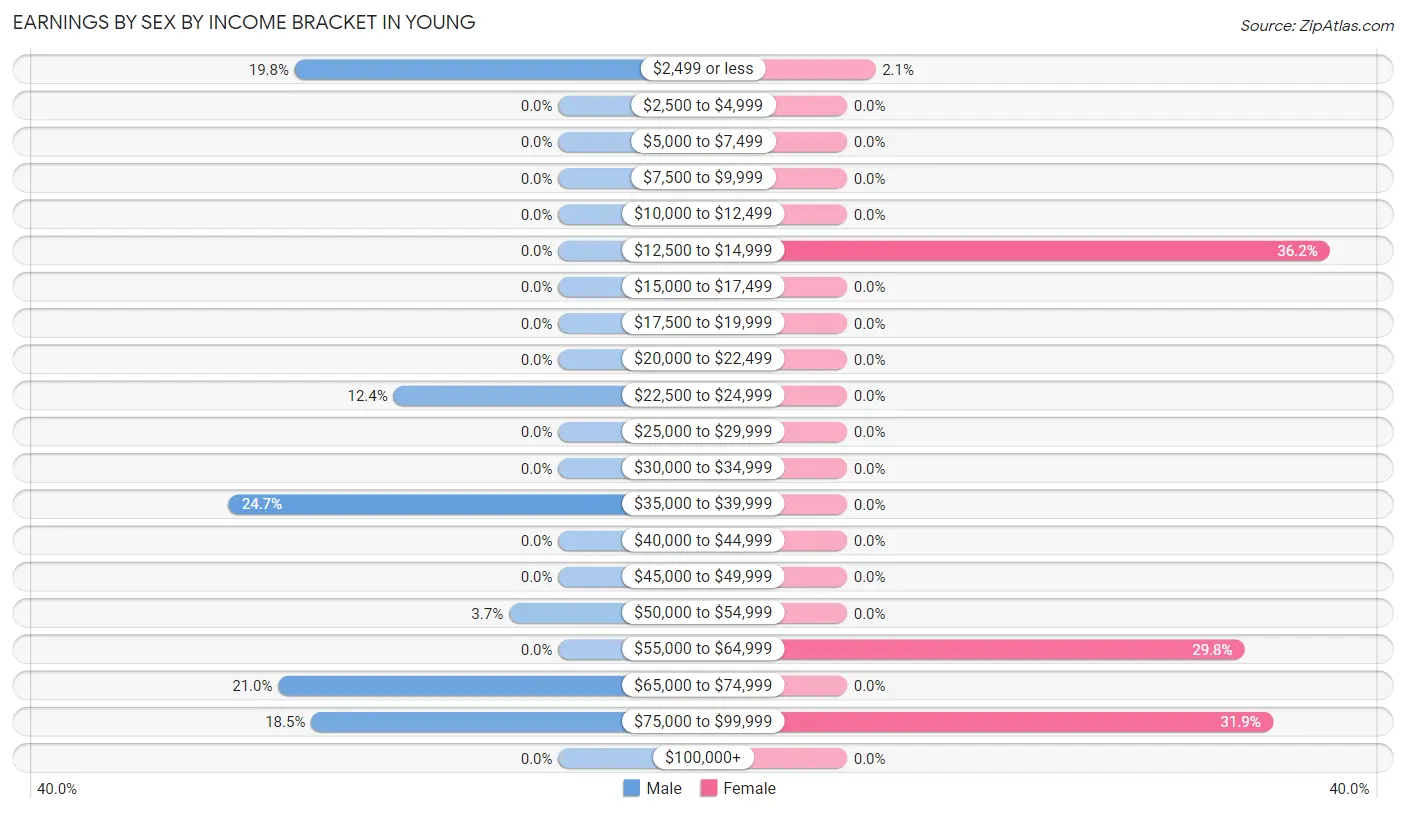
Earnings by Sex by Income Bracket in Young
The most common earnings brackets in Young are $35,000 to $39,999 for men (20 | 24.7%) and $12,500 to $14,999 for women (17 | 36.2%).
| Income | Male | Female |
| $2,499 or less | 16 (19.8%) | 1 (2.1%) |
| $2,500 to $4,999 | 0 (0.0%) | 0 (0.0%) |
| $5,000 to $7,499 | 0 (0.0%) | 0 (0.0%) |
| $7,500 to $9,999 | 0 (0.0%) | 0 (0.0%) |
| $10,000 to $12,499 | 0 (0.0%) | 0 (0.0%) |
| $12,500 to $14,999 | 0 (0.0%) | 17 (36.2%) |
| $15,000 to $17,499 | 0 (0.0%) | 0 (0.0%) |
| $17,500 to $19,999 | 0 (0.0%) | 0 (0.0%) |
| $20,000 to $22,499 | 0 (0.0%) | 0 (0.0%) |
| $22,500 to $24,999 | 10 (12.3%) | 0 (0.0%) |
| $25,000 to $29,999 | 0 (0.0%) | 0 (0.0%) |
| $30,000 to $34,999 | 0 (0.0%) | 0 (0.0%) |
| $35,000 to $39,999 | 20 (24.7%) | 0 (0.0%) |
| $40,000 to $44,999 | 0 (0.0%) | 0 (0.0%) |
| $45,000 to $49,999 | 0 (0.0%) | 0 (0.0%) |
| $50,000 to $54,999 | 3 (3.7%) | 0 (0.0%) |
| $55,000 to $64,999 | 0 (0.0%) | 14 (29.8%) |
| $65,000 to $74,999 | 17 (21.0%) | 0 (0.0%) |
| $75,000 to $99,999 | 15 (18.5%) | 15 (31.9%) |
| $100,000+ | 0 (0.0%) | 0 (0.0%) |
| Total | 81 (100.0%) | 47 (100.0%) |
Earnings by Sex by Educational Attainment in Young
| Educational Attainment | Male Income | Female Income |
| Less than High School | - | - |
| High School Diploma | - | - |
| College or Associate's Degree | - | - |
| Bachelor's Degree | - | - |
| Graduate Degree | - | - |
| Total | - | - |
Family Income in Young
Family Income Brackets in Young
According to the Young family income data, there are 36 families falling into the $100,000 to $149,999 income range, which is the most common income bracket and makes up 37.9% of all families.
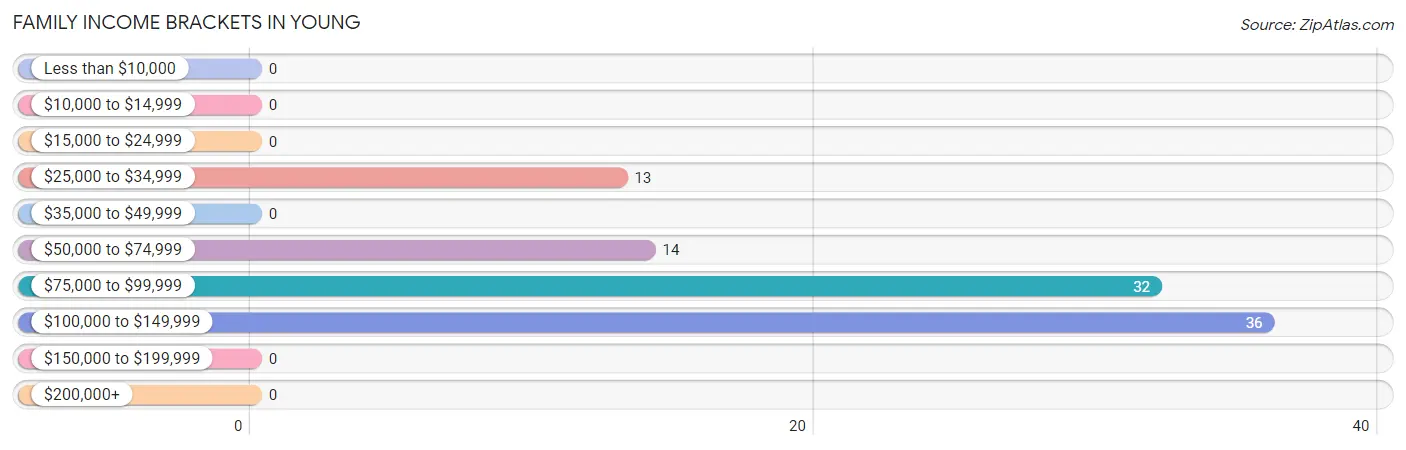
| Income Bracket | # Families | % Families |
| Less than $10,000 | 0 | 0.0% |
| $10,000 to $14,999 | 0 | 0.0% |
| $15,000 to $24,999 | 0 | 0.0% |
| $25,000 to $34,999 | 13 | 13.7% |
| $35,000 to $49,999 | 0 | 0.0% |
| $50,000 to $74,999 | 14 | 14.7% |
| $75,000 to $99,999 | 32 | 33.7% |
| $100,000 to $149,999 | 36 | 37.9% |
| $150,000 to $199,999 | 0 | 0.0% |
| $200,000+ | 0 | 0.0% |
Family Income by Famaliy Size in Young
2-person families (50 | 52.6%) account for the highest median family income in Young with $93,750 per family, while 2-person families (50 | 52.6%) have the highest median income of $46,875 per family member.
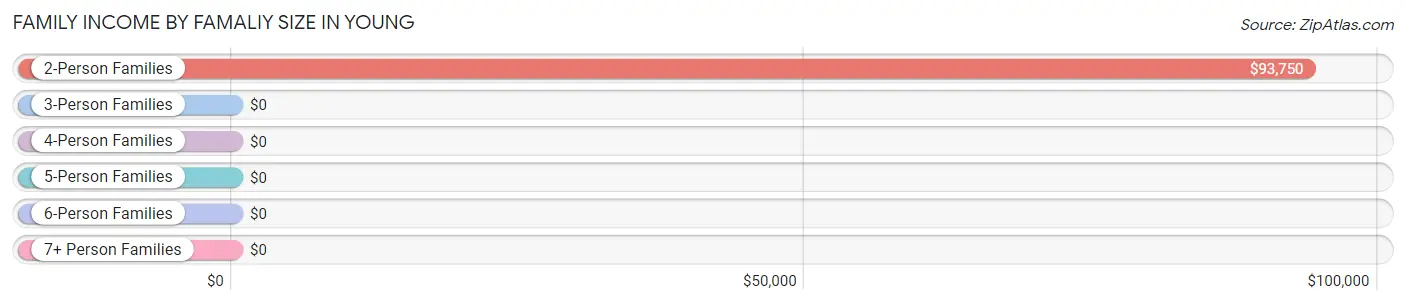
| Income Bracket | # Families | Median Income |
| 2-Person Families | 50 (52.6%) | $93,750 |
| 3-Person Families | 20 (21.0%) | $0 |
| 4-Person Families | 25 (26.3%) | $0 |
| 5-Person Families | 0 (0.0%) | $0 |
| 6-Person Families | 0 (0.0%) | $0 |
| 7+ Person Families | 0 (0.0%) | $0 |
| Total | 95 (100.0%) | $95,446 |
Family Income by Number of Earners in Young
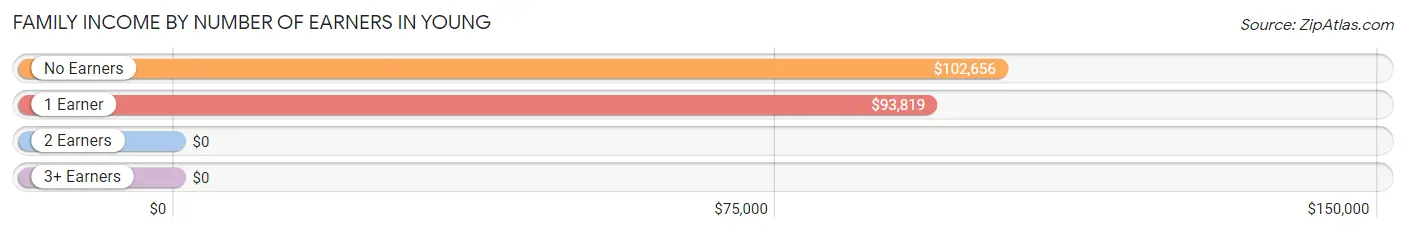
| Number of Earners | # Families | Median Income |
| No Earners | 30 (31.6%) | $102,656 |
| 1 Earner | 45 (47.4%) | $93,819 |
| 2 Earners | 0 (0.0%) | $0 |
| 3+ Earners | 20 (21.0%) | $0 |
| Total | 95 (100.0%) | $95,446 |
Household Income in Young
Household Income Brackets in Young
With 51 households falling in the category, the $10,000 to $14,999 income range is the most frequent in Young, accounting for 22.4% of all households.
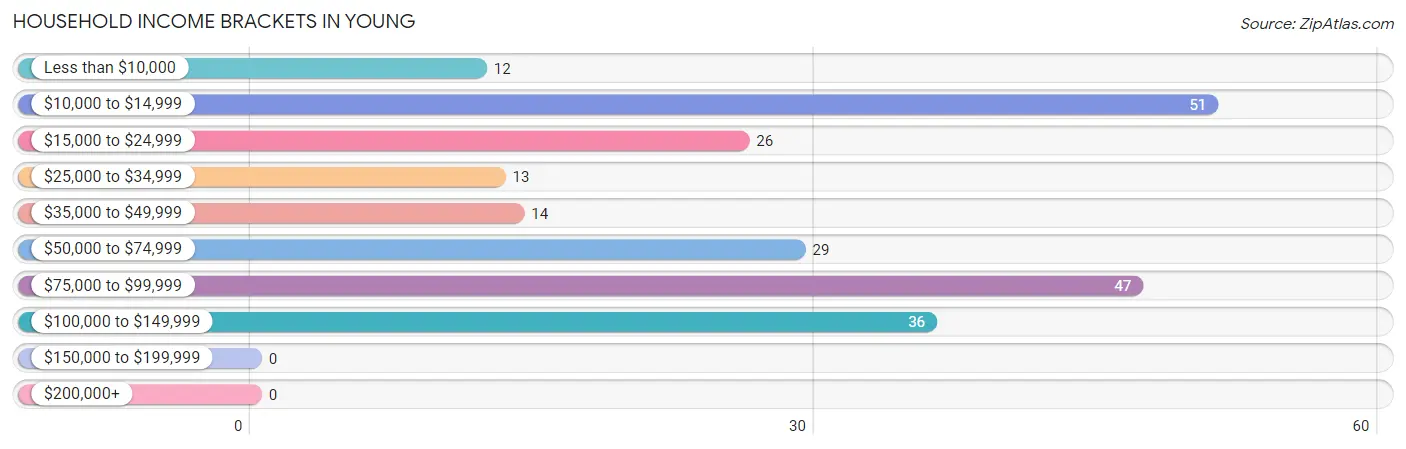
| Income Bracket | # Households | % Households |
| Less than $10,000 | 12 | 5.3% |
| $10,000 to $14,999 | 51 | 22.4% |
| $15,000 to $24,999 | 26 | 11.4% |
| $25,000 to $34,999 | 13 | 5.7% |
| $35,000 to $49,999 | 14 | 6.1% |
| $50,000 to $74,999 | 29 | 12.7% |
| $75,000 to $99,999 | 47 | 20.6% |
| $100,000 to $149,999 | 36 | 15.8% |
| $150,000 to $199,999 | 0 | 0.0% |
| $200,000+ | 0 | 0.0% |
Household Income by Householder Age in Young
The median household income in Young is $47,000, with the highest median household income of $52,841 found in the 65+ years age bracket for the primary householder. A total of 87 households (38.2%) fall into this category.
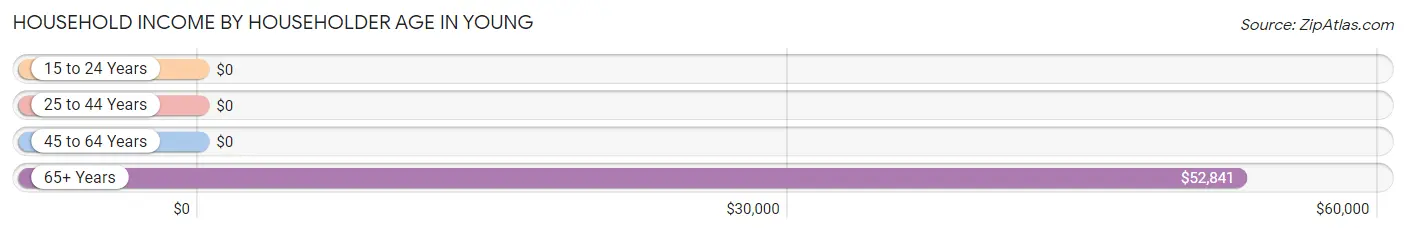
| Income Bracket | # Households | Median Income |
| 15 to 24 Years | 0 (0.0%) | $0 |
| 25 to 44 Years | 14 (6.1%) | $0 |
| 45 to 64 Years | 127 (55.7%) | $0 |
| 65+ Years | 87 (38.2%) | $52,841 |
| Total | 228 (100.0%) | $47,000 |
Poverty in Young
Income Below Poverty by Sex and Age in Young
With 25.7% poverty level for males and 10.7% for females among the residents of Young, 18 to 24 year old males and 45 to 54 year old females are the most vulnerable to poverty, with 4 males (100.0%) and 9 females (39.1%) in their respective age groups living below the poverty level.
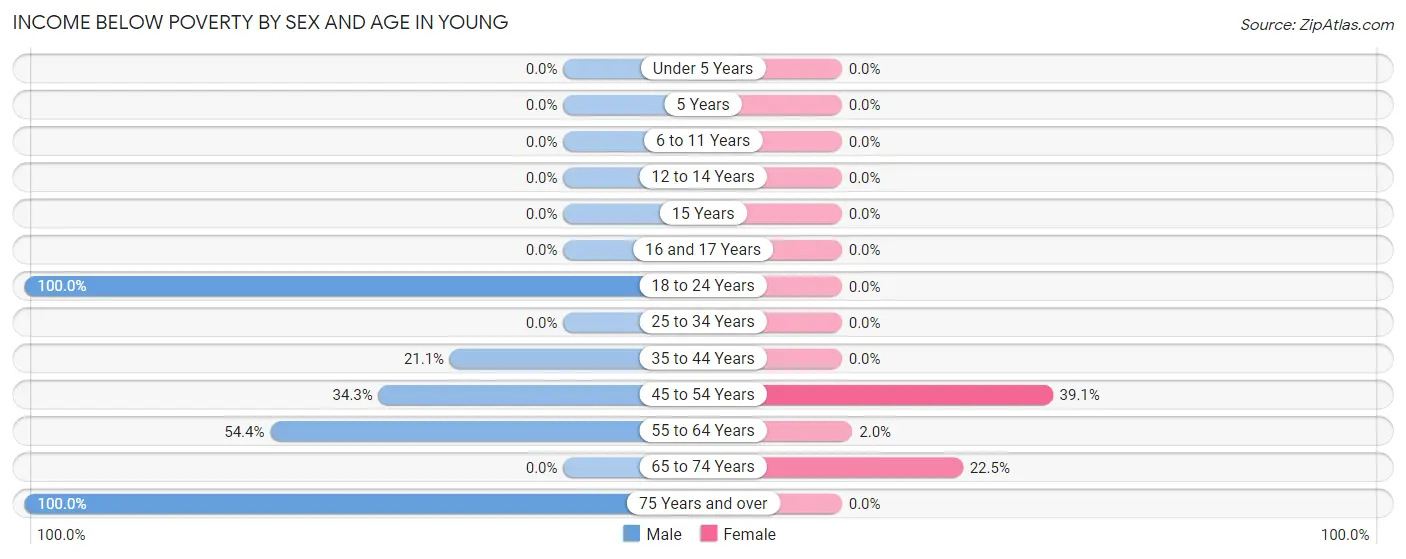
| Age Bracket | Male | Female |
| Under 5 Years | 0 (0.0%) | 0 (0.0%) |
| 5 Years | 0 (0.0%) | 0 (0.0%) |
| 6 to 11 Years | 0 (0.0%) | 0 (0.0%) |
| 12 to 14 Years | 0 (0.0%) | 0 (0.0%) |
| 15 Years | 0 (0.0%) | 0 (0.0%) |
| 16 and 17 Years | 0 (0.0%) | 0 (0.0%) |
| 18 to 24 Years | 4 (100.0%) | 0 (0.0%) |
| 25 to 34 Years | 0 (0.0%) | 0 (0.0%) |
| 35 to 44 Years | 4 (21.0%) | 0 (0.0%) |
| 45 to 54 Years | 12 (34.3%) | 9 (39.1%) |
| 55 to 64 Years | 31 (54.4%) | 1 (2.0%) |
| 65 to 74 Years | 0 (0.0%) | 11 (22.5%) |
| 75 Years and over | 3 (100.0%) | 0 (0.0%) |
| Total | 54 (25.7%) | 21 (10.7%) |
Income Above Poverty by Sex and Age in Young
According to the poverty statistics in Young, males aged 12 to 14 years and females aged 6 to 11 years are the age groups that are most secure financially, with 100.0% of males and 100.0% of females in these age groups living above the poverty line.
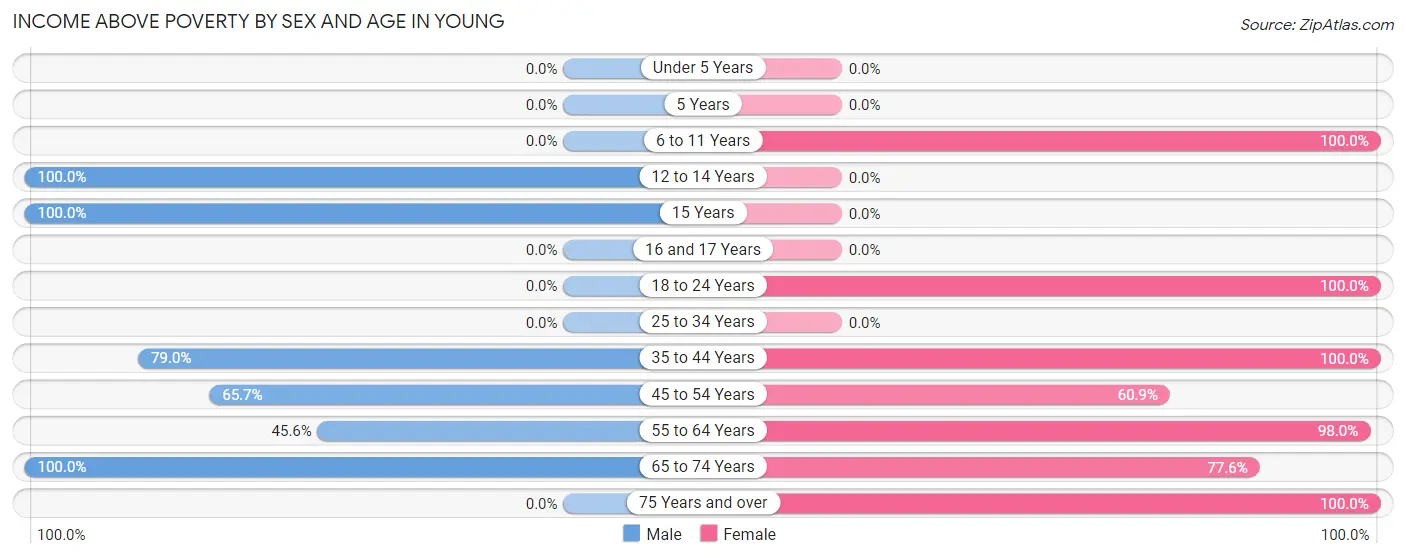
| Age Bracket | Male | Female |
| Under 5 Years | 0 (0.0%) | 0 (0.0%) |
| 5 Years | 0 (0.0%) | 0 (0.0%) |
| 6 to 11 Years | 0 (0.0%) | 15 (100.0%) |
| 12 to 14 Years | 27 (100.0%) | 0 (0.0%) |
| 15 Years | 11 (100.0%) | 0 (0.0%) |
| 16 and 17 Years | 0 (0.0%) | 0 (0.0%) |
| 18 to 24 Years | 0 (0.0%) | 17 (100.0%) |
| 25 to 34 Years | 0 (0.0%) | 0 (0.0%) |
| 35 to 44 Years | 15 (78.9%) | 23 (100.0%) |
| 45 to 54 Years | 23 (65.7%) | 14 (60.9%) |
| 55 to 64 Years | 26 (45.6%) | 50 (98.0%) |
| 65 to 74 Years | 54 (100.0%) | 38 (77.5%) |
| 75 Years and over | 0 (0.0%) | 19 (100.0%) |
| Total | 156 (74.3%) | 176 (89.3%) |
Income Below Poverty Among Married-Couple Families in Young
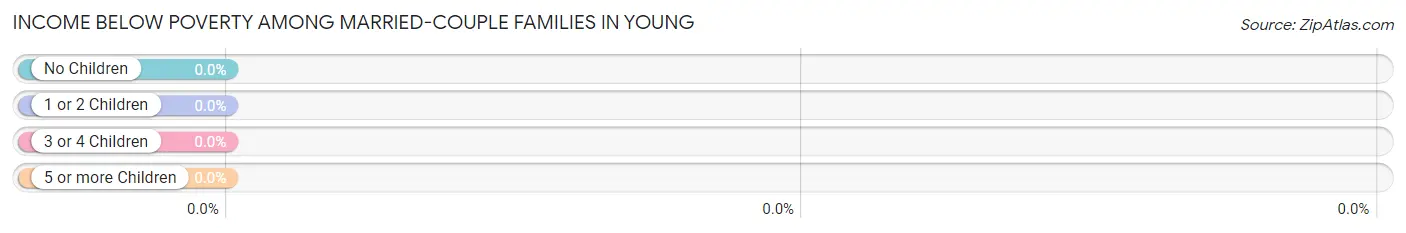
| Children | Above Poverty | Below Poverty |
| No Children | 70 (100.0%) | 0 (0.0%) |
| 1 or 2 Children | 25 (100.0%) | 0 (0.0%) |
| 3 or 4 Children | 0 (0.0%) | 0 (0.0%) |
| 5 or more Children | 0 (0.0%) | 0 (0.0%) |
| Total | 95 (100.0%) | 0 (0.0%) |
Income Below Poverty Among Single-Parent Households in Young
| Children | Single Father | Single Mother |
| No Children | 0 (0.0%) | 0 (0.0%) |
| 1 or 2 Children | 0 (0.0%) | 0 (0.0%) |
| 3 or 4 Children | 0 (0.0%) | 0 (0.0%) |
| 5 or more Children | 0 (0.0%) | 0 (0.0%) |
| Total | 0 (0.0%) | 0 (0.0%) |
Income Below Poverty Among Married-Couple vs Single-Parent Households in Young
| Children | Married-Couple Families | Single-Parent Households |
| No Children | 0 (0.0%) | 0 (0.0%) |
| 1 or 2 Children | 0 (0.0%) | 0 (0.0%) |
| 3 or 4 Children | 0 (0.0%) | 0 (0.0%) |
| 5 or more Children | 0 (0.0%) | 0 (0.0%) |
| Total | 0 (0.0%) | 0 (0.0%) |
Race in Young
The most populous races in Young are White / Caucasian (398 | 97.8%), Hispanic or Latino (4 | 1.0%), and Native / Alaskan (4 | 1.0%).
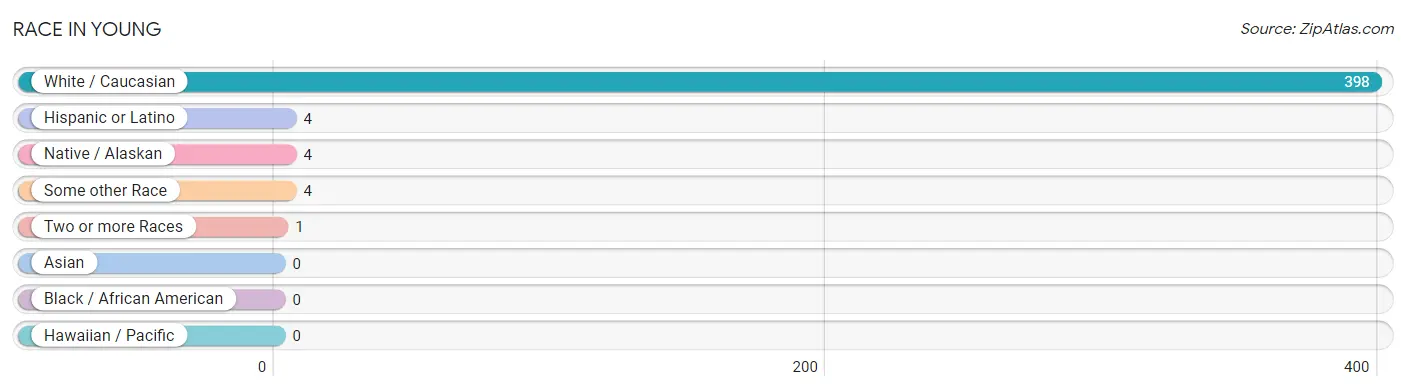
| Race | # Population | % Population |
| Asian | 0 | 0.0% |
| Black / African American | 0 | 0.0% |
| Hawaiian / Pacific | 0 | 0.0% |
| Hispanic or Latino | 4 | 1.0% |
| Native / Alaskan | 4 | 1.0% |
| White / Caucasian | 398 | 97.8% |
| Two or more Races | 1 | 0.3% |
| Some other Race | 4 | 1.0% |
| Total | 407 | 100.0% |
Ancestry in Young
The most populous ancestries reported in Young are English (102 | 25.1%), German (91 | 22.4%), Danish (34 | 8.4%), Scotch-Irish (20 | 4.9%), and Welsh (20 | 4.9%), together accounting for 65.6% of all Young residents.
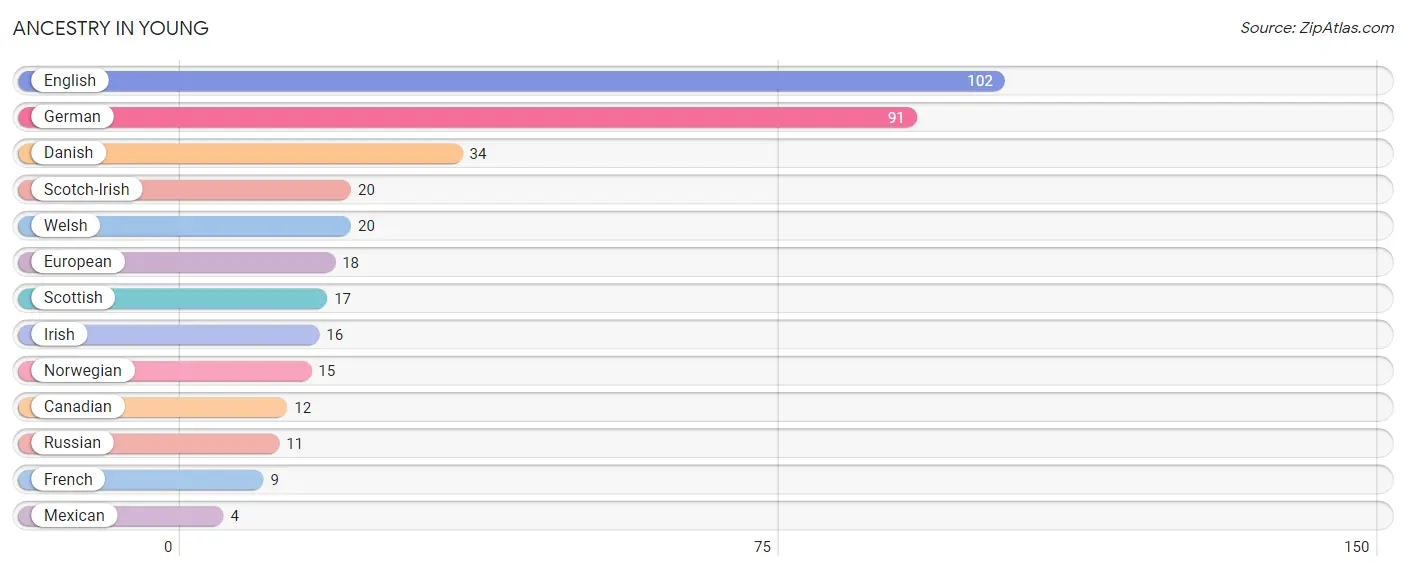
| Ancestry | # Population | % Population |
| Canadian | 12 | 2.9% |
| Danish | 34 | 8.4% |
| English | 102 | 25.1% |
| European | 18 | 4.4% |
| French | 9 | 2.2% |
| German | 91 | 22.4% |
| Irish | 16 | 3.9% |
| Mexican | 4 | 1.0% |
| Norwegian | 15 | 3.7% |
| Russian | 11 | 2.7% |
| Scotch-Irish | 20 | 4.9% |
| Scottish | 17 | 4.2% |
| Welsh | 20 | 4.9% | View All 13 Rows |
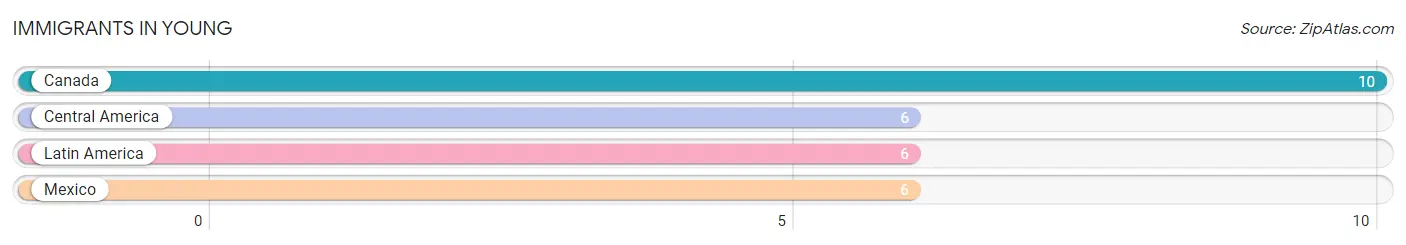
Immigrants in Young
The most numerous immigrant groups reported in Young came from Canada (10 | 2.5%), Central America (6 | 1.5%), Latin America (6 | 1.5%), and Mexico (6 | 1.5%), together accounting for 6.9% of all Young residents.
| Immigration Origin | # Population | % Population |
| Canada | 10 | 2.5% |
| Central America | 6 | 1.5% |
| Latin America | 6 | 1.5% |
| Mexico | 6 | 1.5% | View All 4 Rows |
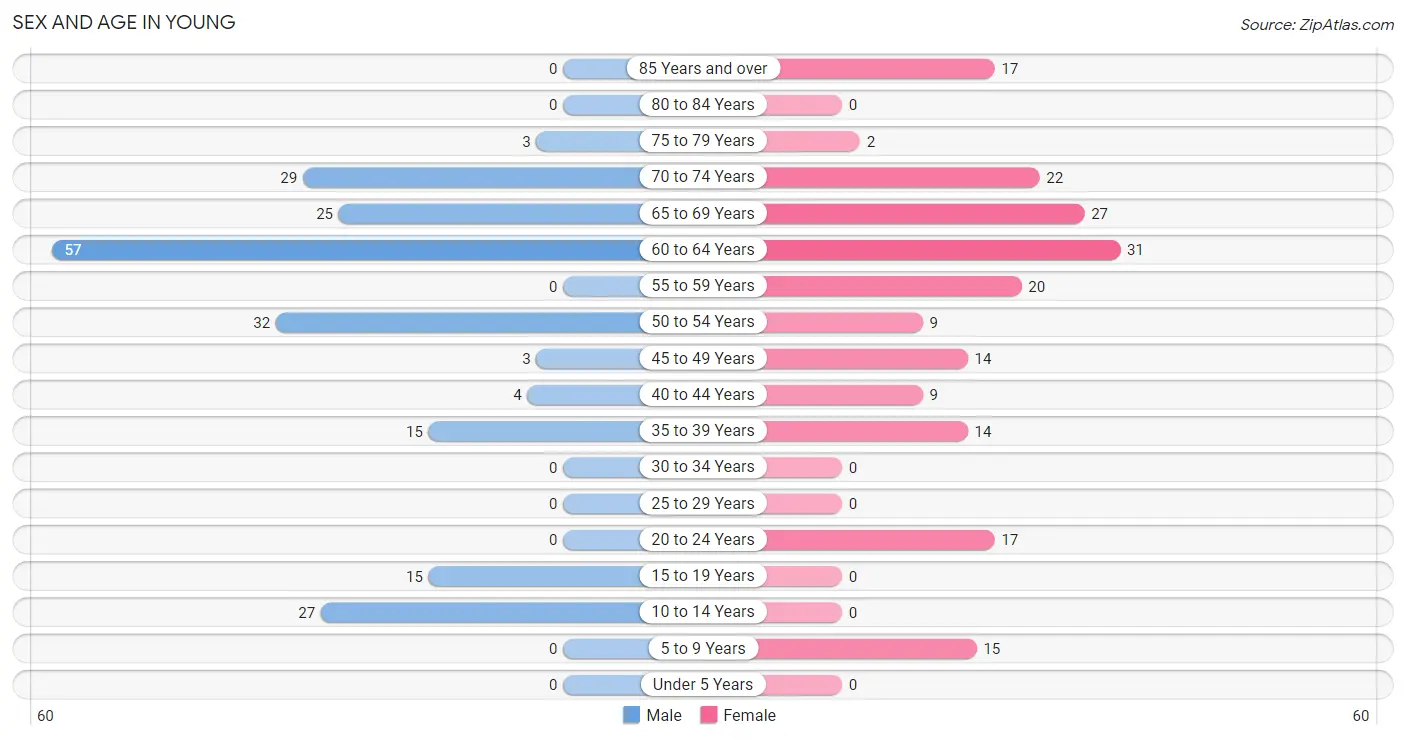
Sex and Age in Young
Sex and Age in Young
The most populous age groups in Young are 60 to 64 Years (57 | 27.1%) for men and 60 to 64 Years (31 | 15.7%) for women.
| Age Bracket | Male | Female |
| Under 5 Years | 0 (0.0%) | 0 (0.0%) |
| 5 to 9 Years | 0 (0.0%) | 15 (7.6%) |
| 10 to 14 Years | 27 (12.9%) | 0 (0.0%) |
| 15 to 19 Years | 15 (7.1%) | 0 (0.0%) |
| 20 to 24 Years | 0 (0.0%) | 17 (8.6%) |
| 25 to 29 Years | 0 (0.0%) | 0 (0.0%) |
| 30 to 34 Years | 0 (0.0%) | 0 (0.0%) |
| 35 to 39 Years | 15 (7.1%) | 14 (7.1%) |
| 40 to 44 Years | 4 (1.9%) | 9 (4.6%) |
| 45 to 49 Years | 3 (1.4%) | 14 (7.1%) |
| 50 to 54 Years | 32 (15.2%) | 9 (4.6%) |
| 55 to 59 Years | 0 (0.0%) | 20 (10.2%) |
| 60 to 64 Years | 57 (27.1%) | 31 (15.7%) |
| 65 to 69 Years | 25 (11.9%) | 27 (13.7%) |
| 70 to 74 Years | 29 (13.8%) | 22 (11.2%) |
| 75 to 79 Years | 3 (1.4%) | 2 (1.0%) |
| 80 to 84 Years | 0 (0.0%) | 0 (0.0%) |
| 85 Years and over | 0 (0.0%) | 17 (8.6%) |
| Total | 210 (100.0%) | 197 (100.0%) |
Families and Households in Young
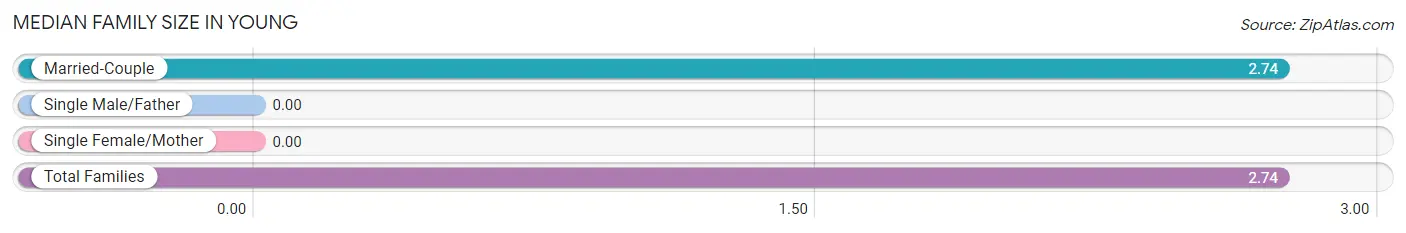
Median Family Size in Young
| Family Type | # Families | Family Size |
| Married-Couple | 95 (100.0%) | 2.74 |
| Single Male/Father | 0 (0.0%) | - |
| Single Female/Mother | 0 (0.0%) | - |
| Total Families | 95 (100.0%) | 2.74 |
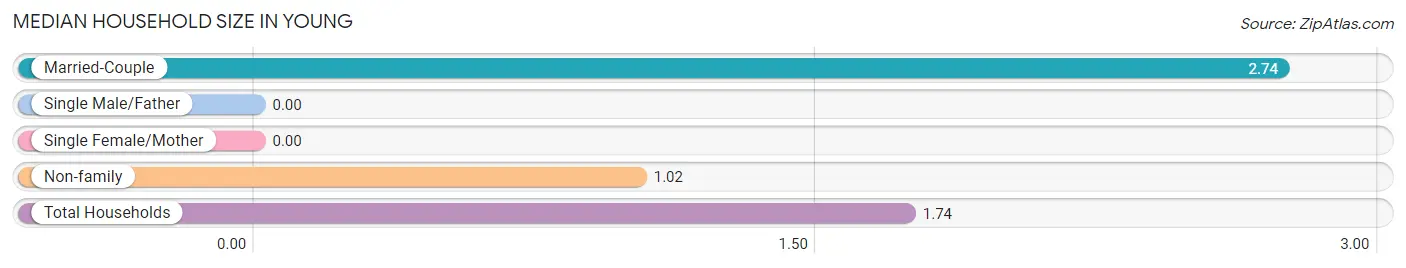
Median Household Size in Young
| Household Type | # Households | Household Size |
| Married-Couple | 95 (41.7%) | 2.74 |
| Single Male/Father | 0 (0.0%) | - |
| Single Female/Mother | 0 (0.0%) | - |
| Non-family | 133 (58.3%) | 1.02 |
| Total Households | 228 (100.0%) | 1.74 |
Household Size by Marriage Status in Young
Out of a total of 228 households in Young, 95 (41.7%) are family households, while 133 (58.3%) are nonfamily households. The most numerous type of family households are 2-person households, comprising 50, and the most common type of nonfamily households are 1-person households, comprising 129.
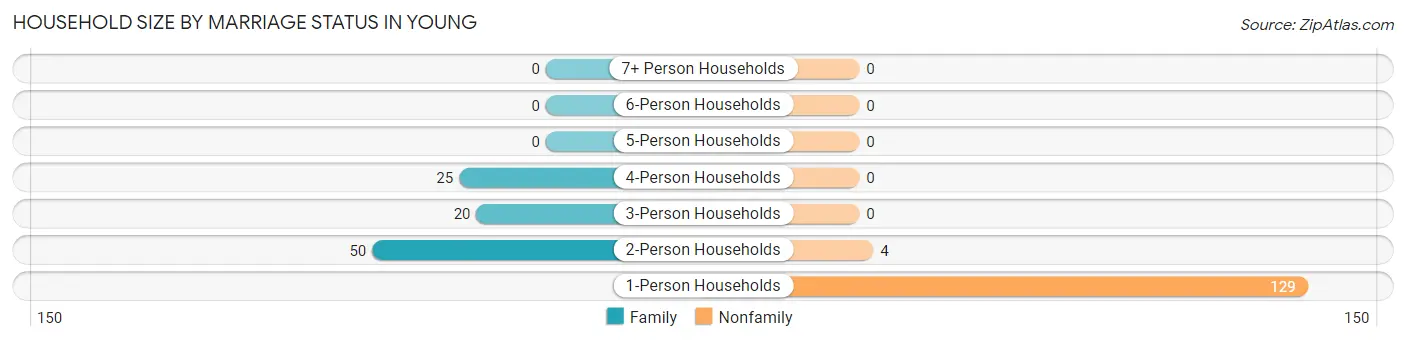
| Household Size | Family Households | Nonfamily Households |
| 1-Person Households | - | 129 (56.6%) |
| 2-Person Households | 50 (21.9%) | 4 (1.8%) |
| 3-Person Households | 20 (8.8%) | 0 (0.0%) |
| 4-Person Households | 25 (11.0%) | 0 (0.0%) |
| 5-Person Households | 0 (0.0%) | 0 (0.0%) |
| 6-Person Households | 0 (0.0%) | 0 (0.0%) |
| 7+ Person Households | 0 (0.0%) | 0 (0.0%) |
| Total | 95 (41.7%) | 133 (58.3%) |
Female Fertility in Young
Fertility by Age in Young
| Age Bracket | Women with Births | Births / 1,000 Women |
| 15 to 19 years | 0 (0.0%) | 0.0 |
| 20 to 34 years | 0 (0.0%) | 0.0 |
| 35 to 50 years | 0 (0.0%) | 0.0 |
| Total | 0 (0.0%) | 0.0 |
Fertility by Age by Marriage Status in Young
| Age Bracket | Married | Unmarried |
| 15 to 19 years | 0 (0.0%) | 0 (0.0%) |
| 20 to 34 years | 0 (0.0%) | 0 (0.0%) |
| 35 to 50 years | 0 (0.0%) | 0 (0.0%) |
| Total | 0 (0.0%) | 0 (0.0%) |
Fertility by Education in Young
| Educational Attainment | Women with Births | Births / 1,000 Women |
| Less than High School | 0 (0.0%) | 0.0 |
| High School Diploma | 0 (0.0%) | 0.0 |
| College or Associate's Degree | 0 (0.0%) | 0.0 |
| Bachelor's Degree | 0 (0.0%) | 0.0 |
| Graduate Degree | 0 (0.0%) | 0.0 |
| Total | 0 (0.0%) | 0.0 |
Fertility by Education by Marriage Status in Young
| Educational Attainment | Married | Unmarried |
| Less than High School | 0 (0.0%) | 0 (0.0%) |
| High School Diploma | 0 (0.0%) | 0 (0.0%) |
| College or Associate's Degree | 0 (0.0%) | 0 (0.0%) |
| Bachelor's Degree | 0 (0.0%) | 0 (0.0%) |
| Graduate Degree | 0 (0.0%) | 0 (0.0%) |
| Total | 0 (0.0%) | 0 (0.0%) |
Employment Characteristics in Young
Employment by Class of Employer in Young
Among the 118 employed individuals in Young, private company employees (56 | 47.5%), self-employed (not incorporated) (28 | 23.7%), and self-employed (incorporated) (20 | 17.0%) make up the most common classes of employment.
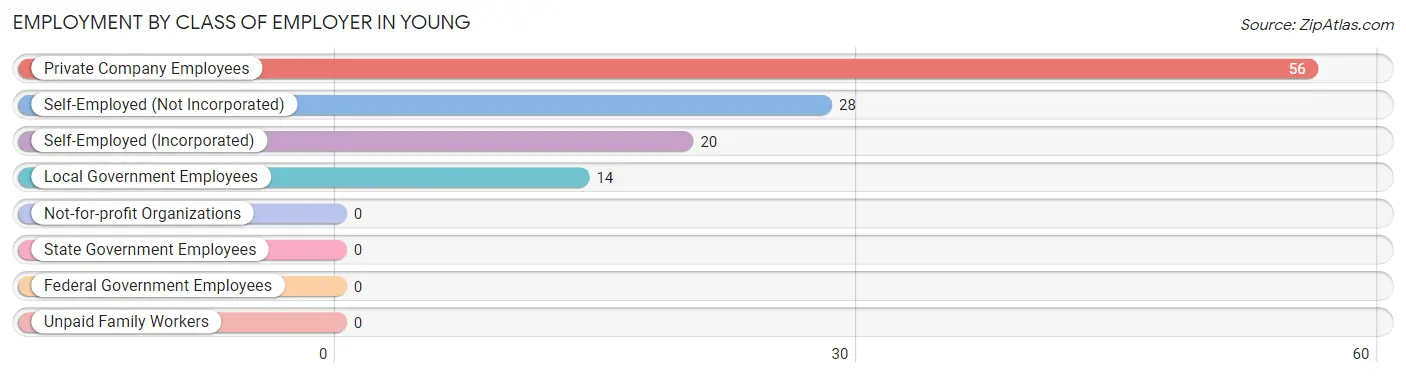
| Employer Class | # Employees | % Employees |
| Private Company Employees | 56 | 47.5% |
| Self-Employed (Incorporated) | 20 | 17.0% |
| Self-Employed (Not Incorporated) | 28 | 23.7% |
| Not-for-profit Organizations | 0 | 0.0% |
| Local Government Employees | 14 | 11.9% |
| State Government Employees | 0 | 0.0% |
| Federal Government Employees | 0 | 0.0% |
| Unpaid Family Workers | 0 | 0.0% |
| Total | 118 | 100.0% |
Employment Status by Age in Young
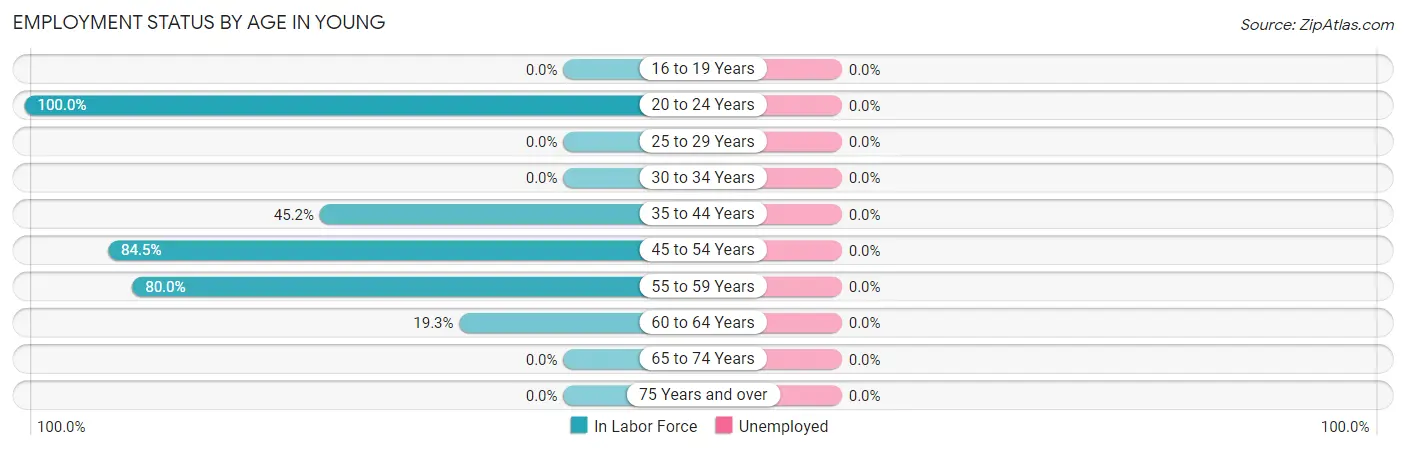
| Age Bracket | In Labor Force | Unemployed |
| 16 to 19 Years | 0 (0.0%) | 0 (0.0%) |
| 20 to 24 Years | 17 (100.0%) | 0 (0.0%) |
| 25 to 29 Years | 0 (0.0%) | 0 (0.0%) |
| 30 to 34 Years | 0 (0.0%) | 0 (0.0%) |
| 35 to 44 Years | 19 (45.2%) | 0 (0.0%) |
| 45 to 54 Years | 49 (84.5%) | 0 (0.0%) |
| 55 to 59 Years | 16 (80.0%) | 0 (0.0%) |
| 60 to 64 Years | 17 (19.3%) | 0 (0.0%) |
| 65 to 74 Years | 0 (0.0%) | 0 (0.0%) |
| 75 Years and over | 0 (0.0%) | 0 (0.0%) |
| Total | 118 (33.3%) | 0 (0.0%) |
Employment Status by Educational Attainment in Young
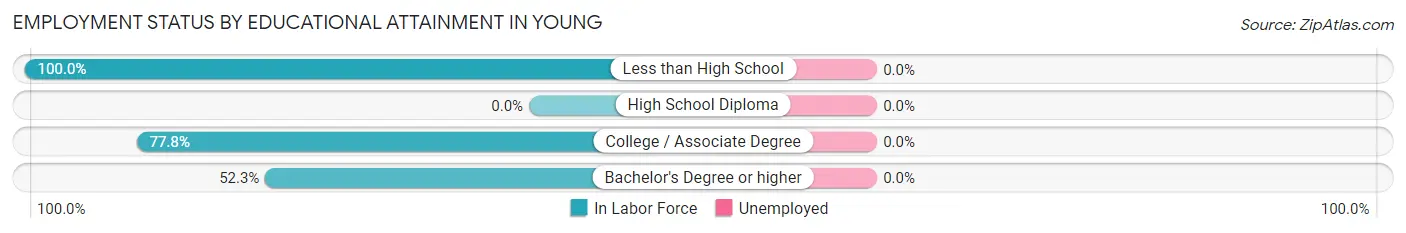
| Educational Attainment | In Labor Force | Unemployed |
| Less than High School | 4 (100.0%) | 0 (0.0%) |
| High School Diploma | 0 (0.0%) | 0 (0.0%) |
| College / Associate Degree | 63 (77.8%) | 0 (0.0%) |
| Bachelor's Degree or higher | 34 (52.3%) | 0 (0.0%) |
| Total | 101 (48.6%) | 0 (0.0%) |
Employment Occupations by Sex in Young
Management, Business, Science and Arts Occupations
The most common Management, Business, Science and Arts occupations in Young are Management (32 | 27.1%), Community & Social Service (14 | 11.9%), and Education Instruction & Library (14 | 11.9%).
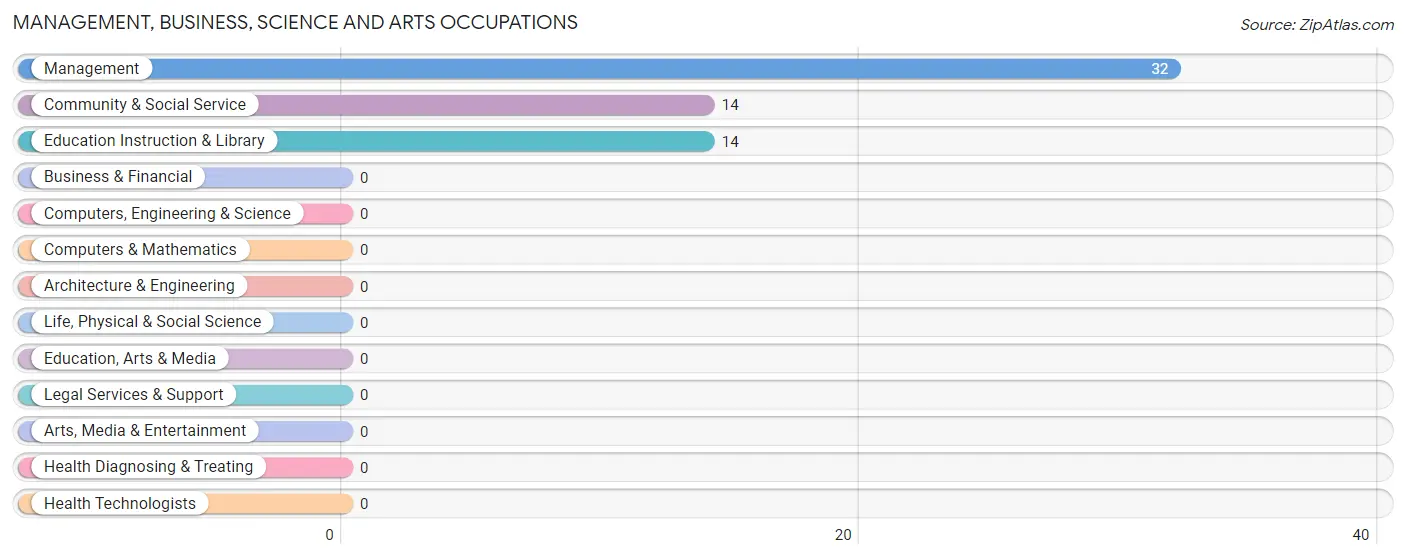
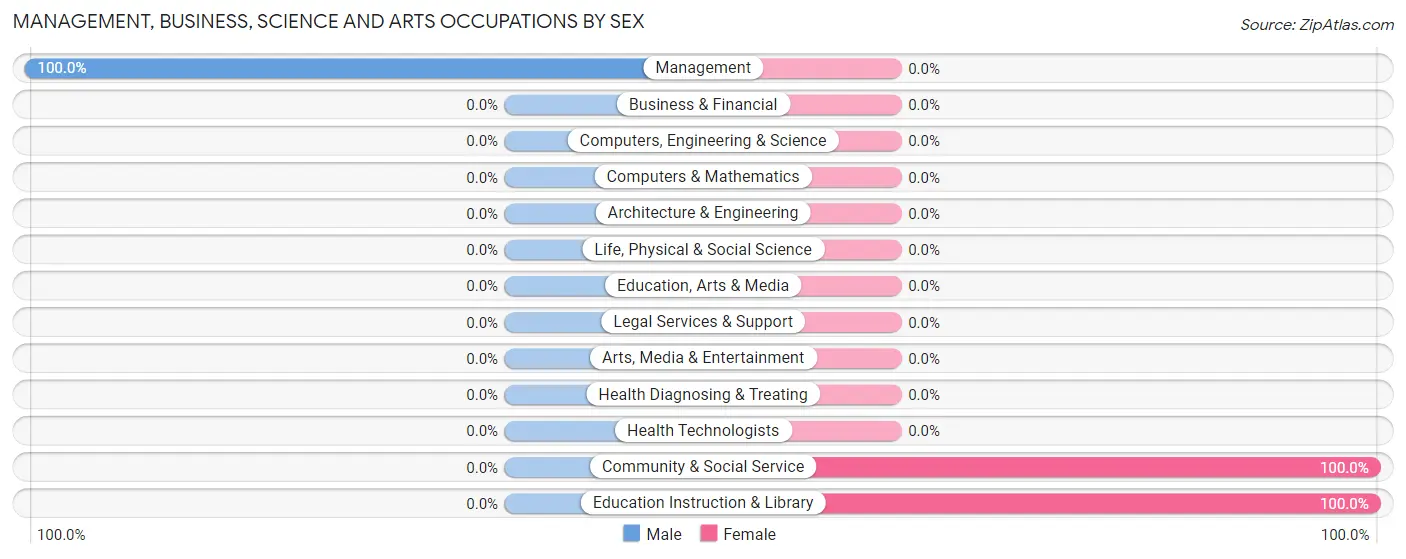
Management, Business, Science and Arts Occupations by Sex
| Occupation | Male | Female |
| Management | 32 (100.0%) | 0 (0.0%) |
| Business & Financial | 0 (0.0%) | 0 (0.0%) |
| Computers, Engineering & Science | 0 (0.0%) | 0 (0.0%) |
| Computers & Mathematics | 0 (0.0%) | 0 (0.0%) |
| Architecture & Engineering | 0 (0.0%) | 0 (0.0%) |
| Life, Physical & Social Science | 0 (0.0%) | 0 (0.0%) |
| Community & Social Service | 0 (0.0%) | 14 (100.0%) |
| Education, Arts & Media | 0 (0.0%) | 0 (0.0%) |
| Legal Services & Support | 0 (0.0%) | 0 (0.0%) |
| Education Instruction & Library | 0 (0.0%) | 14 (100.0%) |
| Arts, Media & Entertainment | 0 (0.0%) | 0 (0.0%) |
| Health Diagnosing & Treating | 0 (0.0%) | 0 (0.0%) |
| Health Technologists | 0 (0.0%) | 0 (0.0%) |
| Total (Category) | 32 (69.6%) | 14 (30.4%) |
| Total (Overall) | 71 (60.2%) | 47 (39.8%) |
Services Occupations
The most common Services occupations in Young are , and Cleaning & Maintenance (1 | 0.9%).
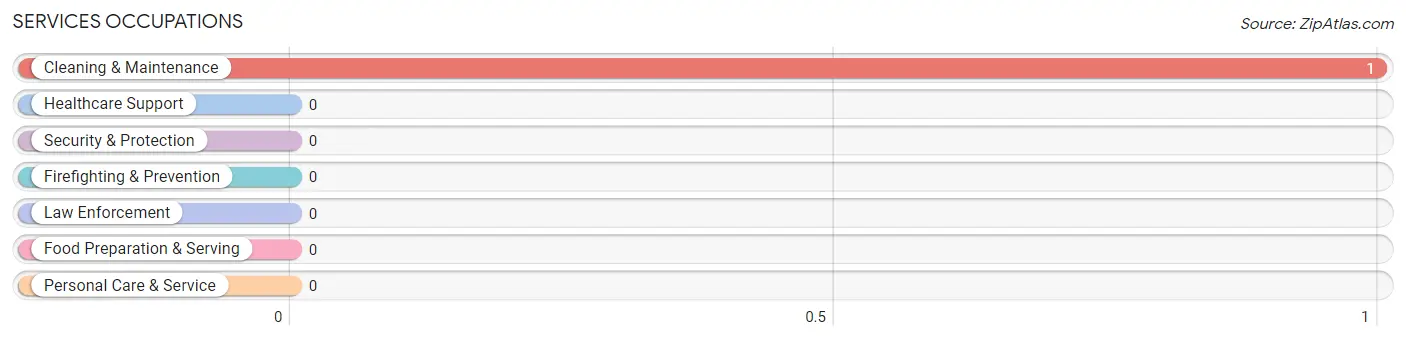
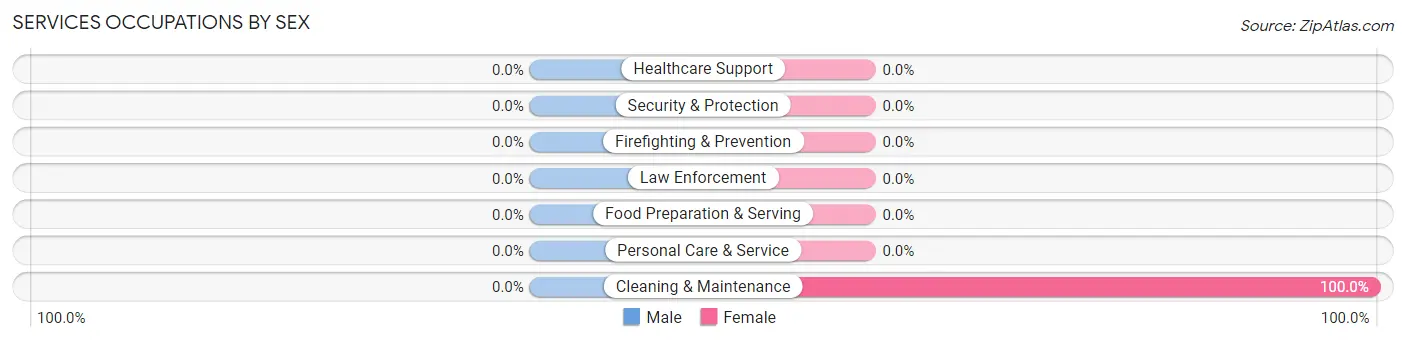
Services Occupations by Sex
| Occupation | Male | Female |
| Healthcare Support | 0 (0.0%) | 0 (0.0%) |
| Security & Protection | 0 (0.0%) | 0 (0.0%) |
| Firefighting & Prevention | 0 (0.0%) | 0 (0.0%) |
| Law Enforcement | 0 (0.0%) | 0 (0.0%) |
| Food Preparation & Serving | 0 (0.0%) | 0 (0.0%) |
| Cleaning & Maintenance | 0 (0.0%) | 1 (100.0%) |
| Personal Care & Service | 0 (0.0%) | 0 (0.0%) |
| Total (Category) | 0 (0.0%) | 1 (100.0%) |
| Total (Overall) | 71 (60.2%) | 47 (39.8%) |
Sales and Office Occupations
The most common Sales and Office occupations in Young are Sales & Related (17 | 14.4%), and Office & Administration (15 | 12.7%).
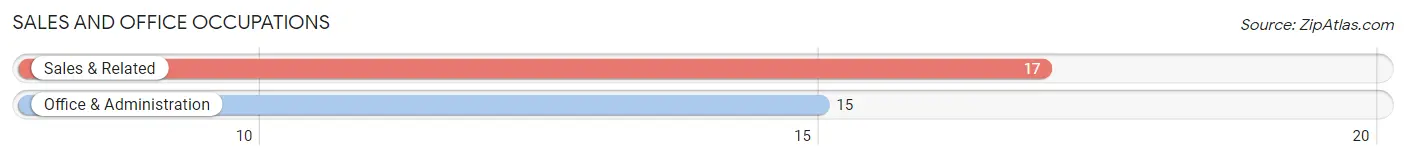
Sales and Office Occupations by Sex
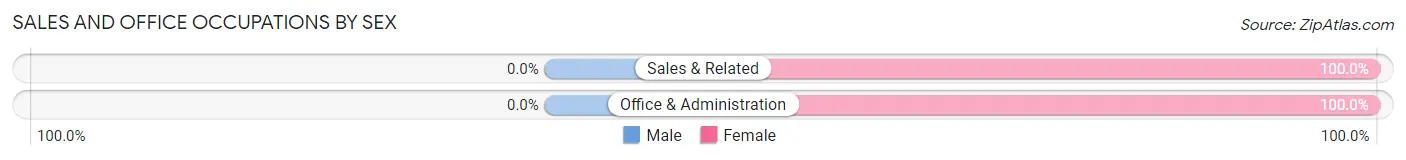
| Occupation | Male | Female |
| Sales & Related | 0 (0.0%) | 17 (100.0%) |
| Office & Administration | 0 (0.0%) | 15 (100.0%) |
| Total (Category) | 0 (0.0%) | 32 (100.0%) |
| Total (Overall) | 71 (60.2%) | 47 (39.8%) |
Natural Resources, Construction and Maintenance Occupations
The most common Natural Resources, Construction and Maintenance occupations in Young are Installation, Maintenance & Repair (20 | 17.0%), and Construction & Extraction (19 | 16.1%).
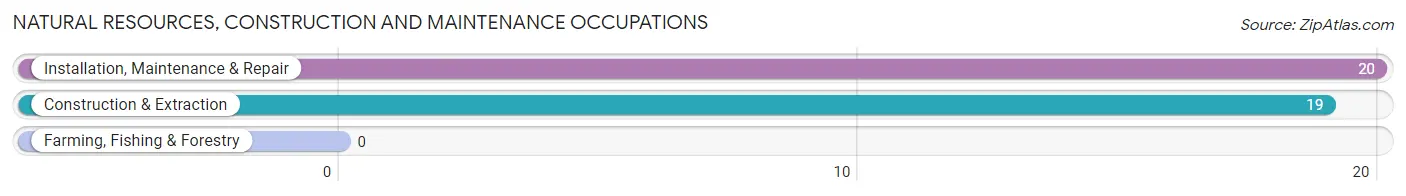
Natural Resources, Construction and Maintenance Occupations by Sex
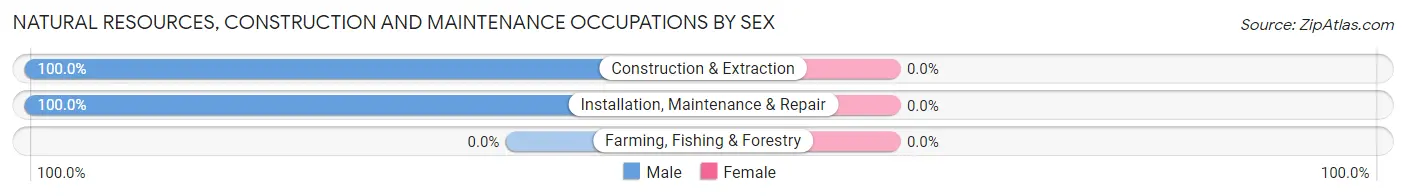
| Occupation | Male | Female |
| Farming, Fishing & Forestry | 0 (0.0%) | 0 (0.0%) |
| Construction & Extraction | 19 (100.0%) | 0 (0.0%) |
| Installation, Maintenance & Repair | 20 (100.0%) | 0 (0.0%) |
| Total (Category) | 39 (100.0%) | 0 (0.0%) |
| Total (Overall) | 71 (60.2%) | 47 (39.8%) |
Production, Transportation and Moving Occupations
Production, Transportation and Moving Occupations by Sex
| Occupation | Male | Female |
| Production | 0 (0.0%) | 0 (0.0%) |
| Transportation | 0 (0.0%) | 0 (0.0%) |
| Material Moving | 0 (0.0%) | 0 (0.0%) |
| Total (Category) | 0 (0.0%) | 0 (0.0%) |
| Total (Overall) | 71 (60.2%) | 47 (39.8%) |
Employment Industries by Sex in Young
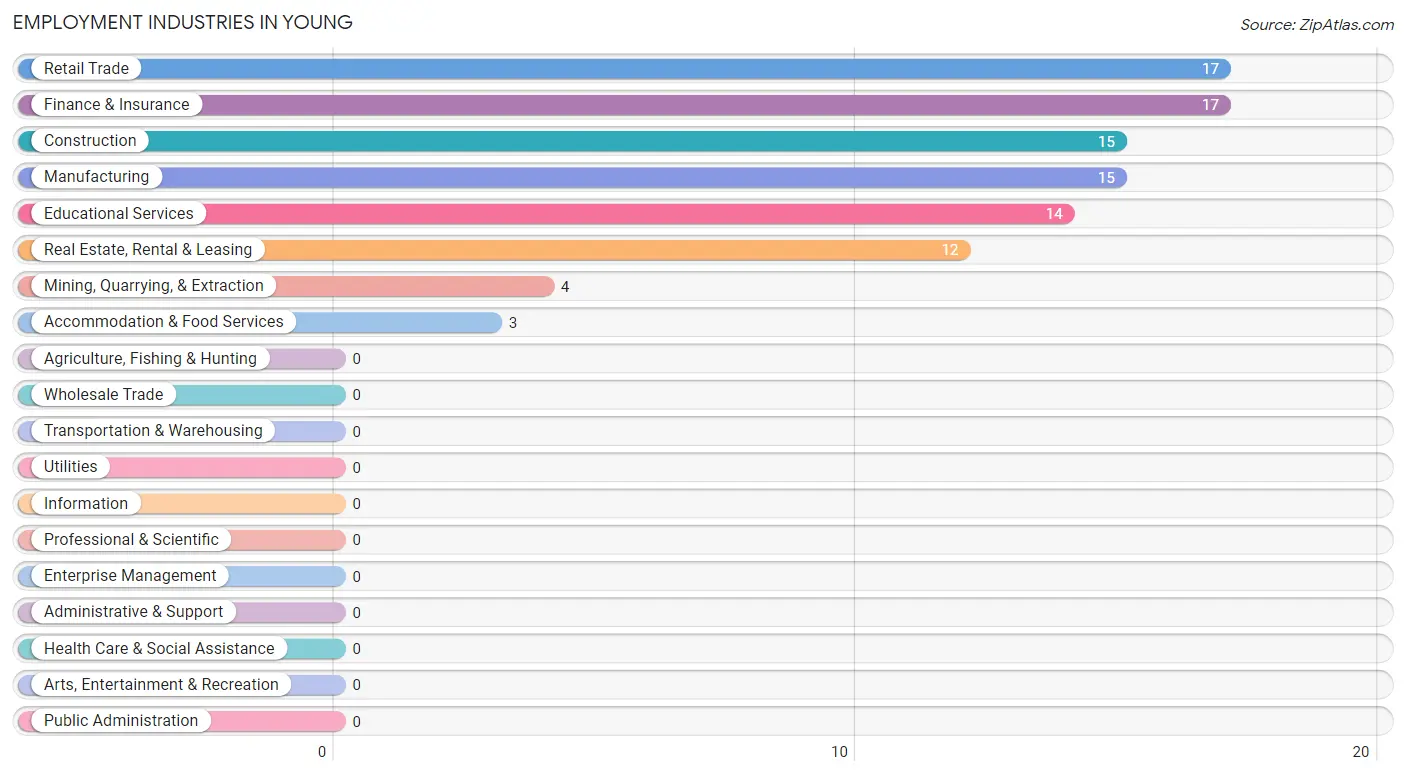
Employment Industries in Young
The major employment industries in Young include Retail Trade (17 | 14.4%), Finance & Insurance (17 | 14.4%), Construction (15 | 12.7%), Manufacturing (15 | 12.7%), and Educational Services (14 | 11.9%).
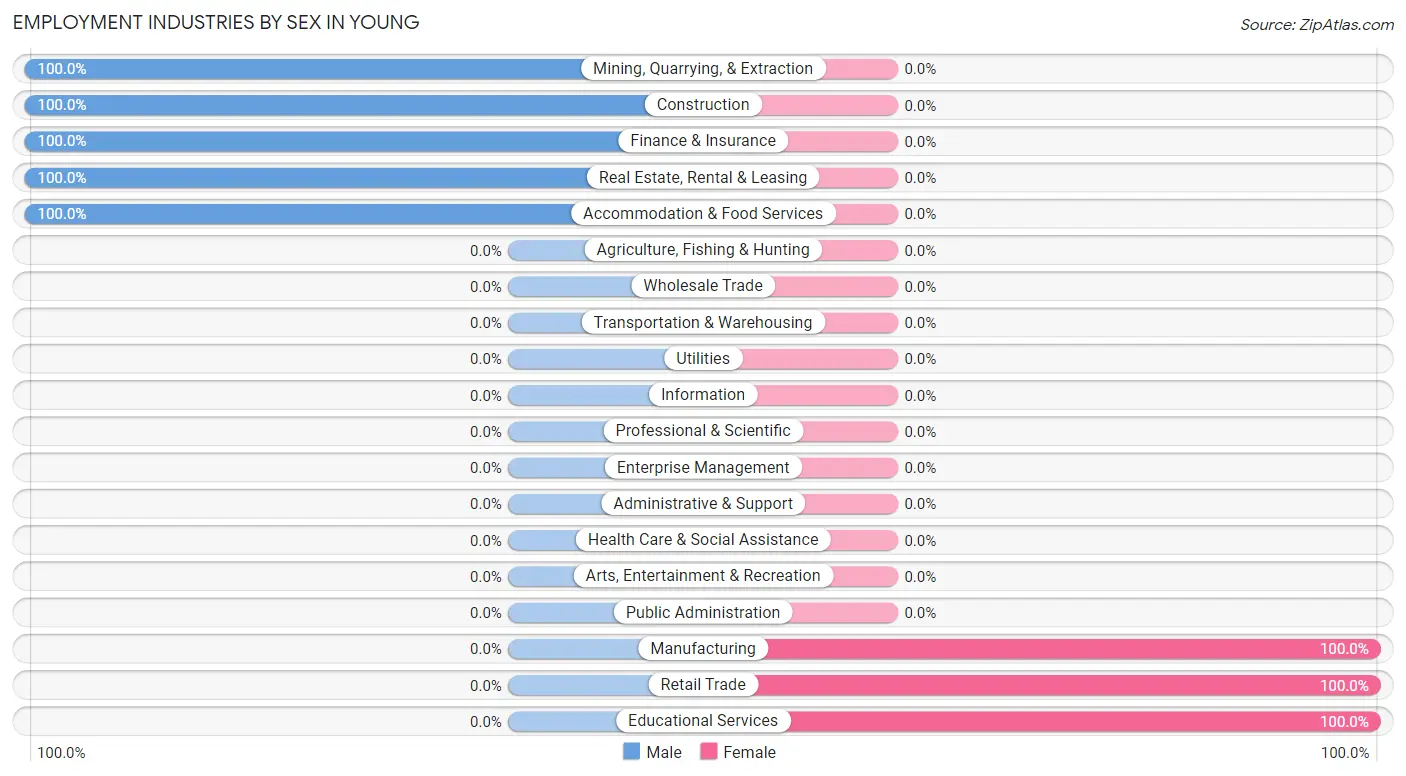
Employment Industries by Sex in Young
The Young industries that see more men than women are Mining, Quarrying, & Extraction (100.0%), Construction (100.0%), and Finance & Insurance (100.0%), whereas the industries that tend to have a higher number of women are Manufacturing (100.0%), Retail Trade (100.0%), and Educational Services (100.0%).
| Industry | Male | Female |
| Agriculture, Fishing & Hunting | 0 (0.0%) | 0 (0.0%) |
| Mining, Quarrying, & Extraction | 4 (100.0%) | 0 (0.0%) |
| Construction | 15 (100.0%) | 0 (0.0%) |
| Manufacturing | 0 (0.0%) | 15 (100.0%) |
| Wholesale Trade | 0 (0.0%) | 0 (0.0%) |
| Retail Trade | 0 (0.0%) | 17 (100.0%) |
| Transportation & Warehousing | 0 (0.0%) | 0 (0.0%) |
| Utilities | 0 (0.0%) | 0 (0.0%) |
| Information | 0 (0.0%) | 0 (0.0%) |
| Finance & Insurance | 17 (100.0%) | 0 (0.0%) |
| Real Estate, Rental & Leasing | 12 (100.0%) | 0 (0.0%) |
| Professional & Scientific | 0 (0.0%) | 0 (0.0%) |
| Enterprise Management | 0 (0.0%) | 0 (0.0%) |
| Administrative & Support | 0 (0.0%) | 0 (0.0%) |
| Educational Services | 0 (0.0%) | 14 (100.0%) |
| Health Care & Social Assistance | 0 (0.0%) | 0 (0.0%) |
| Arts, Entertainment & Recreation | 0 (0.0%) | 0 (0.0%) |
| Accommodation & Food Services | 3 (100.0%) | 0 (0.0%) |
| Public Administration | 0 (0.0%) | 0 (0.0%) |
| Total | 71 (60.2%) | 47 (39.8%) |
Education in Young
School Enrollment in Young
The most common levels of schooling among the 53 students in Young are middle school (27 | 50.9%), elementary school (15 | 28.3%), and high school (11 | 20.7%).
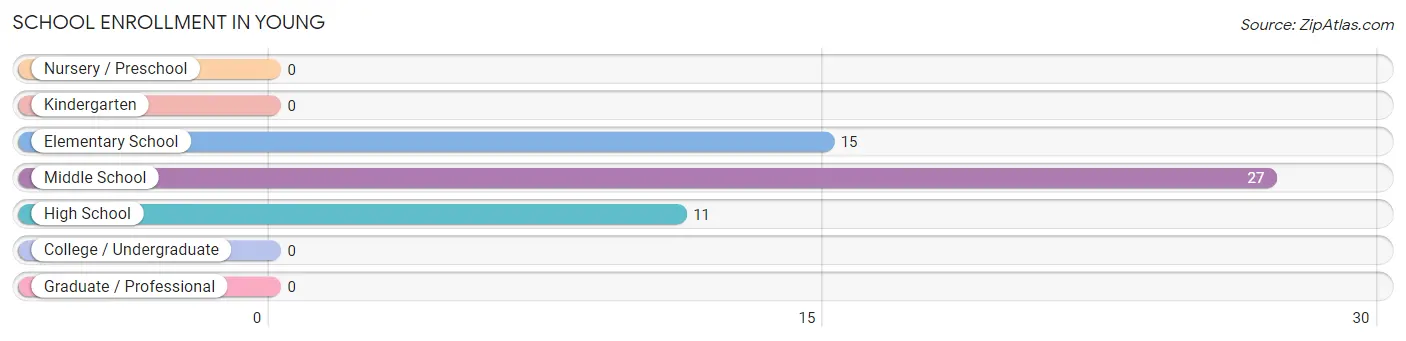
| School Level | # Students | % Students |
| Nursery / Preschool | 0 | 0.0% |
| Kindergarten | 0 | 0.0% |
| Elementary School | 15 | 28.3% |
| Middle School | 27 | 50.9% |
| High School | 11 | 20.7% |
| College / Undergraduate | 0 | 0.0% |
| Graduate / Professional | 0 | 0.0% |
| Total | 53 | 100.0% |
School Enrollment by Age by Funding Source in Young
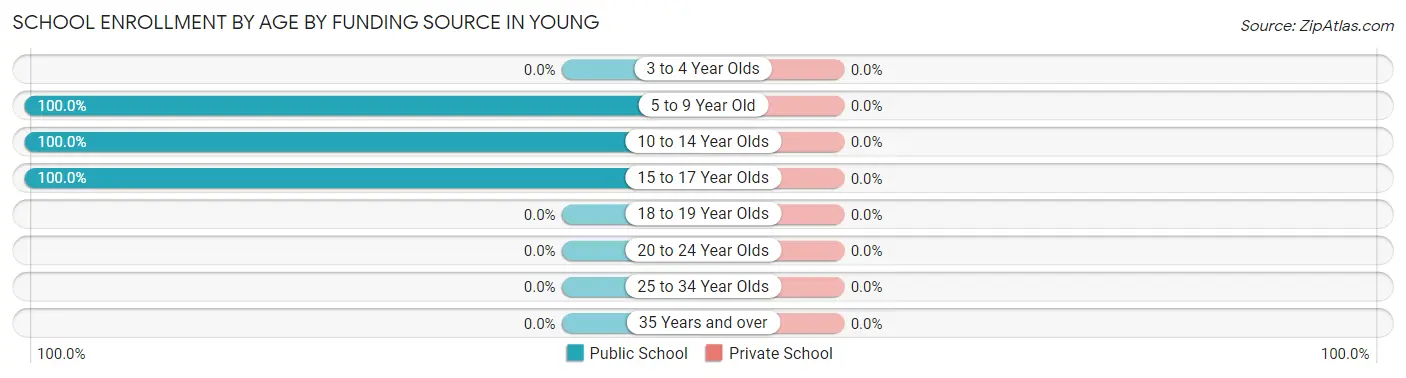
| Age Bracket | Public School | Private School |
| 3 to 4 Year Olds | 0 (0.0%) | 0 (0.0%) |
| 5 to 9 Year Old | 15 (100.0%) | 0 (0.0%) |
| 10 to 14 Year Olds | 27 (100.0%) | 0 (0.0%) |
| 15 to 17 Year Olds | 11 (100.0%) | 0 (0.0%) |
| 18 to 19 Year Olds | 0 (0.0%) | 0 (0.0%) |
| 20 to 24 Year Olds | 0 (0.0%) | 0 (0.0%) |
| 25 to 34 Year Olds | 0 (0.0%) | 0 (0.0%) |
| 35 Years and over | 0 (0.0%) | 0 (0.0%) |
| Total | 53 (100.0%) | 0 (0.0%) |
Educational Attainment by Field of Study in Young
Education (53 | 45.7%), social sciences (17 | 14.7%), arts & humanities (16 | 13.8%), visual & performing arts (11 | 9.5%), and liberal arts & history (10 | 8.6%) are the most common fields of study among 116 individuals in Young who have obtained a bachelor's degree or higher.
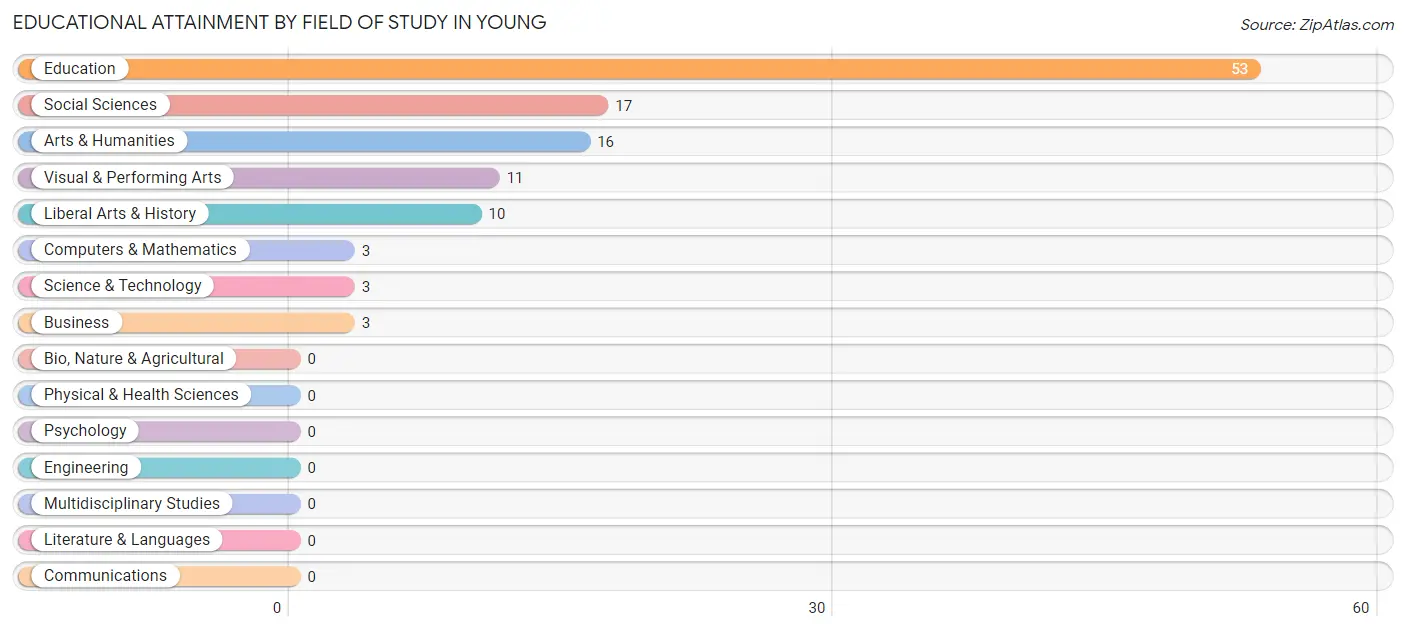
| Field of Study | # Graduates | % Graduates |
| Computers & Mathematics | 3 | 2.6% |
| Bio, Nature & Agricultural | 0 | 0.0% |
| Physical & Health Sciences | 0 | 0.0% |
| Psychology | 0 | 0.0% |
| Social Sciences | 17 | 14.7% |
| Engineering | 0 | 0.0% |
| Multidisciplinary Studies | 0 | 0.0% |
| Science & Technology | 3 | 2.6% |
| Business | 3 | 2.6% |
| Education | 53 | 45.7% |
| Literature & Languages | 0 | 0.0% |
| Liberal Arts & History | 10 | 8.6% |
| Visual & Performing Arts | 11 | 9.5% |
| Communications | 0 | 0.0% |
| Arts & Humanities | 16 | 13.8% |
| Total | 116 | 100.0% |
Transportation & Commute in Young
Vehicle Availability by Sex in Young
The most prevalent vehicle ownership categories in Young are males with 5 or more vehicles (20, accounting for 31.2%) and females with 5 or more vehicles (31, making up 42.5%).
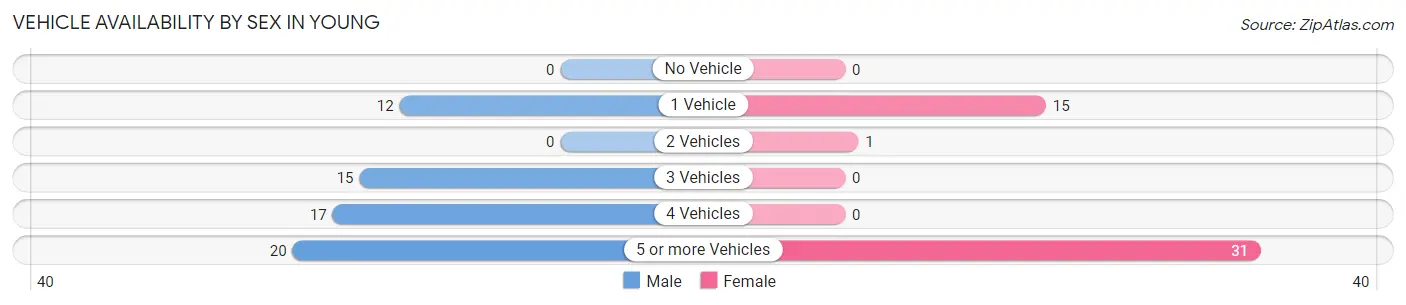
| Vehicles Available | Male | Female |
| No Vehicle | 0 (0.0%) | 0 (0.0%) |
| 1 Vehicle | 12 (18.8%) | 15 (31.9%) |
| 2 Vehicles | 0 (0.0%) | 1 (2.1%) |
| 3 Vehicles | 15 (23.4%) | 0 (0.0%) |
| 4 Vehicles | 17 (26.6%) | 0 (0.0%) |
| 5 or more Vehicles | 20 (31.2%) | 31 (66.0%) |
| Total | 64 (100.0%) | 47 (100.0%) |
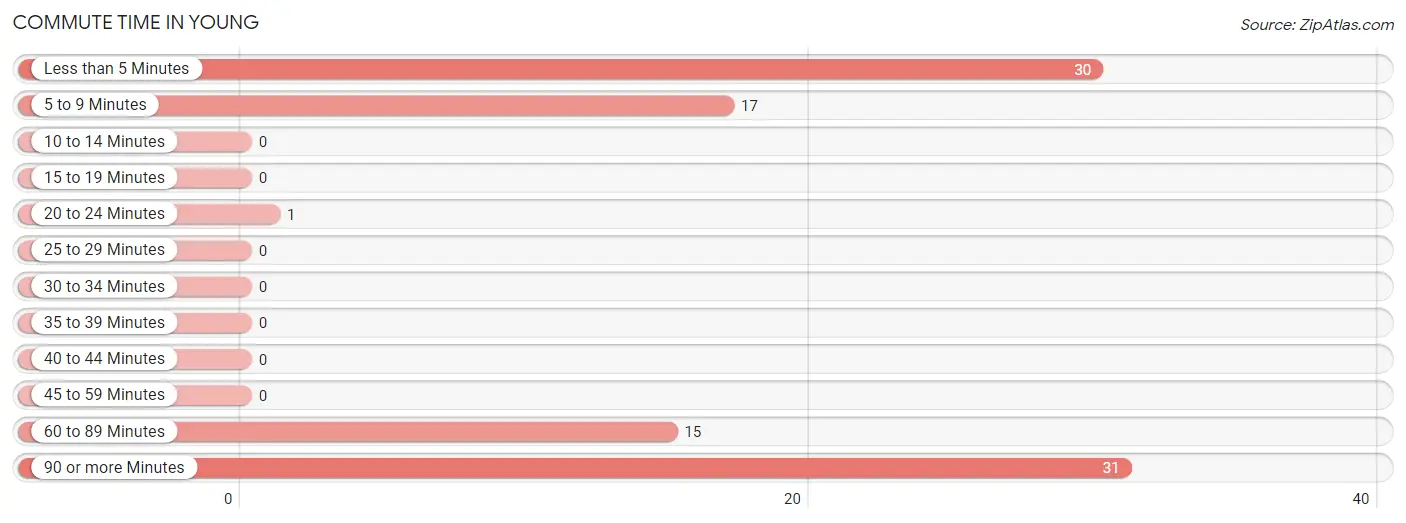
Commute Time in Young
The most frequently occuring commute durations in Young are 90 or more minutes (31 commuters, 33.0%), less than 5 minutes (30 commuters, 31.9%), and 5 to 9 minutes (17 commuters, 18.1%).
| Commute Time | # Commuters | % Commuters |
| Less than 5 Minutes | 30 | 31.9% |
| 5 to 9 Minutes | 17 | 18.1% |
| 10 to 14 Minutes | 0 | 0.0% |
| 15 to 19 Minutes | 0 | 0.0% |
| 20 to 24 Minutes | 1 | 1.1% |
| 25 to 29 Minutes | 0 | 0.0% |
| 30 to 34 Minutes | 0 | 0.0% |
| 35 to 39 Minutes | 0 | 0.0% |
| 40 to 44 Minutes | 0 | 0.0% |
| 45 to 59 Minutes | 0 | 0.0% |
| 60 to 89 Minutes | 15 | 16.0% |
| 90 or more Minutes | 31 | 33.0% |
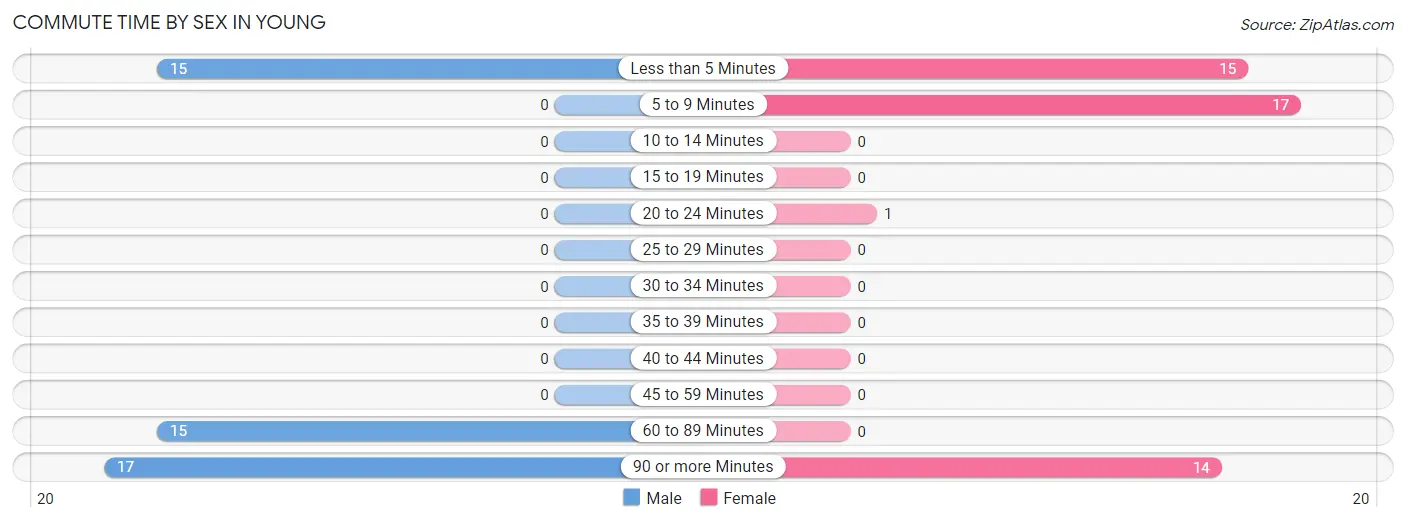
Commute Time by Sex in Young
The most common commute times in Young are 90 or more minutes (17 commuters, 36.2%) for males and 5 to 9 minutes (17 commuters, 36.2%) for females.
| Commute Time | Male | Female |
| Less than 5 Minutes | 15 (31.9%) | 15 (31.9%) |
| 5 to 9 Minutes | 0 (0.0%) | 17 (36.2%) |
| 10 to 14 Minutes | 0 (0.0%) | 0 (0.0%) |
| 15 to 19 Minutes | 0 (0.0%) | 0 (0.0%) |
| 20 to 24 Minutes | 0 (0.0%) | 1 (2.1%) |
| 25 to 29 Minutes | 0 (0.0%) | 0 (0.0%) |
| 30 to 34 Minutes | 0 (0.0%) | 0 (0.0%) |
| 35 to 39 Minutes | 0 (0.0%) | 0 (0.0%) |
| 40 to 44 Minutes | 0 (0.0%) | 0 (0.0%) |
| 45 to 59 Minutes | 0 (0.0%) | 0 (0.0%) |
| 60 to 89 Minutes | 15 (31.9%) | 0 (0.0%) |
| 90 or more Minutes | 17 (36.2%) | 14 (29.8%) |
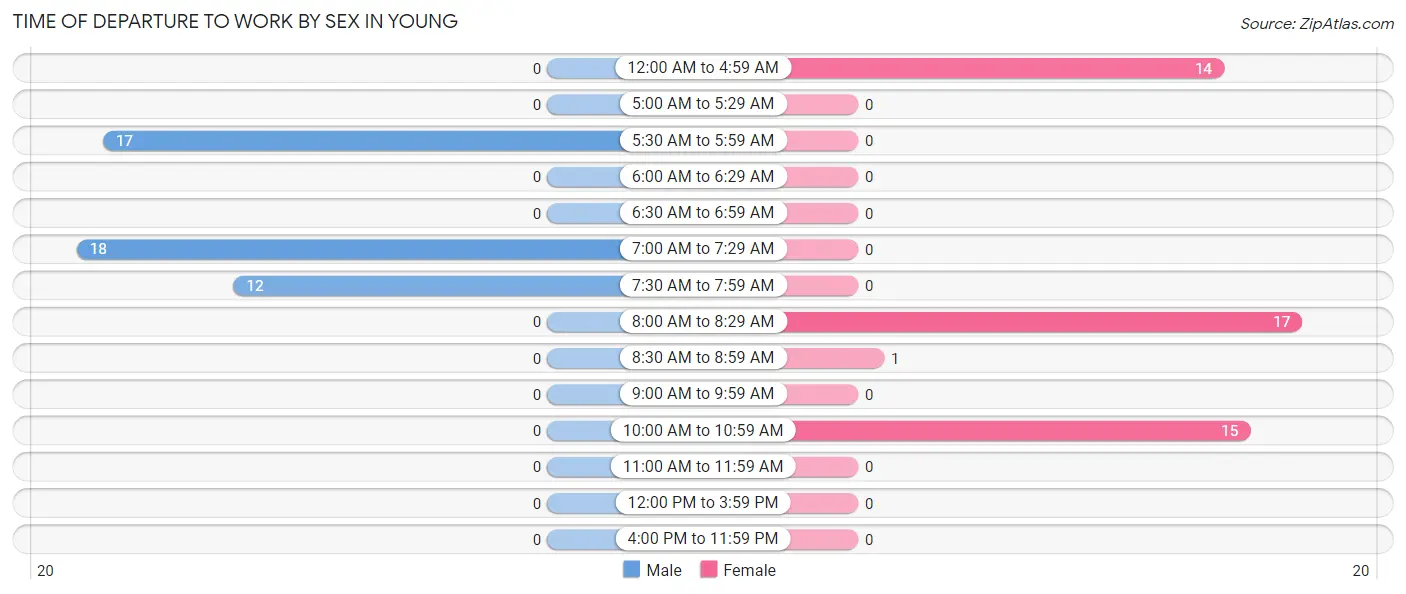
Time of Departure to Work by Sex in Young
The most frequent times of departure to work in Young are 7:00 AM to 7:29 AM (18, 38.3%) for males and 8:00 AM to 8:29 AM (17, 36.2%) for females.
| Time of Departure | Male | Female |
| 12:00 AM to 4:59 AM | 0 (0.0%) | 14 (29.8%) |
| 5:00 AM to 5:29 AM | 0 (0.0%) | 0 (0.0%) |
| 5:30 AM to 5:59 AM | 17 (36.2%) | 0 (0.0%) |
| 6:00 AM to 6:29 AM | 0 (0.0%) | 0 (0.0%) |
| 6:30 AM to 6:59 AM | 0 (0.0%) | 0 (0.0%) |
| 7:00 AM to 7:29 AM | 18 (38.3%) | 0 (0.0%) |
| 7:30 AM to 7:59 AM | 12 (25.5%) | 0 (0.0%) |
| 8:00 AM to 8:29 AM | 0 (0.0%) | 17 (36.2%) |
| 8:30 AM to 8:59 AM | 0 (0.0%) | 1 (2.1%) |
| 9:00 AM to 9:59 AM | 0 (0.0%) | 0 (0.0%) |
| 10:00 AM to 10:59 AM | 0 (0.0%) | 15 (31.9%) |
| 11:00 AM to 11:59 AM | 0 (0.0%) | 0 (0.0%) |
| 12:00 PM to 3:59 PM | 0 (0.0%) | 0 (0.0%) |
| 4:00 PM to 11:59 PM | 0 (0.0%) | 0 (0.0%) |
| Total | 47 (100.0%) | 47 (100.0%) |
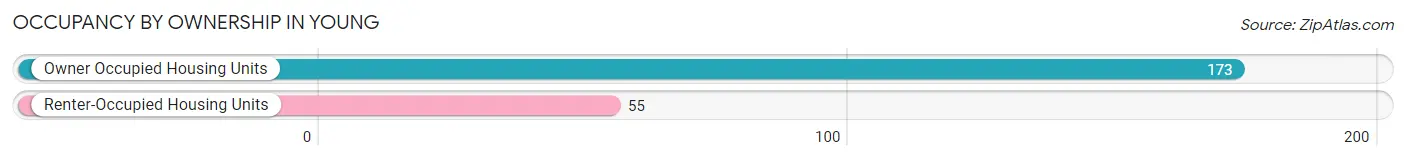
Housing Occupancy in Young
Occupancy by Ownership in Young
Of the total 228 dwellings in Young, owner-occupied units account for 173 (75.9%), while renter-occupied units make up 55 (24.1%).
| Occupancy | # Housing Units | % Housing Units |
| Owner Occupied Housing Units | 173 | 75.9% |
| Renter-Occupied Housing Units | 55 | 24.1% |
| Total Occupied Housing Units | 228 | 100.0% |
Occupancy by Household Size in Young
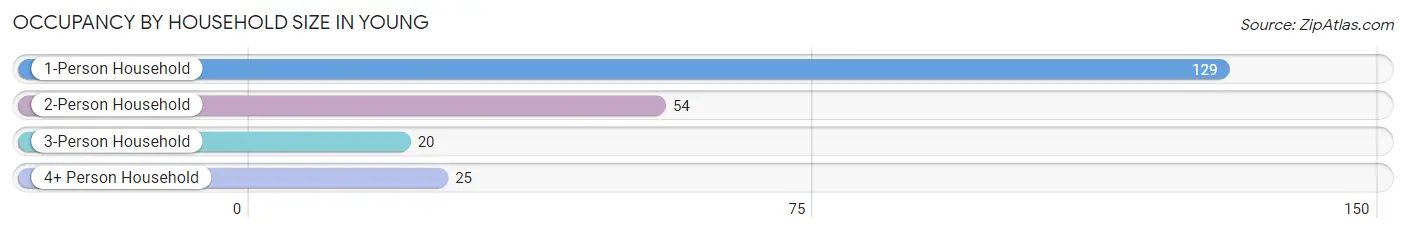
| Household Size | # Housing Units | % Housing Units |
| 1-Person Household | 129 | 56.6% |
| 2-Person Household | 54 | 23.7% |
| 3-Person Household | 20 | 8.8% |
| 4+ Person Household | 25 | 11.0% |
| Total Housing Units | 228 | 100.0% |
Occupancy by Ownership by Household Size in Young
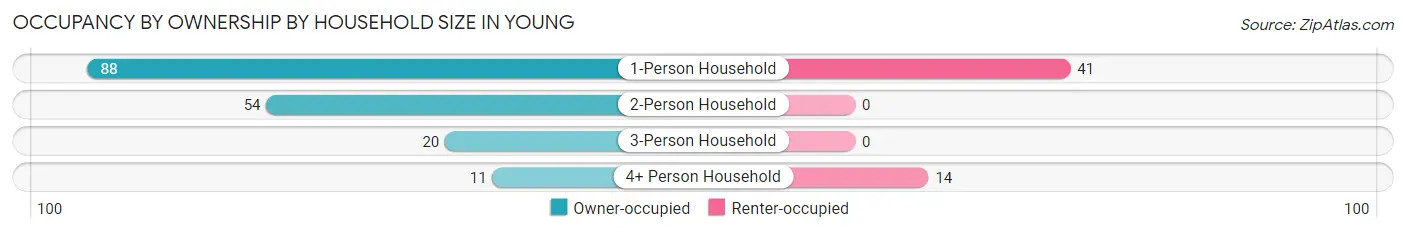
| Household Size | Owner-occupied | Renter-occupied |
| 1-Person Household | 88 (68.2%) | 41 (31.8%) |
| 2-Person Household | 54 (100.0%) | 0 (0.0%) |
| 3-Person Household | 20 (100.0%) | 0 (0.0%) |
| 4+ Person Household | 11 (44.0%) | 14 (56.0%) |
| Total Housing Units | 173 (75.9%) | 55 (24.1%) |
Occupancy by Educational Attainment in Young
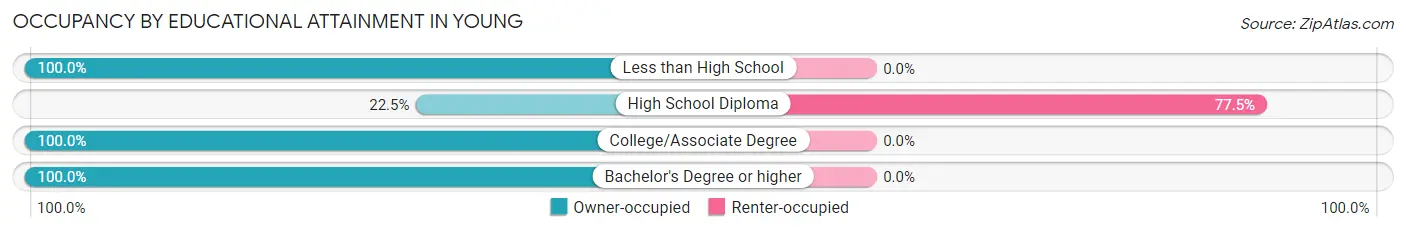
| Household Size | Owner-occupied | Renter-occupied |
| Less than High School | 11 (100.0%) | 0 (0.0%) |
| High School Diploma | 16 (22.5%) | 55 (77.5%) |
| College/Associate Degree | 84 (100.0%) | 0 (0.0%) |
| Bachelor's Degree or higher | 62 (100.0%) | 0 (0.0%) |
Occupancy by Age of Householder in Young
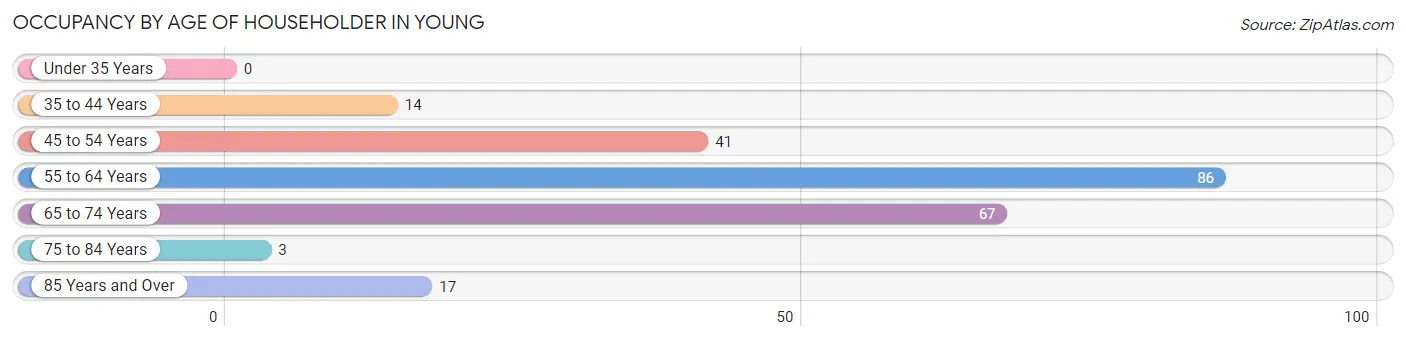
| Age Bracket | # Households | % Households |
| Under 35 Years | 0 | 0.0% |
| 35 to 44 Years | 14 | 6.1% |
| 45 to 54 Years | 41 | 18.0% |
| 55 to 64 Years | 86 | 37.7% |
| 65 to 74 Years | 67 | 29.4% |
| 75 to 84 Years | 3 | 1.3% |
| 85 Years and Over | 17 | 7.5% |
| Total | 228 | 100.0% |
Housing Finances in Young
Median Income by Occupancy in Young
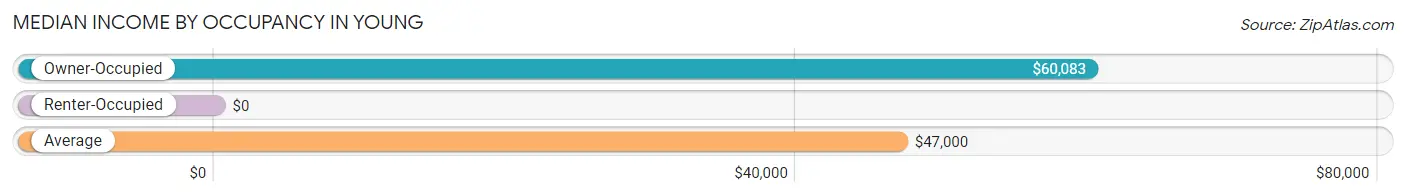
| Occupancy Type | # Households | Median Income |
| Owner-Occupied | 173 (75.9%) | $60,083 |
| Renter-Occupied | 55 (24.1%) | $0 |
| Average | 228 (100.0%) | $47,000 |
Occupancy by Householder Income Bracket in Young
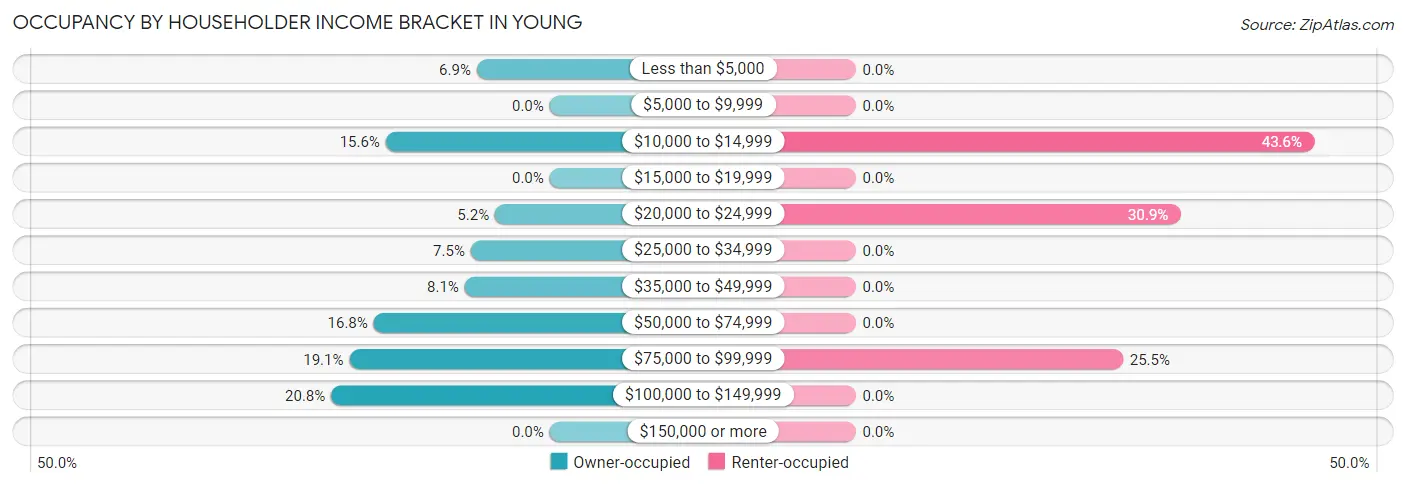
| Income Bracket | Owner-occupied | Renter-occupied |
| Less than $5,000 | 12 (6.9%) | 0 (0.0%) |
| $5,000 to $9,999 | 0 (0.0%) | 0 (0.0%) |
| $10,000 to $14,999 | 27 (15.6%) | 24 (43.6%) |
| $15,000 to $19,999 | 0 (0.0%) | 0 (0.0%) |
| $20,000 to $24,999 | 9 (5.2%) | 17 (30.9%) |
| $25,000 to $34,999 | 13 (7.5%) | 0 (0.0%) |
| $35,000 to $49,999 | 14 (8.1%) | 0 (0.0%) |
| $50,000 to $74,999 | 29 (16.8%) | 0 (0.0%) |
| $75,000 to $99,999 | 33 (19.1%) | 14 (25.5%) |
| $100,000 to $149,999 | 36 (20.8%) | 0 (0.0%) |
| $150,000 or more | 0 (0.0%) | 0 (0.0%) |
| Total | 173 (100.0%) | 55 (100.0%) |
Monthly Housing Cost Tiers in Young
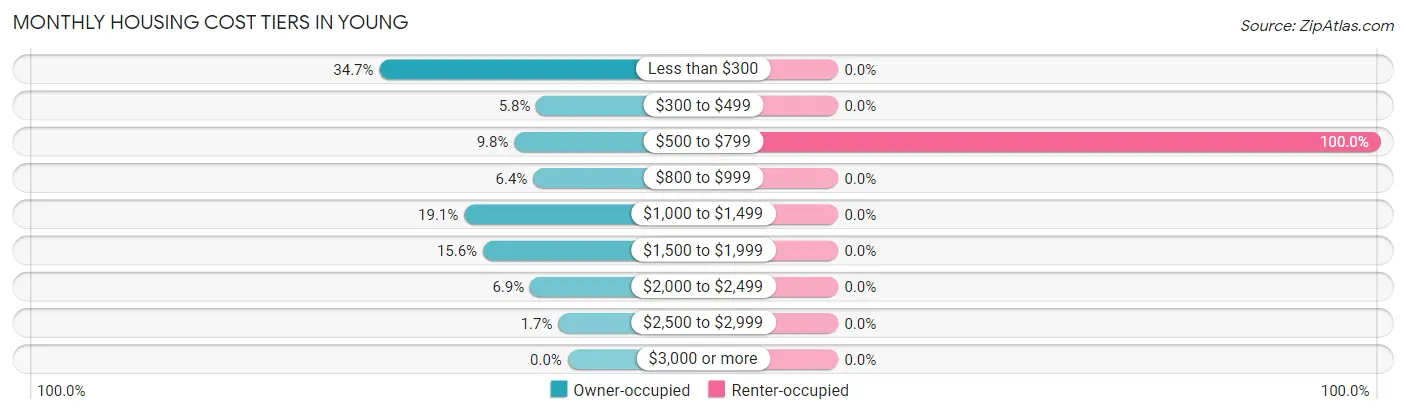
| Monthly Cost | Owner-occupied | Renter-occupied |
| Less than $300 | 60 (34.7%) | 0 (0.0%) |
| $300 to $499 | 10 (5.8%) | 0 (0.0%) |
| $500 to $799 | 17 (9.8%) | 55 (100.0%) |
| $800 to $999 | 11 (6.4%) | 0 (0.0%) |
| $1,000 to $1,499 | 33 (19.1%) | 0 (0.0%) |
| $1,500 to $1,999 | 27 (15.6%) | 0 (0.0%) |
| $2,000 to $2,499 | 12 (6.9%) | 0 (0.0%) |
| $2,500 to $2,999 | 3 (1.7%) | 0 (0.0%) |
| $3,000 or more | 0 (0.0%) | 0 (0.0%) |
| Total | 173 (100.0%) | 55 (100.0%) |
Physical Housing Characteristics in Young
Housing Structures in Young
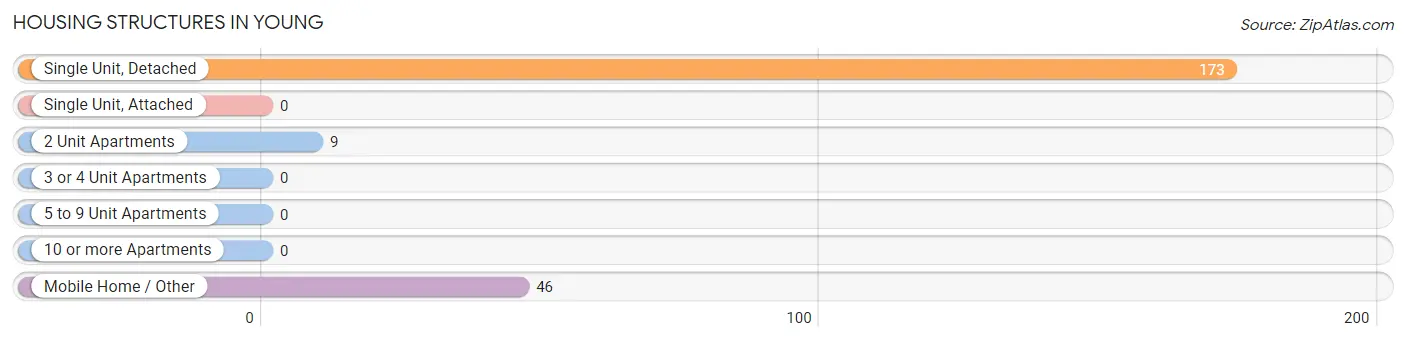
| Structure Type | # Housing Units | % Housing Units |
| Single Unit, Detached | 173 | 75.9% |
| Single Unit, Attached | 0 | 0.0% |
| 2 Unit Apartments | 9 | 4.0% |
| 3 or 4 Unit Apartments | 0 | 0.0% |
| 5 to 9 Unit Apartments | 0 | 0.0% |
| 10 or more Apartments | 0 | 0.0% |
| Mobile Home / Other | 46 | 20.2% |
| Total | 228 | 100.0% |
Housing Structures by Occupancy in Young
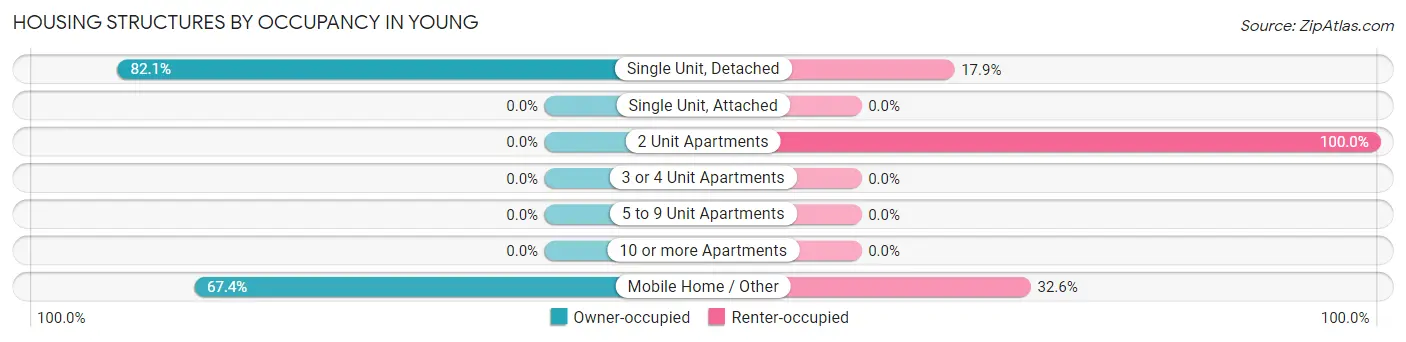
| Structure Type | Owner-occupied | Renter-occupied |
| Single Unit, Detached | 142 (82.1%) | 31 (17.9%) |
| Single Unit, Attached | 0 (0.0%) | 0 (0.0%) |
| 2 Unit Apartments | 0 (0.0%) | 9 (100.0%) |
| 3 or 4 Unit Apartments | 0 (0.0%) | 0 (0.0%) |
| 5 to 9 Unit Apartments | 0 (0.0%) | 0 (0.0%) |
| 10 or more Apartments | 0 (0.0%) | 0 (0.0%) |
| Mobile Home / Other | 31 (67.4%) | 15 (32.6%) |
| Total | 173 (75.9%) | 55 (24.1%) |
Housing Structures by Number of Rooms in Young
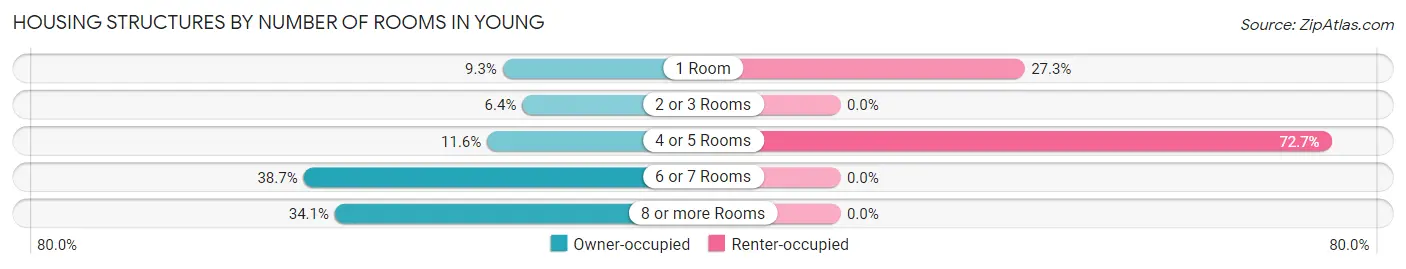
| Number of Rooms | Owner-occupied | Renter-occupied |
| 1 Room | 16 (9.2%) | 15 (27.3%) |
| 2 or 3 Rooms | 11 (6.4%) | 0 (0.0%) |
| 4 or 5 Rooms | 20 (11.6%) | 40 (72.7%) |
| 6 or 7 Rooms | 67 (38.7%) | 0 (0.0%) |
| 8 or more Rooms | 59 (34.1%) | 0 (0.0%) |
| Total | 173 (100.0%) | 55 (100.0%) |
Housing Structure by Heating Type in Young
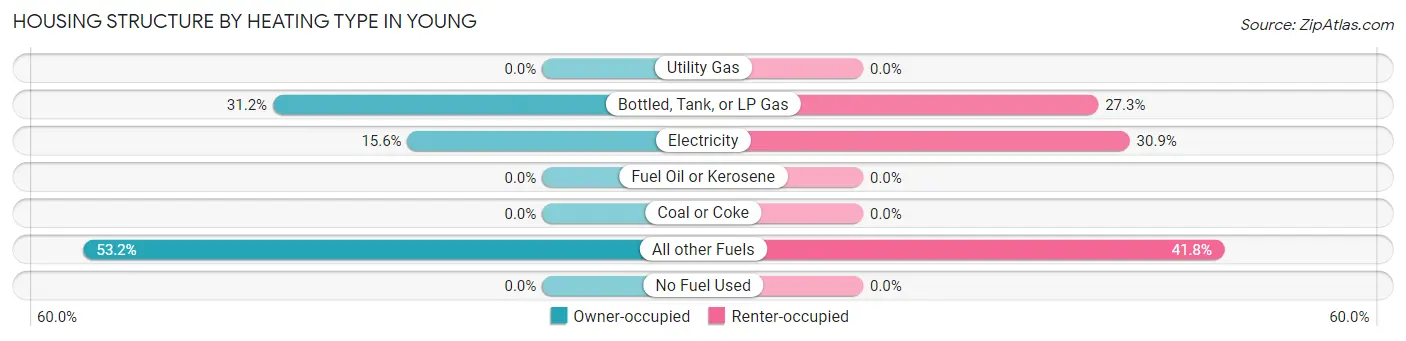
| Heating Type | Owner-occupied | Renter-occupied |
| Utility Gas | 0 (0.0%) | 0 (0.0%) |
| Bottled, Tank, or LP Gas | 54 (31.2%) | 15 (27.3%) |
| Electricity | 27 (15.6%) | 17 (30.9%) |
| Fuel Oil or Kerosene | 0 (0.0%) | 0 (0.0%) |
| Coal or Coke | 0 (0.0%) | 0 (0.0%) |
| All other Fuels | 92 (53.2%) | 23 (41.8%) |
| No Fuel Used | 0 (0.0%) | 0 (0.0%) |
| Total | 173 (100.0%) | 55 (100.0%) |
Household Vehicle Usage in Young
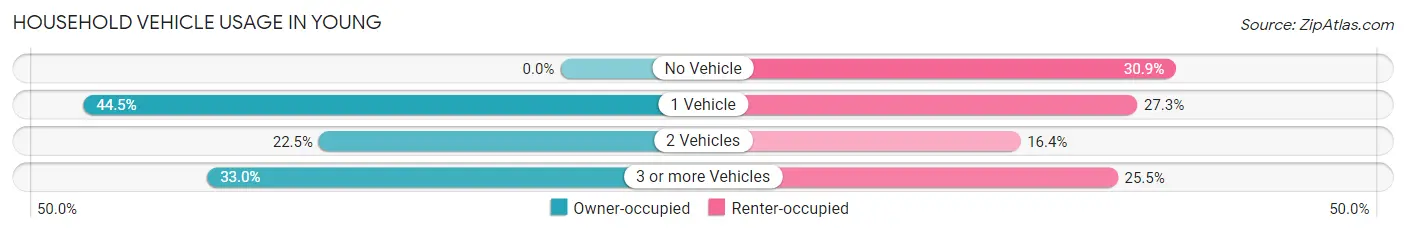
| Vehicles per Household | Owner-occupied | Renter-occupied |
| No Vehicle | 0 (0.0%) | 17 (30.9%) |
| 1 Vehicle | 77 (44.5%) | 15 (27.3%) |
| 2 Vehicles | 39 (22.5%) | 9 (16.4%) |
| 3 or more Vehicles | 57 (33.0%) | 14 (25.5%) |
| Total | 173 (100.0%) | 55 (100.0%) |
Real Estate & Mortgages in Young
Real Estate and Mortgage Overview in Young
| Characteristic | Without Mortgage | With Mortgage |
| Housing Units | 87 | 86 |
| Median Property Value | $154,400 | $238,100 |
| Median Household Income | $46,125 | $0 |
| Monthly Housing Costs | $249 | $0 |
| Real Estate Taxes | - | - |
Property Value by Mortgage Status in Young
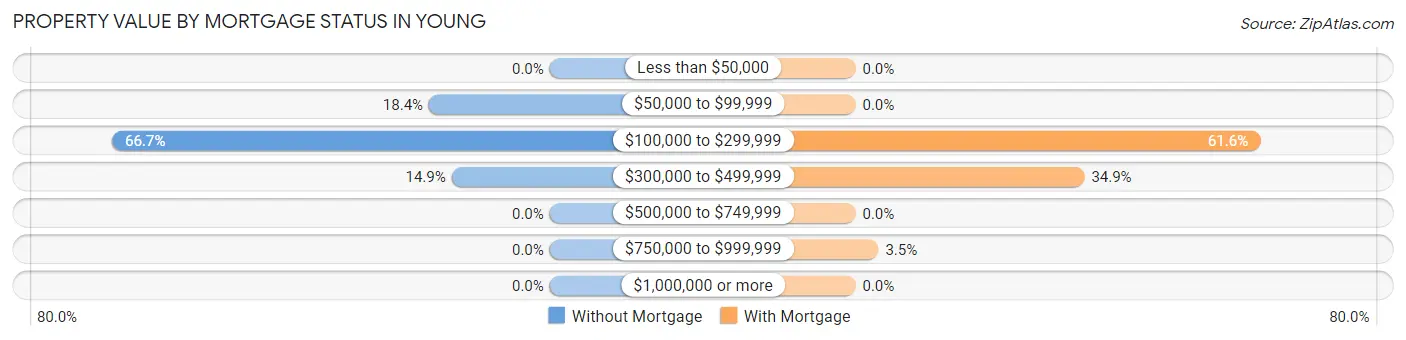
| Property Value | Without Mortgage | With Mortgage |
| Less than $50,000 | 0 (0.0%) | 0 (0.0%) |
| $50,000 to $99,999 | 16 (18.4%) | 0 (0.0%) |
| $100,000 to $299,999 | 58 (66.7%) | 53 (61.6%) |
| $300,000 to $499,999 | 13 (14.9%) | 30 (34.9%) |
| $500,000 to $749,999 | 0 (0.0%) | 0 (0.0%) |
| $750,000 to $999,999 | 0 (0.0%) | 3 (3.5%) |
| $1,000,000 or more | 0 (0.0%) | 0 (0.0%) |
| Total | 87 (100.0%) | 86 (100.0%) |
Household Income by Mortgage Status in Young
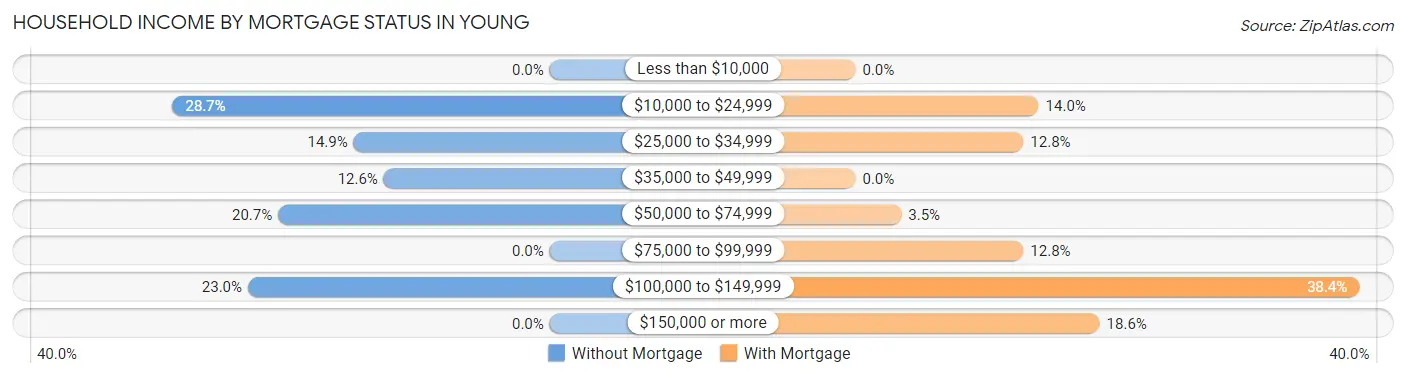
| Household Income | Without Mortgage | With Mortgage |
| Less than $10,000 | 0 (0.0%) | 0 (0.0%) |
| $10,000 to $24,999 | 25 (28.7%) | 12 (14.0%) |
| $25,000 to $34,999 | 13 (14.9%) | 11 (12.8%) |
| $35,000 to $49,999 | 11 (12.6%) | 0 (0.0%) |
| $50,000 to $74,999 | 18 (20.7%) | 3 (3.5%) |
| $75,000 to $99,999 | 0 (0.0%) | 11 (12.8%) |
| $100,000 to $149,999 | 20 (23.0%) | 33 (38.4%) |
| $150,000 or more | 0 (0.0%) | 16 (18.6%) |
| Total | 87 (100.0%) | 86 (100.0%) |
Property Value to Household Income Ratio in Young
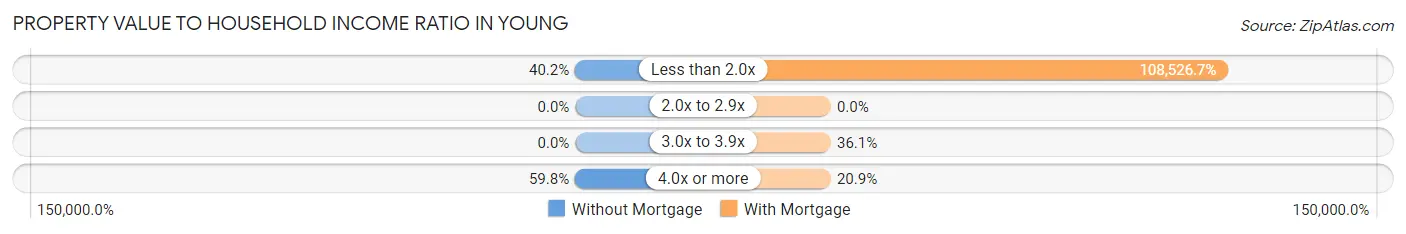
| Value-to-Income Ratio | Without Mortgage | With Mortgage |
| Less than 2.0x | 35 (40.2%) | 93,333 (108,526.7%) |
| 2.0x to 2.9x | 0 (0.0%) | 0 (0.0%) |
| 3.0x to 3.9x | 0 (0.0%) | 31 (36.0%) |
| 4.0x or more | 52 (59.8%) | 18 (20.9%) |
| Total | 87 (100.0%) | 86 (100.0%) |
Real Estate Taxes by Mortgage Status in Young
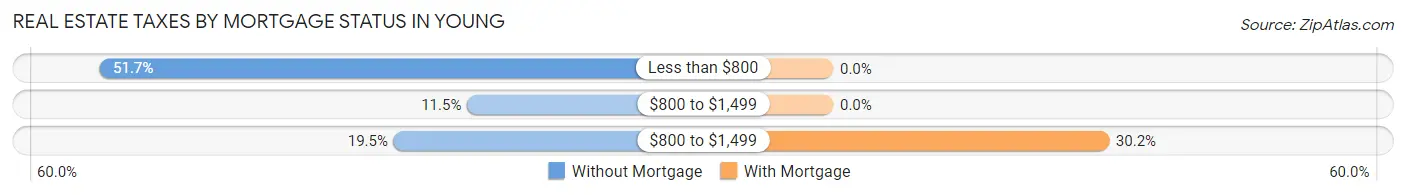
| Property Taxes | Without Mortgage | With Mortgage |
| Less than $800 | 45 (51.7%) | 0 (0.0%) |
| $800 to $1,499 | 10 (11.5%) | 0 (0.0%) |
| $800 to $1,499 | 17 (19.5%) | 26 (30.2%) |
| Total | 87 (100.0%) | 86 (100.0%) |
Health & Disability in Young
Health Insurance Coverage by Age in Young
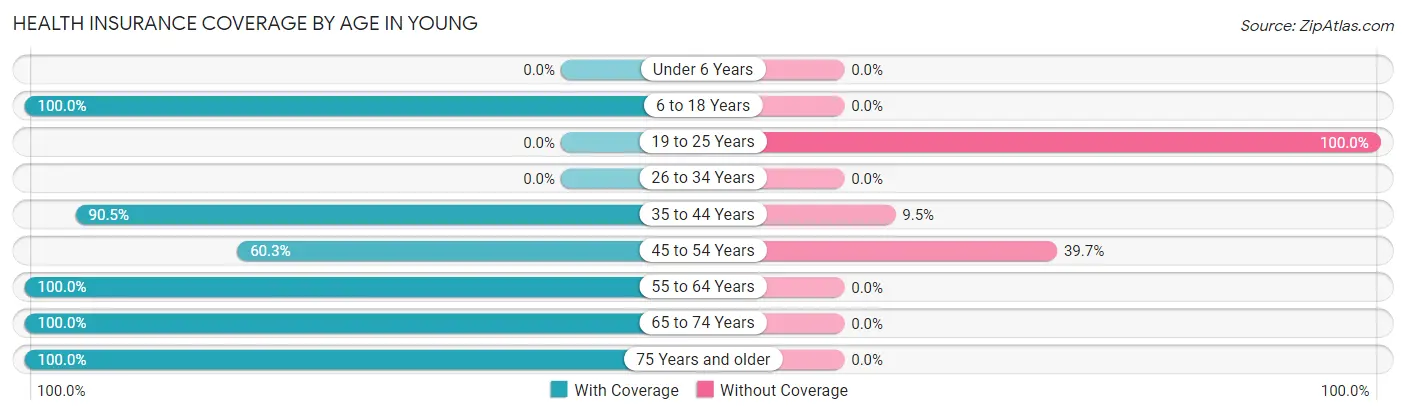
| Age Bracket | With Coverage | Without Coverage |
| Under 6 Years | 0 (0.0%) | 0 (0.0%) |
| 6 to 18 Years | 57 (100.0%) | 0 (0.0%) |
| 19 to 25 Years | 0 (0.0%) | 17 (100.0%) |
| 26 to 34 Years | 0 (0.0%) | 0 (0.0%) |
| 35 to 44 Years | 38 (90.5%) | 4 (9.5%) |
| 45 to 54 Years | 35 (60.3%) | 23 (39.7%) |
| 55 to 64 Years | 108 (100.0%) | 0 (0.0%) |
| 65 to 74 Years | 103 (100.0%) | 0 (0.0%) |
| 75 Years and older | 22 (100.0%) | 0 (0.0%) |
| Total | 363 (89.2%) | 44 (10.8%) |
Health Insurance Coverage by Citizenship Status in Young
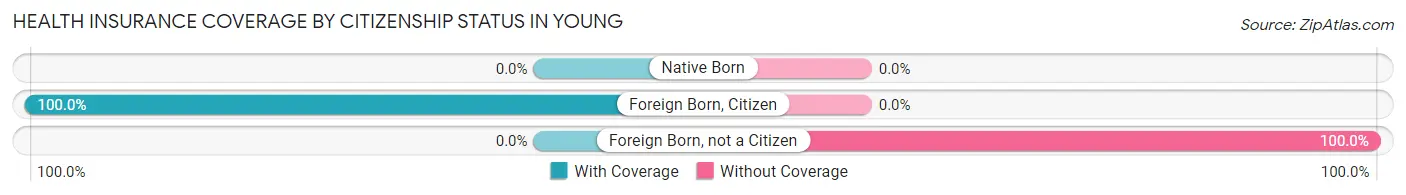
| Citizenship Status | With Coverage | Without Coverage |
| Native Born | 0 (0.0%) | 0 (0.0%) |
| Foreign Born, Citizen | 57 (100.0%) | 0 (0.0%) |
| Foreign Born, not a Citizen | 0 (0.0%) | 17 (100.0%) |
Health Insurance Coverage by Household Income in Young
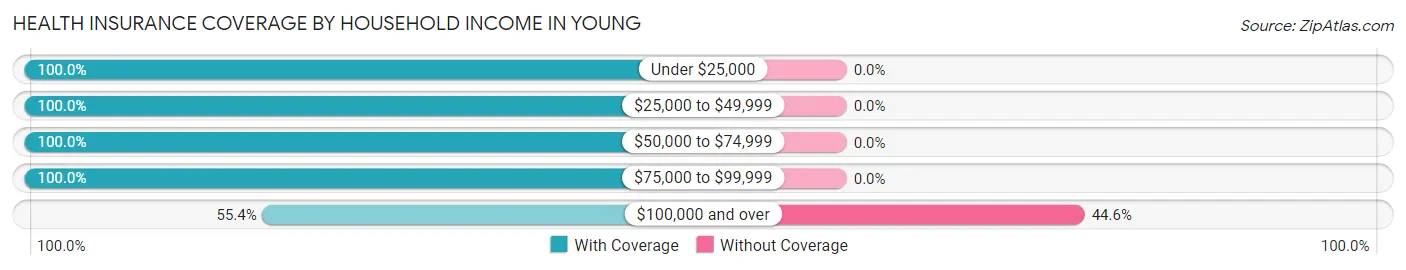
| Household Income | With Coverage | Without Coverage |
| Under $25,000 | 89 (100.0%) | 0 (0.0%) |
| $25,000 to $49,999 | 40 (100.0%) | 0 (0.0%) |
| $50,000 to $74,999 | 63 (100.0%) | 0 (0.0%) |
| $75,000 to $99,999 | 121 (100.0%) | 0 (0.0%) |
| $100,000 and over | 46 (55.4%) | 37 (44.6%) |
Public vs Private Health Insurance Coverage by Age in Young
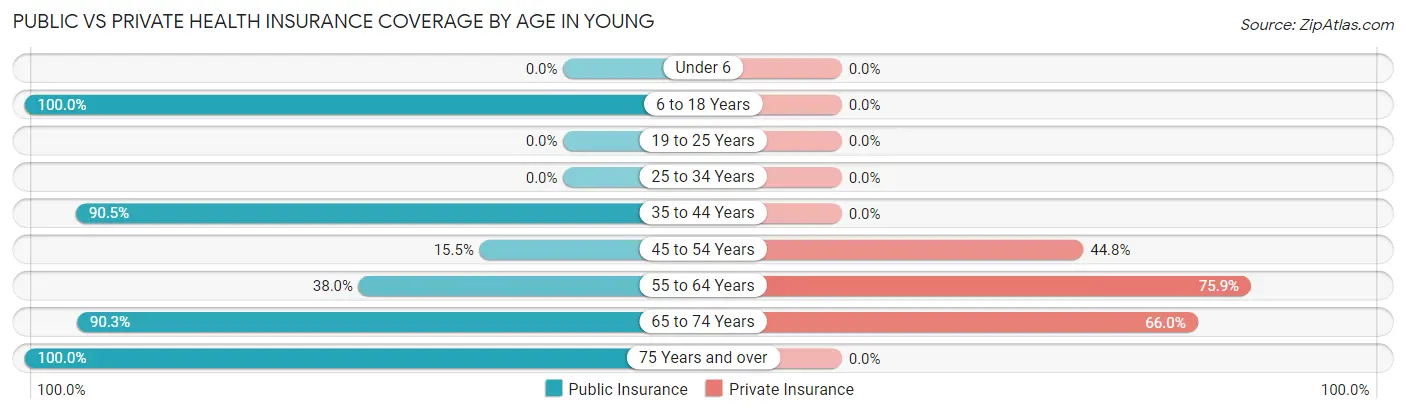
| Age Bracket | Public Insurance | Private Insurance |
| Under 6 | 0 (0.0%) | 0 (0.0%) |
| 6 to 18 Years | 57 (100.0%) | 0 (0.0%) |
| 19 to 25 Years | 0 (0.0%) | 0 (0.0%) |
| 25 to 34 Years | 0 (0.0%) | 0 (0.0%) |
| 35 to 44 Years | 38 (90.5%) | 0 (0.0%) |
| 45 to 54 Years | 9 (15.5%) | 26 (44.8%) |
| 55 to 64 Years | 41 (38.0%) | 82 (75.9%) |
| 65 to 74 Years | 93 (90.3%) | 68 (66.0%) |
| 75 Years and over | 22 (100.0%) | 0 (0.0%) |
| Total | 260 (63.9%) | 176 (43.2%) |
Disability Status by Sex by Age in Young
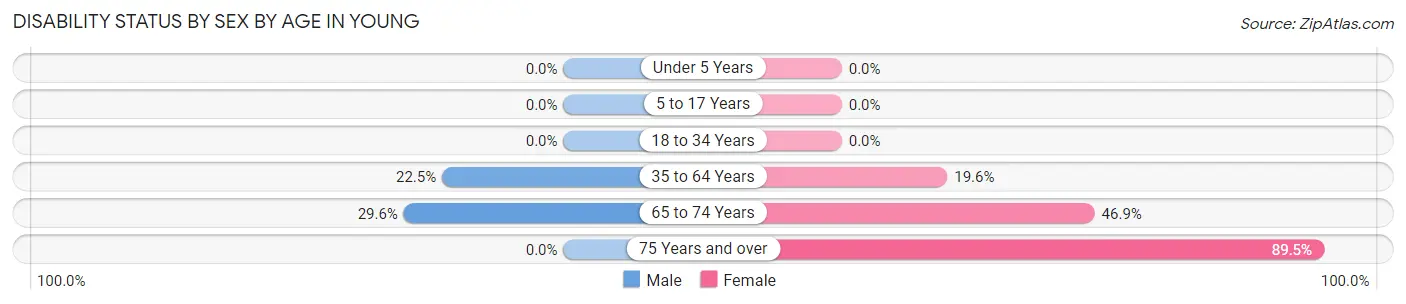
| Age Bracket | Male | Female |
| Under 5 Years | 0 (0.0%) | 0 (0.0%) |
| 5 to 17 Years | 0 (0.0%) | 0 (0.0%) |
| 18 to 34 Years | 0 (0.0%) | 0 (0.0%) |
| 35 to 64 Years | 25 (22.5%) | 19 (19.6%) |
| 65 to 74 Years | 16 (29.6%) | 23 (46.9%) |
| 75 Years and over | 0 (0.0%) | 17 (89.5%) |
Disability Class by Sex by Age in Young
Disability Class: Hearing Difficulty
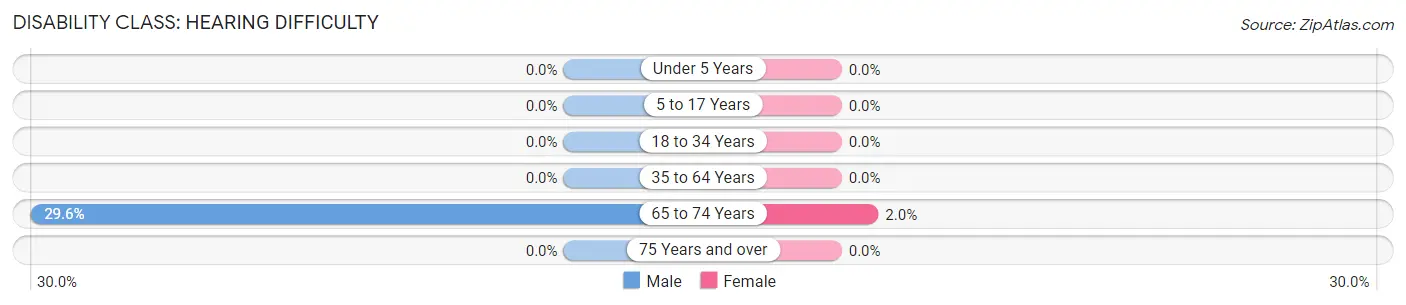
| Age Bracket | Male | Female |
| Under 5 Years | 0 (0.0%) | 0 (0.0%) |
| 5 to 17 Years | 0 (0.0%) | 0 (0.0%) |
| 18 to 34 Years | 0 (0.0%) | 0 (0.0%) |
| 35 to 64 Years | 0 (0.0%) | 0 (0.0%) |
| 65 to 74 Years | 16 (29.6%) | 1 (2.0%) |
| 75 Years and over | 0 (0.0%) | 0 (0.0%) |
Disability Class: Vision Difficulty
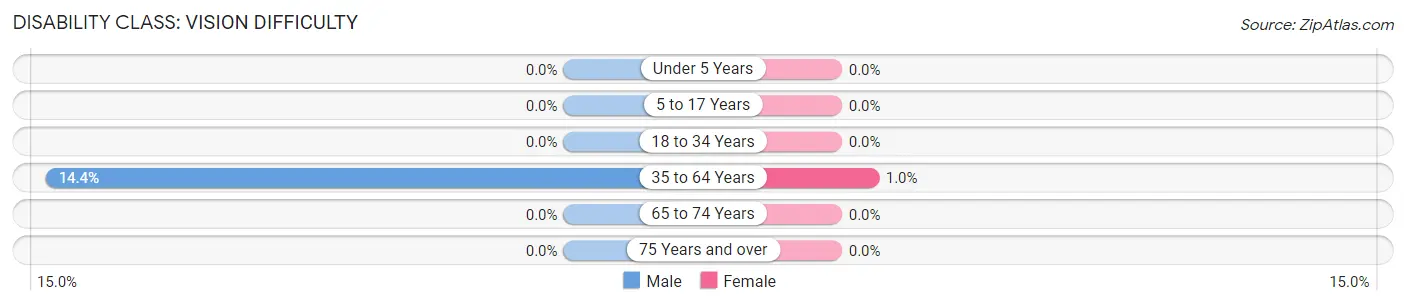
| Age Bracket | Male | Female |
| Under 5 Years | 0 (0.0%) | 0 (0.0%) |
| 5 to 17 Years | 0 (0.0%) | 0 (0.0%) |
| 18 to 34 Years | 0 (0.0%) | 0 (0.0%) |
| 35 to 64 Years | 16 (14.4%) | 1 (1.0%) |
| 65 to 74 Years | 0 (0.0%) | 0 (0.0%) |
| 75 Years and over | 0 (0.0%) | 0 (0.0%) |
Disability Class: Cognitive Difficulty
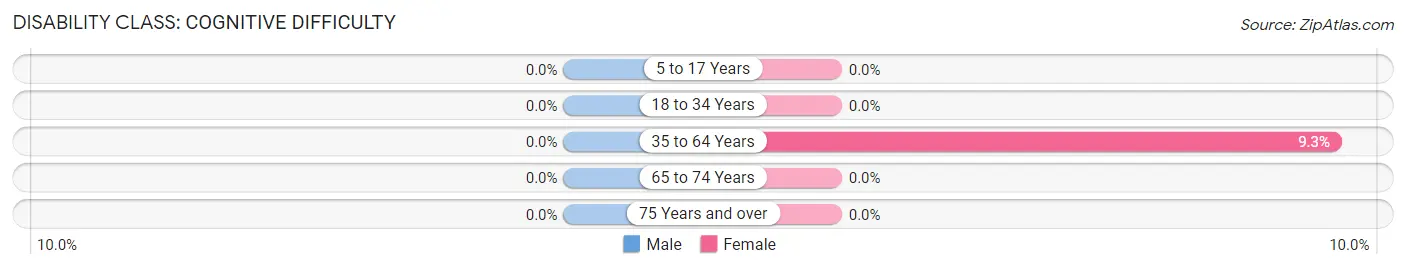
| Age Bracket | Male | Female |
| 5 to 17 Years | 0 (0.0%) | 0 (0.0%) |
| 18 to 34 Years | 0 (0.0%) | 0 (0.0%) |
| 35 to 64 Years | 0 (0.0%) | 9 (9.3%) |
| 65 to 74 Years | 0 (0.0%) | 0 (0.0%) |
| 75 Years and over | 0 (0.0%) | 0 (0.0%) |
Disability Class: Ambulatory Difficulty
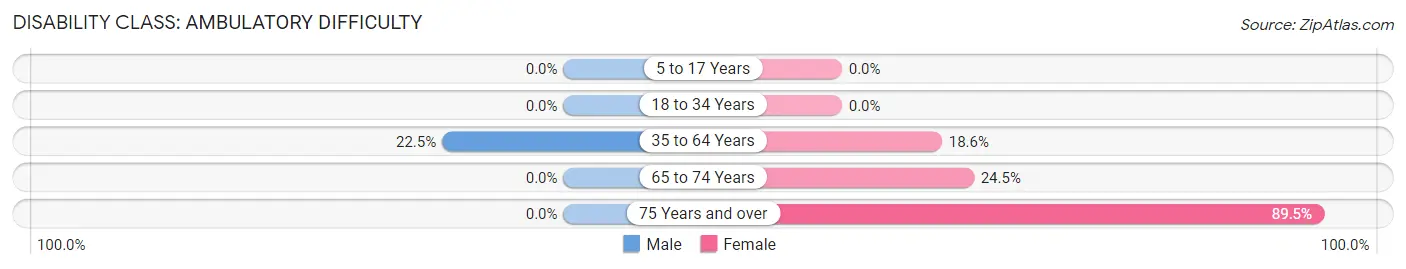
| Age Bracket | Male | Female |
| 5 to 17 Years | 0 (0.0%) | 0 (0.0%) |
| 18 to 34 Years | 0 (0.0%) | 0 (0.0%) |
| 35 to 64 Years | 25 (22.5%) | 18 (18.6%) |
| 65 to 74 Years | 0 (0.0%) | 12 (24.5%) |
| 75 Years and over | 0 (0.0%) | 17 (89.5%) |
Disability Class: Self-Care Difficulty
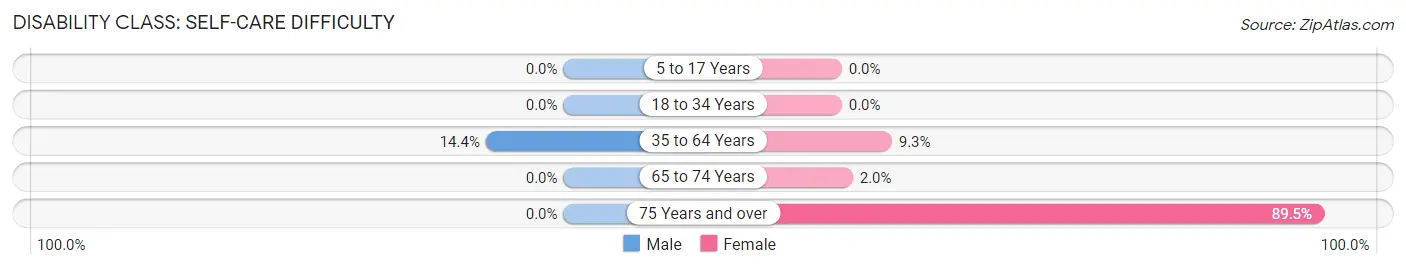
| Age Bracket | Male | Female |
| 5 to 17 Years | 0 (0.0%) | 0 (0.0%) |
| 18 to 34 Years | 0 (0.0%) | 0 (0.0%) |
| 35 to 64 Years | 16 (14.4%) | 9 (9.3%) |
| 65 to 74 Years | 0 (0.0%) | 1 (2.0%) |
| 75 Years and over | 0 (0.0%) | 17 (89.5%) |
Technology Access in Young
Computing Device Access in Young
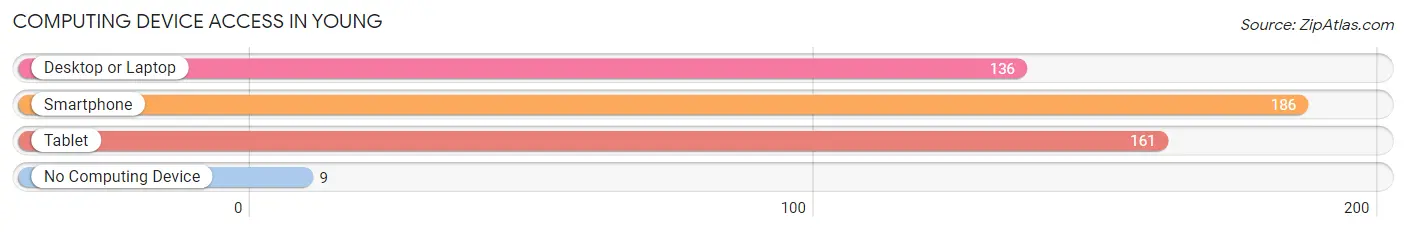
| Device Type | # Households | % Households |
| Desktop or Laptop | 136 | 59.7% |
| Smartphone | 186 | 81.6% |
| Tablet | 161 | 70.6% |
| No Computing Device | 9 | 4.0% |
| Total | 228 | 100.0% |
Internet Access in Young
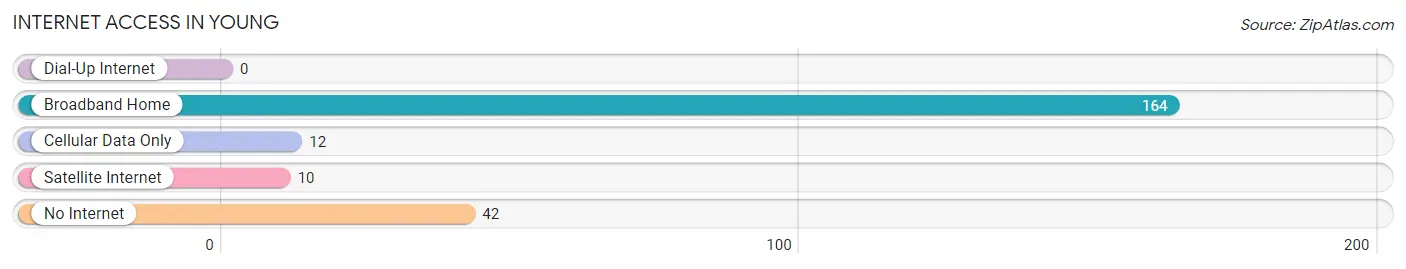
| Internet Type | # Households | % Households |
| Dial-Up Internet | 0 | 0.0% |
| Broadband Home | 164 | 71.9% |
| Cellular Data Only | 12 | 5.3% |
| Satellite Internet | 10 | 4.4% |
| No Internet | 42 | 18.4% |
| Total | 228 | 100.0% |
Young Summary
Arizona is a state located in the southwestern region of the United States. It is bordered by California, Nevada, Utah, New Mexico, and Mexico. Arizona is the sixth largest state in the country and is known for its desert climate and diverse landscape.
History
Arizona has a long and varied history. The area was first inhabited by Native American tribes such as the Hohokam, the Anasazi, and the Apache. These tribes were hunter-gatherers and farmers who lived in the area for thousands of years.
In 1539, Spanish explorer Francisco Vásquez de Coronado became the first European to explore the area. He was followed by other Spanish explorers and missionaries who established missions and settlements in the area.
In 1848, the area became part of the United States after the Mexican-American War. The area was then divided into two territories, New Mexico and Arizona. In 1863, Arizona became a separate territory and in 1912, it became the 48th state in the Union.
Geography
Arizona is located in the southwestern region of the United States. It is bordered by California, Nevada, Utah, New Mexico, and Mexico. Arizona is the sixth largest state in the country and is known for its desert climate and diverse landscape.
The state is divided into two distinct regions, the Colorado Plateau and the Basin and Range Province. The Colorado Plateau is a high plateau that covers much of northern Arizona and is home to the Grand Canyon. The Basin and Range Province is a region of mountains and valleys that covers much of southern Arizona.
The state is home to a variety of landscapes, including deserts, mountains, canyons, and forests. The highest point in the state is Humphreys Peak, which is located in the San Francisco Peaks near Flagstaff.
Economy
Arizona has a diverse economy that is driven by a variety of industries. The state is home to a number of large companies, including Intel, Honeywell, and US Airways.
The state is also a major producer of copper, which is mined in the state’s copper mines. Other important industries in the state include tourism, agriculture, and manufacturing.
Demographics
As of 2020, the population of Arizona was estimated to be 7.3 million. The state is home to a diverse population, with the largest ethnic groups being White (63.7%), Hispanic or Latino (30.2%), and Native American (4.9%).
The state’s largest cities are Phoenix, Tucson, Mesa, and Glendale. Phoenix is the state’s capital and largest city, with a population of 1.7 million. Tucson is the second largest city, with a population of 545,000.
Conclusion
Arizona is a state located in the southwestern region of the United States. It is bordered by California, Nevada, Utah, New Mexico, and Mexico. Arizona is the sixth largest state in the country and is known for its desert climate and diverse landscape. The state has a long and varied history and is home to a diverse population and economy. The state is home to a variety of landscapes, including deserts, mountains, canyons, and forests. The state is also a major producer of copper and is home to a number of large companies. Arizona is a unique and vibrant state with a rich history and culture.
Common Questions
What is Per Capita Income in Young?
Per Capita income in Young is $29,167.
What is the Median Family Income in Young?
Median Family Income in Young is $95,446.
What is the Median Household income in Young?
Median Household Income in Young is $47,000.
What is Inequality or Gini Index in Young?
Inequality or Gini Index in Young is 0.40.
What is the Total Population of Young?
Total Population of Young is 407.
What is the Total Male Population of Young?
Total Male Population of Young is 210.
What is the Total Female Population of Young?
Total Female Population of Young is 197.
What is the Ratio of Males per 100 Females in Young?
There are 106.60 Males per 100 Females in Young.
What is the Ratio of Females per 100 Males in Young?
There are 93.81 Females per 100 Males in Young.
What is the Median Population Age in Young?
Median Population Age in Young is 60.4 Years.
What is the Average Family Size in Young
Average Family Size in Young is 2.7 People.
What is the Average Household Size in Young
Average Household Size in Young is 1.7 People.
How Large is the Labor Force in Young?
There are 118 People in the Labor Forcein in Young.
What is the Percentage of People in the Labor Force in Young?
33.3% of People are in the Labor Force in Young.