Yarnell, AZ Map & Demographics
Yarnell Map
Yarnell Overview
$36,706
PER CAPITA INCOME
$64,375
AVG FAMILY INCOME
$39,847
AVG HOUSEHOLD INCOME
0.45
INEQUALITY / GINI INDEX
579
TOTAL POPULATION
301
MALE POPULATION
278
FEMALE POPULATION
108.27
MALES / 100 FEMALES
92.36
FEMALES / 100 MALES
64.8
MEDIAN AGE
2.5
AVG FAMILY SIZE
1.6
AVG HOUSEHOLD SIZE
177
LABOR FORCE [ PEOPLE ]
32.4%
PERCENT IN LABOR FORCE
Yarnell Zip Codes
Yarnell Area Codes
Income in Yarnell
Income Overview in Yarnell
Per Capita Income in Yarnell is $36,706, while median incomes of families and households are $64,375 and $39,847 respectively.
| Characteristic | Number | Measure |
| Per Capita Income | 579 | $36,706 |
| Median Family Income | 134 | $64,375 |
| Mean Family Income | 134 | $86,263 |
| Median Household Income | 366 | $39,847 |
| Mean Household Income | 366 | $58,094 |
| Income Deficit | 134 | $0 |
| Wage / Income Gap (%) | 579 | 0.00% |
| Wage / Income Gap ($) | 579 | 100.00¢ per $1 |
| Gini / Inequality Index | 579 | 0.45 |
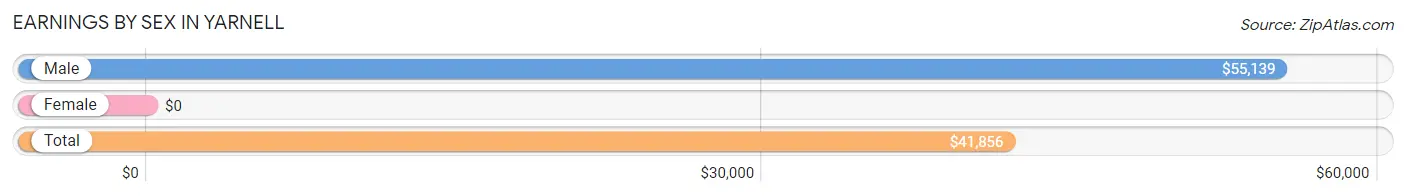
Earnings by Sex in Yarnell
| Sex | Number | Average Earnings |
| Male | 113 (58.6%) | $55,139 |
| Female | 80 (41.4%) | $0 |
| Total | 193 (100.0%) | $41,856 |
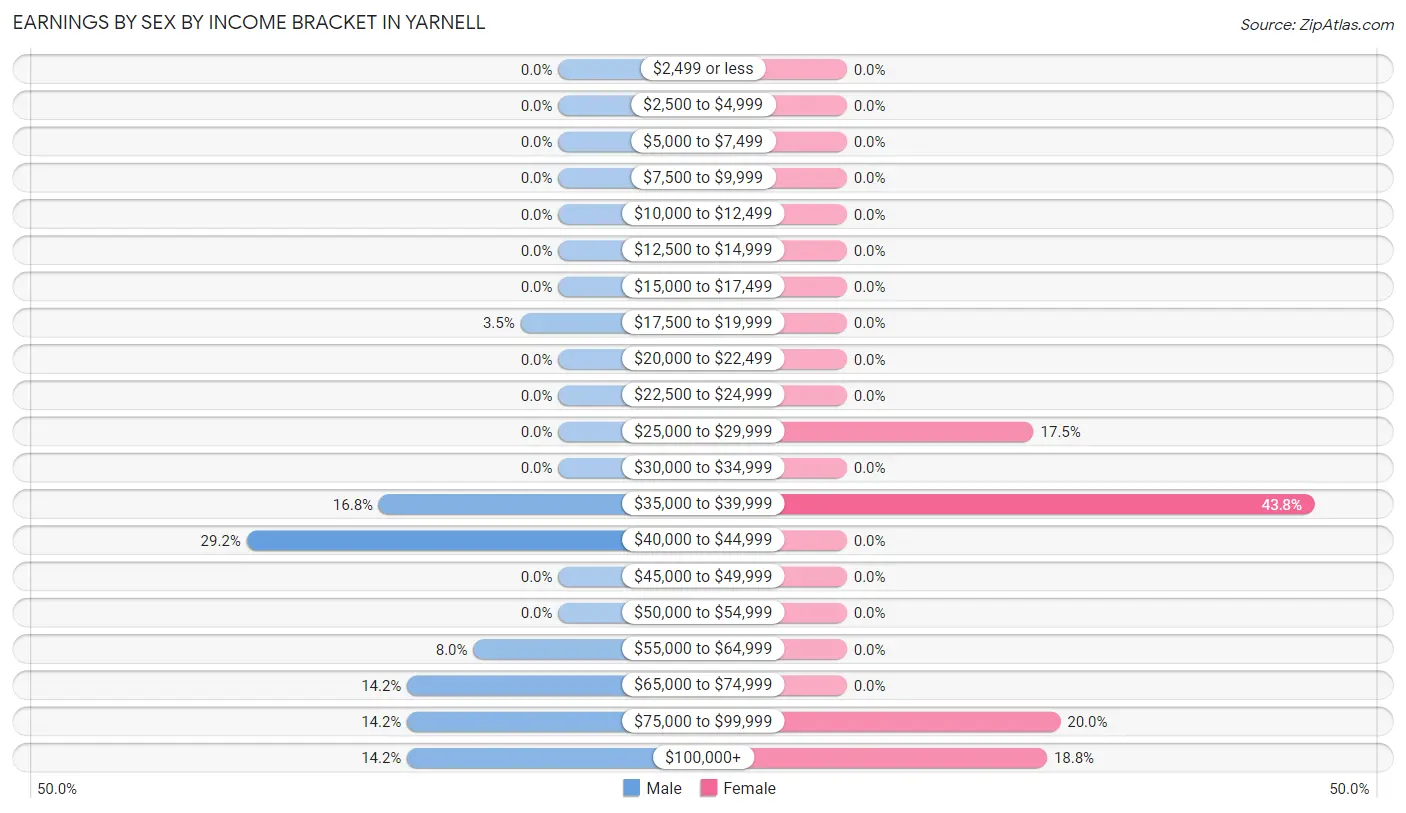
Earnings by Sex by Income Bracket in Yarnell
The most common earnings brackets in Yarnell are $40,000 to $44,999 for men (33 | 29.2%) and $35,000 to $39,999 for women (35 | 43.8%).
| Income | Male | Female |
| $2,499 or less | 0 (0.0%) | 0 (0.0%) |
| $2,500 to $4,999 | 0 (0.0%) | 0 (0.0%) |
| $5,000 to $7,499 | 0 (0.0%) | 0 (0.0%) |
| $7,500 to $9,999 | 0 (0.0%) | 0 (0.0%) |
| $10,000 to $12,499 | 0 (0.0%) | 0 (0.0%) |
| $12,500 to $14,999 | 0 (0.0%) | 0 (0.0%) |
| $15,000 to $17,499 | 0 (0.0%) | 0 (0.0%) |
| $17,500 to $19,999 | 4 (3.5%) | 0 (0.0%) |
| $20,000 to $22,499 | 0 (0.0%) | 0 (0.0%) |
| $22,500 to $24,999 | 0 (0.0%) | 0 (0.0%) |
| $25,000 to $29,999 | 0 (0.0%) | 14 (17.5%) |
| $30,000 to $34,999 | 0 (0.0%) | 0 (0.0%) |
| $35,000 to $39,999 | 19 (16.8%) | 35 (43.8%) |
| $40,000 to $44,999 | 33 (29.2%) | 0 (0.0%) |
| $45,000 to $49,999 | 0 (0.0%) | 0 (0.0%) |
| $50,000 to $54,999 | 0 (0.0%) | 0 (0.0%) |
| $55,000 to $64,999 | 9 (8.0%) | 0 (0.0%) |
| $65,000 to $74,999 | 16 (14.2%) | 0 (0.0%) |
| $75,000 to $99,999 | 16 (14.2%) | 16 (20.0%) |
| $100,000+ | 16 (14.2%) | 15 (18.8%) |
| Total | 113 (100.0%) | 80 (100.0%) |
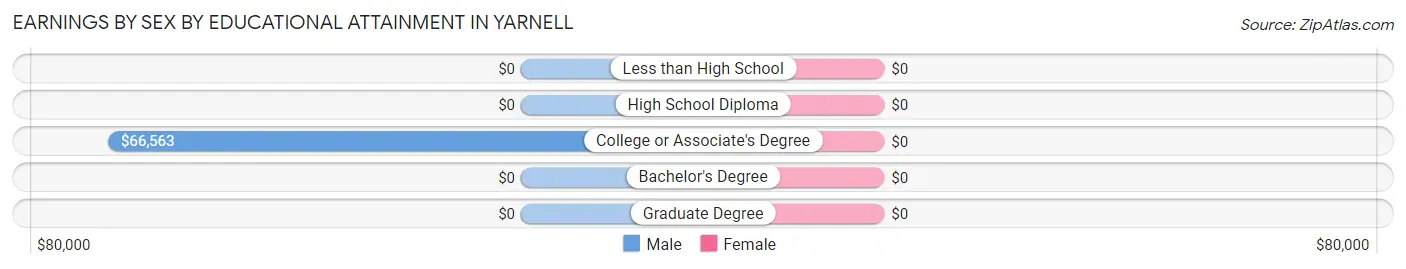
Earnings by Sex by Educational Attainment in Yarnell
| Educational Attainment | Male Income | Female Income |
| Less than High School | - | - |
| High School Diploma | - | - |
| College or Associate's Degree | $66,563 | $0 |
| Bachelor's Degree | - | - |
| Graduate Degree | - | - |
| Total | $57,361 | $0 |
Family Income in Yarnell
Family Income Brackets in Yarnell
According to the Yarnell family income data, there are 47 families falling into the $50,000 to $74,999 income range, which is the most common income bracket and makes up 35.1% of all families.
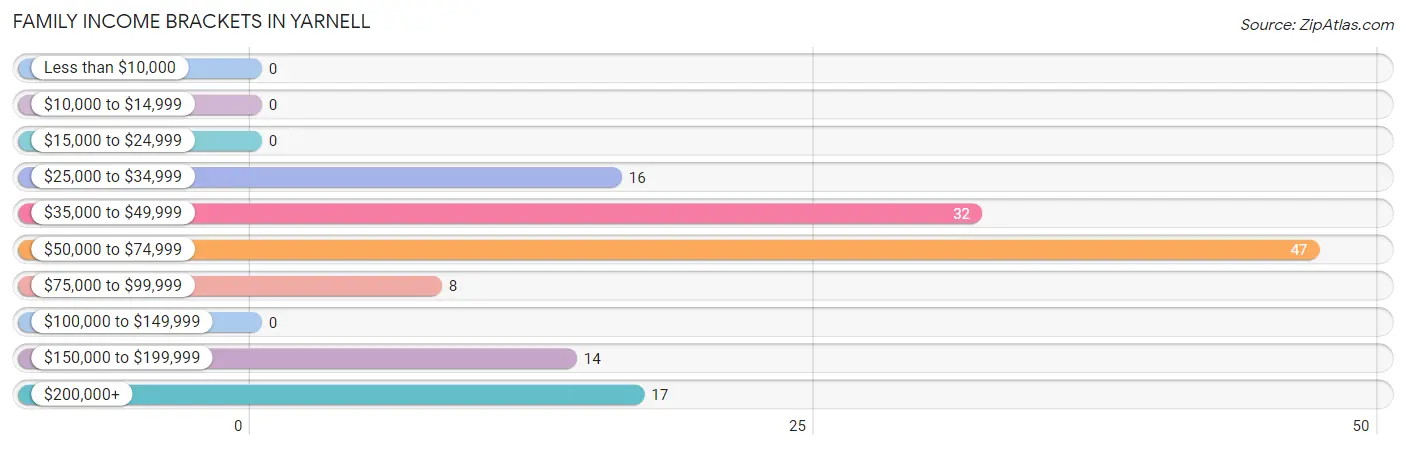
| Income Bracket | # Families | % Families |
| Less than $10,000 | 0 | 0.0% |
| $10,000 to $14,999 | 0 | 0.0% |
| $15,000 to $24,999 | 0 | 0.0% |
| $25,000 to $34,999 | 16 | 11.9% |
| $35,000 to $49,999 | 32 | 23.9% |
| $50,000 to $74,999 | 47 | 35.1% |
| $75,000 to $99,999 | 8 | 6.0% |
| $100,000 to $149,999 | 0 | 0.0% |
| $150,000 to $199,999 | 14 | 10.4% |
| $200,000+ | 17 | 12.7% |
Family Income by Famaliy Size in Yarnell
2-person families (120 | 89.5%) account for the highest median family income in Yarnell with $61,875 per family, while 2-person families (120 | 89.5%) have the highest median income of $30,938 per family member.
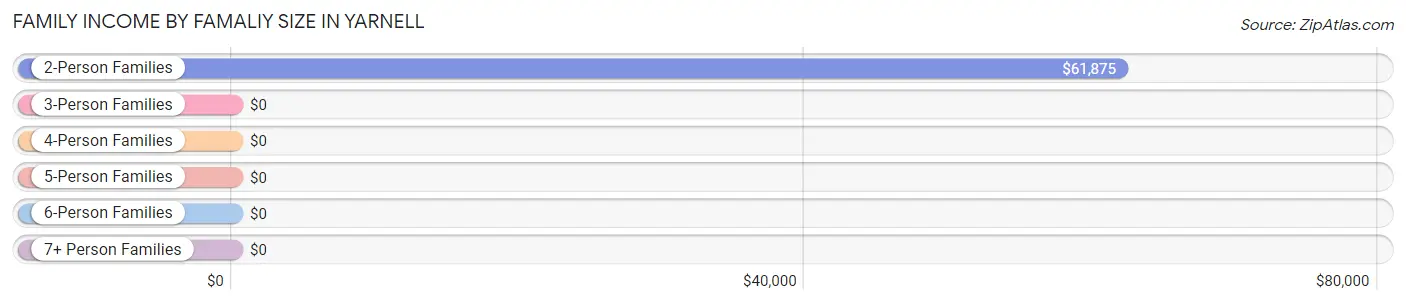
| Income Bracket | # Families | Median Income |
| 2-Person Families | 120 (89.5%) | $61,875 |
| 3-Person Families | 0 (0.0%) | $0 |
| 4-Person Families | 0 (0.0%) | $0 |
| 5-Person Families | 0 (0.0%) | $0 |
| 6-Person Families | 14 (10.4%) | $0 |
| 7+ Person Families | 0 (0.0%) | $0 |
| Total | 134 (100.0%) | $64,375 |
Family Income by Number of Earners in Yarnell
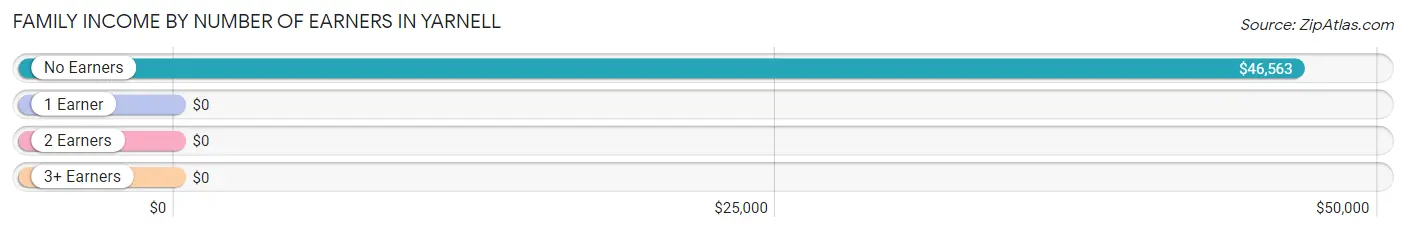
| Number of Earners | # Families | Median Income |
| No Earners | 72 (53.7%) | $46,563 |
| 1 Earner | 12 (9.0%) | $0 |
| 2 Earners | 36 (26.9%) | $0 |
| 3+ Earners | 14 (10.4%) | $0 |
| Total | 134 (100.0%) | $64,375 |
Household Income in Yarnell
Household Income Brackets in Yarnell
With 81 households falling in the category, the $35,000 to $49,999 income range is the most frequent in Yarnell, accounting for 22.1% of all households. In contrast, only 8 households (2.2%) fall into the $75,000 to $99,999 income bracket, making it the least populous group.
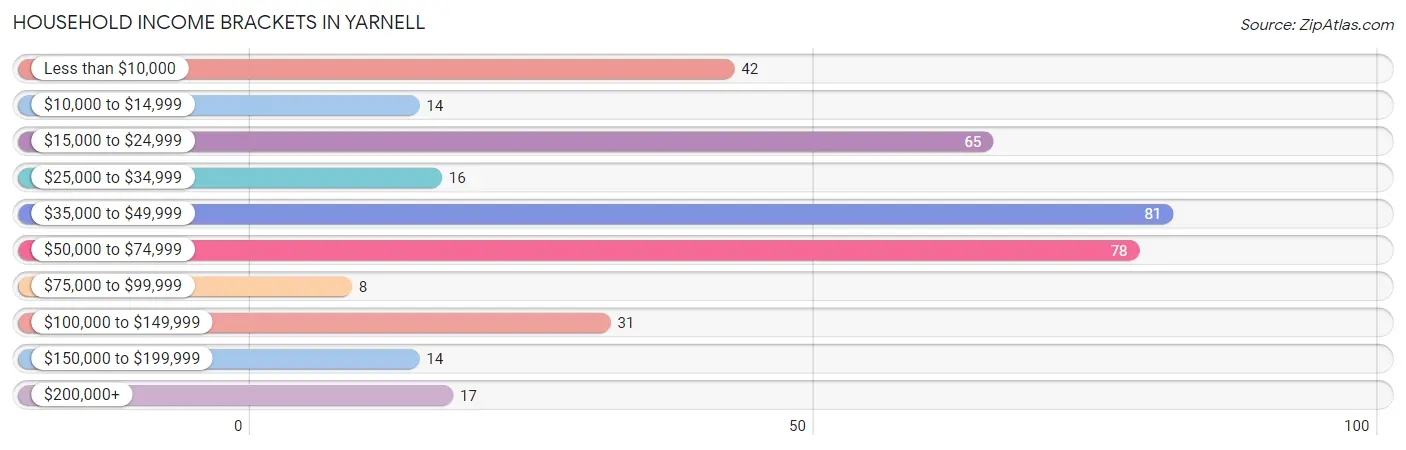
| Income Bracket | # Households | % Households |
| Less than $10,000 | 42 | 11.5% |
| $10,000 to $14,999 | 14 | 3.8% |
| $15,000 to $24,999 | 65 | 17.8% |
| $25,000 to $34,999 | 16 | 4.4% |
| $35,000 to $49,999 | 81 | 22.1% |
| $50,000 to $74,999 | 78 | 21.3% |
| $75,000 to $99,999 | 8 | 2.2% |
| $100,000 to $149,999 | 31 | 8.5% |
| $150,000 to $199,999 | 14 | 3.8% |
| $200,000+ | 17 | 4.6% |
Household Income by Householder Age in Yarnell
The median household income in Yarnell is $39,847, with the highest median household income of $74,398 found in the 45 to 64 years age bracket for the primary householder. A total of 137 households (37.4%) fall into this category.
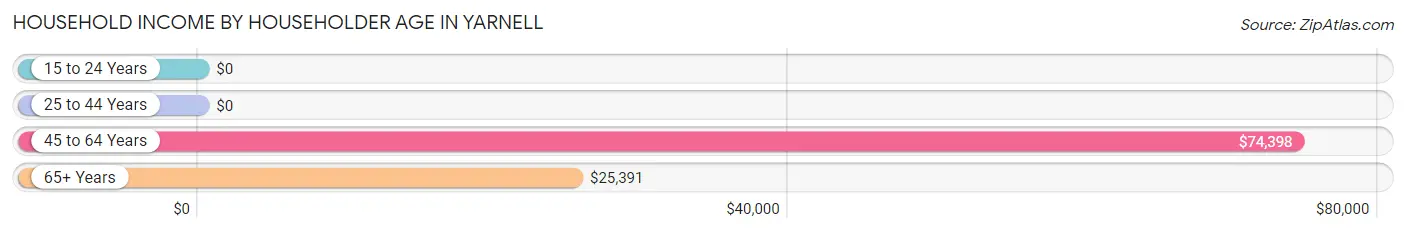
| Income Bracket | # Households | Median Income |
| 15 to 24 Years | 0 (0.0%) | $0 |
| 25 to 44 Years | 16 (4.4%) | $0 |
| 45 to 64 Years | 137 (37.4%) | $74,398 |
| 65+ Years | 213 (58.2%) | $25,391 |
| Total | 366 (100.0%) | $39,847 |
Poverty in Yarnell
Income Below Poverty by Sex and Age in Yarnell
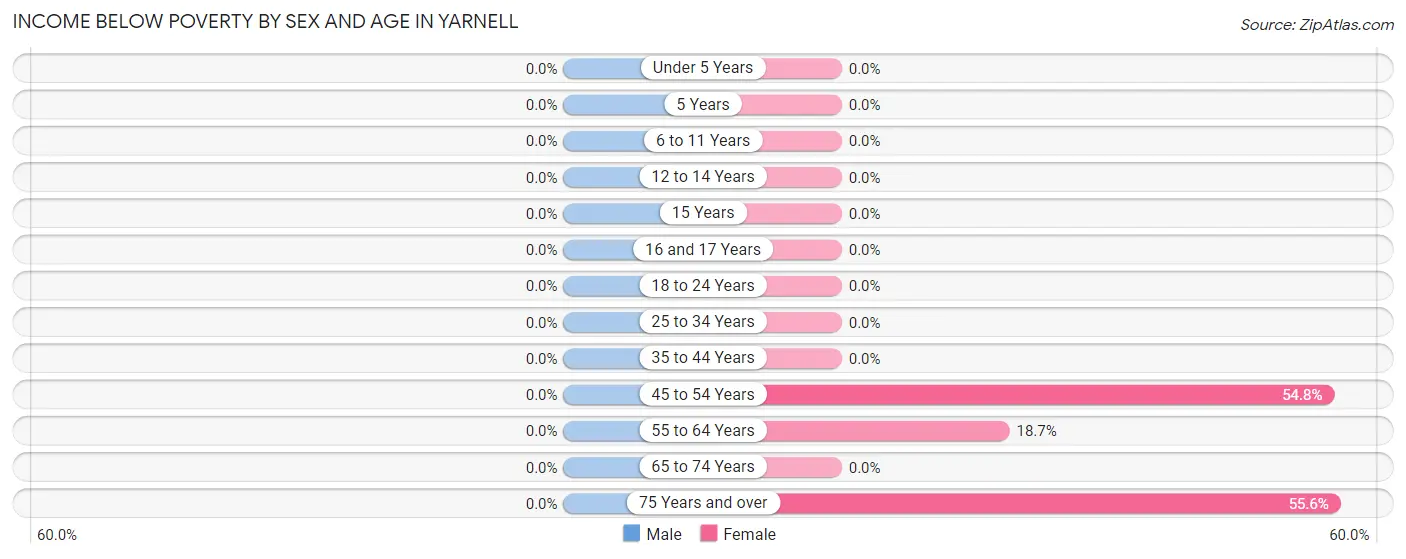
| Age Bracket | Male | Female |
| Under 5 Years | 0 (0.0%) | 0 (0.0%) |
| 5 Years | 0 (0.0%) | 0 (0.0%) |
| 6 to 11 Years | 0 (0.0%) | 0 (0.0%) |
| 12 to 14 Years | 0 (0.0%) | 0 (0.0%) |
| 15 Years | 0 (0.0%) | 0 (0.0%) |
| 16 and 17 Years | 0 (0.0%) | 0 (0.0%) |
| 18 to 24 Years | 0 (0.0%) | 0 (0.0%) |
| 25 to 34 Years | 0 (0.0%) | 0 (0.0%) |
| 35 to 44 Years | 0 (0.0%) | 0 (0.0%) |
| 45 to 54 Years | 0 (0.0%) | 17 (54.8%) |
| 55 to 64 Years | 0 (0.0%) | 17 (18.7%) |
| 65 to 74 Years | 0 (0.0%) | 0 (0.0%) |
| 75 Years and over | 0 (0.0%) | 25 (55.6%) |
| Total | 0 (0.0%) | 59 (21.2%) |
Income Above Poverty by Sex and Age in Yarnell
According to the poverty statistics in Yarnell, males aged 12 to 14 years and females aged 16 and 17 years are the age groups that are most secure financially, with 100.0% of males and 100.0% of females in these age groups living above the poverty line.
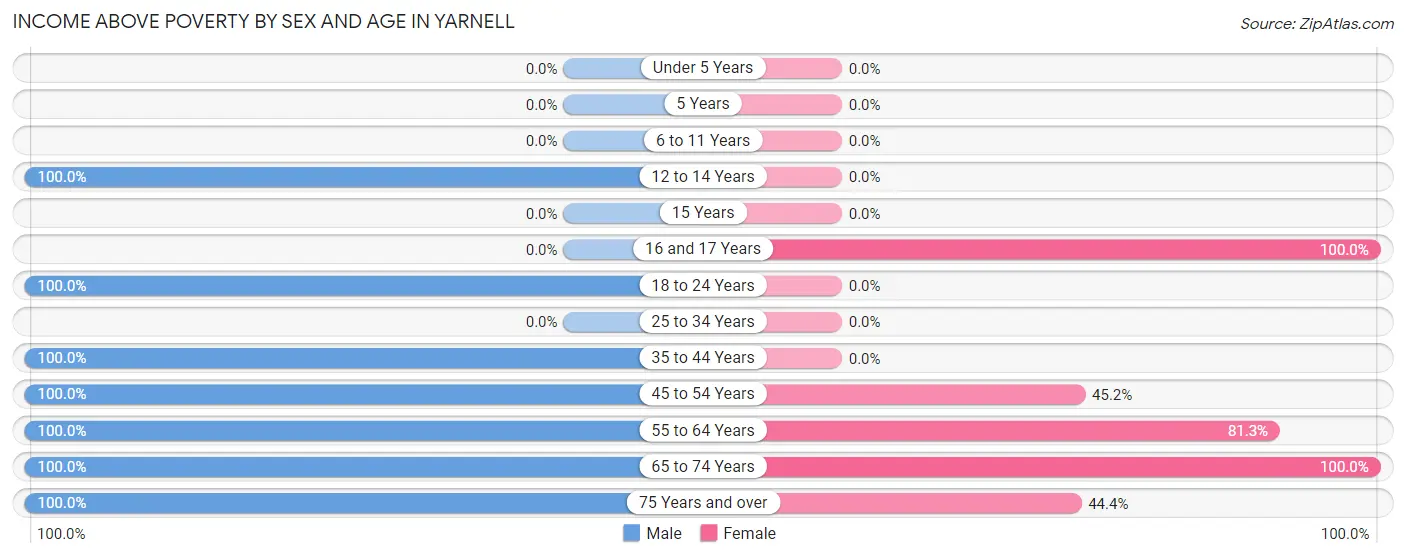
| Age Bracket | Male | Female |
| Under 5 Years | 0 (0.0%) | 0 (0.0%) |
| 5 Years | 0 (0.0%) | 0 (0.0%) |
| 6 to 11 Years | 0 (0.0%) | 0 (0.0%) |
| 12 to 14 Years | 32 (100.0%) | 0 (0.0%) |
| 15 Years | 0 (0.0%) | 0 (0.0%) |
| 16 and 17 Years | 0 (0.0%) | 18 (100.0%) |
| 18 to 24 Years | 16 (100.0%) | 0 (0.0%) |
| 25 to 34 Years | 0 (0.0%) | 0 (0.0%) |
| 35 to 44 Years | 16 (100.0%) | 0 (0.0%) |
| 45 to 54 Years | 67 (100.0%) | 14 (45.2%) |
| 55 to 64 Years | 24 (100.0%) | 74 (81.3%) |
| 65 to 74 Years | 104 (100.0%) | 93 (100.0%) |
| 75 Years and over | 42 (100.0%) | 20 (44.4%) |
| Total | 301 (100.0%) | 219 (78.8%) |
Income Below Poverty Among Married-Couple Families in Yarnell
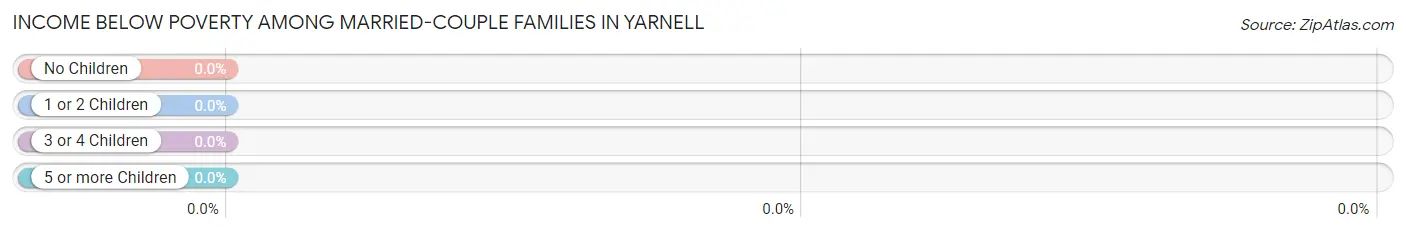
| Children | Above Poverty | Below Poverty |
| No Children | 104 (100.0%) | 0 (0.0%) |
| 1 or 2 Children | 0 (0.0%) | 0 (0.0%) |
| 3 or 4 Children | 14 (100.0%) | 0 (0.0%) |
| 5 or more Children | 0 (0.0%) | 0 (0.0%) |
| Total | 118 (100.0%) | 0 (0.0%) |
Income Below Poverty Among Single-Parent Households in Yarnell
| Children | Single Father | Single Mother |
| No Children | 0 (0.0%) | 0 (0.0%) |
| 1 or 2 Children | 0 (0.0%) | 0 (0.0%) |
| 3 or 4 Children | 0 (0.0%) | 0 (0.0%) |
| 5 or more Children | 0 (0.0%) | 0 (0.0%) |
| Total | 0 (0.0%) | 0 (0.0%) |
Income Below Poverty Among Married-Couple vs Single-Parent Households in Yarnell
| Children | Married-Couple Families | Single-Parent Households |
| No Children | 0 (0.0%) | 0 (0.0%) |
| 1 or 2 Children | 0 (0.0%) | 0 (0.0%) |
| 3 or 4 Children | 0 (0.0%) | 0 (0.0%) |
| 5 or more Children | 0 (0.0%) | 0 (0.0%) |
| Total | 0 (0.0%) | 0 (0.0%) |
Race in Yarnell
The most populous races in Yarnell are White / Caucasian (562 | 97.1%), Hispanic or Latino (17 | 2.9%), and Two or more Races (17 | 2.9%).
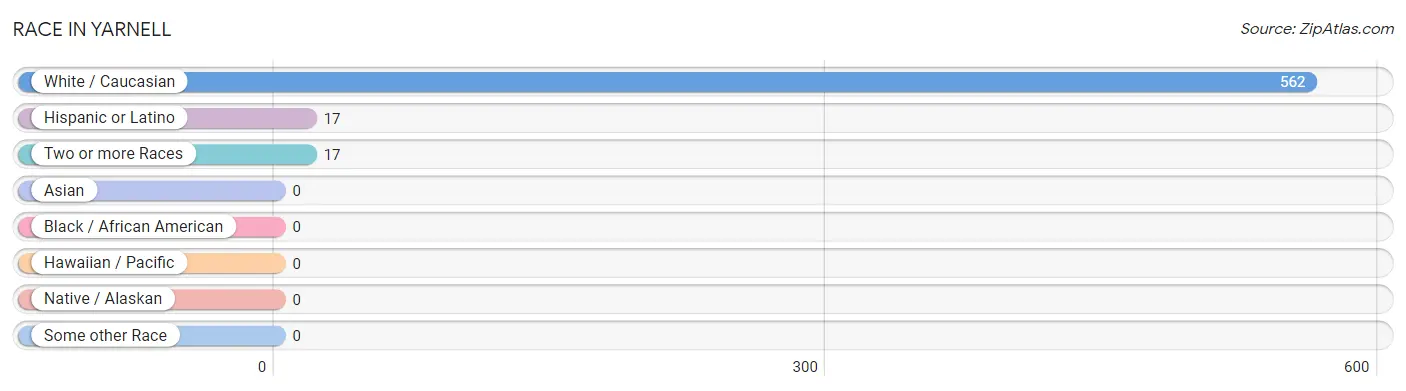
| Race | # Population | % Population |
| Asian | 0 | 0.0% |
| Black / African American | 0 | 0.0% |
| Hawaiian / Pacific | 0 | 0.0% |
| Hispanic or Latino | 17 | 2.9% |
| Native / Alaskan | 0 | 0.0% |
| White / Caucasian | 562 | 97.1% |
| Two or more Races | 17 | 2.9% |
| Some other Race | 0 | 0.0% |
| Total | 579 | 100.0% |
Ancestry in Yarnell
The most populous ancestries reported in Yarnell are English (262 | 45.3%), German (245 | 42.3%), Irish (91 | 15.7%), Norwegian (29 | 5.0%), and French (25 | 4.3%), together accounting for 112.6% of all Yarnell residents.
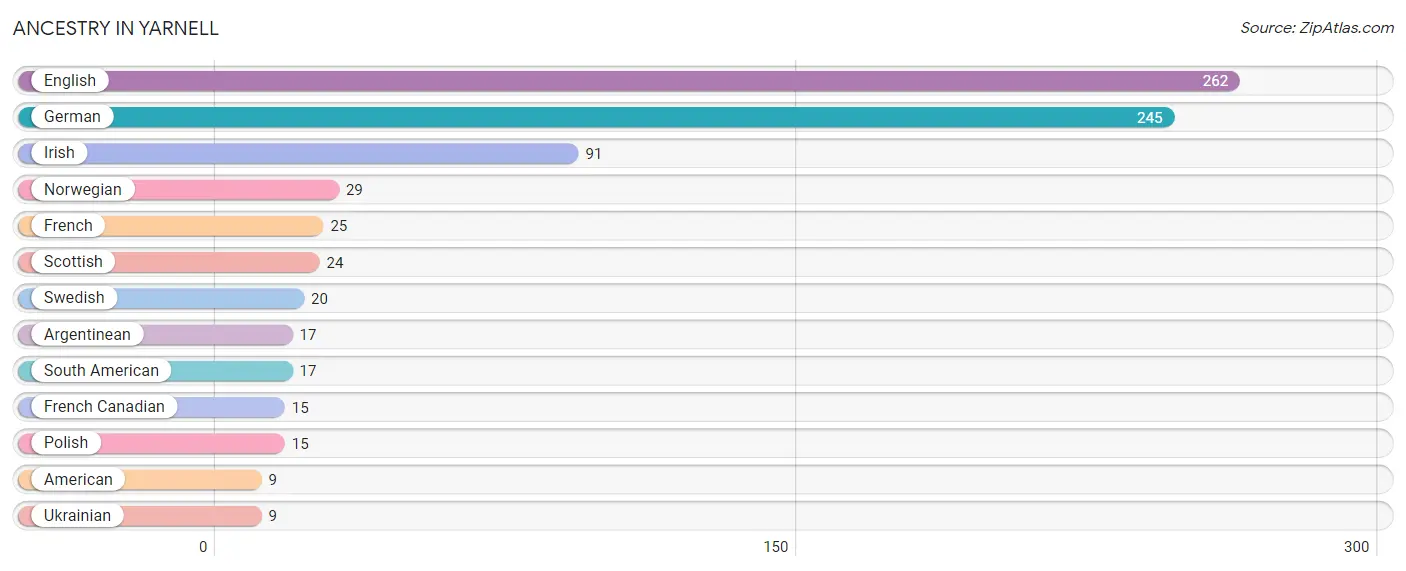
| Ancestry | # Population | % Population |
| American | 9 | 1.5% |
| Argentinean | 17 | 2.9% |
| English | 262 | 45.3% |
| French | 25 | 4.3% |
| French Canadian | 15 | 2.6% |
| German | 245 | 42.3% |
| Irish | 91 | 15.7% |
| Norwegian | 29 | 5.0% |
| Polish | 15 | 2.6% |
| Scottish | 24 | 4.2% |
| South American | 17 | 2.9% |
| Swedish | 20 | 3.5% |
| Ukrainian | 9 | 1.5% | View All 13 Rows |
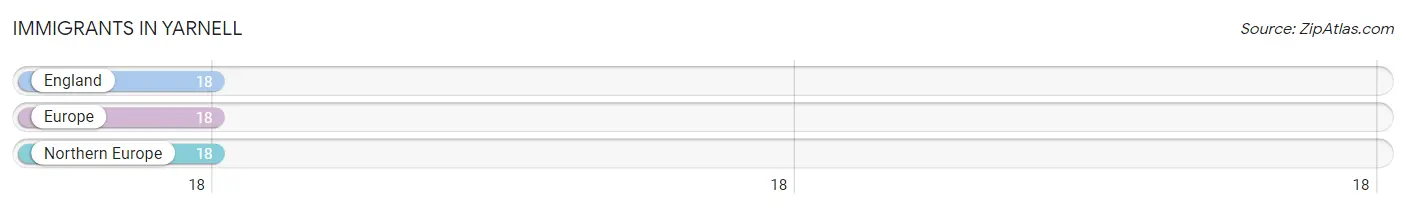
Immigrants in Yarnell
The most numerous immigrant groups reported in Yarnell came from England (18 | 3.1%), Europe (18 | 3.1%), and Northern Europe (18 | 3.1%), together accounting for 9.3% of all Yarnell residents.
| Immigration Origin | # Population | % Population |
| England | 18 | 3.1% |
| Europe | 18 | 3.1% |
| Northern Europe | 18 | 3.1% | View All 3 Rows |
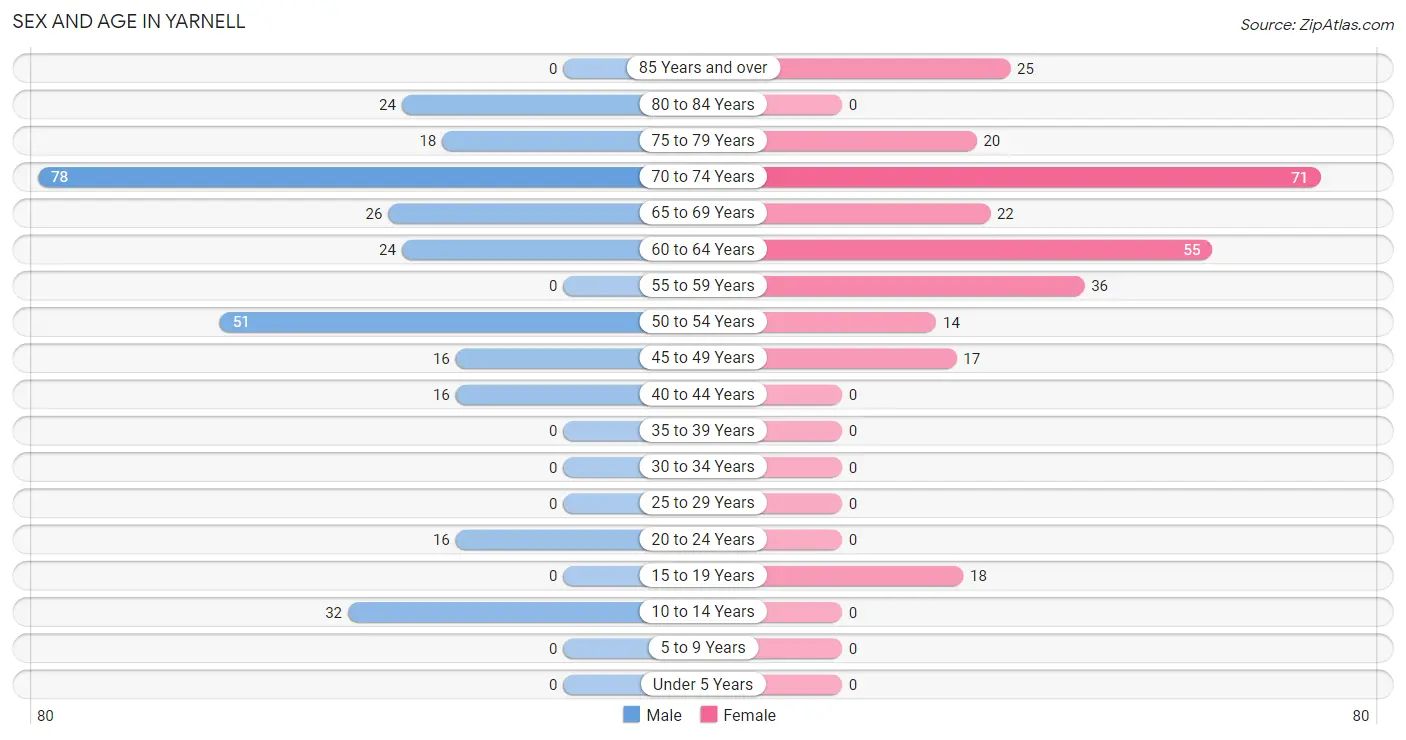
Sex and Age in Yarnell
Sex and Age in Yarnell
The most populous age groups in Yarnell are 70 to 74 Years (78 | 25.9%) for men and 70 to 74 Years (71 | 25.5%) for women.
| Age Bracket | Male | Female |
| Under 5 Years | 0 (0.0%) | 0 (0.0%) |
| 5 to 9 Years | 0 (0.0%) | 0 (0.0%) |
| 10 to 14 Years | 32 (10.6%) | 0 (0.0%) |
| 15 to 19 Years | 0 (0.0%) | 18 (6.5%) |
| 20 to 24 Years | 16 (5.3%) | 0 (0.0%) |
| 25 to 29 Years | 0 (0.0%) | 0 (0.0%) |
| 30 to 34 Years | 0 (0.0%) | 0 (0.0%) |
| 35 to 39 Years | 0 (0.0%) | 0 (0.0%) |
| 40 to 44 Years | 16 (5.3%) | 0 (0.0%) |
| 45 to 49 Years | 16 (5.3%) | 17 (6.1%) |
| 50 to 54 Years | 51 (16.9%) | 14 (5.0%) |
| 55 to 59 Years | 0 (0.0%) | 36 (13.0%) |
| 60 to 64 Years | 24 (8.0%) | 55 (19.8%) |
| 65 to 69 Years | 26 (8.6%) | 22 (7.9%) |
| 70 to 74 Years | 78 (25.9%) | 71 (25.5%) |
| 75 to 79 Years | 18 (6.0%) | 20 (7.2%) |
| 80 to 84 Years | 24 (8.0%) | 0 (0.0%) |
| 85 Years and over | 0 (0.0%) | 25 (9.0%) |
| Total | 301 (100.0%) | 278 (100.0%) |
Families and Households in Yarnell
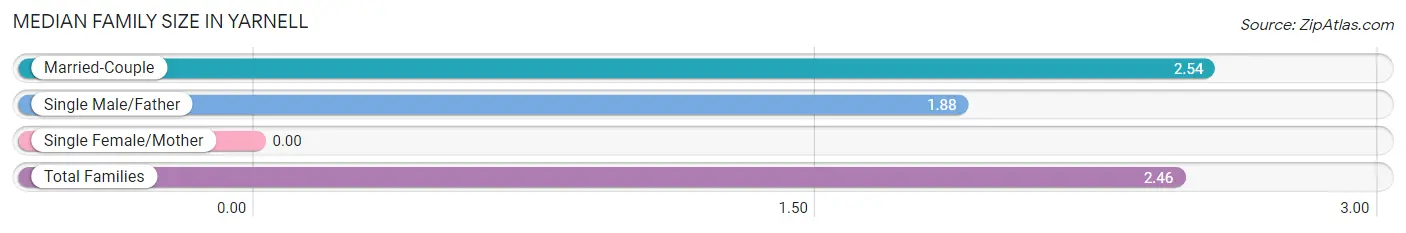
Median Family Size in Yarnell
| Family Type | # Families | Family Size |
| Married-Couple | 118 (88.1%) | 2.54 |
| Single Male/Father | 16 (11.9%) | 1.88 |
| Single Female/Mother | 0 (0.0%) | - |
| Total Families | 134 (100.0%) | 2.46 |
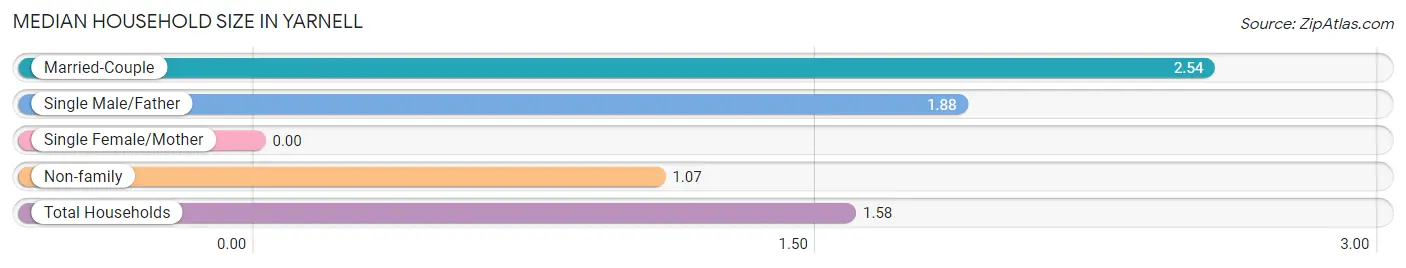
Median Household Size in Yarnell
| Household Type | # Households | Household Size |
| Married-Couple | 118 (32.2%) | 2.54 |
| Single Male/Father | 16 (4.4%) | 1.88 |
| Single Female/Mother | 0 (0.0%) | - |
| Non-family | 232 (63.4%) | 1.07 |
| Total Households | 366 (100.0%) | 1.58 |
Household Size by Marriage Status in Yarnell
Out of a total of 366 households in Yarnell, 134 (36.6%) are family households, while 232 (63.4%) are nonfamily households. The most numerous type of family households are 2-person households, comprising 120, and the most common type of nonfamily households are 1-person households, comprising 216.
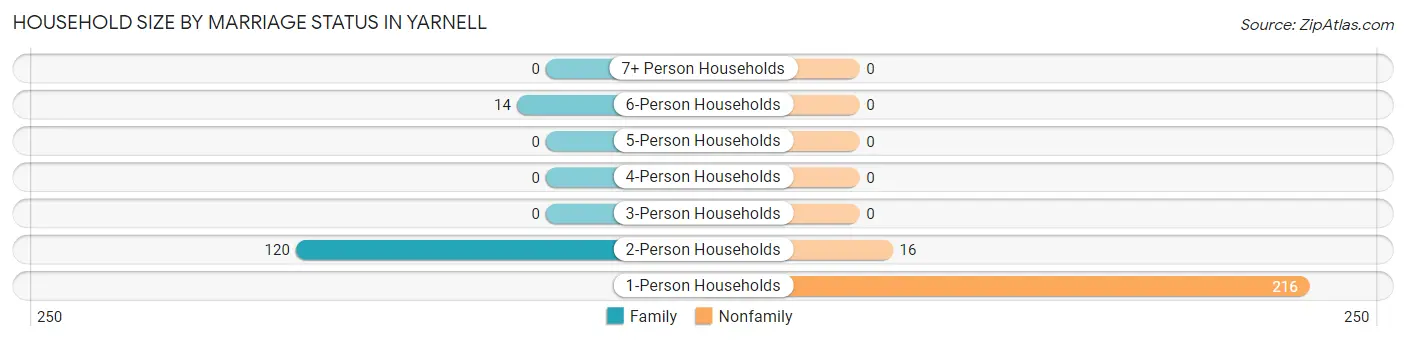
| Household Size | Family Households | Nonfamily Households |
| 1-Person Households | - | 216 (59.0%) |
| 2-Person Households | 120 (32.8%) | 16 (4.4%) |
| 3-Person Households | 0 (0.0%) | 0 (0.0%) |
| 4-Person Households | 0 (0.0%) | 0 (0.0%) |
| 5-Person Households | 0 (0.0%) | 0 (0.0%) |
| 6-Person Households | 14 (3.8%) | 0 (0.0%) |
| 7+ Person Households | 0 (0.0%) | 0 (0.0%) |
| Total | 134 (36.6%) | 232 (63.4%) |
Female Fertility in Yarnell
Fertility by Age in Yarnell
| Age Bracket | Women with Births | Births / 1,000 Women |
| 15 to 19 years | 0 (0.0%) | 0.0 |
| 20 to 34 years | 0 (0.0%) | 0.0 |
| 35 to 50 years | 0 (0.0%) | 0.0 |
| Total | 0 (0.0%) | 0.0 |
Fertility by Age by Marriage Status in Yarnell
| Age Bracket | Married | Unmarried |
| 15 to 19 years | 0 (0.0%) | 0 (0.0%) |
| 20 to 34 years | 0 (0.0%) | 0 (0.0%) |
| 35 to 50 years | 0 (0.0%) | 0 (0.0%) |
| Total | 0 (0.0%) | 0 (0.0%) |
Fertility by Education in Yarnell
| Educational Attainment | Women with Births | Births / 1,000 Women |
| Less than High School | 0 (0.0%) | 0.0 |
| High School Diploma | 0 (0.0%) | 0.0 |
| College or Associate's Degree | 0 (0.0%) | 0.0 |
| Bachelor's Degree | 0 (0.0%) | 0.0 |
| Graduate Degree | 0 (0.0%) | 0.0 |
| Total | 0 (0.0%) | 0.0 |
Fertility by Education by Marriage Status in Yarnell
| Educational Attainment | Married | Unmarried |
| Less than High School | 0 (0.0%) | 0 (0.0%) |
| High School Diploma | 0 (0.0%) | 0 (0.0%) |
| College or Associate's Degree | 0 (0.0%) | 0 (0.0%) |
| Bachelor's Degree | 0 (0.0%) | 0 (0.0%) |
| Graduate Degree | 0 (0.0%) | 0 (0.0%) |
| Total | 0 (0.0%) | 0 (0.0%) |
Employment Characteristics in Yarnell
Employment by Class of Employer in Yarnell
Among the 177 employed individuals in Yarnell, self-employed (not incorporated) (95 | 53.7%), private company employees (48 | 27.1%), and state government employees (20 | 11.3%) make up the most common classes of employment.
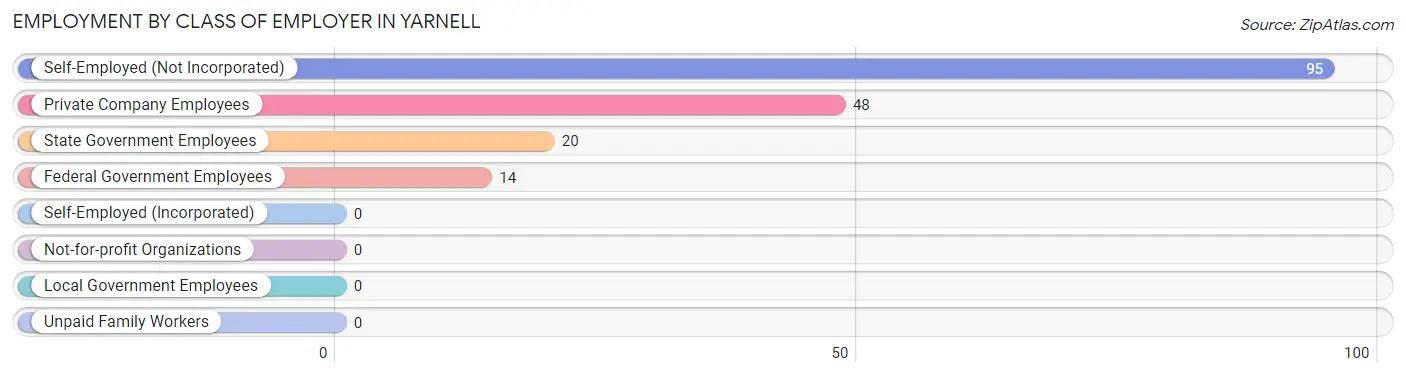
| Employer Class | # Employees | % Employees |
| Private Company Employees | 48 | 27.1% |
| Self-Employed (Incorporated) | 0 | 0.0% |
| Self-Employed (Not Incorporated) | 95 | 53.7% |
| Not-for-profit Organizations | 0 | 0.0% |
| Local Government Employees | 0 | 0.0% |
| State Government Employees | 20 | 11.3% |
| Federal Government Employees | 14 | 7.9% |
| Unpaid Family Workers | 0 | 0.0% |
| Total | 177 | 100.0% |
Employment Status by Age in Yarnell
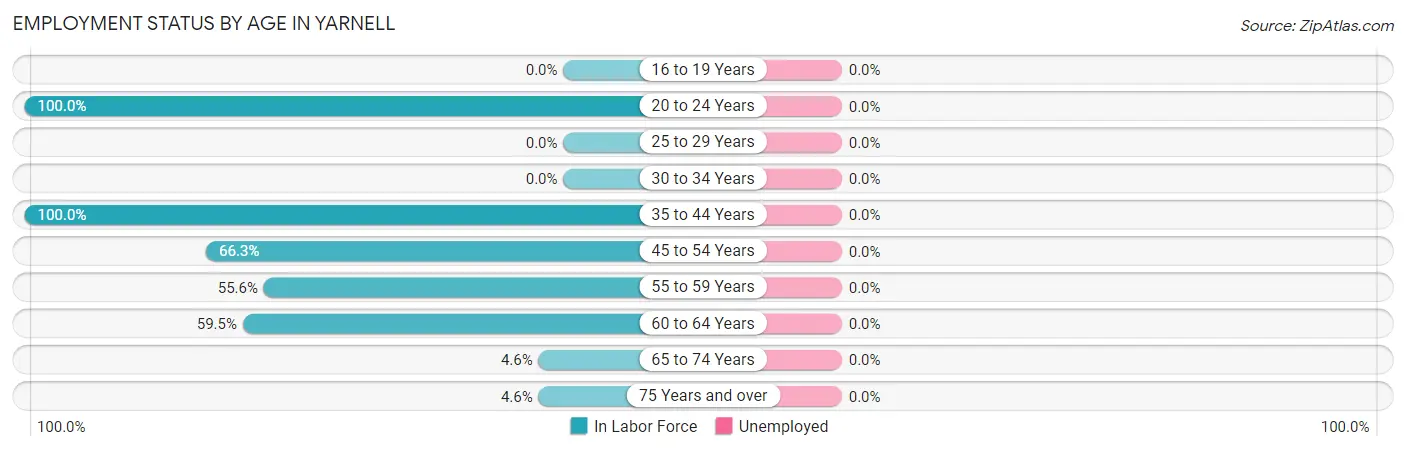
| Age Bracket | In Labor Force | Unemployed |
| 16 to 19 Years | 0 (0.0%) | 0 (0.0%) |
| 20 to 24 Years | 16 (100.0%) | 0 (0.0%) |
| 25 to 29 Years | 0 (0.0%) | 0 (0.0%) |
| 30 to 34 Years | 0 (0.0%) | 0 (0.0%) |
| 35 to 44 Years | 16 (100.0%) | 0 (0.0%) |
| 45 to 54 Years | 65 (66.3%) | 0 (0.0%) |
| 55 to 59 Years | 20 (55.6%) | 0 (0.0%) |
| 60 to 64 Years | 47 (59.5%) | 0 (0.0%) |
| 65 to 74 Years | 9 (4.6%) | 0 (0.0%) |
| 75 Years and over | 4 (4.6%) | 0 (0.0%) |
| Total | 177 (32.4%) | 0 (0.0%) |
Employment Status by Educational Attainment in Yarnell
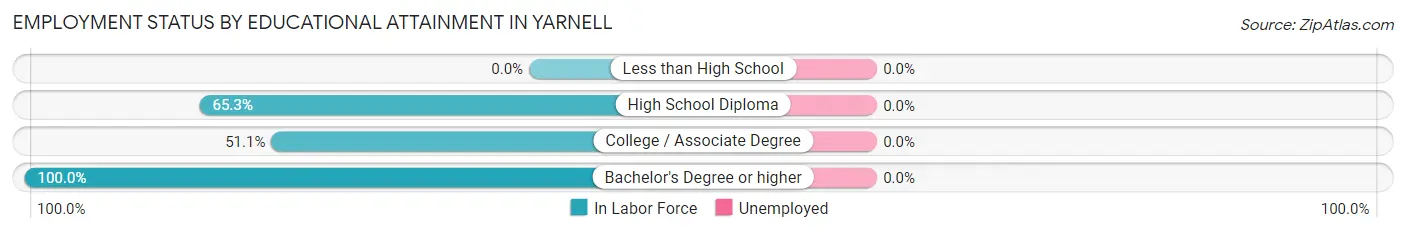
| Educational Attainment | In Labor Force | Unemployed |
| Less than High School | 0 (0.0%) | 0 (0.0%) |
| High School Diploma | 32 (65.3%) | 0 (0.0%) |
| College / Associate Degree | 67 (51.1%) | 0 (0.0%) |
| Bachelor's Degree or higher | 49 (100.0%) | 0 (0.0%) |
| Total | 148 (64.6%) | 0 (0.0%) |
Employment Occupations by Sex in Yarnell
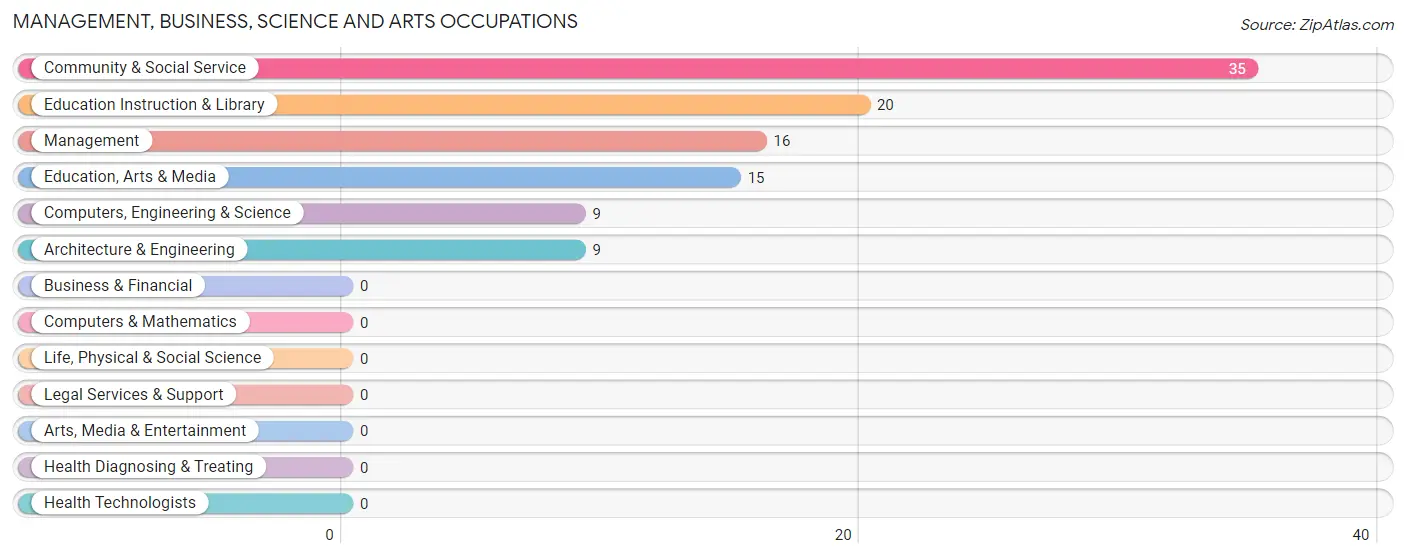
Management, Business, Science and Arts Occupations
The most common Management, Business, Science and Arts occupations in Yarnell are Community & Social Service (35 | 19.8%), Education Instruction & Library (20 | 11.3%), Management (16 | 9.0%), Education, Arts & Media (15 | 8.5%), and Computers, Engineering & Science (9 | 5.1%).
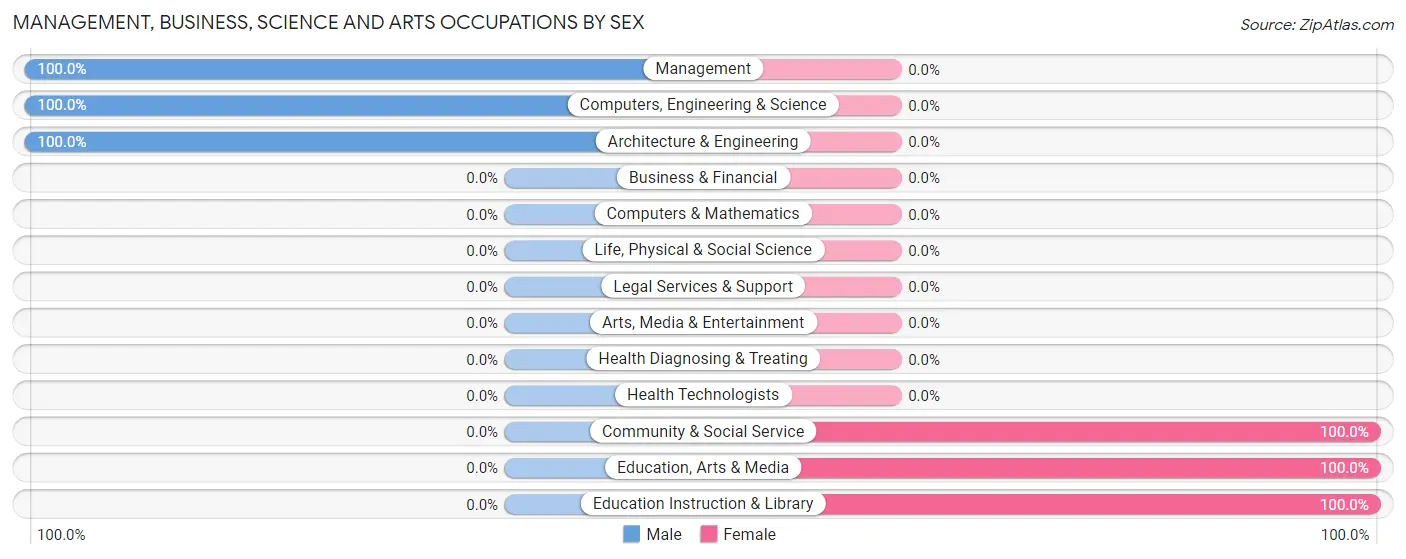
Management, Business, Science and Arts Occupations by Sex
Within the Management, Business, Science and Arts occupations in Yarnell, the most male-oriented occupations are Management (100.0%), Computers, Engineering & Science (100.0%), and Architecture & Engineering (100.0%), while the most female-oriented occupations are Community & Social Service (100.0%), Education, Arts & Media (100.0%), and Education Instruction & Library (100.0%).
| Occupation | Male | Female |
| Management | 16 (100.0%) | 0 (0.0%) |
| Business & Financial | 0 (0.0%) | 0 (0.0%) |
| Computers, Engineering & Science | 9 (100.0%) | 0 (0.0%) |
| Computers & Mathematics | 0 (0.0%) | 0 (0.0%) |
| Architecture & Engineering | 9 (100.0%) | 0 (0.0%) |
| Life, Physical & Social Science | 0 (0.0%) | 0 (0.0%) |
| Community & Social Service | 0 (0.0%) | 35 (100.0%) |
| Education, Arts & Media | 0 (0.0%) | 15 (100.0%) |
| Legal Services & Support | 0 (0.0%) | 0 (0.0%) |
| Education Instruction & Library | 0 (0.0%) | 20 (100.0%) |
| Arts, Media & Entertainment | 0 (0.0%) | 0 (0.0%) |
| Health Diagnosing & Treating | 0 (0.0%) | 0 (0.0%) |
| Health Technologists | 0 (0.0%) | 0 (0.0%) |
| Total (Category) | 25 (41.7%) | 35 (58.3%) |
| Total (Overall) | 113 (63.8%) | 64 (36.2%) |
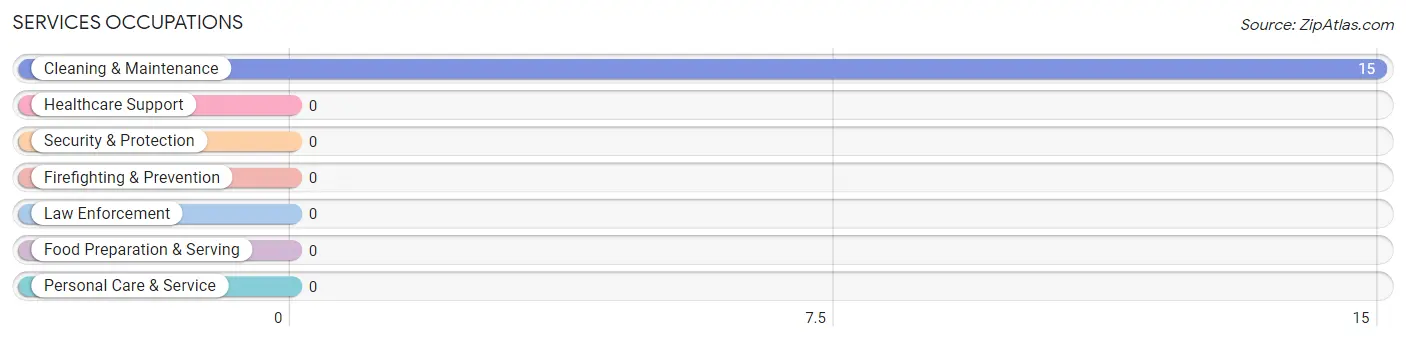
Services Occupations
The most common Services occupations in Yarnell are , and Cleaning & Maintenance (15 | 8.5%).
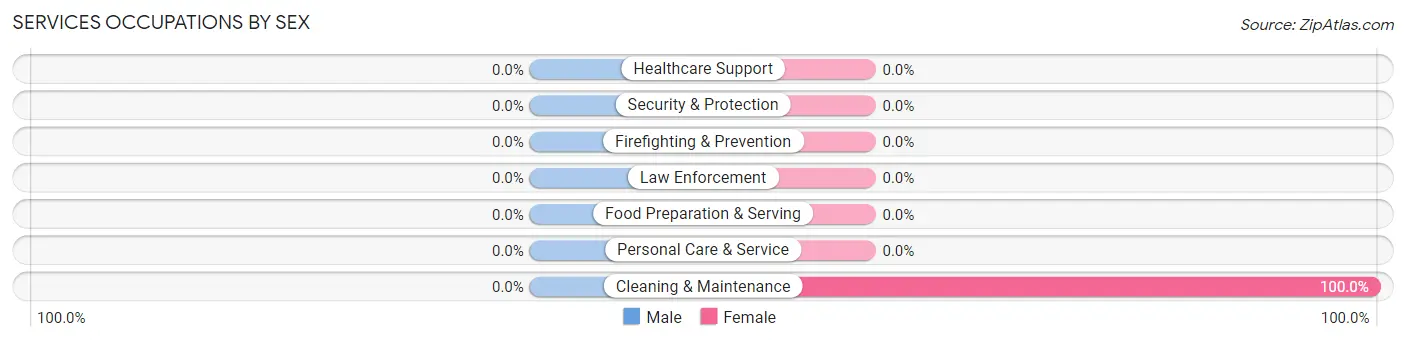
Services Occupations by Sex
| Occupation | Male | Female |
| Healthcare Support | 0 (0.0%) | 0 (0.0%) |
| Security & Protection | 0 (0.0%) | 0 (0.0%) |
| Firefighting & Prevention | 0 (0.0%) | 0 (0.0%) |
| Law Enforcement | 0 (0.0%) | 0 (0.0%) |
| Food Preparation & Serving | 0 (0.0%) | 0 (0.0%) |
| Cleaning & Maintenance | 0 (0.0%) | 15 (100.0%) |
| Personal Care & Service | 0 (0.0%) | 0 (0.0%) |
| Total (Category) | 0 (0.0%) | 15 (100.0%) |
| Total (Overall) | 113 (63.8%) | 64 (36.2%) |
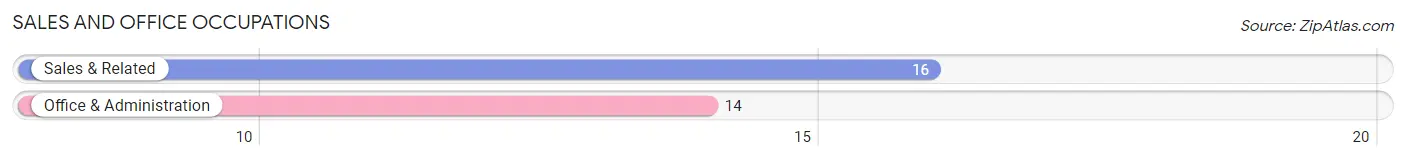
Sales and Office Occupations
The most common Sales and Office occupations in Yarnell are Sales & Related (16 | 9.0%), and Office & Administration (14 | 7.9%).
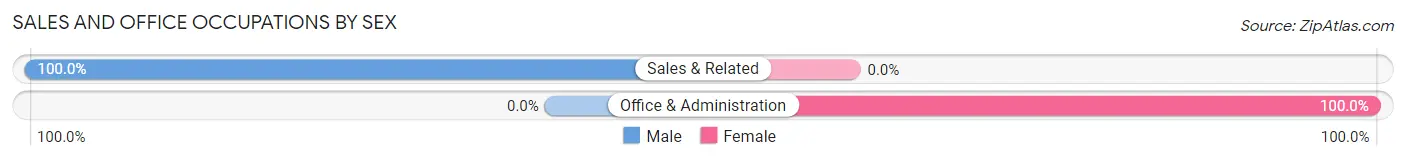
Sales and Office Occupations by Sex
| Occupation | Male | Female |
| Sales & Related | 16 (100.0%) | 0 (0.0%) |
| Office & Administration | 0 (0.0%) | 14 (100.0%) |
| Total (Category) | 16 (53.3%) | 14 (46.7%) |
| Total (Overall) | 113 (63.8%) | 64 (36.2%) |
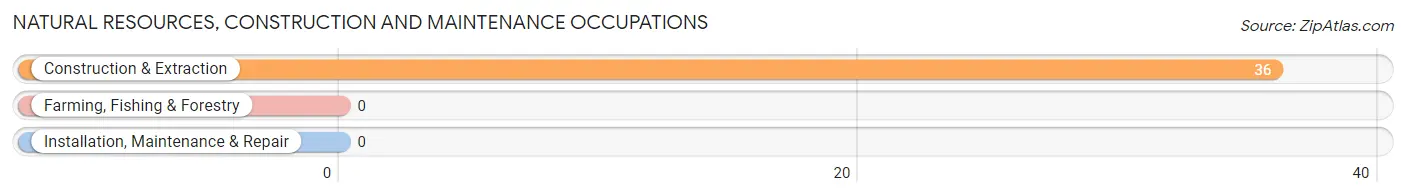
Natural Resources, Construction and Maintenance Occupations
The most common Natural Resources, Construction and Maintenance occupations in Yarnell are , and Construction & Extraction (36 | 20.3%).
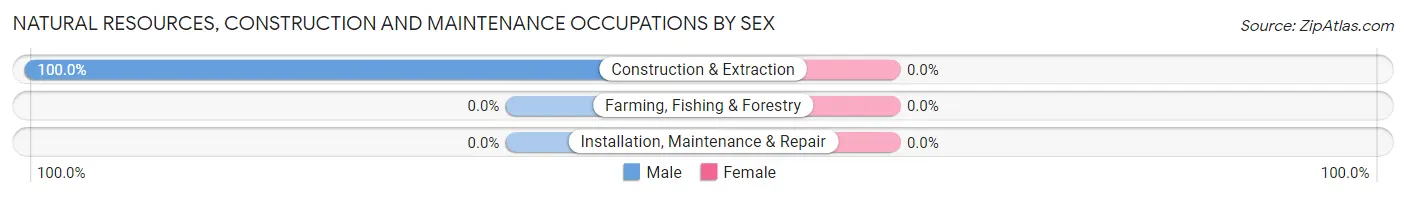
Natural Resources, Construction and Maintenance Occupations by Sex
| Occupation | Male | Female |
| Farming, Fishing & Forestry | 0 (0.0%) | 0 (0.0%) |
| Construction & Extraction | 36 (100.0%) | 0 (0.0%) |
| Installation, Maintenance & Repair | 0 (0.0%) | 0 (0.0%) |
| Total (Category) | 36 (100.0%) | 0 (0.0%) |
| Total (Overall) | 113 (63.8%) | 64 (36.2%) |
Production, Transportation and Moving Occupations
The most common Production, Transportation and Moving occupations in Yarnell are Production (32 | 18.1%), and Material Moving (4 | 2.3%).
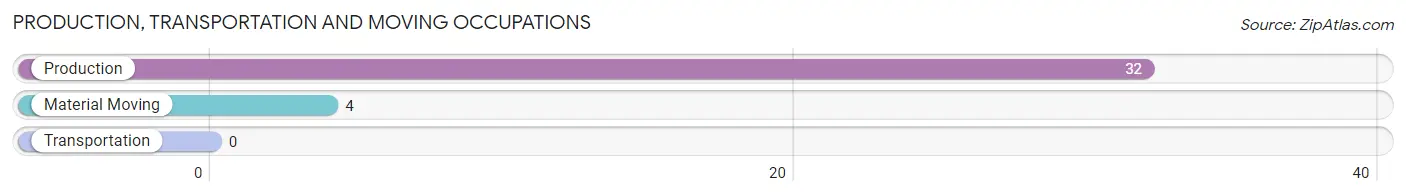
Production, Transportation and Moving Occupations by Sex
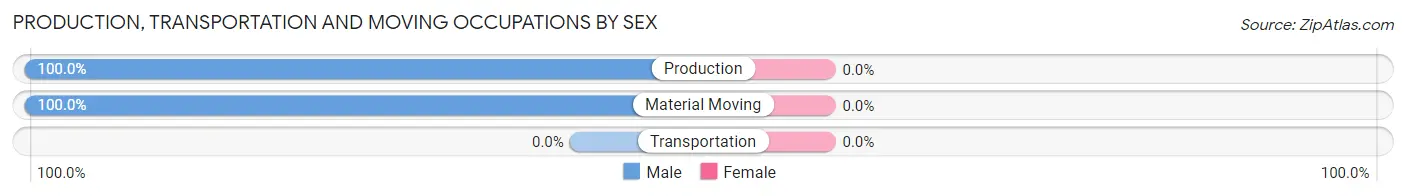
| Occupation | Male | Female |
| Production | 32 (100.0%) | 0 (0.0%) |
| Transportation | 0 (0.0%) | 0 (0.0%) |
| Material Moving | 4 (100.0%) | 0 (0.0%) |
| Total (Category) | 36 (100.0%) | 0 (0.0%) |
| Total (Overall) | 113 (63.8%) | 64 (36.2%) |
Employment Industries by Sex in Yarnell
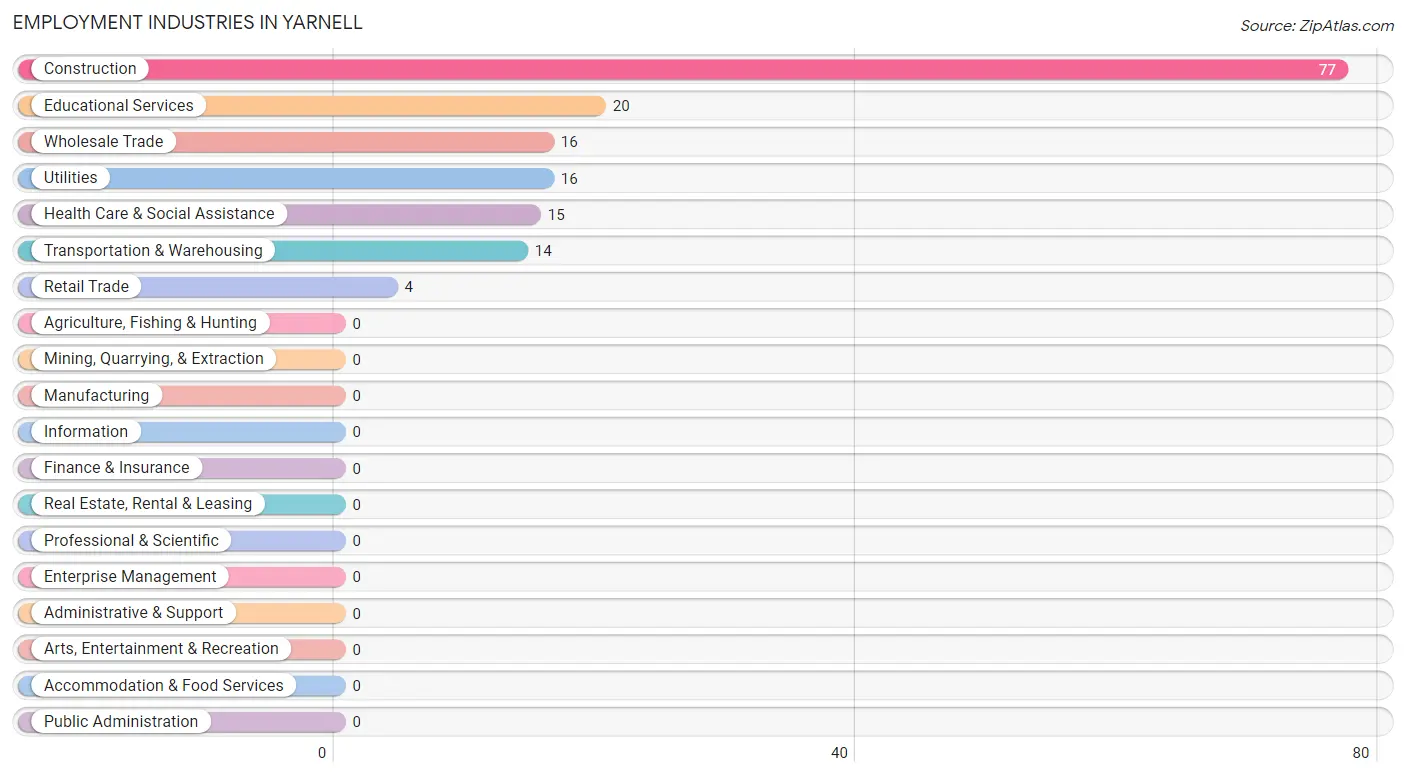
Employment Industries in Yarnell
The major employment industries in Yarnell include Construction (77 | 43.5%), Educational Services (20 | 11.3%), Wholesale Trade (16 | 9.0%), Utilities (16 | 9.0%), and Health Care & Social Assistance (15 | 8.5%).
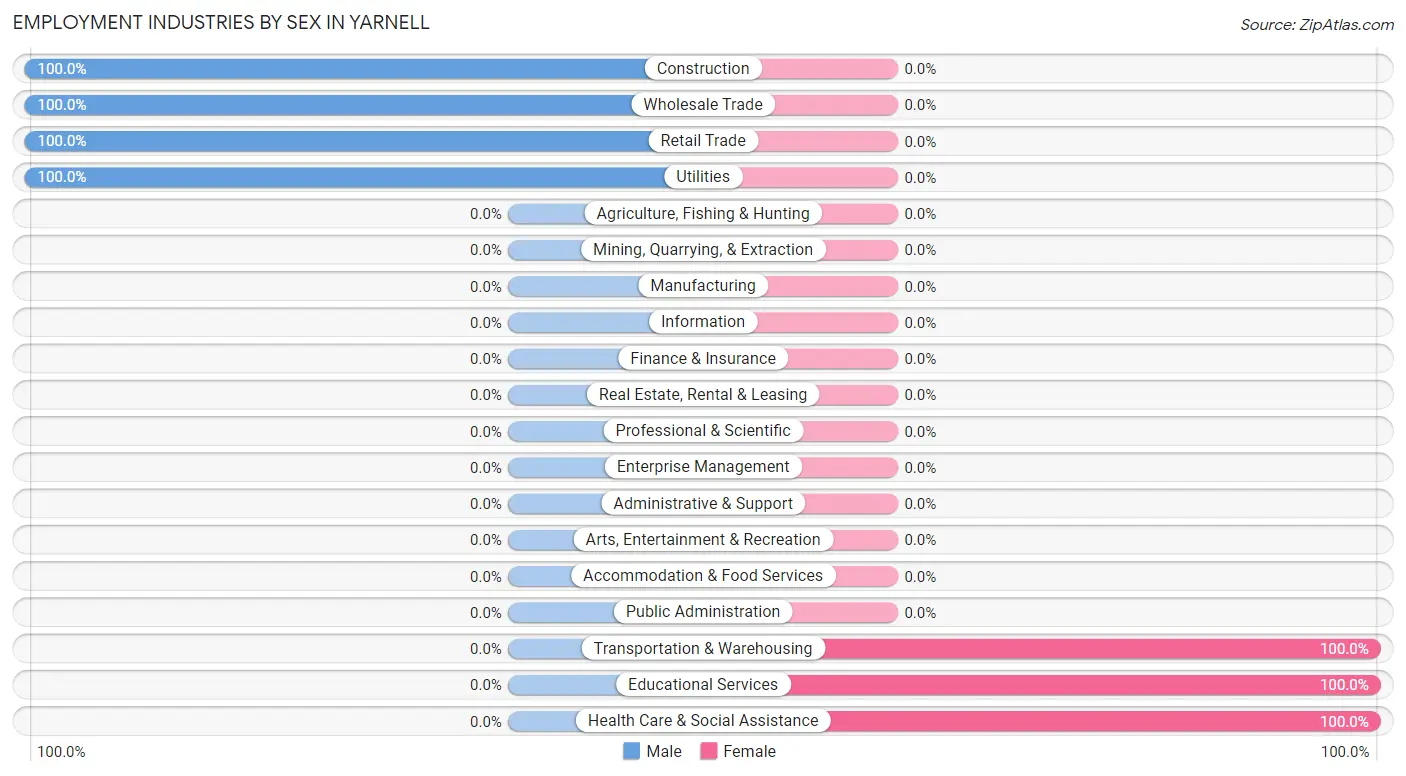
Employment Industries by Sex in Yarnell
The Yarnell industries that see more men than women are Construction (100.0%), Wholesale Trade (100.0%), and Retail Trade (100.0%), whereas the industries that tend to have a higher number of women are Transportation & Warehousing (100.0%), Educational Services (100.0%), and Health Care & Social Assistance (100.0%).
| Industry | Male | Female |
| Agriculture, Fishing & Hunting | 0 (0.0%) | 0 (0.0%) |
| Mining, Quarrying, & Extraction | 0 (0.0%) | 0 (0.0%) |
| Construction | 77 (100.0%) | 0 (0.0%) |
| Manufacturing | 0 (0.0%) | 0 (0.0%) |
| Wholesale Trade | 16 (100.0%) | 0 (0.0%) |
| Retail Trade | 4 (100.0%) | 0 (0.0%) |
| Transportation & Warehousing | 0 (0.0%) | 14 (100.0%) |
| Utilities | 16 (100.0%) | 0 (0.0%) |
| Information | 0 (0.0%) | 0 (0.0%) |
| Finance & Insurance | 0 (0.0%) | 0 (0.0%) |
| Real Estate, Rental & Leasing | 0 (0.0%) | 0 (0.0%) |
| Professional & Scientific | 0 (0.0%) | 0 (0.0%) |
| Enterprise Management | 0 (0.0%) | 0 (0.0%) |
| Administrative & Support | 0 (0.0%) | 0 (0.0%) |
| Educational Services | 0 (0.0%) | 20 (100.0%) |
| Health Care & Social Assistance | 0 (0.0%) | 15 (100.0%) |
| Arts, Entertainment & Recreation | 0 (0.0%) | 0 (0.0%) |
| Accommodation & Food Services | 0 (0.0%) | 0 (0.0%) |
| Public Administration | 0 (0.0%) | 0 (0.0%) |
| Total | 113 (63.8%) | 64 (36.2%) |
Education in Yarnell
School Enrollment in Yarnell
The most common levels of schooling among the 50 students in Yarnell are middle school (32 | 64.0%), and high school (18 | 36.0%).
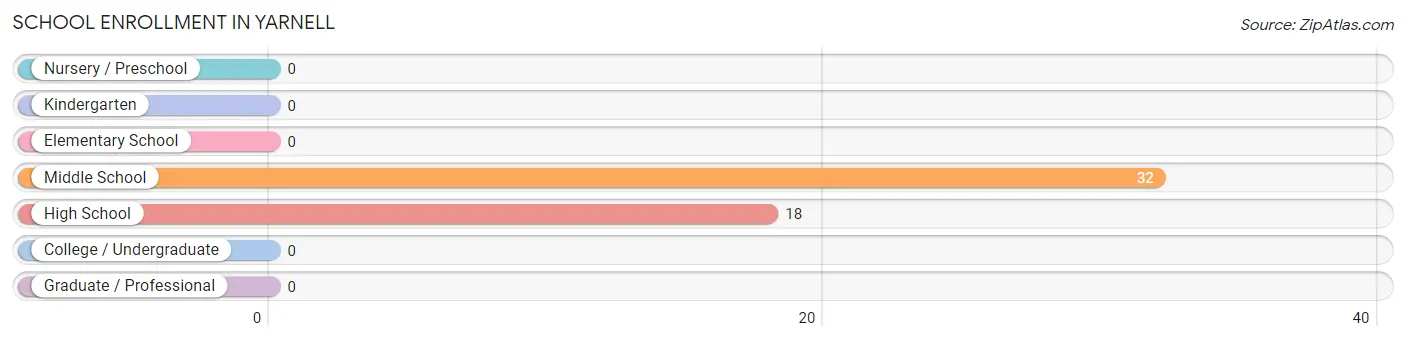
| School Level | # Students | % Students |
| Nursery / Preschool | 0 | 0.0% |
| Kindergarten | 0 | 0.0% |
| Elementary School | 0 | 0.0% |
| Middle School | 32 | 64.0% |
| High School | 18 | 36.0% |
| College / Undergraduate | 0 | 0.0% |
| Graduate / Professional | 0 | 0.0% |
| Total | 50 | 100.0% |
School Enrollment by Age by Funding Source in Yarnell
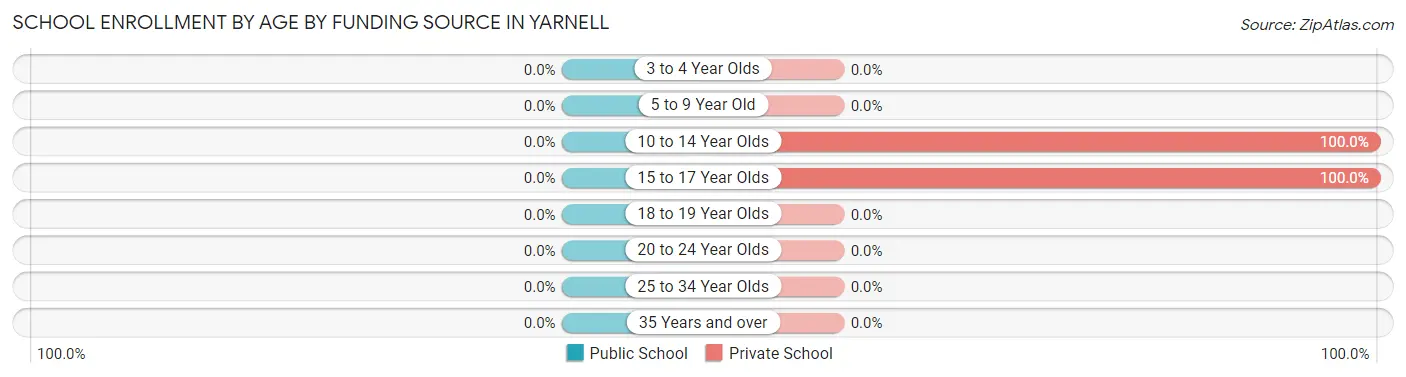
| Age Bracket | Public School | Private School |
| 3 to 4 Year Olds | 0 (0.0%) | 0 (0.0%) |
| 5 to 9 Year Old | 0 (0.0%) | 0 (0.0%) |
| 10 to 14 Year Olds | 0 (0.0%) | 32 (100.0%) |
| 15 to 17 Year Olds | 0 (0.0%) | 18 (100.0%) |
| 18 to 19 Year Olds | 0 (0.0%) | 0 (0.0%) |
| 20 to 24 Year Olds | 0 (0.0%) | 0 (0.0%) |
| 25 to 34 Year Olds | 0 (0.0%) | 0 (0.0%) |
| 35 Years and over | 0 (0.0%) | 0 (0.0%) |
| Total | 0 (0.0%) | 50 (100.0%) |
Educational Attainment by Field of Study in Yarnell
Education (35 | 40.2%), physical & health sciences (34 | 39.1%), social sciences (14 | 16.1%), and business (4 | 4.6%) are the most common fields of study among 87 individuals in Yarnell who have obtained a bachelor's degree or higher.
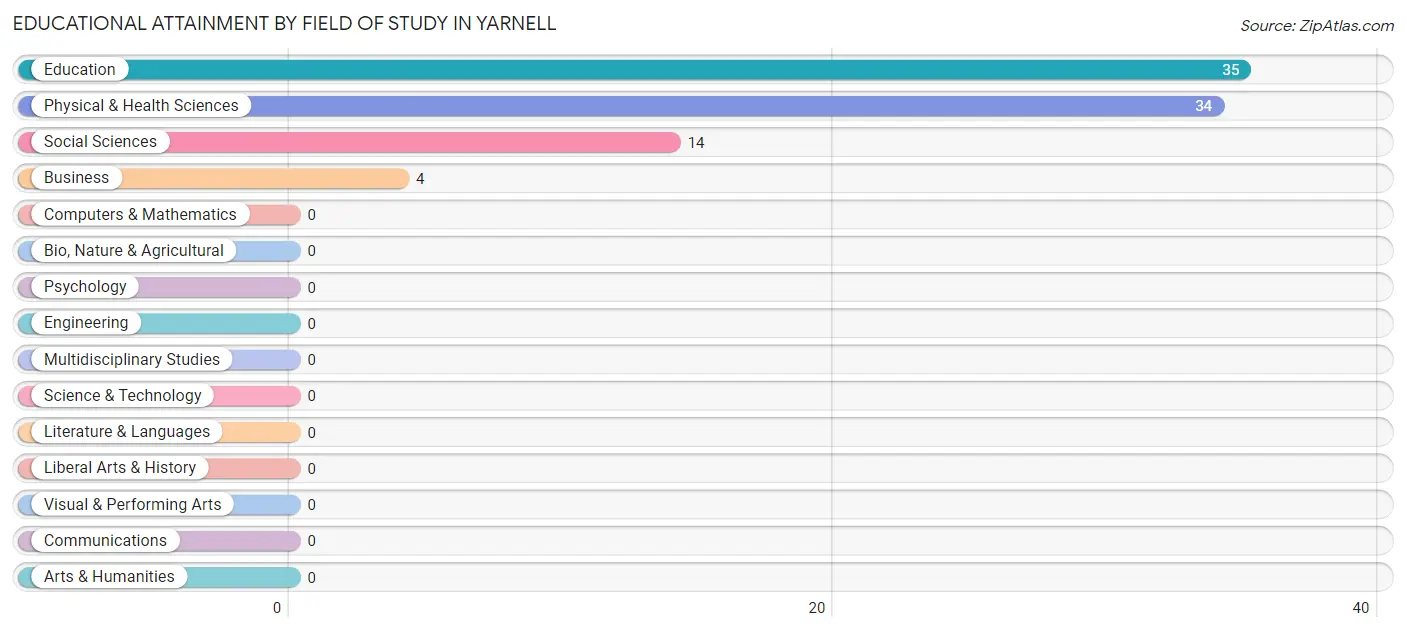
| Field of Study | # Graduates | % Graduates |
| Computers & Mathematics | 0 | 0.0% |
| Bio, Nature & Agricultural | 0 | 0.0% |
| Physical & Health Sciences | 34 | 39.1% |
| Psychology | 0 | 0.0% |
| Social Sciences | 14 | 16.1% |
| Engineering | 0 | 0.0% |
| Multidisciplinary Studies | 0 | 0.0% |
| Science & Technology | 0 | 0.0% |
| Business | 4 | 4.6% |
| Education | 35 | 40.2% |
| Literature & Languages | 0 | 0.0% |
| Liberal Arts & History | 0 | 0.0% |
| Visual & Performing Arts | 0 | 0.0% |
| Communications | 0 | 0.0% |
| Arts & Humanities | 0 | 0.0% |
| Total | 87 | 100.0% |
Transportation & Commute in Yarnell
Vehicle Availability by Sex in Yarnell
The most prevalent vehicle ownership categories in Yarnell are males with 2 vehicles (44, accounting for 38.9%) and females with 2 vehicles (20, making up 68.8%).
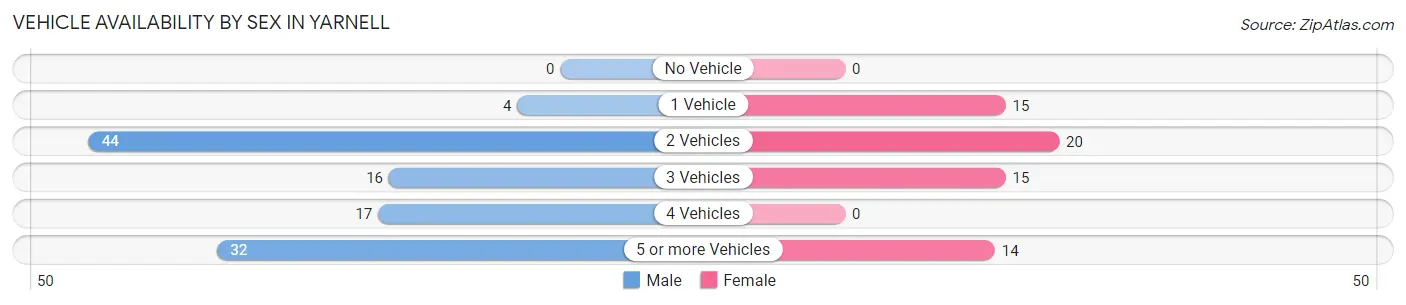
| Vehicles Available | Male | Female |
| No Vehicle | 0 (0.0%) | 0 (0.0%) |
| 1 Vehicle | 4 (3.5%) | 15 (23.4%) |
| 2 Vehicles | 44 (38.9%) | 20 (31.2%) |
| 3 Vehicles | 16 (14.2%) | 15 (23.4%) |
| 4 Vehicles | 17 (15.0%) | 0 (0.0%) |
| 5 or more Vehicles | 32 (28.3%) | 14 (21.9%) |
| Total | 113 (100.0%) | 64 (100.0%) |
Commute Time in Yarnell
The most frequently occuring commute durations in Yarnell are 10 to 14 minutes (48 commuters, 27.1%), less than 5 minutes (47 commuters, 26.6%), and 5 to 9 minutes (35 commuters, 19.8%).
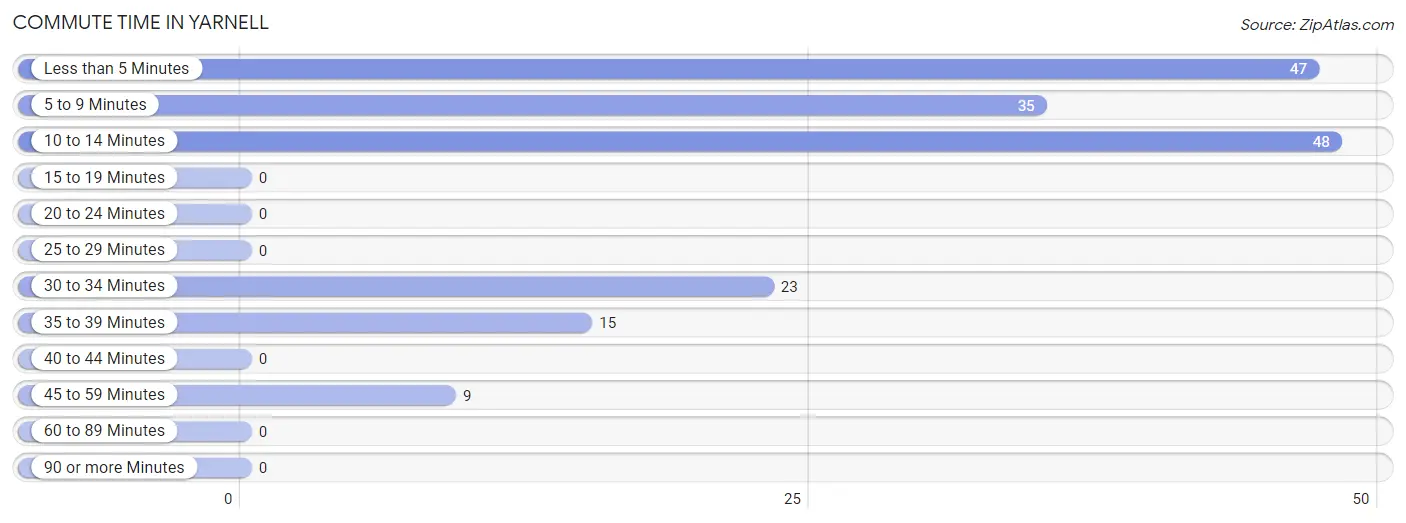
| Commute Time | # Commuters | % Commuters |
| Less than 5 Minutes | 47 | 26.6% |
| 5 to 9 Minutes | 35 | 19.8% |
| 10 to 14 Minutes | 48 | 27.1% |
| 15 to 19 Minutes | 0 | 0.0% |
| 20 to 24 Minutes | 0 | 0.0% |
| 25 to 29 Minutes | 0 | 0.0% |
| 30 to 34 Minutes | 23 | 13.0% |
| 35 to 39 Minutes | 15 | 8.5% |
| 40 to 44 Minutes | 0 | 0.0% |
| 45 to 59 Minutes | 9 | 5.1% |
| 60 to 89 Minutes | 0 | 0.0% |
| 90 or more Minutes | 0 | 0.0% |
Commute Time by Sex in Yarnell
The most common commute times in Yarnell are 10 to 14 minutes (48 commuters, 42.5%) for males and 5 to 9 minutes (35 commuters, 54.7%) for females.
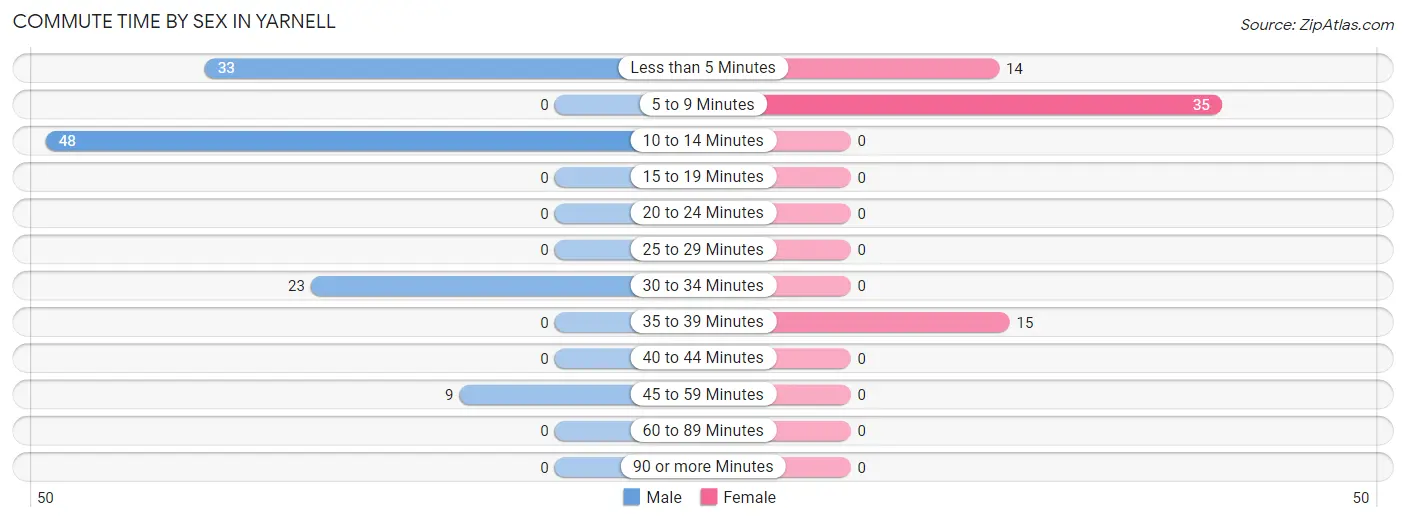
| Commute Time | Male | Female |
| Less than 5 Minutes | 33 (29.2%) | 14 (21.9%) |
| 5 to 9 Minutes | 0 (0.0%) | 35 (54.7%) |
| 10 to 14 Minutes | 48 (42.5%) | 0 (0.0%) |
| 15 to 19 Minutes | 0 (0.0%) | 0 (0.0%) |
| 20 to 24 Minutes | 0 (0.0%) | 0 (0.0%) |
| 25 to 29 Minutes | 0 (0.0%) | 0 (0.0%) |
| 30 to 34 Minutes | 23 (20.3%) | 0 (0.0%) |
| 35 to 39 Minutes | 0 (0.0%) | 15 (23.4%) |
| 40 to 44 Minutes | 0 (0.0%) | 0 (0.0%) |
| 45 to 59 Minutes | 9 (8.0%) | 0 (0.0%) |
| 60 to 89 Minutes | 0 (0.0%) | 0 (0.0%) |
| 90 or more Minutes | 0 (0.0%) | 0 (0.0%) |
Time of Departure to Work by Sex in Yarnell
The most frequent times of departure to work in Yarnell are 12:00 AM to 4:59 AM (48, 42.5%) for males and 6:30 AM to 6:59 AM (35, 54.7%) for females.
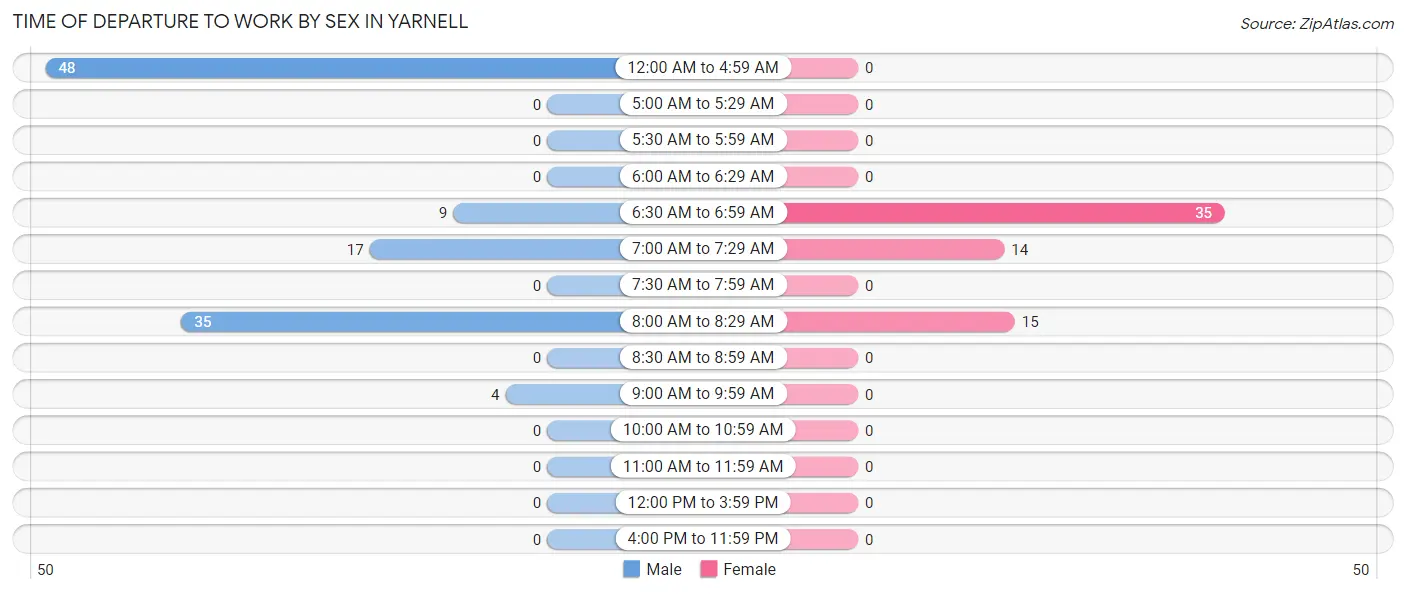
| Time of Departure | Male | Female |
| 12:00 AM to 4:59 AM | 48 (42.5%) | 0 (0.0%) |
| 5:00 AM to 5:29 AM | 0 (0.0%) | 0 (0.0%) |
| 5:30 AM to 5:59 AM | 0 (0.0%) | 0 (0.0%) |
| 6:00 AM to 6:29 AM | 0 (0.0%) | 0 (0.0%) |
| 6:30 AM to 6:59 AM | 9 (8.0%) | 35 (54.7%) |
| 7:00 AM to 7:29 AM | 17 (15.0%) | 14 (21.9%) |
| 7:30 AM to 7:59 AM | 0 (0.0%) | 0 (0.0%) |
| 8:00 AM to 8:29 AM | 35 (31.0%) | 15 (23.4%) |
| 8:30 AM to 8:59 AM | 0 (0.0%) | 0 (0.0%) |
| 9:00 AM to 9:59 AM | 4 (3.5%) | 0 (0.0%) |
| 10:00 AM to 10:59 AM | 0 (0.0%) | 0 (0.0%) |
| 11:00 AM to 11:59 AM | 0 (0.0%) | 0 (0.0%) |
| 12:00 PM to 3:59 PM | 0 (0.0%) | 0 (0.0%) |
| 4:00 PM to 11:59 PM | 0 (0.0%) | 0 (0.0%) |
| Total | 113 (100.0%) | 64 (100.0%) |
Housing Occupancy in Yarnell
Occupancy by Ownership in Yarnell
Of the total 366 dwellings in Yarnell, owner-occupied units account for 246 (67.2%), while renter-occupied units make up 120 (32.8%).
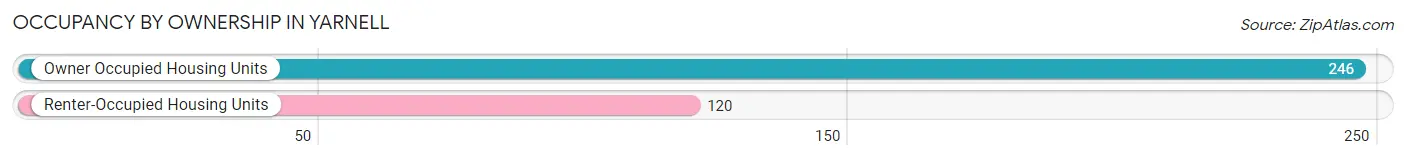
| Occupancy | # Housing Units | % Housing Units |
| Owner Occupied Housing Units | 246 | 67.2% |
| Renter-Occupied Housing Units | 120 | 32.8% |
| Total Occupied Housing Units | 366 | 100.0% |
Occupancy by Household Size in Yarnell
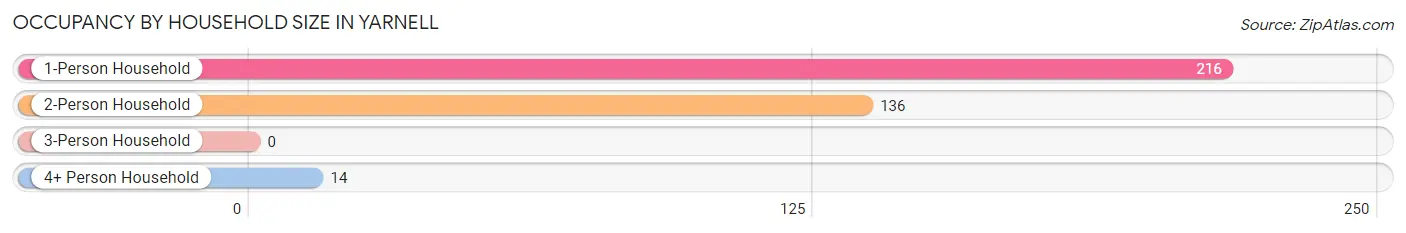
| Household Size | # Housing Units | % Housing Units |
| 1-Person Household | 216 | 59.0% |
| 2-Person Household | 136 | 37.2% |
| 3-Person Household | 0 | 0.0% |
| 4+ Person Household | 14 | 3.8% |
| Total Housing Units | 366 | 100.0% |
Occupancy by Ownership by Household Size in Yarnell
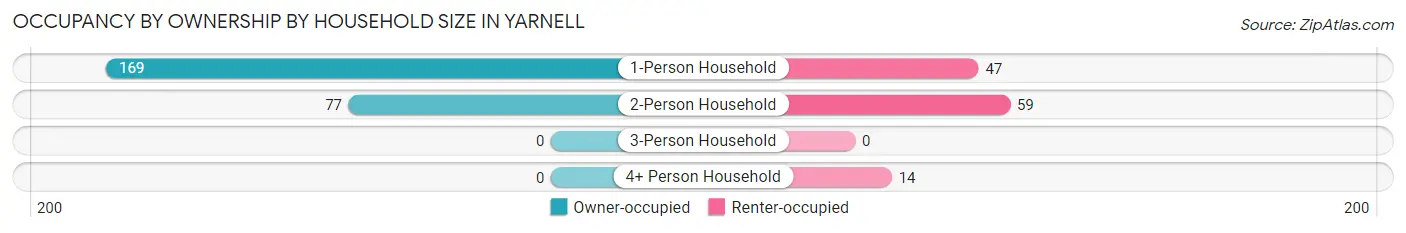
| Household Size | Owner-occupied | Renter-occupied |
| 1-Person Household | 169 (78.2%) | 47 (21.8%) |
| 2-Person Household | 77 (56.6%) | 59 (43.4%) |
| 3-Person Household | 0 (0.0%) | 0 (0.0%) |
| 4+ Person Household | 0 (0.0%) | 14 (100.0%) |
| Total Housing Units | 246 (67.2%) | 120 (32.8%) |
Occupancy by Educational Attainment in Yarnell
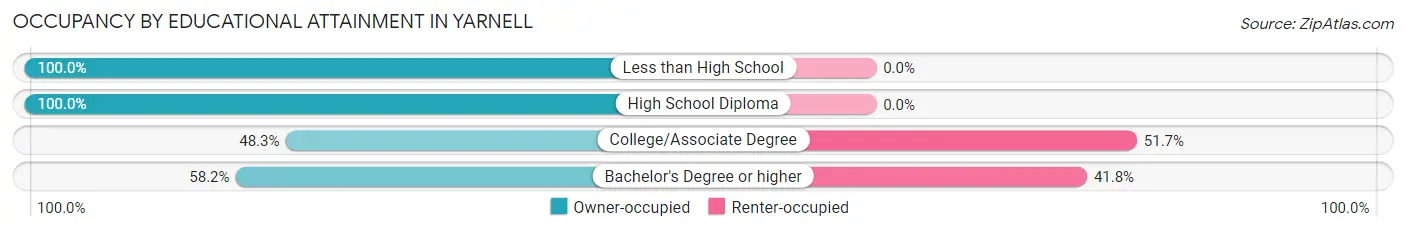
| Household Size | Owner-occupied | Renter-occupied |
| Less than High School | 25 (100.0%) | 0 (0.0%) |
| High School Diploma | 96 (100.0%) | 0 (0.0%) |
| College/Associate Degree | 86 (48.3%) | 92 (51.7%) |
| Bachelor's Degree or higher | 39 (58.2%) | 28 (41.8%) |
Occupancy by Age of Householder in Yarnell
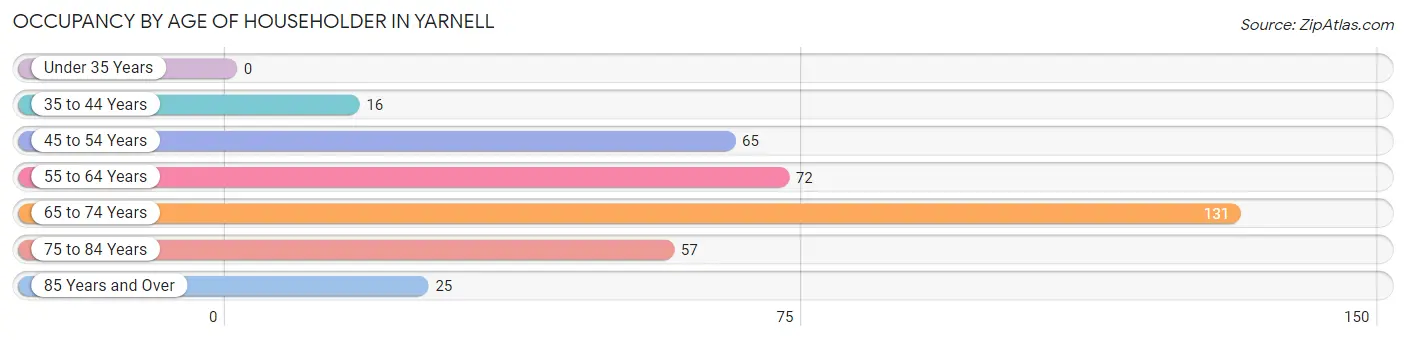
| Age Bracket | # Households | % Households |
| Under 35 Years | 0 | 0.0% |
| 35 to 44 Years | 16 | 4.4% |
| 45 to 54 Years | 65 | 17.8% |
| 55 to 64 Years | 72 | 19.7% |
| 65 to 74 Years | 131 | 35.8% |
| 75 to 84 Years | 57 | 15.6% |
| 85 Years and Over | 25 | 6.8% |
| Total | 366 | 100.0% |
Housing Finances in Yarnell
Median Income by Occupancy in Yarnell
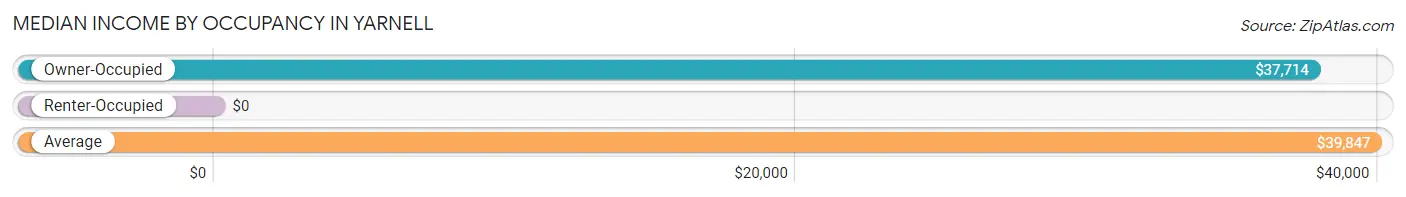
| Occupancy Type | # Households | Median Income |
| Owner-Occupied | 246 (67.2%) | $37,714 |
| Renter-Occupied | 120 (32.8%) | $0 |
| Average | 366 (100.0%) | $39,847 |
Occupancy by Householder Income Bracket in Yarnell
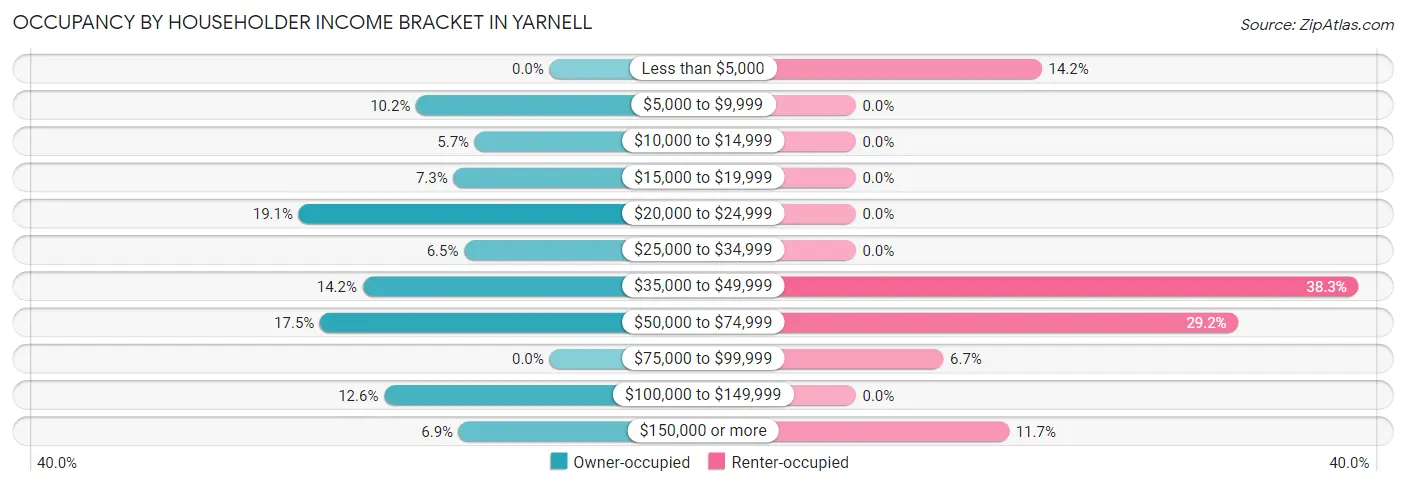
| Income Bracket | Owner-occupied | Renter-occupied |
| Less than $5,000 | 0 (0.0%) | 17 (14.2%) |
| $5,000 to $9,999 | 25 (10.2%) | 0 (0.0%) |
| $10,000 to $14,999 | 14 (5.7%) | 0 (0.0%) |
| $15,000 to $19,999 | 18 (7.3%) | 0 (0.0%) |
| $20,000 to $24,999 | 47 (19.1%) | 0 (0.0%) |
| $25,000 to $34,999 | 16 (6.5%) | 0 (0.0%) |
| $35,000 to $49,999 | 35 (14.2%) | 46 (38.3%) |
| $50,000 to $74,999 | 43 (17.5%) | 35 (29.2%) |
| $75,000 to $99,999 | 0 (0.0%) | 8 (6.7%) |
| $100,000 to $149,999 | 31 (12.6%) | 0 (0.0%) |
| $150,000 or more | 17 (6.9%) | 14 (11.7%) |
| Total | 246 (100.0%) | 120 (100.0%) |
Monthly Housing Cost Tiers in Yarnell
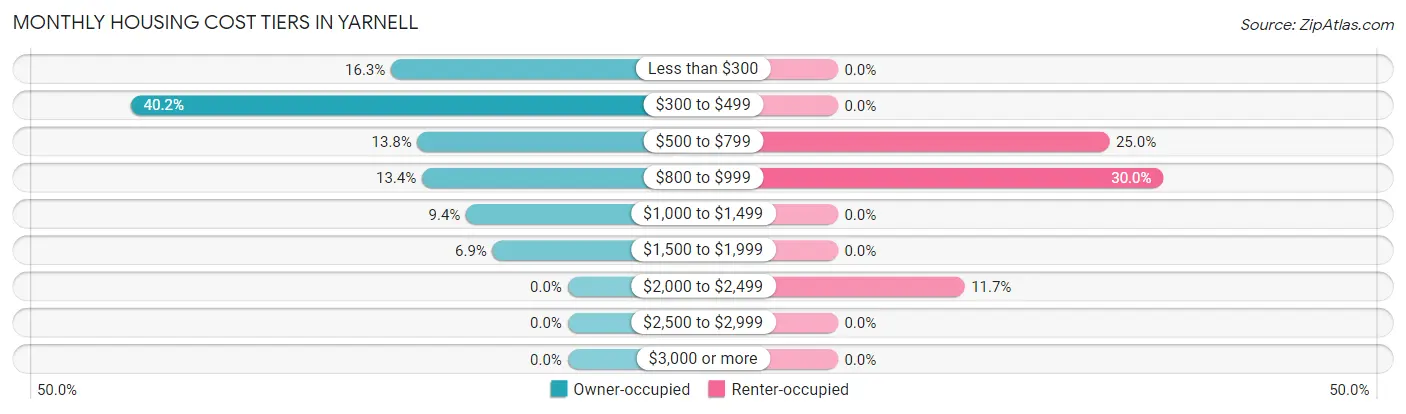
| Monthly Cost | Owner-occupied | Renter-occupied |
| Less than $300 | 40 (16.3%) | 0 (0.0%) |
| $300 to $499 | 99 (40.2%) | 0 (0.0%) |
| $500 to $799 | 34 (13.8%) | 30 (25.0%) |
| $800 to $999 | 33 (13.4%) | 36 (30.0%) |
| $1,000 to $1,499 | 23 (9.3%) | 0 (0.0%) |
| $1,500 to $1,999 | 17 (6.9%) | 0 (0.0%) |
| $2,000 to $2,499 | 0 (0.0%) | 14 (11.7%) |
| $2,500 to $2,999 | 0 (0.0%) | 0 (0.0%) |
| $3,000 or more | 0 (0.0%) | 0 (0.0%) |
| Total | 246 (100.0%) | 120 (100.0%) |
Physical Housing Characteristics in Yarnell
Housing Structures in Yarnell
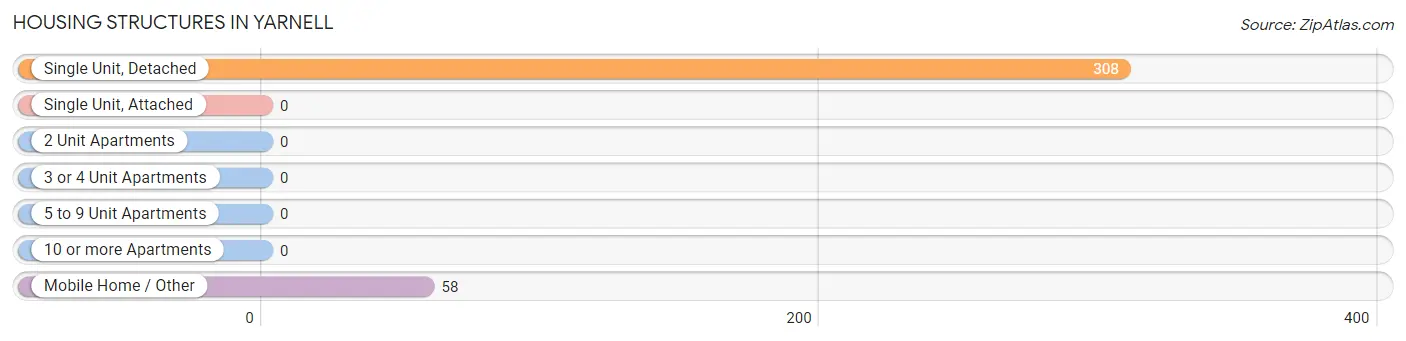
| Structure Type | # Housing Units | % Housing Units |
| Single Unit, Detached | 308 | 84.2% |
| Single Unit, Attached | 0 | 0.0% |
| 2 Unit Apartments | 0 | 0.0% |
| 3 or 4 Unit Apartments | 0 | 0.0% |
| 5 to 9 Unit Apartments | 0 | 0.0% |
| 10 or more Apartments | 0 | 0.0% |
| Mobile Home / Other | 58 | 15.9% |
| Total | 366 | 100.0% |
Housing Structures by Occupancy in Yarnell
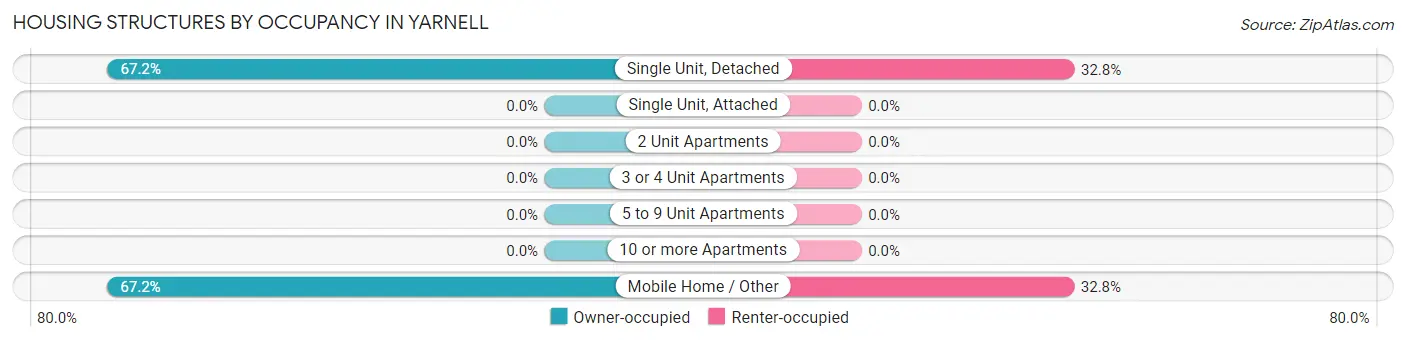
| Structure Type | Owner-occupied | Renter-occupied |
| Single Unit, Detached | 207 (67.2%) | 101 (32.8%) |
| Single Unit, Attached | 0 (0.0%) | 0 (0.0%) |
| 2 Unit Apartments | 0 (0.0%) | 0 (0.0%) |
| 3 or 4 Unit Apartments | 0 (0.0%) | 0 (0.0%) |
| 5 to 9 Unit Apartments | 0 (0.0%) | 0 (0.0%) |
| 10 or more Apartments | 0 (0.0%) | 0 (0.0%) |
| Mobile Home / Other | 39 (67.2%) | 19 (32.8%) |
| Total | 246 (67.2%) | 120 (32.8%) |
Housing Structures by Number of Rooms in Yarnell
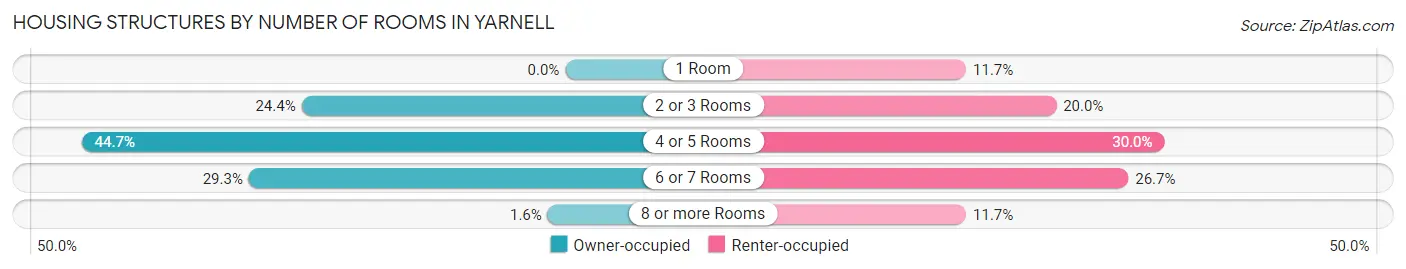
| Number of Rooms | Owner-occupied | Renter-occupied |
| 1 Room | 0 (0.0%) | 14 (11.7%) |
| 2 or 3 Rooms | 60 (24.4%) | 24 (20.0%) |
| 4 or 5 Rooms | 110 (44.7%) | 36 (30.0%) |
| 6 or 7 Rooms | 72 (29.3%) | 32 (26.7%) |
| 8 or more Rooms | 4 (1.6%) | 14 (11.7%) |
| Total | 246 (100.0%) | 120 (100.0%) |
Housing Structure by Heating Type in Yarnell
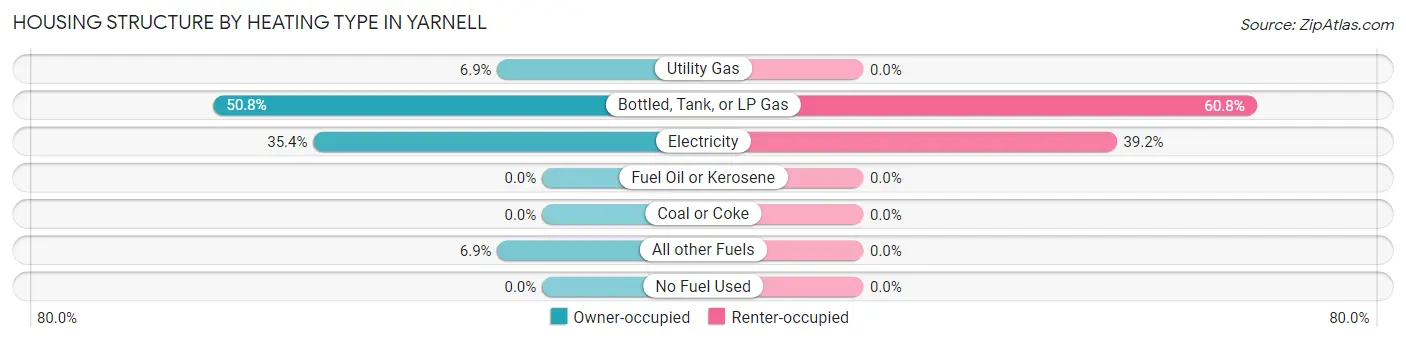
| Heating Type | Owner-occupied | Renter-occupied |
| Utility Gas | 17 (6.9%) | 0 (0.0%) |
| Bottled, Tank, or LP Gas | 125 (50.8%) | 73 (60.8%) |
| Electricity | 87 (35.4%) | 47 (39.2%) |
| Fuel Oil or Kerosene | 0 (0.0%) | 0 (0.0%) |
| Coal or Coke | 0 (0.0%) | 0 (0.0%) |
| All other Fuels | 17 (6.9%) | 0 (0.0%) |
| No Fuel Used | 0 (0.0%) | 0 (0.0%) |
| Total | 246 (100.0%) | 120 (100.0%) |
Household Vehicle Usage in Yarnell
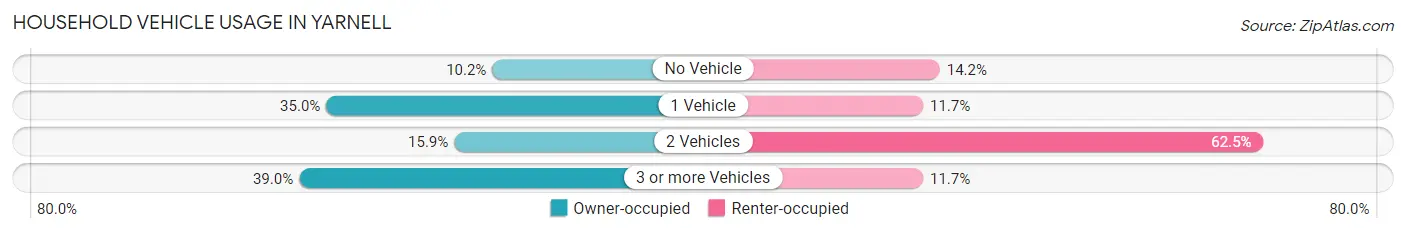
| Vehicles per Household | Owner-occupied | Renter-occupied |
| No Vehicle | 25 (10.2%) | 17 (14.2%) |
| 1 Vehicle | 86 (35.0%) | 14 (11.7%) |
| 2 Vehicles | 39 (15.9%) | 75 (62.5%) |
| 3 or more Vehicles | 96 (39.0%) | 14 (11.7%) |
| Total | 246 (100.0%) | 120 (100.0%) |
Real Estate & Mortgages in Yarnell
Real Estate and Mortgage Overview in Yarnell
| Characteristic | Without Mortgage | With Mortgage |
| Housing Units | 156 | 90 |
| Median Property Value | $233,600 | $203,300 |
| Median Household Income | $24,141 | $17 |
| Monthly Housing Costs | $337 | $0 |
| Real Estate Taxes | $907 | $15 |
Property Value by Mortgage Status in Yarnell
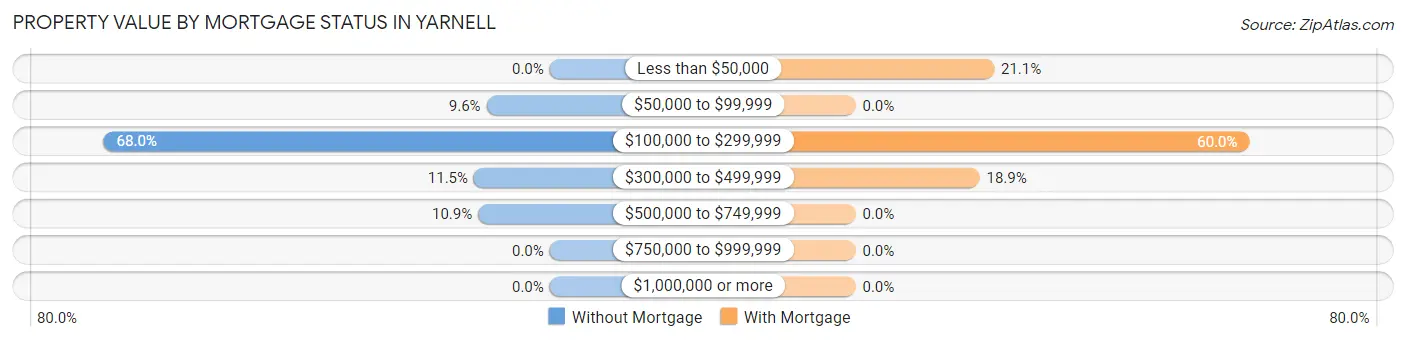
| Property Value | Without Mortgage | With Mortgage |
| Less than $50,000 | 0 (0.0%) | 19 (21.1%) |
| $50,000 to $99,999 | 15 (9.6%) | 0 (0.0%) |
| $100,000 to $299,999 | 106 (67.9%) | 54 (60.0%) |
| $300,000 to $499,999 | 18 (11.5%) | 17 (18.9%) |
| $500,000 to $749,999 | 17 (10.9%) | 0 (0.0%) |
| $750,000 to $999,999 | 0 (0.0%) | 0 (0.0%) |
| $1,000,000 or more | 0 (0.0%) | 0 (0.0%) |
| Total | 156 (100.0%) | 90 (100.0%) |
Household Income by Mortgage Status in Yarnell
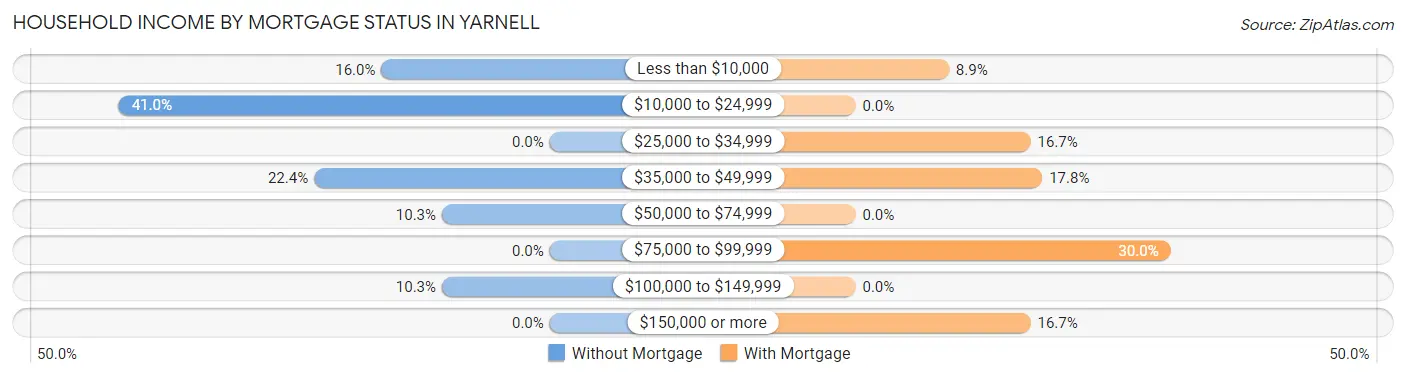
| Household Income | Without Mortgage | With Mortgage |
| Less than $10,000 | 25 (16.0%) | 8 (8.9%) |
| $10,000 to $24,999 | 64 (41.0%) | 0 (0.0%) |
| $25,000 to $34,999 | 0 (0.0%) | 15 (16.7%) |
| $35,000 to $49,999 | 35 (22.4%) | 16 (17.8%) |
| $50,000 to $74,999 | 16 (10.3%) | 0 (0.0%) |
| $75,000 to $99,999 | 0 (0.0%) | 27 (30.0%) |
| $100,000 to $149,999 | 16 (10.3%) | 0 (0.0%) |
| $150,000 or more | 0 (0.0%) | 15 (16.7%) |
| Total | 156 (100.0%) | 90 (100.0%) |
Property Value to Household Income Ratio in Yarnell
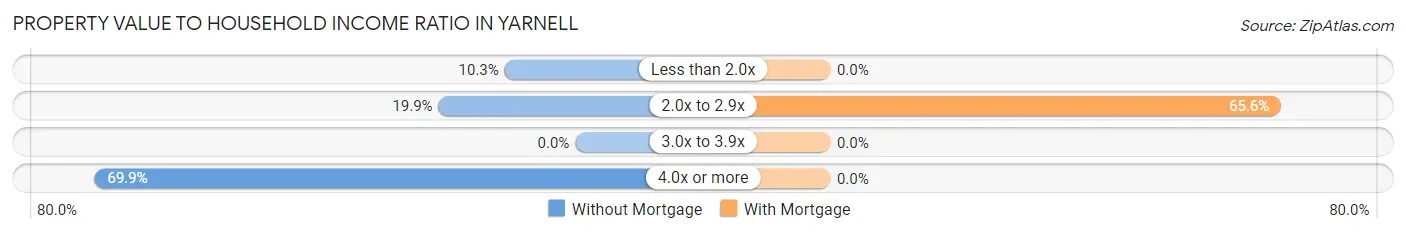
| Value-to-Income Ratio | Without Mortgage | With Mortgage |
| Less than 2.0x | 16 (10.3%) | 0 (0.0%) |
| 2.0x to 2.9x | 31 (19.9%) | 59 (65.6%) |
| 3.0x to 3.9x | 0 (0.0%) | 0 (0.0%) |
| 4.0x or more | 109 (69.9%) | 0 (0.0%) |
| Total | 156 (100.0%) | 90 (100.0%) |
Real Estate Taxes by Mortgage Status in Yarnell
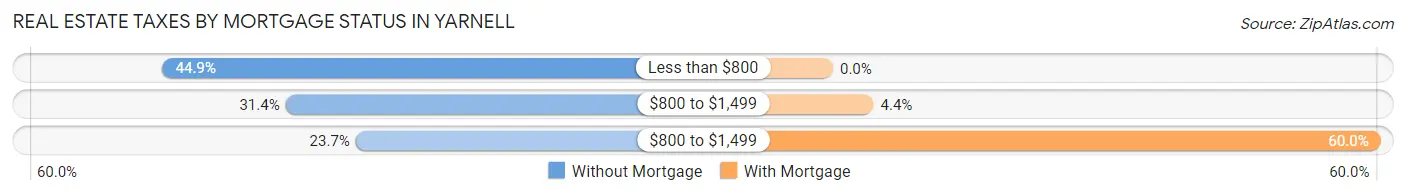
| Property Taxes | Without Mortgage | With Mortgage |
| Less than $800 | 70 (44.9%) | 0 (0.0%) |
| $800 to $1,499 | 49 (31.4%) | 4 (4.4%) |
| $800 to $1,499 | 37 (23.7%) | 54 (60.0%) |
| Total | 156 (100.0%) | 90 (100.0%) |
Health & Disability in Yarnell
Health Insurance Coverage by Age in Yarnell
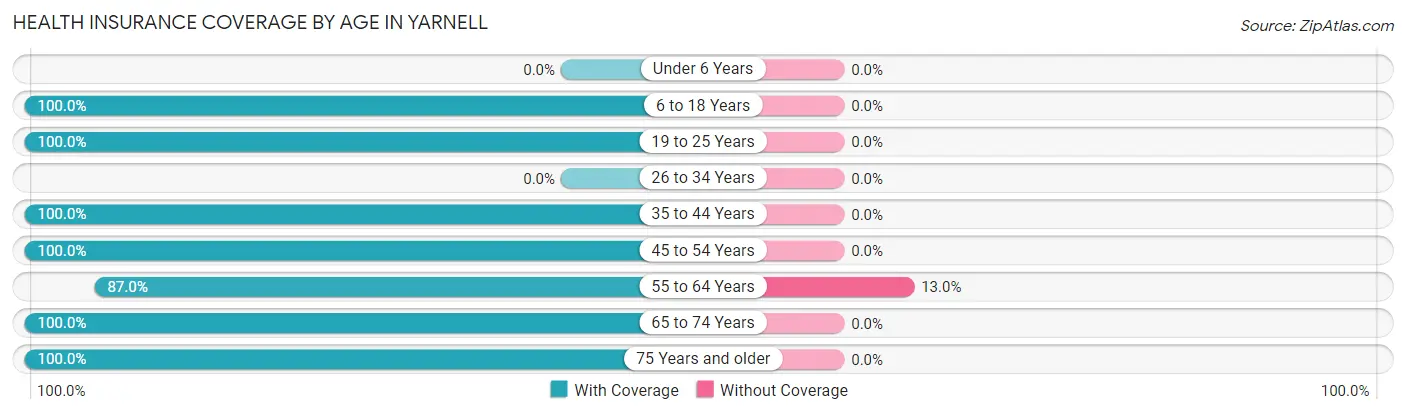
| Age Bracket | With Coverage | Without Coverage |
| Under 6 Years | 0 (0.0%) | 0 (0.0%) |
| 6 to 18 Years | 50 (100.0%) | 0 (0.0%) |
| 19 to 25 Years | 16 (100.0%) | 0 (0.0%) |
| 26 to 34 Years | 0 (0.0%) | 0 (0.0%) |
| 35 to 44 Years | 16 (100.0%) | 0 (0.0%) |
| 45 to 54 Years | 98 (100.0%) | 0 (0.0%) |
| 55 to 64 Years | 100 (87.0%) | 15 (13.0%) |
| 65 to 74 Years | 197 (100.0%) | 0 (0.0%) |
| 75 Years and older | 87 (100.0%) | 0 (0.0%) |
| Total | 564 (97.4%) | 15 (2.6%) |
Health Insurance Coverage by Citizenship Status in Yarnell
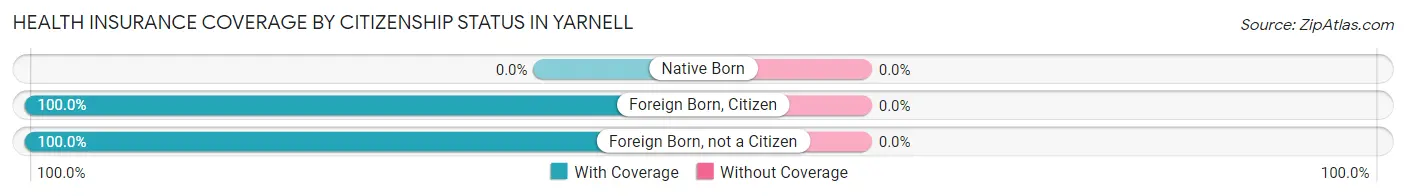
| Citizenship Status | With Coverage | Without Coverage |
| Native Born | 0 (0.0%) | 0 (0.0%) |
| Foreign Born, Citizen | 50 (100.0%) | 0 (0.0%) |
| Foreign Born, not a Citizen | 16 (100.0%) | 0 (0.0%) |
Health Insurance Coverage by Household Income in Yarnell
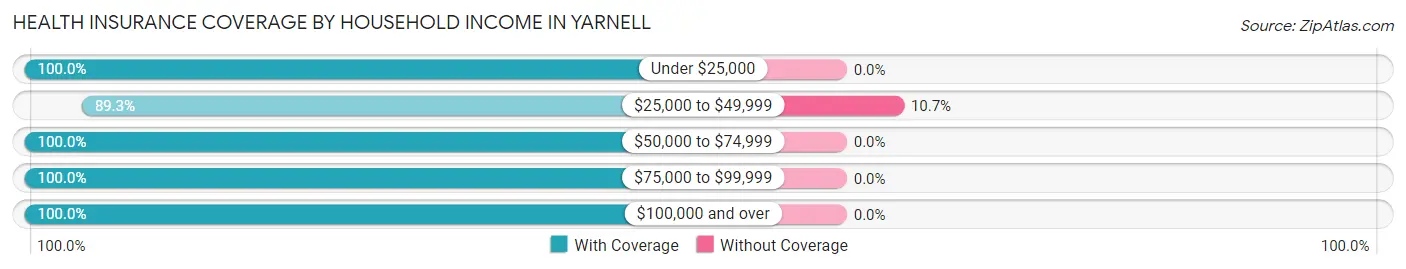
| Household Income | With Coverage | Without Coverage |
| Under $25,000 | 121 (100.0%) | 0 (0.0%) |
| $25,000 to $49,999 | 125 (89.3%) | 15 (10.7%) |
| $50,000 to $74,999 | 124 (100.0%) | 0 (0.0%) |
| $75,000 to $99,999 | 17 (100.0%) | 0 (0.0%) |
| $100,000 and over | 177 (100.0%) | 0 (0.0%) |
Public vs Private Health Insurance Coverage by Age in Yarnell
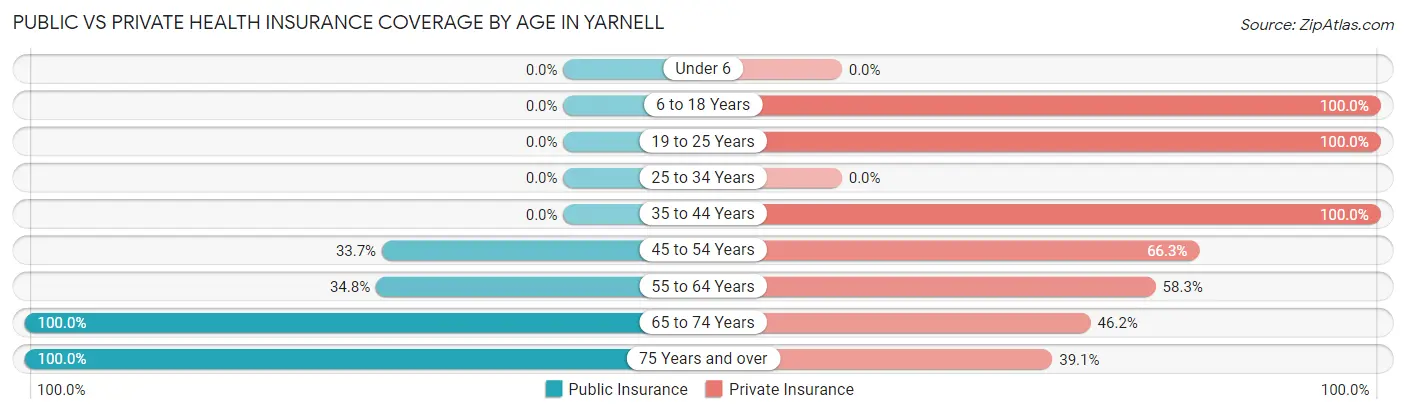
| Age Bracket | Public Insurance | Private Insurance |
| Under 6 | 0 (0.0%) | 0 (0.0%) |
| 6 to 18 Years | 0 (0.0%) | 50 (100.0%) |
| 19 to 25 Years | 0 (0.0%) | 16 (100.0%) |
| 25 to 34 Years | 0 (0.0%) | 0 (0.0%) |
| 35 to 44 Years | 0 (0.0%) | 16 (100.0%) |
| 45 to 54 Years | 33 (33.7%) | 65 (66.3%) |
| 55 to 64 Years | 40 (34.8%) | 67 (58.3%) |
| 65 to 74 Years | 197 (100.0%) | 91 (46.2%) |
| 75 Years and over | 87 (100.0%) | 34 (39.1%) |
| Total | 357 (61.7%) | 339 (58.6%) |
Disability Status by Sex by Age in Yarnell
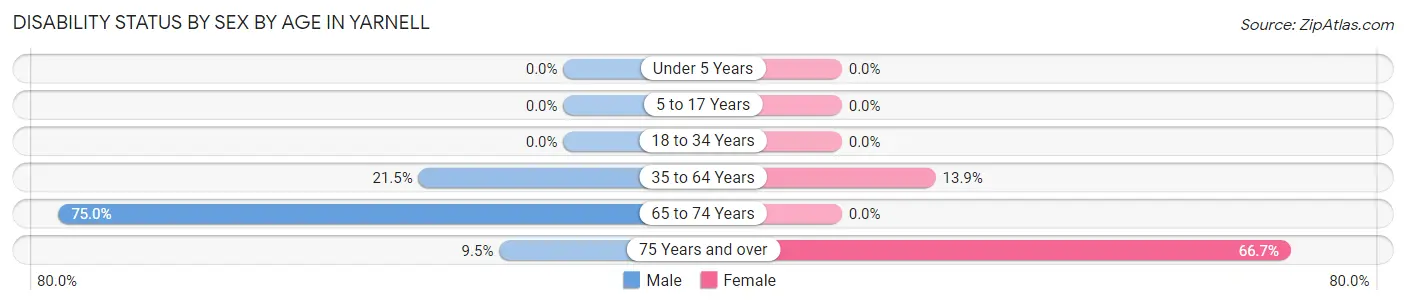
| Age Bracket | Male | Female |
| Under 5 Years | 0 (0.0%) | 0 (0.0%) |
| 5 to 17 Years | 0 (0.0%) | 0 (0.0%) |
| 18 to 34 Years | 0 (0.0%) | 0 (0.0%) |
| 35 to 64 Years | 23 (21.5%) | 17 (13.9%) |
| 65 to 74 Years | 78 (75.0%) | 0 (0.0%) |
| 75 Years and over | 4 (9.5%) | 30 (66.7%) |
Disability Class by Sex by Age in Yarnell
Disability Class: Hearing Difficulty
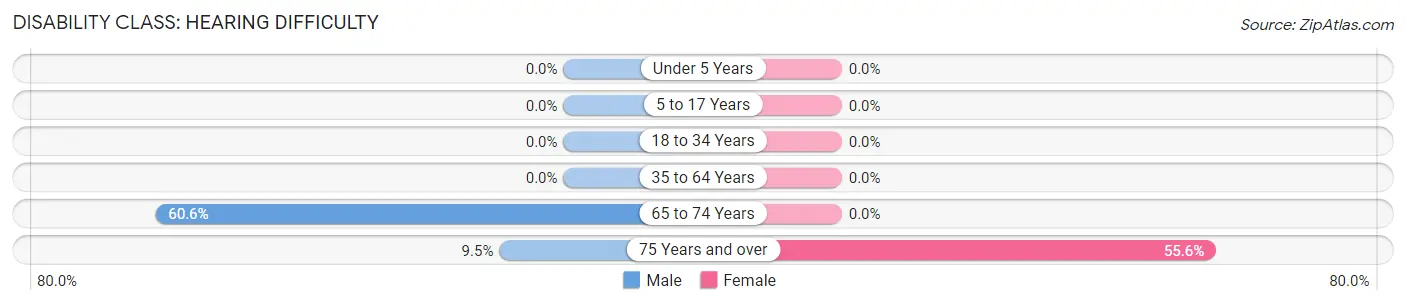
| Age Bracket | Male | Female |
| Under 5 Years | 0 (0.0%) | 0 (0.0%) |
| 5 to 17 Years | 0 (0.0%) | 0 (0.0%) |
| 18 to 34 Years | 0 (0.0%) | 0 (0.0%) |
| 35 to 64 Years | 0 (0.0%) | 0 (0.0%) |
| 65 to 74 Years | 63 (60.6%) | 0 (0.0%) |
| 75 Years and over | 4 (9.5%) | 25 (55.6%) |
Disability Class: Vision Difficulty
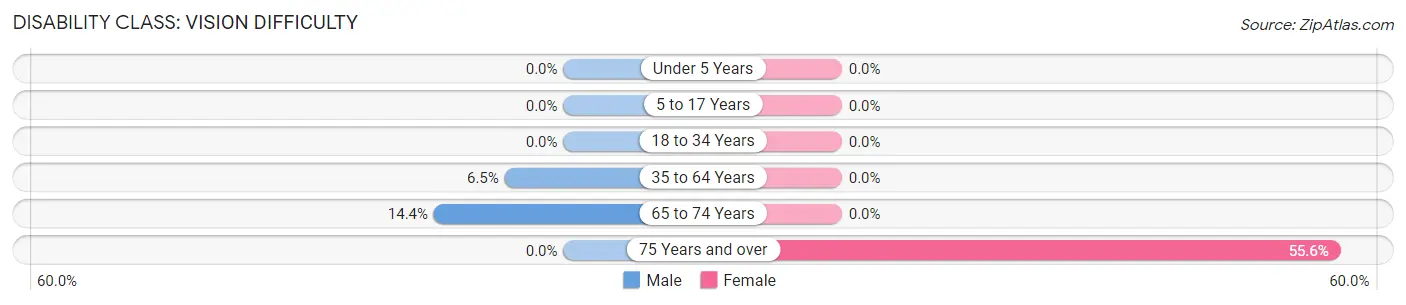
| Age Bracket | Male | Female |
| Under 5 Years | 0 (0.0%) | 0 (0.0%) |
| 5 to 17 Years | 0 (0.0%) | 0 (0.0%) |
| 18 to 34 Years | 0 (0.0%) | 0 (0.0%) |
| 35 to 64 Years | 7 (6.5%) | 0 (0.0%) |
| 65 to 74 Years | 15 (14.4%) | 0 (0.0%) |
| 75 Years and over | 0 (0.0%) | 25 (55.6%) |
Disability Class: Cognitive Difficulty
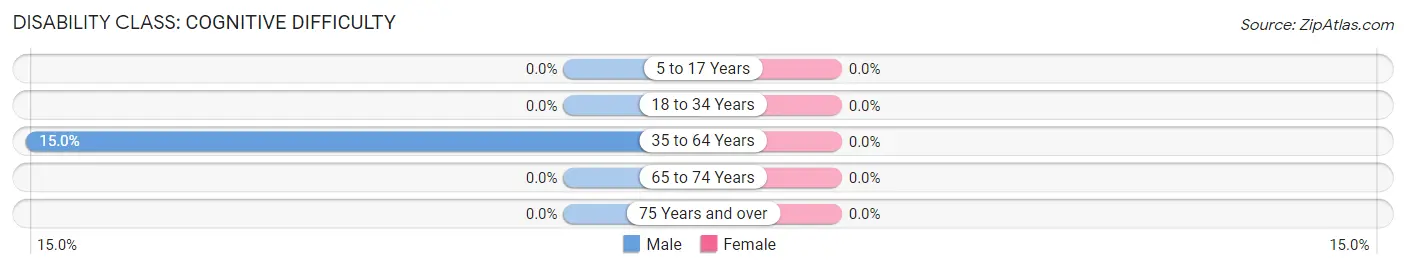
| Age Bracket | Male | Female |
| 5 to 17 Years | 0 (0.0%) | 0 (0.0%) |
| 18 to 34 Years | 0 (0.0%) | 0 (0.0%) |
| 35 to 64 Years | 16 (14.9%) | 0 (0.0%) |
| 65 to 74 Years | 0 (0.0%) | 0 (0.0%) |
| 75 Years and over | 0 (0.0%) | 0 (0.0%) |
Disability Class: Ambulatory Difficulty
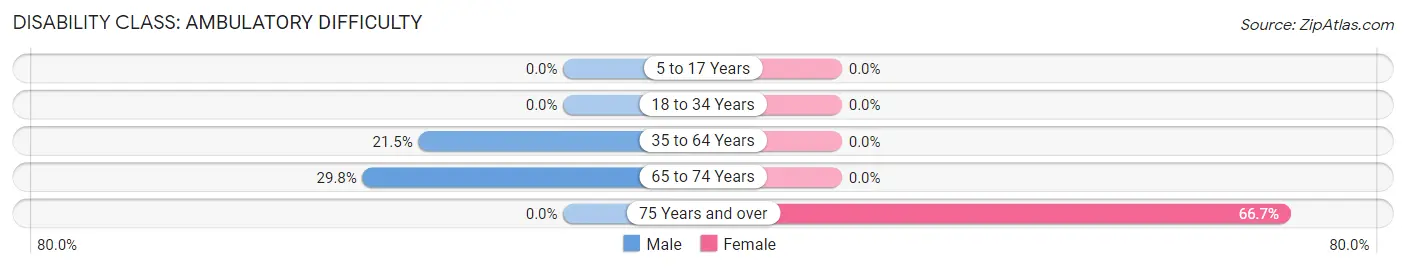
| Age Bracket | Male | Female |
| 5 to 17 Years | 0 (0.0%) | 0 (0.0%) |
| 18 to 34 Years | 0 (0.0%) | 0 (0.0%) |
| 35 to 64 Years | 23 (21.5%) | 0 (0.0%) |
| 65 to 74 Years | 31 (29.8%) | 0 (0.0%) |
| 75 Years and over | 0 (0.0%) | 30 (66.7%) |
Disability Class: Self-Care Difficulty
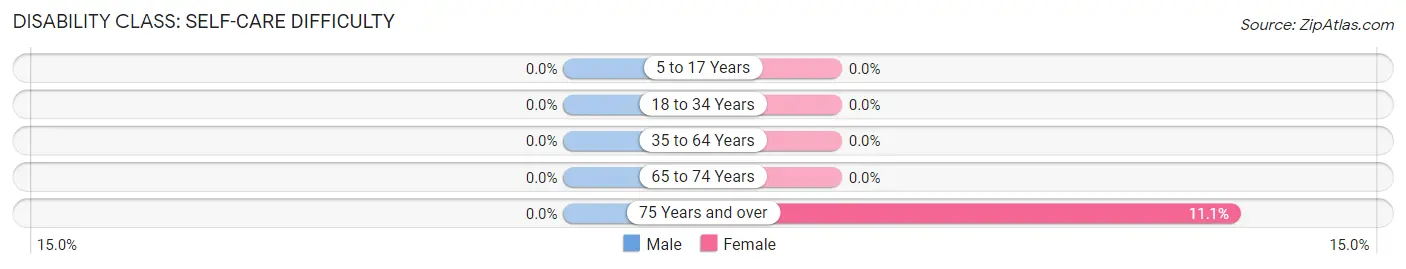
| Age Bracket | Male | Female |
| 5 to 17 Years | 0 (0.0%) | 0 (0.0%) |
| 18 to 34 Years | 0 (0.0%) | 0 (0.0%) |
| 35 to 64 Years | 0 (0.0%) | 0 (0.0%) |
| 65 to 74 Years | 0 (0.0%) | 0 (0.0%) |
| 75 Years and over | 0 (0.0%) | 5 (11.1%) |
Technology Access in Yarnell
Computing Device Access in Yarnell
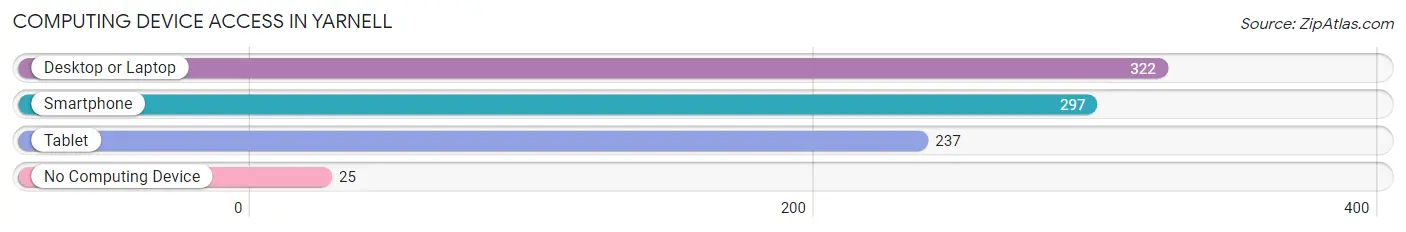
| Device Type | # Households | % Households |
| Desktop or Laptop | 322 | 88.0% |
| Smartphone | 297 | 81.1% |
| Tablet | 237 | 64.7% |
| No Computing Device | 25 | 6.8% |
| Total | 366 | 100.0% |
Internet Access in Yarnell
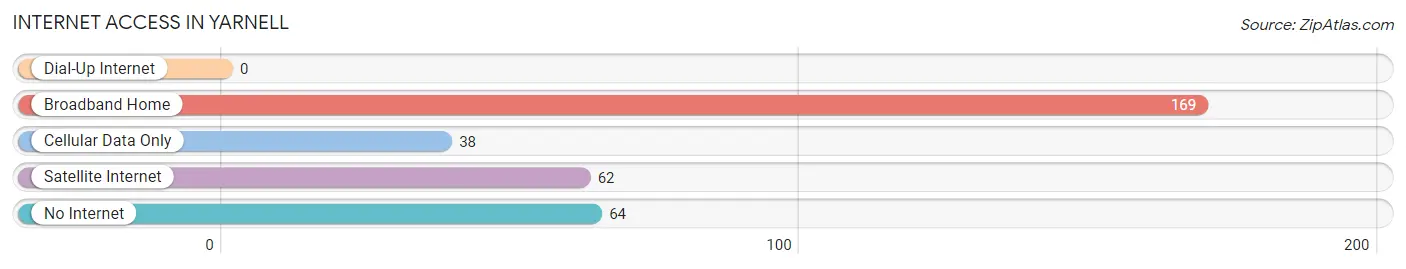
| Internet Type | # Households | % Households |
| Dial-Up Internet | 0 | 0.0% |
| Broadband Home | 169 | 46.2% |
| Cellular Data Only | 38 | 10.4% |
| Satellite Internet | 62 | 16.9% |
| No Internet | 64 | 17.5% |
| Total | 366 | 100.0% |
Yarnell Summary
Yarnell, Arizona is a small unincorporated community located in Yavapai County, Arizona. It is situated in the foothills of the Bradshaw Mountains, approximately 30 miles northwest of Prescott. The town was founded in the late 19th century and has a population of approximately 700 people.
History
Yarnell was founded in 1875 by a group of miners who were searching for gold in the Bradshaw Mountains. The town was named after William Yarnell, a prospector who discovered gold in the area. The town quickly grew and by the early 1900s, it had become a bustling mining town with a population of over 1,000 people.
The town was home to several businesses, including a hotel, saloon, general store, and a post office. The town also had a school, which was built in 1891. The school was later replaced by a larger building in the 1920s.
The town experienced a decline in the 1930s due to the Great Depression and the closure of the mines. The population decreased to around 500 people by the 1950s.
Geography
Yarnell is located in the foothills of the Bradshaw Mountains, approximately 30 miles northwest of Prescott. The town is situated at an elevation of 4,500 feet and is surrounded by the Prescott National Forest. The town is located in a semi-arid climate, with hot summers and mild winters.
The town is located near several natural attractions, including the Granite Mountain Hotshots Memorial State Park, which honors the 19 firefighters who died in the 2013 Yarnell Hill Fire.
Economy
Yarnell's economy is largely based on tourism. The town is home to several tourist attractions, including the Granite Mountain Hotshots Memorial State Park, the Yarnell Hill Observatory, and the Yarnell Hill Winery. The town also has several restaurants, shops, and lodging options.
The town is also home to several small businesses, including a general store, a gas station, and a post office.
Demographics
As of the 2010 census, Yarnell had a population of 696 people. The racial makeup of the town was 94.3% White, 0.3% African American, 0.3% Native American, 0.3% Asian, 0.1% Pacific Islander, 0.3% from other races, and 4.3% from two or more races. Hispanic or Latino of any race were 4.3% of the population.
The median household income in Yarnell was $37,500, and the median family income was $41,250. The per capita income for the town was $17,845. About 11.3% of families and 14.3% of the population were below the poverty line, including 18.2% of those under age 18 and none of those age 65 or over.
Common Questions
What is Per Capita Income in Yarnell?
Per Capita income in Yarnell is $36,706.
What is the Median Family Income in Yarnell?
Median Family Income in Yarnell is $64,375.
What is the Median Household income in Yarnell?
Median Household Income in Yarnell is $39,847.
What is Inequality or Gini Index in Yarnell?
Inequality or Gini Index in Yarnell is 0.45.
What is the Total Population of Yarnell?
Total Population of Yarnell is 579.
What is the Total Male Population of Yarnell?
Total Male Population of Yarnell is 301.
What is the Total Female Population of Yarnell?
Total Female Population of Yarnell is 278.
What is the Ratio of Males per 100 Females in Yarnell?
There are 108.27 Males per 100 Females in Yarnell.
What is the Ratio of Females per 100 Males in Yarnell?
There are 92.36 Females per 100 Males in Yarnell.
What is the Median Population Age in Yarnell?
Median Population Age in Yarnell is 64.8 Years.
What is the Average Family Size in Yarnell
Average Family Size in Yarnell is 2.5 People.
What is the Average Household Size in Yarnell
Average Household Size in Yarnell is 1.6 People.
How Large is the Labor Force in Yarnell?
There are 177 People in the Labor Forcein in Yarnell.
What is the Percentage of People in the Labor Force in Yarnell?
32.4% of People are in the Labor Force in Yarnell.