Why, AZ Map & Demographics
Why Map
Why Overview
$14,864
PER CAPITA INCOME
0.35
INEQUALITY / GINI INDEX
102
TOTAL POPULATION
53
MALE POPULATION
49
FEMALE POPULATION
108.16
MALES / 100 FEMALES
92.45
FEMALES / 100 MALES
60.4
MEDIAN AGE
2.1
AVG FAMILY SIZE
2.1
AVG HOUSEHOLD SIZE
31
LABOR FORCE [ PEOPLE ]
34.1%
PERCENT IN LABOR FORCE
Income in Why
Income Overview in Why
| Characteristic | Number | Measure |
| Per Capita Income | 102 | $14,864 |
| Median Family Income | 49 | $0 |
| Mean Family Income | 49 | $32,088 |
| Median Household Income | 49 | $0 |
| Mean Household Income | 49 | $32,088 |
| Income Deficit | 49 | $0 |
| Wage / Income Gap (%) | 102 | 0.00% |
| Wage / Income Gap ($) | 102 | 100.00¢ per $1 |
| Gini / Inequality Index | 102 | 0.35 |
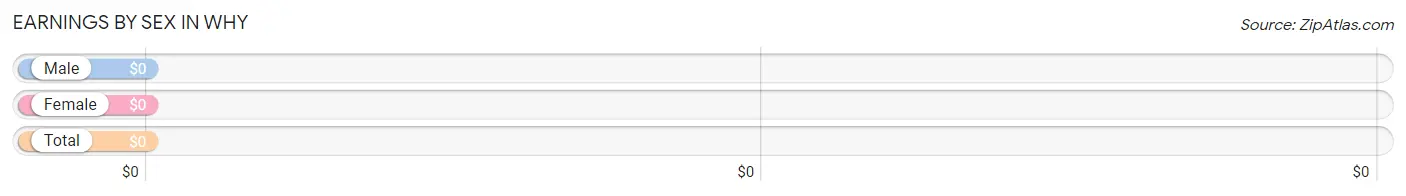
Earnings by Sex in Why
| Sex | Number | Average Earnings |
| Male | 38 (82.6%) | $0 |
| Female | 8 (17.4%) | $0 |
| Total | 46 (100.0%) | $0 |
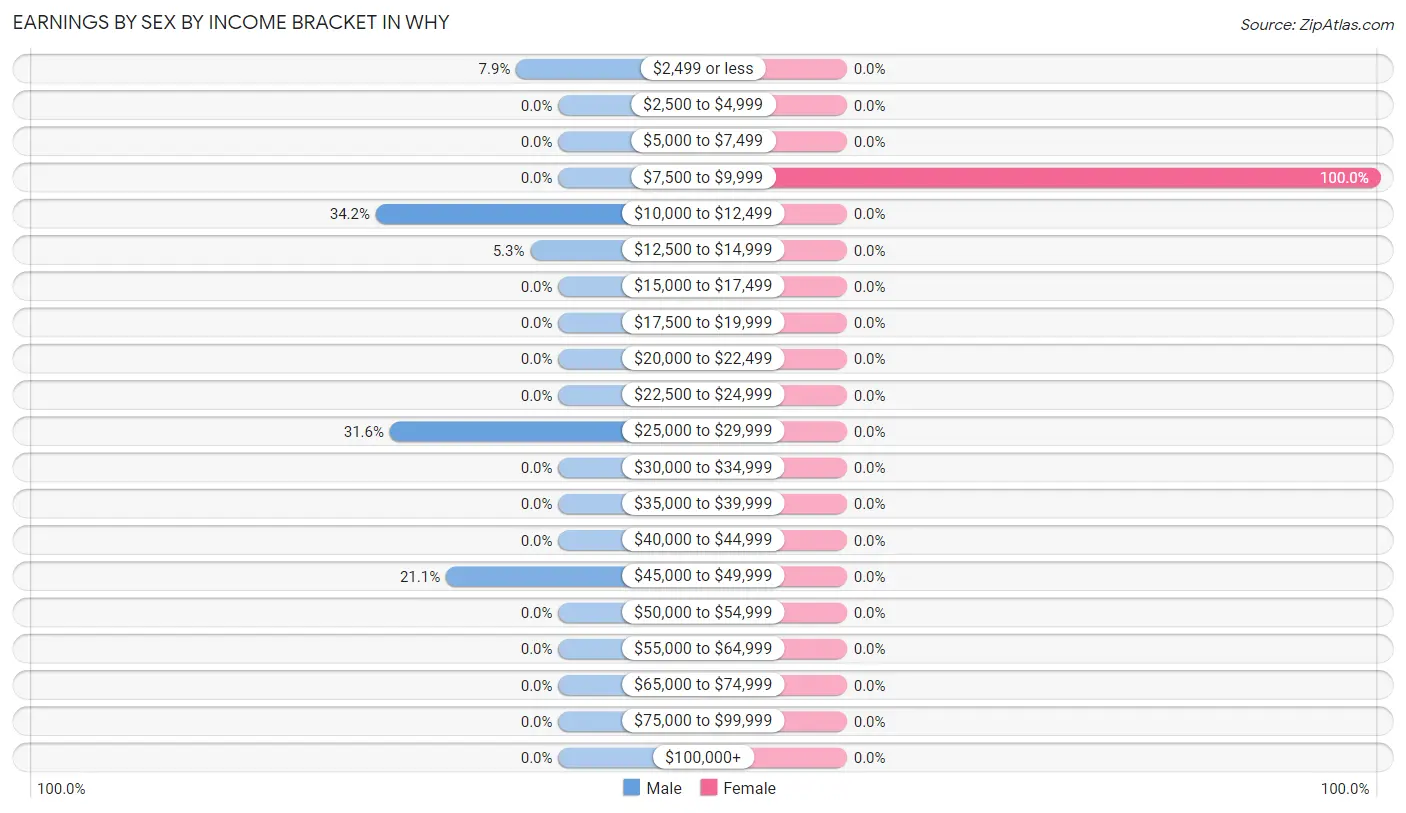
Earnings by Sex by Income Bracket in Why
The most common earnings brackets in Why are $10,000 to $12,499 for men (13 | 34.2%) and $7,500 to $9,999 for women (8 | 100.0%).
| Income | Male | Female |
| $2,499 or less | 3 (7.9%) | 0 (0.0%) |
| $2,500 to $4,999 | 0 (0.0%) | 0 (0.0%) |
| $5,000 to $7,499 | 0 (0.0%) | 0 (0.0%) |
| $7,500 to $9,999 | 0 (0.0%) | 8 (100.0%) |
| $10,000 to $12,499 | 13 (34.2%) | 0 (0.0%) |
| $12,500 to $14,999 | 2 (5.3%) | 0 (0.0%) |
| $15,000 to $17,499 | 0 (0.0%) | 0 (0.0%) |
| $17,500 to $19,999 | 0 (0.0%) | 0 (0.0%) |
| $20,000 to $22,499 | 0 (0.0%) | 0 (0.0%) |
| $22,500 to $24,999 | 0 (0.0%) | 0 (0.0%) |
| $25,000 to $29,999 | 12 (31.6%) | 0 (0.0%) |
| $30,000 to $34,999 | 0 (0.0%) | 0 (0.0%) |
| $35,000 to $39,999 | 0 (0.0%) | 0 (0.0%) |
| $40,000 to $44,999 | 0 (0.0%) | 0 (0.0%) |
| $45,000 to $49,999 | 8 (21.0%) | 0 (0.0%) |
| $50,000 to $54,999 | 0 (0.0%) | 0 (0.0%) |
| $55,000 to $64,999 | 0 (0.0%) | 0 (0.0%) |
| $65,000 to $74,999 | 0 (0.0%) | 0 (0.0%) |
| $75,000 to $99,999 | 0 (0.0%) | 0 (0.0%) |
| $100,000+ | 0 (0.0%) | 0 (0.0%) |
| Total | 38 (100.0%) | 8 (100.0%) |
Earnings by Sex by Educational Attainment in Why
| Educational Attainment | Male Income | Female Income |
| Less than High School | - | - |
| High School Diploma | - | - |
| College or Associate's Degree | - | - |
| Bachelor's Degree | - | - |
| Graduate Degree | - | - |
| Total | - | - |
Family Income in Why
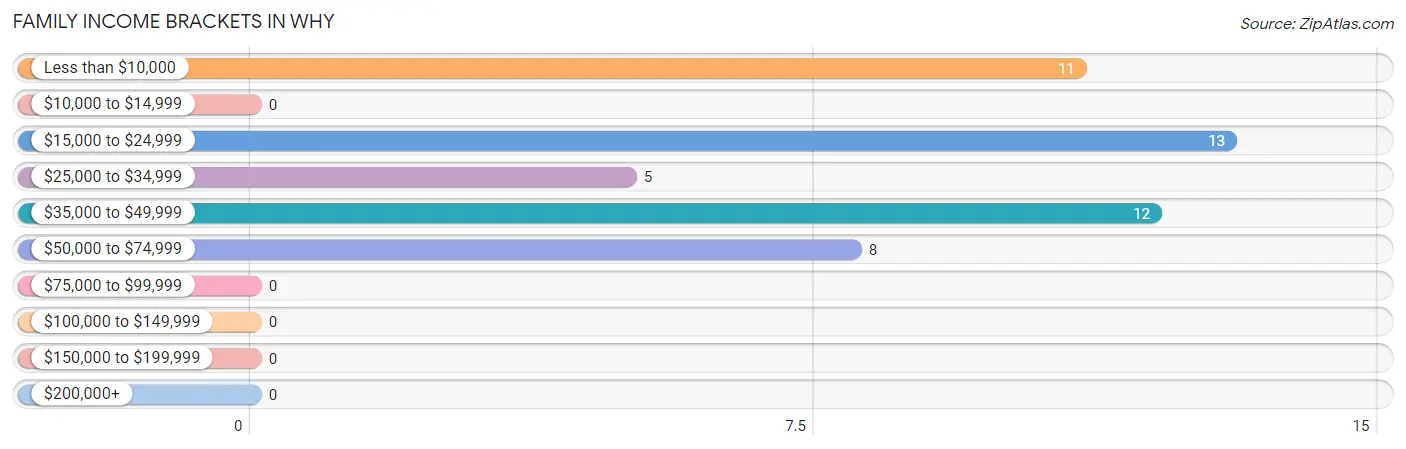
Family Income Brackets in Why
According to the Why family income data, there are 13 families falling into the $15,000 to $24,999 income range, which is the most common income bracket and makes up 26.5% of all families.
| Income Bracket | # Families | % Families |
| Less than $10,000 | 11 | 22.4% |
| $10,000 to $14,999 | 0 | 0.0% |
| $15,000 to $24,999 | 13 | 26.5% |
| $25,000 to $34,999 | 5 | 10.2% |
| $35,000 to $49,999 | 12 | 24.5% |
| $50,000 to $74,999 | 8 | 16.3% |
| $75,000 to $99,999 | 0 | 0.0% |
| $100,000 to $149,999 | 0 | 0.0% |
| $150,000 to $199,999 | 0 | 0.0% |
| $200,000+ | 0 | 0.0% |
Family Income by Famaliy Size in Why
| Income Bracket | # Families | Median Income |
| 2-Person Families | 44 (89.8%) | $0 |
| 3-Person Families | 0 (0.0%) | $0 |
| 4-Person Families | 5 (10.2%) | $0 |
| 5-Person Families | 0 (0.0%) | $0 |
| 6-Person Families | 0 (0.0%) | $0 |
| 7+ Person Families | 0 (0.0%) | $0 |
| Total | 49 (100.0%) | $0 |
Family Income by Number of Earners in Why
| Number of Earners | # Families | Median Income |
| No Earners | 11 (22.5%) | $0 |
| 1 Earner | 25 (51.0%) | $0 |
| 2 Earners | 13 (26.5%) | $0 |
| 3+ Earners | 0 (0.0%) | $0 |
| Total | 49 (100.0%) | $0 |
Household Income in Why
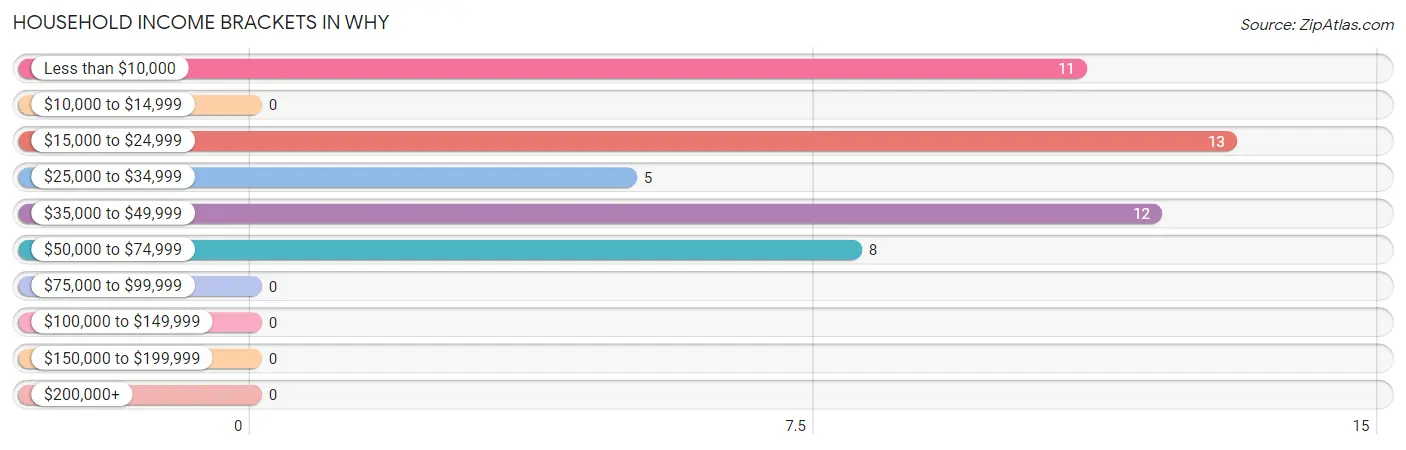
Household Income Brackets in Why
With 13 households falling in the category, the $15,000 to $24,999 income range is the most frequent in Why, accounting for 26.5% of all households.
| Income Bracket | # Households | % Households |
| Less than $10,000 | 11 | 22.4% |
| $10,000 to $14,999 | 0 | 0.0% |
| $15,000 to $24,999 | 13 | 26.5% |
| $25,000 to $34,999 | 5 | 10.2% |
| $35,000 to $49,999 | 12 | 24.5% |
| $50,000 to $74,999 | 8 | 16.3% |
| $75,000 to $99,999 | 0 | 0.0% |
| $100,000 to $149,999 | 0 | 0.0% |
| $150,000 to $199,999 | 0 | 0.0% |
| $200,000+ | 0 | 0.0% |
Household Income by Householder Age in Why
The median household income in Why is $0, with the highest median household income of $18,173 found in the 45 to 64 years age bracket for the primary householder. A total of 29 households (59.2%) fall into this category.
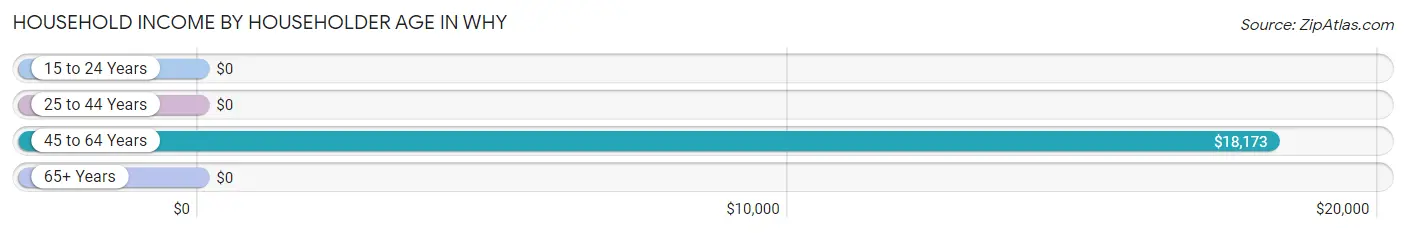
| Income Bracket | # Households | Median Income |
| 15 to 24 Years | 0 (0.0%) | $0 |
| 25 to 44 Years | 0 (0.0%) | $0 |
| 45 to 64 Years | 29 (59.2%) | $18,173 |
| 65+ Years | 20 (40.8%) | $0 |
| Total | 49 (100.0%) | $0 |
Poverty in Why
Income Below Poverty by Sex and Age in Why
With 62.3% poverty level for males and 59.2% for females among the residents of Why, under 5 year old males and 55 to 64 year old females are the most vulnerable to poverty, with 11 males (100.0%) and 29 females (70.7%) in their respective age groups living below the poverty level.
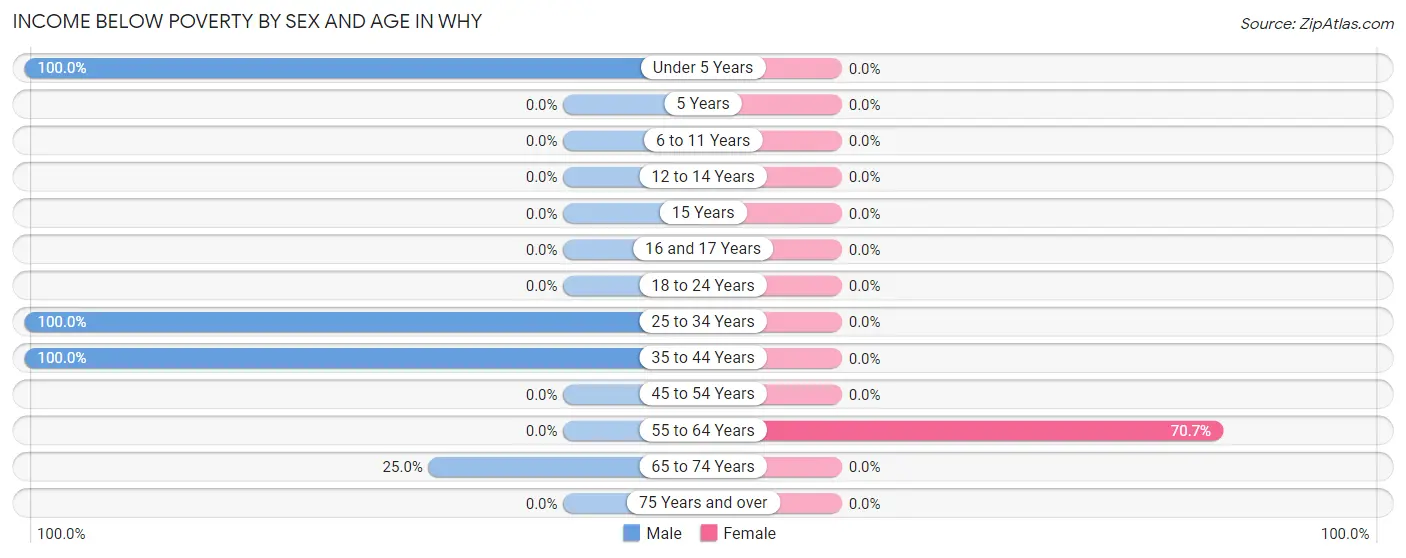
| Age Bracket | Male | Female |
| Under 5 Years | 11 (100.0%) | 0 (0.0%) |
| 5 Years | 0 (0.0%) | 0 (0.0%) |
| 6 to 11 Years | 0 (0.0%) | 0 (0.0%) |
| 12 to 14 Years | 0 (0.0%) | 0 (0.0%) |
| 15 Years | 0 (0.0%) | 0 (0.0%) |
| 16 and 17 Years | 0 (0.0%) | 0 (0.0%) |
| 18 to 24 Years | 0 (0.0%) | 0 (0.0%) |
| 25 to 34 Years | 15 (100.0%) | 0 (0.0%) |
| 35 to 44 Years | 3 (100.0%) | 0 (0.0%) |
| 45 to 54 Years | 0 (0.0%) | 0 (0.0%) |
| 55 to 64 Years | 0 (0.0%) | 29 (70.7%) |
| 65 to 74 Years | 4 (25.0%) | 0 (0.0%) |
| 75 Years and over | 0 (0.0%) | 0 (0.0%) |
| Total | 33 (62.3%) | 29 (59.2%) |
Income Above Poverty by Sex and Age in Why
According to the poverty statistics in Why, males aged 55 to 64 years and females aged 75 years and over are the age groups that are most secure financially, with 100.0% of males and 100.0% of females in these age groups living above the poverty line.
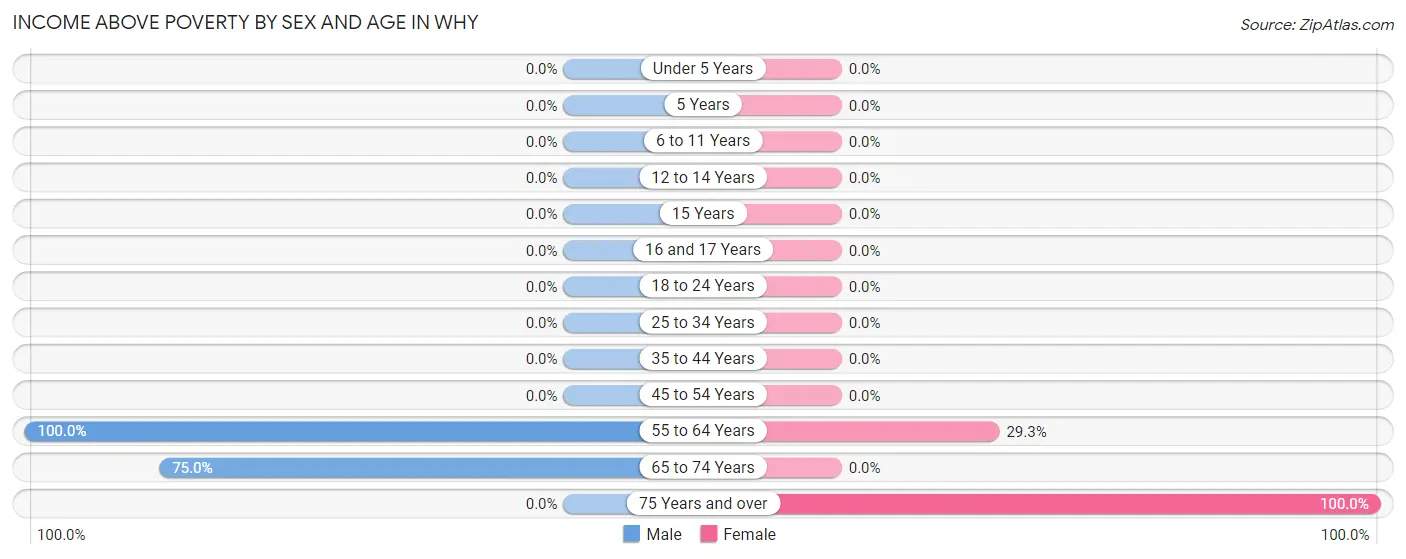
| Age Bracket | Male | Female |
| Under 5 Years | 0 (0.0%) | 0 (0.0%) |
| 5 Years | 0 (0.0%) | 0 (0.0%) |
| 6 to 11 Years | 0 (0.0%) | 0 (0.0%) |
| 12 to 14 Years | 0 (0.0%) | 0 (0.0%) |
| 15 Years | 0 (0.0%) | 0 (0.0%) |
| 16 and 17 Years | 0 (0.0%) | 0 (0.0%) |
| 18 to 24 Years | 0 (0.0%) | 0 (0.0%) |
| 25 to 34 Years | 0 (0.0%) | 0 (0.0%) |
| 35 to 44 Years | 0 (0.0%) | 0 (0.0%) |
| 45 to 54 Years | 0 (0.0%) | 0 (0.0%) |
| 55 to 64 Years | 8 (100.0%) | 12 (29.3%) |
| 65 to 74 Years | 12 (75.0%) | 0 (0.0%) |
| 75 Years and over | 0 (0.0%) | 8 (100.0%) |
| Total | 20 (37.7%) | 20 (40.8%) |
Income Below Poverty Among Married-Couple Families in Why
The poverty statistics for married-couple families in Why show that 20.0% or 5 of the total 25 families live below the poverty line. Families with no children have the highest poverty rate of 20.0%, comprising of 5 families. On the other hand, families with no children have the lowest poverty rate of 20.0%, which includes 5 families.
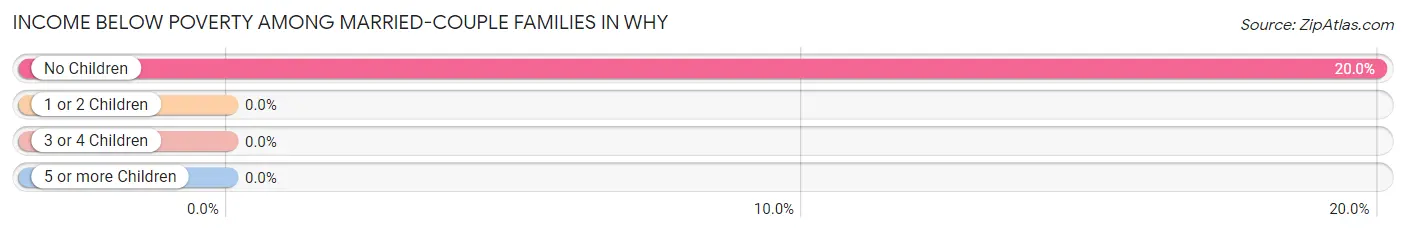
| Children | Above Poverty | Below Poverty |
| No Children | 20 (80.0%) | 5 (20.0%) |
| 1 or 2 Children | 0 (0.0%) | 0 (0.0%) |
| 3 or 4 Children | 0 (0.0%) | 0 (0.0%) |
| 5 or more Children | 0 (0.0%) | 0 (0.0%) |
| Total | 20 (80.0%) | 5 (20.0%) |
Income Below Poverty Among Single-Parent Households in Why
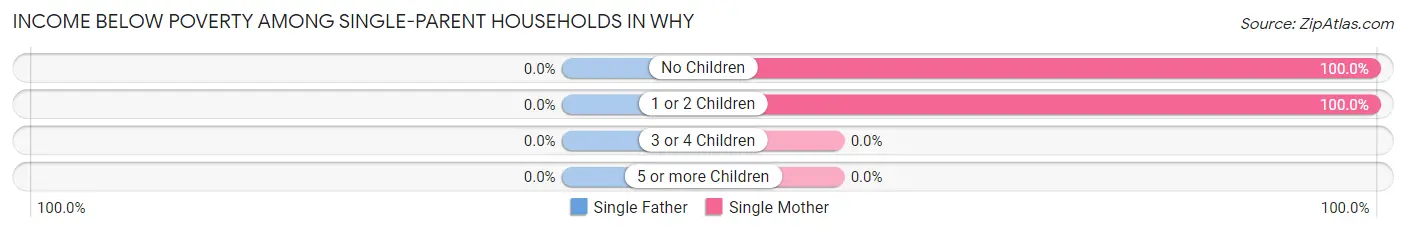
| Children | Single Father | Single Mother |
| No Children | 0 (0.0%) | 13 (100.0%) |
| 1 or 2 Children | 0 (0.0%) | 11 (100.0%) |
| 3 or 4 Children | 0 (0.0%) | 0 (0.0%) |
| 5 or more Children | 0 (0.0%) | 0 (0.0%) |
| Total | 0 (0.0%) | 24 (100.0%) |
Income Below Poverty Among Married-Couple vs Single-Parent Households in Why
The poverty data for Why shows that 5 of the married-couple family households (20.0%) and 24 of the single-parent households (100.0%) are living below the poverty level. Within the married-couple family households, those with no children have the highest poverty rate, with 5 households (20.0%) falling below the poverty line. Among the single-parent households, those with no children have the highest poverty rate, with 13 household (100.0%) living below poverty.
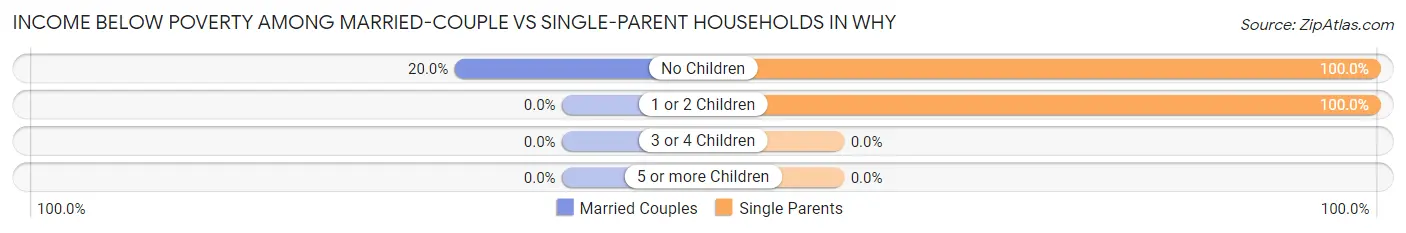
| Children | Married-Couple Families | Single-Parent Households |
| No Children | 5 (20.0%) | 13 (100.0%) |
| 1 or 2 Children | 0 (0.0%) | 11 (100.0%) |
| 3 or 4 Children | 0 (0.0%) | 0 (0.0%) |
| 5 or more Children | 0 (0.0%) | 0 (0.0%) |
| Total | 5 (20.0%) | 24 (100.0%) |
Race in Why
The most populous races in Why are White / Caucasian (93 | 91.2%), Native / Alaskan (6 | 5.9%), and Two or more Races (3 | 2.9%).
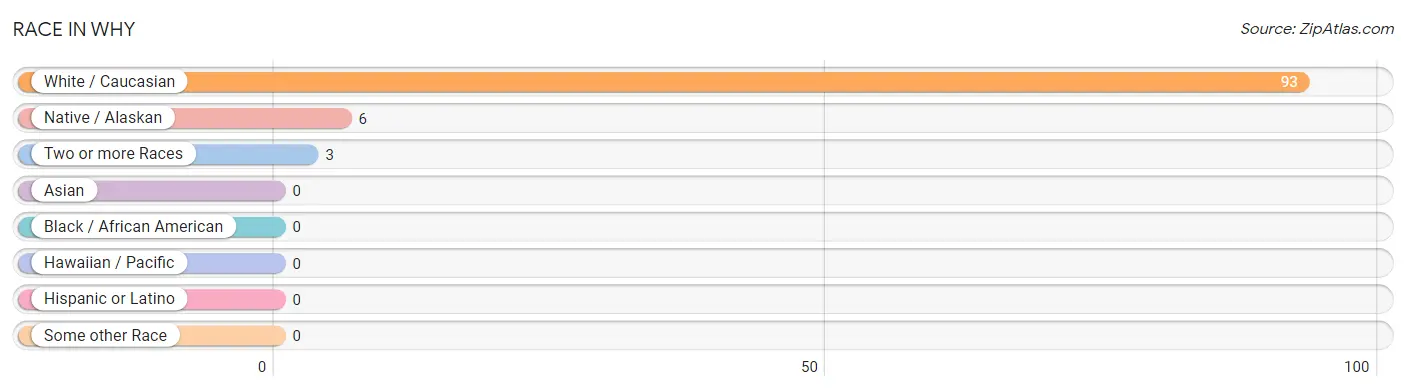
| Race | # Population | % Population |
| Asian | 0 | 0.0% |
| Black / African American | 0 | 0.0% |
| Hawaiian / Pacific | 0 | 0.0% |
| Hispanic or Latino | 0 | 0.0% |
| Native / Alaskan | 6 | 5.9% |
| White / Caucasian | 93 | 91.2% |
| Two or more Races | 3 | 2.9% |
| Some other Race | 0 | 0.0% |
| Total | 102 | 100.0% |
Ancestry in Why
The most populous ancestries reported in Why are English (29 | 28.4%), and Scottish (5 | 4.9%), together accounting for 33.3% of all Why residents.
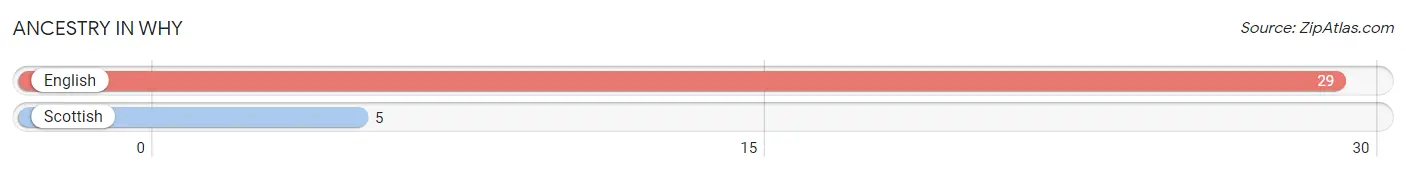
| Ancestry | # Population | % Population |
| English | 29 | 28.4% |
| Scottish | 5 | 4.9% | View All 2 Rows |
Immigrants in Why

| Immigration Origin | # Population | % Population | View All 0 Rows |
Sex and Age in Why
Sex and Age in Why
The most populous age groups in Why are 30 to 34 Years (15 | 28.3%) for men and 60 to 64 Years (24 | 49.0%) for women.
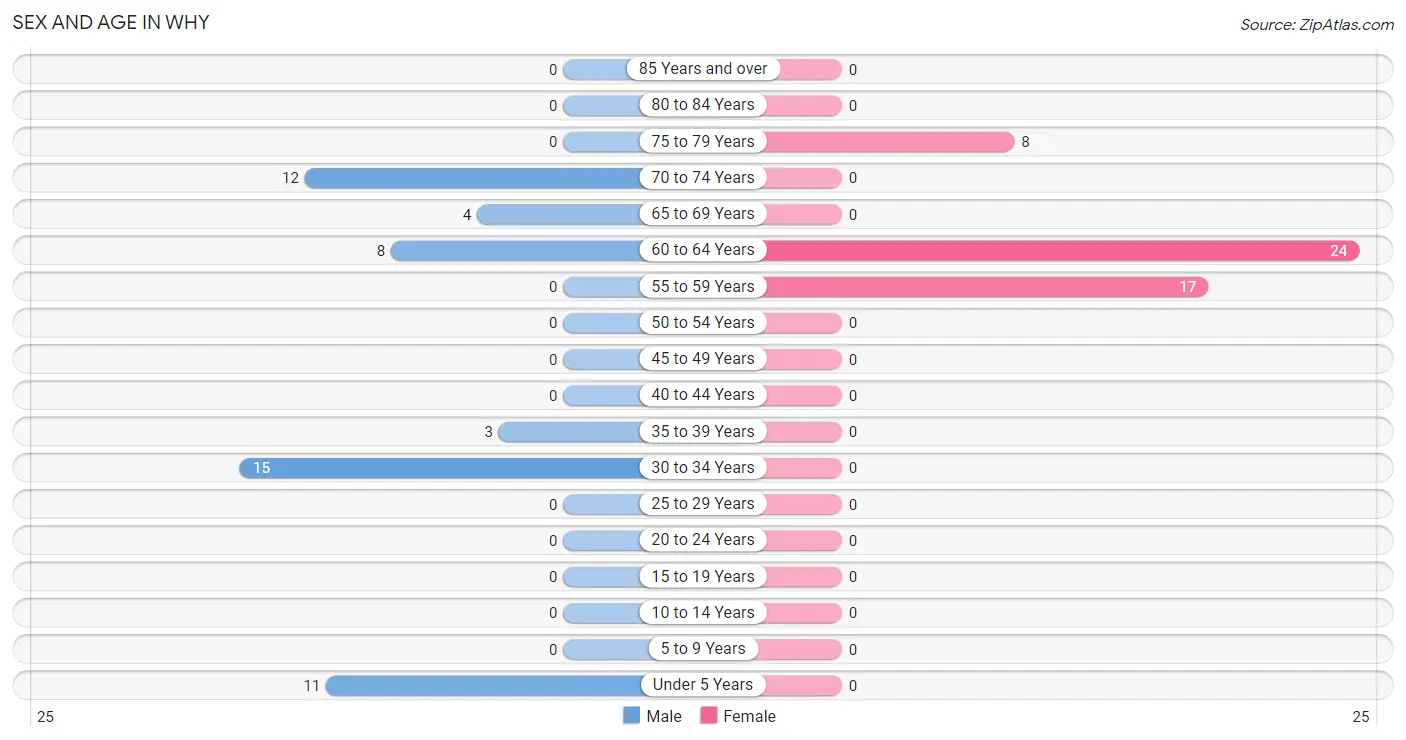
| Age Bracket | Male | Female |
| Under 5 Years | 11 (20.7%) | 0 (0.0%) |
| 5 to 9 Years | 0 (0.0%) | 0 (0.0%) |
| 10 to 14 Years | 0 (0.0%) | 0 (0.0%) |
| 15 to 19 Years | 0 (0.0%) | 0 (0.0%) |
| 20 to 24 Years | 0 (0.0%) | 0 (0.0%) |
| 25 to 29 Years | 0 (0.0%) | 0 (0.0%) |
| 30 to 34 Years | 15 (28.3%) | 0 (0.0%) |
| 35 to 39 Years | 3 (5.7%) | 0 (0.0%) |
| 40 to 44 Years | 0 (0.0%) | 0 (0.0%) |
| 45 to 49 Years | 0 (0.0%) | 0 (0.0%) |
| 50 to 54 Years | 0 (0.0%) | 0 (0.0%) |
| 55 to 59 Years | 0 (0.0%) | 17 (34.7%) |
| 60 to 64 Years | 8 (15.1%) | 24 (49.0%) |
| 65 to 69 Years | 4 (7.5%) | 0 (0.0%) |
| 70 to 74 Years | 12 (22.6%) | 0 (0.0%) |
| 75 to 79 Years | 0 (0.0%) | 8 (16.3%) |
| 80 to 84 Years | 0 (0.0%) | 0 (0.0%) |
| 85 Years and over | 0 (0.0%) | 0 (0.0%) |
| Total | 53 (100.0%) | 49 (100.0%) |
Families and Households in Why
Median Family Size in Why
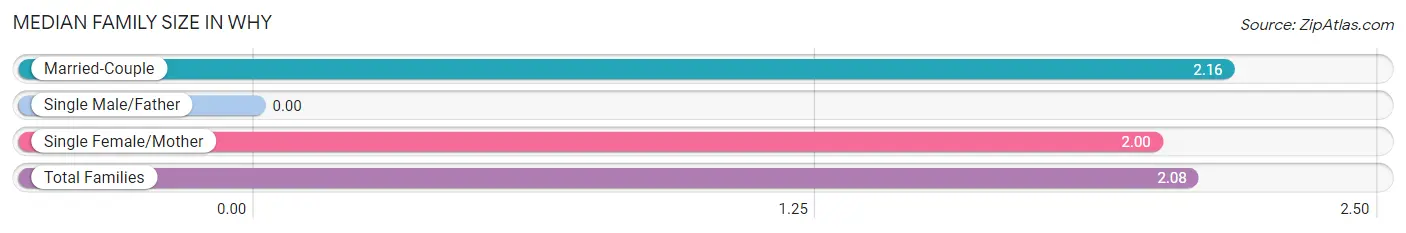
| Family Type | # Families | Family Size |
| Married-Couple | 25 (51.0%) | 2.16 |
| Single Male/Father | 0 (0.0%) | - |
| Single Female/Mother | 24 (49.0%) | 2.00 |
| Total Families | 49 (100.0%) | 2.08 |
Median Household Size in Why
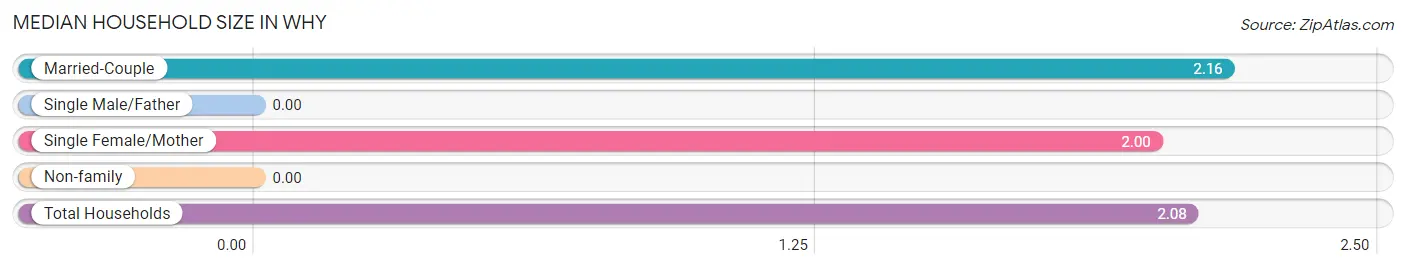
| Household Type | # Households | Household Size |
| Married-Couple | 25 (51.0%) | 2.16 |
| Single Male/Father | 0 (0.0%) | - |
| Single Female/Mother | 24 (49.0%) | 2.00 |
| Non-family | 0 (0.0%) | - |
| Total Households | 49 (100.0%) | 2.08 |
Household Size by Marriage Status in Why
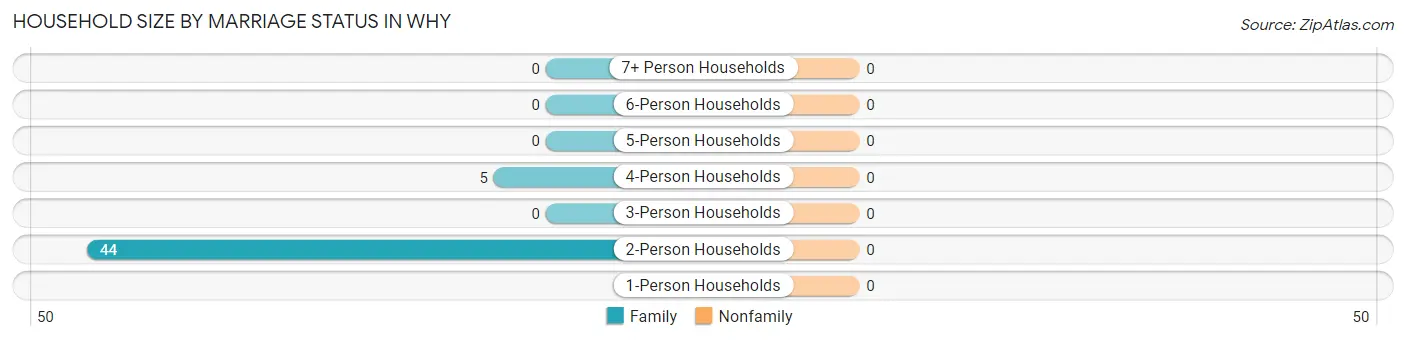
| Household Size | Family Households | Nonfamily Households |
| 1-Person Households | - | 0 (0.0%) |
| 2-Person Households | 44 (89.8%) | 0 (0.0%) |
| 3-Person Households | 0 (0.0%) | 0 (0.0%) |
| 4-Person Households | 5 (10.2%) | 0 (0.0%) |
| 5-Person Households | 0 (0.0%) | 0 (0.0%) |
| 6-Person Households | 0 (0.0%) | 0 (0.0%) |
| 7+ Person Households | 0 (0.0%) | 0 (0.0%) |
| Total | 49 (100.0%) | 0 (0.0%) |
Female Fertility in Why
Fertility by Age in Why
| Age Bracket | Women with Births | Births / 1,000 Women |
| 15 to 19 years | 0 (0.0%) | 0.0 |
| 20 to 34 years | 0 (0.0%) | 0.0 |
| 35 to 50 years | 0 (0.0%) | 0.0 |
| Total | 0 (0.0%) | 0.0 |
Fertility by Age by Marriage Status in Why
| Age Bracket | Married | Unmarried |
| 15 to 19 years | 0 (0.0%) | 0 (0.0%) |
| 20 to 34 years | 0 (0.0%) | 0 (0.0%) |
| 35 to 50 years | 0 (0.0%) | 0 (0.0%) |
| Total | 0 (0.0%) | 0 (0.0%) |
Fertility by Education in Why
| Educational Attainment | Women with Births | Births / 1,000 Women |
| Less than High School | 0 (0.0%) | 0.0 |
| High School Diploma | 0 (0.0%) | 0.0 |
| College or Associate's Degree | 0 (0.0%) | 0.0 |
| Bachelor's Degree | 0 (0.0%) | 0.0 |
| Graduate Degree | 0 (0.0%) | 0.0 |
| Total | 0 (0.0%) | 0.0 |
Fertility by Education by Marriage Status in Why
| Educational Attainment | Married | Unmarried |
| Less than High School | 0 (0.0%) | 0 (0.0%) |
| High School Diploma | 0 (0.0%) | 0 (0.0%) |
| College or Associate's Degree | 0 (0.0%) | 0 (0.0%) |
| Bachelor's Degree | 0 (0.0%) | 0 (0.0%) |
| Graduate Degree | 0 (0.0%) | 0 (0.0%) |
| Total | 0 (0.0%) | 0 (0.0%) |
Employment Characteristics in Why
Employment by Class of Employer in Why
Among the 31 employed individuals in Why, private company employees (15 | 48.4%), self-employed (not incorporated) (8 | 25.8%), and local government employees (8 | 25.8%) make up the most common classes of employment.
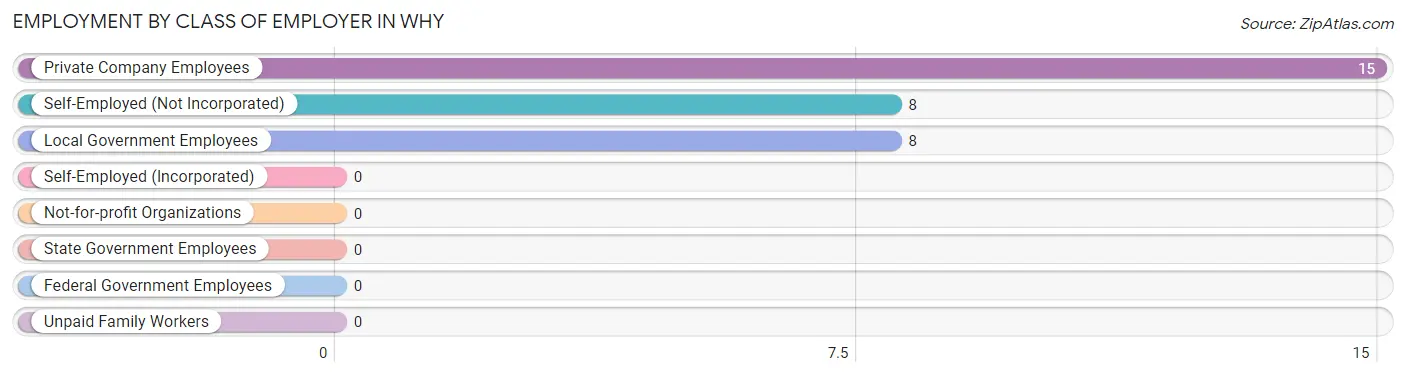
| Employer Class | # Employees | % Employees |
| Private Company Employees | 15 | 48.4% |
| Self-Employed (Incorporated) | 0 | 0.0% |
| Self-Employed (Not Incorporated) | 8 | 25.8% |
| Not-for-profit Organizations | 0 | 0.0% |
| Local Government Employees | 8 | 25.8% |
| State Government Employees | 0 | 0.0% |
| Federal Government Employees | 0 | 0.0% |
| Unpaid Family Workers | 0 | 0.0% |
| Total | 31 | 100.0% |
Employment Status by Age in Why
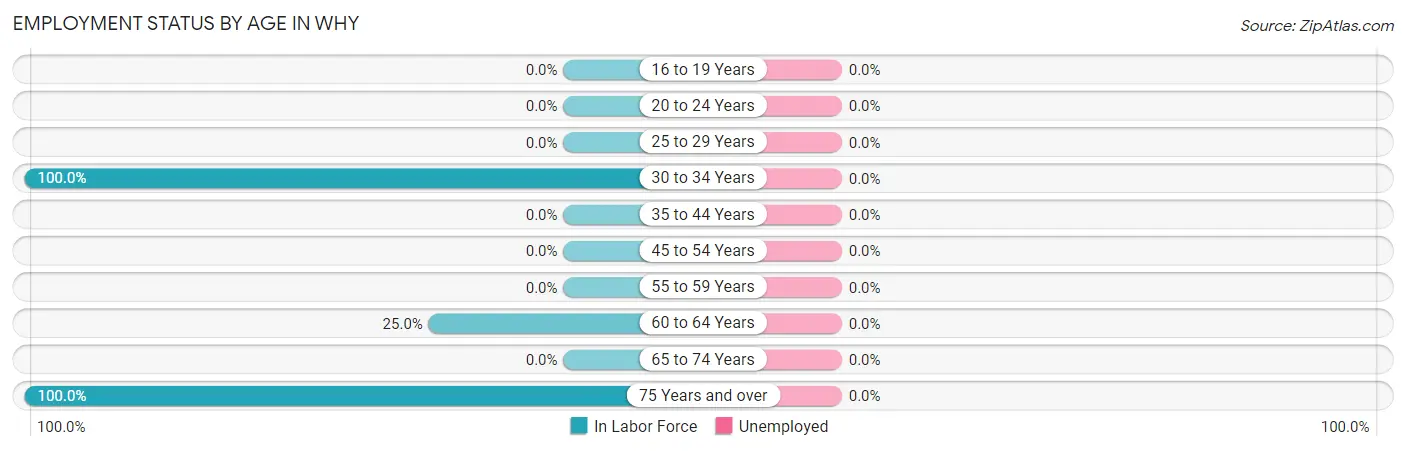
| Age Bracket | In Labor Force | Unemployed |
| 16 to 19 Years | 0 (0.0%) | 0 (0.0%) |
| 20 to 24 Years | 0 (0.0%) | 0 (0.0%) |
| 25 to 29 Years | 0 (0.0%) | 0 (0.0%) |
| 30 to 34 Years | 15 (100.0%) | 0 (0.0%) |
| 35 to 44 Years | 0 (0.0%) | 0 (0.0%) |
| 45 to 54 Years | 0 (0.0%) | 0 (0.0%) |
| 55 to 59 Years | 0 (0.0%) | 0 (0.0%) |
| 60 to 64 Years | 8 (25.0%) | 0 (0.0%) |
| 65 to 74 Years | 0 (0.0%) | 0 (0.0%) |
| 75 Years and over | 8 (100.0%) | 0 (0.0%) |
| Total | 31 (34.1%) | 0 (0.0%) |
Employment Status by Educational Attainment in Why
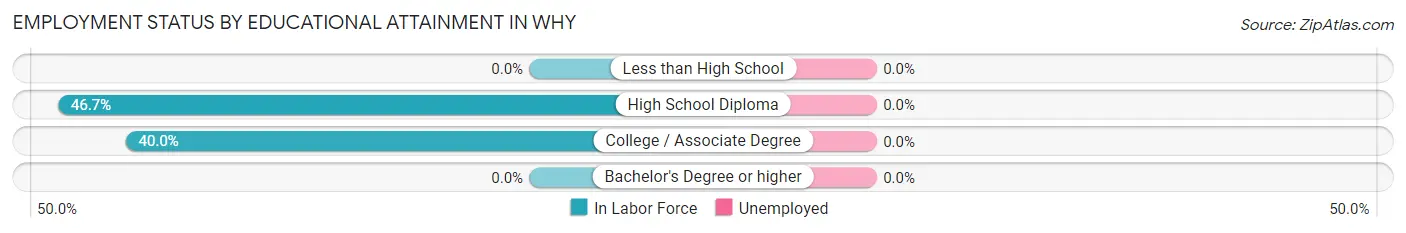
| Educational Attainment | In Labor Force | Unemployed |
| Less than High School | 0 (0.0%) | 0 (0.0%) |
| High School Diploma | 21 (46.7%) | 0 (0.0%) |
| College / Associate Degree | 2 (40.0%) | 0 (0.0%) |
| Bachelor's Degree or higher | 0 (0.0%) | 0 (0.0%) |
| Total | 23 (34.3%) | 0 (0.0%) |
Employment Occupations by Sex in Why
Management, Business, Science and Arts Occupations
The most common Management, Business, Science and Arts occupations in Why are Community & Social Service (10 | 32.3%), Education Instruction & Library (10 | 32.3%), and Management (8 | 25.8%).
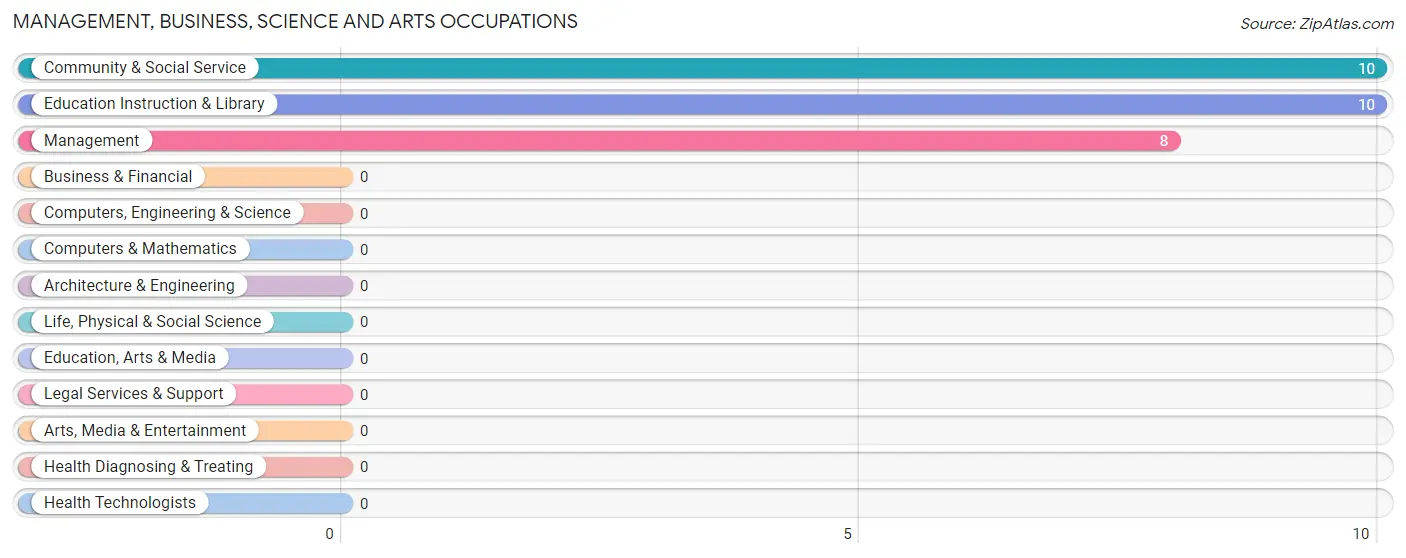
Management, Business, Science and Arts Occupations by Sex
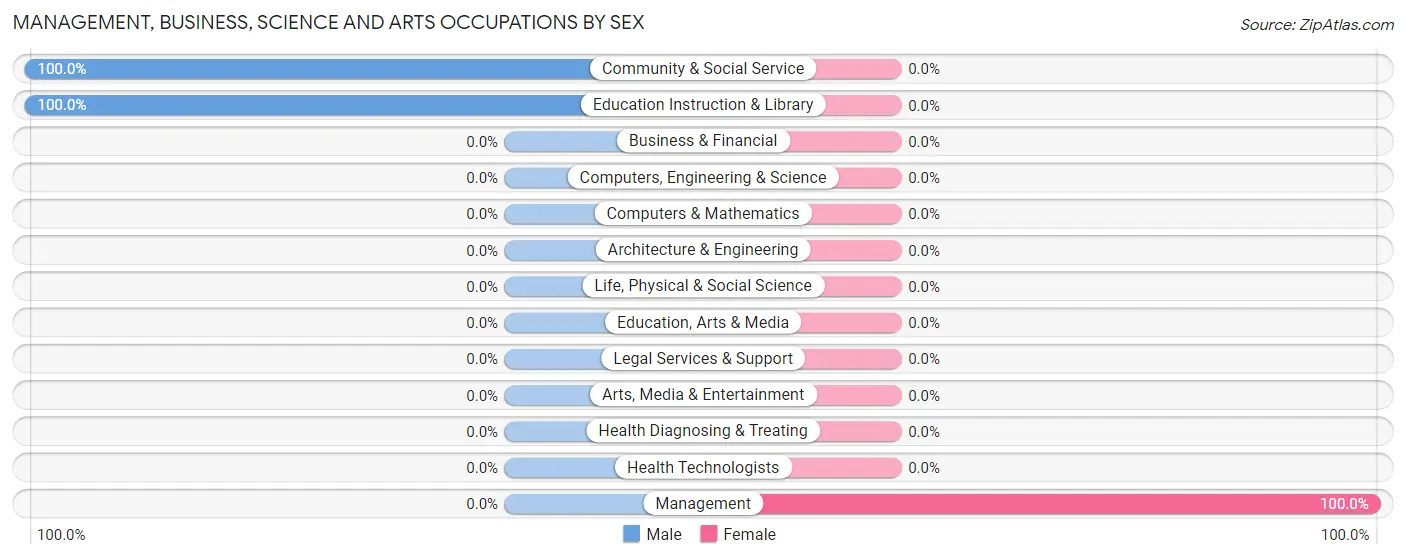
| Occupation | Male | Female |
| Management | 0 (0.0%) | 8 (100.0%) |
| Business & Financial | 0 (0.0%) | 0 (0.0%) |
| Computers, Engineering & Science | 0 (0.0%) | 0 (0.0%) |
| Computers & Mathematics | 0 (0.0%) | 0 (0.0%) |
| Architecture & Engineering | 0 (0.0%) | 0 (0.0%) |
| Life, Physical & Social Science | 0 (0.0%) | 0 (0.0%) |
| Community & Social Service | 10 (100.0%) | 0 (0.0%) |
| Education, Arts & Media | 0 (0.0%) | 0 (0.0%) |
| Legal Services & Support | 0 (0.0%) | 0 (0.0%) |
| Education Instruction & Library | 10 (100.0%) | 0 (0.0%) |
| Arts, Media & Entertainment | 0 (0.0%) | 0 (0.0%) |
| Health Diagnosing & Treating | 0 (0.0%) | 0 (0.0%) |
| Health Technologists | 0 (0.0%) | 0 (0.0%) |
| Total (Category) | 10 (55.6%) | 8 (44.4%) |
| Total (Overall) | 23 (74.2%) | 8 (25.8%) |
Services Occupations
The most common Services occupations in Why are , and Healthcare Support (13 | 41.9%).
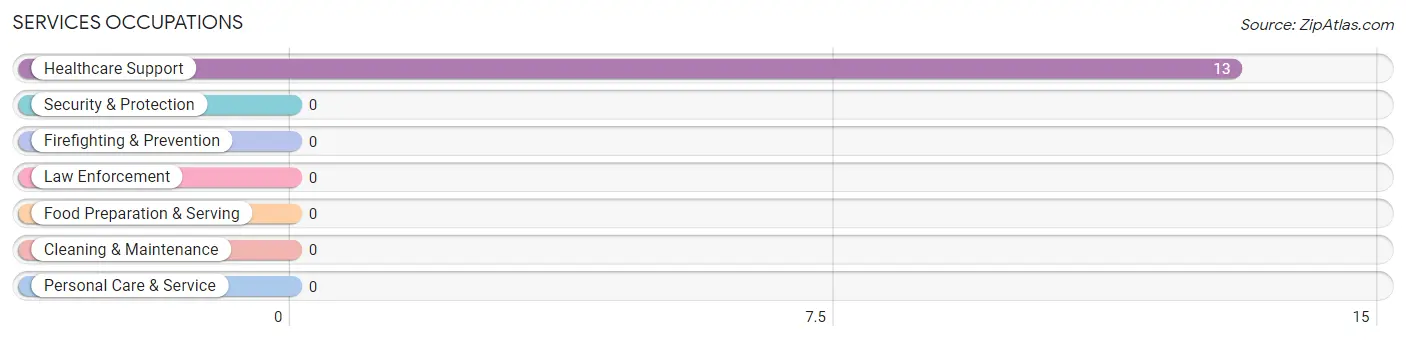
Services Occupations by Sex
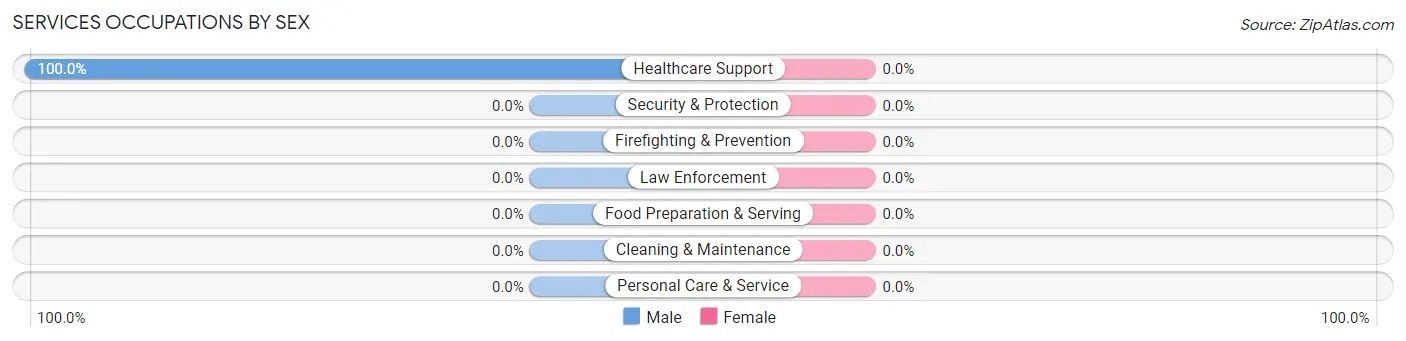
| Occupation | Male | Female |
| Healthcare Support | 13 (100.0%) | 0 (0.0%) |
| Security & Protection | 0 (0.0%) | 0 (0.0%) |
| Firefighting & Prevention | 0 (0.0%) | 0 (0.0%) |
| Law Enforcement | 0 (0.0%) | 0 (0.0%) |
| Food Preparation & Serving | 0 (0.0%) | 0 (0.0%) |
| Cleaning & Maintenance | 0 (0.0%) | 0 (0.0%) |
| Personal Care & Service | 0 (0.0%) | 0 (0.0%) |
| Total (Category) | 13 (100.0%) | 0 (0.0%) |
| Total (Overall) | 23 (74.2%) | 8 (25.8%) |
Sales and Office Occupations
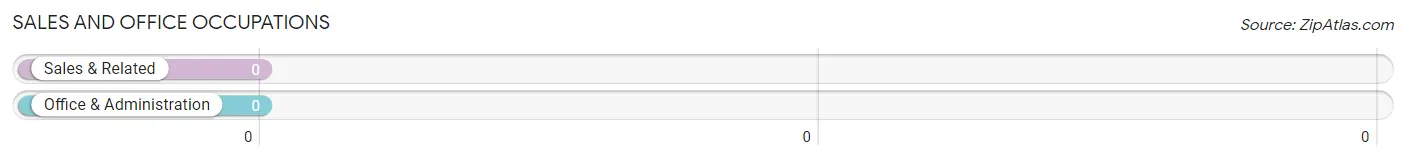
Sales and Office Occupations by Sex
| Occupation | Male | Female |
| Sales & Related | 0 (0.0%) | 0 (0.0%) |
| Office & Administration | 0 (0.0%) | 0 (0.0%) |
| Total (Category) | 0 (0.0%) | 0 (0.0%) |
| Total (Overall) | 23 (74.2%) | 8 (25.8%) |
Natural Resources, Construction and Maintenance Occupations
Natural Resources, Construction and Maintenance Occupations by Sex
| Occupation | Male | Female |
| Farming, Fishing & Forestry | 0 (0.0%) | 0 (0.0%) |
| Construction & Extraction | 0 (0.0%) | 0 (0.0%) |
| Installation, Maintenance & Repair | 0 (0.0%) | 0 (0.0%) |
| Total (Category) | 0 (0.0%) | 0 (0.0%) |
| Total (Overall) | 23 (74.2%) | 8 (25.8%) |
Production, Transportation and Moving Occupations
Production, Transportation and Moving Occupations by Sex
| Occupation | Male | Female |
| Production | 0 (0.0%) | 0 (0.0%) |
| Transportation | 0 (0.0%) | 0 (0.0%) |
| Material Moving | 0 (0.0%) | 0 (0.0%) |
| Total (Category) | 0 (0.0%) | 0 (0.0%) |
| Total (Overall) | 23 (74.2%) | 8 (25.8%) |
Employment Industries by Sex in Why
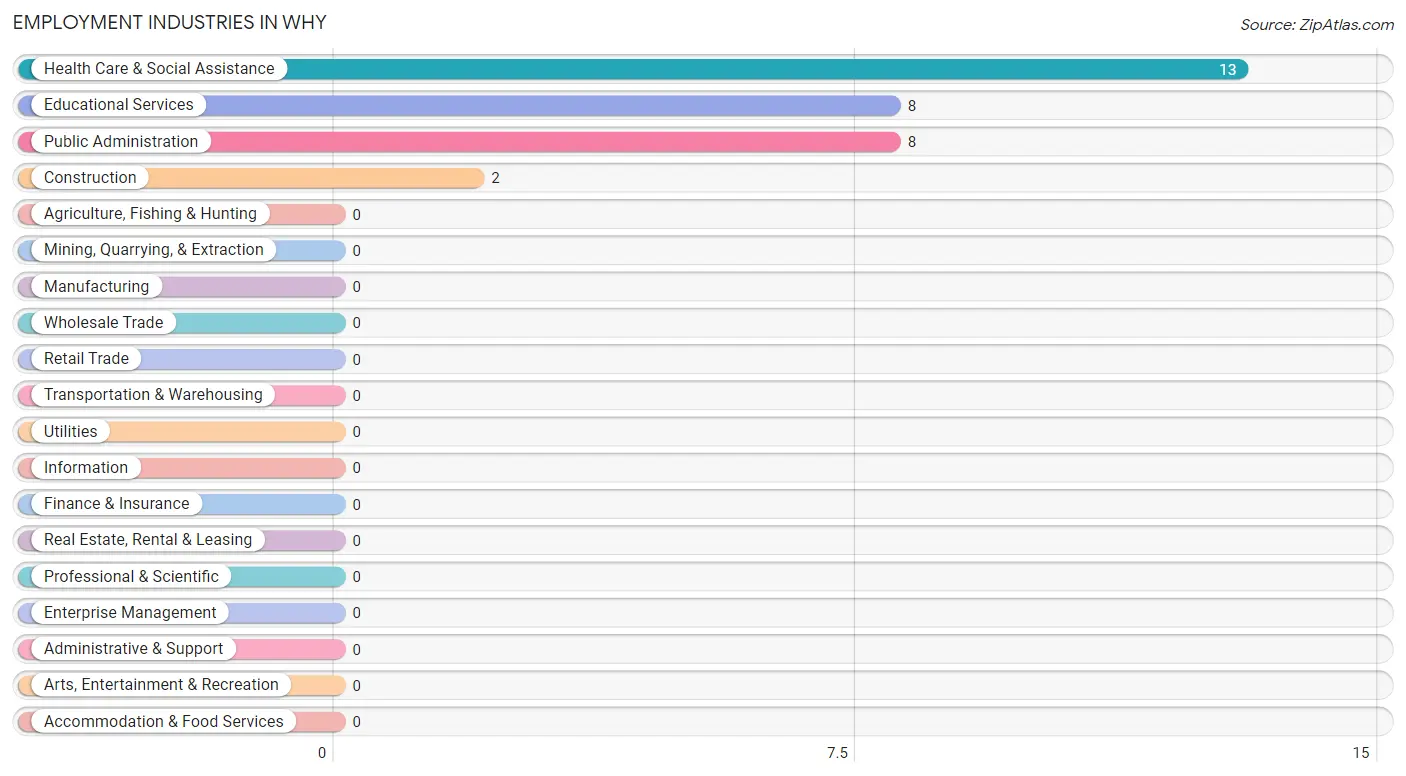
Employment Industries in Why
The major employment industries in Why include Health Care & Social Assistance (13 | 41.9%), Educational Services (8 | 25.8%), Public Administration (8 | 25.8%), and Construction (2 | 6.5%).
Employment Industries by Sex in Why
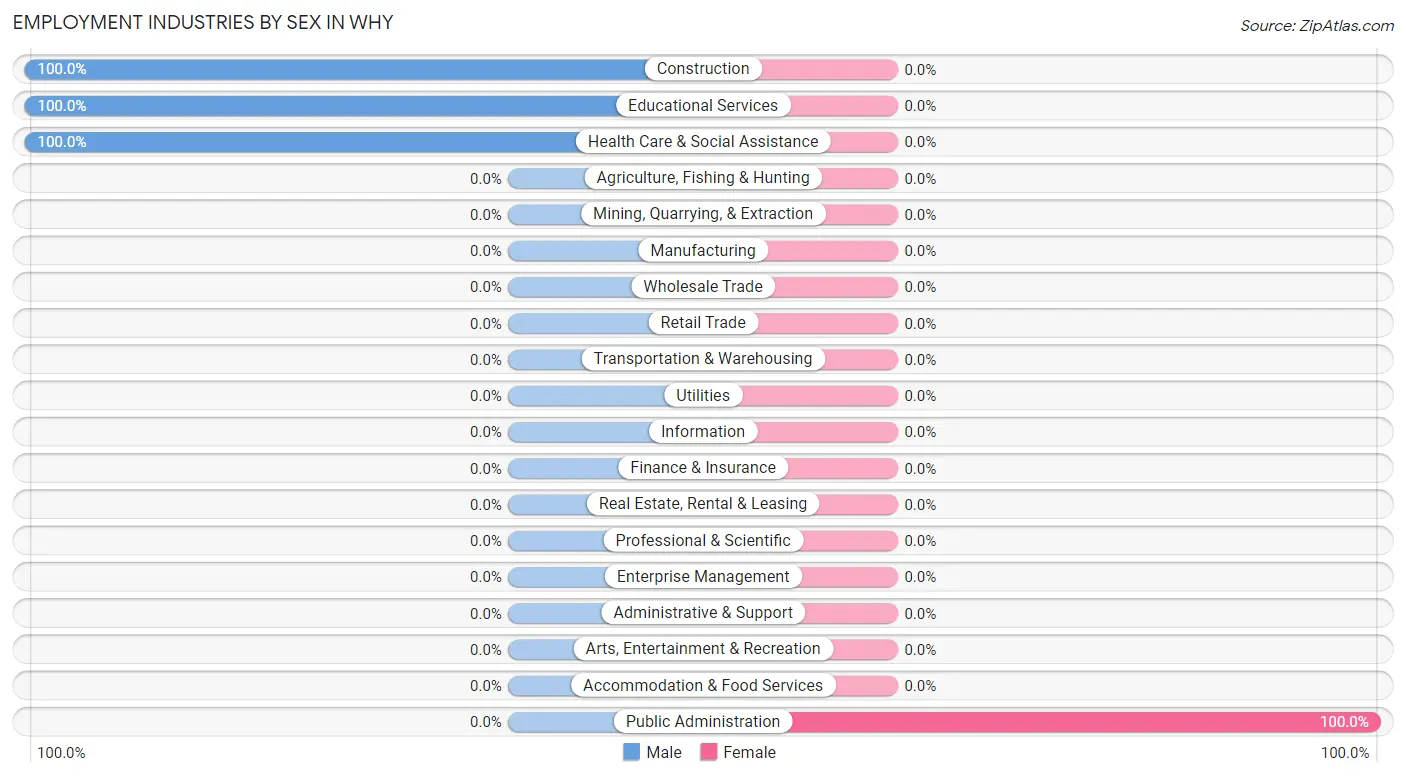
| Industry | Male | Female |
| Agriculture, Fishing & Hunting | 0 (0.0%) | 0 (0.0%) |
| Mining, Quarrying, & Extraction | 0 (0.0%) | 0 (0.0%) |
| Construction | 2 (100.0%) | 0 (0.0%) |
| Manufacturing | 0 (0.0%) | 0 (0.0%) |
| Wholesale Trade | 0 (0.0%) | 0 (0.0%) |
| Retail Trade | 0 (0.0%) | 0 (0.0%) |
| Transportation & Warehousing | 0 (0.0%) | 0 (0.0%) |
| Utilities | 0 (0.0%) | 0 (0.0%) |
| Information | 0 (0.0%) | 0 (0.0%) |
| Finance & Insurance | 0 (0.0%) | 0 (0.0%) |
| Real Estate, Rental & Leasing | 0 (0.0%) | 0 (0.0%) |
| Professional & Scientific | 0 (0.0%) | 0 (0.0%) |
| Enterprise Management | 0 (0.0%) | 0 (0.0%) |
| Administrative & Support | 0 (0.0%) | 0 (0.0%) |
| Educational Services | 8 (100.0%) | 0 (0.0%) |
| Health Care & Social Assistance | 13 (100.0%) | 0 (0.0%) |
| Arts, Entertainment & Recreation | 0 (0.0%) | 0 (0.0%) |
| Accommodation & Food Services | 0 (0.0%) | 0 (0.0%) |
| Public Administration | 0 (0.0%) | 8 (100.0%) |
| Total | 23 (74.2%) | 8 (25.8%) |
Education in Why
School Enrollment in Why
| School Level | # Students | % Students |
| Nursery / Preschool | 0 | 0.0% |
| Kindergarten | 0 | 0.0% |
| Elementary School | 0 | 0.0% |
| Middle School | 0 | 0.0% |
| High School | 0 | 0.0% |
| College / Undergraduate | 0 | 0.0% |
| Graduate / Professional | 0 | 0.0% |
| Total | 0 | 0.0% |
School Enrollment by Age by Funding Source in Why
| Age Bracket | Public School | Private School |
| 3 to 4 Year Olds | 0 (0.0%) | 0 (0.0%) |
| 5 to 9 Year Old | 0 (0.0%) | 0 (0.0%) |
| 10 to 14 Year Olds | 0 (0.0%) | 0 (0.0%) |
| 15 to 17 Year Olds | 0 (0.0%) | 0 (0.0%) |
| 18 to 19 Year Olds | 0 (0.0%) | 0 (0.0%) |
| 20 to 24 Year Olds | 0 (0.0%) | 0 (0.0%) |
| 25 to 34 Year Olds | 0 (0.0%) | 0 (0.0%) |
| 35 Years and over | 0 (0.0%) | 0 (0.0%) |
| Total | 0 (0.0%) | 0 (0.0%) |
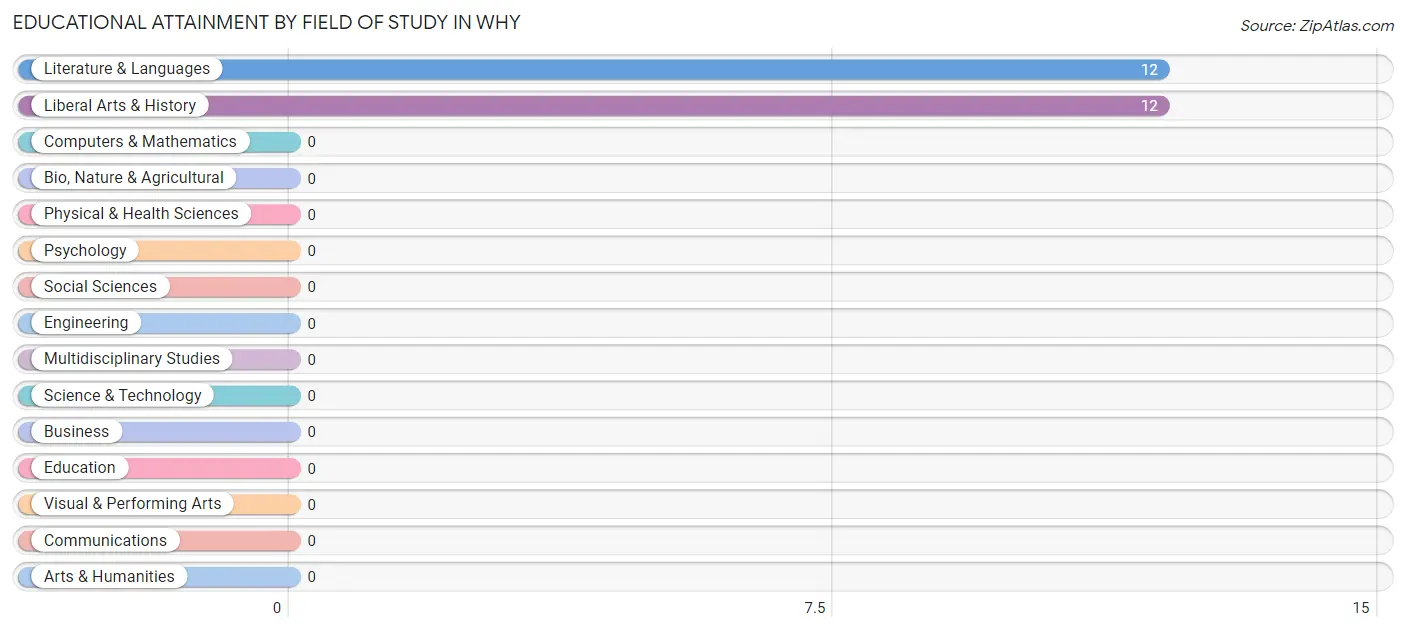
Educational Attainment by Field of Study in Why
Literature & languages (12 | 50.0%), and liberal arts & history (12 | 50.0%) are the most common fields of study among 24 individuals in Why who have obtained a bachelor's degree or higher.
| Field of Study | # Graduates | % Graduates |
| Computers & Mathematics | 0 | 0.0% |
| Bio, Nature & Agricultural | 0 | 0.0% |
| Physical & Health Sciences | 0 | 0.0% |
| Psychology | 0 | 0.0% |
| Social Sciences | 0 | 0.0% |
| Engineering | 0 | 0.0% |
| Multidisciplinary Studies | 0 | 0.0% |
| Science & Technology | 0 | 0.0% |
| Business | 0 | 0.0% |
| Education | 0 | 0.0% |
| Literature & Languages | 12 | 50.0% |
| Liberal Arts & History | 12 | 50.0% |
| Visual & Performing Arts | 0 | 0.0% |
| Communications | 0 | 0.0% |
| Arts & Humanities | 0 | 0.0% |
| Total | 24 | 100.0% |
Transportation & Commute in Why
Vehicle Availability by Sex in Why
The most prevalent vehicle ownership categories in Why are males with 2 vehicles (21, accounting for 91.3%) and females with 2 vehicles (8, making up 262.5%).
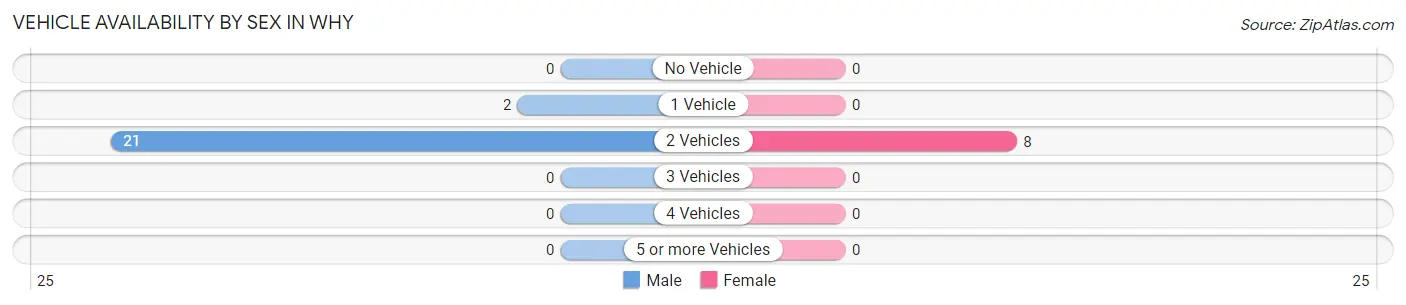
| Vehicles Available | Male | Female |
| No Vehicle | 0 (0.0%) | 0 (0.0%) |
| 1 Vehicle | 2 (8.7%) | 0 (0.0%) |
| 2 Vehicles | 21 (91.3%) | 8 (100.0%) |
| 3 Vehicles | 0 (0.0%) | 0 (0.0%) |
| 4 Vehicles | 0 (0.0%) | 0 (0.0%) |
| 5 or more Vehicles | 0 (0.0%) | 0 (0.0%) |
| Total | 23 (100.0%) | 8 (100.0%) |
Commute Time in Why
The most frequently occuring commute durations in Why are 20 to 24 minutes (16 commuters, 51.6%), 15 to 19 minutes (15 commuters, 48.4%), and less than 5 minutes (0 commuters, 0.0%).
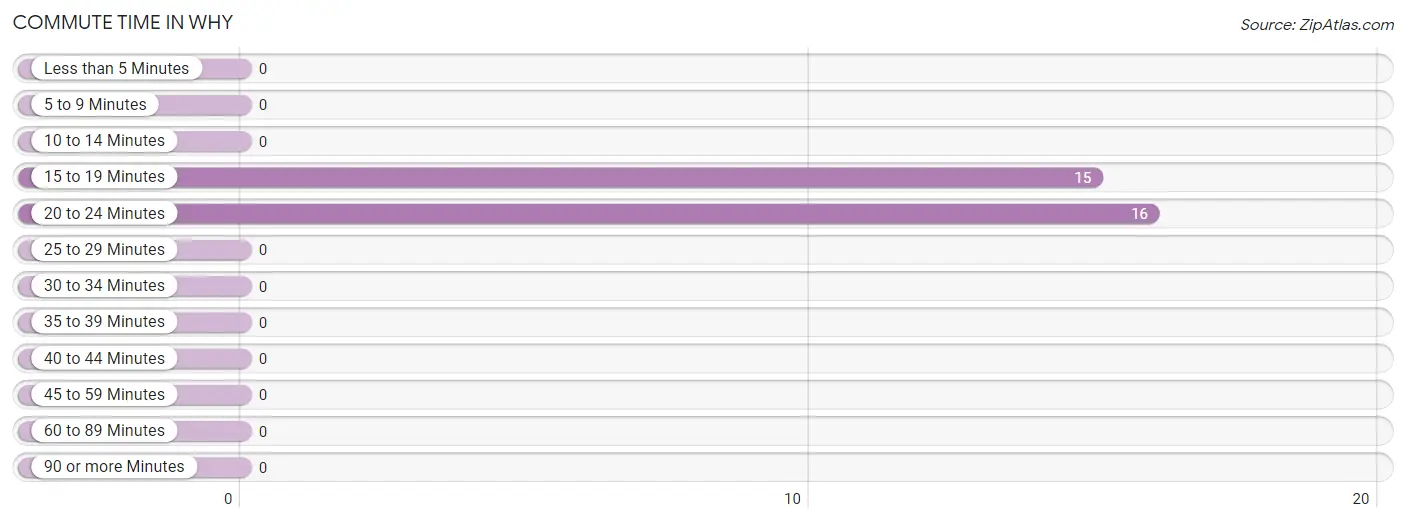
| Commute Time | # Commuters | % Commuters |
| Less than 5 Minutes | 0 | 0.0% |
| 5 to 9 Minutes | 0 | 0.0% |
| 10 to 14 Minutes | 0 | 0.0% |
| 15 to 19 Minutes | 15 | 48.4% |
| 20 to 24 Minutes | 16 | 51.6% |
| 25 to 29 Minutes | 0 | 0.0% |
| 30 to 34 Minutes | 0 | 0.0% |
| 35 to 39 Minutes | 0 | 0.0% |
| 40 to 44 Minutes | 0 | 0.0% |
| 45 to 59 Minutes | 0 | 0.0% |
| 60 to 89 Minutes | 0 | 0.0% |
| 90 or more Minutes | 0 | 0.0% |
Commute Time by Sex in Why
The most common commute times in Why are 15 to 19 minutes (15 commuters, 65.2%) for males and 20 to 24 minutes (8 commuters, 100.0%) for females.
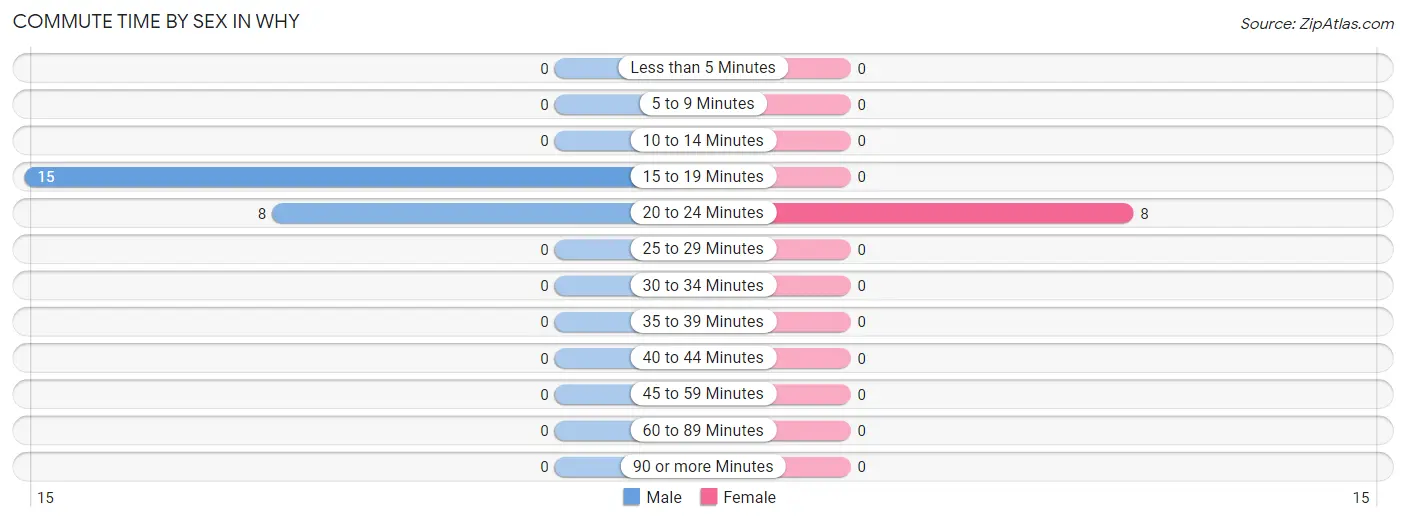
| Commute Time | Male | Female |
| Less than 5 Minutes | 0 (0.0%) | 0 (0.0%) |
| 5 to 9 Minutes | 0 (0.0%) | 0 (0.0%) |
| 10 to 14 Minutes | 0 (0.0%) | 0 (0.0%) |
| 15 to 19 Minutes | 15 (65.2%) | 0 (0.0%) |
| 20 to 24 Minutes | 8 (34.8%) | 8 (100.0%) |
| 25 to 29 Minutes | 0 (0.0%) | 0 (0.0%) |
| 30 to 34 Minutes | 0 (0.0%) | 0 (0.0%) |
| 35 to 39 Minutes | 0 (0.0%) | 0 (0.0%) |
| 40 to 44 Minutes | 0 (0.0%) | 0 (0.0%) |
| 45 to 59 Minutes | 0 (0.0%) | 0 (0.0%) |
| 60 to 89 Minutes | 0 (0.0%) | 0 (0.0%) |
| 90 or more Minutes | 0 (0.0%) | 0 (0.0%) |
Time of Departure to Work by Sex in Why
The most frequent times of departure to work in Why are 7:30 AM to 7:59 AM (13, 56.5%) for males and 6:30 AM to 6:59 AM (8, 100.0%) for females.
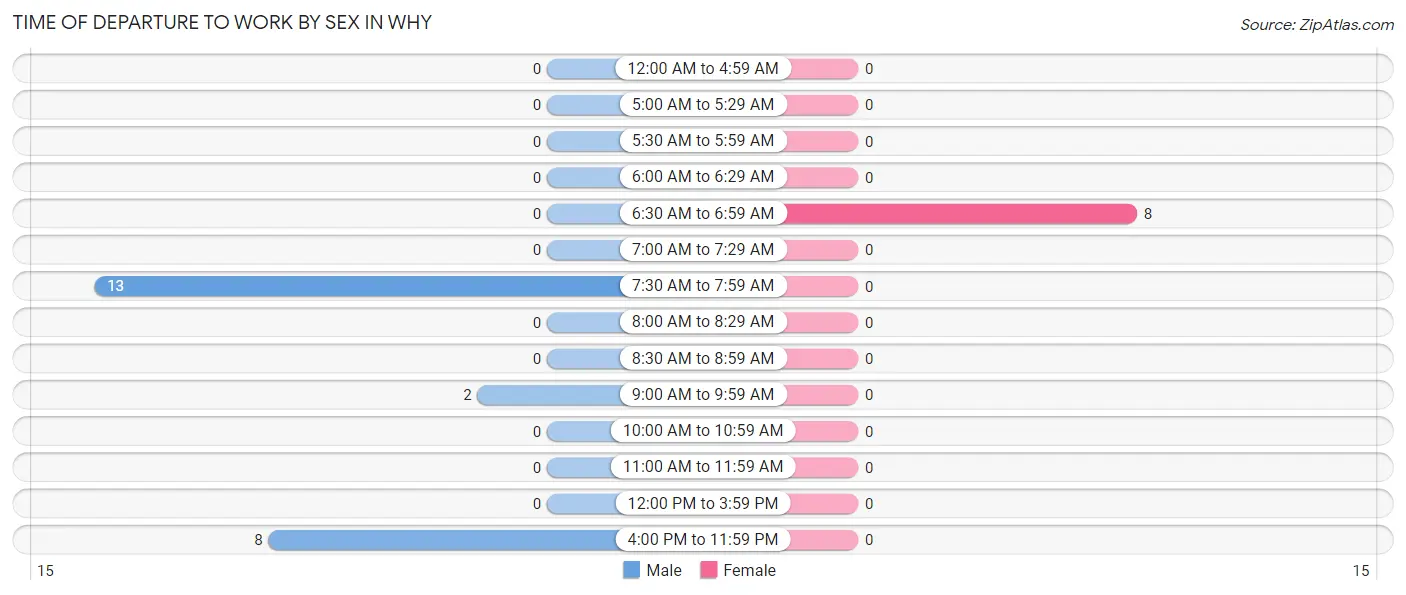
| Time of Departure | Male | Female |
| 12:00 AM to 4:59 AM | 0 (0.0%) | 0 (0.0%) |
| 5:00 AM to 5:29 AM | 0 (0.0%) | 0 (0.0%) |
| 5:30 AM to 5:59 AM | 0 (0.0%) | 0 (0.0%) |
| 6:00 AM to 6:29 AM | 0 (0.0%) | 0 (0.0%) |
| 6:30 AM to 6:59 AM | 0 (0.0%) | 8 (100.0%) |
| 7:00 AM to 7:29 AM | 0 (0.0%) | 0 (0.0%) |
| 7:30 AM to 7:59 AM | 13 (56.5%) | 0 (0.0%) |
| 8:00 AM to 8:29 AM | 0 (0.0%) | 0 (0.0%) |
| 8:30 AM to 8:59 AM | 0 (0.0%) | 0 (0.0%) |
| 9:00 AM to 9:59 AM | 2 (8.7%) | 0 (0.0%) |
| 10:00 AM to 10:59 AM | 0 (0.0%) | 0 (0.0%) |
| 11:00 AM to 11:59 AM | 0 (0.0%) | 0 (0.0%) |
| 12:00 PM to 3:59 PM | 0 (0.0%) | 0 (0.0%) |
| 4:00 PM to 11:59 PM | 8 (34.8%) | 0 (0.0%) |
| Total | 23 (100.0%) | 8 (100.0%) |
Housing Occupancy in Why
Occupancy by Ownership in Why
Of the total 49 dwellings in Why, owner-occupied units account for 44 (89.8%), while renter-occupied units make up 5 (10.2%).
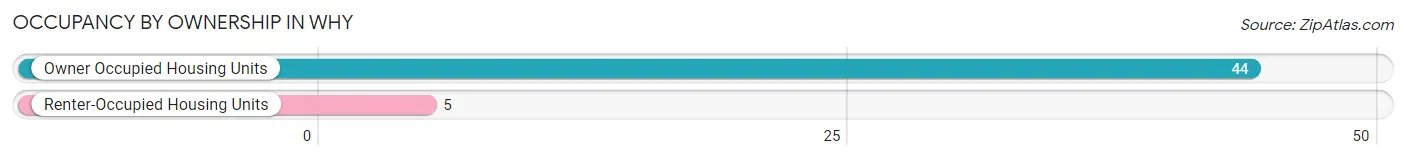
| Occupancy | # Housing Units | % Housing Units |
| Owner Occupied Housing Units | 44 | 89.8% |
| Renter-Occupied Housing Units | 5 | 10.2% |
| Total Occupied Housing Units | 49 | 100.0% |
Occupancy by Household Size in Why
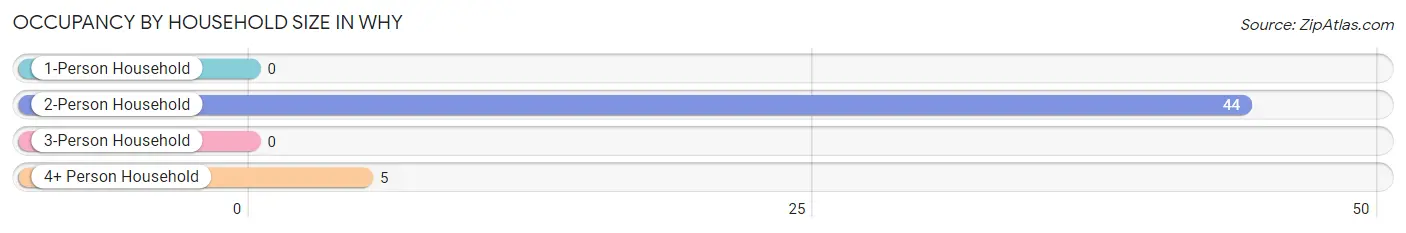
| Household Size | # Housing Units | % Housing Units |
| 1-Person Household | 0 | 0.0% |
| 2-Person Household | 44 | 89.8% |
| 3-Person Household | 0 | 0.0% |
| 4+ Person Household | 5 | 10.2% |
| Total Housing Units | 49 | 100.0% |
Occupancy by Ownership by Household Size in Why
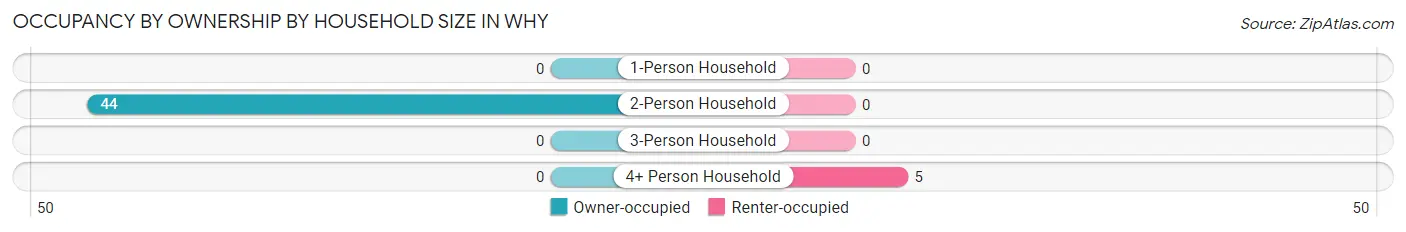
| Household Size | Owner-occupied | Renter-occupied |
| 1-Person Household | 0 (0.0%) | 0 (0.0%) |
| 2-Person Household | 44 (100.0%) | 0 (0.0%) |
| 3-Person Household | 0 (0.0%) | 0 (0.0%) |
| 4+ Person Household | 0 (0.0%) | 5 (100.0%) |
| Total Housing Units | 44 (89.8%) | 5 (10.2%) |
Occupancy by Educational Attainment in Why
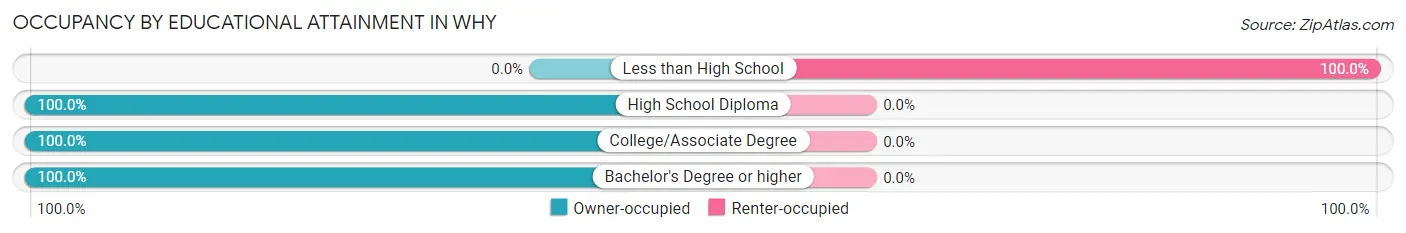
| Household Size | Owner-occupied | Renter-occupied |
| Less than High School | 0 (0.0%) | 5 (100.0%) |
| High School Diploma | 24 (100.0%) | 0 (0.0%) |
| College/Associate Degree | 8 (100.0%) | 0 (0.0%) |
| Bachelor's Degree or higher | 12 (100.0%) | 0 (0.0%) |
Occupancy by Age of Householder in Why
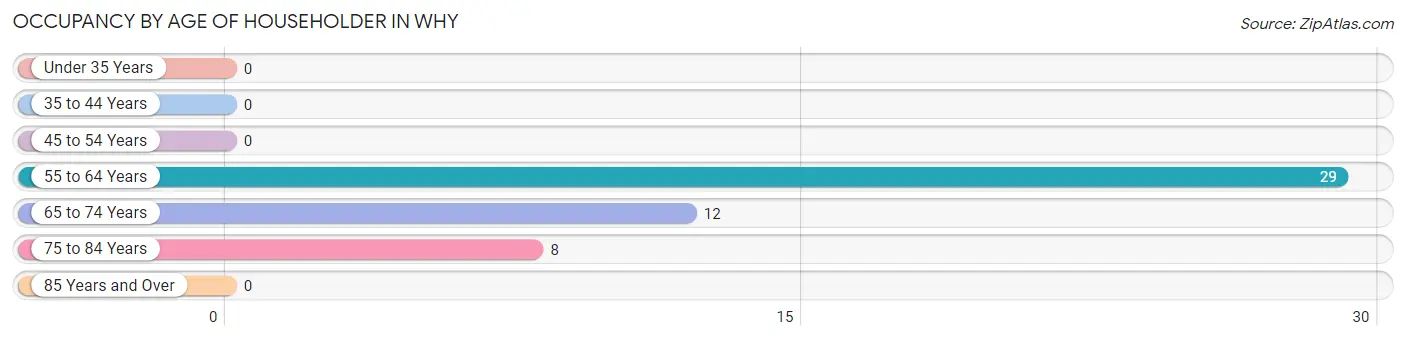
| Age Bracket | # Households | % Households |
| Under 35 Years | 0 | 0.0% |
| 35 to 44 Years | 0 | 0.0% |
| 45 to 54 Years | 0 | 0.0% |
| 55 to 64 Years | 29 | 59.2% |
| 65 to 74 Years | 12 | 24.5% |
| 75 to 84 Years | 8 | 16.3% |
| 85 Years and Over | 0 | 0.0% |
| Total | 49 | 100.0% |
Housing Finances in Why
Median Income by Occupancy in Why
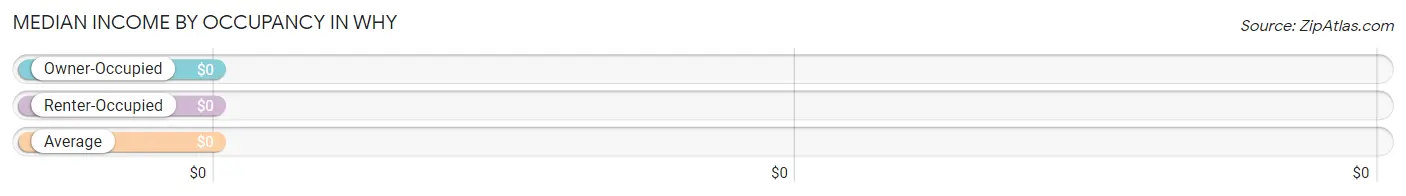
| Occupancy Type | # Households | Median Income |
| Owner-Occupied | 44 (89.8%) | $0 |
| Renter-Occupied | 5 (10.2%) | $0 |
| Average | 49 (100.0%) | $0 |
Occupancy by Householder Income Bracket in Why
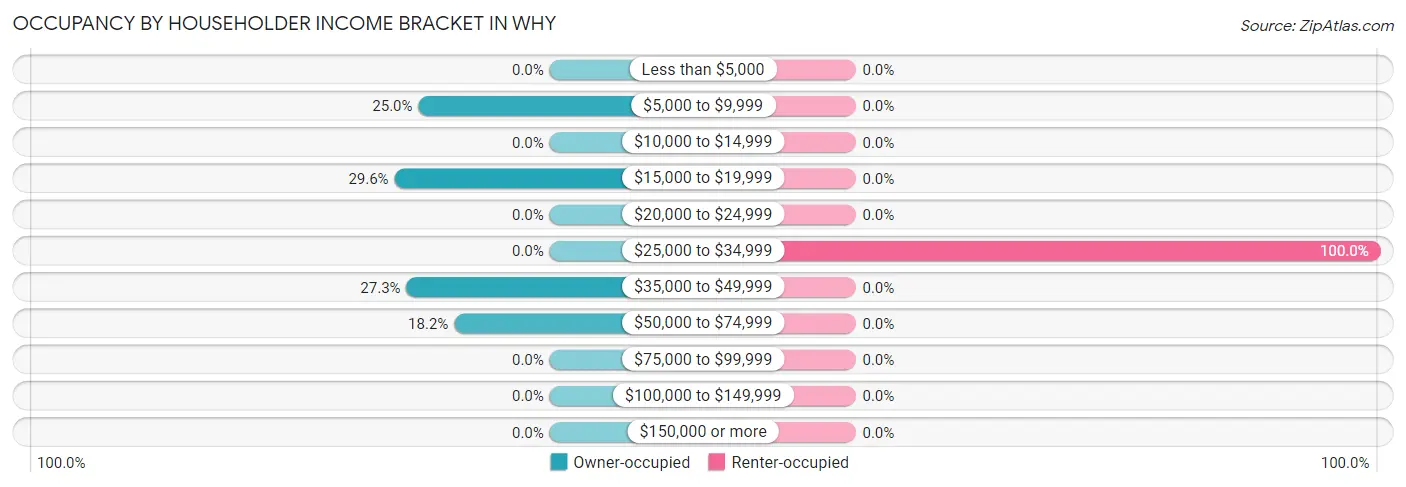
| Income Bracket | Owner-occupied | Renter-occupied |
| Less than $5,000 | 0 (0.0%) | 0 (0.0%) |
| $5,000 to $9,999 | 11 (25.0%) | 0 (0.0%) |
| $10,000 to $14,999 | 0 (0.0%) | 0 (0.0%) |
| $15,000 to $19,999 | 13 (29.5%) | 0 (0.0%) |
| $20,000 to $24,999 | 0 (0.0%) | 0 (0.0%) |
| $25,000 to $34,999 | 0 (0.0%) | 5 (100.0%) |
| $35,000 to $49,999 | 12 (27.3%) | 0 (0.0%) |
| $50,000 to $74,999 | 8 (18.2%) | 0 (0.0%) |
| $75,000 to $99,999 | 0 (0.0%) | 0 (0.0%) |
| $100,000 to $149,999 | 0 (0.0%) | 0 (0.0%) |
| $150,000 or more | 0 (0.0%) | 0 (0.0%) |
| Total | 44 (100.0%) | 5 (100.0%) |
Monthly Housing Cost Tiers in Why
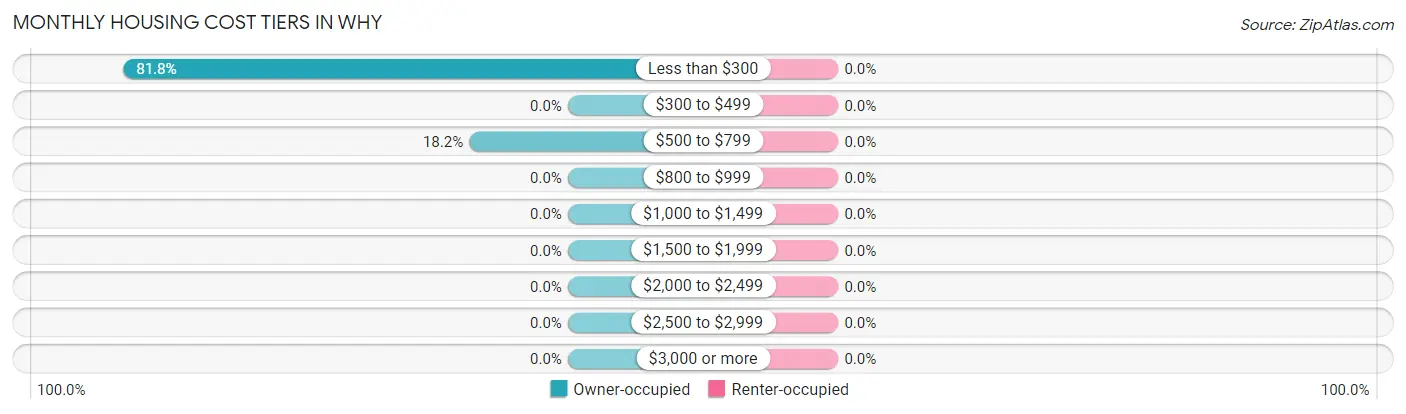
| Monthly Cost | Owner-occupied | Renter-occupied |
| Less than $300 | 36 (81.8%) | 0 (0.0%) |
| $300 to $499 | 0 (0.0%) | 0 (0.0%) |
| $500 to $799 | 8 (18.2%) | 0 (0.0%) |
| $800 to $999 | 0 (0.0%) | 0 (0.0%) |
| $1,000 to $1,499 | 0 (0.0%) | 0 (0.0%) |
| $1,500 to $1,999 | 0 (0.0%) | 0 (0.0%) |
| $2,000 to $2,499 | 0 (0.0%) | 0 (0.0%) |
| $2,500 to $2,999 | 0 (0.0%) | 0 (0.0%) |
| $3,000 or more | 0 (0.0%) | 0 (0.0%) |
| Total | 44 (100.0%) | 5 (100.0%) |
Physical Housing Characteristics in Why
Housing Structures in Why
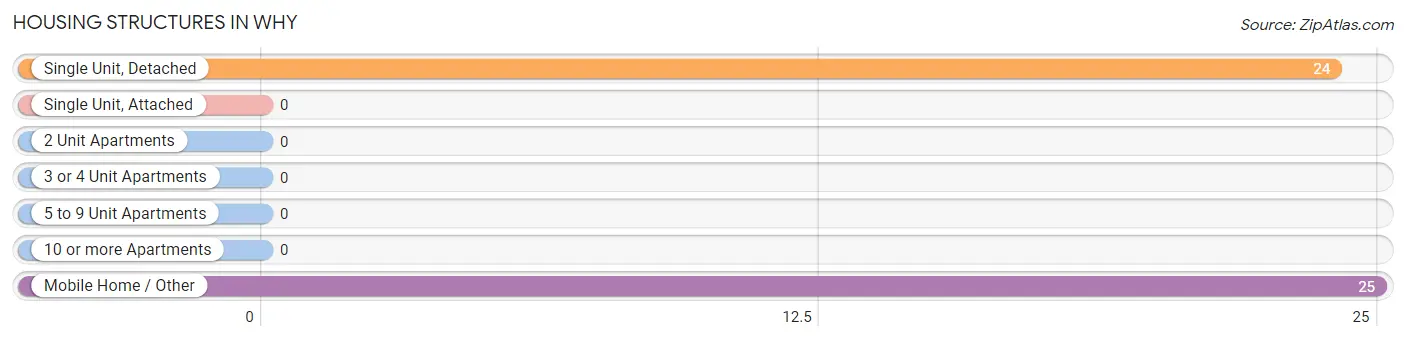
| Structure Type | # Housing Units | % Housing Units |
| Single Unit, Detached | 24 | 49.0% |
| Single Unit, Attached | 0 | 0.0% |
| 2 Unit Apartments | 0 | 0.0% |
| 3 or 4 Unit Apartments | 0 | 0.0% |
| 5 to 9 Unit Apartments | 0 | 0.0% |
| 10 or more Apartments | 0 | 0.0% |
| Mobile Home / Other | 25 | 51.0% |
| Total | 49 | 100.0% |
Housing Structures by Occupancy in Why
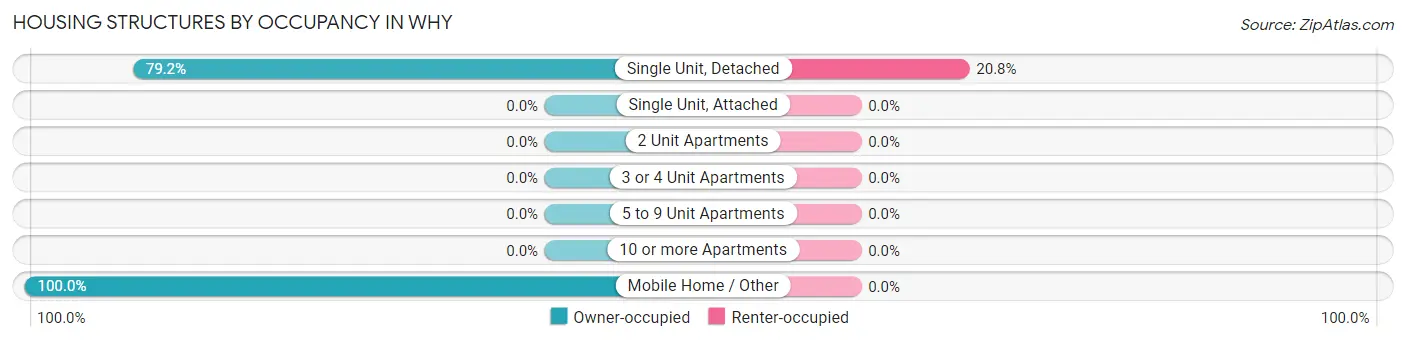
| Structure Type | Owner-occupied | Renter-occupied |
| Single Unit, Detached | 19 (79.2%) | 5 (20.8%) |
| Single Unit, Attached | 0 (0.0%) | 0 (0.0%) |
| 2 Unit Apartments | 0 (0.0%) | 0 (0.0%) |
| 3 or 4 Unit Apartments | 0 (0.0%) | 0 (0.0%) |
| 5 to 9 Unit Apartments | 0 (0.0%) | 0 (0.0%) |
| 10 or more Apartments | 0 (0.0%) | 0 (0.0%) |
| Mobile Home / Other | 25 (100.0%) | 0 (0.0%) |
| Total | 44 (89.8%) | 5 (10.2%) |
Housing Structures by Number of Rooms in Why
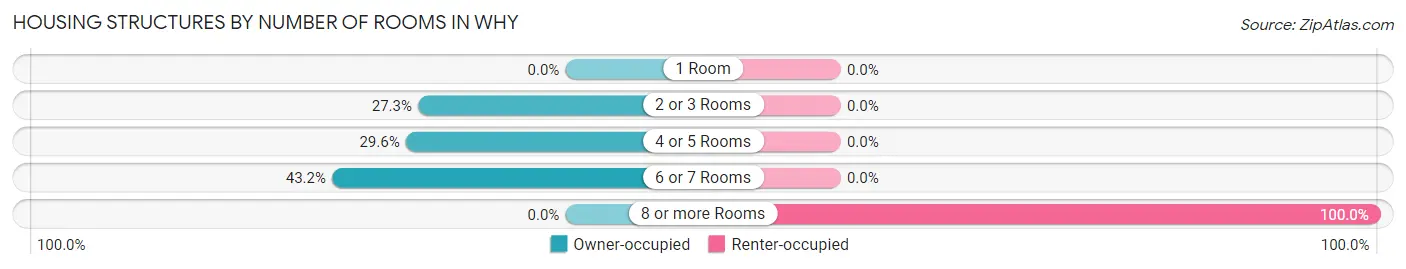
| Number of Rooms | Owner-occupied | Renter-occupied |
| 1 Room | 0 (0.0%) | 0 (0.0%) |
| 2 or 3 Rooms | 12 (27.3%) | 0 (0.0%) |
| 4 or 5 Rooms | 13 (29.5%) | 0 (0.0%) |
| 6 or 7 Rooms | 19 (43.2%) | 0 (0.0%) |
| 8 or more Rooms | 0 (0.0%) | 5 (100.0%) |
| Total | 44 (100.0%) | 5 (100.0%) |
Housing Structure by Heating Type in Why
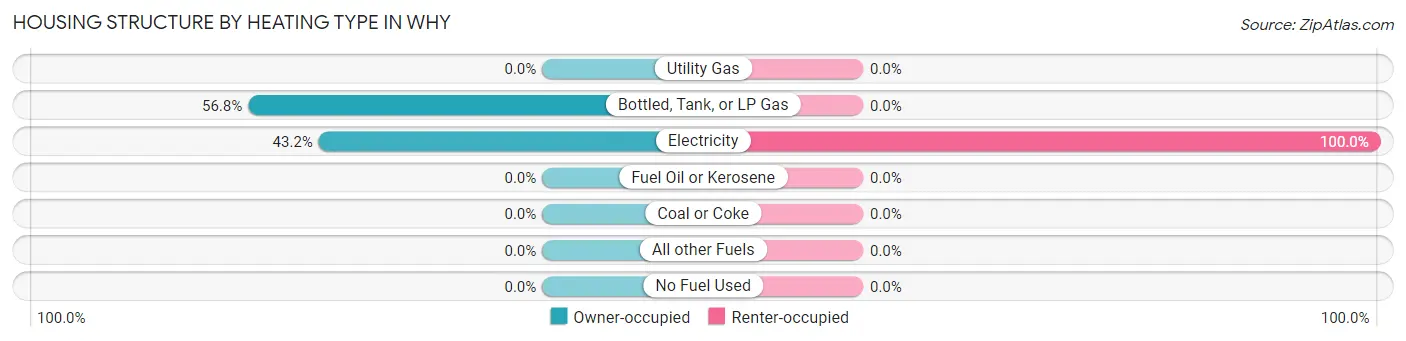
| Heating Type | Owner-occupied | Renter-occupied |
| Utility Gas | 0 (0.0%) | 0 (0.0%) |
| Bottled, Tank, or LP Gas | 25 (56.8%) | 0 (0.0%) |
| Electricity | 19 (43.2%) | 5 (100.0%) |
| Fuel Oil or Kerosene | 0 (0.0%) | 0 (0.0%) |
| Coal or Coke | 0 (0.0%) | 0 (0.0%) |
| All other Fuels | 0 (0.0%) | 0 (0.0%) |
| No Fuel Used | 0 (0.0%) | 0 (0.0%) |
| Total | 44 (100.0%) | 5 (100.0%) |
Household Vehicle Usage in Why
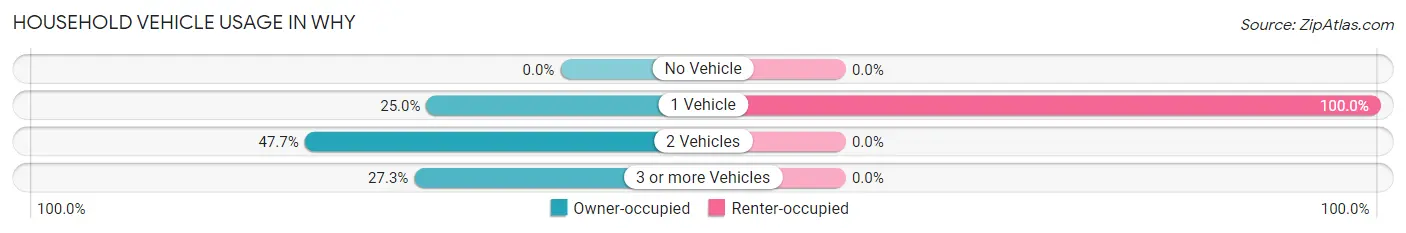
| Vehicles per Household | Owner-occupied | Renter-occupied |
| No Vehicle | 0 (0.0%) | 0 (0.0%) |
| 1 Vehicle | 11 (25.0%) | 5 (100.0%) |
| 2 Vehicles | 21 (47.7%) | 0 (0.0%) |
| 3 or more Vehicles | 12 (27.3%) | 0 (0.0%) |
| Total | 44 (100.0%) | 5 (100.0%) |
Real Estate & Mortgages in Why
Real Estate and Mortgage Overview in Why
| Characteristic | Without Mortgage | With Mortgage |
| Housing Units | 44 | 0 |
| Median Property Value | - | - |
| Median Household Income | - | - |
| Monthly Housing Costs | - | - |
| Real Estate Taxes | - | - |
Property Value by Mortgage Status in Why
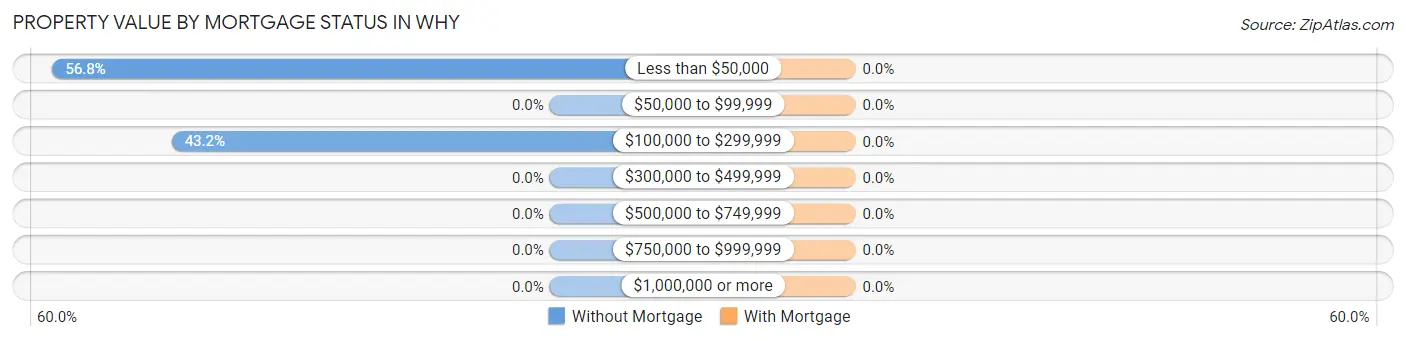
| Property Value | Without Mortgage | With Mortgage |
| Less than $50,000 | 25 (56.8%) | 0 (0.0%) |
| $50,000 to $99,999 | 0 (0.0%) | 0 (0.0%) |
| $100,000 to $299,999 | 19 (43.2%) | 0 (0.0%) |
| $300,000 to $499,999 | 0 (0.0%) | 0 (0.0%) |
| $500,000 to $749,999 | 0 (0.0%) | 0 (0.0%) |
| $750,000 to $999,999 | 0 (0.0%) | 0 (0.0%) |
| $1,000,000 or more | 0 (0.0%) | 0 (0.0%) |
| Total | 44 (100.0%) | 0 (0.0%) |
Household Income by Mortgage Status in Why
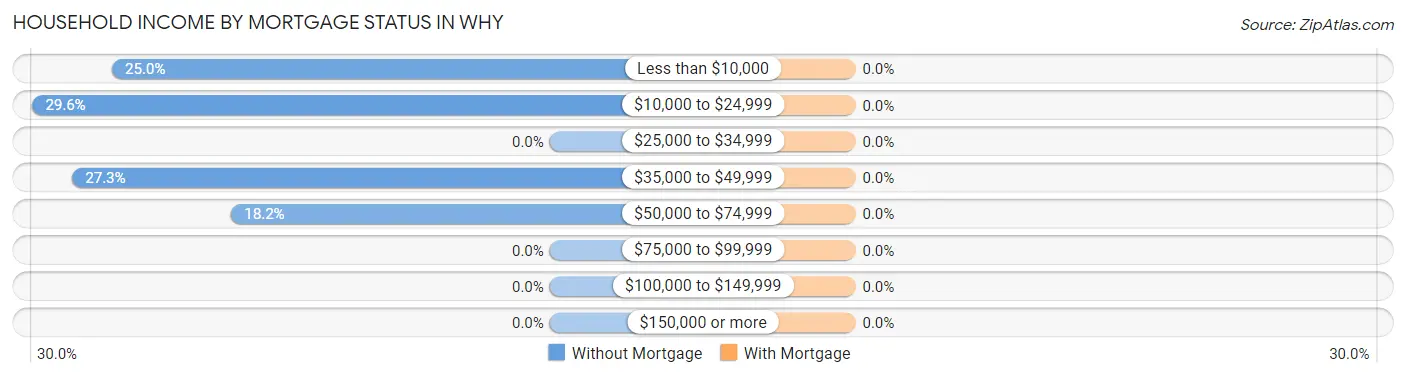
| Household Income | Without Mortgage | With Mortgage |
| Less than $10,000 | 11 (25.0%) | 0 (0.0%) |
| $10,000 to $24,999 | 13 (29.5%) | 0 (0.0%) |
| $25,000 to $34,999 | 0 (0.0%) | 0 (0.0%) |
| $35,000 to $49,999 | 12 (27.3%) | 0 (0.0%) |
| $50,000 to $74,999 | 8 (18.2%) | 0 (0.0%) |
| $75,000 to $99,999 | 0 (0.0%) | 0 (0.0%) |
| $100,000 to $149,999 | 0 (0.0%) | 0 (0.0%) |
| $150,000 or more | 0 (0.0%) | 0 (0.0%) |
| Total | 44 (100.0%) | 0 (0.0%) |
Property Value to Household Income Ratio in Why
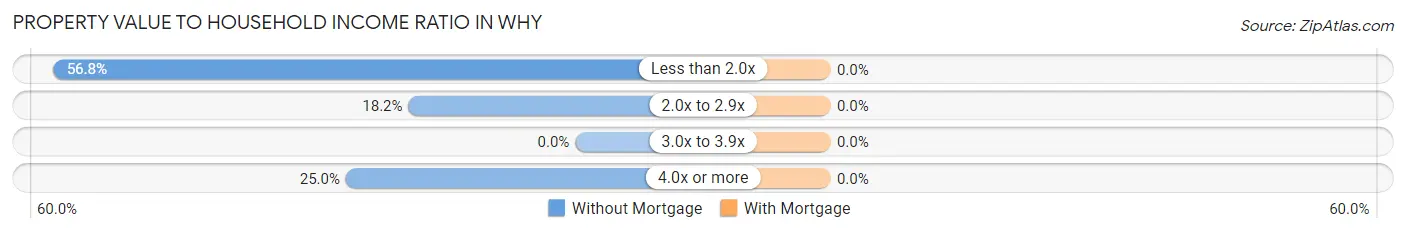
| Value-to-Income Ratio | Without Mortgage | With Mortgage |
| Less than 2.0x | 25 (56.8%) | 0 (0.0%) |
| 2.0x to 2.9x | 8 (18.2%) | 0 (0.0%) |
| 3.0x to 3.9x | 0 (0.0%) | 0 (0.0%) |
| 4.0x or more | 11 (25.0%) | 0 (0.0%) |
| Total | 44 (100.0%) | 0 (0.0%) |
Real Estate Taxes by Mortgage Status in Why
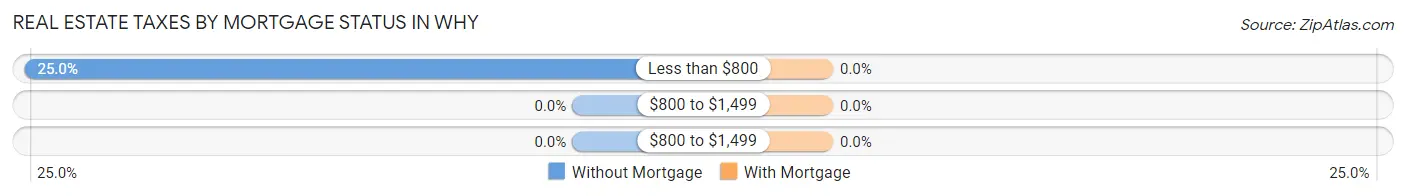
| Property Taxes | Without Mortgage | With Mortgage |
| Less than $800 | 11 (25.0%) | 0 (0.0%) |
| $800 to $1,499 | 0 (0.0%) | 0 (0.0%) |
| $800 to $1,499 | 0 (0.0%) | 0 (0.0%) |
| Total | 44 (100.0%) | 0 (0.0%) |
Health & Disability in Why
Health Insurance Coverage by Age in Why
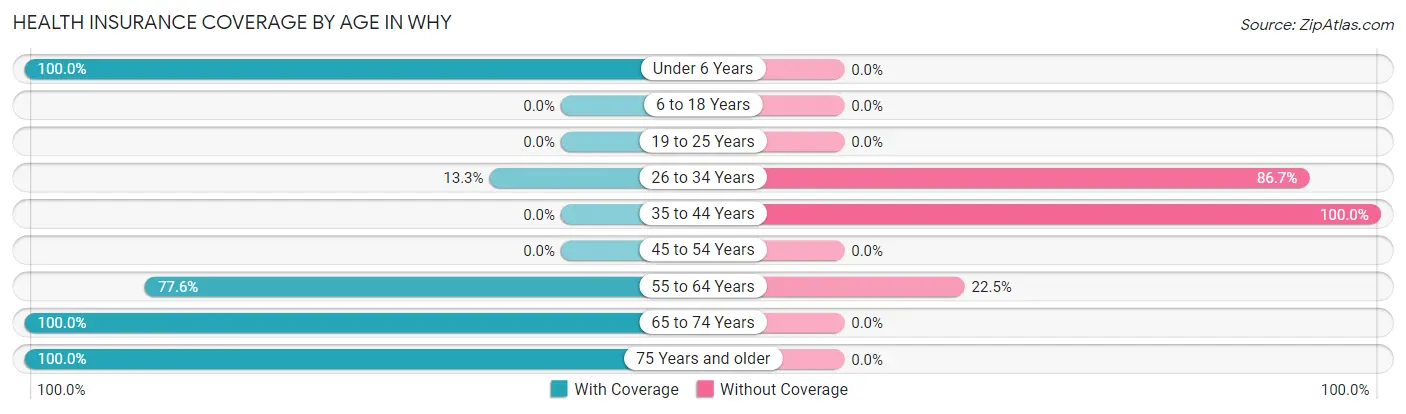
| Age Bracket | With Coverage | Without Coverage |
| Under 6 Years | 11 (100.0%) | 0 (0.0%) |
| 6 to 18 Years | 0 (0.0%) | 0 (0.0%) |
| 19 to 25 Years | 0 (0.0%) | 0 (0.0%) |
| 26 to 34 Years | 2 (13.3%) | 13 (86.7%) |
| 35 to 44 Years | 0 (0.0%) | 3 (100.0%) |
| 45 to 54 Years | 0 (0.0%) | 0 (0.0%) |
| 55 to 64 Years | 38 (77.5%) | 11 (22.5%) |
| 65 to 74 Years | 16 (100.0%) | 0 (0.0%) |
| 75 Years and older | 8 (100.0%) | 0 (0.0%) |
| Total | 75 (73.5%) | 27 (26.5%) |
Health Insurance Coverage by Citizenship Status in Why
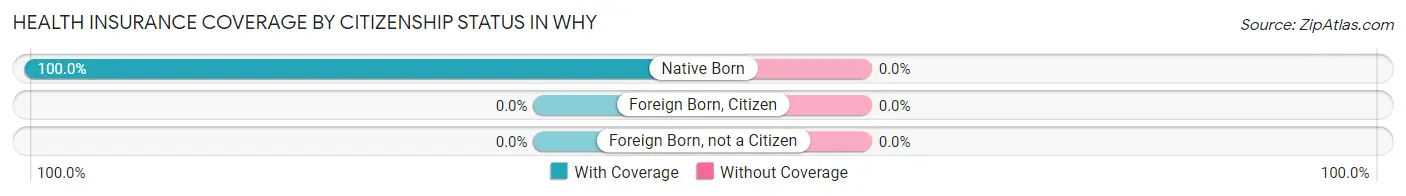
| Citizenship Status | With Coverage | Without Coverage |
| Native Born | 11 (100.0%) | 0 (0.0%) |
| Foreign Born, Citizen | 0 (0.0%) | 0 (0.0%) |
| Foreign Born, not a Citizen | 0 (0.0%) | 0 (0.0%) |
Health Insurance Coverage by Household Income in Why
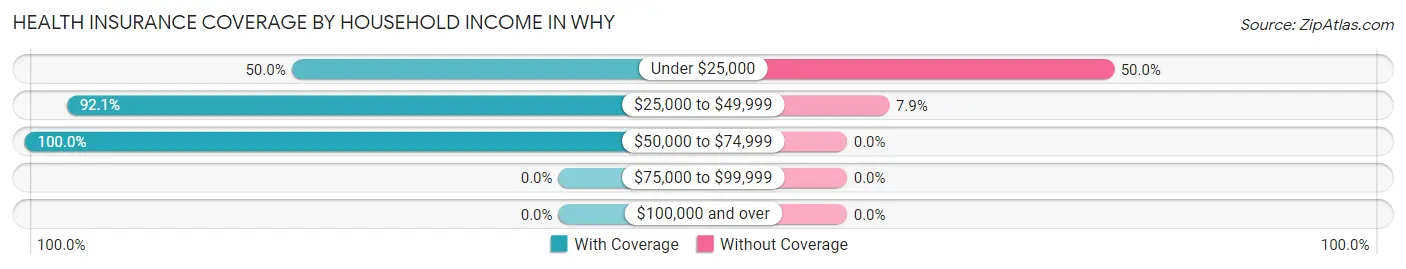
| Household Income | With Coverage | Without Coverage |
| Under $25,000 | 24 (50.0%) | 24 (50.0%) |
| $25,000 to $49,999 | 35 (92.1%) | 3 (7.9%) |
| $50,000 to $74,999 | 16 (100.0%) | 0 (0.0%) |
| $75,000 to $99,999 | 0 (0.0%) | 0 (0.0%) |
| $100,000 and over | 0 (0.0%) | 0 (0.0%) |
Public vs Private Health Insurance Coverage by Age in Why
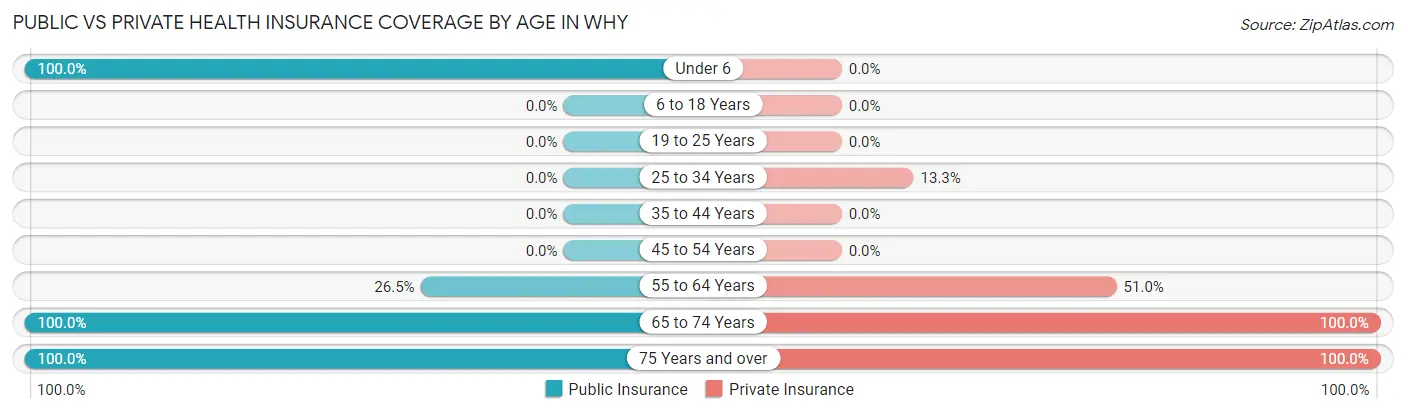
| Age Bracket | Public Insurance | Private Insurance |
| Under 6 | 11 (100.0%) | 0 (0.0%) |
| 6 to 18 Years | 0 (0.0%) | 0 (0.0%) |
| 19 to 25 Years | 0 (0.0%) | 0 (0.0%) |
| 25 to 34 Years | 0 (0.0%) | 2 (13.3%) |
| 35 to 44 Years | 0 (0.0%) | 0 (0.0%) |
| 45 to 54 Years | 0 (0.0%) | 0 (0.0%) |
| 55 to 64 Years | 13 (26.5%) | 25 (51.0%) |
| 65 to 74 Years | 16 (100.0%) | 16 (100.0%) |
| 75 Years and over | 8 (100.0%) | 8 (100.0%) |
| Total | 48 (47.1%) | 51 (50.0%) |
Disability Status by Sex by Age in Why
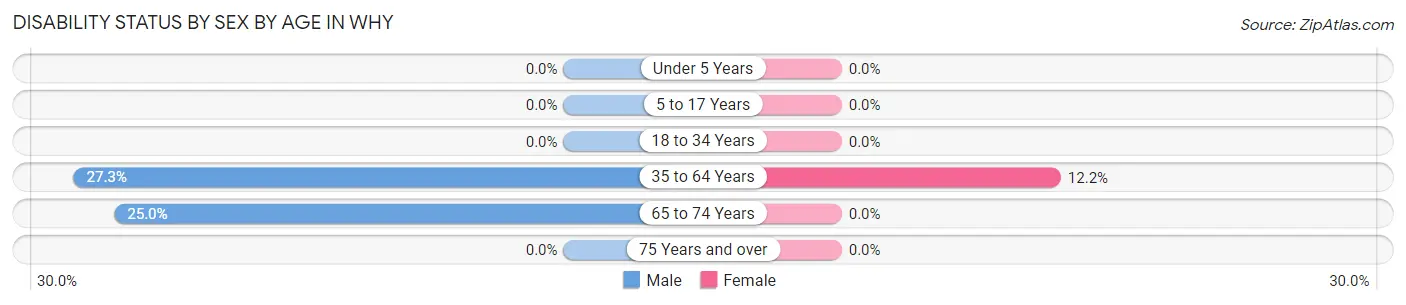
| Age Bracket | Male | Female |
| Under 5 Years | 0 (0.0%) | 0 (0.0%) |
| 5 to 17 Years | 0 (0.0%) | 0 (0.0%) |
| 18 to 34 Years | 0 (0.0%) | 0 (0.0%) |
| 35 to 64 Years | 3 (27.3%) | 5 (12.2%) |
| 65 to 74 Years | 4 (25.0%) | 0 (0.0%) |
| 75 Years and over | 0 (0.0%) | 0 (0.0%) |
Disability Class by Sex by Age in Why
Disability Class: Hearing Difficulty
| Age Bracket | Male | Female |
| Under 5 Years | 0 (0.0%) | 0 (0.0%) |
| 5 to 17 Years | 0 (0.0%) | 0 (0.0%) |
| 18 to 34 Years | 0 (0.0%) | 0 (0.0%) |
| 35 to 64 Years | 0 (0.0%) | 0 (0.0%) |
| 65 to 74 Years | 0 (0.0%) | 0 (0.0%) |
| 75 Years and over | 0 (0.0%) | 0 (0.0%) |
Disability Class: Vision Difficulty
| Age Bracket | Male | Female |
| Under 5 Years | 0 (0.0%) | 0 (0.0%) |
| 5 to 17 Years | 0 (0.0%) | 0 (0.0%) |
| 18 to 34 Years | 0 (0.0%) | 0 (0.0%) |
| 35 to 64 Years | 0 (0.0%) | 0 (0.0%) |
| 65 to 74 Years | 0 (0.0%) | 0 (0.0%) |
| 75 Years and over | 0 (0.0%) | 0 (0.0%) |
Disability Class: Cognitive Difficulty
| Age Bracket | Male | Female |
| 5 to 17 Years | 0 (0.0%) | 0 (0.0%) |
| 18 to 34 Years | 0 (0.0%) | 0 (0.0%) |
| 35 to 64 Years | 0 (0.0%) | 0 (0.0%) |
| 65 to 74 Years | 0 (0.0%) | 0 (0.0%) |
| 75 Years and over | 0 (0.0%) | 0 (0.0%) |
Disability Class: Ambulatory Difficulty
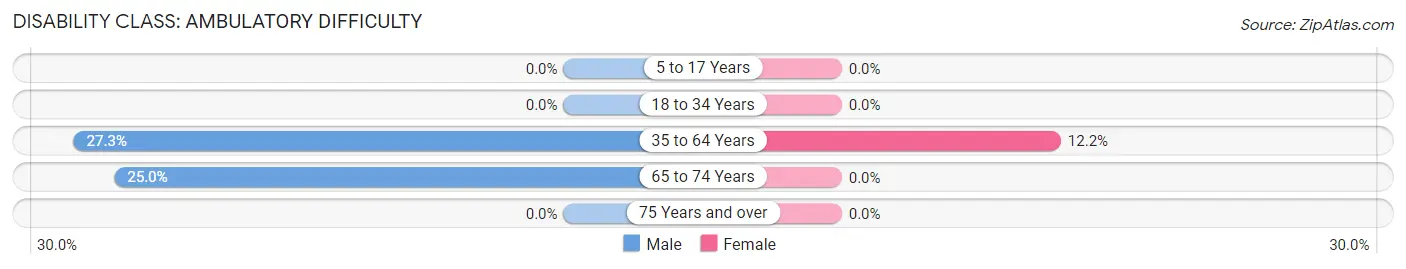
| Age Bracket | Male | Female |
| 5 to 17 Years | 0 (0.0%) | 0 (0.0%) |
| 18 to 34 Years | 0 (0.0%) | 0 (0.0%) |
| 35 to 64 Years | 3 (27.3%) | 5 (12.2%) |
| 65 to 74 Years | 4 (25.0%) | 0 (0.0%) |
| 75 Years and over | 0 (0.0%) | 0 (0.0%) |
Disability Class: Self-Care Difficulty
| Age Bracket | Male | Female |
| 5 to 17 Years | 0 (0.0%) | 0 (0.0%) |
| 18 to 34 Years | 0 (0.0%) | 0 (0.0%) |
| 35 to 64 Years | 0 (0.0%) | 0 (0.0%) |
| 65 to 74 Years | 0 (0.0%) | 0 (0.0%) |
| 75 Years and over | 0 (0.0%) | 0 (0.0%) |
Technology Access in Why
Computing Device Access in Why
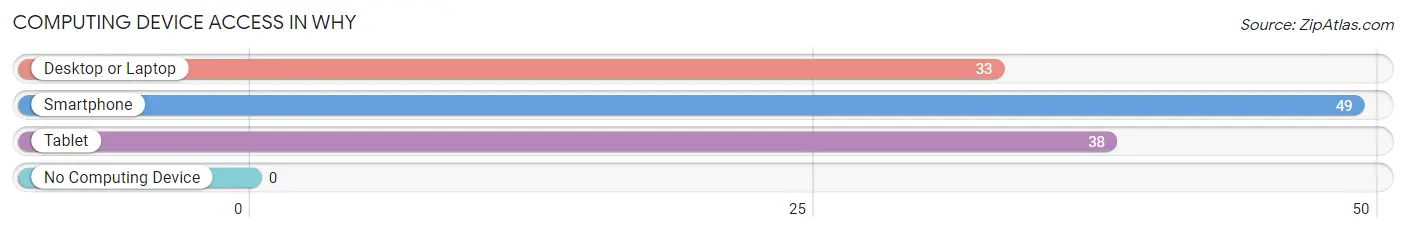
| Device Type | # Households | % Households |
| Desktop or Laptop | 33 | 67.3% |
| Smartphone | 49 | 100.0% |
| Tablet | 38 | 77.5% |
| No Computing Device | 0 | 0.0% |
| Total | 49 | 100.0% |
Internet Access in Why
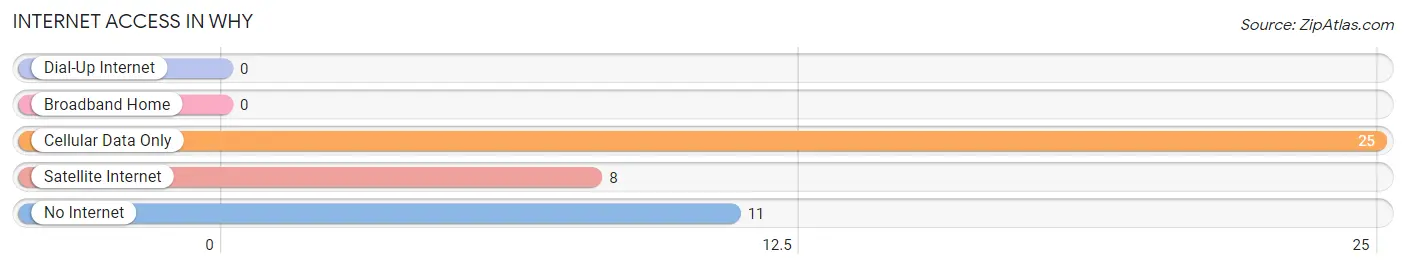
| Internet Type | # Households | % Households |
| Dial-Up Internet | 0 | 0.0% |
| Broadband Home | 0 | 0.0% |
| Cellular Data Only | 25 | 51.0% |
| Satellite Internet | 8 | 16.3% |
| No Internet | 11 | 22.5% |
| Total | 49 | 100.0% |
Why Summary
Arizona is a state located in the southwestern region of the United States. It is bordered by New Mexico to the east, Utah to the north, Nevada to the northwest, California to the west, and Mexico to the south. Arizona is the sixth largest state in the United States, with an area of 113,998 square miles. It is the 14th most populous state, with a population of 7,171,646 as of 2020.
Arizona has a rich and varied history. It was first inhabited by Native American tribes, including the Hohokam, the Pima, the Tohono O’odham, the Apache, and the Navajo. The first Europeans to explore the area were Spanish explorers in the 16th century. In 1853, the area became part of the United States as part of the Gadsden Purchase. Arizona became a state in 1912.
Arizona is known for its diverse geography. It is home to the Grand Canyon, one of the seven natural wonders of the world. It is also home to the Sonoran Desert, the largest desert in North America. The state is also home to several mountain ranges, including the White Mountains, the Chiricahua Mountains, and the San Francisco Peaks.
The economy of Arizona is largely based on tourism, agriculture, and manufacturing. Tourism is a major industry in the state, with visitors drawn to its natural beauty and attractions such as the Grand Canyon, Monument Valley, and the Petrified Forest. Agriculture is also an important part of the state’s economy, with crops such as cotton, hay, and wheat being grown in the state. Manufacturing is also a major industry in Arizona, with companies such as Intel, Boeing, and Honeywell having major operations in the state.
The demographics of Arizona are diverse. The state has a large Hispanic population, with nearly one-third of the population being of Hispanic or Latino origin. The state also has a large Native American population, with nearly one-fifth of the population being of Native American descent. The state also has a large white population, with nearly two-thirds of the population being of white or European descent.
Arizona is a state with a rich and varied history, diverse geography, and a strong economy. It is home to a diverse population, with a variety of cultures and backgrounds. It is a state that is sure to continue to grow and thrive in the years to come.
Common Questions
What is Per Capita Income in Why?
Per Capita income in Why is $14,864.
What is Inequality or Gini Index in Why?
Inequality or Gini Index in Why is 0.35.
What is the Total Population of Why?
Total Population of Why is 102.
What is the Total Male Population of Why?
Total Male Population of Why is 53.
What is the Total Female Population of Why?
Total Female Population of Why is 49.
What is the Ratio of Males per 100 Females in Why?
There are 108.16 Males per 100 Females in Why.
What is the Ratio of Females per 100 Males in Why?
There are 92.45 Females per 100 Males in Why.
What is the Median Population Age in Why?
Median Population Age in Why is 60.4 Years.
What is the Average Family Size in Why
Average Family Size in Why is 2.1 People.
What is the Average Household Size in Why
Average Household Size in Why is 2.1 People.
How Large is the Labor Force in Why?
There are 31 People in the Labor Forcein in Why.
What is the Percentage of People in the Labor Force in Why?
34.1% of People are in the Labor Force in Why.