Whispering Pines, AZ Map & Demographics
Whispering Pines Map
Whispering Pines Overview
$37,332
PER CAPITA INCOME
$67,813
AVG FAMILY INCOME
$67,813
AVG HOUSEHOLD INCOME
0.31
INEQUALITY / GINI INDEX
126
TOTAL POPULATION
58
MALE POPULATION
68
FEMALE POPULATION
85.29
MALES / 100 FEMALES
117.24
FEMALES / 100 MALES
68.8
MEDIAN AGE
1.8
AVG FAMILY SIZE
1.8
AVG HOUSEHOLD SIZE
23
LABOR FORCE [ PEOPLE ]
18.3%
PERCENT IN LABOR FORCE
Income in Whispering Pines
Income Overview in Whispering Pines
Per Capita Income in Whispering Pines is $37,332, while median incomes of families and households are $67,813 and $67,813 respectively.
| Characteristic | Number | Measure |
| Per Capita Income | 126 | $37,332 |
| Median Family Income | 72 | $67,813 |
| Mean Family Income | 72 | $70,617 |
| Median Household Income | 72 | $67,813 |
| Mean Household Income | 72 | $70,617 |
| Income Deficit | 72 | $0 |
| Wage / Income Gap (%) | 126 | 0.00% |
| Wage / Income Gap ($) | 126 | 100.00¢ per $1 |
| Gini / Inequality Index | 126 | 0.31 |
Earnings by Sex in Whispering Pines
| Sex | Number | Average Earnings |
| Male | 14 (41.2%) | $0 |
| Female | 20 (58.8%) | $0 |
| Total | 34 (100.0%) | $0 |
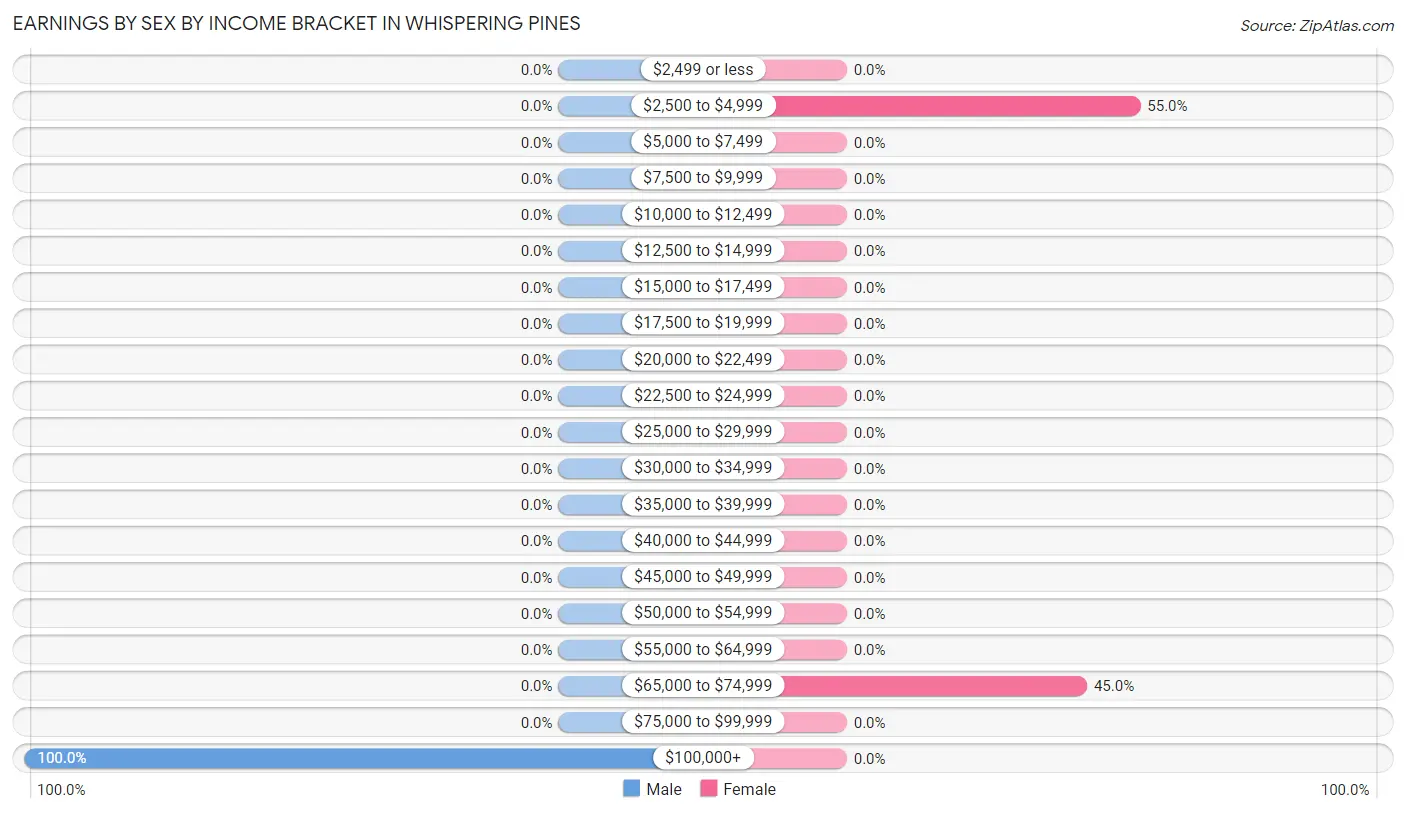
Earnings by Sex by Income Bracket in Whispering Pines
The most common earnings brackets in Whispering Pines are $100,000+ for men (14 | 100.0%) and $2,500 to $4,999 for women (11 | 55.0%).
| Income | Male | Female |
| $2,499 or less | 0 (0.0%) | 0 (0.0%) |
| $2,500 to $4,999 | 0 (0.0%) | 11 (55.0%) |
| $5,000 to $7,499 | 0 (0.0%) | 0 (0.0%) |
| $7,500 to $9,999 | 0 (0.0%) | 0 (0.0%) |
| $10,000 to $12,499 | 0 (0.0%) | 0 (0.0%) |
| $12,500 to $14,999 | 0 (0.0%) | 0 (0.0%) |
| $15,000 to $17,499 | 0 (0.0%) | 0 (0.0%) |
| $17,500 to $19,999 | 0 (0.0%) | 0 (0.0%) |
| $20,000 to $22,499 | 0 (0.0%) | 0 (0.0%) |
| $22,500 to $24,999 | 0 (0.0%) | 0 (0.0%) |
| $25,000 to $29,999 | 0 (0.0%) | 0 (0.0%) |
| $30,000 to $34,999 | 0 (0.0%) | 0 (0.0%) |
| $35,000 to $39,999 | 0 (0.0%) | 0 (0.0%) |
| $40,000 to $44,999 | 0 (0.0%) | 0 (0.0%) |
| $45,000 to $49,999 | 0 (0.0%) | 0 (0.0%) |
| $50,000 to $54,999 | 0 (0.0%) | 0 (0.0%) |
| $55,000 to $64,999 | 0 (0.0%) | 0 (0.0%) |
| $65,000 to $74,999 | 0 (0.0%) | 9 (45.0%) |
| $75,000 to $99,999 | 0 (0.0%) | 0 (0.0%) |
| $100,000+ | 14 (100.0%) | 0 (0.0%) |
| Total | 14 (100.0%) | 20 (100.0%) |
Earnings by Sex by Educational Attainment in Whispering Pines
| Educational Attainment | Male Income | Female Income |
| Less than High School | - | - |
| High School Diploma | - | - |
| College or Associate's Degree | - | - |
| Bachelor's Degree | - | - |
| Graduate Degree | - | - |
| Total | - | - |
Family Income in Whispering Pines
Family Income Brackets in Whispering Pines
According to the Whispering Pines family income data, there are 34 families falling into the $35,000 to $49,999 income range, which is the most common income bracket and makes up 47.2% of all families.
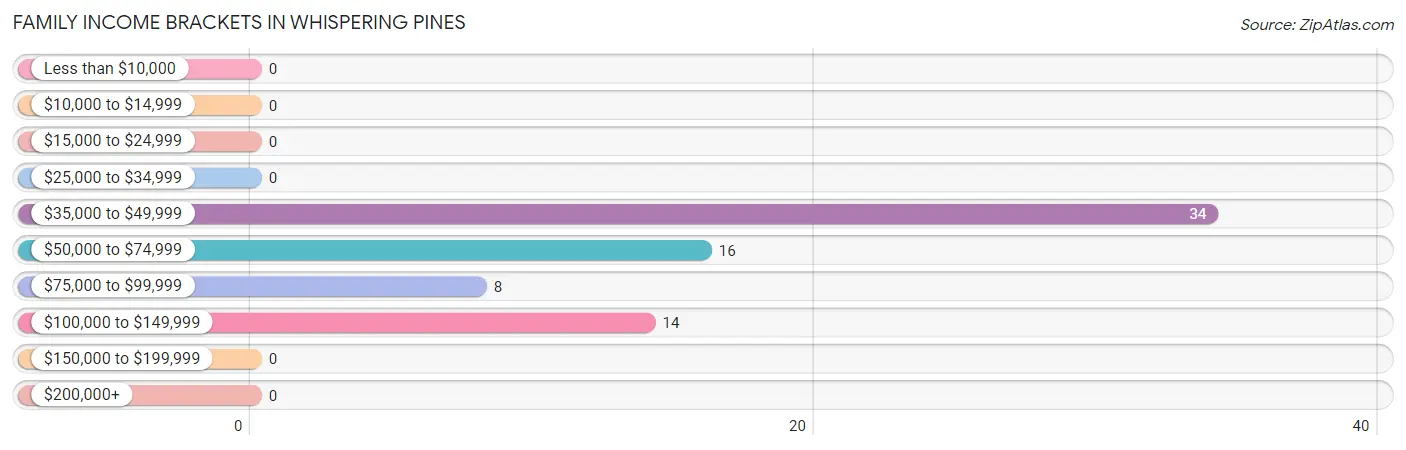
| Income Bracket | # Families | % Families |
| Less than $10,000 | 0 | 0.0% |
| $10,000 to $14,999 | 0 | 0.0% |
| $15,000 to $24,999 | 0 | 0.0% |
| $25,000 to $34,999 | 0 | 0.0% |
| $35,000 to $49,999 | 34 | 47.2% |
| $50,000 to $74,999 | 16 | 22.2% |
| $75,000 to $99,999 | 8 | 11.1% |
| $100,000 to $149,999 | 14 | 19.4% |
| $150,000 to $199,999 | 0 | 0.0% |
| $200,000+ | 0 | 0.0% |
Family Income by Famaliy Size in Whispering Pines
2-person families (72 | 100.0%) account for the highest median family income in Whispering Pines with $67,813 per family, while 2-person families (72 | 100.0%) have the highest median income of $33,906 per family member.
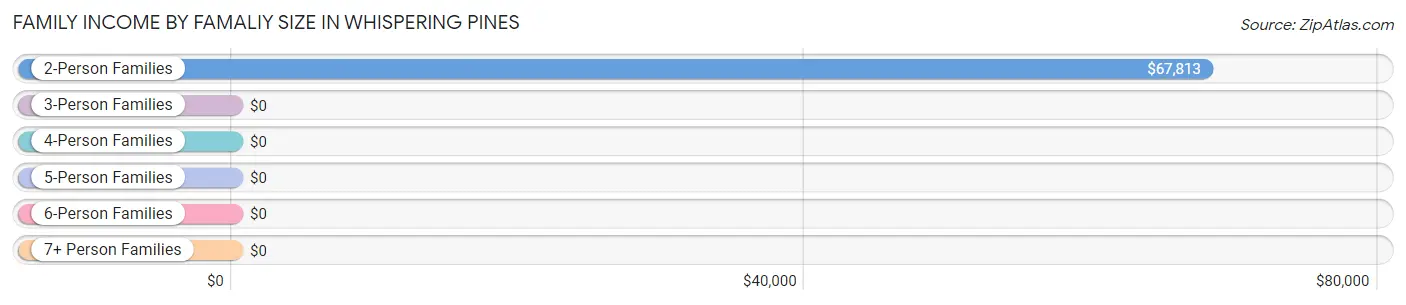
| Income Bracket | # Families | Median Income |
| 2-Person Families | 72 (100.0%) | $67,813 |
| 3-Person Families | 0 (0.0%) | $0 |
| 4-Person Families | 0 (0.0%) | $0 |
| 5-Person Families | 0 (0.0%) | $0 |
| 6-Person Families | 0 (0.0%) | $0 |
| 7+ Person Families | 0 (0.0%) | $0 |
| Total | 72 (100.0%) | $67,813 |
Family Income by Number of Earners in Whispering Pines
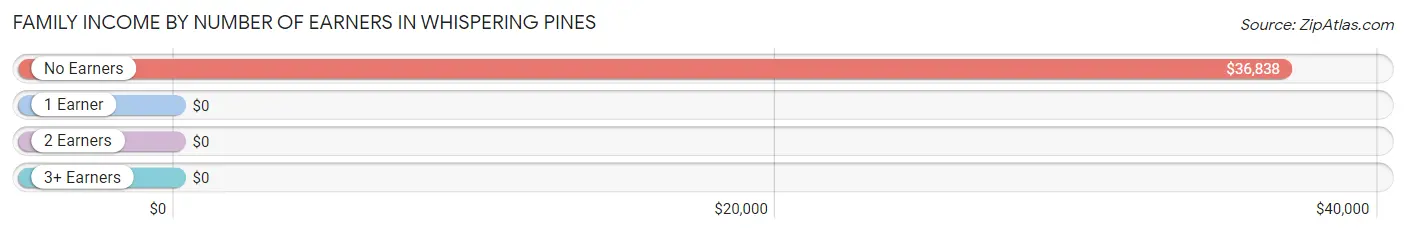
| Number of Earners | # Families | Median Income |
| No Earners | 50 (69.4%) | $36,838 |
| 1 Earner | 8 (11.1%) | $0 |
| 2 Earners | 14 (19.4%) | $0 |
| 3+ Earners | 0 (0.0%) | $0 |
| Total | 72 (100.0%) | $67,813 |
Household Income in Whispering Pines
Household Income Brackets in Whispering Pines
With 34 households falling in the category, the $35,000 to $49,999 income range is the most frequent in Whispering Pines, accounting for 47.2% of all households.
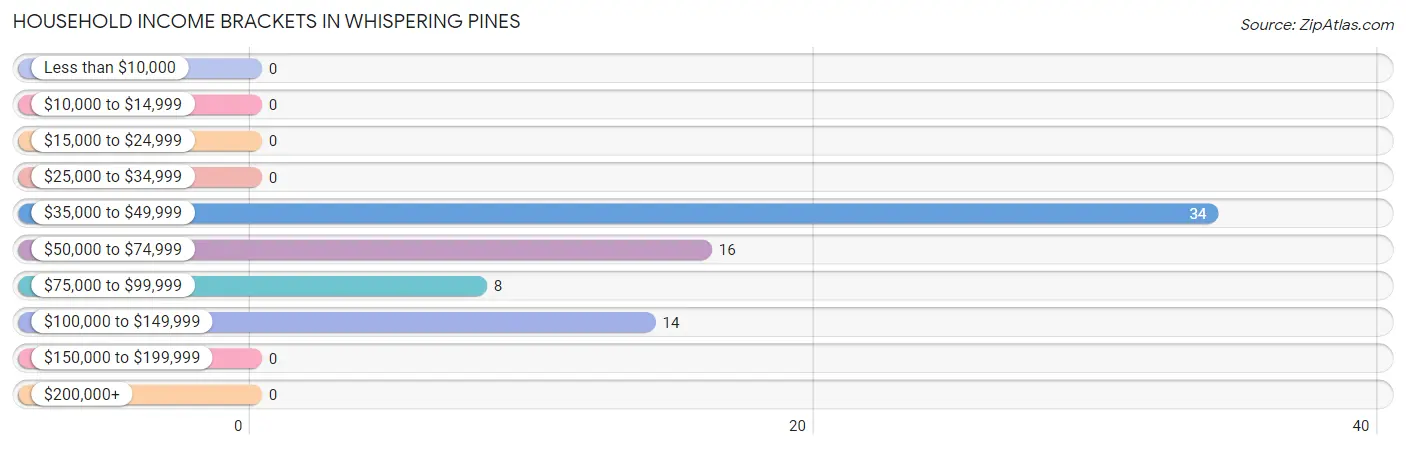
| Income Bracket | # Households | % Households |
| Less than $10,000 | 0 | 0.0% |
| $10,000 to $14,999 | 0 | 0.0% |
| $15,000 to $24,999 | 0 | 0.0% |
| $25,000 to $34,999 | 0 | 0.0% |
| $35,000 to $49,999 | 34 | 47.2% |
| $50,000 to $74,999 | 16 | 22.2% |
| $75,000 to $99,999 | 8 | 11.1% |
| $100,000 to $149,999 | 14 | 19.4% |
| $150,000 to $199,999 | 0 | 0.0% |
| $200,000+ | 0 | 0.0% |
Household Income by Householder Age in Whispering Pines
| Income Bracket | # Households | Median Income |
| 15 to 24 Years | 0 (0.0%) | $0 |
| 25 to 44 Years | 0 (0.0%) | $0 |
| 45 to 64 Years | 14 (19.4%) | $0 |
| 65+ Years | 58 (80.6%) | $0 |
| Total | 72 (100.0%) | $67,813 |
Poverty in Whispering Pines
Income Below Poverty by Sex and Age in Whispering Pines
| Age Bracket | Male | Female |
| Under 5 Years | 0 (0.0%) | 0 (0.0%) |
| 5 Years | 0 (0.0%) | 0 (0.0%) |
| 6 to 11 Years | 0 (0.0%) | 0 (0.0%) |
| 12 to 14 Years | 0 (0.0%) | 0 (0.0%) |
| 15 Years | 0 (0.0%) | 0 (0.0%) |
| 16 and 17 Years | 0 (0.0%) | 0 (0.0%) |
| 18 to 24 Years | 0 (0.0%) | 0 (0.0%) |
| 25 to 34 Years | 0 (0.0%) | 0 (0.0%) |
| 35 to 44 Years | 0 (0.0%) | 0 (0.0%) |
| 45 to 54 Years | 0 (0.0%) | 0 (0.0%) |
| 55 to 64 Years | 0 (0.0%) | 0 (0.0%) |
| 65 to 74 Years | 0 (0.0%) | 0 (0.0%) |
| 75 Years and over | 0 (0.0%) | 0 (0.0%) |
| Total | 0 (0.0%) | 0 (0.0%) |
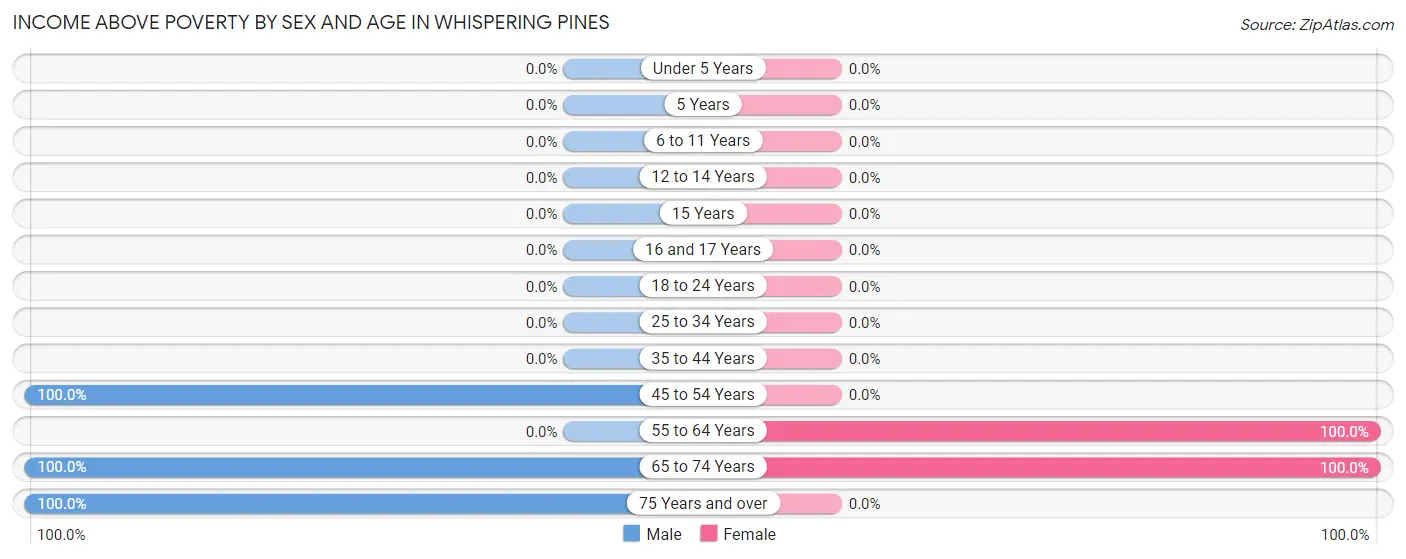
Income Above Poverty by Sex and Age in Whispering Pines
According to the poverty statistics in Whispering Pines, males aged 45 to 54 years and females aged 55 to 64 years are the age groups that are most secure financially, with 100.0% of males and 100.0% of females in these age groups living above the poverty line.
| Age Bracket | Male | Female |
| Under 5 Years | 0 (0.0%) | 0 (0.0%) |
| 5 Years | 0 (0.0%) | 0 (0.0%) |
| 6 to 11 Years | 0 (0.0%) | 0 (0.0%) |
| 12 to 14 Years | 0 (0.0%) | 0 (0.0%) |
| 15 Years | 0 (0.0%) | 0 (0.0%) |
| 16 and 17 Years | 0 (0.0%) | 0 (0.0%) |
| 18 to 24 Years | 0 (0.0%) | 0 (0.0%) |
| 25 to 34 Years | 0 (0.0%) | 0 (0.0%) |
| 35 to 44 Years | 0 (0.0%) | 0 (0.0%) |
| 45 to 54 Years | 14 (100.0%) | 0 (0.0%) |
| 55 to 64 Years | 0 (0.0%) | 20 (100.0%) |
| 65 to 74 Years | 24 (100.0%) | 48 (100.0%) |
| 75 Years and over | 20 (100.0%) | 0 (0.0%) |
| Total | 58 (100.0%) | 68 (100.0%) |
Income Below Poverty Among Married-Couple Families in Whispering Pines
| Children | Above Poverty | Below Poverty |
| No Children | 72 (100.0%) | 0 (0.0%) |
| 1 or 2 Children | 0 (0.0%) | 0 (0.0%) |
| 3 or 4 Children | 0 (0.0%) | 0 (0.0%) |
| 5 or more Children | 0 (0.0%) | 0 (0.0%) |
| Total | 72 (100.0%) | 0 (0.0%) |
Income Below Poverty Among Single-Parent Households in Whispering Pines
| Children | Single Father | Single Mother |
| No Children | 0 (0.0%) | 0 (0.0%) |
| 1 or 2 Children | 0 (0.0%) | 0 (0.0%) |
| 3 or 4 Children | 0 (0.0%) | 0 (0.0%) |
| 5 or more Children | 0 (0.0%) | 0 (0.0%) |
| Total | 0 (0.0%) | 0 (0.0%) |
Income Below Poverty Among Married-Couple vs Single-Parent Households in Whispering Pines
| Children | Married-Couple Families | Single-Parent Households |
| No Children | 0 (0.0%) | 0 (0.0%) |
| 1 or 2 Children | 0 (0.0%) | 0 (0.0%) |
| 3 or 4 Children | 0 (0.0%) | 0 (0.0%) |
| 5 or more Children | 0 (0.0%) | 0 (0.0%) |
| Total | 0 (0.0%) | 0 (0.0%) |
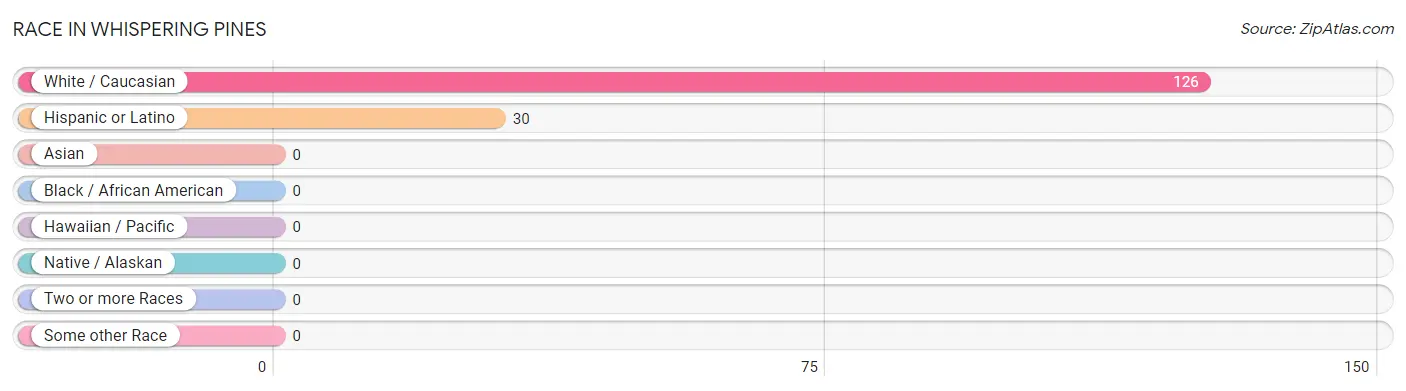
Race in Whispering Pines
The most populous races in Whispering Pines are White / Caucasian (126 | 100.0%), and Hispanic or Latino (30 | 23.8%).
| Race | # Population | % Population |
| Asian | 0 | 0.0% |
| Black / African American | 0 | 0.0% |
| Hawaiian / Pacific | 0 | 0.0% |
| Hispanic or Latino | 30 | 23.8% |
| Native / Alaskan | 0 | 0.0% |
| White / Caucasian | 126 | 100.0% |
| Two or more Races | 0 | 0.0% |
| Some other Race | 0 | 0.0% |
| Total | 126 | 100.0% |
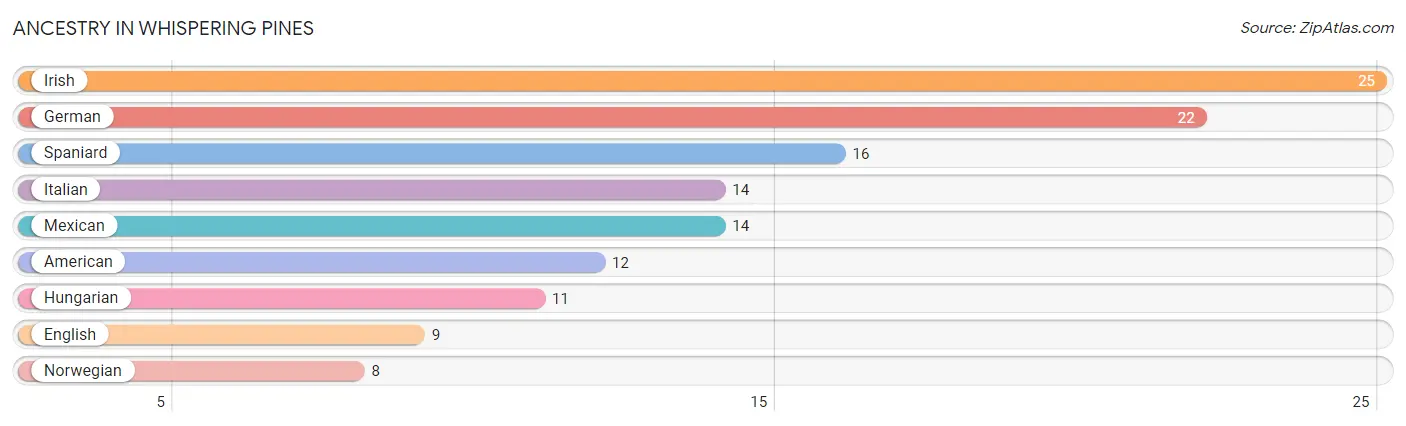
Ancestry in Whispering Pines
The most populous ancestries reported in Whispering Pines are Irish (25 | 19.8%), German (22 | 17.5%), Spaniard (16 | 12.7%), Italian (14 | 11.1%), and Mexican (14 | 11.1%), together accounting for 72.2% of all Whispering Pines residents.
| Ancestry | # Population | % Population |
| American | 12 | 9.5% |
| English | 9 | 7.1% |
| German | 22 | 17.5% |
| Hungarian | 11 | 8.7% |
| Irish | 25 | 19.8% |
| Italian | 14 | 11.1% |
| Mexican | 14 | 11.1% |
| Norwegian | 8 | 6.4% |
| Spaniard | 16 | 12.7% | View All 9 Rows |
Immigrants in Whispering Pines

| Immigration Origin | # Population | % Population | View All 0 Rows |
Sex and Age in Whispering Pines
Sex and Age in Whispering Pines
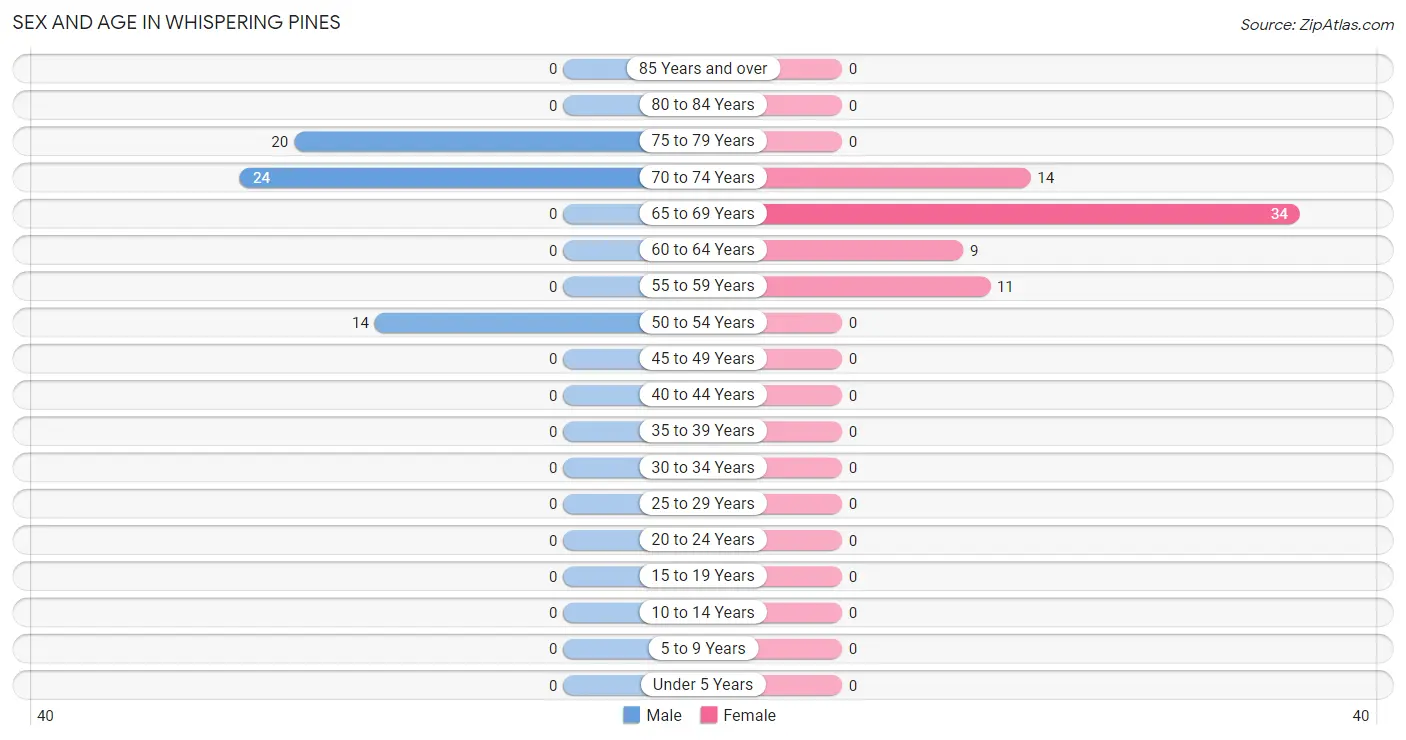
The most populous age groups in Whispering Pines are 70 to 74 Years (24 | 41.4%) for men and 65 to 69 Years (34 | 50.0%) for women.
| Age Bracket | Male | Female |
| Under 5 Years | 0 (0.0%) | 0 (0.0%) |
| 5 to 9 Years | 0 (0.0%) | 0 (0.0%) |
| 10 to 14 Years | 0 (0.0%) | 0 (0.0%) |
| 15 to 19 Years | 0 (0.0%) | 0 (0.0%) |
| 20 to 24 Years | 0 (0.0%) | 0 (0.0%) |
| 25 to 29 Years | 0 (0.0%) | 0 (0.0%) |
| 30 to 34 Years | 0 (0.0%) | 0 (0.0%) |
| 35 to 39 Years | 0 (0.0%) | 0 (0.0%) |
| 40 to 44 Years | 0 (0.0%) | 0 (0.0%) |
| 45 to 49 Years | 0 (0.0%) | 0 (0.0%) |
| 50 to 54 Years | 14 (24.1%) | 0 (0.0%) |
| 55 to 59 Years | 0 (0.0%) | 11 (16.2%) |
| 60 to 64 Years | 0 (0.0%) | 9 (13.2%) |
| 65 to 69 Years | 0 (0.0%) | 34 (50.0%) |
| 70 to 74 Years | 24 (41.4%) | 14 (20.6%) |
| 75 to 79 Years | 20 (34.5%) | 0 (0.0%) |
| 80 to 84 Years | 0 (0.0%) | 0 (0.0%) |
| 85 Years and over | 0 (0.0%) | 0 (0.0%) |
| Total | 58 (100.0%) | 68 (100.0%) |
Families and Households in Whispering Pines
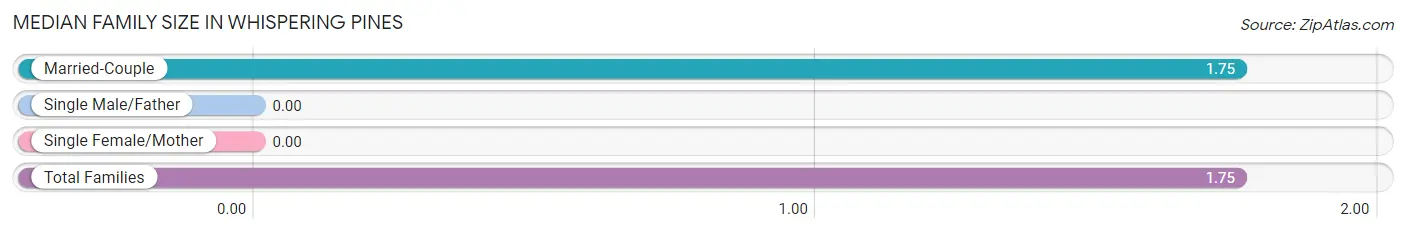
Median Family Size in Whispering Pines
| Family Type | # Families | Family Size |
| Married-Couple | 72 (100.0%) | 1.75 |
| Single Male/Father | 0 (0.0%) | - |
| Single Female/Mother | 0 (0.0%) | - |
| Total Families | 72 (100.0%) | 1.75 |
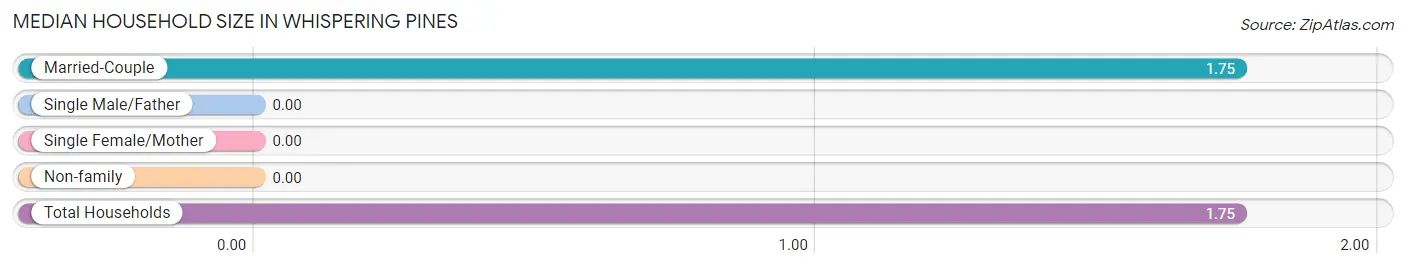
Median Household Size in Whispering Pines
| Household Type | # Households | Household Size |
| Married-Couple | 72 (100.0%) | 1.75 |
| Single Male/Father | 0 (0.0%) | - |
| Single Female/Mother | 0 (0.0%) | - |
| Non-family | 0 (0.0%) | - |
| Total Households | 72 (100.0%) | 1.75 |
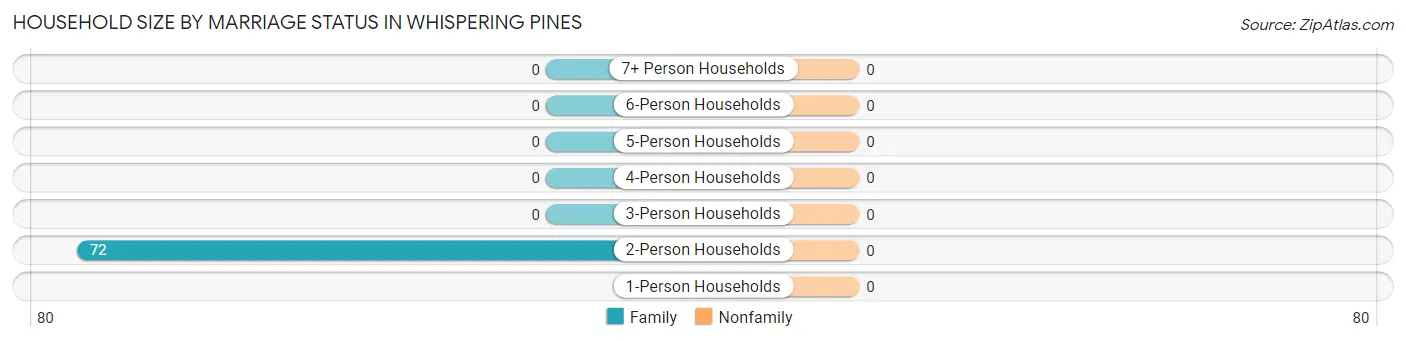
Household Size by Marriage Status in Whispering Pines
| Household Size | Family Households | Nonfamily Households |
| 1-Person Households | - | 0 (0.0%) |
| 2-Person Households | 72 (100.0%) | 0 (0.0%) |
| 3-Person Households | 0 (0.0%) | 0 (0.0%) |
| 4-Person Households | 0 (0.0%) | 0 (0.0%) |
| 5-Person Households | 0 (0.0%) | 0 (0.0%) |
| 6-Person Households | 0 (0.0%) | 0 (0.0%) |
| 7+ Person Households | 0 (0.0%) | 0 (0.0%) |
| Total | 72 (100.0%) | 0 (0.0%) |
Female Fertility in Whispering Pines
Fertility by Age in Whispering Pines
| Age Bracket | Women with Births | Births / 1,000 Women |
| 15 to 19 years | 0 (0.0%) | 0.0 |
| 20 to 34 years | 0 (0.0%) | 0.0 |
| 35 to 50 years | 0 (0.0%) | 0.0 |
| Total | 0 (0.0%) | 0.0 |
Fertility by Age by Marriage Status in Whispering Pines
| Age Bracket | Married | Unmarried |
| 15 to 19 years | 0 (0.0%) | 0 (0.0%) |
| 20 to 34 years | 0 (0.0%) | 0 (0.0%) |
| 35 to 50 years | 0 (0.0%) | 0 (0.0%) |
| Total | 0 (0.0%) | 0 (0.0%) |
Fertility by Education in Whispering Pines
| Educational Attainment | Women with Births | Births / 1,000 Women |
| Less than High School | 0 (0.0%) | 0.0 |
| High School Diploma | 0 (0.0%) | 0.0 |
| College or Associate's Degree | 0 (0.0%) | 0.0 |
| Bachelor's Degree | 0 (0.0%) | 0.0 |
| Graduate Degree | 0 (0.0%) | 0.0 |
| Total | 0 (0.0%) | 0.0 |
Fertility by Education by Marriage Status in Whispering Pines
| Educational Attainment | Married | Unmarried |
| Less than High School | 0 (0.0%) | 0 (0.0%) |
| High School Diploma | 0 (0.0%) | 0 (0.0%) |
| College or Associate's Degree | 0 (0.0%) | 0 (0.0%) |
| Bachelor's Degree | 0 (0.0%) | 0 (0.0%) |
| Graduate Degree | 0 (0.0%) | 0 (0.0%) |
| Total | 0 (0.0%) | 0 (0.0%) |
Employment Characteristics in Whispering Pines
Employment by Class of Employer in Whispering Pines
Among the 23 employed individuals in Whispering Pines, , and private company employees (23 | 100.0%) make up the most common classes of employment.
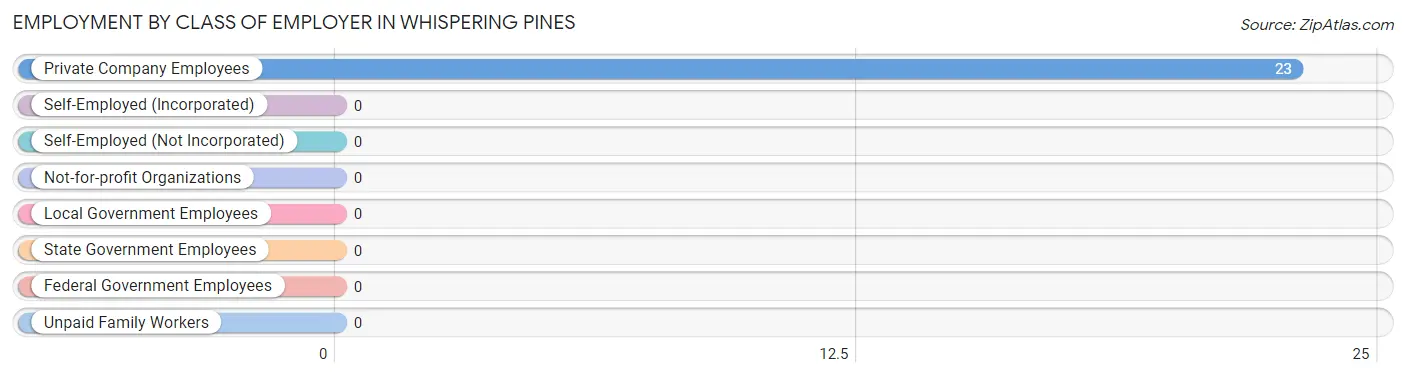
| Employer Class | # Employees | % Employees |
| Private Company Employees | 23 | 100.0% |
| Self-Employed (Incorporated) | 0 | 0.0% |
| Self-Employed (Not Incorporated) | 0 | 0.0% |
| Not-for-profit Organizations | 0 | 0.0% |
| Local Government Employees | 0 | 0.0% |
| State Government Employees | 0 | 0.0% |
| Federal Government Employees | 0 | 0.0% |
| Unpaid Family Workers | 0 | 0.0% |
| Total | 23 | 100.0% |
Employment Status by Age in Whispering Pines
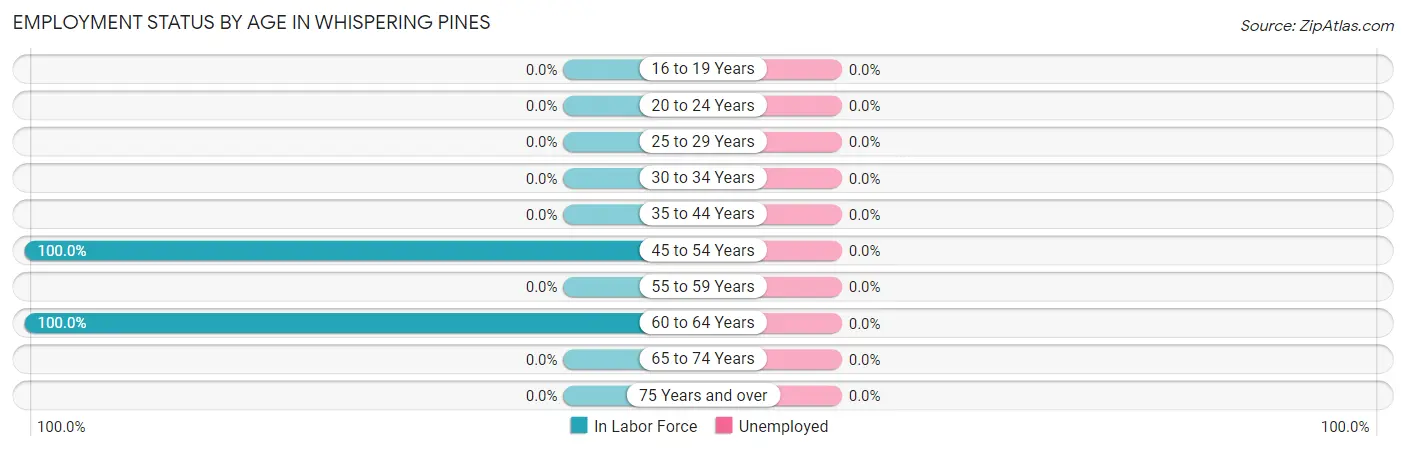
| Age Bracket | In Labor Force | Unemployed |
| 16 to 19 Years | 0 (0.0%) | 0 (0.0%) |
| 20 to 24 Years | 0 (0.0%) | 0 (0.0%) |
| 25 to 29 Years | 0 (0.0%) | 0 (0.0%) |
| 30 to 34 Years | 0 (0.0%) | 0 (0.0%) |
| 35 to 44 Years | 0 (0.0%) | 0 (0.0%) |
| 45 to 54 Years | 14 (100.0%) | 0 (0.0%) |
| 55 to 59 Years | 0 (0.0%) | 0 (0.0%) |
| 60 to 64 Years | 9 (100.0%) | 0 (0.0%) |
| 65 to 74 Years | 0 (0.0%) | 0 (0.0%) |
| 75 Years and over | 0 (0.0%) | 0 (0.0%) |
| Total | 23 (18.3%) | 0 (0.0%) |
Employment Status by Educational Attainment in Whispering Pines
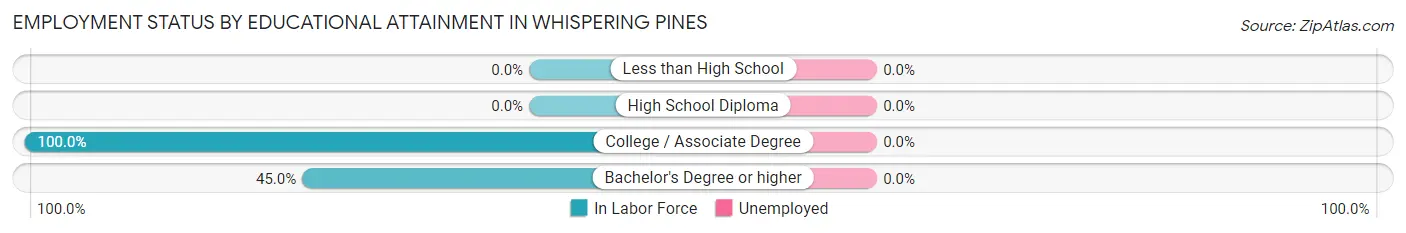
| Educational Attainment | In Labor Force | Unemployed |
| Less than High School | 0 (0.0%) | 0 (0.0%) |
| High School Diploma | 0 (0.0%) | 0 (0.0%) |
| College / Associate Degree | 14 (100.0%) | 0 (0.0%) |
| Bachelor's Degree or higher | 9 (45.0%) | 0 (0.0%) |
| Total | 23 (67.6%) | 0 (0.0%) |
Employment Occupations by Sex in Whispering Pines
Management, Business, Science and Arts Occupations
The most common Management, Business, Science and Arts occupations in Whispering Pines are Computers, Engineering & Science (14 | 60.9%), Computers & Mathematics (14 | 60.9%), and Management (9 | 39.1%).
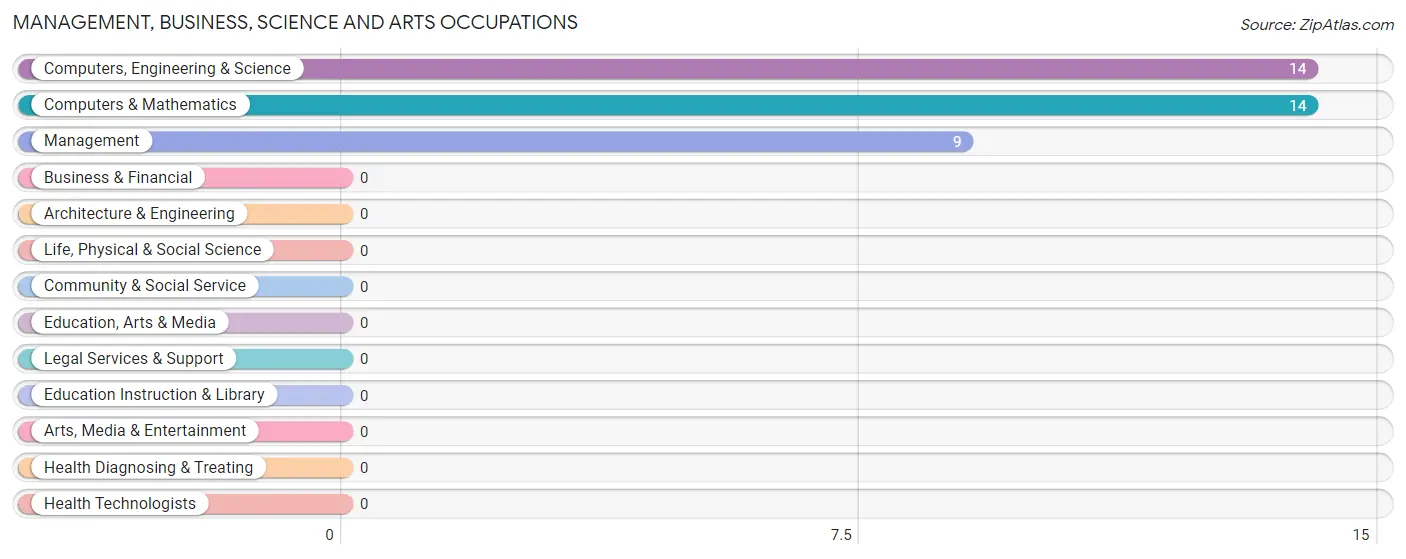
Management, Business, Science and Arts Occupations by Sex
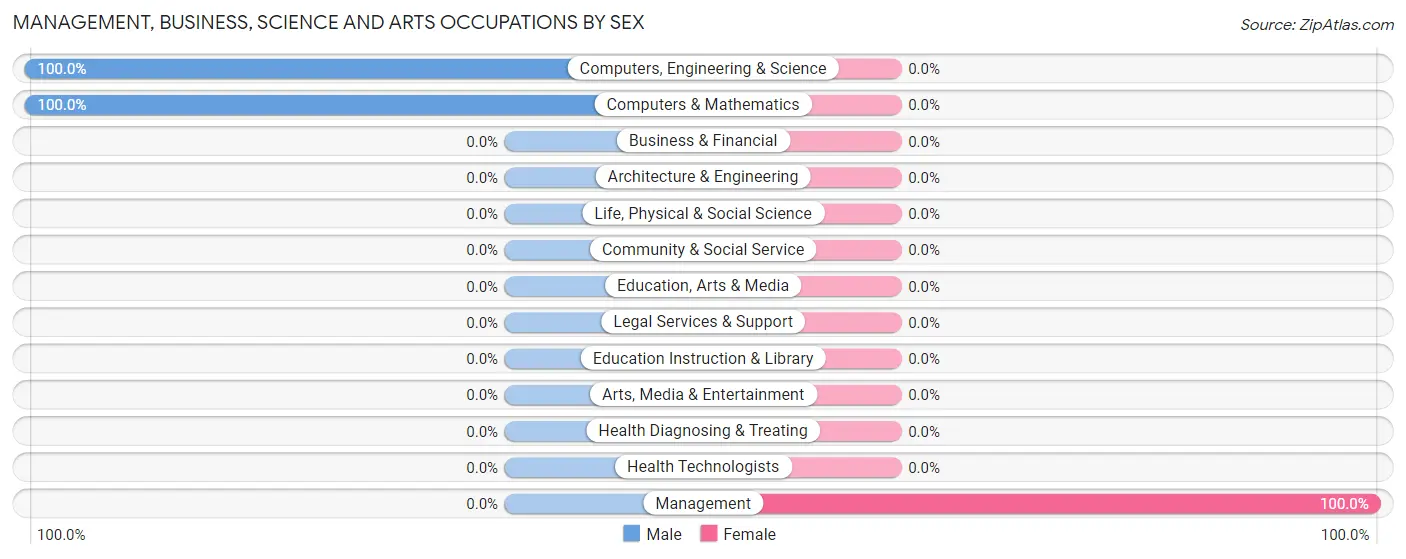
| Occupation | Male | Female |
| Management | 0 (0.0%) | 9 (100.0%) |
| Business & Financial | 0 (0.0%) | 0 (0.0%) |
| Computers, Engineering & Science | 14 (100.0%) | 0 (0.0%) |
| Computers & Mathematics | 14 (100.0%) | 0 (0.0%) |
| Architecture & Engineering | 0 (0.0%) | 0 (0.0%) |
| Life, Physical & Social Science | 0 (0.0%) | 0 (0.0%) |
| Community & Social Service | 0 (0.0%) | 0 (0.0%) |
| Education, Arts & Media | 0 (0.0%) | 0 (0.0%) |
| Legal Services & Support | 0 (0.0%) | 0 (0.0%) |
| Education Instruction & Library | 0 (0.0%) | 0 (0.0%) |
| Arts, Media & Entertainment | 0 (0.0%) | 0 (0.0%) |
| Health Diagnosing & Treating | 0 (0.0%) | 0 (0.0%) |
| Health Technologists | 0 (0.0%) | 0 (0.0%) |
| Total (Category) | 14 (60.9%) | 9 (39.1%) |
| Total (Overall) | 14 (60.9%) | 9 (39.1%) |
Services Occupations
Services Occupations by Sex
| Occupation | Male | Female |
| Healthcare Support | 0 (0.0%) | 0 (0.0%) |
| Security & Protection | 0 (0.0%) | 0 (0.0%) |
| Firefighting & Prevention | 0 (0.0%) | 0 (0.0%) |
| Law Enforcement | 0 (0.0%) | 0 (0.0%) |
| Food Preparation & Serving | 0 (0.0%) | 0 (0.0%) |
| Cleaning & Maintenance | 0 (0.0%) | 0 (0.0%) |
| Personal Care & Service | 0 (0.0%) | 0 (0.0%) |
| Total (Category) | 0 (0.0%) | 0 (0.0%) |
| Total (Overall) | 14 (60.9%) | 9 (39.1%) |
Sales and Office Occupations

Sales and Office Occupations by Sex
| Occupation | Male | Female |
| Sales & Related | 0 (0.0%) | 0 (0.0%) |
| Office & Administration | 0 (0.0%) | 0 (0.0%) |
| Total (Category) | 0 (0.0%) | 0 (0.0%) |
| Total (Overall) | 14 (60.9%) | 9 (39.1%) |
Natural Resources, Construction and Maintenance Occupations
Natural Resources, Construction and Maintenance Occupations by Sex
| Occupation | Male | Female |
| Farming, Fishing & Forestry | 0 (0.0%) | 0 (0.0%) |
| Construction & Extraction | 0 (0.0%) | 0 (0.0%) |
| Installation, Maintenance & Repair | 0 (0.0%) | 0 (0.0%) |
| Total (Category) | 0 (0.0%) | 0 (0.0%) |
| Total (Overall) | 14 (60.9%) | 9 (39.1%) |
Production, Transportation and Moving Occupations
Production, Transportation and Moving Occupations by Sex
| Occupation | Male | Female |
| Production | 0 (0.0%) | 0 (0.0%) |
| Transportation | 0 (0.0%) | 0 (0.0%) |
| Material Moving | 0 (0.0%) | 0 (0.0%) |
| Total (Category) | 0 (0.0%) | 0 (0.0%) |
| Total (Overall) | 14 (60.9%) | 9 (39.1%) |
Employment Industries by Sex in Whispering Pines
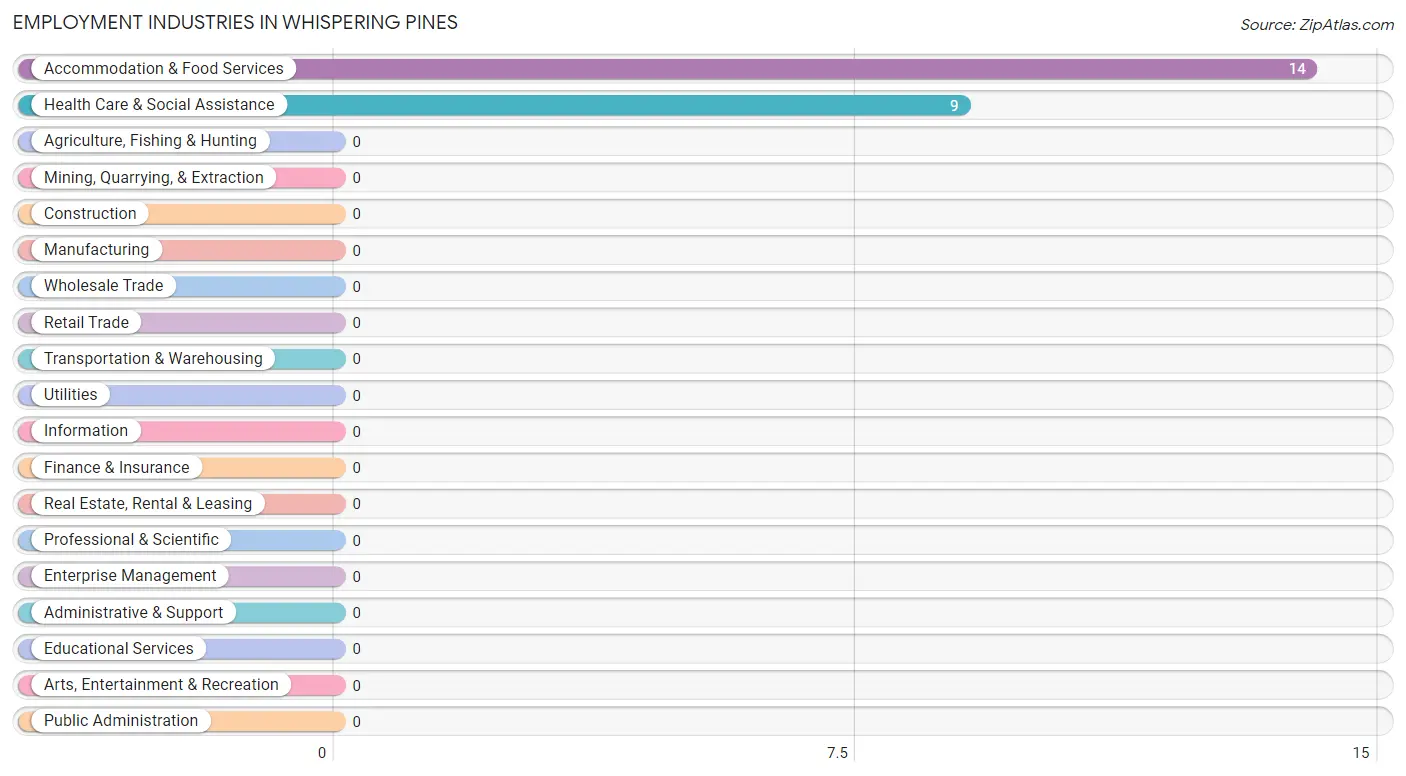
Employment Industries in Whispering Pines
The major employment industries in Whispering Pines include Accommodation & Food Services (14 | 60.9%), and Health Care & Social Assistance (9 | 39.1%).
Employment Industries by Sex in Whispering Pines
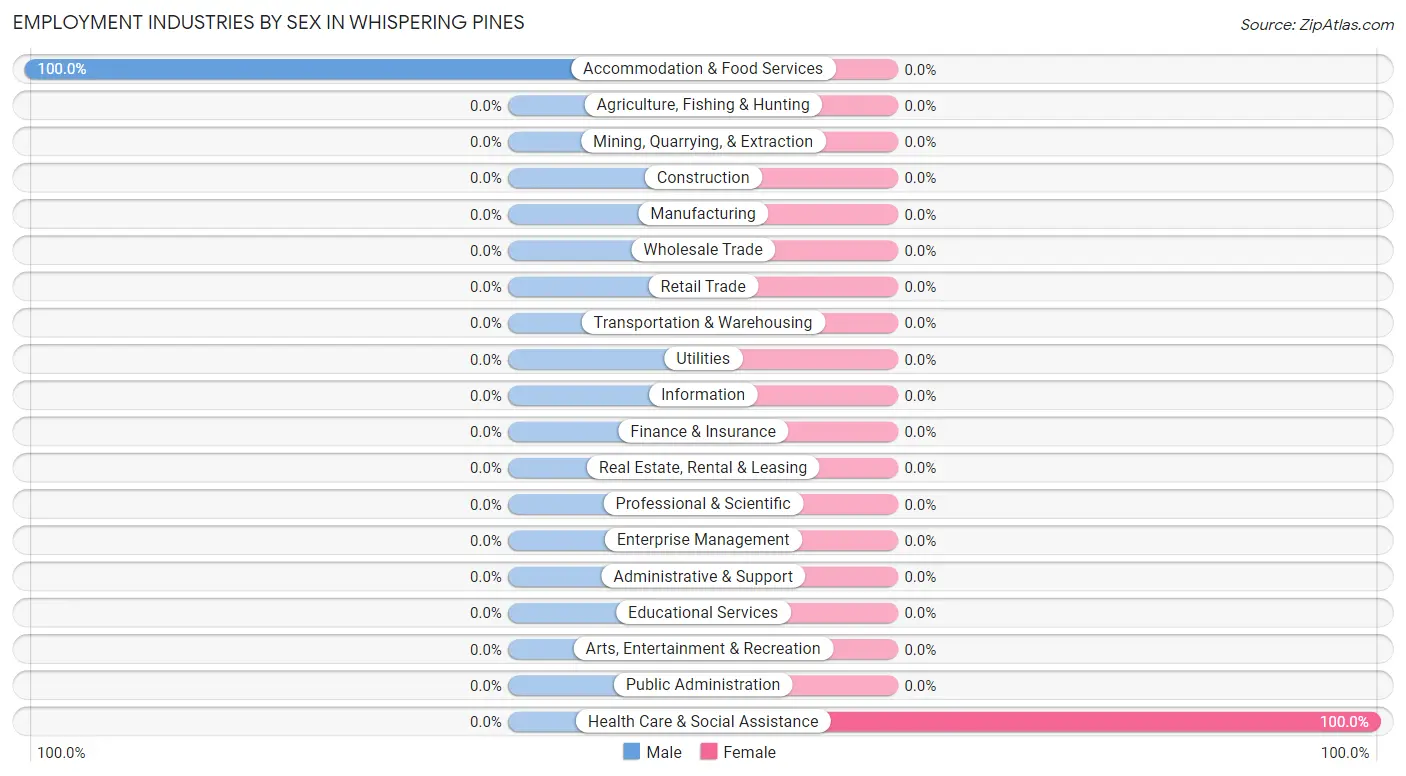
| Industry | Male | Female |
| Agriculture, Fishing & Hunting | 0 (0.0%) | 0 (0.0%) |
| Mining, Quarrying, & Extraction | 0 (0.0%) | 0 (0.0%) |
| Construction | 0 (0.0%) | 0 (0.0%) |
| Manufacturing | 0 (0.0%) | 0 (0.0%) |
| Wholesale Trade | 0 (0.0%) | 0 (0.0%) |
| Retail Trade | 0 (0.0%) | 0 (0.0%) |
| Transportation & Warehousing | 0 (0.0%) | 0 (0.0%) |
| Utilities | 0 (0.0%) | 0 (0.0%) |
| Information | 0 (0.0%) | 0 (0.0%) |
| Finance & Insurance | 0 (0.0%) | 0 (0.0%) |
| Real Estate, Rental & Leasing | 0 (0.0%) | 0 (0.0%) |
| Professional & Scientific | 0 (0.0%) | 0 (0.0%) |
| Enterprise Management | 0 (0.0%) | 0 (0.0%) |
| Administrative & Support | 0 (0.0%) | 0 (0.0%) |
| Educational Services | 0 (0.0%) | 0 (0.0%) |
| Health Care & Social Assistance | 0 (0.0%) | 9 (100.0%) |
| Arts, Entertainment & Recreation | 0 (0.0%) | 0 (0.0%) |
| Accommodation & Food Services | 14 (100.0%) | 0 (0.0%) |
| Public Administration | 0 (0.0%) | 0 (0.0%) |
| Total | 14 (60.9%) | 9 (39.1%) |
Education in Whispering Pines
School Enrollment in Whispering Pines
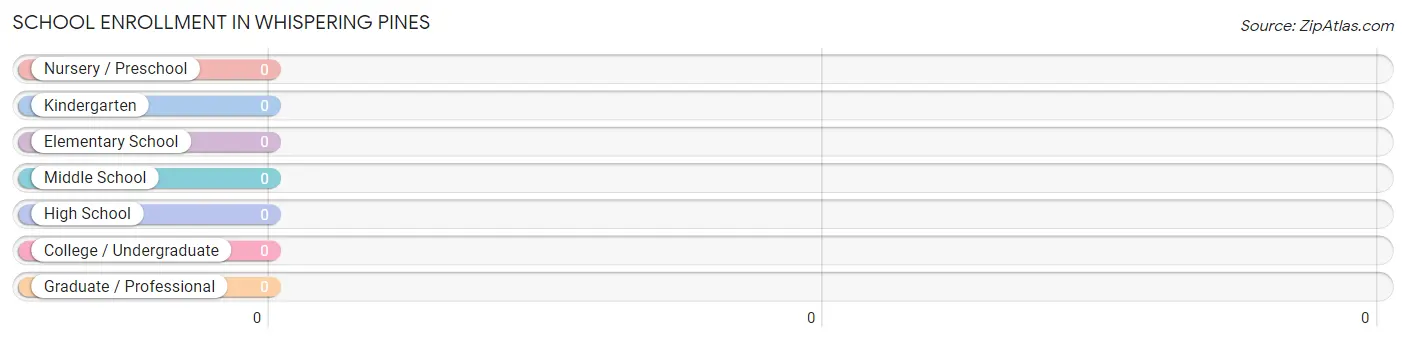
| School Level | # Students | % Students |
| Nursery / Preschool | 0 | 0.0% |
| Kindergarten | 0 | 0.0% |
| Elementary School | 0 | 0.0% |
| Middle School | 0 | 0.0% |
| High School | 0 | 0.0% |
| College / Undergraduate | 0 | 0.0% |
| Graduate / Professional | 0 | 0.0% |
| Total | 0 | 0.0% |
School Enrollment by Age by Funding Source in Whispering Pines
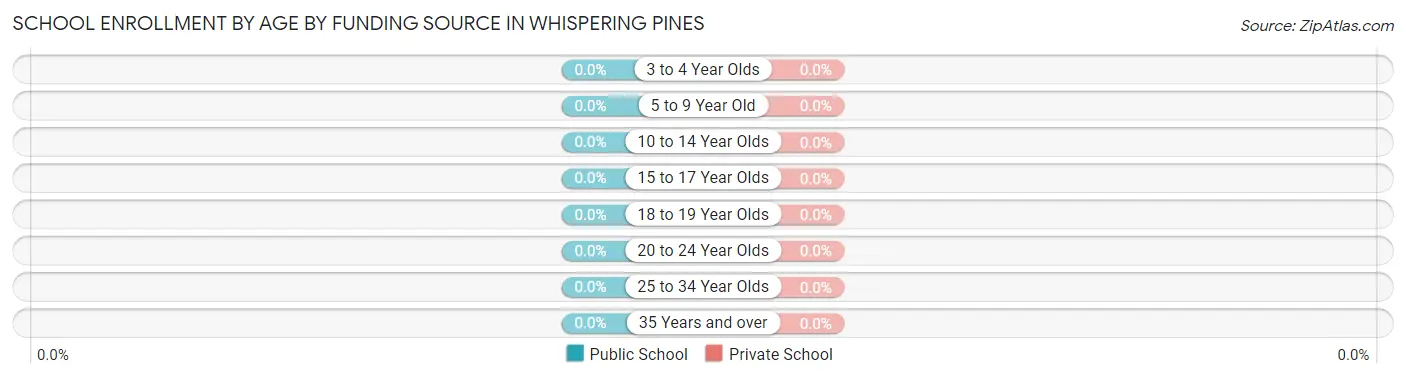
| Age Bracket | Public School | Private School |
| 3 to 4 Year Olds | 0 (0.0%) | 0 (0.0%) |
| 5 to 9 Year Old | 0 (0.0%) | 0 (0.0%) |
| 10 to 14 Year Olds | 0 (0.0%) | 0 (0.0%) |
| 15 to 17 Year Olds | 0 (0.0%) | 0 (0.0%) |
| 18 to 19 Year Olds | 0 (0.0%) | 0 (0.0%) |
| 20 to 24 Year Olds | 0 (0.0%) | 0 (0.0%) |
| 25 to 34 Year Olds | 0 (0.0%) | 0 (0.0%) |
| 35 Years and over | 0 (0.0%) | 0 (0.0%) |
| Total | 0 (0.0%) | 0 (0.0%) |
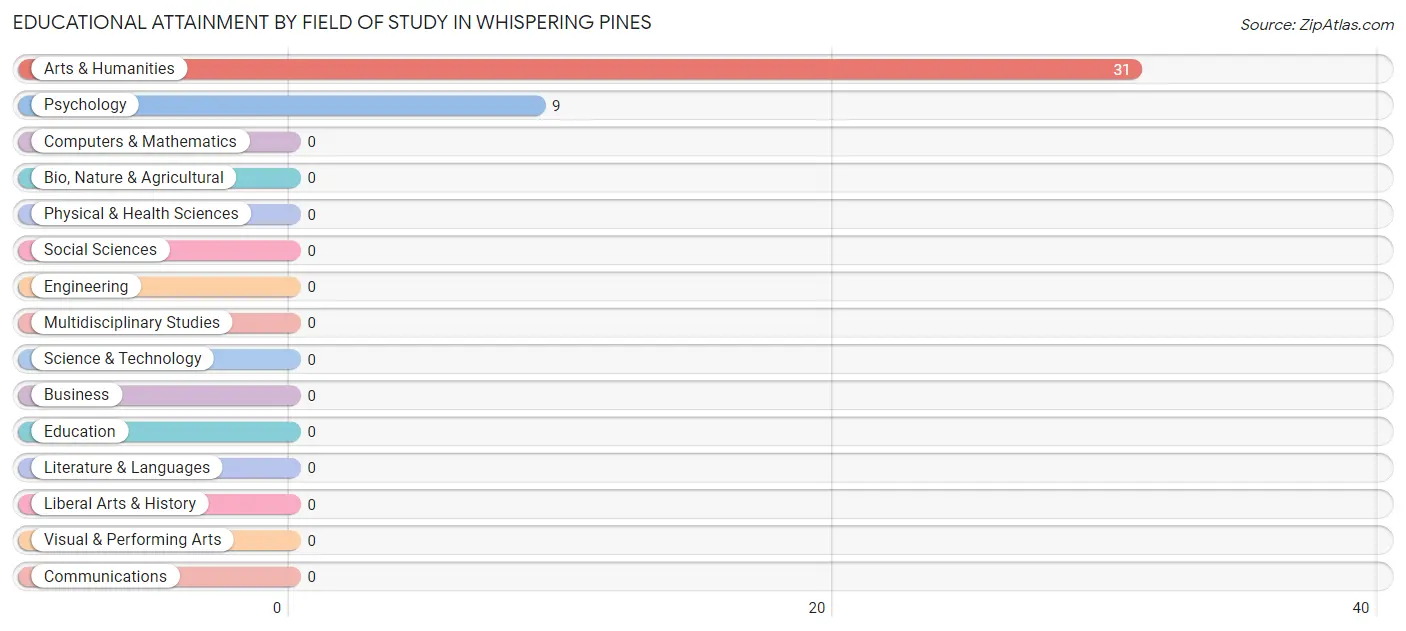
Educational Attainment by Field of Study in Whispering Pines
Arts & humanities (31 | 77.5%), and psychology (9 | 22.5%) are the most common fields of study among 40 individuals in Whispering Pines who have obtained a bachelor's degree or higher.
| Field of Study | # Graduates | % Graduates |
| Computers & Mathematics | 0 | 0.0% |
| Bio, Nature & Agricultural | 0 | 0.0% |
| Physical & Health Sciences | 0 | 0.0% |
| Psychology | 9 | 22.5% |
| Social Sciences | 0 | 0.0% |
| Engineering | 0 | 0.0% |
| Multidisciplinary Studies | 0 | 0.0% |
| Science & Technology | 0 | 0.0% |
| Business | 0 | 0.0% |
| Education | 0 | 0.0% |
| Literature & Languages | 0 | 0.0% |
| Liberal Arts & History | 0 | 0.0% |
| Visual & Performing Arts | 0 | 0.0% |
| Communications | 0 | 0.0% |
| Arts & Humanities | 31 | 77.5% |
| Total | 40 | 100.0% |
Transportation & Commute in Whispering Pines
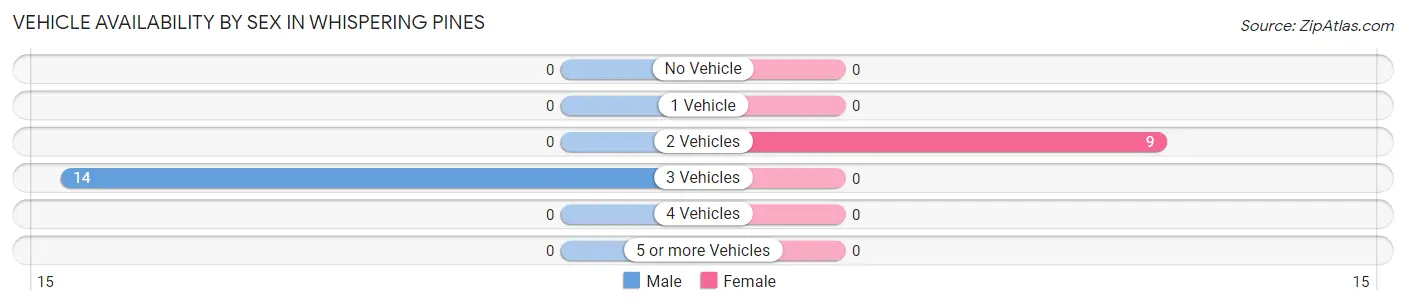
Vehicle Availability by Sex in Whispering Pines
The most prevalent vehicle ownership categories in Whispering Pines are males with 3 vehicles (14, accounting for 100.0%) and females with 3 vehicles (0, making up 155.6%).
| Vehicles Available | Male | Female |
| No Vehicle | 0 (0.0%) | 0 (0.0%) |
| 1 Vehicle | 0 (0.0%) | 0 (0.0%) |
| 2 Vehicles | 0 (0.0%) | 9 (100.0%) |
| 3 Vehicles | 14 (100.0%) | 0 (0.0%) |
| 4 Vehicles | 0 (0.0%) | 0 (0.0%) |
| 5 or more Vehicles | 0 (0.0%) | 0 (0.0%) |
| Total | 14 (100.0%) | 9 (100.0%) |
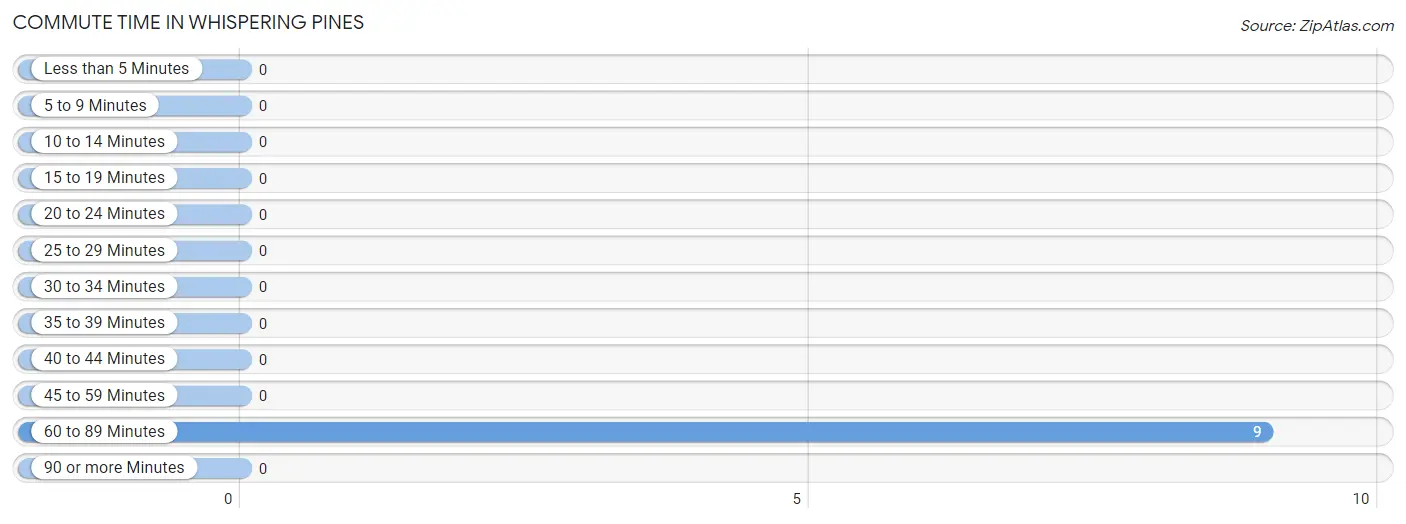
Commute Time in Whispering Pines
The most frequently occuring commute durations in Whispering Pines are 60 to 89 minutes (9 commuters, 100.0%), less than 5 minutes (0 commuters, 0.0%), and 5 to 9 minutes (0 commuters, 0.0%).
| Commute Time | # Commuters | % Commuters |
| Less than 5 Minutes | 0 | 0.0% |
| 5 to 9 Minutes | 0 | 0.0% |
| 10 to 14 Minutes | 0 | 0.0% |
| 15 to 19 Minutes | 0 | 0.0% |
| 20 to 24 Minutes | 0 | 0.0% |
| 25 to 29 Minutes | 0 | 0.0% |
| 30 to 34 Minutes | 0 | 0.0% |
| 35 to 39 Minutes | 0 | 0.0% |
| 40 to 44 Minutes | 0 | 0.0% |
| 45 to 59 Minutes | 0 | 0.0% |
| 60 to 89 Minutes | 9 | 100.0% |
| 90 or more Minutes | 0 | 0.0% |
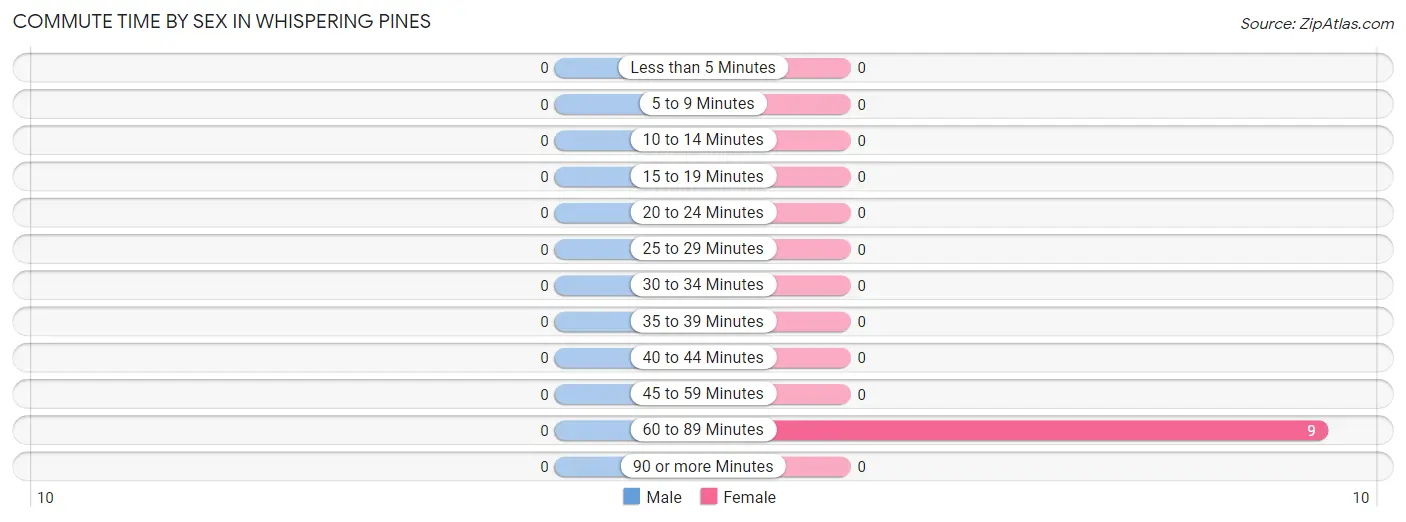
Commute Time by Sex in Whispering Pines
| Commute Time | Male | Female |
| Less than 5 Minutes | 0 (0.0%) | 0 (0.0%) |
| 5 to 9 Minutes | 0 (0.0%) | 0 (0.0%) |
| 10 to 14 Minutes | 0 (0.0%) | 0 (0.0%) |
| 15 to 19 Minutes | 0 (0.0%) | 0 (0.0%) |
| 20 to 24 Minutes | 0 (0.0%) | 0 (0.0%) |
| 25 to 29 Minutes | 0 (0.0%) | 0 (0.0%) |
| 30 to 34 Minutes | 0 (0.0%) | 0 (0.0%) |
| 35 to 39 Minutes | 0 (0.0%) | 0 (0.0%) |
| 40 to 44 Minutes | 0 (0.0%) | 0 (0.0%) |
| 45 to 59 Minutes | 0 (0.0%) | 0 (0.0%) |
| 60 to 89 Minutes | 0 (0.0%) | 9 (100.0%) |
| 90 or more Minutes | 0 (0.0%) | 0 (0.0%) |
Time of Departure to Work by Sex in Whispering Pines
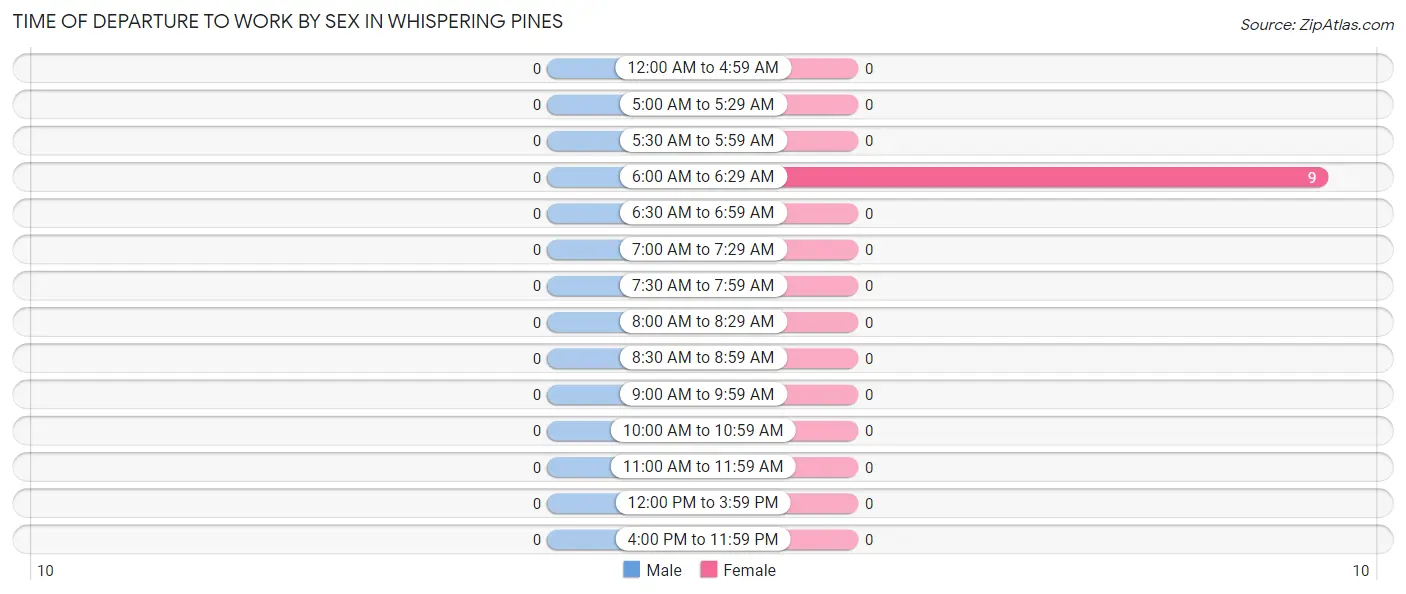
| Time of Departure | Male | Female |
| 12:00 AM to 4:59 AM | 0 (0.0%) | 0 (0.0%) |
| 5:00 AM to 5:29 AM | 0 (0.0%) | 0 (0.0%) |
| 5:30 AM to 5:59 AM | 0 (0.0%) | 0 (0.0%) |
| 6:00 AM to 6:29 AM | 0 (0.0%) | 9 (100.0%) |
| 6:30 AM to 6:59 AM | 0 (0.0%) | 0 (0.0%) |
| 7:00 AM to 7:29 AM | 0 (0.0%) | 0 (0.0%) |
| 7:30 AM to 7:59 AM | 0 (0.0%) | 0 (0.0%) |
| 8:00 AM to 8:29 AM | 0 (0.0%) | 0 (0.0%) |
| 8:30 AM to 8:59 AM | 0 (0.0%) | 0 (0.0%) |
| 9:00 AM to 9:59 AM | 0 (0.0%) | 0 (0.0%) |
| 10:00 AM to 10:59 AM | 0 (0.0%) | 0 (0.0%) |
| 11:00 AM to 11:59 AM | 0 (0.0%) | 0 (0.0%) |
| 12:00 PM to 3:59 PM | 0 (0.0%) | 0 (0.0%) |
| 4:00 PM to 11:59 PM | 0 (0.0%) | 0 (0.0%) |
| Total | 0 (0.0%) | 9 (100.0%) |
Housing Occupancy in Whispering Pines
Occupancy by Ownership in Whispering Pines
Of the total 72 dwellings in Whispering Pines, owner-occupied units account for 38 (52.8%), while renter-occupied units make up 34 (47.2%).
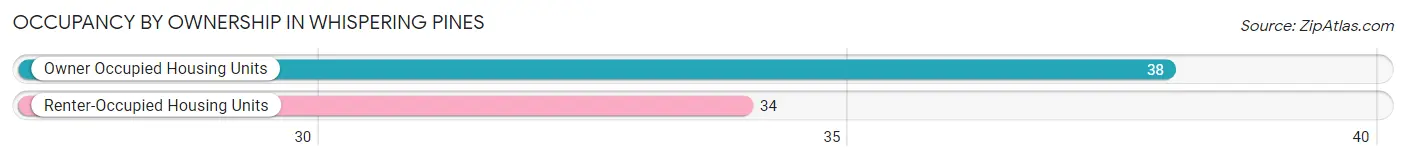
| Occupancy | # Housing Units | % Housing Units |
| Owner Occupied Housing Units | 38 | 52.8% |
| Renter-Occupied Housing Units | 34 | 47.2% |
| Total Occupied Housing Units | 72 | 100.0% |
Occupancy by Household Size in Whispering Pines
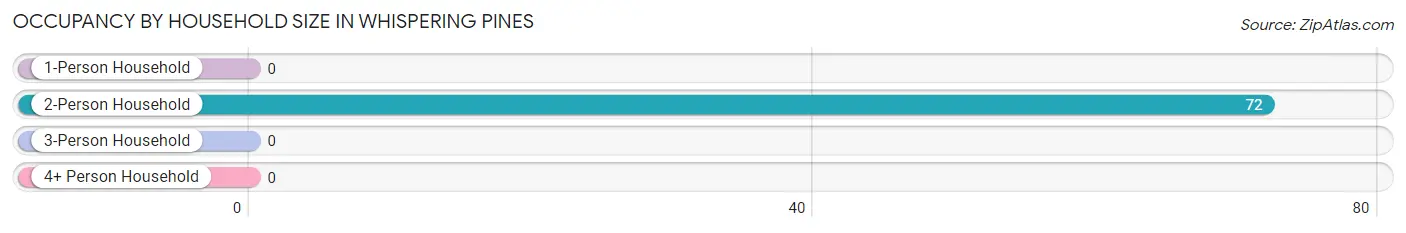
| Household Size | # Housing Units | % Housing Units |
| 1-Person Household | 0 | 0.0% |
| 2-Person Household | 72 | 100.0% |
| 3-Person Household | 0 | 0.0% |
| 4+ Person Household | 0 | 0.0% |
| Total Housing Units | 72 | 100.0% |
Occupancy by Ownership by Household Size in Whispering Pines
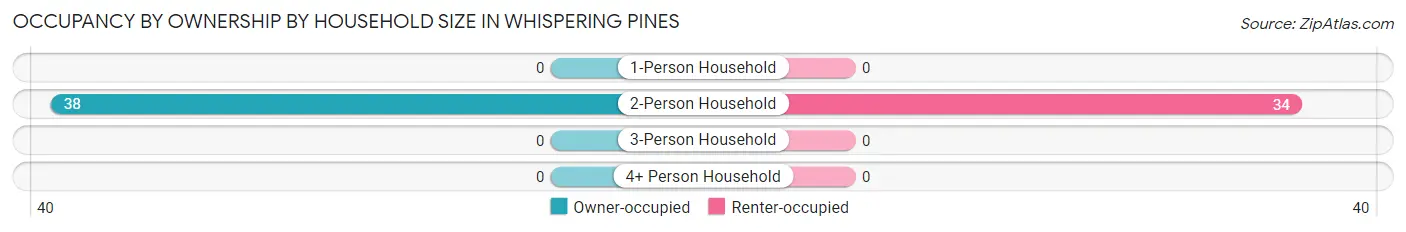
| Household Size | Owner-occupied | Renter-occupied |
| 1-Person Household | 0 (0.0%) | 0 (0.0%) |
| 2-Person Household | 38 (52.8%) | 34 (47.2%) |
| 3-Person Household | 0 (0.0%) | 0 (0.0%) |
| 4+ Person Household | 0 (0.0%) | 0 (0.0%) |
| Total Housing Units | 38 (52.8%) | 34 (47.2%) |
Occupancy by Educational Attainment in Whispering Pines
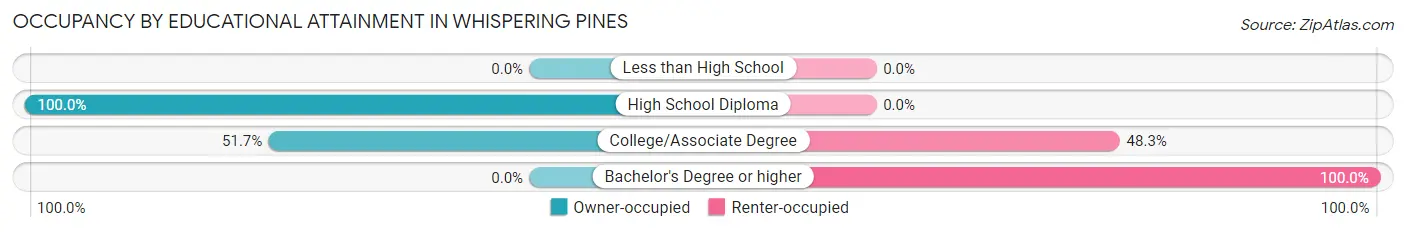
| Household Size | Owner-occupied | Renter-occupied |
| Less than High School | 0 (0.0%) | 0 (0.0%) |
| High School Diploma | 8 (100.0%) | 0 (0.0%) |
| College/Associate Degree | 30 (51.7%) | 28 (48.3%) |
| Bachelor's Degree or higher | 0 (0.0%) | 6 (100.0%) |
Occupancy by Age of Householder in Whispering Pines
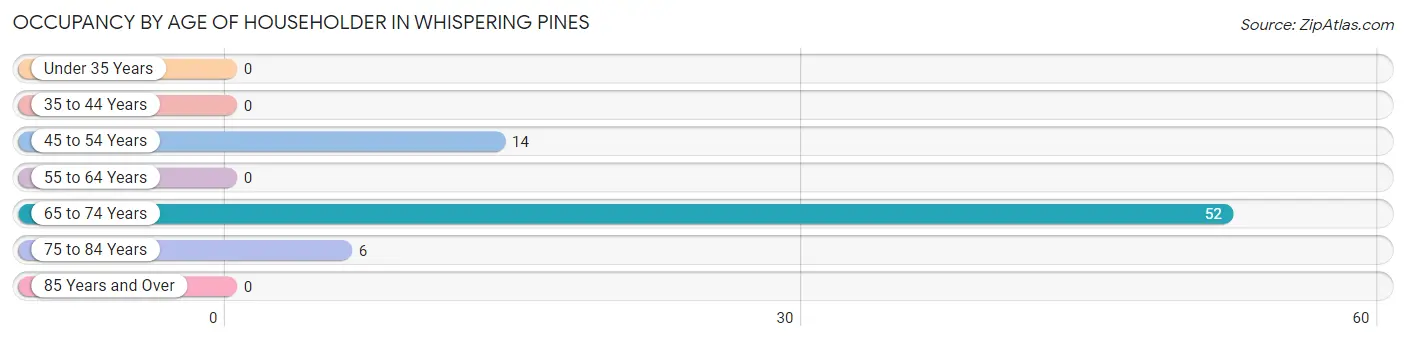
| Age Bracket | # Households | % Households |
| Under 35 Years | 0 | 0.0% |
| 35 to 44 Years | 0 | 0.0% |
| 45 to 54 Years | 14 | 19.4% |
| 55 to 64 Years | 0 | 0.0% |
| 65 to 74 Years | 52 | 72.2% |
| 75 to 84 Years | 6 | 8.3% |
| 85 Years and Over | 0 | 0.0% |
| Total | 72 | 100.0% |
Housing Finances in Whispering Pines
Median Income by Occupancy in Whispering Pines
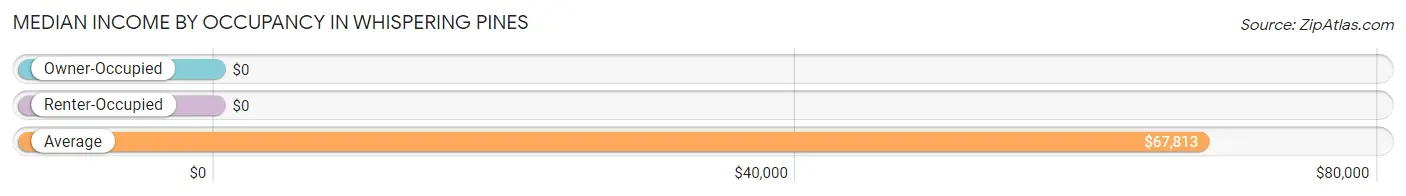
| Occupancy Type | # Households | Median Income |
| Owner-Occupied | 38 (52.8%) | $0 |
| Renter-Occupied | 34 (47.2%) | $0 |
| Average | 72 (100.0%) | $67,813 |
Occupancy by Householder Income Bracket in Whispering Pines
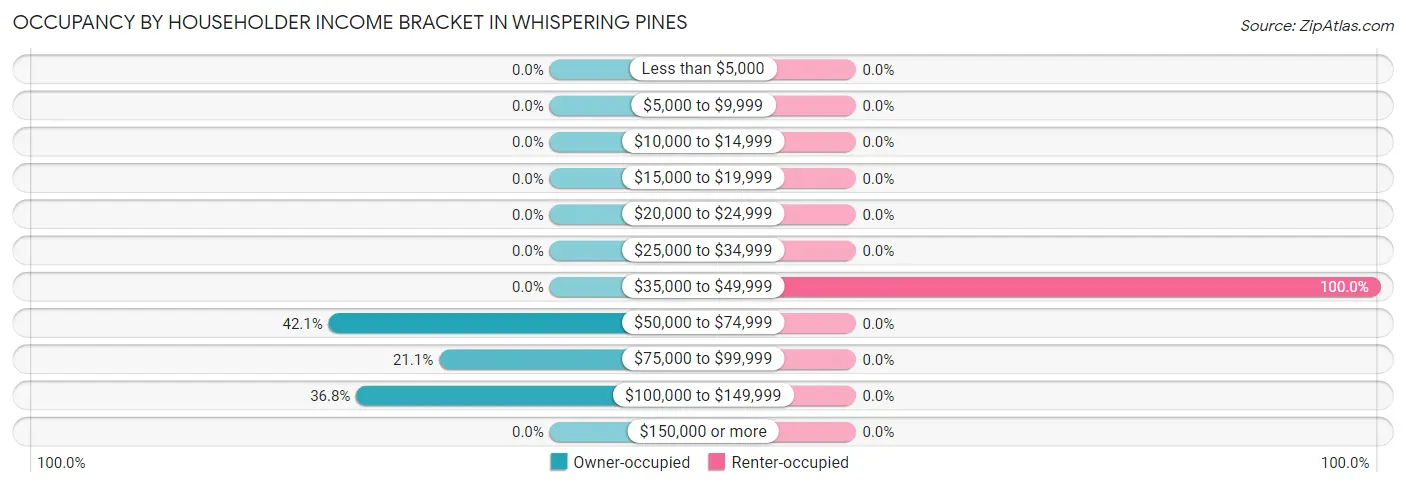
| Income Bracket | Owner-occupied | Renter-occupied |
| Less than $5,000 | 0 (0.0%) | 0 (0.0%) |
| $5,000 to $9,999 | 0 (0.0%) | 0 (0.0%) |
| $10,000 to $14,999 | 0 (0.0%) | 0 (0.0%) |
| $15,000 to $19,999 | 0 (0.0%) | 0 (0.0%) |
| $20,000 to $24,999 | 0 (0.0%) | 0 (0.0%) |
| $25,000 to $34,999 | 0 (0.0%) | 0 (0.0%) |
| $35,000 to $49,999 | 0 (0.0%) | 34 (100.0%) |
| $50,000 to $74,999 | 16 (42.1%) | 0 (0.0%) |
| $75,000 to $99,999 | 8 (21.0%) | 0 (0.0%) |
| $100,000 to $149,999 | 14 (36.8%) | 0 (0.0%) |
| $150,000 or more | 0 (0.0%) | 0 (0.0%) |
| Total | 38 (100.0%) | 34 (100.0%) |
Monthly Housing Cost Tiers in Whispering Pines
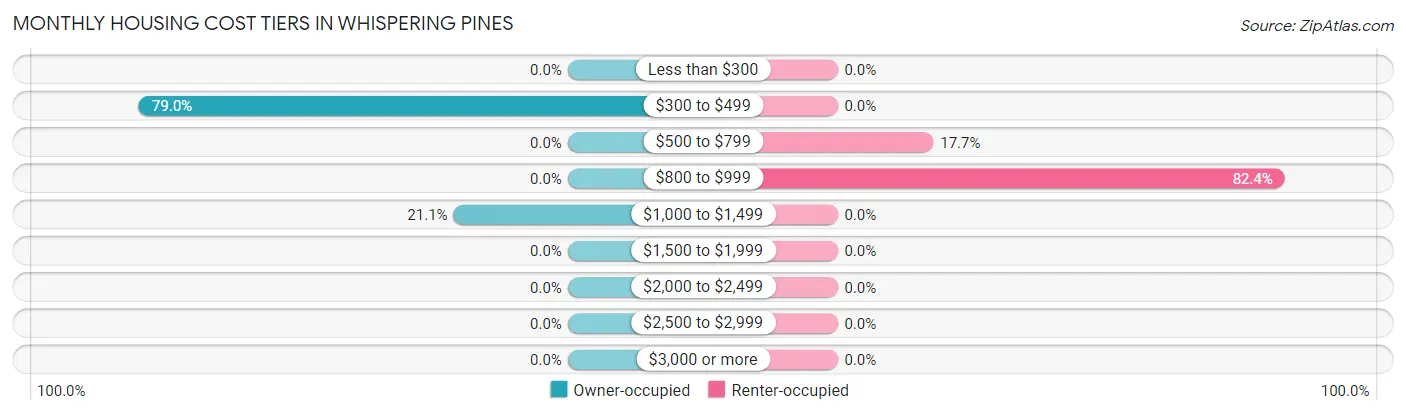
| Monthly Cost | Owner-occupied | Renter-occupied |
| Less than $300 | 0 (0.0%) | 0 (0.0%) |
| $300 to $499 | 30 (78.9%) | 0 (0.0%) |
| $500 to $799 | 0 (0.0%) | 6 (17.6%) |
| $800 to $999 | 0 (0.0%) | 28 (82.4%) |
| $1,000 to $1,499 | 8 (21.0%) | 0 (0.0%) |
| $1,500 to $1,999 | 0 (0.0%) | 0 (0.0%) |
| $2,000 to $2,499 | 0 (0.0%) | 0 (0.0%) |
| $2,500 to $2,999 | 0 (0.0%) | 0 (0.0%) |
| $3,000 or more | 0 (0.0%) | 0 (0.0%) |
| Total | 38 (100.0%) | 34 (100.0%) |
Physical Housing Characteristics in Whispering Pines
Housing Structures in Whispering Pines
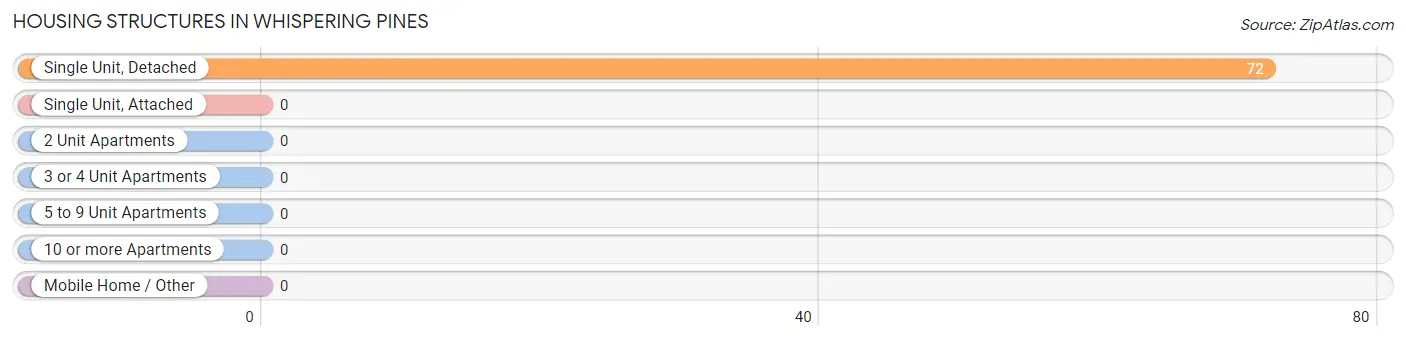
| Structure Type | # Housing Units | % Housing Units |
| Single Unit, Detached | 72 | 100.0% |
| Single Unit, Attached | 0 | 0.0% |
| 2 Unit Apartments | 0 | 0.0% |
| 3 or 4 Unit Apartments | 0 | 0.0% |
| 5 to 9 Unit Apartments | 0 | 0.0% |
| 10 or more Apartments | 0 | 0.0% |
| Mobile Home / Other | 0 | 0.0% |
| Total | 72 | 100.0% |
Housing Structures by Occupancy in Whispering Pines
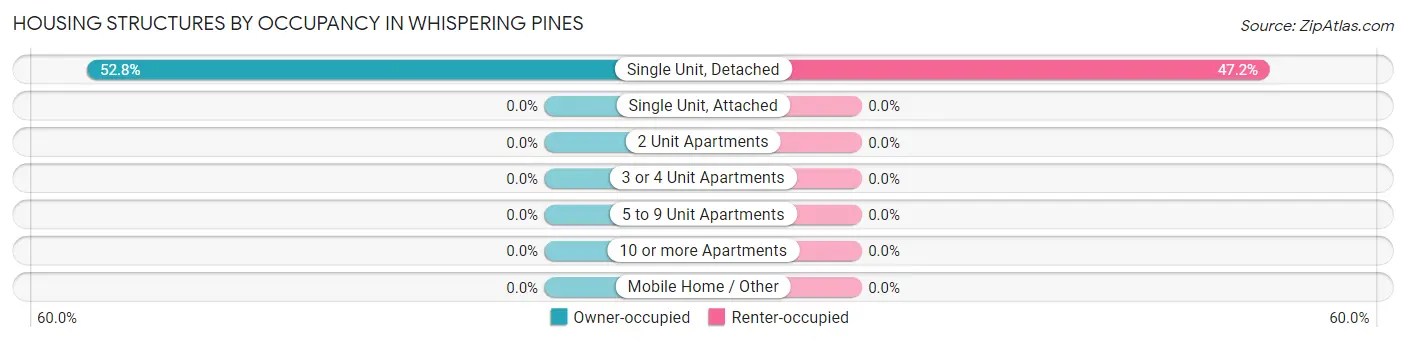
| Structure Type | Owner-occupied | Renter-occupied |
| Single Unit, Detached | 38 (52.8%) | 34 (47.2%) |
| Single Unit, Attached | 0 (0.0%) | 0 (0.0%) |
| 2 Unit Apartments | 0 (0.0%) | 0 (0.0%) |
| 3 or 4 Unit Apartments | 0 (0.0%) | 0 (0.0%) |
| 5 to 9 Unit Apartments | 0 (0.0%) | 0 (0.0%) |
| 10 or more Apartments | 0 (0.0%) | 0 (0.0%) |
| Mobile Home / Other | 0 (0.0%) | 0 (0.0%) |
| Total | 38 (52.8%) | 34 (47.2%) |
Housing Structures by Number of Rooms in Whispering Pines
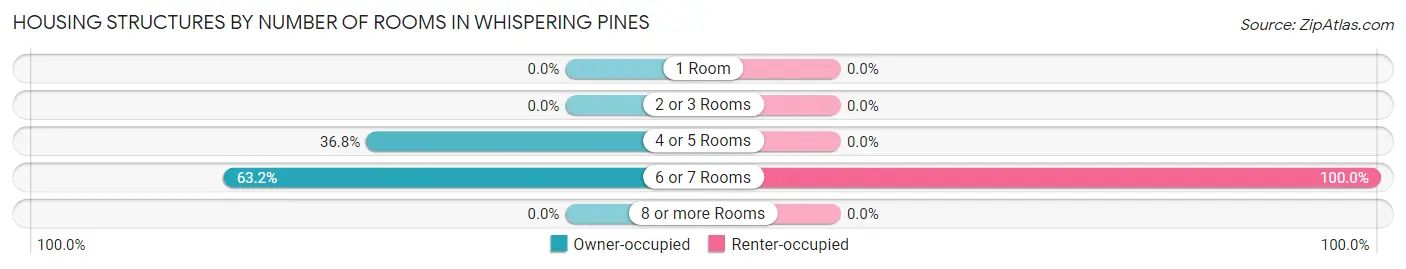
| Number of Rooms | Owner-occupied | Renter-occupied |
| 1 Room | 0 (0.0%) | 0 (0.0%) |
| 2 or 3 Rooms | 0 (0.0%) | 0 (0.0%) |
| 4 or 5 Rooms | 14 (36.8%) | 0 (0.0%) |
| 6 or 7 Rooms | 24 (63.2%) | 34 (100.0%) |
| 8 or more Rooms | 0 (0.0%) | 0 (0.0%) |
| Total | 38 (100.0%) | 34 (100.0%) |
Housing Structure by Heating Type in Whispering Pines
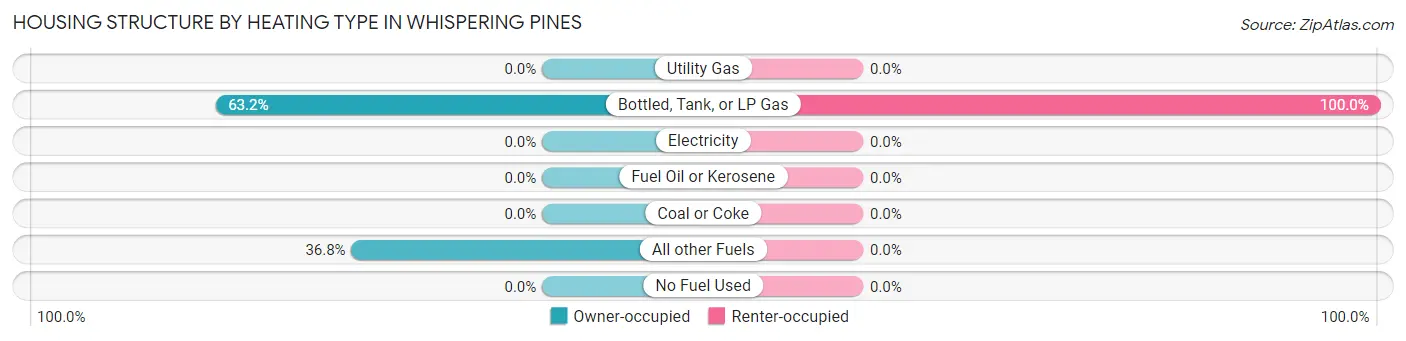
| Heating Type | Owner-occupied | Renter-occupied |
| Utility Gas | 0 (0.0%) | 0 (0.0%) |
| Bottled, Tank, or LP Gas | 24 (63.2%) | 34 (100.0%) |
| Electricity | 0 (0.0%) | 0 (0.0%) |
| Fuel Oil or Kerosene | 0 (0.0%) | 0 (0.0%) |
| Coal or Coke | 0 (0.0%) | 0 (0.0%) |
| All other Fuels | 14 (36.8%) | 0 (0.0%) |
| No Fuel Used | 0 (0.0%) | 0 (0.0%) |
| Total | 38 (100.0%) | 34 (100.0%) |
Household Vehicle Usage in Whispering Pines
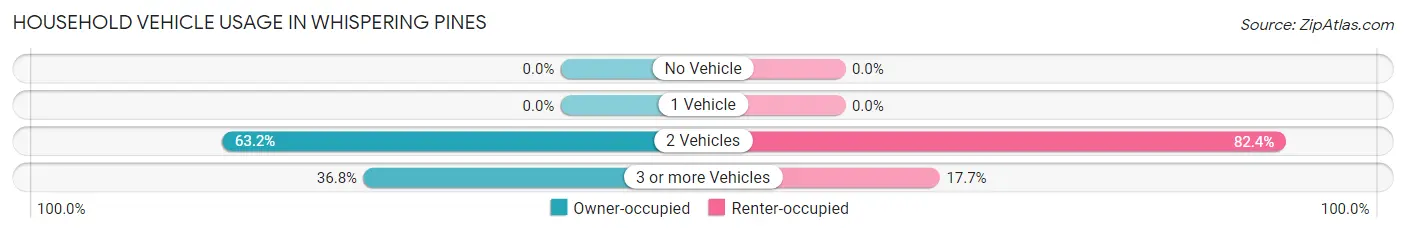
| Vehicles per Household | Owner-occupied | Renter-occupied |
| No Vehicle | 0 (0.0%) | 0 (0.0%) |
| 1 Vehicle | 0 (0.0%) | 0 (0.0%) |
| 2 Vehicles | 24 (63.2%) | 28 (82.4%) |
| 3 or more Vehicles | 14 (36.8%) | 6 (17.6%) |
| Total | 38 (100.0%) | 34 (100.0%) |
Real Estate & Mortgages in Whispering Pines
Real Estate and Mortgage Overview in Whispering Pines
| Characteristic | Without Mortgage | With Mortgage |
| Housing Units | 30 | 8 |
| Median Property Value | - | - |
| Median Household Income | - | - |
| Monthly Housing Costs | - | - |
| Real Estate Taxes | - | - |
Property Value by Mortgage Status in Whispering Pines
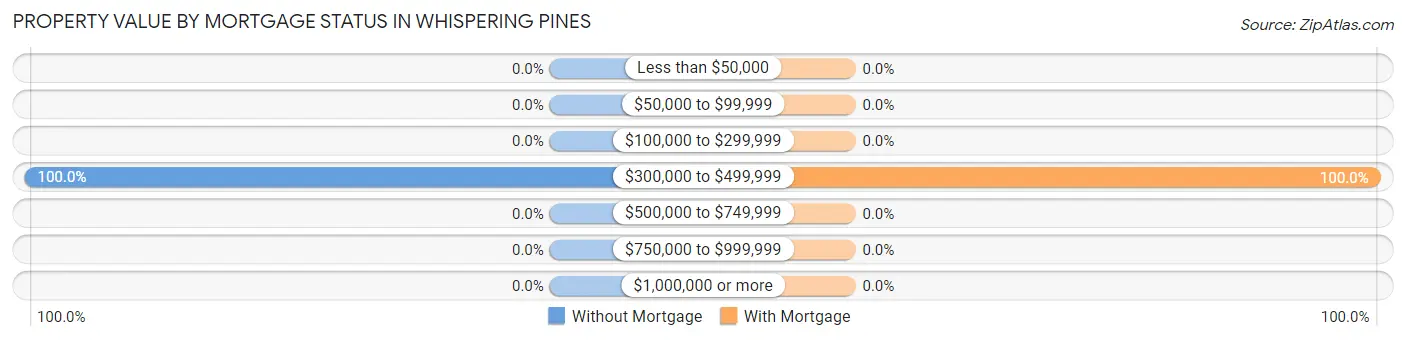
| Property Value | Without Mortgage | With Mortgage |
| Less than $50,000 | 0 (0.0%) | 0 (0.0%) |
| $50,000 to $99,999 | 0 (0.0%) | 0 (0.0%) |
| $100,000 to $299,999 | 0 (0.0%) | 0 (0.0%) |
| $300,000 to $499,999 | 30 (100.0%) | 8 (100.0%) |
| $500,000 to $749,999 | 0 (0.0%) | 0 (0.0%) |
| $750,000 to $999,999 | 0 (0.0%) | 0 (0.0%) |
| $1,000,000 or more | 0 (0.0%) | 0 (0.0%) |
| Total | 30 (100.0%) | 8 (100.0%) |
Household Income by Mortgage Status in Whispering Pines
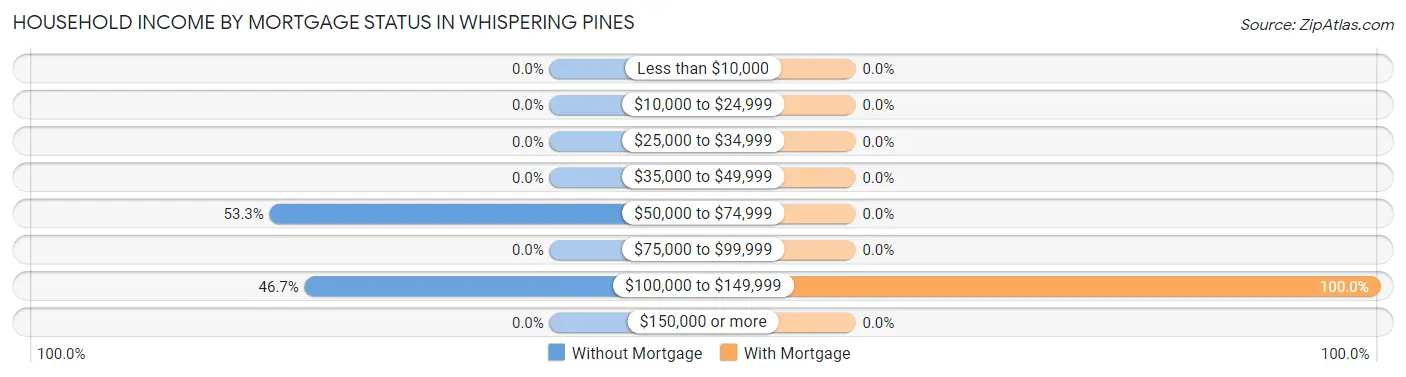
| Household Income | Without Mortgage | With Mortgage |
| Less than $10,000 | 0 (0.0%) | 0 (0.0%) |
| $10,000 to $24,999 | 0 (0.0%) | 0 (0.0%) |
| $25,000 to $34,999 | 0 (0.0%) | 0 (0.0%) |
| $35,000 to $49,999 | 0 (0.0%) | 0 (0.0%) |
| $50,000 to $74,999 | 16 (53.3%) | 0 (0.0%) |
| $75,000 to $99,999 | 0 (0.0%) | 0 (0.0%) |
| $100,000 to $149,999 | 14 (46.7%) | 8 (100.0%) |
| $150,000 or more | 0 (0.0%) | 0 (0.0%) |
| Total | 30 (100.0%) | 8 (100.0%) |
Property Value to Household Income Ratio in Whispering Pines
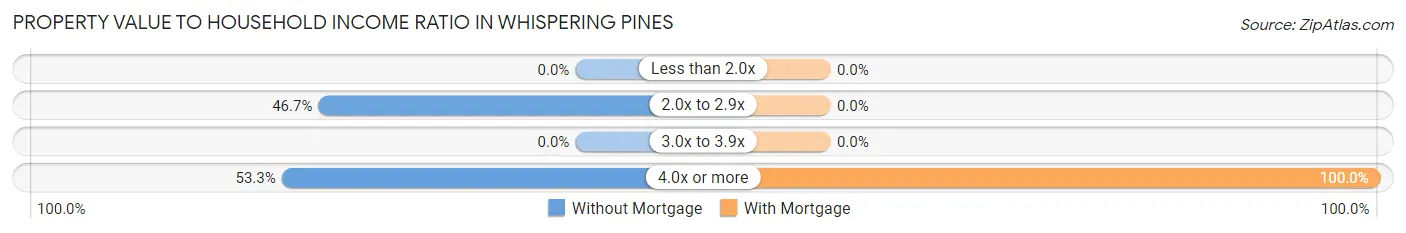
| Value-to-Income Ratio | Without Mortgage | With Mortgage |
| Less than 2.0x | 0 (0.0%) | 0 (0.0%) |
| 2.0x to 2.9x | 14 (46.7%) | 0 (0.0%) |
| 3.0x to 3.9x | 0 (0.0%) | 0 (0.0%) |
| 4.0x or more | 16 (53.3%) | 8 (100.0%) |
| Total | 30 (100.0%) | 8 (100.0%) |
Real Estate Taxes by Mortgage Status in Whispering Pines
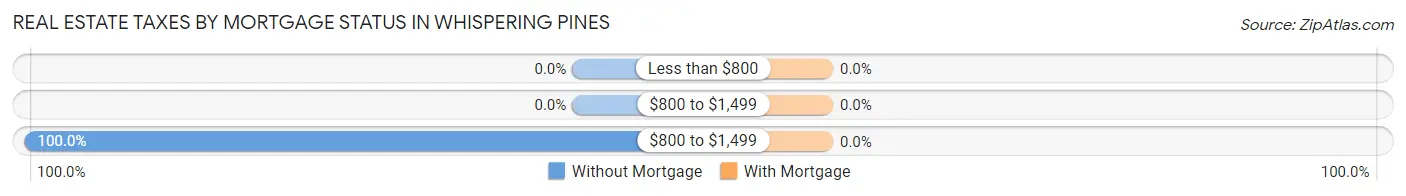
| Property Taxes | Without Mortgage | With Mortgage |
| Less than $800 | 0 (0.0%) | 0 (0.0%) |
| $800 to $1,499 | 0 (0.0%) | 0 (0.0%) |
| $800 to $1,499 | 30 (100.0%) | 0 (0.0%) |
| Total | 30 (100.0%) | 8 (100.0%) |
Health & Disability in Whispering Pines
Health Insurance Coverage by Age in Whispering Pines
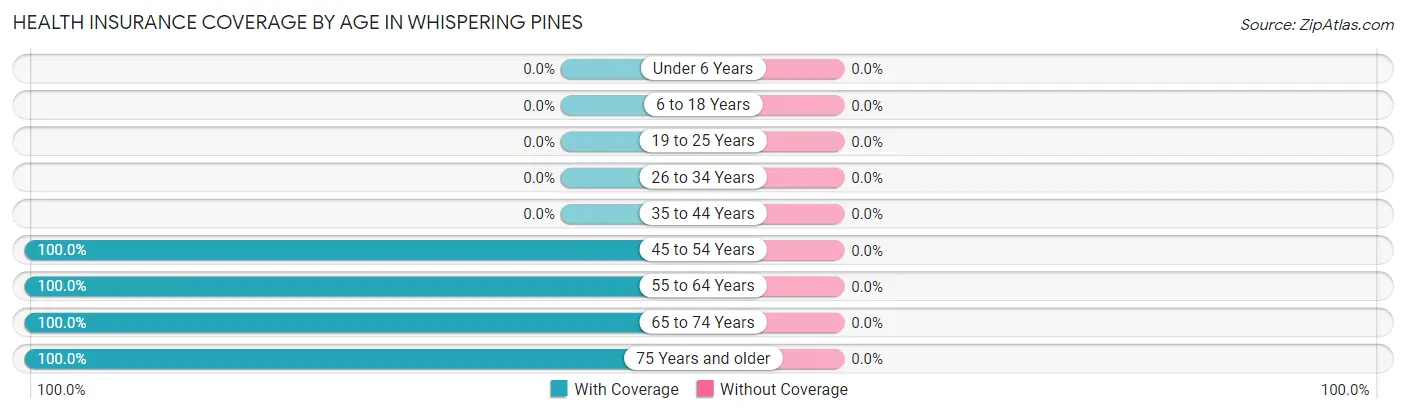
| Age Bracket | With Coverage | Without Coverage |
| Under 6 Years | 0 (0.0%) | 0 (0.0%) |
| 6 to 18 Years | 0 (0.0%) | 0 (0.0%) |
| 19 to 25 Years | 0 (0.0%) | 0 (0.0%) |
| 26 to 34 Years | 0 (0.0%) | 0 (0.0%) |
| 35 to 44 Years | 0 (0.0%) | 0 (0.0%) |
| 45 to 54 Years | 14 (100.0%) | 0 (0.0%) |
| 55 to 64 Years | 20 (100.0%) | 0 (0.0%) |
| 65 to 74 Years | 72 (100.0%) | 0 (0.0%) |
| 75 Years and older | 20 (100.0%) | 0 (0.0%) |
| Total | 126 (100.0%) | 0 (0.0%) |
Health Insurance Coverage by Citizenship Status in Whispering Pines
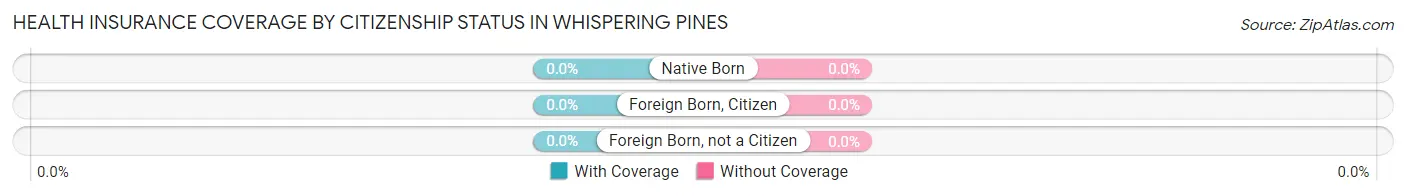
| Citizenship Status | With Coverage | Without Coverage |
| Native Born | 0 (0.0%) | 0 (0.0%) |
| Foreign Born, Citizen | 0 (0.0%) | 0 (0.0%) |
| Foreign Born, not a Citizen | 0 (0.0%) | 0 (0.0%) |
Health Insurance Coverage by Household Income in Whispering Pines
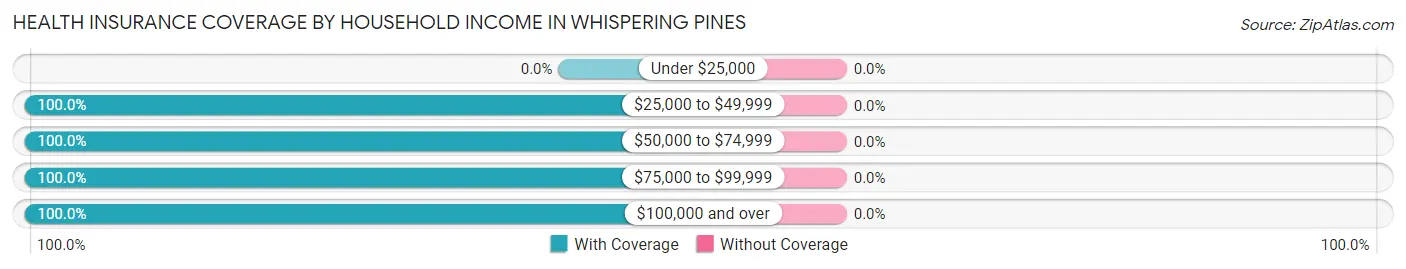
| Household Income | With Coverage | Without Coverage |
| Under $25,000 | 0 (0.0%) | 0 (0.0%) |
| $25,000 to $49,999 | 54 (100.0%) | 0 (0.0%) |
| $50,000 to $74,999 | 30 (100.0%) | 0 (0.0%) |
| $75,000 to $99,999 | 17 (100.0%) | 0 (0.0%) |
| $100,000 and over | 25 (100.0%) | 0 (0.0%) |
Public vs Private Health Insurance Coverage by Age in Whispering Pines
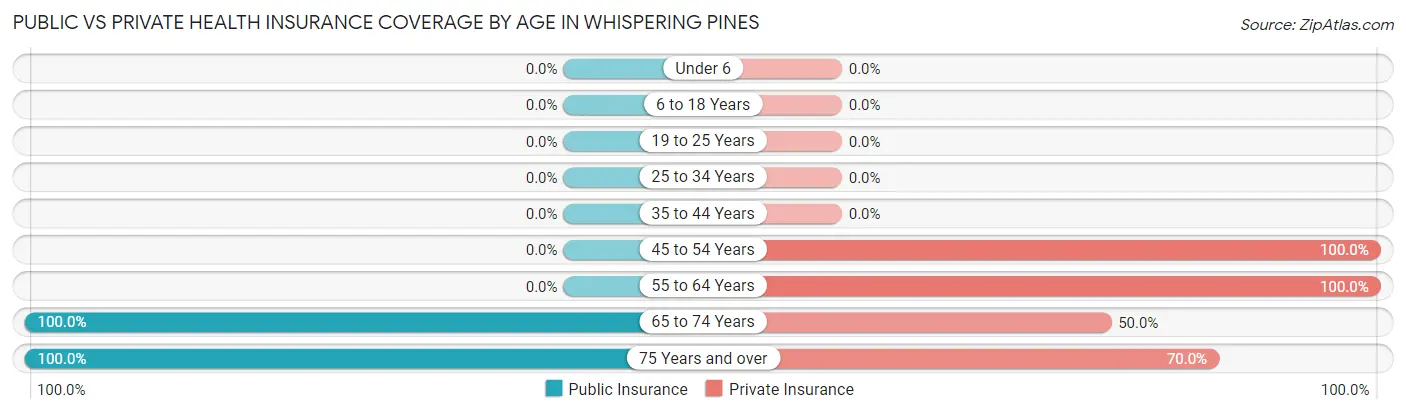
| Age Bracket | Public Insurance | Private Insurance |
| Under 6 | 0 (0.0%) | 0 (0.0%) |
| 6 to 18 Years | 0 (0.0%) | 0 (0.0%) |
| 19 to 25 Years | 0 (0.0%) | 0 (0.0%) |
| 25 to 34 Years | 0 (0.0%) | 0 (0.0%) |
| 35 to 44 Years | 0 (0.0%) | 0 (0.0%) |
| 45 to 54 Years | 0 (0.0%) | 14 (100.0%) |
| 55 to 64 Years | 0 (0.0%) | 20 (100.0%) |
| 65 to 74 Years | 72 (100.0%) | 36 (50.0%) |
| 75 Years and over | 20 (100.0%) | 14 (70.0%) |
| Total | 92 (73.0%) | 84 (66.7%) |
Disability Status by Sex by Age in Whispering Pines
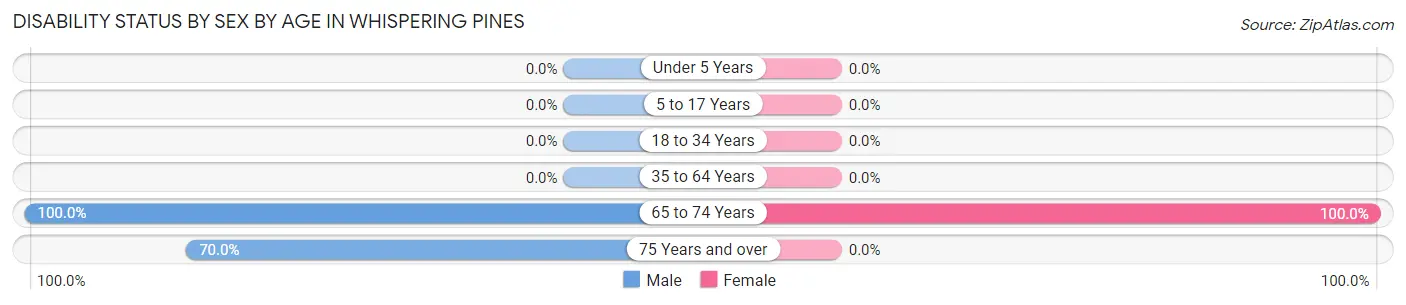
| Age Bracket | Male | Female |
| Under 5 Years | 0 (0.0%) | 0 (0.0%) |
| 5 to 17 Years | 0 (0.0%) | 0 (0.0%) |
| 18 to 34 Years | 0 (0.0%) | 0 (0.0%) |
| 35 to 64 Years | 0 (0.0%) | 0 (0.0%) |
| 65 to 74 Years | 24 (100.0%) | 48 (100.0%) |
| 75 Years and over | 14 (70.0%) | 0 (0.0%) |
Disability Class by Sex by Age in Whispering Pines
Disability Class: Hearing Difficulty
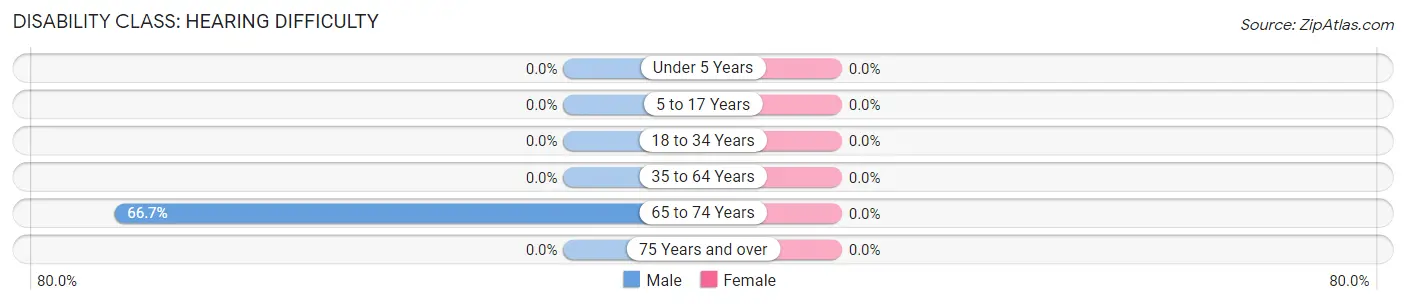
| Age Bracket | Male | Female |
| Under 5 Years | 0 (0.0%) | 0 (0.0%) |
| 5 to 17 Years | 0 (0.0%) | 0 (0.0%) |
| 18 to 34 Years | 0 (0.0%) | 0 (0.0%) |
| 35 to 64 Years | 0 (0.0%) | 0 (0.0%) |
| 65 to 74 Years | 16 (66.7%) | 0 (0.0%) |
| 75 Years and over | 0 (0.0%) | 0 (0.0%) |
Disability Class: Vision Difficulty
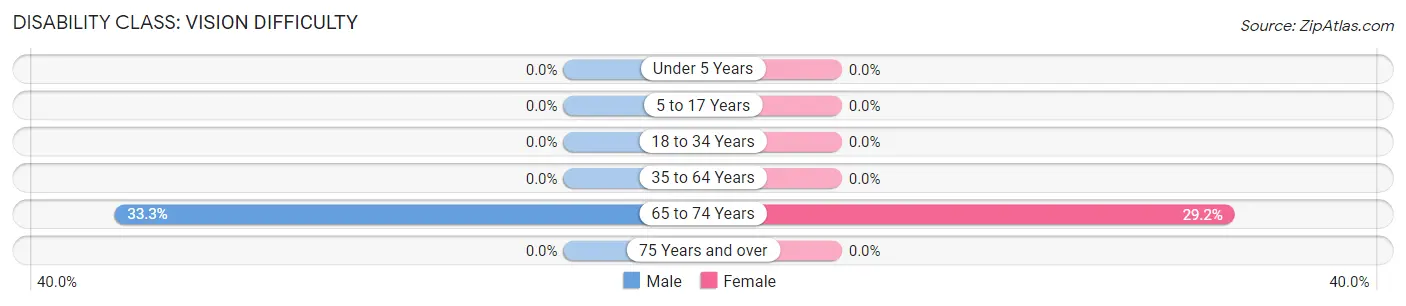
| Age Bracket | Male | Female |
| Under 5 Years | 0 (0.0%) | 0 (0.0%) |
| 5 to 17 Years | 0 (0.0%) | 0 (0.0%) |
| 18 to 34 Years | 0 (0.0%) | 0 (0.0%) |
| 35 to 64 Years | 0 (0.0%) | 0 (0.0%) |
| 65 to 74 Years | 8 (33.3%) | 14 (29.2%) |
| 75 Years and over | 0 (0.0%) | 0 (0.0%) |
Disability Class: Cognitive Difficulty
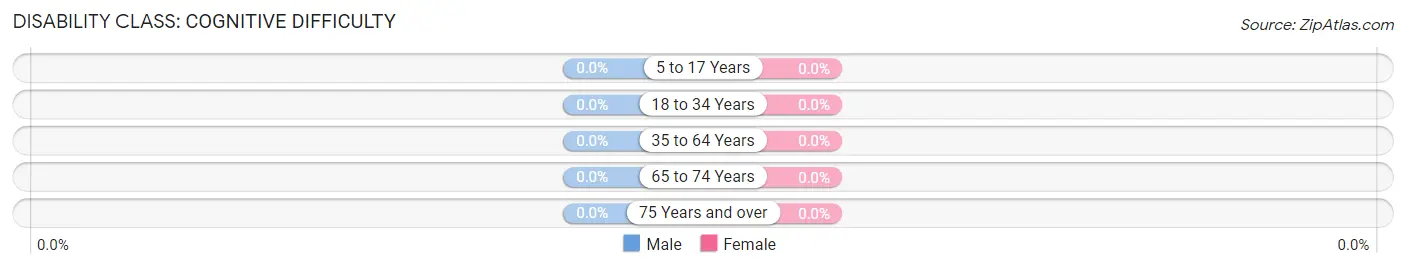
| Age Bracket | Male | Female |
| 5 to 17 Years | 0 (0.0%) | 0 (0.0%) |
| 18 to 34 Years | 0 (0.0%) | 0 (0.0%) |
| 35 to 64 Years | 0 (0.0%) | 0 (0.0%) |
| 65 to 74 Years | 0 (0.0%) | 0 (0.0%) |
| 75 Years and over | 0 (0.0%) | 0 (0.0%) |
Disability Class: Ambulatory Difficulty
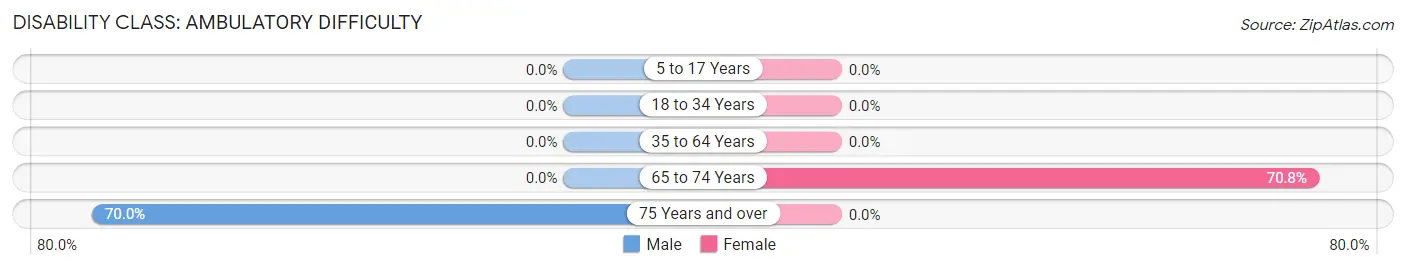
| Age Bracket | Male | Female |
| 5 to 17 Years | 0 (0.0%) | 0 (0.0%) |
| 18 to 34 Years | 0 (0.0%) | 0 (0.0%) |
| 35 to 64 Years | 0 (0.0%) | 0 (0.0%) |
| 65 to 74 Years | 0 (0.0%) | 34 (70.8%) |
| 75 Years and over | 14 (70.0%) | 0 (0.0%) |
Disability Class: Self-Care Difficulty
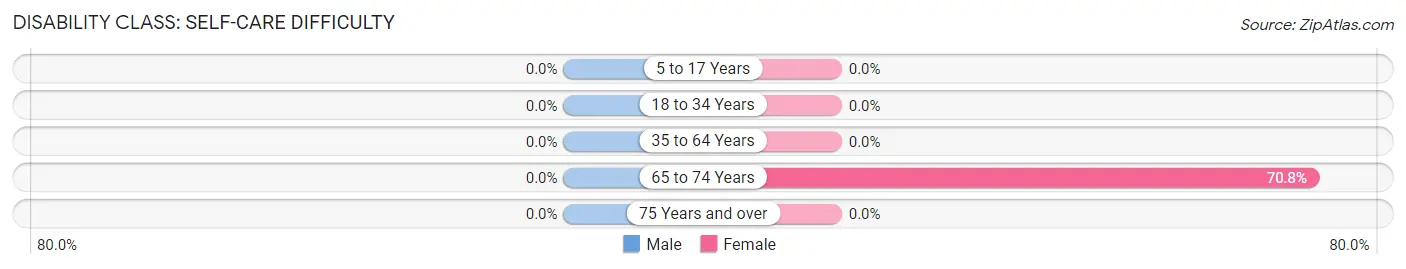
| Age Bracket | Male | Female |
| 5 to 17 Years | 0 (0.0%) | 0 (0.0%) |
| 18 to 34 Years | 0 (0.0%) | 0 (0.0%) |
| 35 to 64 Years | 0 (0.0%) | 0 (0.0%) |
| 65 to 74 Years | 0 (0.0%) | 34 (70.8%) |
| 75 Years and over | 0 (0.0%) | 0 (0.0%) |
Technology Access in Whispering Pines
Computing Device Access in Whispering Pines
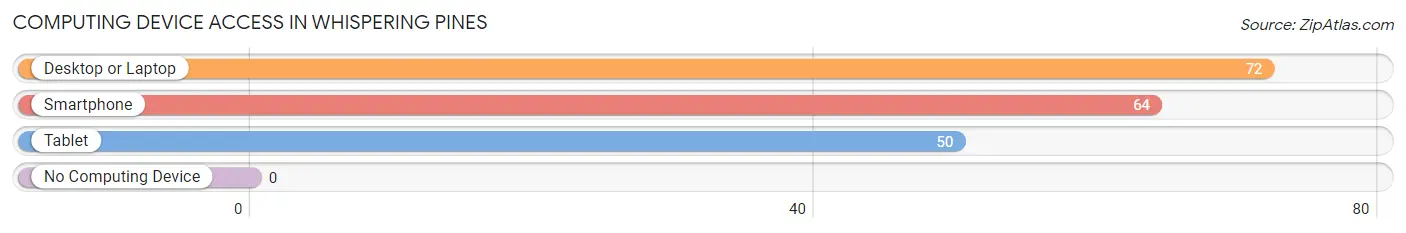
| Device Type | # Households | % Households |
| Desktop or Laptop | 72 | 100.0% |
| Smartphone | 64 | 88.9% |
| Tablet | 50 | 69.4% |
| No Computing Device | 0 | 0.0% |
| Total | 72 | 100.0% |
Internet Access in Whispering Pines
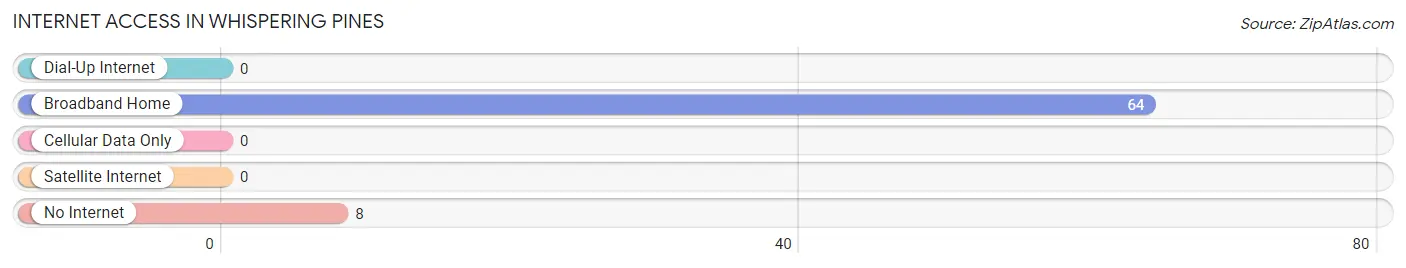
| Internet Type | # Households | % Households |
| Dial-Up Internet | 0 | 0.0% |
| Broadband Home | 64 | 88.9% |
| Cellular Data Only | 0 | 0.0% |
| Satellite Internet | 0 | 0.0% |
| No Internet | 8 | 11.1% |
| Total | 72 | 100.0% |
Whispering Pines Summary
Whispering Pines, Arizona is a small town located in the White Mountains of Arizona. It is situated in Navajo County, approximately 30 miles east of Show Low. The town was founded in the late 1800s and has a population of just over 1,000 people.
History
Whispering Pines was founded in the late 1800s by a group of settlers who were looking for a place to settle and start a new life. The town was originally called “Pine Valley” but was later changed to Whispering Pines due to the sound of the wind blowing through the pine trees. The town was incorporated in 1912 and has remained a small, rural community ever since.
The town was originally a logging and ranching community, but in the 1950s, the economy shifted to tourism. The town is now a popular destination for outdoor recreation, such as camping, fishing, and hiking.
Geography
Whispering Pines is located in the White Mountains of Arizona, approximately 30 miles east of Show Low. The town is situated at an elevation of 6,000 feet and is surrounded by the Apache-Sitgreaves National Forest. The town is located in a valley surrounded by mountains, and the climate is mild and dry.
The town is located near several lakes, including Fool Hollow Lake, Woods Canyon Lake, and Black Canyon Lake. The area is also home to several ski resorts, including Sunrise Park Resort and Arizona Snowbowl.
Economy
The economy of Whispering Pines is largely based on tourism. The town is a popular destination for outdoor recreation, such as camping, fishing, and hiking. The town is also home to several ski resorts, which attract visitors from all over the country.
In addition to tourism, the town is also home to several small businesses, including restaurants, shops, and lodging. The town is also home to a small manufacturing plant, which produces wood products.
Demographics
As of the 2010 census, the population of Whispering Pines was 1,072. The town is predominantly white, with a small Hispanic population. The median household income is $37,500, and the median age is 44.
Whispering Pines is a small, rural community with a strong sense of community. The town is home to several churches, a library, and a community center. The town is also home to several schools, including a high school, a middle school, and an elementary school.
Whispering Pines is a small town with a rich history and a strong sense of community. The town is a popular destination for outdoor recreation, and the economy is largely based on tourism. The town is home to several small businesses, and the population is predominantly white. The town is a great place to live and visit, and it is sure to remain a popular destination for years to come.
Common Questions
What is Per Capita Income in Whispering Pines?
Per Capita income in Whispering Pines is $37,332.
What is the Median Family Income in Whispering Pines?
Median Family Income in Whispering Pines is $67,813.
What is the Median Household income in Whispering Pines?
Median Household Income in Whispering Pines is $67,813.
What is Inequality or Gini Index in Whispering Pines?
Inequality or Gini Index in Whispering Pines is 0.31.
What is the Total Population of Whispering Pines?
Total Population of Whispering Pines is 126.
What is the Total Male Population of Whispering Pines?
Total Male Population of Whispering Pines is 58.
What is the Total Female Population of Whispering Pines?
Total Female Population of Whispering Pines is 68.
What is the Ratio of Males per 100 Females in Whispering Pines?
There are 85.29 Males per 100 Females in Whispering Pines.
What is the Ratio of Females per 100 Males in Whispering Pines?
There are 117.24 Females per 100 Males in Whispering Pines.
What is the Median Population Age in Whispering Pines?
Median Population Age in Whispering Pines is 68.8 Years.
What is the Average Family Size in Whispering Pines
Average Family Size in Whispering Pines is 1.8 People.
What is the Average Household Size in Whispering Pines
Average Household Size in Whispering Pines is 1.8 People.
How Large is the Labor Force in Whispering Pines?
There are 23 People in the Labor Forcein in Whispering Pines.
What is the Percentage of People in the Labor Force in Whispering Pines?
18.3% of People are in the Labor Force in Whispering Pines.