Sonoita, AZ Map & Demographics
Sonoita Map
Sonoita Overview
$39,980
PER CAPITA INCOME
$76,250
AVG FAMILY INCOME
$83,295
AVG HOUSEHOLD INCOME
0.33
INEQUALITY / GINI INDEX
741
TOTAL POPULATION
420
MALE POPULATION
321
FEMALE POPULATION
130.84
MALES / 100 FEMALES
76.43
FEMALES / 100 MALES
65.6
MEDIAN AGE
2.6
AVG FAMILY SIZE
2.4
AVG HOUSEHOLD SIZE
204
LABOR FORCE [ PEOPLE ]
30.6%
PERCENT IN LABOR FORCE
16.2%
UNEMPLOYMENT RATE
Sonoita Zip Codes
Income in Sonoita
Income Overview in Sonoita
Per Capita Income in Sonoita is $39,980, while median incomes of families and households are $76,250 and $83,295 respectively.
| Characteristic | Number | Measure |
| Per Capita Income | 741 | $39,980 |
| Median Family Income | 255 | $76,250 |
| Mean Family Income | 255 | $94,867 |
| Median Household Income | 306 | $83,295 |
| Mean Household Income | 306 | $98,010 |
| Income Deficit | 255 | $0 |
| Wage / Income Gap (%) | 741 | 0.00% |
| Wage / Income Gap ($) | 741 | 100.00¢ per $1 |
| Gini / Inequality Index | 741 | 0.33 |
Earnings by Sex in Sonoita
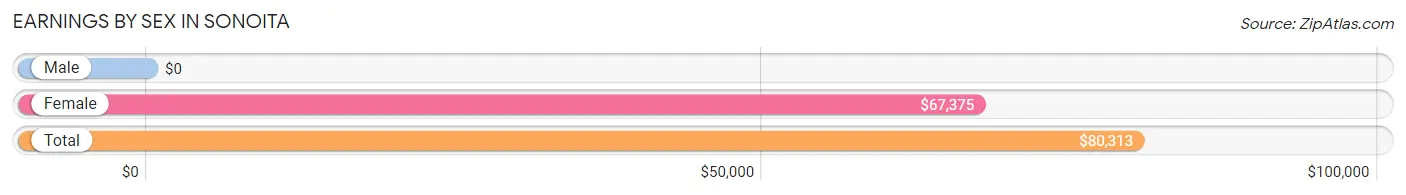
| Sex | Number | Average Earnings |
| Male | 132 (66.7%) | $0 |
| Female | 66 (33.3%) | $67,375 |
| Total | 198 (100.0%) | $80,313 |
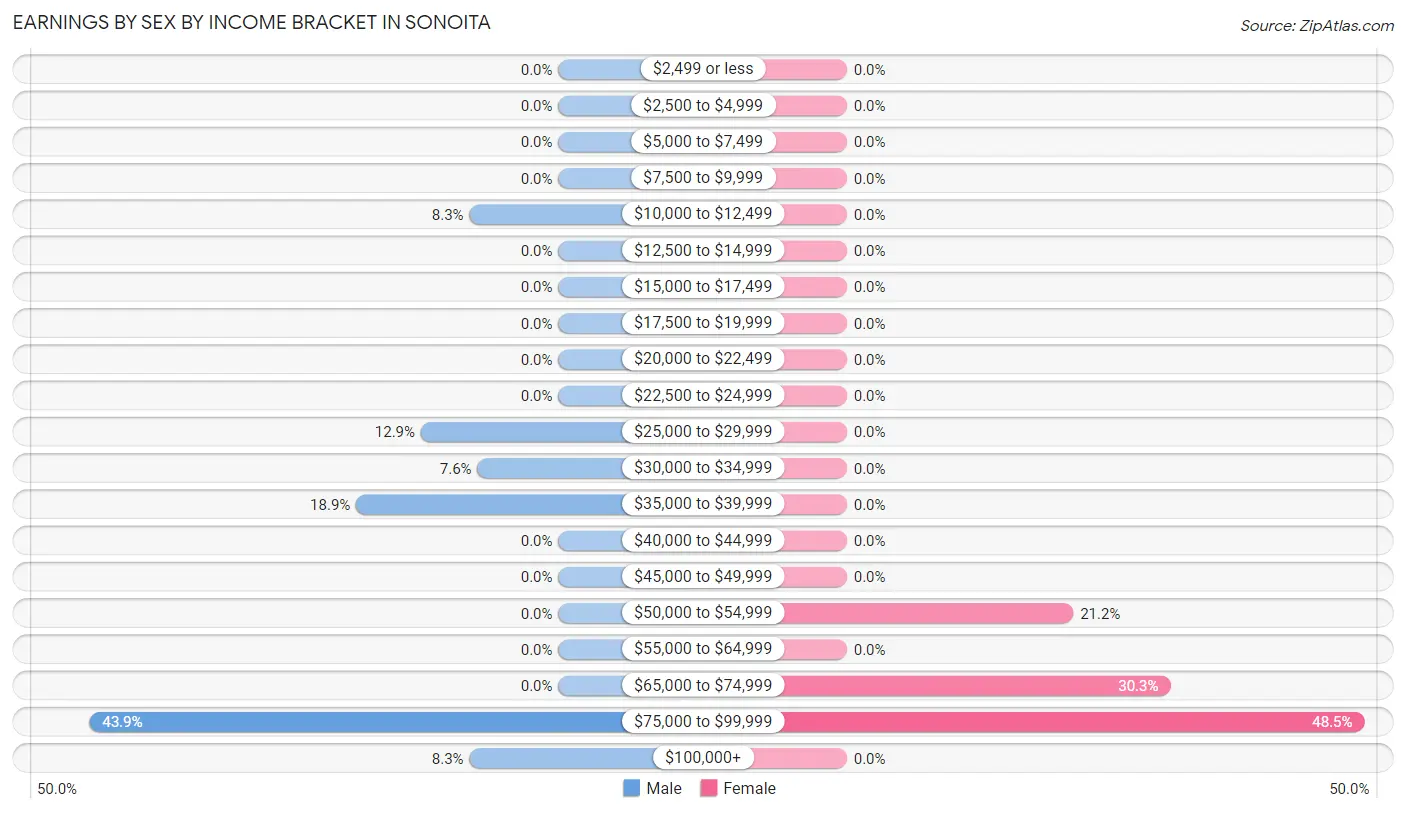
Earnings by Sex by Income Bracket in Sonoita
The most common earnings brackets in Sonoita are $75,000 to $99,999 for men (58 | 43.9%) and $75,000 to $99,999 for women (32 | 48.5%).
| Income | Male | Female |
| $2,499 or less | 0 (0.0%) | 0 (0.0%) |
| $2,500 to $4,999 | 0 (0.0%) | 0 (0.0%) |
| $5,000 to $7,499 | 0 (0.0%) | 0 (0.0%) |
| $7,500 to $9,999 | 0 (0.0%) | 0 (0.0%) |
| $10,000 to $12,499 | 11 (8.3%) | 0 (0.0%) |
| $12,500 to $14,999 | 0 (0.0%) | 0 (0.0%) |
| $15,000 to $17,499 | 0 (0.0%) | 0 (0.0%) |
| $17,500 to $19,999 | 0 (0.0%) | 0 (0.0%) |
| $20,000 to $22,499 | 0 (0.0%) | 0 (0.0%) |
| $22,500 to $24,999 | 0 (0.0%) | 0 (0.0%) |
| $25,000 to $29,999 | 17 (12.9%) | 0 (0.0%) |
| $30,000 to $34,999 | 10 (7.6%) | 0 (0.0%) |
| $35,000 to $39,999 | 25 (18.9%) | 0 (0.0%) |
| $40,000 to $44,999 | 0 (0.0%) | 0 (0.0%) |
| $45,000 to $49,999 | 0 (0.0%) | 0 (0.0%) |
| $50,000 to $54,999 | 0 (0.0%) | 14 (21.2%) |
| $55,000 to $64,999 | 0 (0.0%) | 0 (0.0%) |
| $65,000 to $74,999 | 0 (0.0%) | 20 (30.3%) |
| $75,000 to $99,999 | 58 (43.9%) | 32 (48.5%) |
| $100,000+ | 11 (8.3%) | 0 (0.0%) |
| Total | 132 (100.0%) | 66 (100.0%) |
Earnings by Sex by Educational Attainment in Sonoita
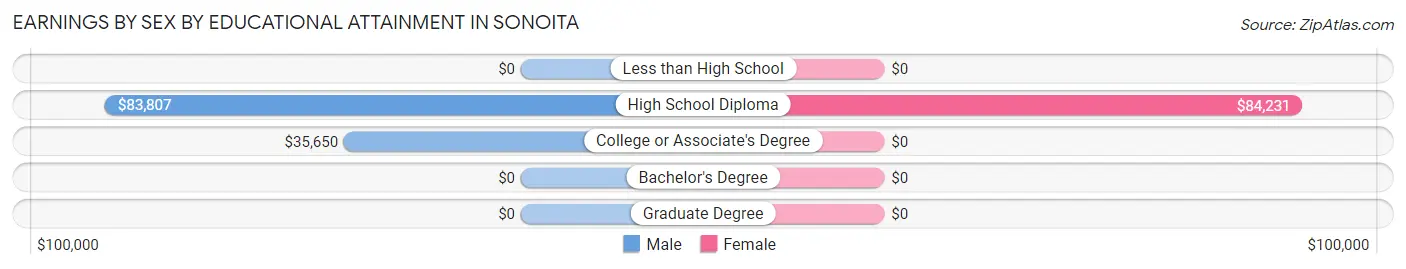
| Educational Attainment | Male Income | Female Income |
| Less than High School | - | - |
| High School Diploma | $83,807 | $84,231 |
| College or Associate's Degree | $35,650 | $0 |
| Bachelor's Degree | - | - |
| Graduate Degree | - | - |
| Total | - | - |
Family Income in Sonoita
Family Income Brackets in Sonoita
According to the Sonoita family income data, there are 69 families falling into the $50,000 to $74,999 income range, which is the most common income bracket and makes up 27.1% of all families.
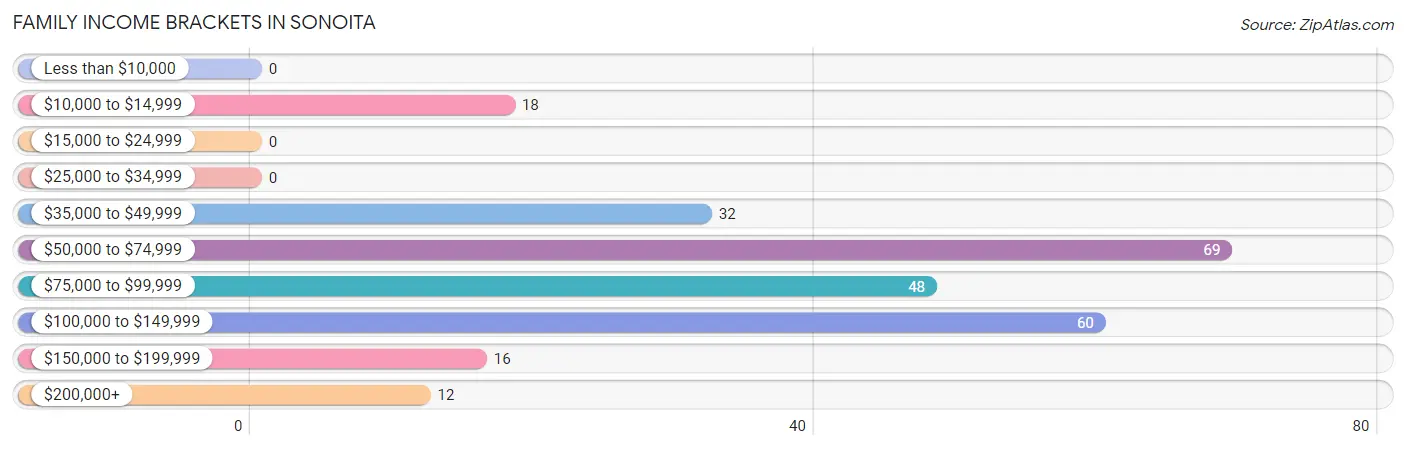
| Income Bracket | # Families | % Families |
| Less than $10,000 | 0 | 0.0% |
| $10,000 to $14,999 | 18 | 7.1% |
| $15,000 to $24,999 | 0 | 0.0% |
| $25,000 to $34,999 | 0 | 0.0% |
| $35,000 to $49,999 | 32 | 12.5% |
| $50,000 to $74,999 | 69 | 27.1% |
| $75,000 to $99,999 | 48 | 18.8% |
| $100,000 to $149,999 | 60 | 23.5% |
| $150,000 to $199,999 | 16 | 6.3% |
| $200,000+ | 12 | 4.7% |
Family Income by Famaliy Size in Sonoita
3-person families (34 | 13.3%) account for the highest median family income in Sonoita with $181,719 per family, while 3-person families (34 | 13.3%) have the highest median income of $60,573 per family member.
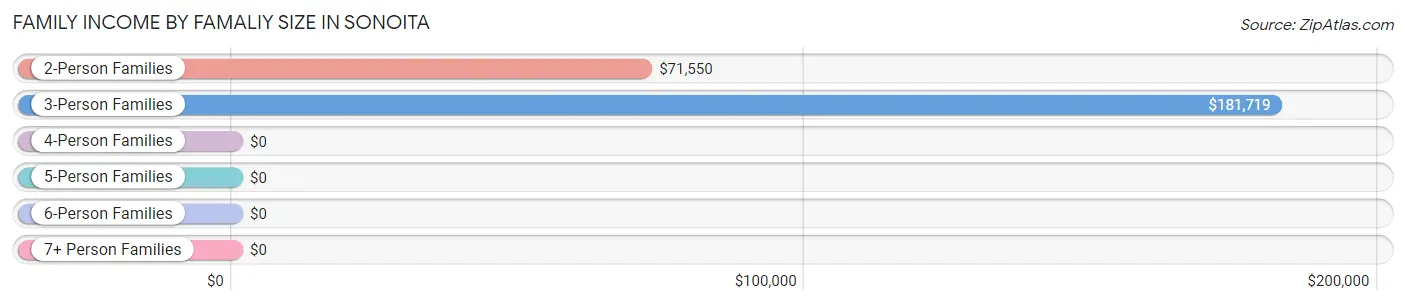
| Income Bracket | # Families | Median Income |
| 2-Person Families | 207 (81.2%) | $71,550 |
| 3-Person Families | 34 (13.3%) | $181,719 |
| 4-Person Families | 0 (0.0%) | $0 |
| 5-Person Families | 0 (0.0%) | $0 |
| 6-Person Families | 0 (0.0%) | $0 |
| 7+ Person Families | 14 (5.5%) | $0 |
| Total | 255 (100.0%) | $76,250 |
Family Income by Number of Earners in Sonoita
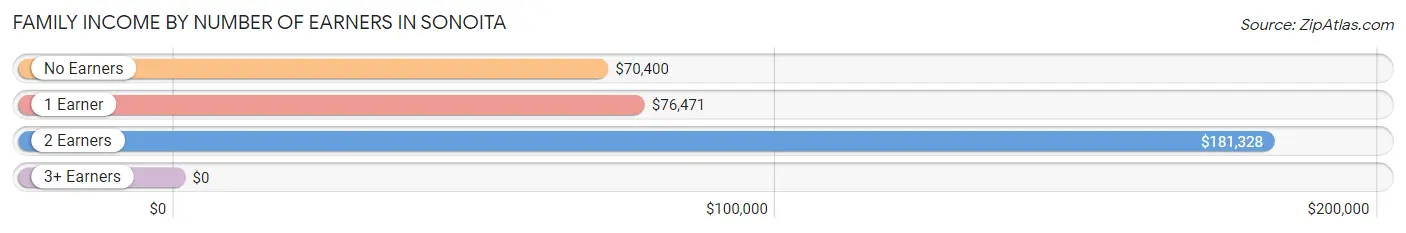
| Number of Earners | # Families | Median Income |
| No Earners | 162 (63.5%) | $70,400 |
| 1 Earner | 54 (21.2%) | $76,471 |
| 2 Earners | 39 (15.3%) | $181,328 |
| 3+ Earners | 0 (0.0%) | $0 |
| Total | 255 (100.0%) | $76,250 |
Household Income in Sonoita
Household Income Brackets in Sonoita
With 70 households falling in the category, the $75,000 to $99,999 income range is the most frequent in Sonoita, accounting for 22.9% of all households.
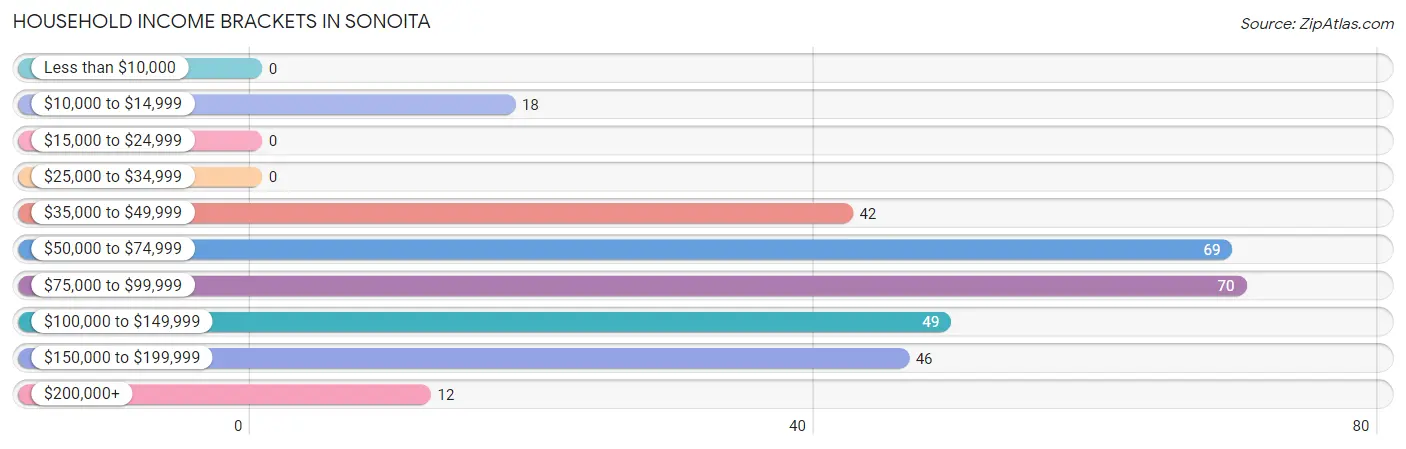
| Income Bracket | # Households | % Households |
| Less than $10,000 | 0 | 0.0% |
| $10,000 to $14,999 | 18 | 5.9% |
| $15,000 to $24,999 | 0 | 0.0% |
| $25,000 to $34,999 | 0 | 0.0% |
| $35,000 to $49,999 | 42 | 13.7% |
| $50,000 to $74,999 | 69 | 22.5% |
| $75,000 to $99,999 | 70 | 22.9% |
| $100,000 to $149,999 | 49 | 16.0% |
| $150,000 to $199,999 | 46 | 15.0% |
| $200,000+ | 12 | 3.9% |
Household Income by Householder Age in Sonoita
The median household income in Sonoita is $83,295, with the highest median household income of $77,132 found in the 65+ years age bracket for the primary householder. A total of 197 households (64.4%) fall into this category.
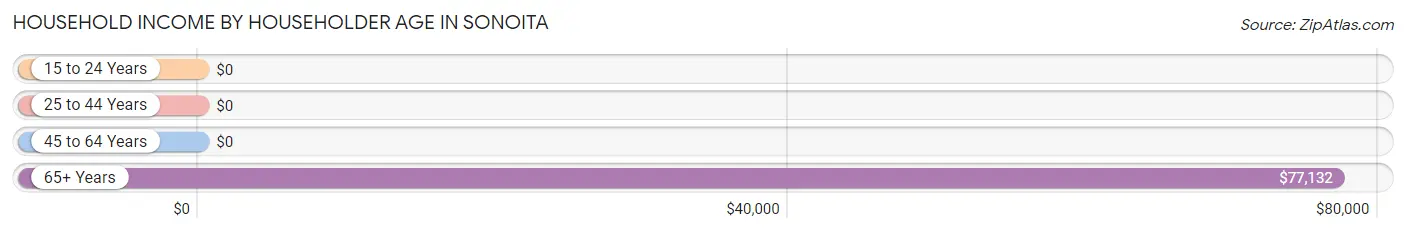
| Income Bracket | # Households | Median Income |
| 15 to 24 Years | 0 (0.0%) | $0 |
| 25 to 44 Years | 25 (8.2%) | $0 |
| 45 to 64 Years | 84 (27.5%) | $0 |
| 65+ Years | 197 (64.4%) | $77,132 |
| Total | 306 (100.0%) | $83,295 |
Poverty in Sonoita
Income Below Poverty by Sex and Age in Sonoita
With 5.7% poverty level for males and 7.8% for females among the residents of Sonoita, 45 to 54 year old males and 12 to 14 year old females are the most vulnerable to poverty, with 12 males (18.8%) and 17 females (53.1%) in their respective age groups living below the poverty level.
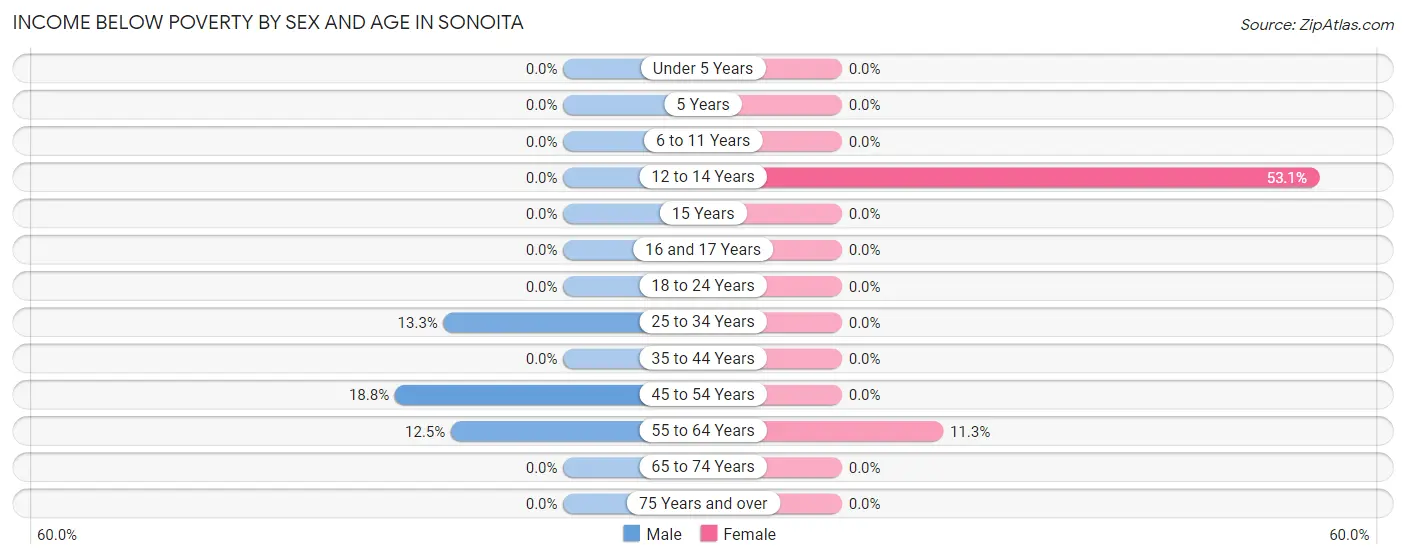
| Age Bracket | Male | Female |
| Under 5 Years | 0 (0.0%) | 0 (0.0%) |
| 5 Years | 0 (0.0%) | 0 (0.0%) |
| 6 to 11 Years | 0 (0.0%) | 0 (0.0%) |
| 12 to 14 Years | 0 (0.0%) | 17 (53.1%) |
| 15 Years | 0 (0.0%) | 0 (0.0%) |
| 16 and 17 Years | 0 (0.0%) | 0 (0.0%) |
| 18 to 24 Years | 0 (0.0%) | 0 (0.0%) |
| 25 to 34 Years | 6 (13.3%) | 0 (0.0%) |
| 35 to 44 Years | 0 (0.0%) | 0 (0.0%) |
| 45 to 54 Years | 12 (18.8%) | 0 (0.0%) |
| 55 to 64 Years | 6 (12.5%) | 8 (11.3%) |
| 65 to 74 Years | 0 (0.0%) | 0 (0.0%) |
| 75 Years and over | 0 (0.0%) | 0 (0.0%) |
| Total | 24 (5.7%) | 25 (7.8%) |
Income Above Poverty by Sex and Age in Sonoita
According to the poverty statistics in Sonoita, males aged under 5 years and females aged under 5 years are the age groups that are most secure financially, with 100.0% of males and 100.0% of females in these age groups living above the poverty line.
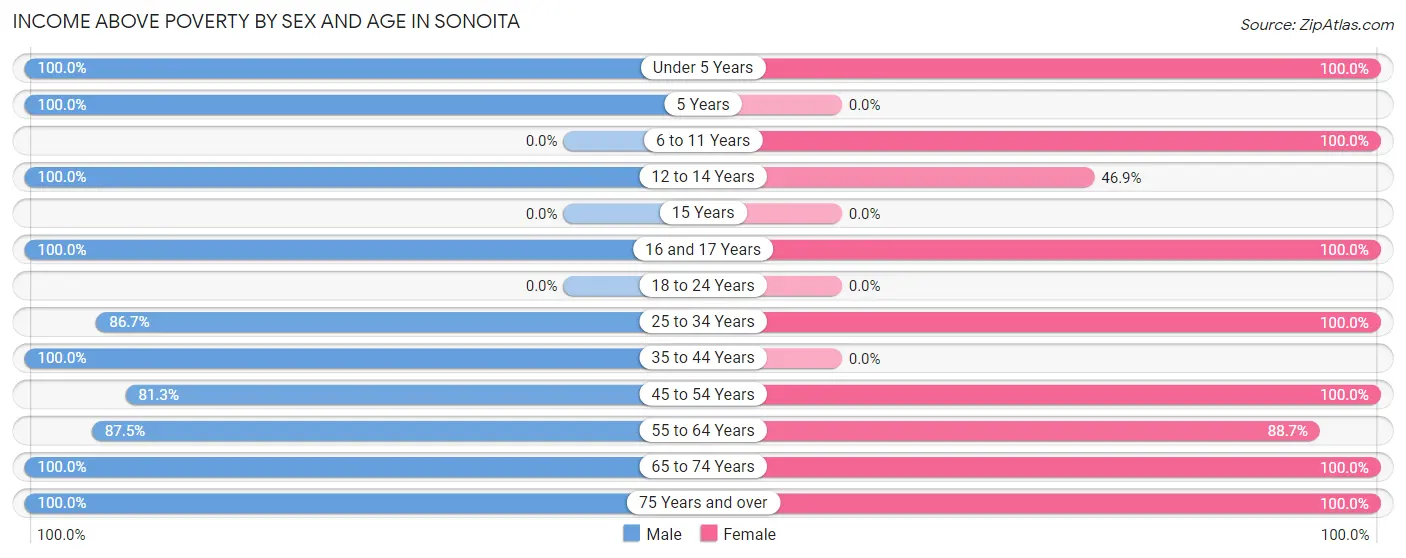
| Age Bracket | Male | Female |
| Under 5 Years | 4 (100.0%) | 4 (100.0%) |
| 5 Years | 16 (100.0%) | 0 (0.0%) |
| 6 to 11 Years | 0 (0.0%) | 3 (100.0%) |
| 12 to 14 Years | 16 (100.0%) | 15 (46.9%) |
| 15 Years | 0 (0.0%) | 0 (0.0%) |
| 16 and 17 Years | 2 (100.0%) | 10 (100.0%) |
| 18 to 24 Years | 0 (0.0%) | 0 (0.0%) |
| 25 to 34 Years | 39 (86.7%) | 3 (100.0%) |
| 35 to 44 Years | 18 (100.0%) | 0 (0.0%) |
| 45 to 54 Years | 52 (81.2%) | 16 (100.0%) |
| 55 to 64 Years | 42 (87.5%) | 63 (88.7%) |
| 65 to 74 Years | 82 (100.0%) | 117 (100.0%) |
| 75 Years and over | 125 (100.0%) | 65 (100.0%) |
| Total | 396 (94.3%) | 296 (92.2%) |
Income Below Poverty Among Married-Couple Families in Sonoita
The poverty statistics for married-couple families in Sonoita show that 2.5% or 6 of the total 243 families live below the poverty line. Families with no children have the highest poverty rate of 2.6%, comprising of 6 families. On the other hand, families with 3 or 4 children have the lowest poverty rate of 0.0%, which includes 0 families.
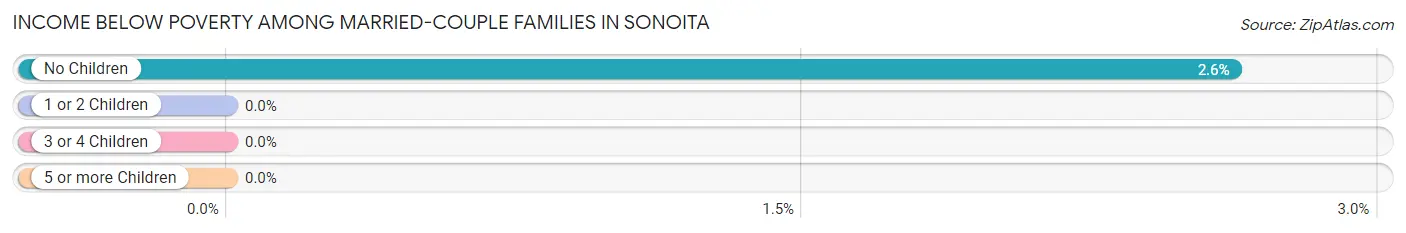
| Children | Above Poverty | Below Poverty |
| No Children | 223 (97.4%) | 6 (2.6%) |
| 1 or 2 Children | 0 (0.0%) | 0 (0.0%) |
| 3 or 4 Children | 11 (100.0%) | 0 (0.0%) |
| 5 or more Children | 3 (100.0%) | 0 (0.0%) |
| Total | 237 (97.5%) | 6 (2.5%) |
Income Below Poverty Among Single-Parent Households in Sonoita
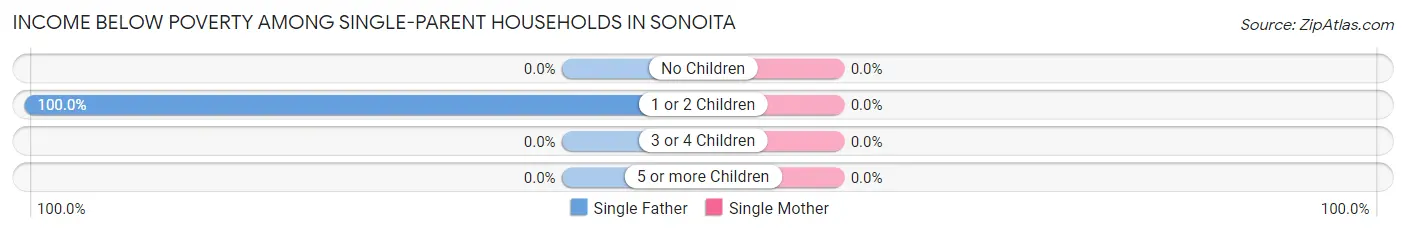
| Children | Single Father | Single Mother |
| No Children | 0 (0.0%) | 0 (0.0%) |
| 1 or 2 Children | 12 (100.0%) | 0 (0.0%) |
| 3 or 4 Children | 0 (0.0%) | 0 (0.0%) |
| 5 or more Children | 0 (0.0%) | 0 (0.0%) |
| Total | 12 (100.0%) | 0 (0.0%) |
Income Below Poverty Among Married-Couple vs Single-Parent Households in Sonoita
The poverty data for Sonoita shows that 6 of the married-couple family households (2.5%) and 12 of the single-parent households (100.0%) are living below the poverty level. Within the married-couple family households, those with no children have the highest poverty rate, with 6 households (2.6%) falling below the poverty line. Among the single-parent households, those with 1 or 2 children have the highest poverty rate, with 12 household (100.0%) living below poverty.
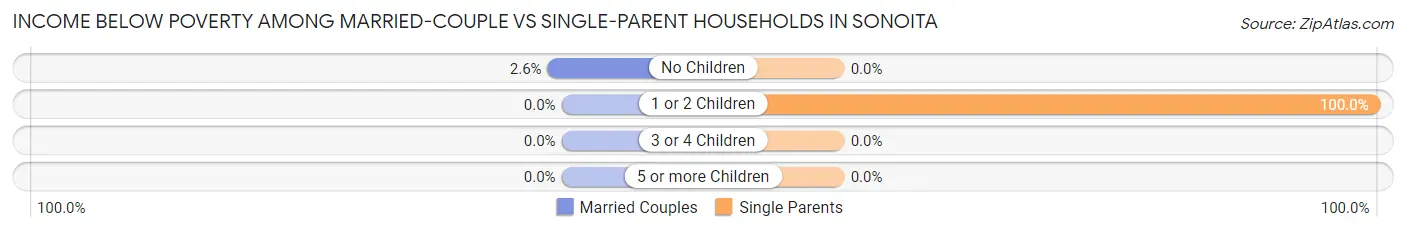
| Children | Married-Couple Families | Single-Parent Households |
| No Children | 6 (2.6%) | 0 (0.0%) |
| 1 or 2 Children | 0 (0.0%) | 12 (100.0%) |
| 3 or 4 Children | 0 (0.0%) | 0 (0.0%) |
| 5 or more Children | 0 (0.0%) | 0 (0.0%) |
| Total | 6 (2.5%) | 12 (100.0%) |
Race in Sonoita
The most populous races in Sonoita are White / Caucasian (699 | 94.3%), Hispanic or Latino (90 | 12.1%), and Two or more Races (34 | 4.6%).
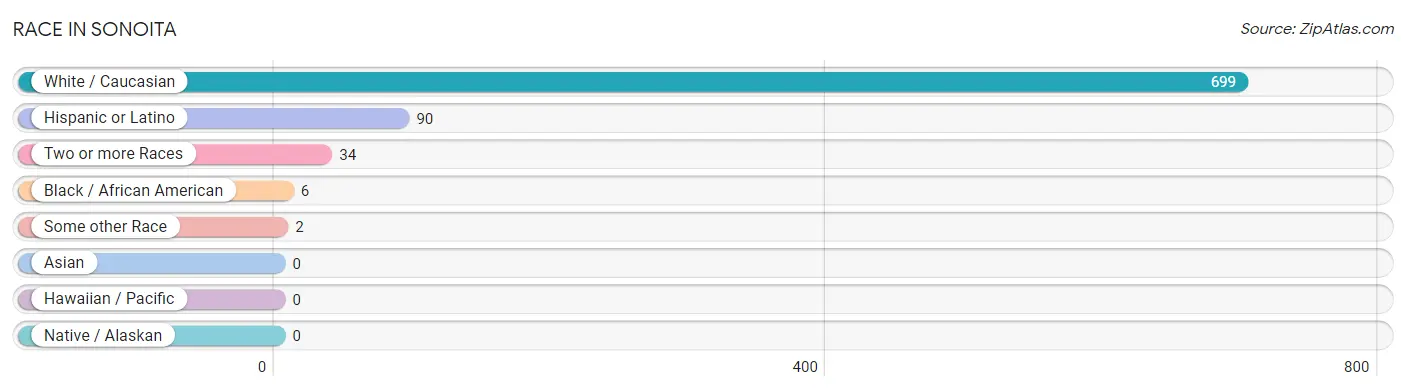
| Race | # Population | % Population |
| Asian | 0 | 0.0% |
| Black / African American | 6 | 0.8% |
| Hawaiian / Pacific | 0 | 0.0% |
| Hispanic or Latino | 90 | 12.1% |
| Native / Alaskan | 0 | 0.0% |
| White / Caucasian | 699 | 94.3% |
| Two or more Races | 34 | 4.6% |
| Some other Race | 2 | 0.3% |
| Total | 741 | 100.0% |
Ancestry in Sonoita
The most populous ancestries reported in Sonoita are Irish (120 | 16.2%), Mexican (90 | 12.1%), English (67 | 9.0%), German (67 | 9.0%), and Polish (44 | 5.9%), together accounting for 52.4% of all Sonoita residents.
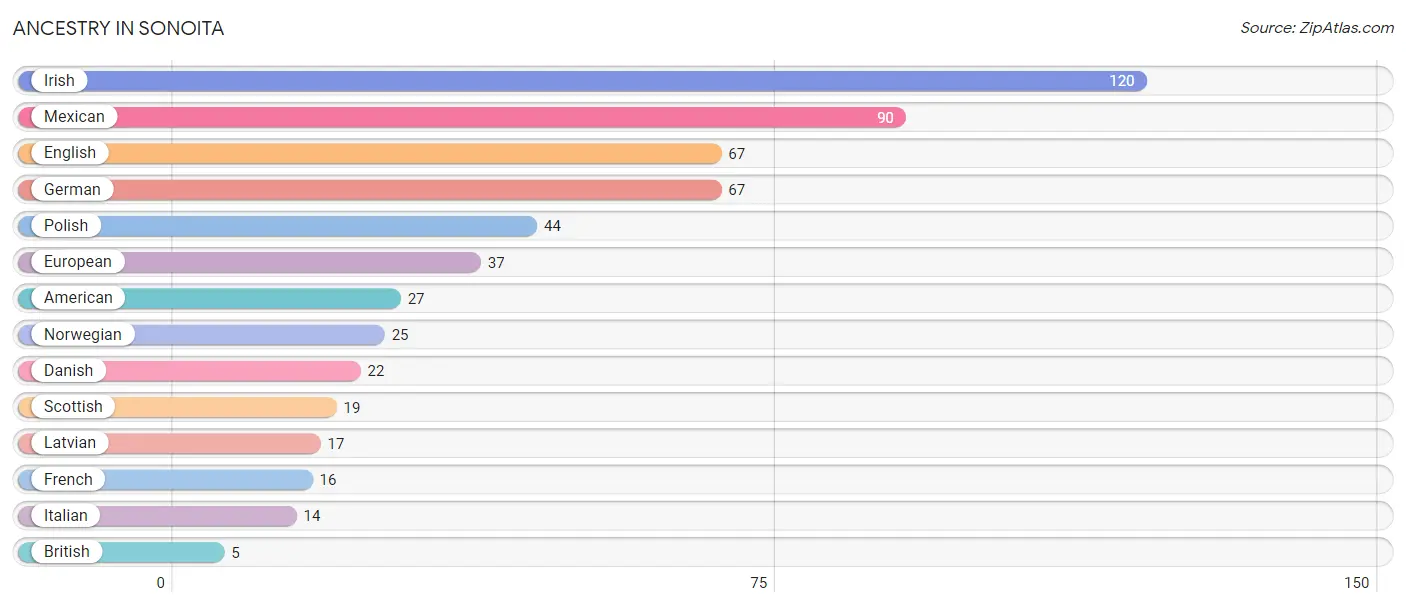
| Ancestry | # Population | % Population |
| American | 27 | 3.6% |
| British | 5 | 0.7% |
| Danish | 22 | 3.0% |
| English | 67 | 9.0% |
| European | 37 | 5.0% |
| French | 16 | 2.2% |
| German | 67 | 9.0% |
| Irish | 120 | 16.2% |
| Italian | 14 | 1.9% |
| Latvian | 17 | 2.3% |
| Mexican | 90 | 12.1% |
| Norwegian | 25 | 3.4% |
| Polish | 44 | 5.9% |
| Scottish | 19 | 2.6% | View All 14 Rows |
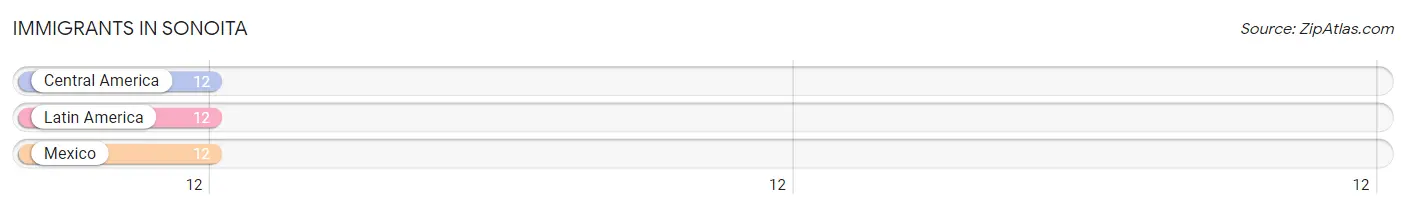
Immigrants in Sonoita
The most numerous immigrant groups reported in Sonoita came from Central America (12 | 1.6%), Latin America (12 | 1.6%), and Mexico (12 | 1.6%), together accounting for 4.9% of all Sonoita residents.
| Immigration Origin | # Population | % Population |
| Central America | 12 | 1.6% |
| Latin America | 12 | 1.6% |
| Mexico | 12 | 1.6% | View All 3 Rows |
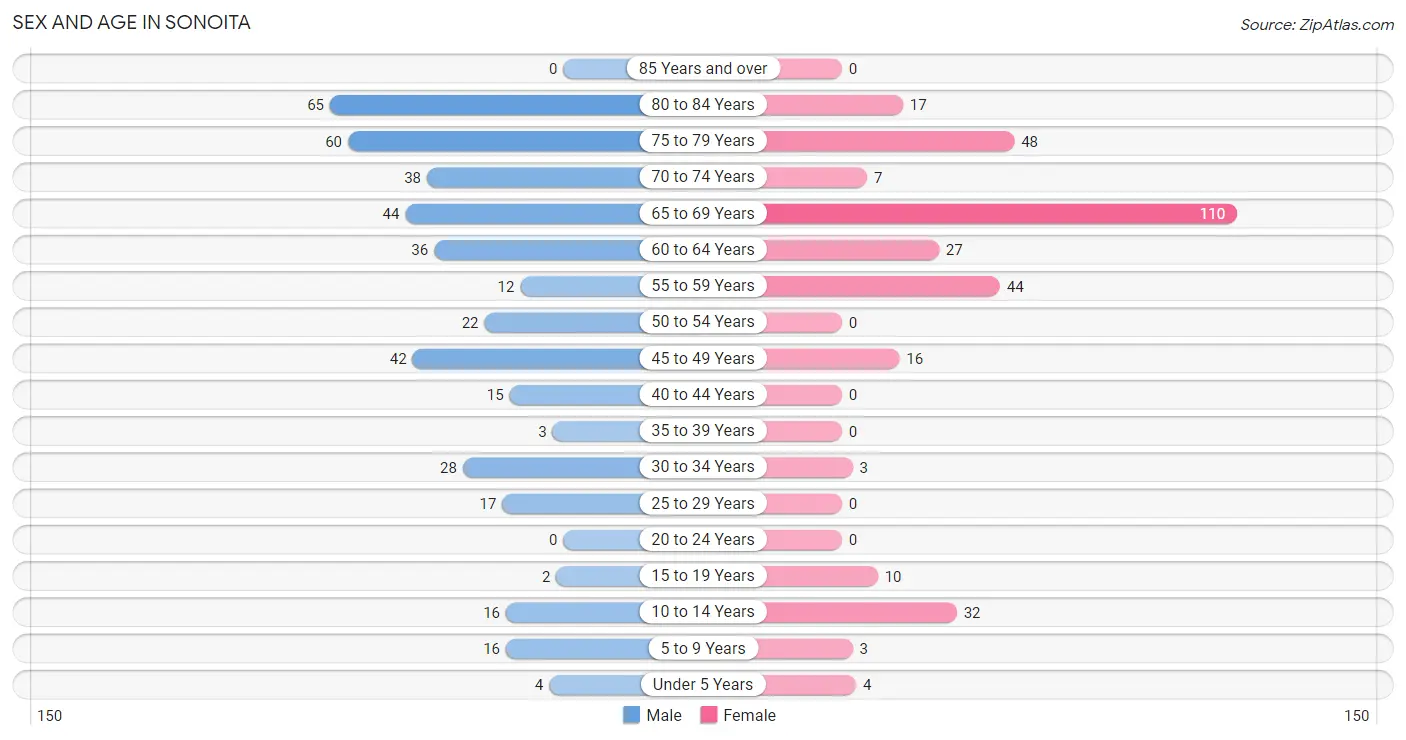
Sex and Age in Sonoita
Sex and Age in Sonoita
The most populous age groups in Sonoita are 80 to 84 Years (65 | 15.5%) for men and 65 to 69 Years (110 | 34.3%) for women.
| Age Bracket | Male | Female |
| Under 5 Years | 4 (0.9%) | 4 (1.3%) |
| 5 to 9 Years | 16 (3.8%) | 3 (0.9%) |
| 10 to 14 Years | 16 (3.8%) | 32 (10.0%) |
| 15 to 19 Years | 2 (0.5%) | 10 (3.1%) |
| 20 to 24 Years | 0 (0.0%) | 0 (0.0%) |
| 25 to 29 Years | 17 (4.1%) | 0 (0.0%) |
| 30 to 34 Years | 28 (6.7%) | 3 (0.9%) |
| 35 to 39 Years | 3 (0.7%) | 0 (0.0%) |
| 40 to 44 Years | 15 (3.6%) | 0 (0.0%) |
| 45 to 49 Years | 42 (10.0%) | 16 (5.0%) |
| 50 to 54 Years | 22 (5.2%) | 0 (0.0%) |
| 55 to 59 Years | 12 (2.9%) | 44 (13.7%) |
| 60 to 64 Years | 36 (8.6%) | 27 (8.4%) |
| 65 to 69 Years | 44 (10.5%) | 110 (34.3%) |
| 70 to 74 Years | 38 (9.0%) | 7 (2.2%) |
| 75 to 79 Years | 60 (14.3%) | 48 (14.9%) |
| 80 to 84 Years | 65 (15.5%) | 17 (5.3%) |
| 85 Years and over | 0 (0.0%) | 0 (0.0%) |
| Total | 420 (100.0%) | 321 (100.0%) |
Families and Households in Sonoita
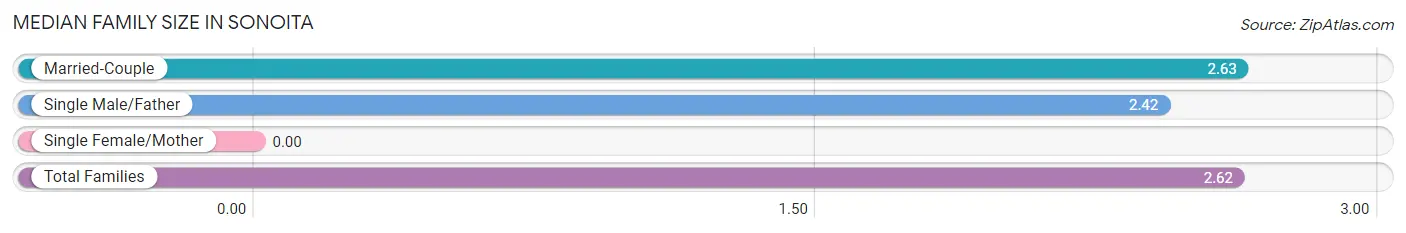
Median Family Size in Sonoita
| Family Type | # Families | Family Size |
| Married-Couple | 243 (95.3%) | 2.63 |
| Single Male/Father | 12 (4.7%) | 2.42 |
| Single Female/Mother | 0 (0.0%) | - |
| Total Families | 255 (100.0%) | 2.62 |
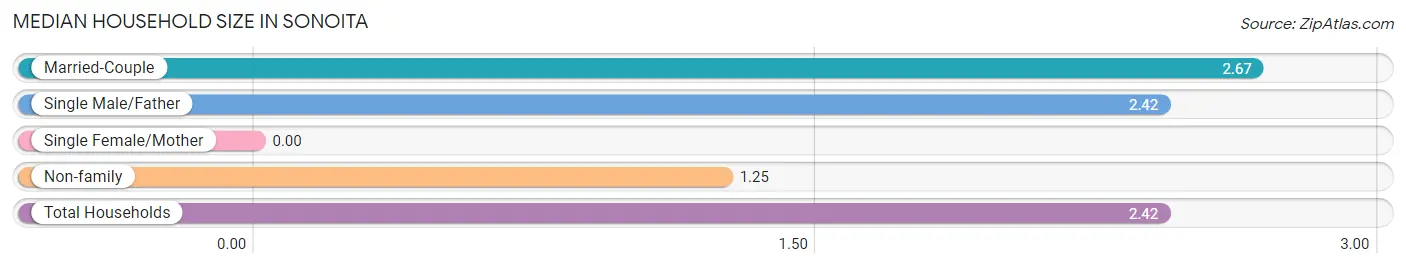
Median Household Size in Sonoita
| Household Type | # Households | Household Size |
| Married-Couple | 243 (79.4%) | 2.67 |
| Single Male/Father | 12 (3.9%) | 2.42 |
| Single Female/Mother | 0 (0.0%) | - |
| Non-family | 51 (16.7%) | 1.25 |
| Total Households | 306 (100.0%) | 2.42 |
Household Size by Marriage Status in Sonoita
Out of a total of 306 households in Sonoita, 255 (83.3%) are family households, while 51 (16.7%) are nonfamily households. The most numerous type of family households are 2-person households, comprising 207, and the most common type of nonfamily households are 1-person households, comprising 32.
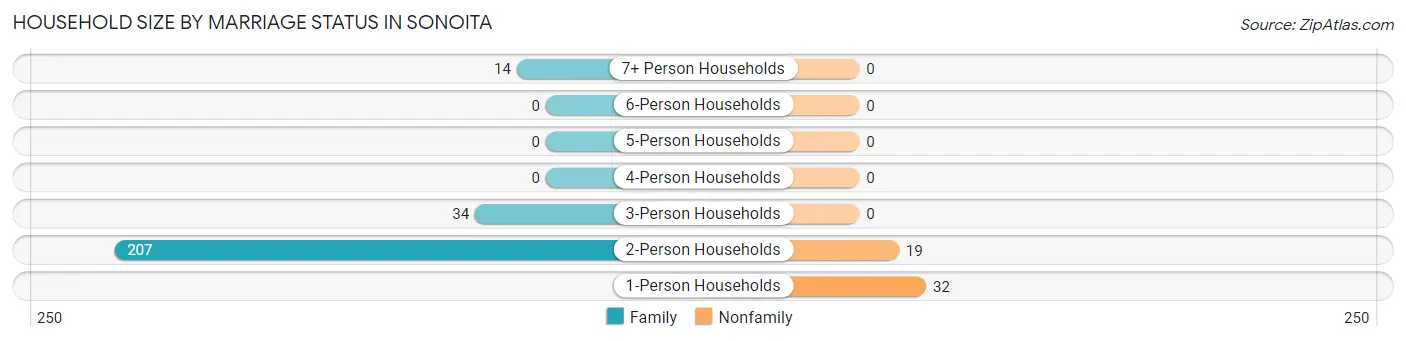
| Household Size | Family Households | Nonfamily Households |
| 1-Person Households | - | 32 (10.5%) |
| 2-Person Households | 207 (67.6%) | 19 (6.2%) |
| 3-Person Households | 34 (11.1%) | 0 (0.0%) |
| 4-Person Households | 0 (0.0%) | 0 (0.0%) |
| 5-Person Households | 0 (0.0%) | 0 (0.0%) |
| 6-Person Households | 0 (0.0%) | 0 (0.0%) |
| 7+ Person Households | 14 (4.6%) | 0 (0.0%) |
| Total | 255 (83.3%) | 51 (16.7%) |
Female Fertility in Sonoita
Fertility by Age in Sonoita
| Age Bracket | Women with Births | Births / 1,000 Women |
| 15 to 19 years | 0 (0.0%) | 0.0 |
| 20 to 34 years | 0 (0.0%) | 0.0 |
| 35 to 50 years | 0 (0.0%) | 0.0 |
| Total | 0 (0.0%) | 0.0 |
Fertility by Age by Marriage Status in Sonoita
| Age Bracket | Married | Unmarried |
| 15 to 19 years | 0 (0.0%) | 0 (0.0%) |
| 20 to 34 years | 0 (0.0%) | 0 (0.0%) |
| 35 to 50 years | 0 (0.0%) | 0 (0.0%) |
| Total | 0 (0.0%) | 0 (0.0%) |
Fertility by Education in Sonoita
| Educational Attainment | Women with Births | Births / 1,000 Women |
| Less than High School | 0 (0.0%) | 0.0 |
| High School Diploma | 0 (0.0%) | 0.0 |
| College or Associate's Degree | 0 (0.0%) | 0.0 |
| Bachelor's Degree | 0 (0.0%) | 0.0 |
| Graduate Degree | 0 (0.0%) | 0.0 |
| Total | 0 (0.0%) | 0.0 |
Fertility by Education by Marriage Status in Sonoita
| Educational Attainment | Married | Unmarried |
| Less than High School | 0 (0.0%) | 0 (0.0%) |
| High School Diploma | 0 (0.0%) | 0 (0.0%) |
| College or Associate's Degree | 0 (0.0%) | 0 (0.0%) |
| Bachelor's Degree | 0 (0.0%) | 0 (0.0%) |
| Graduate Degree | 0 (0.0%) | 0 (0.0%) |
| Total | 0 (0.0%) | 0 (0.0%) |
Employment Characteristics in Sonoita
Employment by Class of Employer in Sonoita
Among the 171 employed individuals in Sonoita, private company employees (83 | 48.5%), self-employed (not incorporated) (26 | 15.2%), and federal government employees (22 | 12.9%) make up the most common classes of employment.
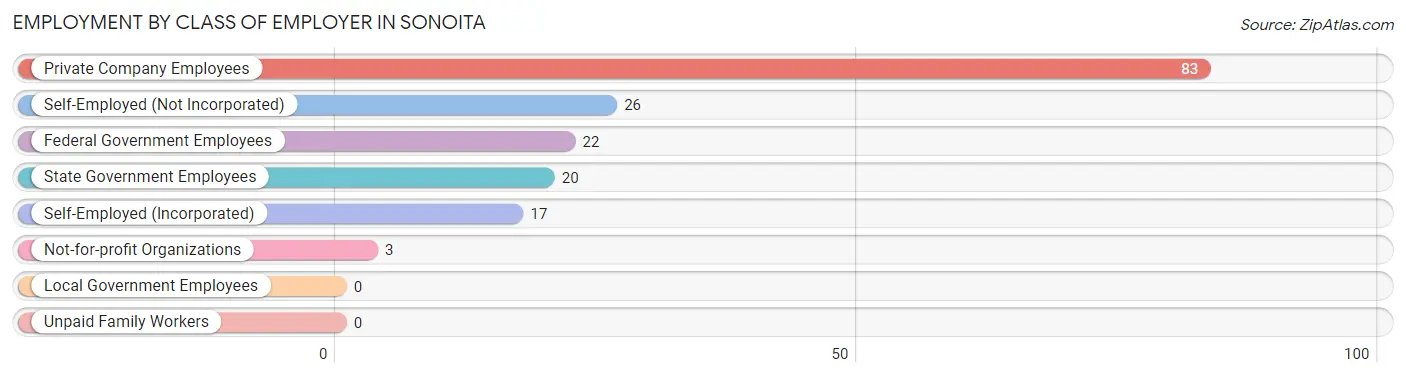
| Employer Class | # Employees | % Employees |
| Private Company Employees | 83 | 48.5% |
| Self-Employed (Incorporated) | 17 | 9.9% |
| Self-Employed (Not Incorporated) | 26 | 15.2% |
| Not-for-profit Organizations | 3 | 1.8% |
| Local Government Employees | 0 | 0.0% |
| State Government Employees | 20 | 11.7% |
| Federal Government Employees | 22 | 12.9% |
| Unpaid Family Workers | 0 | 0.0% |
| Total | 171 | 100.0% |
Employment Status by Age in Sonoita
According to the labor force statistics for Sonoita, out of the total population over 16 years of age (666), 30.6% or 204 individuals are in the labor force, with 16.2% or 33 of them unemployed. The age group with the highest labor force participation rate is 25 to 29 years, with 100.0% or 17 individuals in the labor force. Within the labor force, the 25 to 29 years age range has the highest percentage of unemployed individuals, with 100.0% or 17 of them being unemployed.
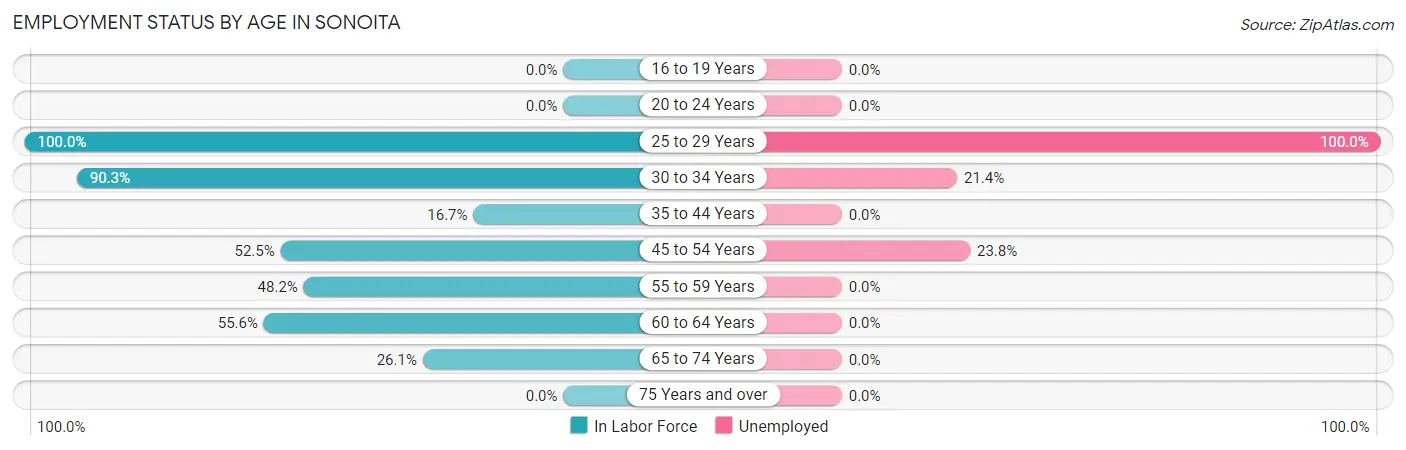
| Age Bracket | In Labor Force | Unemployed |
| 16 to 19 Years | 0 (0.0%) | 0 (0.0%) |
| 20 to 24 Years | 0 (0.0%) | 0 (0.0%) |
| 25 to 29 Years | 17 (100.0%) | 17 (100.0%) |
| 30 to 34 Years | 28 (90.3%) | 6 (21.4%) |
| 35 to 44 Years | 3 (16.7%) | 0 (0.0%) |
| 45 to 54 Years | 42 (52.5%) | 10 (23.8%) |
| 55 to 59 Years | 27 (48.2%) | 0 (0.0%) |
| 60 to 64 Years | 35 (55.6%) | 0 (0.0%) |
| 65 to 74 Years | 52 (26.1%) | 0 (0.0%) |
| 75 Years and over | 0 (0.0%) | 0 (0.0%) |
| Total | 204 (30.6%) | 33 (16.2%) |
Employment Status by Educational Attainment in Sonoita
According to labor force statistics for Sonoita, 57.4% of individuals (152) out of the total population between 25 and 64 years of age (265) are in the labor force, with 21.7% or 33 of them being unemployed. The group with the highest labor force participation rate are those with the educational attainment of high school diploma, with 84.1% or 95 individuals in the labor force. Within the labor force, individuals with less than high school education have the highest percentage of unemployment, with 100.0% or 17 of them being unemployed.
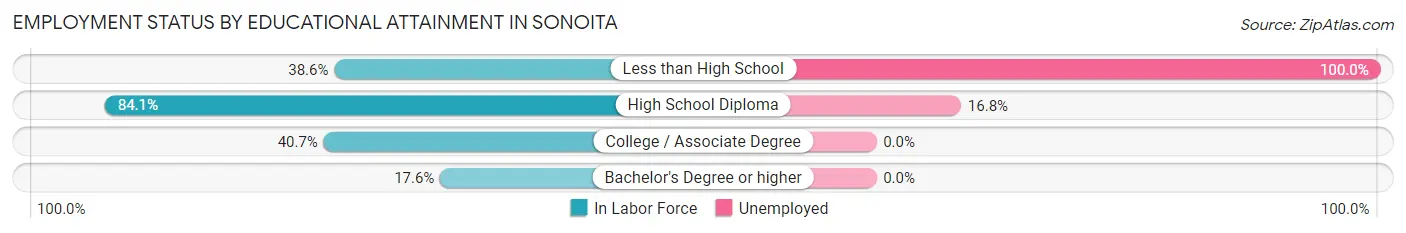
| Educational Attainment | In Labor Force | Unemployed |
| Less than High School | 17 (38.6%) | 44 (100.0%) |
| High School Diploma | 95 (84.1%) | 19 (16.8%) |
| College / Associate Degree | 37 (40.7%) | 0 (0.0%) |
| Bachelor's Degree or higher | 3 (17.6%) | 0 (0.0%) |
| Total | 152 (57.4%) | 58 (21.7%) |
Employment Occupations by Sex in Sonoita
Management, Business, Science and Arts Occupations
The most common Management, Business, Science and Arts occupations in Sonoita are Computers, Engineering & Science (22 | 12.9%), Computers & Mathematics (22 | 12.9%), and Management (3 | 1.8%).
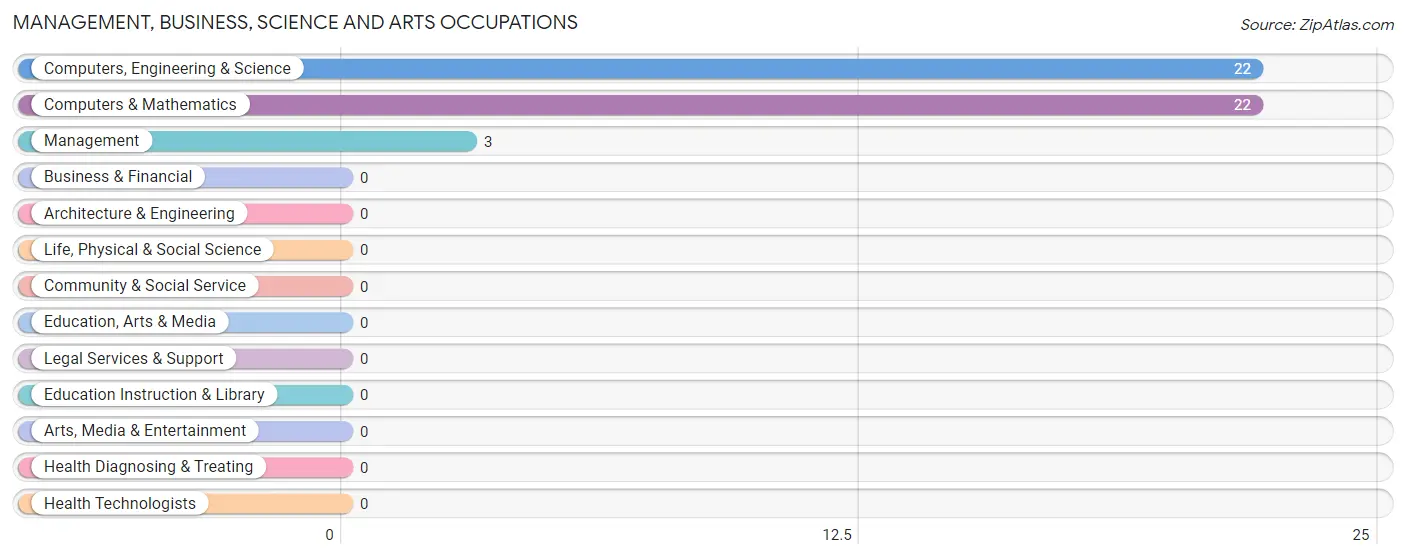
Management, Business, Science and Arts Occupations by Sex
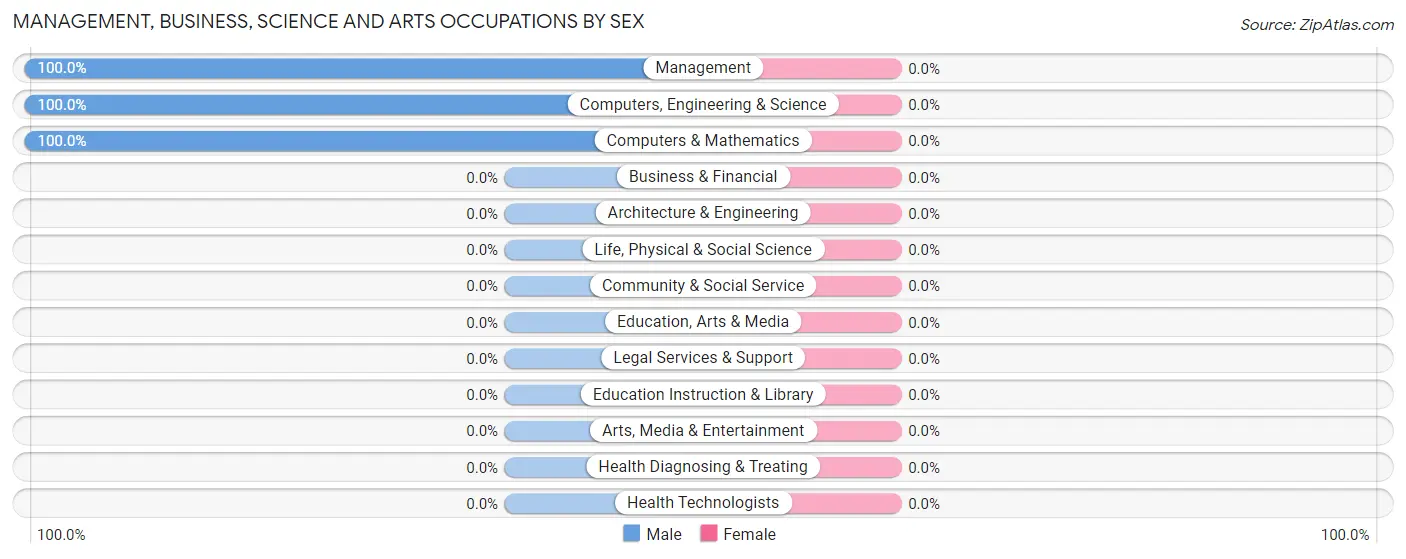
| Occupation | Male | Female |
| Management | 3 (100.0%) | 0 (0.0%) |
| Business & Financial | 0 (0.0%) | 0 (0.0%) |
| Computers, Engineering & Science | 22 (100.0%) | 0 (0.0%) |
| Computers & Mathematics | 22 (100.0%) | 0 (0.0%) |
| Architecture & Engineering | 0 (0.0%) | 0 (0.0%) |
| Life, Physical & Social Science | 0 (0.0%) | 0 (0.0%) |
| Community & Social Service | 0 (0.0%) | 0 (0.0%) |
| Education, Arts & Media | 0 (0.0%) | 0 (0.0%) |
| Legal Services & Support | 0 (0.0%) | 0 (0.0%) |
| Education Instruction & Library | 0 (0.0%) | 0 (0.0%) |
| Arts, Media & Entertainment | 0 (0.0%) | 0 (0.0%) |
| Health Diagnosing & Treating | 0 (0.0%) | 0 (0.0%) |
| Health Technologists | 0 (0.0%) | 0 (0.0%) |
| Total (Category) | 25 (100.0%) | 0 (0.0%) |
| Total (Overall) | 105 (61.4%) | 66 (38.6%) |
Services Occupations
The most common Services occupations in Sonoita are Cleaning & Maintenance (50 | 29.2%), and Personal Care & Service (17 | 9.9%).
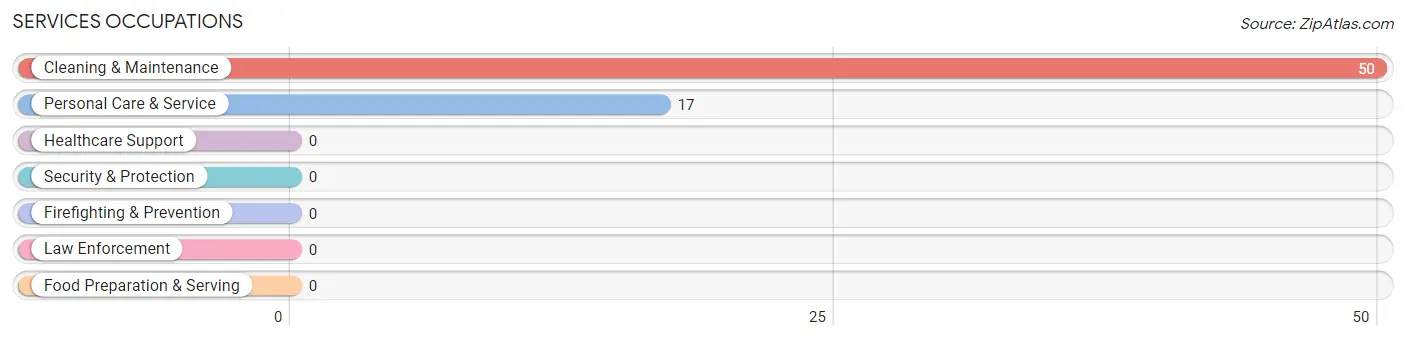
Services Occupations by Sex
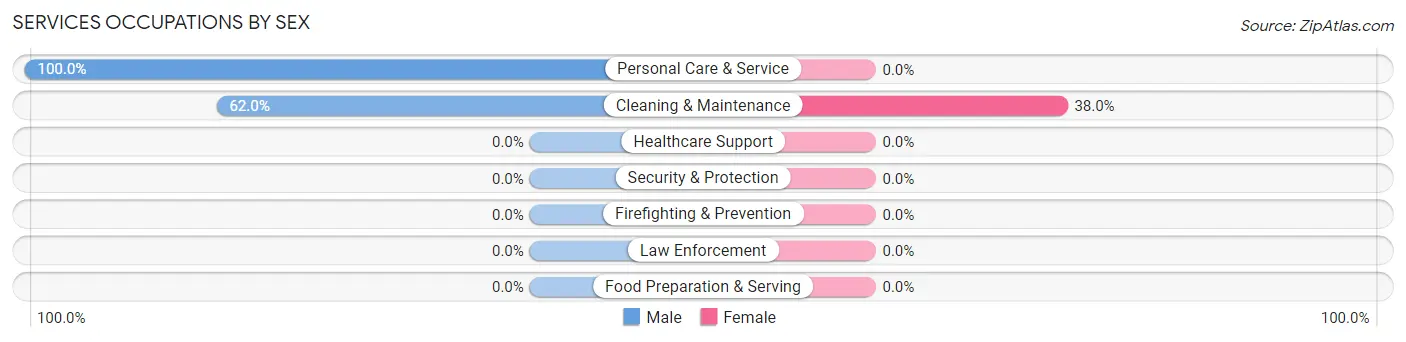
| Occupation | Male | Female |
| Healthcare Support | 0 (0.0%) | 0 (0.0%) |
| Security & Protection | 0 (0.0%) | 0 (0.0%) |
| Firefighting & Prevention | 0 (0.0%) | 0 (0.0%) |
| Law Enforcement | 0 (0.0%) | 0 (0.0%) |
| Food Preparation & Serving | 0 (0.0%) | 0 (0.0%) |
| Cleaning & Maintenance | 31 (62.0%) | 19 (38.0%) |
| Personal Care & Service | 17 (100.0%) | 0 (0.0%) |
| Total (Category) | 48 (71.6%) | 19 (28.4%) |
| Total (Overall) | 105 (61.4%) | 66 (38.6%) |
Sales and Office Occupations
The most common Sales and Office occupations in Sonoita are , and Office & Administration (47 | 27.5%).
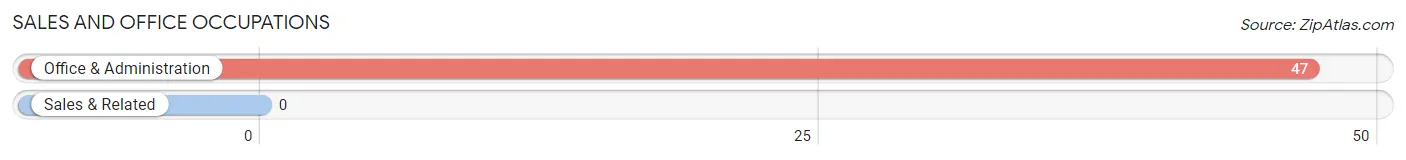
Sales and Office Occupations by Sex
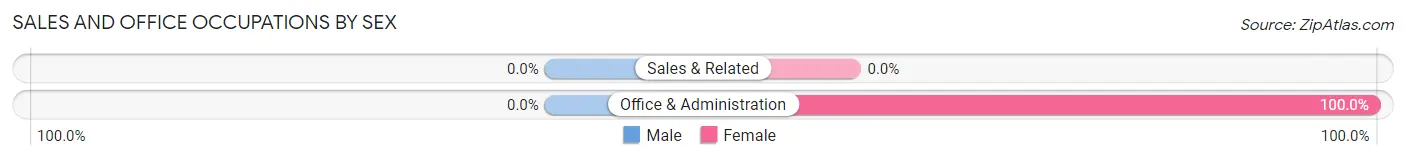
| Occupation | Male | Female |
| Sales & Related | 0 (0.0%) | 0 (0.0%) |
| Office & Administration | 0 (0.0%) | 47 (100.0%) |
| Total (Category) | 0 (0.0%) | 47 (100.0%) |
| Total (Overall) | 105 (61.4%) | 66 (38.6%) |
Natural Resources, Construction and Maintenance Occupations
The most common Natural Resources, Construction and Maintenance occupations in Sonoita are , and Construction & Extraction (11 | 6.4%).
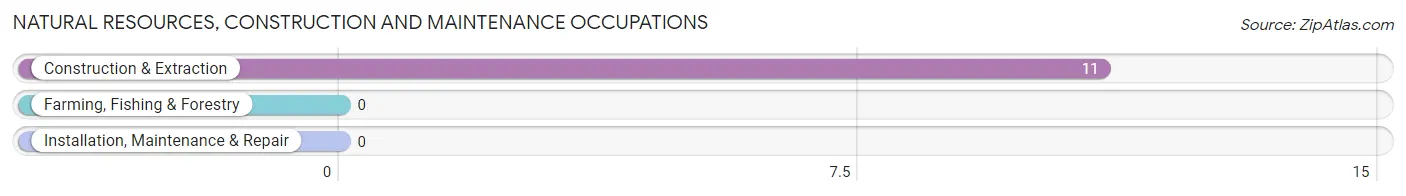
Natural Resources, Construction and Maintenance Occupations by Sex
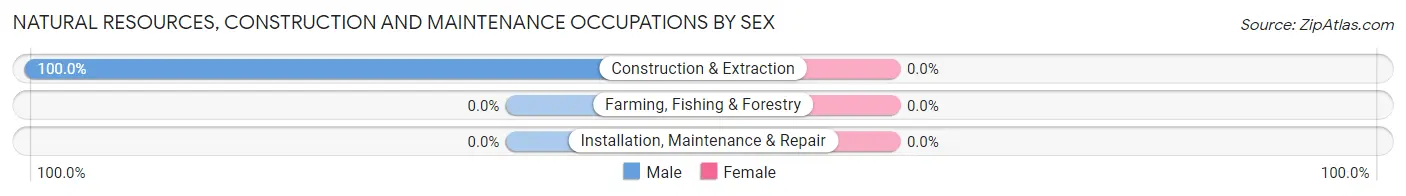
| Occupation | Male | Female |
| Farming, Fishing & Forestry | 0 (0.0%) | 0 (0.0%) |
| Construction & Extraction | 11 (100.0%) | 0 (0.0%) |
| Installation, Maintenance & Repair | 0 (0.0%) | 0 (0.0%) |
| Total (Category) | 11 (100.0%) | 0 (0.0%) |
| Total (Overall) | 105 (61.4%) | 66 (38.6%) |
Production, Transportation and Moving Occupations
The most common Production, Transportation and Moving occupations in Sonoita are Production (11 | 6.4%), and Transportation (10 | 5.9%).
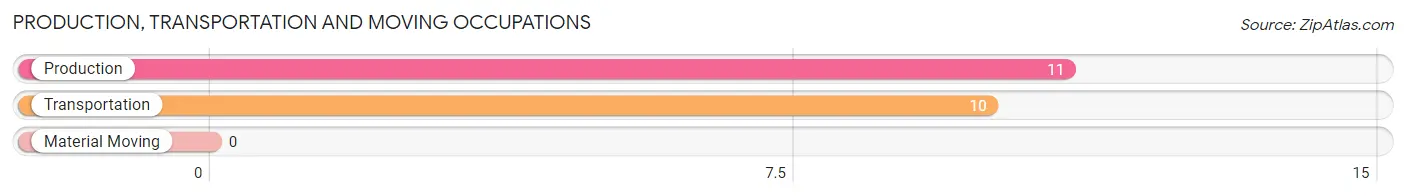
Production, Transportation and Moving Occupations by Sex
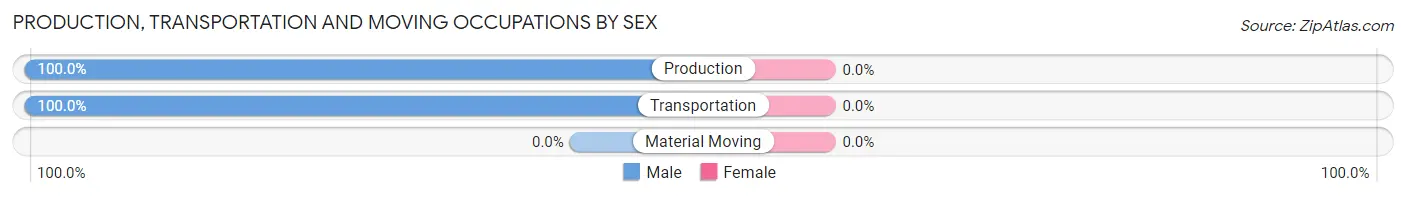
| Occupation | Male | Female |
| Production | 11 (100.0%) | 0 (0.0%) |
| Transportation | 10 (100.0%) | 0 (0.0%) |
| Material Moving | 0 (0.0%) | 0 (0.0%) |
| Total (Category) | 21 (100.0%) | 0 (0.0%) |
| Total (Overall) | 105 (61.4%) | 66 (38.6%) |
Employment Industries by Sex in Sonoita
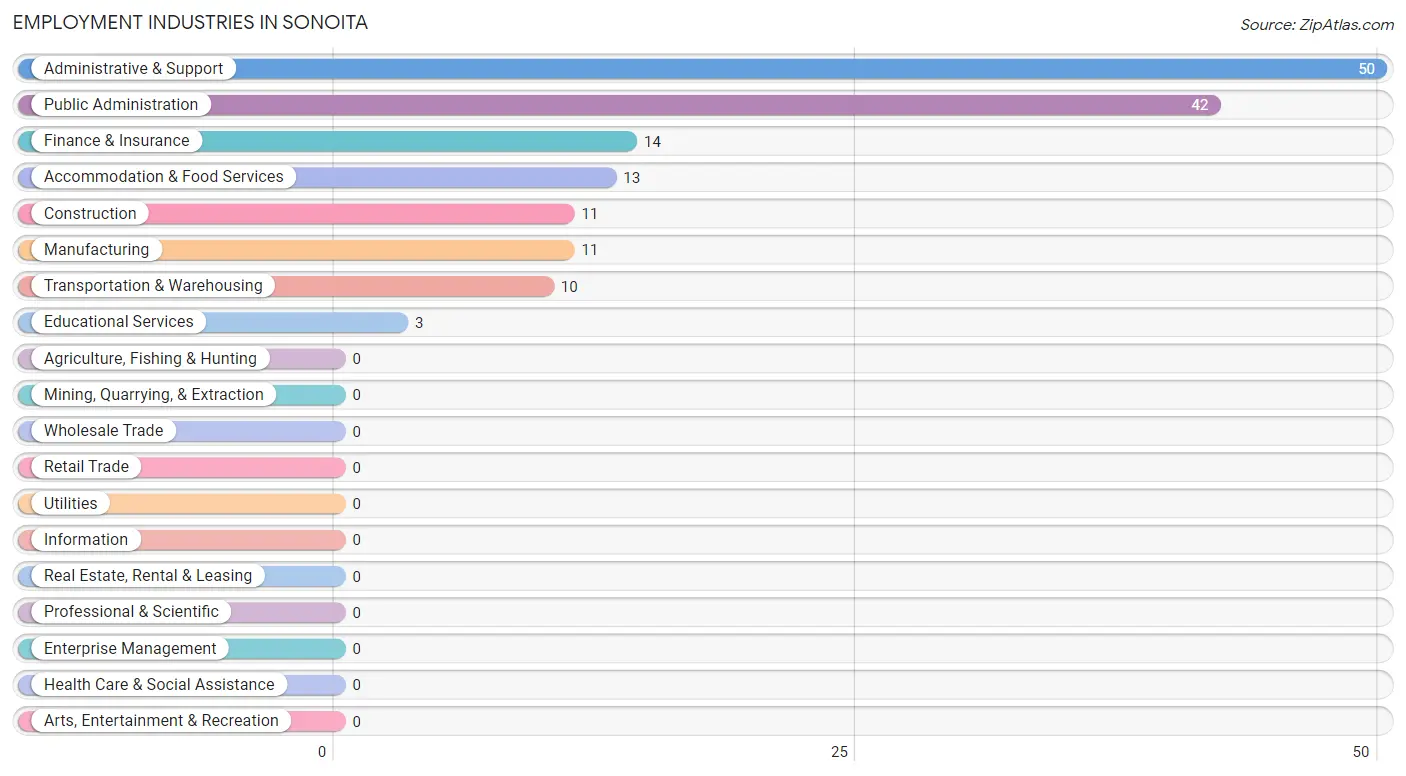
Employment Industries in Sonoita
The major employment industries in Sonoita include Administrative & Support (50 | 29.2%), Public Administration (42 | 24.6%), Finance & Insurance (14 | 8.2%), Accommodation & Food Services (13 | 7.6%), and Construction (11 | 6.4%).
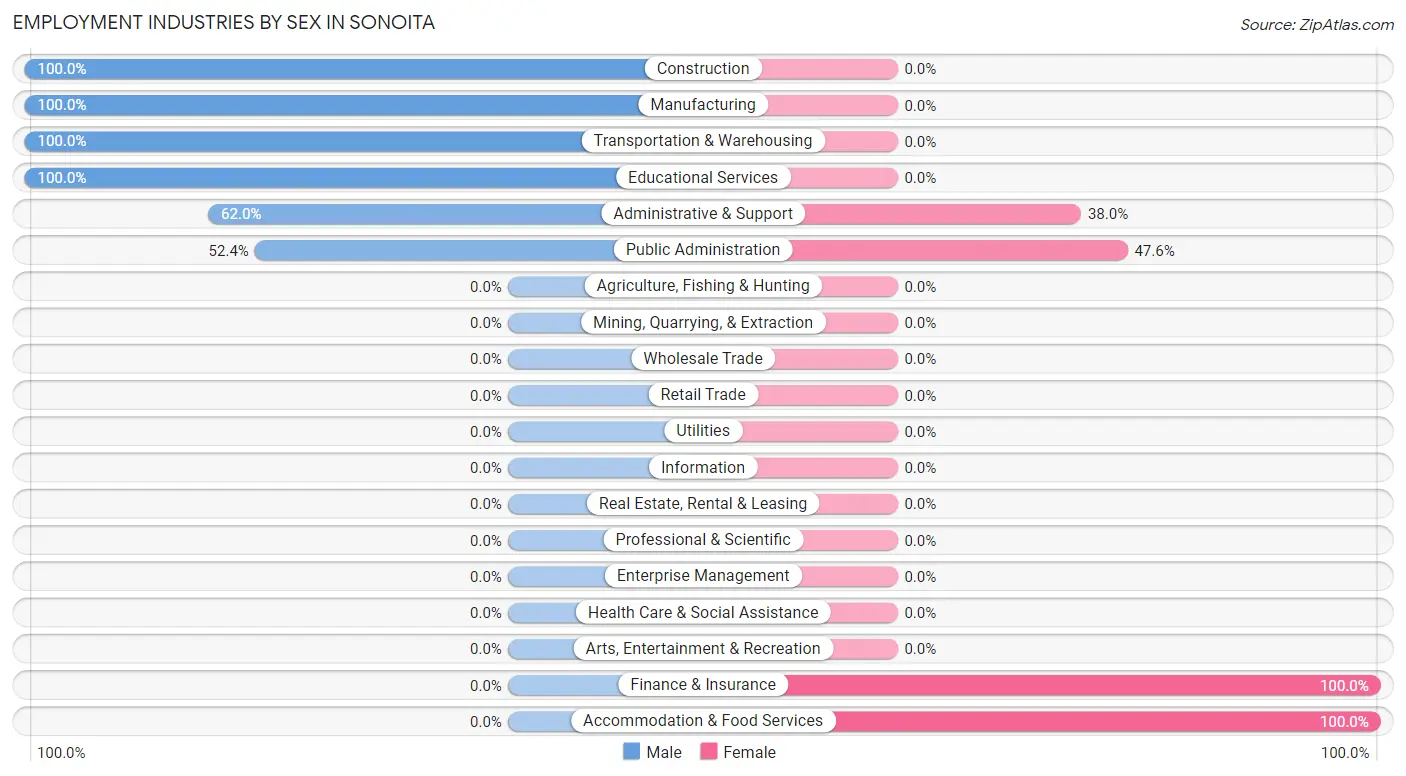
Employment Industries by Sex in Sonoita
The Sonoita industries that see more men than women are Construction (100.0%), Manufacturing (100.0%), and Transportation & Warehousing (100.0%), whereas the industries that tend to have a higher number of women are Finance & Insurance (100.0%), Accommodation & Food Services (100.0%), and Public Administration (47.6%).
| Industry | Male | Female |
| Agriculture, Fishing & Hunting | 0 (0.0%) | 0 (0.0%) |
| Mining, Quarrying, & Extraction | 0 (0.0%) | 0 (0.0%) |
| Construction | 11 (100.0%) | 0 (0.0%) |
| Manufacturing | 11 (100.0%) | 0 (0.0%) |
| Wholesale Trade | 0 (0.0%) | 0 (0.0%) |
| Retail Trade | 0 (0.0%) | 0 (0.0%) |
| Transportation & Warehousing | 10 (100.0%) | 0 (0.0%) |
| Utilities | 0 (0.0%) | 0 (0.0%) |
| Information | 0 (0.0%) | 0 (0.0%) |
| Finance & Insurance | 0 (0.0%) | 14 (100.0%) |
| Real Estate, Rental & Leasing | 0 (0.0%) | 0 (0.0%) |
| Professional & Scientific | 0 (0.0%) | 0 (0.0%) |
| Enterprise Management | 0 (0.0%) | 0 (0.0%) |
| Administrative & Support | 31 (62.0%) | 19 (38.0%) |
| Educational Services | 3 (100.0%) | 0 (0.0%) |
| Health Care & Social Assistance | 0 (0.0%) | 0 (0.0%) |
| Arts, Entertainment & Recreation | 0 (0.0%) | 0 (0.0%) |
| Accommodation & Food Services | 0 (0.0%) | 13 (100.0%) |
| Public Administration | 22 (52.4%) | 20 (47.6%) |
| Total | 105 (61.4%) | 66 (38.6%) |
Education in Sonoita
School Enrollment in Sonoita
The most common levels of schooling among the 83 students in Sonoita are middle school (31 | 37.3%), high school (29 | 34.9%), and kindergarten (16 | 19.3%).
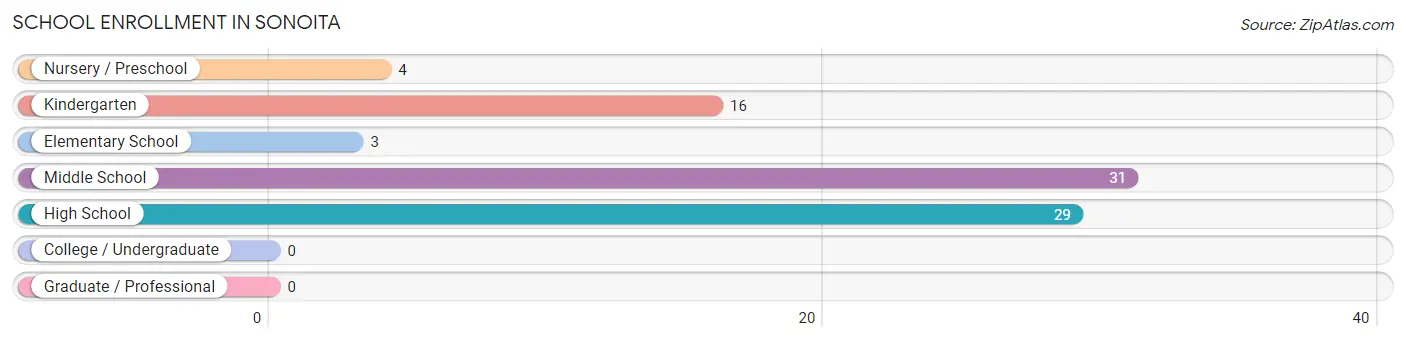
| School Level | # Students | % Students |
| Nursery / Preschool | 4 | 4.8% |
| Kindergarten | 16 | 19.3% |
| Elementary School | 3 | 3.6% |
| Middle School | 31 | 37.3% |
| High School | 29 | 34.9% |
| College / Undergraduate | 0 | 0.0% |
| Graduate / Professional | 0 | 0.0% |
| Total | 83 | 100.0% |
School Enrollment by Age by Funding Source in Sonoita
Out of a total of 83 students who are enrolled in schools in Sonoita, 55 (66.3%) attend a private institution, while the remaining 28 (33.7%) are enrolled in public schools. The age group of 5 to 9 year old has the highest likelihood of being enrolled in private schools, with 16 (84.2% in the age bracket) enrolled. Conversely, the age group of 3 to 4 year olds has the lowest likelihood of being enrolled in a private school, with 4 (100.0% in the age bracket) attending a public institution.
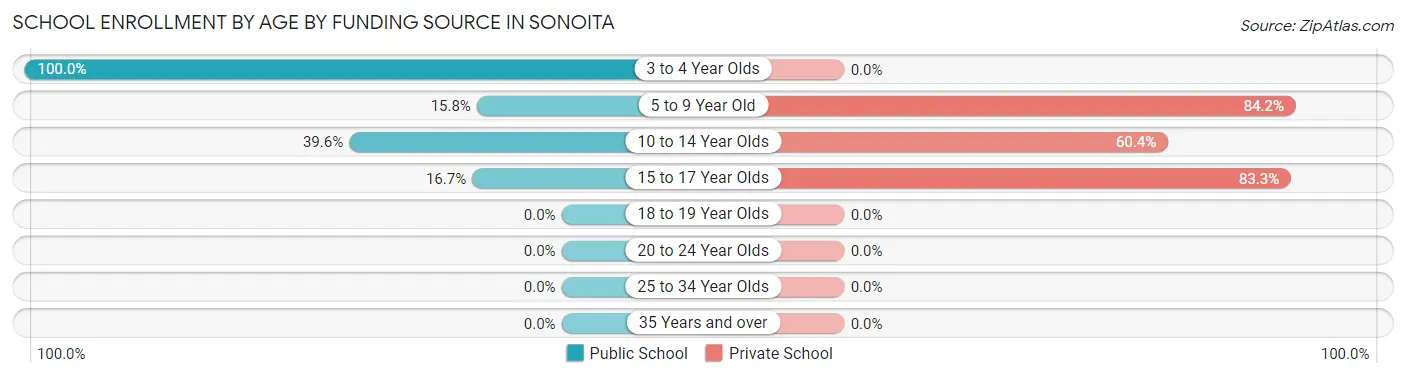
| Age Bracket | Public School | Private School |
| 3 to 4 Year Olds | 4 (100.0%) | 0 (0.0%) |
| 5 to 9 Year Old | 3 (15.8%) | 16 (84.2%) |
| 10 to 14 Year Olds | 19 (39.6%) | 29 (60.4%) |
| 15 to 17 Year Olds | 2 (16.7%) | 10 (83.3%) |
| 18 to 19 Year Olds | 0 (0.0%) | 0 (0.0%) |
| 20 to 24 Year Olds | 0 (0.0%) | 0 (0.0%) |
| 25 to 34 Year Olds | 0 (0.0%) | 0 (0.0%) |
| 35 Years and over | 0 (0.0%) | 0 (0.0%) |
| Total | 28 (33.7%) | 55 (66.3%) |
Educational Attainment by Field of Study in Sonoita
Literature & languages (55 | 29.9%), science & technology (30 | 16.3%), arts & humanities (25 | 13.6%), social sciences (20 | 10.9%), and physical & health sciences (19 | 10.3%) are the most common fields of study among 184 individuals in Sonoita who have obtained a bachelor's degree or higher.
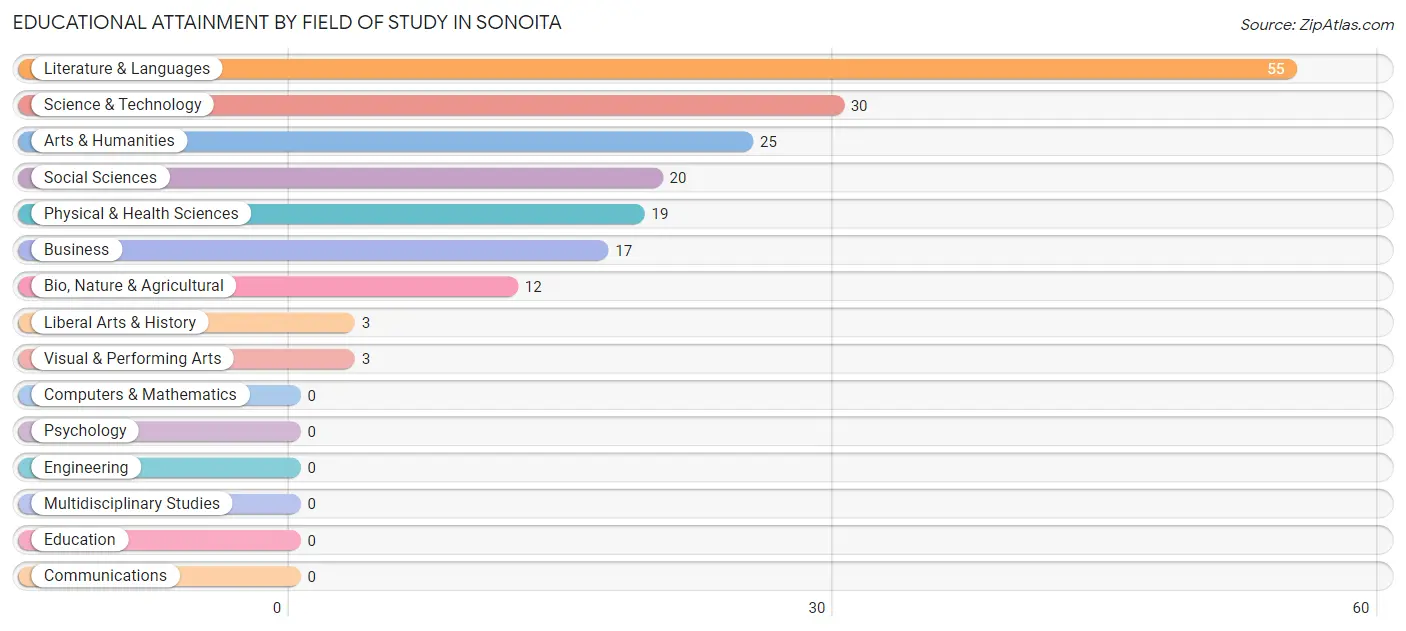
| Field of Study | # Graduates | % Graduates |
| Computers & Mathematics | 0 | 0.0% |
| Bio, Nature & Agricultural | 12 | 6.5% |
| Physical & Health Sciences | 19 | 10.3% |
| Psychology | 0 | 0.0% |
| Social Sciences | 20 | 10.9% |
| Engineering | 0 | 0.0% |
| Multidisciplinary Studies | 0 | 0.0% |
| Science & Technology | 30 | 16.3% |
| Business | 17 | 9.2% |
| Education | 0 | 0.0% |
| Literature & Languages | 55 | 29.9% |
| Liberal Arts & History | 3 | 1.6% |
| Visual & Performing Arts | 3 | 1.6% |
| Communications | 0 | 0.0% |
| Arts & Humanities | 25 | 13.6% |
| Total | 184 | 100.0% |
Transportation & Commute in Sonoita
Vehicle Availability by Sex in Sonoita
The most prevalent vehicle ownership categories in Sonoita are males with 3 vehicles (51, accounting for 48.6%) and females with 3 vehicles (52, making up 77.3%).
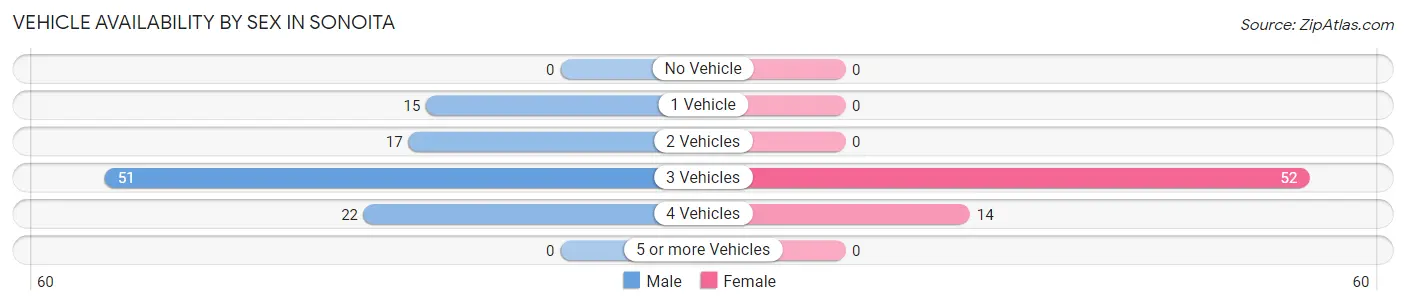
| Vehicles Available | Male | Female |
| No Vehicle | 0 (0.0%) | 0 (0.0%) |
| 1 Vehicle | 15 (14.3%) | 0 (0.0%) |
| 2 Vehicles | 17 (16.2%) | 0 (0.0%) |
| 3 Vehicles | 51 (48.6%) | 52 (78.8%) |
| 4 Vehicles | 22 (20.9%) | 14 (21.2%) |
| 5 or more Vehicles | 0 (0.0%) | 0 (0.0%) |
| Total | 105 (100.0%) | 66 (100.0%) |
Commute Time in Sonoita
The most frequently occuring commute durations in Sonoita are 45 to 59 minutes (93 commuters, 54.4%), 60 to 89 minutes (32 commuters, 18.7%), and 10 to 14 minutes (29 commuters, 17.0%).
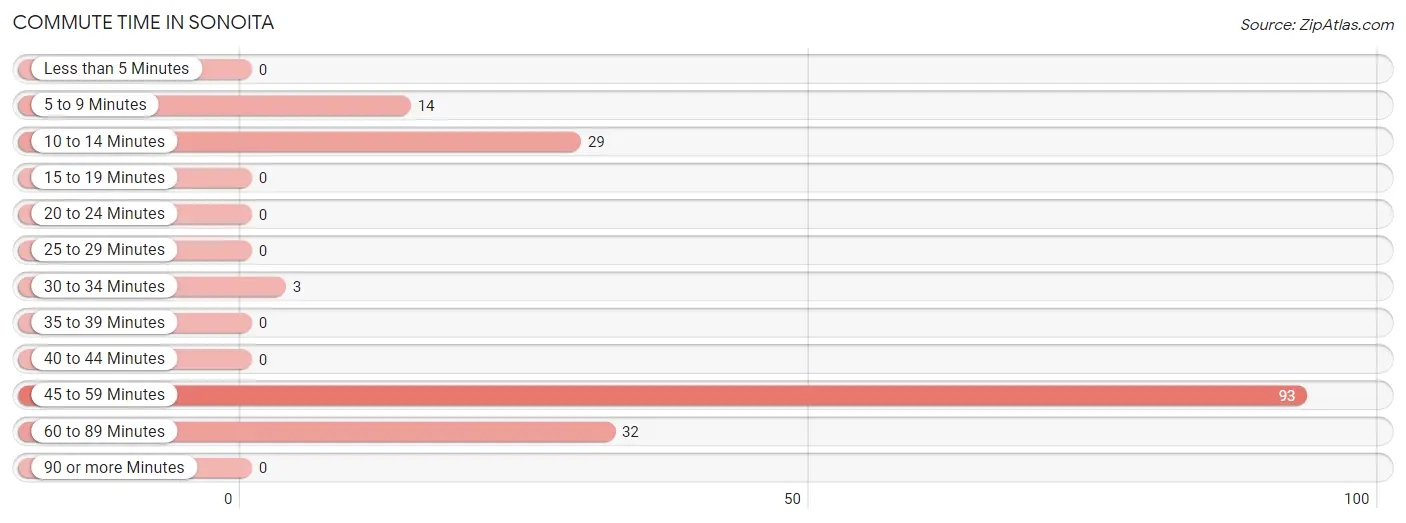
| Commute Time | # Commuters | % Commuters |
| Less than 5 Minutes | 0 | 0.0% |
| 5 to 9 Minutes | 14 | 8.2% |
| 10 to 14 Minutes | 29 | 17.0% |
| 15 to 19 Minutes | 0 | 0.0% |
| 20 to 24 Minutes | 0 | 0.0% |
| 25 to 29 Minutes | 0 | 0.0% |
| 30 to 34 Minutes | 3 | 1.8% |
| 35 to 39 Minutes | 0 | 0.0% |
| 40 to 44 Minutes | 0 | 0.0% |
| 45 to 59 Minutes | 93 | 54.4% |
| 60 to 89 Minutes | 32 | 18.7% |
| 90 or more Minutes | 0 | 0.0% |
Commute Time by Sex in Sonoita
The most common commute times in Sonoita are 45 to 59 minutes (54 commuters, 51.4%) for males and 45 to 59 minutes (39 commuters, 59.1%) for females.
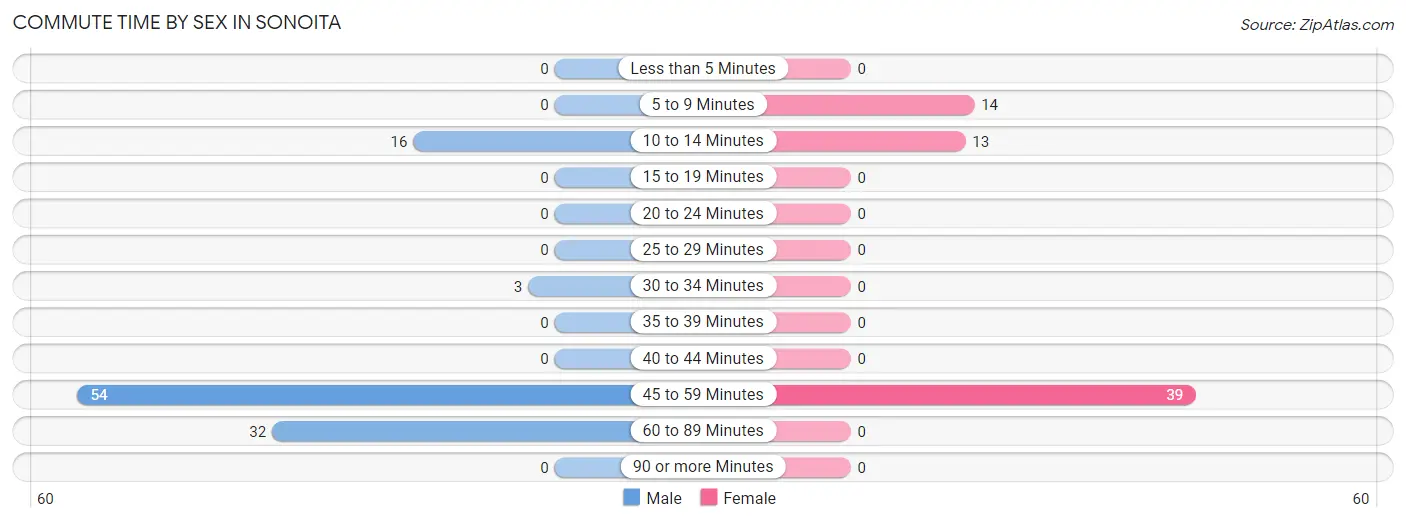
| Commute Time | Male | Female |
| Less than 5 Minutes | 0 (0.0%) | 0 (0.0%) |
| 5 to 9 Minutes | 0 (0.0%) | 14 (21.2%) |
| 10 to 14 Minutes | 16 (15.2%) | 13 (19.7%) |
| 15 to 19 Minutes | 0 (0.0%) | 0 (0.0%) |
| 20 to 24 Minutes | 0 (0.0%) | 0 (0.0%) |
| 25 to 29 Minutes | 0 (0.0%) | 0 (0.0%) |
| 30 to 34 Minutes | 3 (2.9%) | 0 (0.0%) |
| 35 to 39 Minutes | 0 (0.0%) | 0 (0.0%) |
| 40 to 44 Minutes | 0 (0.0%) | 0 (0.0%) |
| 45 to 59 Minutes | 54 (51.4%) | 39 (59.1%) |
| 60 to 89 Minutes | 32 (30.5%) | 0 (0.0%) |
| 90 or more Minutes | 0 (0.0%) | 0 (0.0%) |
Time of Departure to Work by Sex in Sonoita
The most frequent times of departure to work in Sonoita are 7:00 AM to 7:29 AM (54, 51.4%) for males and 8:00 AM to 8:29 AM (20, 30.3%) for females.
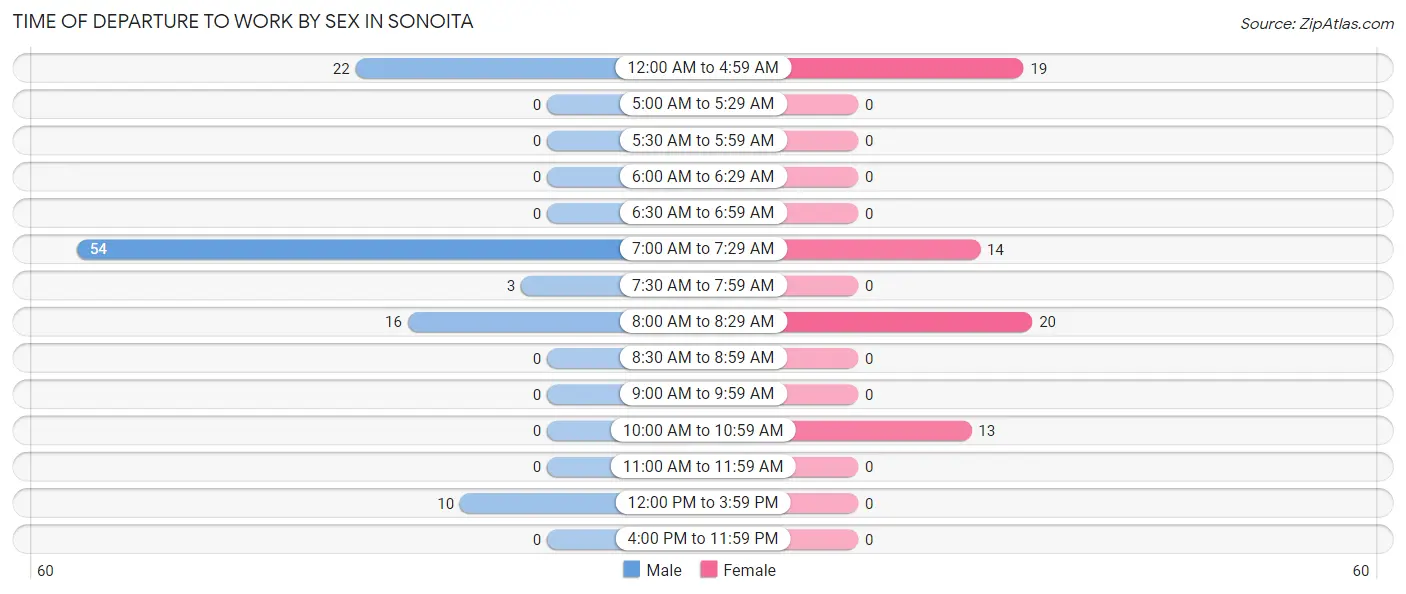
| Time of Departure | Male | Female |
| 12:00 AM to 4:59 AM | 22 (20.9%) | 19 (28.8%) |
| 5:00 AM to 5:29 AM | 0 (0.0%) | 0 (0.0%) |
| 5:30 AM to 5:59 AM | 0 (0.0%) | 0 (0.0%) |
| 6:00 AM to 6:29 AM | 0 (0.0%) | 0 (0.0%) |
| 6:30 AM to 6:59 AM | 0 (0.0%) | 0 (0.0%) |
| 7:00 AM to 7:29 AM | 54 (51.4%) | 14 (21.2%) |
| 7:30 AM to 7:59 AM | 3 (2.9%) | 0 (0.0%) |
| 8:00 AM to 8:29 AM | 16 (15.2%) | 20 (30.3%) |
| 8:30 AM to 8:59 AM | 0 (0.0%) | 0 (0.0%) |
| 9:00 AM to 9:59 AM | 0 (0.0%) | 0 (0.0%) |
| 10:00 AM to 10:59 AM | 0 (0.0%) | 13 (19.7%) |
| 11:00 AM to 11:59 AM | 0 (0.0%) | 0 (0.0%) |
| 12:00 PM to 3:59 PM | 10 (9.5%) | 0 (0.0%) |
| 4:00 PM to 11:59 PM | 0 (0.0%) | 0 (0.0%) |
| Total | 105 (100.0%) | 66 (100.0%) |
Housing Occupancy in Sonoita
Occupancy by Ownership in Sonoita
Of the total 306 dwellings in Sonoita, owner-occupied units account for 306 (100.0%), while renter-occupied units make up 0 (0.0%).
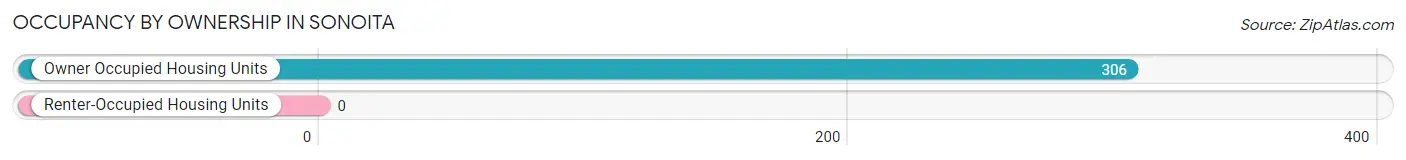
| Occupancy | # Housing Units | % Housing Units |
| Owner Occupied Housing Units | 306 | 100.0% |
| Renter-Occupied Housing Units | 0 | 0.0% |
| Total Occupied Housing Units | 306 | 100.0% |
Occupancy by Household Size in Sonoita
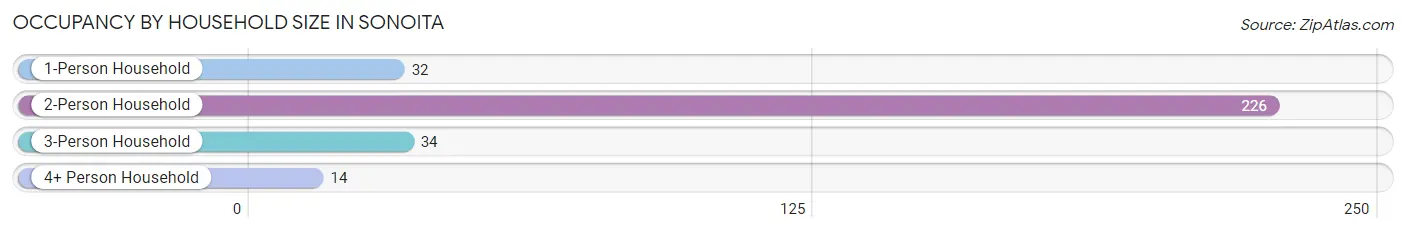
| Household Size | # Housing Units | % Housing Units |
| 1-Person Household | 32 | 10.5% |
| 2-Person Household | 226 | 73.9% |
| 3-Person Household | 34 | 11.1% |
| 4+ Person Household | 14 | 4.6% |
| Total Housing Units | 306 | 100.0% |
Occupancy by Ownership by Household Size in Sonoita
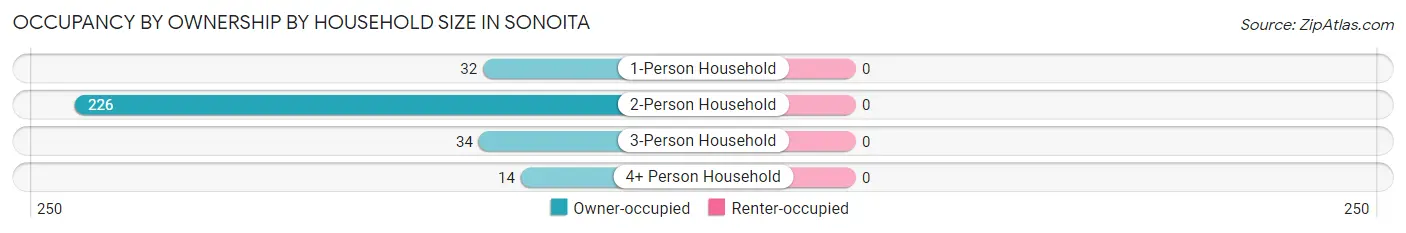
| Household Size | Owner-occupied | Renter-occupied |
| 1-Person Household | 32 (100.0%) | 0 (0.0%) |
| 2-Person Household | 226 (100.0%) | 0 (0.0%) |
| 3-Person Household | 34 (100.0%) | 0 (0.0%) |
| 4+ Person Household | 14 (100.0%) | 0 (0.0%) |
| Total Housing Units | 306 (100.0%) | 0 (0.0%) |
Occupancy by Educational Attainment in Sonoita
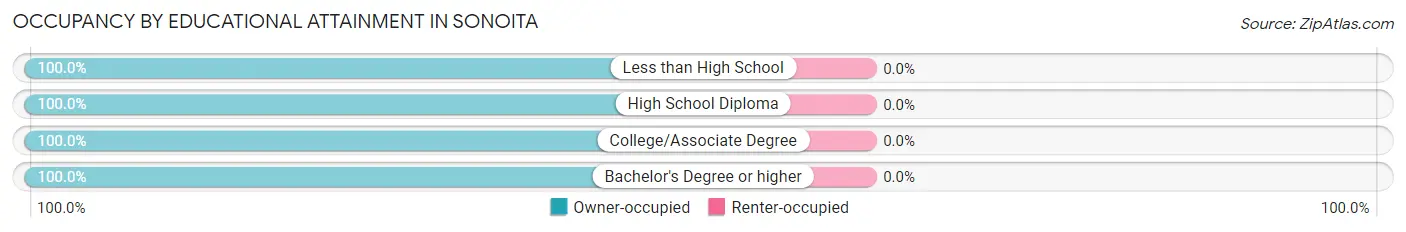
| Household Size | Owner-occupied | Renter-occupied |
| Less than High School | 17 (100.0%) | 0 (0.0%) |
| High School Diploma | 33 (100.0%) | 0 (0.0%) |
| College/Associate Degree | 137 (100.0%) | 0 (0.0%) |
| Bachelor's Degree or higher | 119 (100.0%) | 0 (0.0%) |
Occupancy by Age of Householder in Sonoita
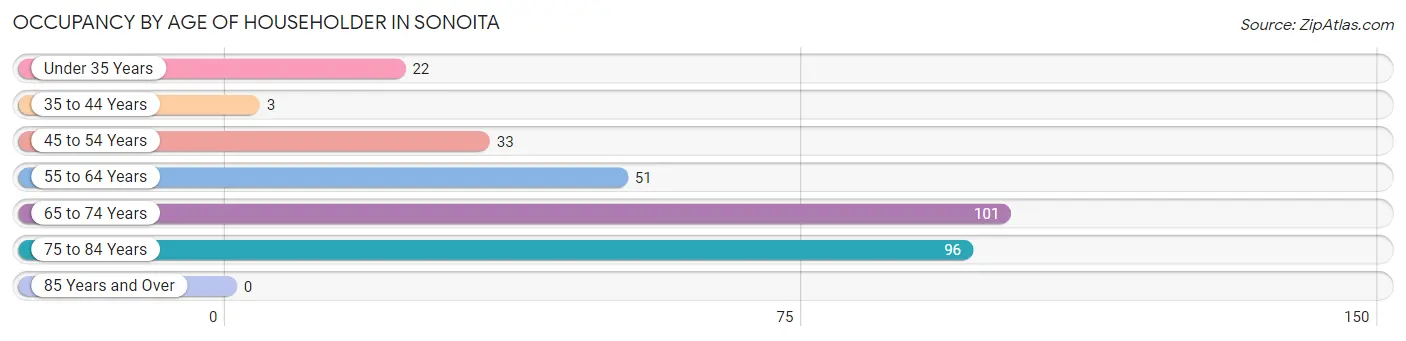
| Age Bracket | # Households | % Households |
| Under 35 Years | 22 | 7.2% |
| 35 to 44 Years | 3 | 1.0% |
| 45 to 54 Years | 33 | 10.8% |
| 55 to 64 Years | 51 | 16.7% |
| 65 to 74 Years | 101 | 33.0% |
| 75 to 84 Years | 96 | 31.4% |
| 85 Years and Over | 0 | 0.0% |
| Total | 306 | 100.0% |
Housing Finances in Sonoita
Median Income by Occupancy in Sonoita
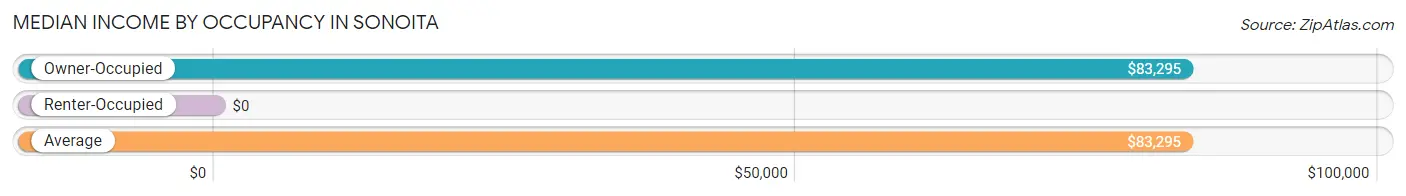
| Occupancy Type | # Households | Median Income |
| Owner-Occupied | 306 (100.0%) | $83,295 |
| Renter-Occupied | 0 (0.0%) | $0 |
| Average | 306 (100.0%) | $83,295 |
Occupancy by Householder Income Bracket in Sonoita
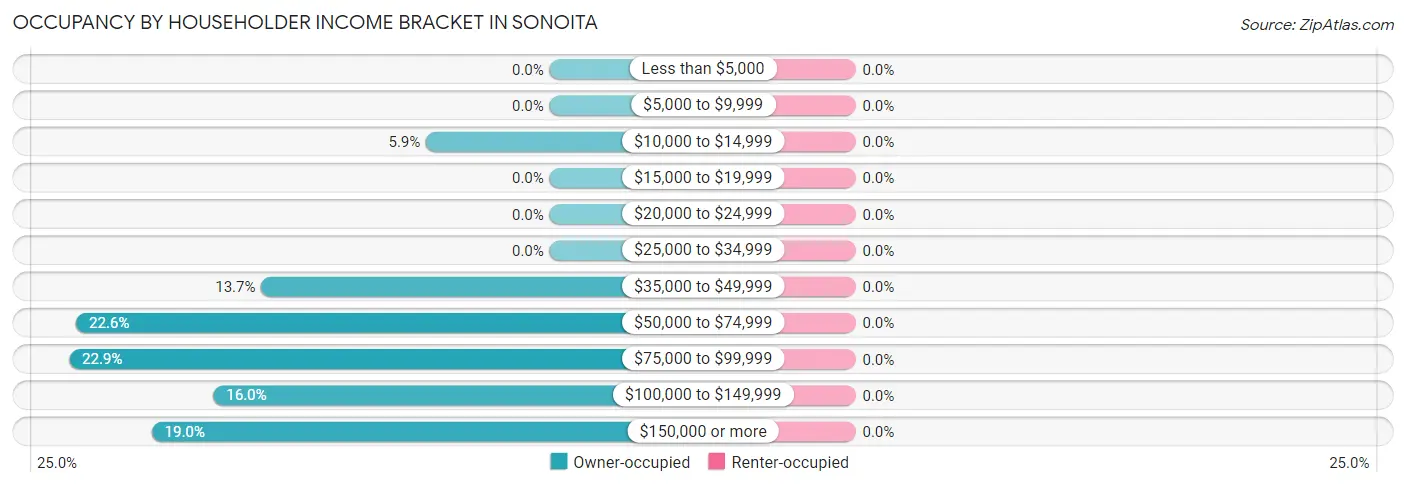
| Income Bracket | Owner-occupied | Renter-occupied |
| Less than $5,000 | 0 (0.0%) | 0 (0.0%) |
| $5,000 to $9,999 | 0 (0.0%) | 0 (0.0%) |
| $10,000 to $14,999 | 18 (5.9%) | 0 (0.0%) |
| $15,000 to $19,999 | 0 (0.0%) | 0 (0.0%) |
| $20,000 to $24,999 | 0 (0.0%) | 0 (0.0%) |
| $25,000 to $34,999 | 0 (0.0%) | 0 (0.0%) |
| $35,000 to $49,999 | 42 (13.7%) | 0 (0.0%) |
| $50,000 to $74,999 | 69 (22.6%) | 0 (0.0%) |
| $75,000 to $99,999 | 70 (22.9%) | 0 (0.0%) |
| $100,000 to $149,999 | 49 (16.0%) | 0 (0.0%) |
| $150,000 or more | 58 (19.0%) | 0 (0.0%) |
| Total | 306 (100.0%) | 0 (0.0%) |
Monthly Housing Cost Tiers in Sonoita
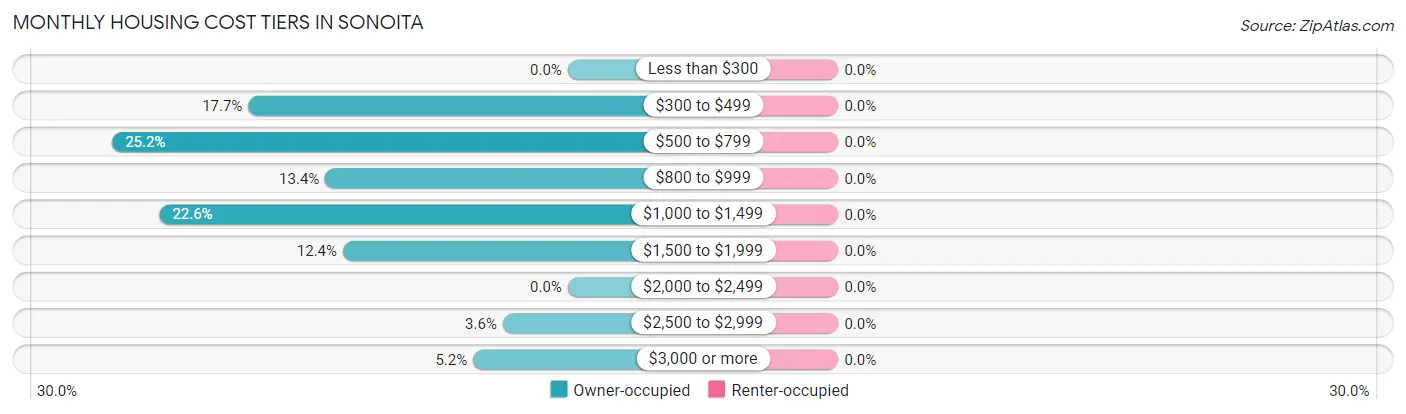
| Monthly Cost | Owner-occupied | Renter-occupied |
| Less than $300 | 0 (0.0%) | 0 (0.0%) |
| $300 to $499 | 54 (17.6%) | 0 (0.0%) |
| $500 to $799 | 77 (25.2%) | 0 (0.0%) |
| $800 to $999 | 41 (13.4%) | 0 (0.0%) |
| $1,000 to $1,499 | 69 (22.6%) | 0 (0.0%) |
| $1,500 to $1,999 | 38 (12.4%) | 0 (0.0%) |
| $2,000 to $2,499 | 0 (0.0%) | 0 (0.0%) |
| $2,500 to $2,999 | 11 (3.6%) | 0 (0.0%) |
| $3,000 or more | 16 (5.2%) | 0 (0.0%) |
| Total | 306 (100.0%) | 0 (0.0%) |
Physical Housing Characteristics in Sonoita
Housing Structures in Sonoita
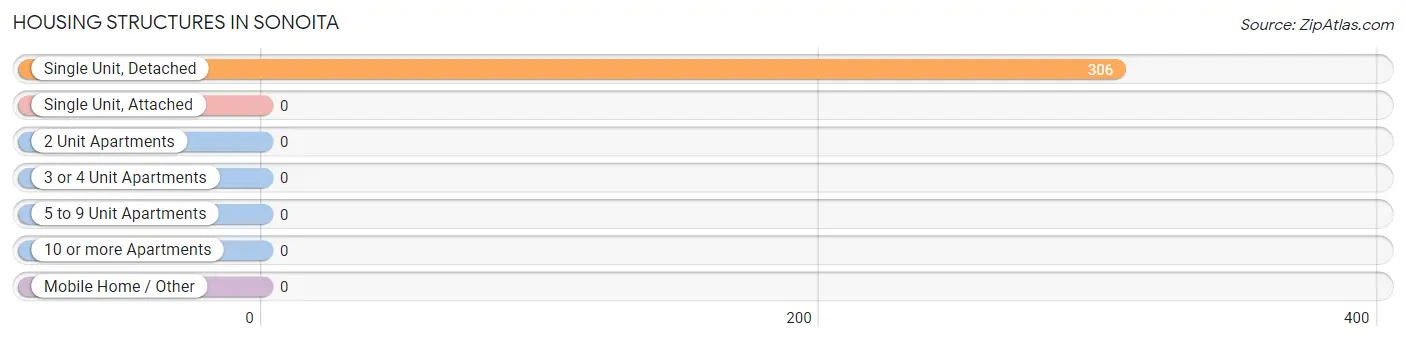
| Structure Type | # Housing Units | % Housing Units |
| Single Unit, Detached | 306 | 100.0% |
| Single Unit, Attached | 0 | 0.0% |
| 2 Unit Apartments | 0 | 0.0% |
| 3 or 4 Unit Apartments | 0 | 0.0% |
| 5 to 9 Unit Apartments | 0 | 0.0% |
| 10 or more Apartments | 0 | 0.0% |
| Mobile Home / Other | 0 | 0.0% |
| Total | 306 | 100.0% |
Housing Structures by Occupancy in Sonoita
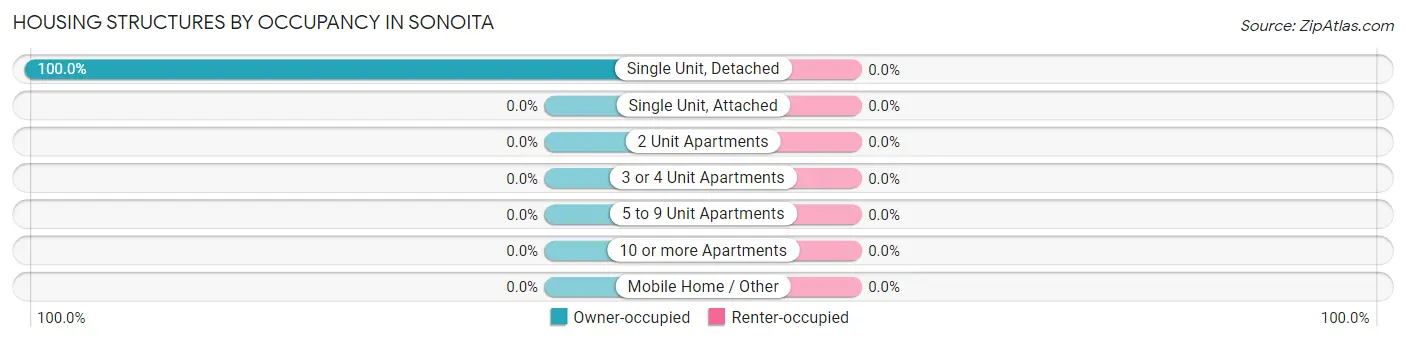
| Structure Type | Owner-occupied | Renter-occupied |
| Single Unit, Detached | 306 (100.0%) | 0 (0.0%) |
| Single Unit, Attached | 0 (0.0%) | 0 (0.0%) |
| 2 Unit Apartments | 0 (0.0%) | 0 (0.0%) |
| 3 or 4 Unit Apartments | 0 (0.0%) | 0 (0.0%) |
| 5 to 9 Unit Apartments | 0 (0.0%) | 0 (0.0%) |
| 10 or more Apartments | 0 (0.0%) | 0 (0.0%) |
| Mobile Home / Other | 0 (0.0%) | 0 (0.0%) |
| Total | 306 (100.0%) | 0 (0.0%) |
Housing Structures by Number of Rooms in Sonoita
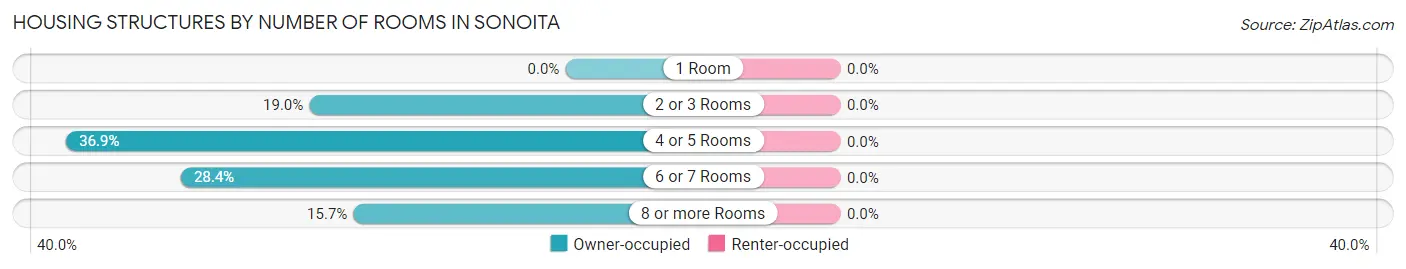
| Number of Rooms | Owner-occupied | Renter-occupied |
| 1 Room | 0 (0.0%) | 0 (0.0%) |
| 2 or 3 Rooms | 58 (19.0%) | 0 (0.0%) |
| 4 or 5 Rooms | 113 (36.9%) | 0 (0.0%) |
| 6 or 7 Rooms | 87 (28.4%) | 0 (0.0%) |
| 8 or more Rooms | 48 (15.7%) | 0 (0.0%) |
| Total | 306 (100.0%) | 0 (0.0%) |
Housing Structure by Heating Type in Sonoita
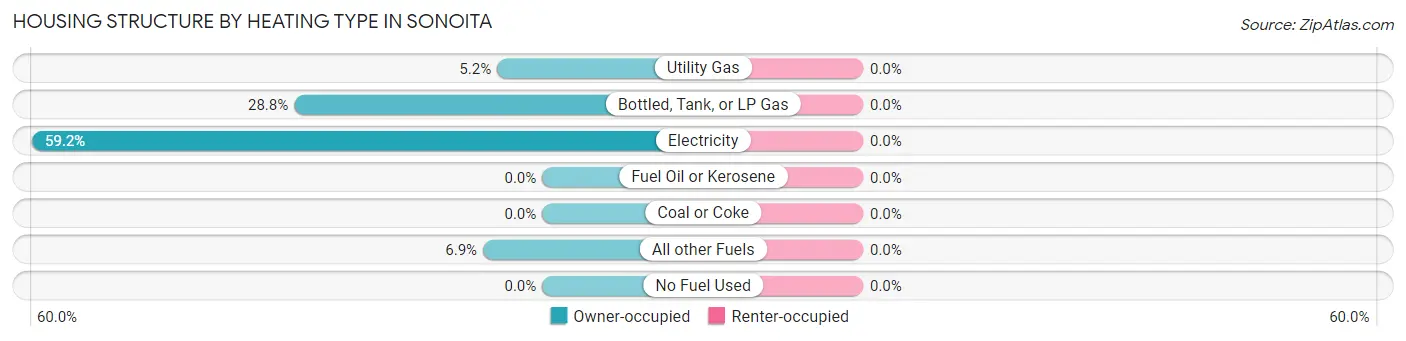
| Heating Type | Owner-occupied | Renter-occupied |
| Utility Gas | 16 (5.2%) | 0 (0.0%) |
| Bottled, Tank, or LP Gas | 88 (28.8%) | 0 (0.0%) |
| Electricity | 181 (59.2%) | 0 (0.0%) |
| Fuel Oil or Kerosene | 0 (0.0%) | 0 (0.0%) |
| Coal or Coke | 0 (0.0%) | 0 (0.0%) |
| All other Fuels | 21 (6.9%) | 0 (0.0%) |
| No Fuel Used | 0 (0.0%) | 0 (0.0%) |
| Total | 306 (100.0%) | 0 (0.0%) |
Household Vehicle Usage in Sonoita
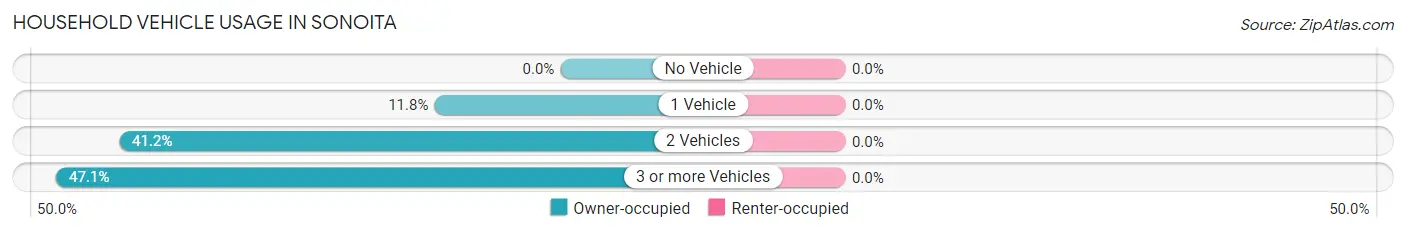
| Vehicles per Household | Owner-occupied | Renter-occupied |
| No Vehicle | 0 (0.0%) | 0 (0.0%) |
| 1 Vehicle | 36 (11.8%) | 0 (0.0%) |
| 2 Vehicles | 126 (41.2%) | 0 (0.0%) |
| 3 or more Vehicles | 144 (47.1%) | 0 (0.0%) |
| Total | 306 (100.0%) | 0 (0.0%) |
Real Estate & Mortgages in Sonoita
Real Estate and Mortgage Overview in Sonoita
| Characteristic | Without Mortgage | With Mortgage |
| Housing Units | 163 | 143 |
| Median Property Value | $357,700 | $386,800 |
| Median Household Income | $130,256 | $16 |
| Monthly Housing Costs | $574 | $16 |
| Real Estate Taxes | $3,426 | $0 |
Property Value by Mortgage Status in Sonoita
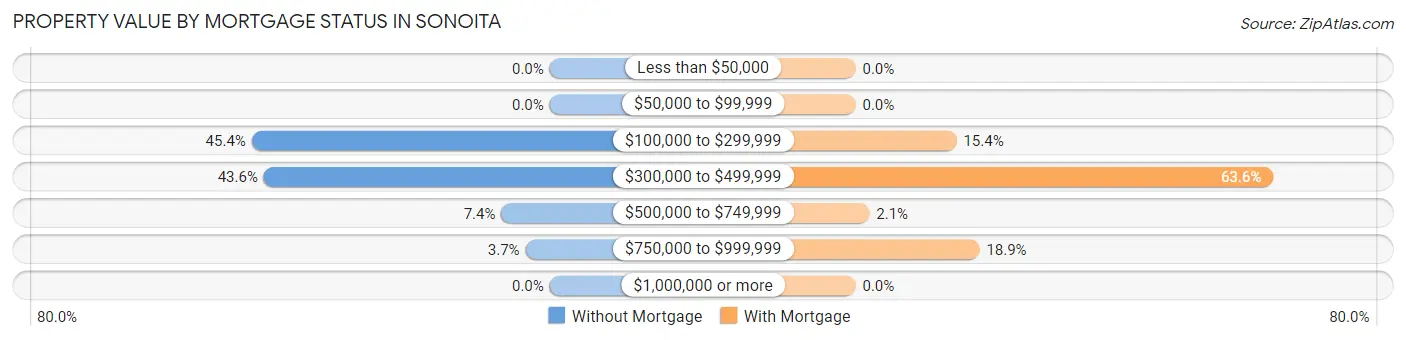
| Property Value | Without Mortgage | With Mortgage |
| Less than $50,000 | 0 (0.0%) | 0 (0.0%) |
| $50,000 to $99,999 | 0 (0.0%) | 0 (0.0%) |
| $100,000 to $299,999 | 74 (45.4%) | 22 (15.4%) |
| $300,000 to $499,999 | 71 (43.6%) | 91 (63.6%) |
| $500,000 to $749,999 | 12 (7.4%) | 3 (2.1%) |
| $750,000 to $999,999 | 6 (3.7%) | 27 (18.9%) |
| $1,000,000 or more | 0 (0.0%) | 0 (0.0%) |
| Total | 163 (100.0%) | 143 (100.0%) |
Household Income by Mortgage Status in Sonoita
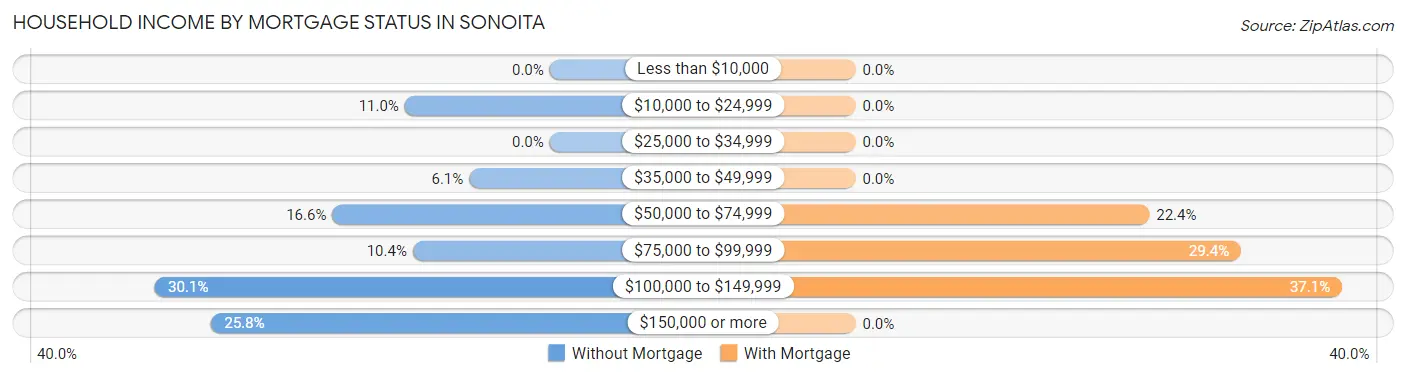
| Household Income | Without Mortgage | With Mortgage |
| Less than $10,000 | 0 (0.0%) | 0 (0.0%) |
| $10,000 to $24,999 | 18 (11.0%) | 0 (0.0%) |
| $25,000 to $34,999 | 0 (0.0%) | 0 (0.0%) |
| $35,000 to $49,999 | 10 (6.1%) | 0 (0.0%) |
| $50,000 to $74,999 | 27 (16.6%) | 32 (22.4%) |
| $75,000 to $99,999 | 17 (10.4%) | 42 (29.4%) |
| $100,000 to $149,999 | 49 (30.1%) | 53 (37.1%) |
| $150,000 or more | 42 (25.8%) | 0 (0.0%) |
| Total | 163 (100.0%) | 143 (100.0%) |
Property Value to Household Income Ratio in Sonoita
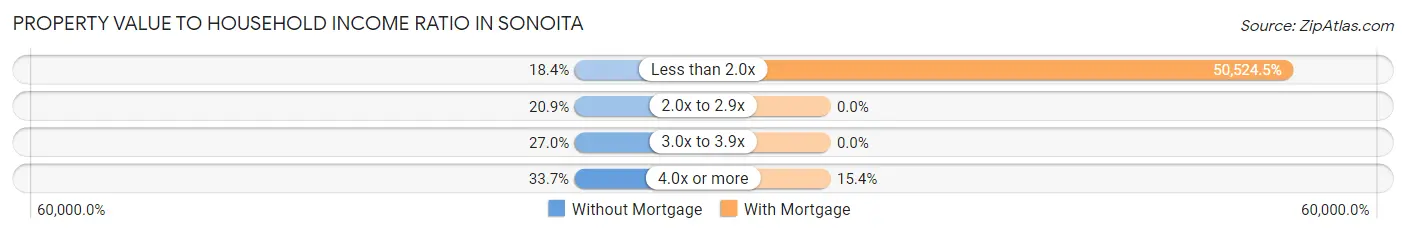
| Value-to-Income Ratio | Without Mortgage | With Mortgage |
| Less than 2.0x | 30 (18.4%) | 72,250 (50,524.5%) |
| 2.0x to 2.9x | 34 (20.9%) | 0 (0.0%) |
| 3.0x to 3.9x | 44 (27.0%) | 0 (0.0%) |
| 4.0x or more | 55 (33.7%) | 22 (15.4%) |
| Total | 163 (100.0%) | 143 (100.0%) |
Real Estate Taxes by Mortgage Status in Sonoita
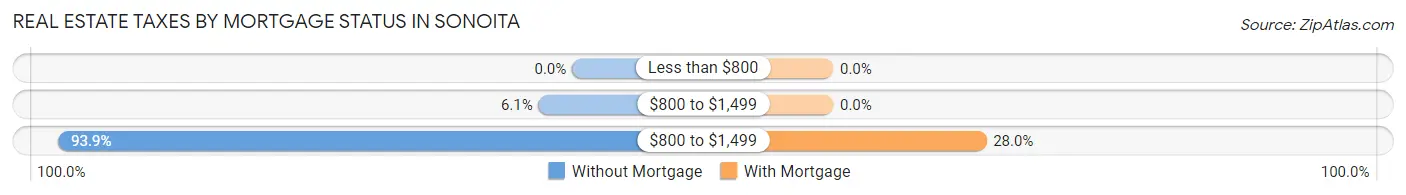
| Property Taxes | Without Mortgage | With Mortgage |
| Less than $800 | 0 (0.0%) | 0 (0.0%) |
| $800 to $1,499 | 10 (6.1%) | 0 (0.0%) |
| $800 to $1,499 | 153 (93.9%) | 40 (28.0%) |
| Total | 163 (100.0%) | 143 (100.0%) |
Health & Disability in Sonoita
Health Insurance Coverage by Age in Sonoita
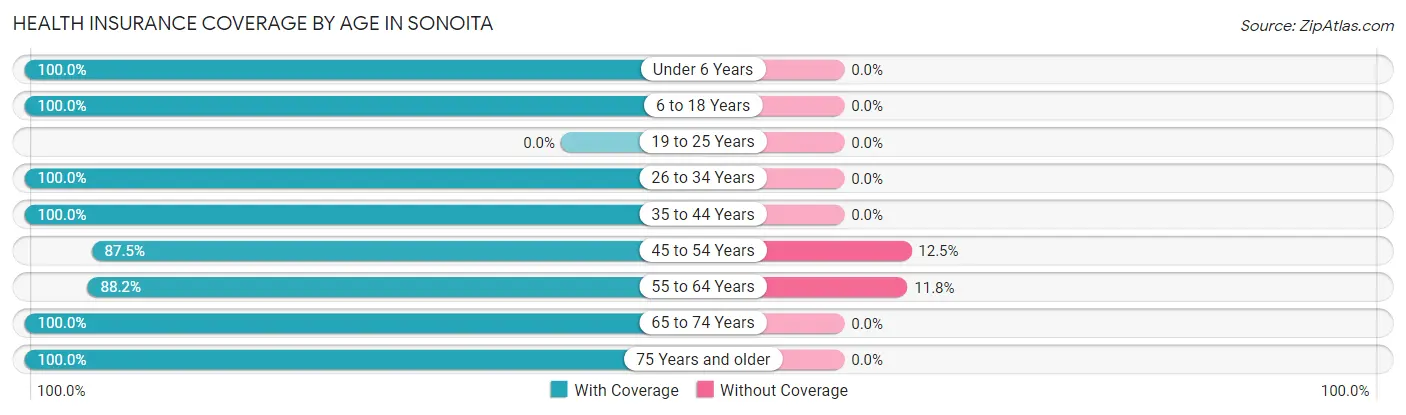
| Age Bracket | With Coverage | Without Coverage |
| Under 6 Years | 24 (100.0%) | 0 (0.0%) |
| 6 to 18 Years | 63 (100.0%) | 0 (0.0%) |
| 19 to 25 Years | 0 (0.0%) | 0 (0.0%) |
| 26 to 34 Years | 48 (100.0%) | 0 (0.0%) |
| 35 to 44 Years | 18 (100.0%) | 0 (0.0%) |
| 45 to 54 Years | 70 (87.5%) | 10 (12.5%) |
| 55 to 64 Years | 105 (88.2%) | 14 (11.8%) |
| 65 to 74 Years | 199 (100.0%) | 0 (0.0%) |
| 75 Years and older | 190 (100.0%) | 0 (0.0%) |
| Total | 717 (96.8%) | 24 (3.2%) |
Health Insurance Coverage by Citizenship Status in Sonoita
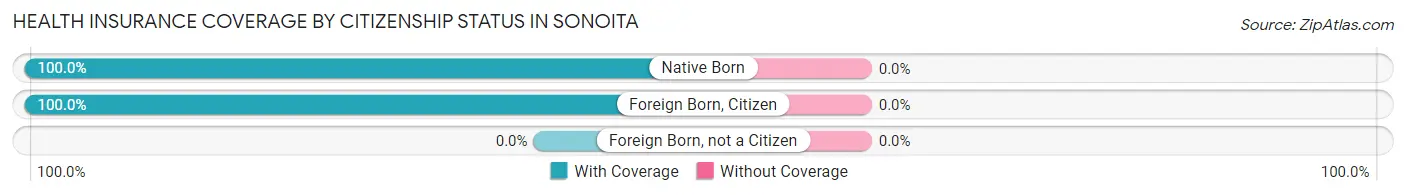
| Citizenship Status | With Coverage | Without Coverage |
| Native Born | 24 (100.0%) | 0 (0.0%) |
| Foreign Born, Citizen | 63 (100.0%) | 0 (0.0%) |
| Foreign Born, not a Citizen | 0 (0.0%) | 0 (0.0%) |
Health Insurance Coverage by Household Income in Sonoita
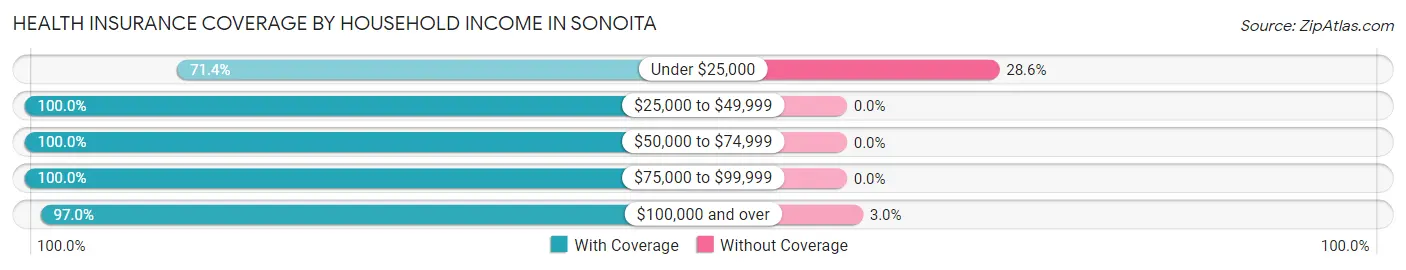
| Household Income | With Coverage | Without Coverage |
| Under $25,000 | 35 (71.4%) | 14 (28.6%) |
| $25,000 to $49,999 | 77 (100.0%) | 0 (0.0%) |
| $50,000 to $74,999 | 142 (100.0%) | 0 (0.0%) |
| $75,000 to $99,999 | 138 (100.0%) | 0 (0.0%) |
| $100,000 and over | 325 (97.0%) | 10 (3.0%) |
Public vs Private Health Insurance Coverage by Age in Sonoita
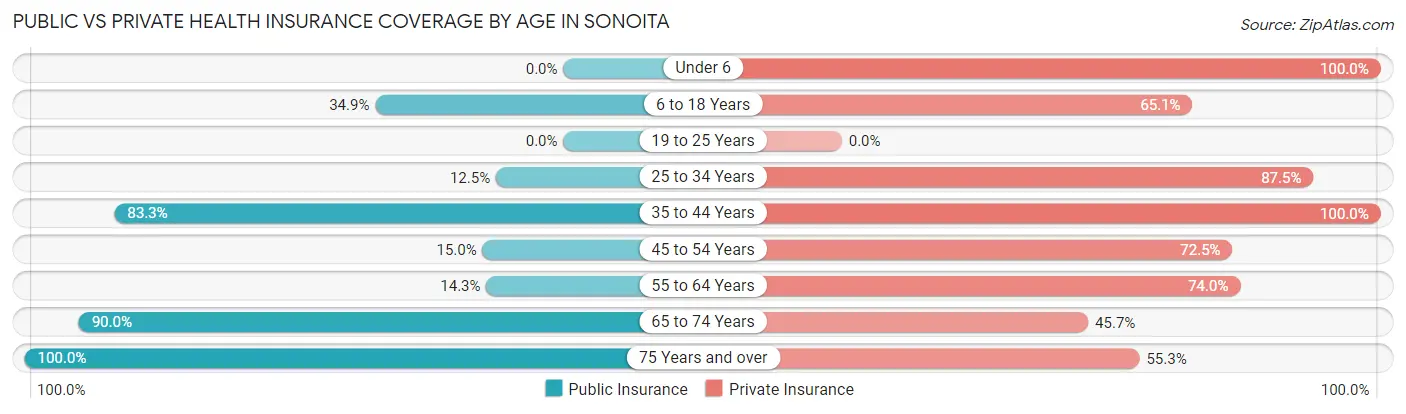
| Age Bracket | Public Insurance | Private Insurance |
| Under 6 | 0 (0.0%) | 24 (100.0%) |
| 6 to 18 Years | 22 (34.9%) | 41 (65.1%) |
| 19 to 25 Years | 0 (0.0%) | 0 (0.0%) |
| 25 to 34 Years | 6 (12.5%) | 42 (87.5%) |
| 35 to 44 Years | 15 (83.3%) | 18 (100.0%) |
| 45 to 54 Years | 12 (15.0%) | 58 (72.5%) |
| 55 to 64 Years | 17 (14.3%) | 88 (74.0%) |
| 65 to 74 Years | 179 (89.9%) | 91 (45.7%) |
| 75 Years and over | 190 (100.0%) | 105 (55.3%) |
| Total | 441 (59.5%) | 467 (63.0%) |
Disability Status by Sex by Age in Sonoita
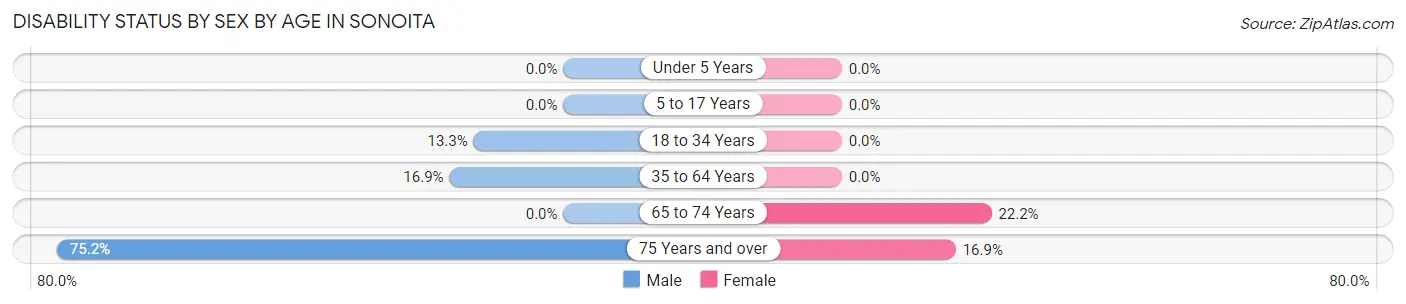
| Age Bracket | Male | Female |
| Under 5 Years | 0 (0.0%) | 0 (0.0%) |
| 5 to 17 Years | 0 (0.0%) | 0 (0.0%) |
| 18 to 34 Years | 6 (13.3%) | 0 (0.0%) |
| 35 to 64 Years | 22 (16.9%) | 0 (0.0%) |
| 65 to 74 Years | 0 (0.0%) | 26 (22.2%) |
| 75 Years and over | 94 (75.2%) | 11 (16.9%) |
Disability Class by Sex by Age in Sonoita
Disability Class: Hearing Difficulty
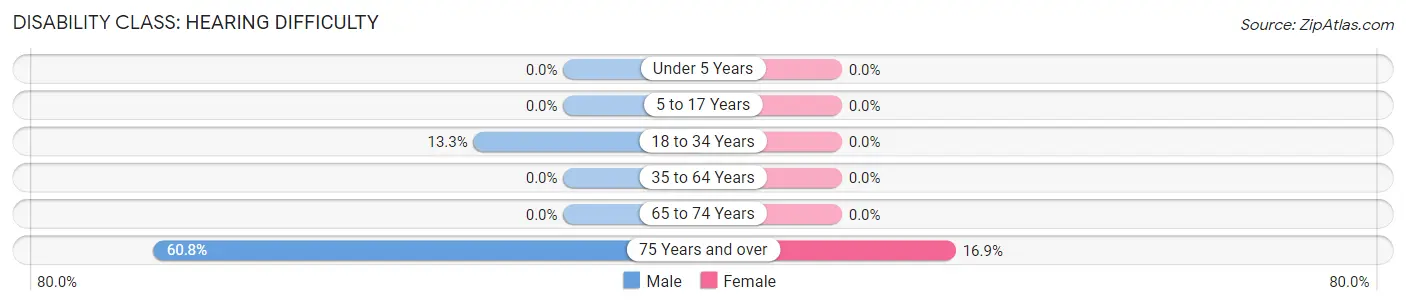
| Age Bracket | Male | Female |
| Under 5 Years | 0 (0.0%) | 0 (0.0%) |
| 5 to 17 Years | 0 (0.0%) | 0 (0.0%) |
| 18 to 34 Years | 6 (13.3%) | 0 (0.0%) |
| 35 to 64 Years | 0 (0.0%) | 0 (0.0%) |
| 65 to 74 Years | 0 (0.0%) | 0 (0.0%) |
| 75 Years and over | 76 (60.8%) | 11 (16.9%) |
Disability Class: Vision Difficulty
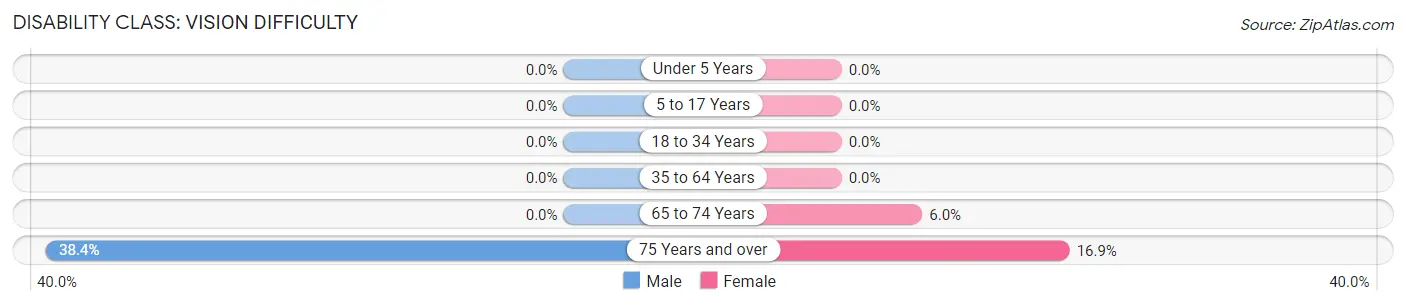
| Age Bracket | Male | Female |
| Under 5 Years | 0 (0.0%) | 0 (0.0%) |
| 5 to 17 Years | 0 (0.0%) | 0 (0.0%) |
| 18 to 34 Years | 0 (0.0%) | 0 (0.0%) |
| 35 to 64 Years | 0 (0.0%) | 0 (0.0%) |
| 65 to 74 Years | 0 (0.0%) | 7 (6.0%) |
| 75 Years and over | 48 (38.4%) | 11 (16.9%) |
Disability Class: Cognitive Difficulty
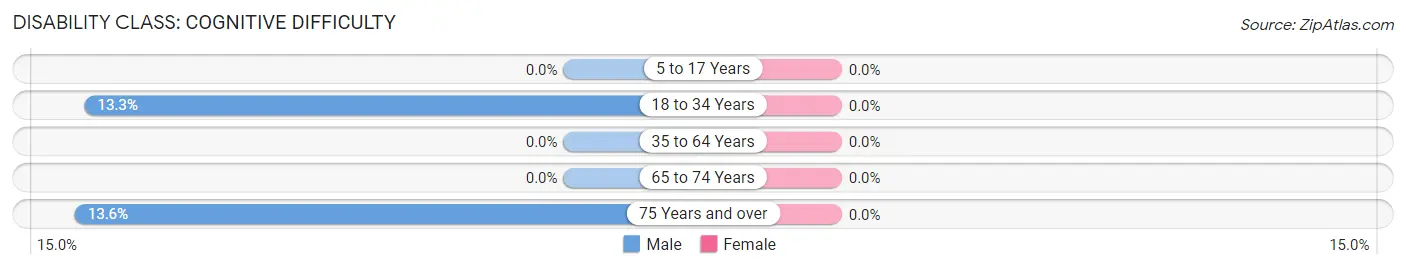
| Age Bracket | Male | Female |
| 5 to 17 Years | 0 (0.0%) | 0 (0.0%) |
| 18 to 34 Years | 6 (13.3%) | 0 (0.0%) |
| 35 to 64 Years | 0 (0.0%) | 0 (0.0%) |
| 65 to 74 Years | 0 (0.0%) | 0 (0.0%) |
| 75 Years and over | 17 (13.6%) | 0 (0.0%) |
Disability Class: Ambulatory Difficulty
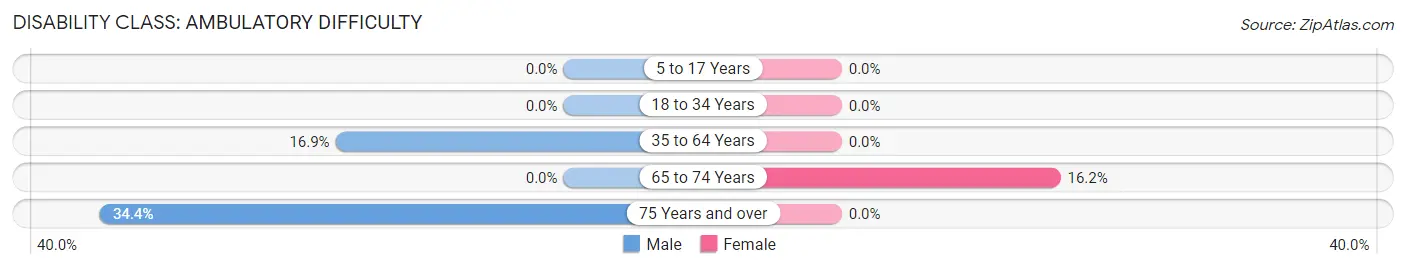
| Age Bracket | Male | Female |
| 5 to 17 Years | 0 (0.0%) | 0 (0.0%) |
| 18 to 34 Years | 0 (0.0%) | 0 (0.0%) |
| 35 to 64 Years | 22 (16.9%) | 0 (0.0%) |
| 65 to 74 Years | 0 (0.0%) | 19 (16.2%) |
| 75 Years and over | 43 (34.4%) | 0 (0.0%) |
Disability Class: Self-Care Difficulty
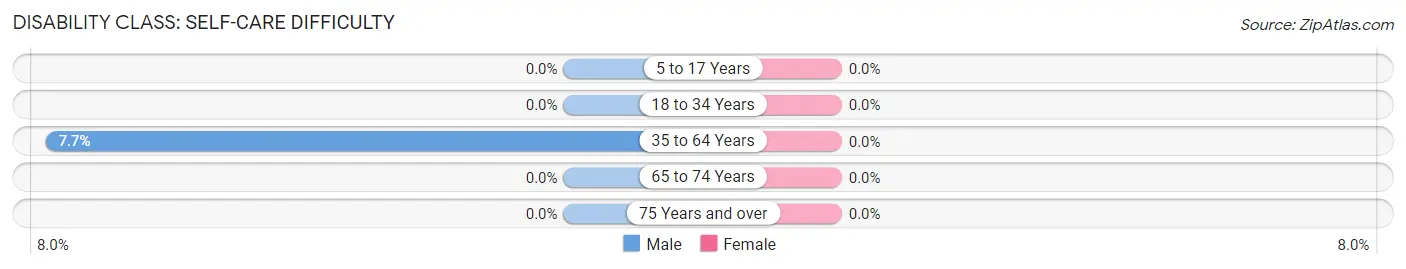
| Age Bracket | Male | Female |
| 5 to 17 Years | 0 (0.0%) | 0 (0.0%) |
| 18 to 34 Years | 0 (0.0%) | 0 (0.0%) |
| 35 to 64 Years | 10 (7.7%) | 0 (0.0%) |
| 65 to 74 Years | 0 (0.0%) | 0 (0.0%) |
| 75 Years and over | 0 (0.0%) | 0 (0.0%) |
Technology Access in Sonoita
Computing Device Access in Sonoita
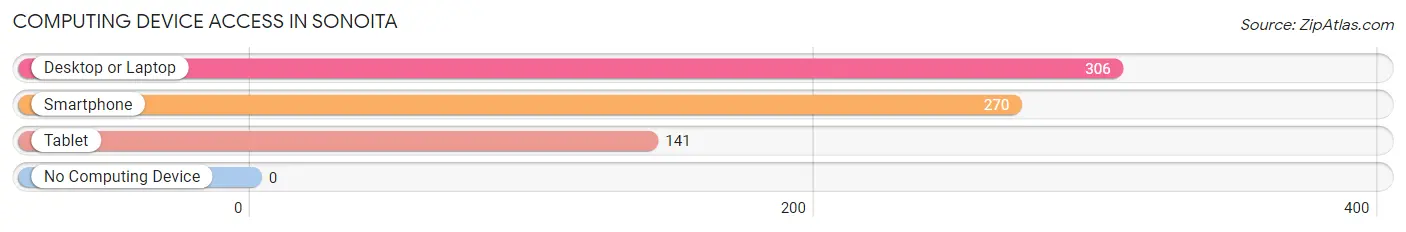
| Device Type | # Households | % Households |
| Desktop or Laptop | 306 | 100.0% |
| Smartphone | 270 | 88.2% |
| Tablet | 141 | 46.1% |
| No Computing Device | 0 | 0.0% |
| Total | 306 | 100.0% |
Internet Access in Sonoita
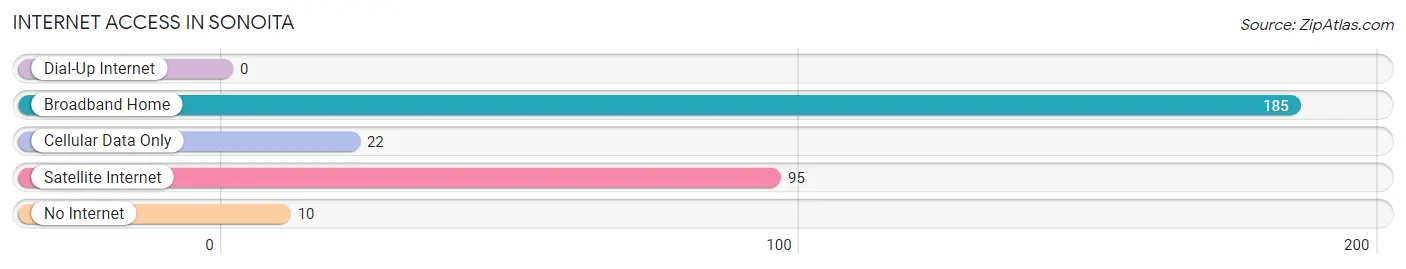
| Internet Type | # Households | % Households |
| Dial-Up Internet | 0 | 0.0% |
| Broadband Home | 185 | 60.5% |
| Cellular Data Only | 22 | 7.2% |
| Satellite Internet | 95 | 31.0% |
| No Internet | 10 | 3.3% |
| Total | 306 | 100.0% |
Sonoita Summary
Sonoita is a small unincorporated community located in Santa Cruz County, Arizona. It is situated in the foothills of the Santa Rita Mountains, approximately 40 miles southeast of Tucson. The town is known for its wineries, vineyards, and ranches, and is a popular destination for tourists and outdoor enthusiasts.
History
The area around Sonoita was first inhabited by the Apache and Tohono O’odham tribes. The first European settlers arrived in the late 19th century, and the town was officially established in 1879. The name “Sonoita” is derived from the Spanish word for “little hill”.
In the early 20th century, the town was a popular stop on the Southern Pacific Railroad. The railroad brought in new settlers and businesses, and the town began to grow. In the 1920s, the area was known for its cattle ranches and horse breeding.
In the 1950s, the town began to attract tourists, and the first winery was established in the area. The winery, called the Sonoita Vineyards, is still in operation today.
Geography
Sonoita is located in the Sonoita Creek Valley, which is part of the Santa Cruz Valley. The town is situated at an elevation of 4,500 feet, and is surrounded by rolling hills and mountains. The area is known for its mild climate and abundant wildlife.
The town is located approximately 40 miles southeast of Tucson, and is accessible via State Route 83. The nearest major cities are Tucson, Nogales, and Sierra Vista.
Economy
The economy of Sonoita is largely based on tourism and agriculture. The town is home to several wineries and vineyards, and is a popular destination for wine tasting and outdoor activities.
The area is also known for its cattle ranches and horse breeding. The town is home to several horse ranches, and is a popular destination for horseback riding and other equestrian activities.
Demographics
As of the 2010 census, the population of Sonoita was 1,081. The racial makeup of the town was 94.3% White, 0.7% Native American, 0.3% Asian, 0.2% African American, and 4.5% from other races.
The median household income in Sonoita was $41,250, and the median family income was $45,000. The per capita income was $20,945. The town had a poverty rate of 11.3%.
Conclusion
Sonoita is a small unincorporated community located in Santa Cruz County, Arizona. It is situated in the foothills of the Santa Rita Mountains, and is known for its wineries, vineyards, and ranches. The town is a popular destination for tourists and outdoor enthusiasts, and is home to several wineries and horse ranches. The economy of Sonoita is largely based on tourism and agriculture, and the town has a population of 1,081 as of the 2010 census.
Common Questions
What is Per Capita Income in Sonoita?
Per Capita income in Sonoita is $39,980.
What is the Median Family Income in Sonoita?
Median Family Income in Sonoita is $76,250.
What is the Median Household income in Sonoita?
Median Household Income in Sonoita is $83,295.
What is Inequality or Gini Index in Sonoita?
Inequality or Gini Index in Sonoita is 0.33.
What is the Total Population of Sonoita?
Total Population of Sonoita is 741.
What is the Total Male Population of Sonoita?
Total Male Population of Sonoita is 420.
What is the Total Female Population of Sonoita?
Total Female Population of Sonoita is 321.
What is the Ratio of Males per 100 Females in Sonoita?
There are 130.84 Males per 100 Females in Sonoita.
What is the Ratio of Females per 100 Males in Sonoita?
There are 76.43 Females per 100 Males in Sonoita.
What is the Median Population Age in Sonoita?
Median Population Age in Sonoita is 65.6 Years.
What is the Average Family Size in Sonoita
Average Family Size in Sonoita is 2.6 People.
What is the Average Household Size in Sonoita
Average Household Size in Sonoita is 2.4 People.
How Large is the Labor Force in Sonoita?
There are 204 People in the Labor Forcein in Sonoita.
What is the Percentage of People in the Labor Force in Sonoita?
30.6% of People are in the Labor Force in Sonoita.
What is the Unemployment Rate in Sonoita?
Unemployment Rate in Sonoita is 16.2%.