Sawmill, AZ Map & Demographics
Sawmill Map
Sawmill Overview
$13,088
PER CAPITA INCOME
$36,667
AVG FAMILY INCOME
$31,875
AVG HOUSEHOLD INCOME
$16,590
FAMILY INCOME DEFICIT
0.54
INEQUALITY / GINI INDEX
794
TOTAL POPULATION
389
MALE POPULATION
405
FEMALE POPULATION
96.05
MALES / 100 FEMALES
104.11
FEMALES / 100 MALES
28.0
MEDIAN AGE
5.8
AVG FAMILY SIZE
4.6
AVG HOUSEHOLD SIZE
229
LABOR FORCE [ PEOPLE ]
36.2%
PERCENT IN LABOR FORCE
24.9%
UNEMPLOYMENT RATE
Income in Sawmill
Income Overview in Sawmill
Per Capita Income in Sawmill is $13,088, while median incomes of families and households are $36,667 and $31,875 respectively.
| Characteristic | Number | Measure |
| Per Capita Income | 794 | $13,088 |
| Median Family Income | 128 | $36,667 |
| Mean Family Income | 128 | $53,820 |
| Median Household Income | 171 | $31,875 |
| Mean Household Income | 171 | $47,118 |
| Income Deficit | 128 | $16,590 |
| Wage / Income Gap (%) | 794 | 0.00% |
| Wage / Income Gap ($) | 794 | 100.00¢ per $1 |
| Gini / Inequality Index | 794 | 0.54 |
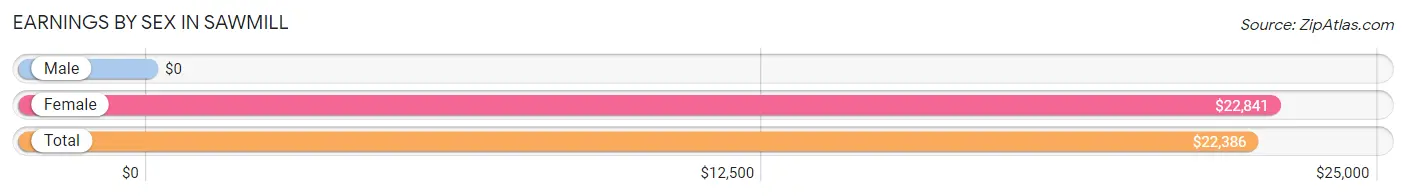
Earnings by Sex in Sawmill
| Sex | Number | Average Earnings |
| Male | 119 (52.2%) | $0 |
| Female | 109 (47.8%) | $22,841 |
| Total | 228 (100.0%) | $22,386 |
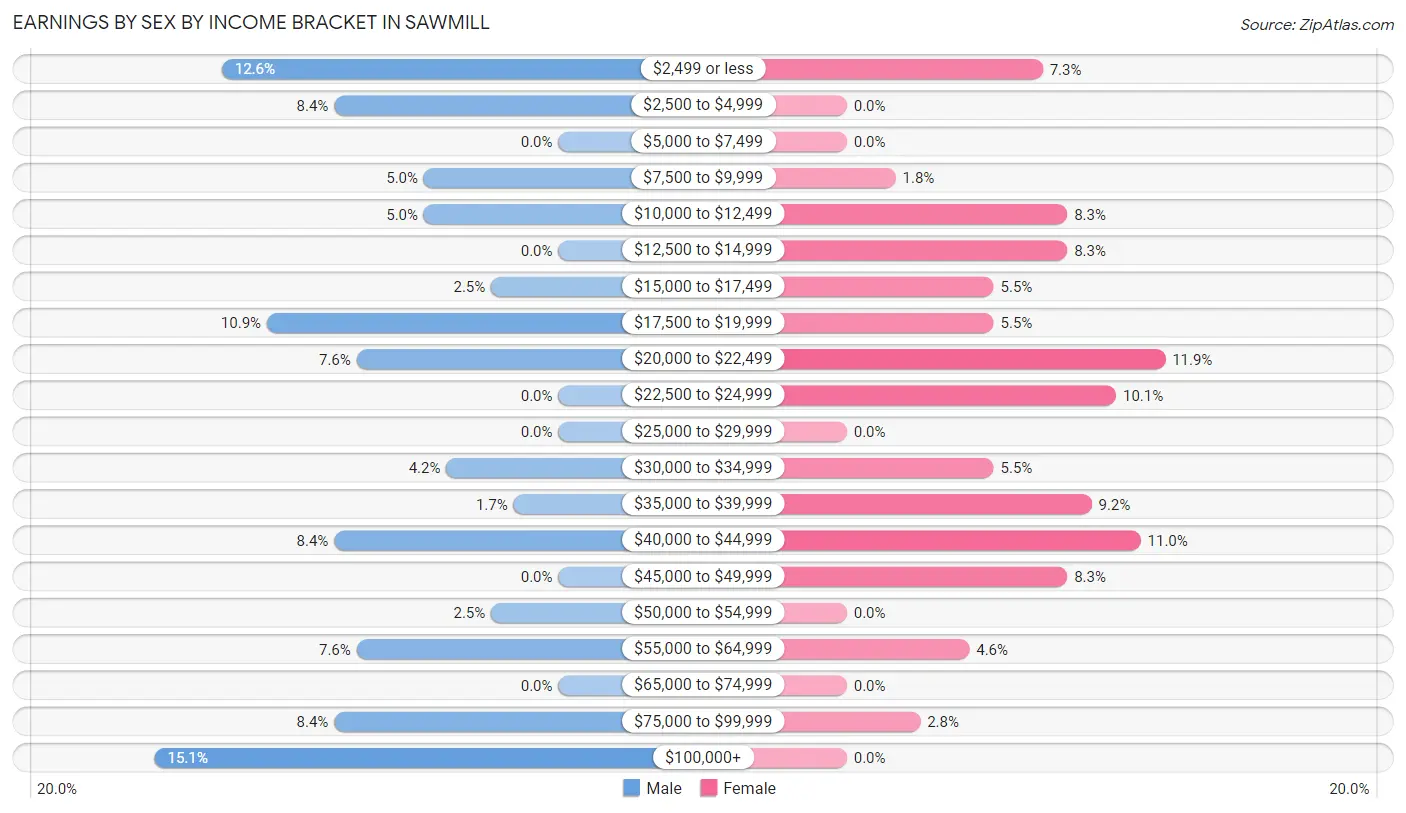
Earnings by Sex by Income Bracket in Sawmill
The most common earnings brackets in Sawmill are $100,000+ for men (18 | 15.1%) and $20,000 to $22,499 for women (13 | 11.9%).
| Income | Male | Female |
| $2,499 or less | 15 (12.6%) | 8 (7.3%) |
| $2,500 to $4,999 | 10 (8.4%) | 0 (0.0%) |
| $5,000 to $7,499 | 0 (0.0%) | 0 (0.0%) |
| $7,500 to $9,999 | 6 (5.0%) | 2 (1.8%) |
| $10,000 to $12,499 | 6 (5.0%) | 9 (8.3%) |
| $12,500 to $14,999 | 0 (0.0%) | 9 (8.3%) |
| $15,000 to $17,499 | 3 (2.5%) | 6 (5.5%) |
| $17,500 to $19,999 | 13 (10.9%) | 6 (5.5%) |
| $20,000 to $22,499 | 9 (7.6%) | 13 (11.9%) |
| $22,500 to $24,999 | 0 (0.0%) | 11 (10.1%) |
| $25,000 to $29,999 | 0 (0.0%) | 0 (0.0%) |
| $30,000 to $34,999 | 5 (4.2%) | 6 (5.5%) |
| $35,000 to $39,999 | 2 (1.7%) | 10 (9.2%) |
| $40,000 to $44,999 | 10 (8.4%) | 12 (11.0%) |
| $45,000 to $49,999 | 0 (0.0%) | 9 (8.3%) |
| $50,000 to $54,999 | 3 (2.5%) | 0 (0.0%) |
| $55,000 to $64,999 | 9 (7.6%) | 5 (4.6%) |
| $65,000 to $74,999 | 0 (0.0%) | 0 (0.0%) |
| $75,000 to $99,999 | 10 (8.4%) | 3 (2.8%) |
| $100,000+ | 18 (15.1%) | 0 (0.0%) |
| Total | 119 (100.0%) | 109 (100.0%) |
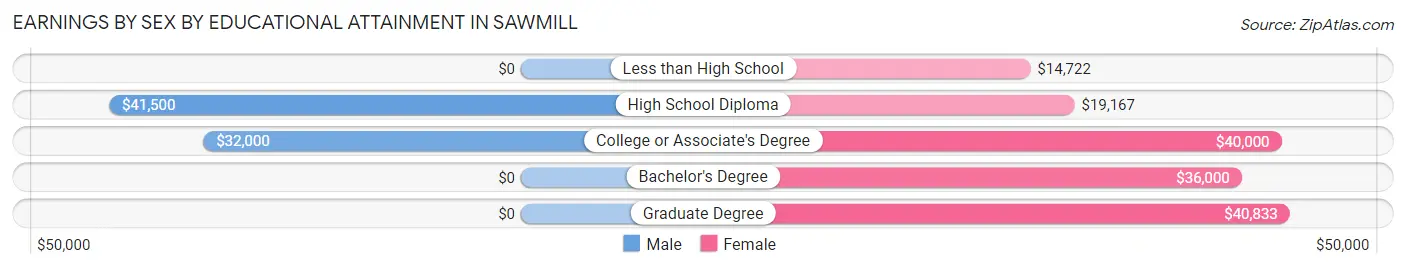
Earnings by Sex by Educational Attainment in Sawmill
Average earnings in Sawmill are $31,250 for men and $23,409 for women, a difference of 25.1%. Men with an educational attainment of high school diploma enjoy the highest average annual earnings of $41,500, while those with college or associate's degree education earn the least with $32,000. Women with an educational attainment of graduate degree earn the most with the average annual earnings of $40,833, while those with less than high school education have the smallest earnings of $14,722.
| Educational Attainment | Male Income | Female Income |
| Less than High School | - | - |
| High School Diploma | $41,500 | $19,167 |
| College or Associate's Degree | $32,000 | $40,000 |
| Bachelor's Degree | - | - |
| Graduate Degree | - | - |
| Total | $31,250 | $23,409 |
Family Income in Sawmill
Family Income Brackets in Sawmill
According to the Sawmill family income data, there are 24 families falling into the $100,000 to $149,999 income range, which is the most common income bracket and makes up 18.8% of all families.
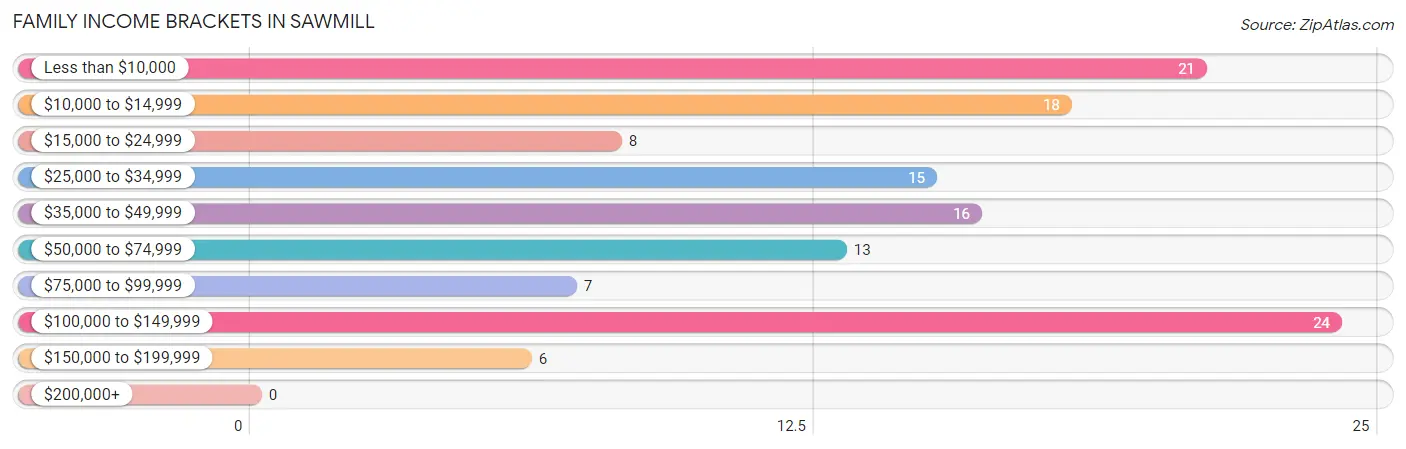
| Income Bracket | # Families | % Families |
| Less than $10,000 | 21 | 16.4% |
| $10,000 to $14,999 | 18 | 14.1% |
| $15,000 to $24,999 | 8 | 6.3% |
| $25,000 to $34,999 | 15 | 11.7% |
| $35,000 to $49,999 | 16 | 12.5% |
| $50,000 to $74,999 | 13 | 10.2% |
| $75,000 to $99,999 | 7 | 5.5% |
| $100,000 to $149,999 | 24 | 18.8% |
| $150,000 to $199,999 | 6 | 4.7% |
| $200,000+ | 0 | 0.0% |
Family Income by Famaliy Size in Sawmill
3-person families (42 | 32.8%) account for the highest median family income in Sawmill with $34,286 per family, while 2-person families (23 | 18.0%) have the highest median income of $14,062 per family member.
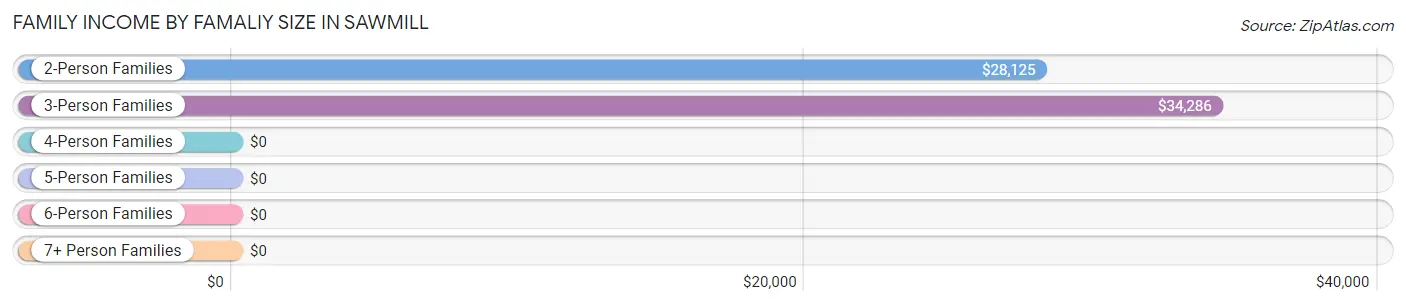
| Income Bracket | # Families | Median Income |
| 2-Person Families | 23 (18.0%) | $28,125 |
| 3-Person Families | 42 (32.8%) | $34,286 |
| 4-Person Families | 28 (21.9%) | $0 |
| 5-Person Families | 13 (10.2%) | $0 |
| 6-Person Families | 14 (10.9%) | $0 |
| 7+ Person Families | 8 (6.2%) | $0 |
| Total | 128 (100.0%) | $36,667 |
Family Income by Number of Earners in Sawmill
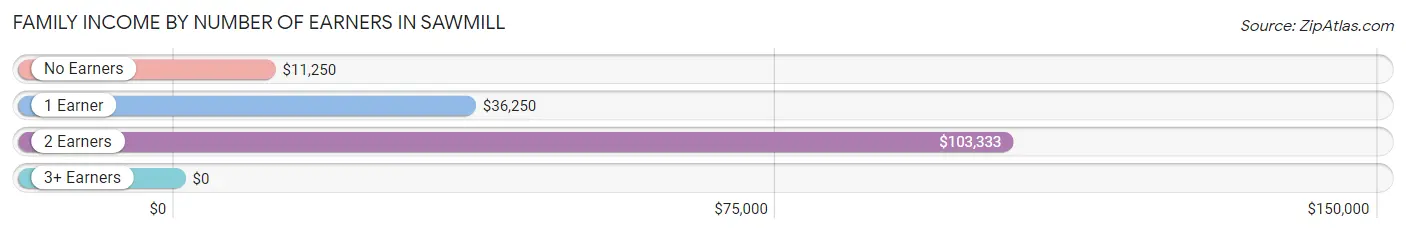
| Number of Earners | # Families | Median Income |
| No Earners | 36 (28.1%) | $11,250 |
| 1 Earner | 50 (39.1%) | $36,250 |
| 2 Earners | 36 (28.1%) | $103,333 |
| 3+ Earners | 6 (4.7%) | $0 |
| Total | 128 (100.0%) | $36,667 |
Household Income in Sawmill
Household Income Brackets in Sawmill
With 39 households falling in the category, the less than $10,000 income range is the most frequent in Sawmill, accounting for 22.8% of all households.
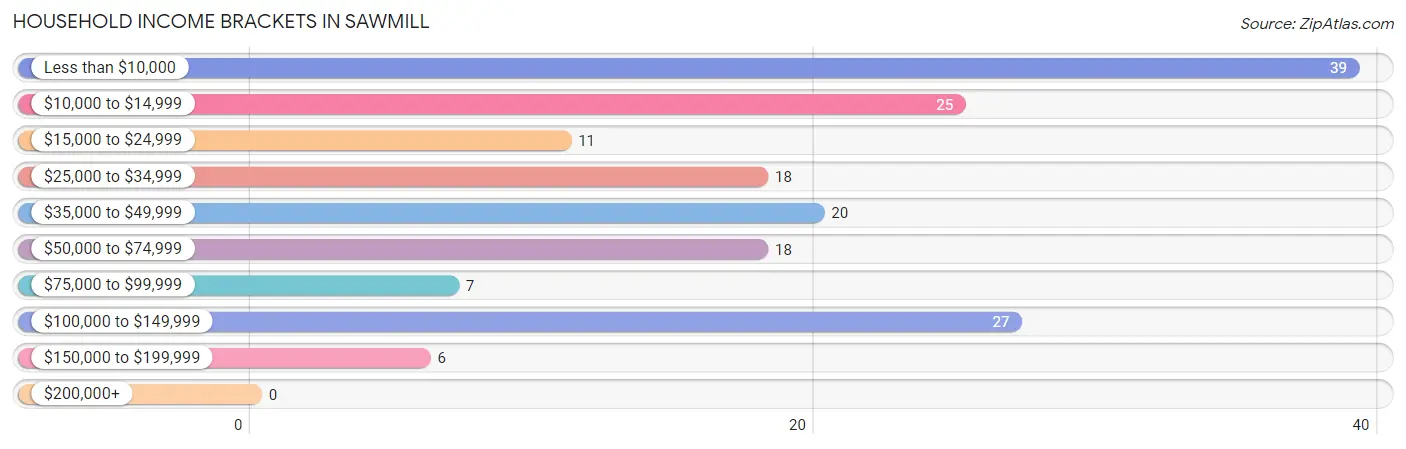
| Income Bracket | # Households | % Households |
| Less than $10,000 | 39 | 22.8% |
| $10,000 to $14,999 | 25 | 14.6% |
| $15,000 to $24,999 | 11 | 6.4% |
| $25,000 to $34,999 | 18 | 10.5% |
| $35,000 to $49,999 | 20 | 11.7% |
| $50,000 to $74,999 | 18 | 10.5% |
| $75,000 to $99,999 | 7 | 4.1% |
| $100,000 to $149,999 | 27 | 15.8% |
| $150,000 to $199,999 | 6 | 3.5% |
| $200,000+ | 0 | 0.0% |
Household Income by Householder Age in Sawmill
The median household income in Sawmill is $31,875, with the highest median household income of $36,667 found in the 65+ years age bracket for the primary householder. A total of 42 households (24.6%) fall into this category.
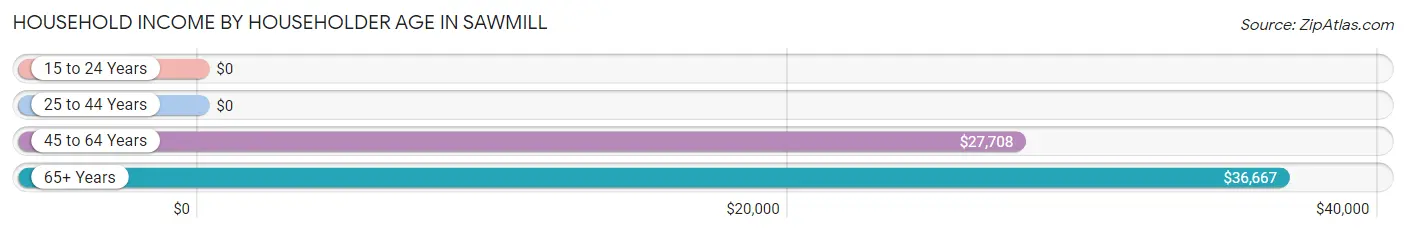
| Income Bracket | # Households | Median Income |
| 15 to 24 Years | 0 (0.0%) | $0 |
| 25 to 44 Years | 34 (19.9%) | $0 |
| 45 to 64 Years | 95 (55.6%) | $27,708 |
| 65+ Years | 42 (24.6%) | $36,667 |
| Total | 171 (100.0%) | $31,875 |
Poverty in Sawmill
Income Below Poverty by Sex and Age in Sawmill
With 38.6% poverty level for males and 38.0% for females among the residents of Sawmill, 15 year old males and under 5 year old females are the most vulnerable to poverty, with 3 males (100.0%) and 14 females (100.0%) in their respective age groups living below the poverty level.
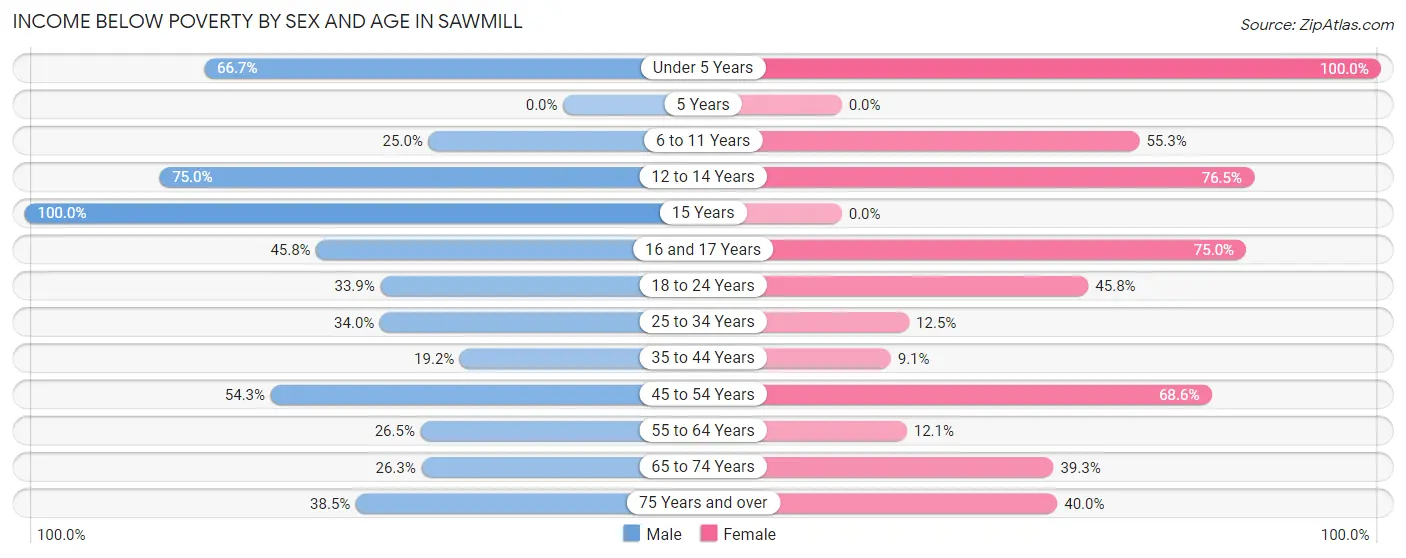
| Age Bracket | Male | Female |
| Under 5 Years | 14 (66.7%) | 14 (100.0%) |
| 5 Years | 0 (0.0%) | 0 (0.0%) |
| 6 to 11 Years | 8 (25.0%) | 21 (55.3%) |
| 12 to 14 Years | 12 (75.0%) | 13 (76.5%) |
| 15 Years | 3 (100.0%) | 0 (0.0%) |
| 16 and 17 Years | 11 (45.8%) | 12 (75.0%) |
| 18 to 24 Years | 19 (33.9%) | 38 (45.8%) |
| 25 to 34 Years | 17 (34.0%) | 7 (12.5%) |
| 35 to 44 Years | 9 (19.2%) | 3 (9.1%) |
| 45 to 54 Years | 38 (54.3%) | 24 (68.6%) |
| 55 to 64 Years | 9 (26.5%) | 7 (12.1%) |
| 65 to 74 Years | 5 (26.3%) | 11 (39.3%) |
| 75 Years and over | 5 (38.5%) | 4 (40.0%) |
| Total | 150 (38.6%) | 154 (38.0%) |
Income Above Poverty by Sex and Age in Sawmill
According to the poverty statistics in Sawmill, males aged 5 years and females aged 5 years are the age groups that are most secure financially, with 100.0% of males and 100.0% of females in these age groups living above the poverty line.
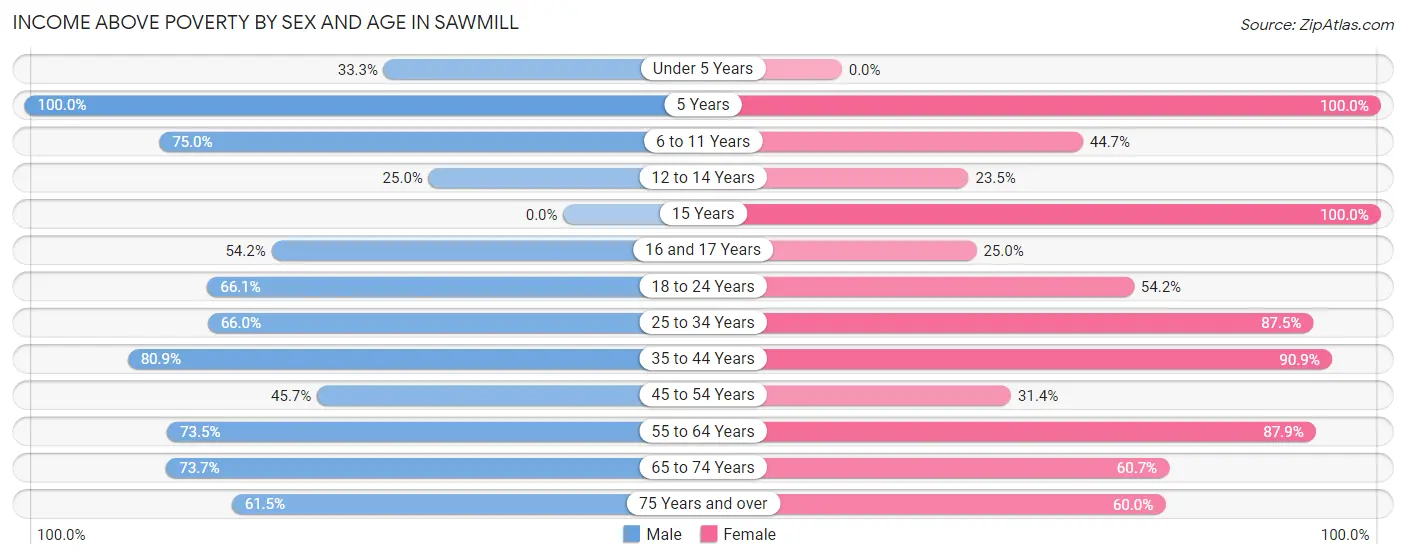
| Age Bracket | Male | Female |
| Under 5 Years | 7 (33.3%) | 0 (0.0%) |
| 5 Years | 4 (100.0%) | 5 (100.0%) |
| 6 to 11 Years | 24 (75.0%) | 17 (44.7%) |
| 12 to 14 Years | 4 (25.0%) | 4 (23.5%) |
| 15 Years | 0 (0.0%) | 12 (100.0%) |
| 16 and 17 Years | 13 (54.2%) | 4 (25.0%) |
| 18 to 24 Years | 37 (66.1%) | 45 (54.2%) |
| 25 to 34 Years | 33 (66.0%) | 49 (87.5%) |
| 35 to 44 Years | 38 (80.8%) | 30 (90.9%) |
| 45 to 54 Years | 32 (45.7%) | 11 (31.4%) |
| 55 to 64 Years | 25 (73.5%) | 51 (87.9%) |
| 65 to 74 Years | 14 (73.7%) | 17 (60.7%) |
| 75 Years and over | 8 (61.5%) | 6 (60.0%) |
| Total | 239 (61.4%) | 251 (62.0%) |
Income Below Poverty Among Married-Couple Families in Sawmill
The poverty statistics for married-couple families in Sawmill show that 28.3% or 17 of the total 60 families live below the poverty line. Families with 3 or 4 children have the highest poverty rate of 37.5%, comprising of 3 families. On the other hand, families with no children have the lowest poverty rate of 25.0%, which includes 7 families.
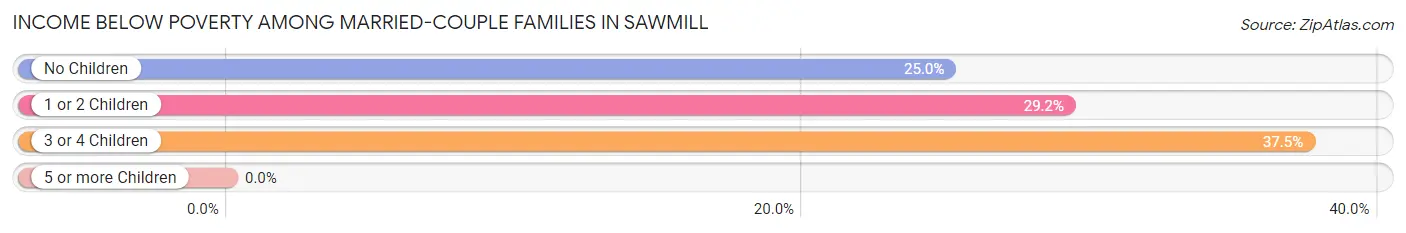
| Children | Above Poverty | Below Poverty |
| No Children | 21 (75.0%) | 7 (25.0%) |
| 1 or 2 Children | 17 (70.8%) | 7 (29.2%) |
| 3 or 4 Children | 5 (62.5%) | 3 (37.5%) |
| 5 or more Children | 0 (0.0%) | 0 (0.0%) |
| Total | 43 (71.7%) | 17 (28.3%) |
Income Below Poverty Among Single-Parent Households in Sawmill
According to the poverty data in Sawmill, 56.2% or 9 single-father households and 42.3% or 22 single-mother households are living below the poverty line. Among single-father households, those with 3 or 4 children have the highest poverty rate, with 3 households (100.0%) experiencing poverty. Likewise, among single-mother households, those with 3 or 4 children have the highest poverty rate, with 8 households (57.1%) falling below the poverty line.
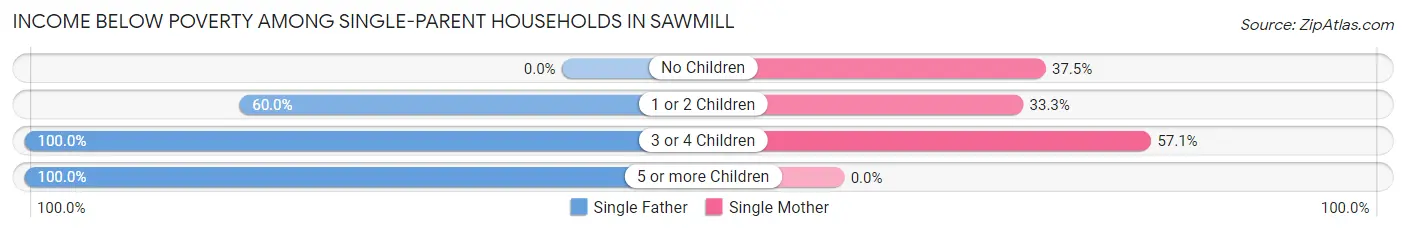
| Children | Single Father | Single Mother |
| No Children | 0 (0.0%) | 12 (37.5%) |
| 1 or 2 Children | 3 (60.0%) | 2 (33.3%) |
| 3 or 4 Children | 3 (100.0%) | 8 (57.1%) |
| 5 or more Children | 3 (100.0%) | 0 (0.0%) |
| Total | 9 (56.2%) | 22 (42.3%) |
Income Below Poverty Among Married-Couple vs Single-Parent Households in Sawmill
The poverty data for Sawmill shows that 17 of the married-couple family households (28.3%) and 31 of the single-parent households (45.6%) are living below the poverty level. Within the married-couple family households, those with 3 or 4 children have the highest poverty rate, with 3 households (37.5%) falling below the poverty line. Among the single-parent households, those with 5 or more children have the highest poverty rate, with 3 household (100.0%) living below poverty.
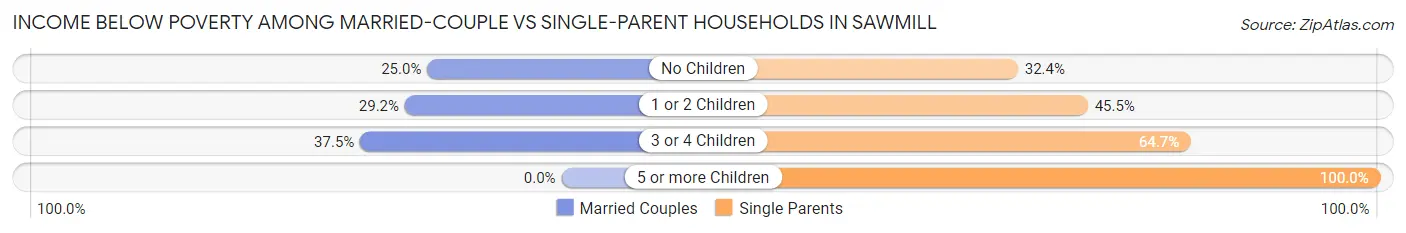
| Children | Married-Couple Families | Single-Parent Households |
| No Children | 7 (25.0%) | 12 (32.4%) |
| 1 or 2 Children | 7 (29.2%) | 5 (45.5%) |
| 3 or 4 Children | 3 (37.5%) | 11 (64.7%) |
| 5 or more Children | 0 (0.0%) | 3 (100.0%) |
| Total | 17 (28.3%) | 31 (45.6%) |
Race in Sawmill
The most populous races in Sawmill are Native / Alaskan (772 | 97.2%), Two or more Races (13 | 1.6%), and White / Caucasian (6 | 0.8%).
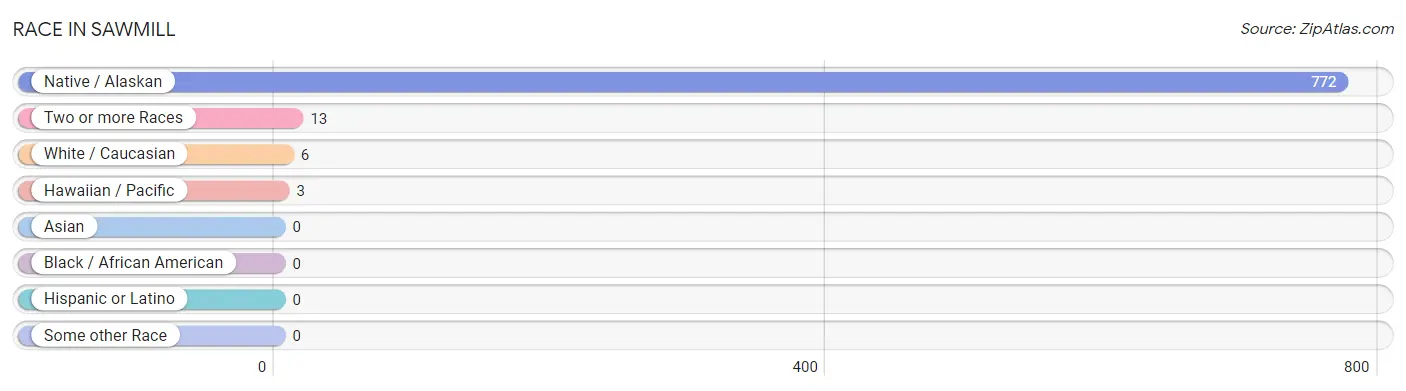
| Race | # Population | % Population |
| Asian | 0 | 0.0% |
| Black / African American | 0 | 0.0% |
| Hawaiian / Pacific | 3 | 0.4% |
| Hispanic or Latino | 0 | 0.0% |
| Native / Alaskan | 772 | 97.2% |
| White / Caucasian | 6 | 0.8% |
| Two or more Races | 13 | 1.6% |
| Some other Race | 0 | 0.0% |
| Total | 794 | 100.0% |
Ancestry in Sawmill
The most populous ancestries reported in Sawmill are Navajo (782 | 98.5%), Apache (3 | 0.4%), and Native Hawaiian (3 | 0.4%), together accounting for 99.3% of all Sawmill residents.
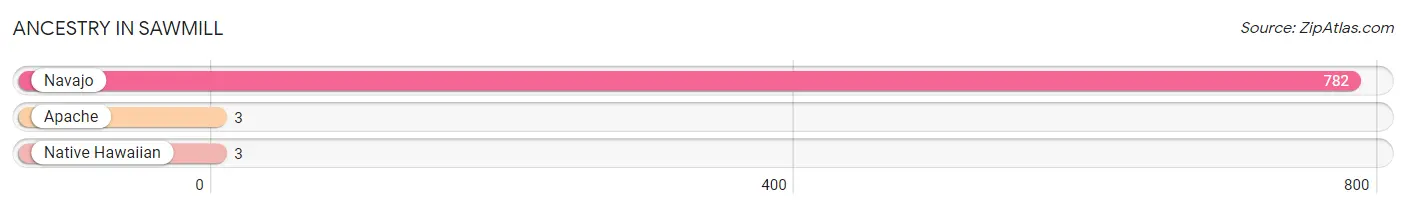
| Ancestry | # Population | % Population |
| Apache | 3 | 0.4% |
| Native Hawaiian | 3 | 0.4% |
| Navajo | 782 | 98.5% | View All 3 Rows |
Immigrants in Sawmill

| Immigration Origin | # Population | % Population | View All 0 Rows |
Sex and Age in Sawmill
Sex and Age in Sawmill
The most populous age groups in Sawmill are 15 to 19 Years (44 | 11.3%) for men and 15 to 19 Years (56 | 13.8%) for women.
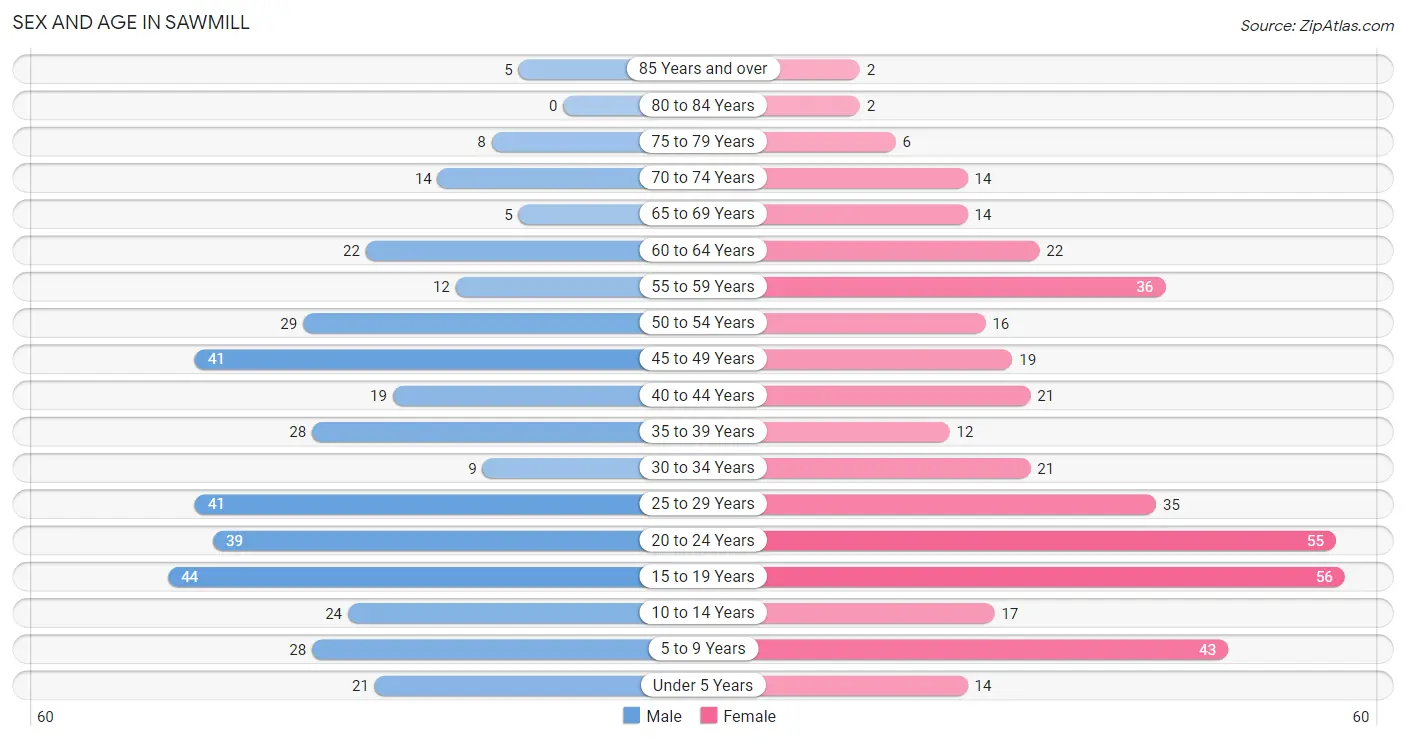
| Age Bracket | Male | Female |
| Under 5 Years | 21 (5.4%) | 14 (3.5%) |
| 5 to 9 Years | 28 (7.2%) | 43 (10.6%) |
| 10 to 14 Years | 24 (6.2%) | 17 (4.2%) |
| 15 to 19 Years | 44 (11.3%) | 56 (13.8%) |
| 20 to 24 Years | 39 (10.0%) | 55 (13.6%) |
| 25 to 29 Years | 41 (10.5%) | 35 (8.6%) |
| 30 to 34 Years | 9 (2.3%) | 21 (5.2%) |
| 35 to 39 Years | 28 (7.2%) | 12 (3.0%) |
| 40 to 44 Years | 19 (4.9%) | 21 (5.2%) |
| 45 to 49 Years | 41 (10.5%) | 19 (4.7%) |
| 50 to 54 Years | 29 (7.5%) | 16 (4.0%) |
| 55 to 59 Years | 12 (3.1%) | 36 (8.9%) |
| 60 to 64 Years | 22 (5.7%) | 22 (5.4%) |
| 65 to 69 Years | 5 (1.3%) | 14 (3.5%) |
| 70 to 74 Years | 14 (3.6%) | 14 (3.5%) |
| 75 to 79 Years | 8 (2.1%) | 6 (1.5%) |
| 80 to 84 Years | 0 (0.0%) | 2 (0.5%) |
| 85 Years and over | 5 (1.3%) | 2 (0.5%) |
| Total | 389 (100.0%) | 405 (100.0%) |
Families and Households in Sawmill
Median Family Size in Sawmill
The median family size in Sawmill is 5.76 persons per family, with single male/father families (16 | 12.5%) accounting for the largest median family size of 7.31 persons per family. On the other hand, married-couple families (60 | 46.9%) represent the smallest median family size with 5.52 persons per family.
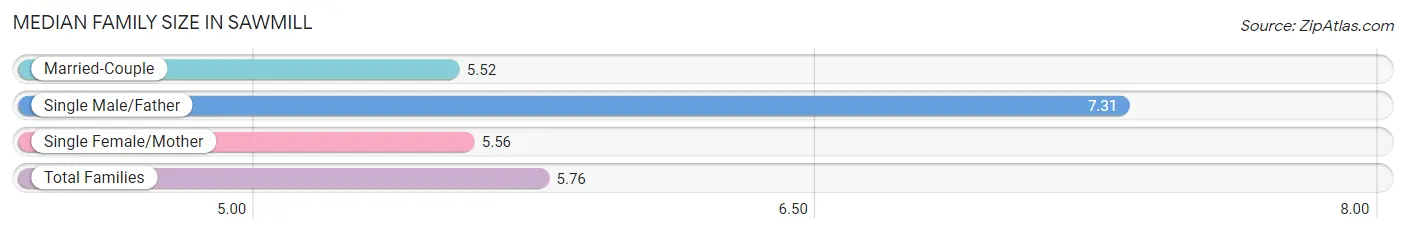
| Family Type | # Families | Family Size |
| Married-Couple | 60 (46.9%) | 5.52 |
| Single Male/Father | 16 (12.5%) | 7.31 |
| Single Female/Mother | 52 (40.6%) | 5.56 |
| Total Families | 128 (100.0%) | 5.76 |
Median Household Size in Sawmill
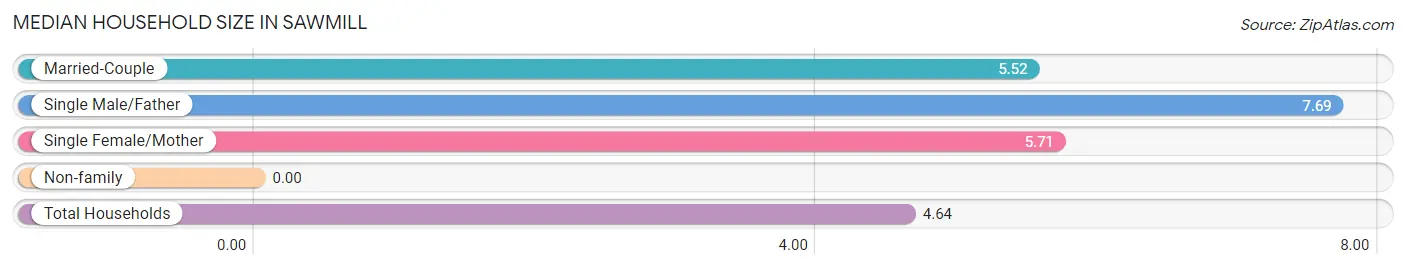
| Household Type | # Households | Household Size |
| Married-Couple | 60 (35.1%) | 5.52 |
| Single Male/Father | 16 (9.4%) | 7.69 |
| Single Female/Mother | 52 (30.4%) | 5.71 |
| Non-family | 43 (25.2%) | - |
| Total Households | 171 (100.0%) | 4.64 |
Household Size by Marriage Status in Sawmill
Out of a total of 171 households in Sawmill, 128 (74.9%) are family households, while 43 (25.2%) are nonfamily households. The most numerous type of family households are 3-person households, comprising 36, and the most common type of nonfamily households are 1-person households, comprising 43.
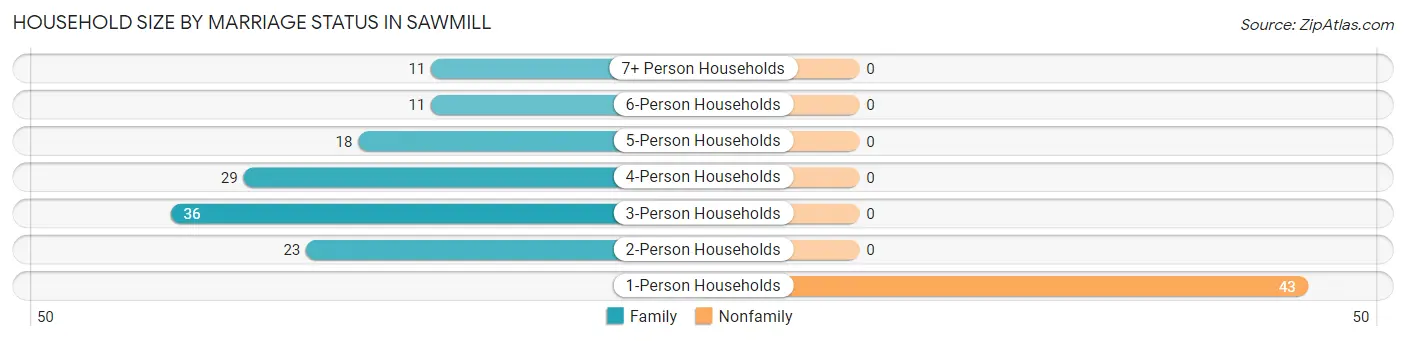
| Household Size | Family Households | Nonfamily Households |
| 1-Person Households | - | 43 (25.2%) |
| 2-Person Households | 23 (13.5%) | 0 (0.0%) |
| 3-Person Households | 36 (21.0%) | 0 (0.0%) |
| 4-Person Households | 29 (17.0%) | 0 (0.0%) |
| 5-Person Households | 18 (10.5%) | 0 (0.0%) |
| 6-Person Households | 11 (6.4%) | 0 (0.0%) |
| 7+ Person Households | 11 (6.4%) | 0 (0.0%) |
| Total | 128 (74.9%) | 43 (25.2%) |
Female Fertility in Sawmill
Fertility by Age in Sawmill
| Age Bracket | Women with Births | Births / 1,000 Women |
| 15 to 19 years | 0 (0.0%) | 0.0 |
| 20 to 34 years | 0 (0.0%) | 0.0 |
| 35 to 50 years | 0 (0.0%) | 0.0 |
| Total | 0 (0.0%) | 0.0 |
Fertility by Age by Marriage Status in Sawmill
| Age Bracket | Married | Unmarried |
| 15 to 19 years | 0 (0.0%) | 0 (0.0%) |
| 20 to 34 years | 0 (0.0%) | 0 (0.0%) |
| 35 to 50 years | 0 (0.0%) | 0 (0.0%) |
| Total | 0 (0.0%) | 0 (0.0%) |
Fertility by Education in Sawmill
| Educational Attainment | Women with Births | Births / 1,000 Women |
| Less than High School | 0 (0.0%) | 0.0 |
| High School Diploma | 0 (0.0%) | 0.0 |
| College or Associate's Degree | 0 (0.0%) | 0.0 |
| Bachelor's Degree | 0 (0.0%) | 0.0 |
| Graduate Degree | 0 (0.0%) | 0.0 |
| Total | 0 (0.0%) | 0.0 |
Fertility by Education by Marriage Status in Sawmill
| Educational Attainment | Married | Unmarried |
| Less than High School | 0 (0.0%) | 0 (0.0%) |
| High School Diploma | 0 (0.0%) | 0 (0.0%) |
| College or Associate's Degree | 0 (0.0%) | 0 (0.0%) |
| Bachelor's Degree | 0 (0.0%) | 0 (0.0%) |
| Graduate Degree | 0 (0.0%) | 0 (0.0%) |
| Total | 0 (0.0%) | 0 (0.0%) |
Employment Characteristics in Sawmill
Employment by Class of Employer in Sawmill
Among the 172 employed individuals in Sawmill, private company employees (106 | 61.6%), federal government employees (19 | 11.1%), and local government employees (18 | 10.5%) make up the most common classes of employment.
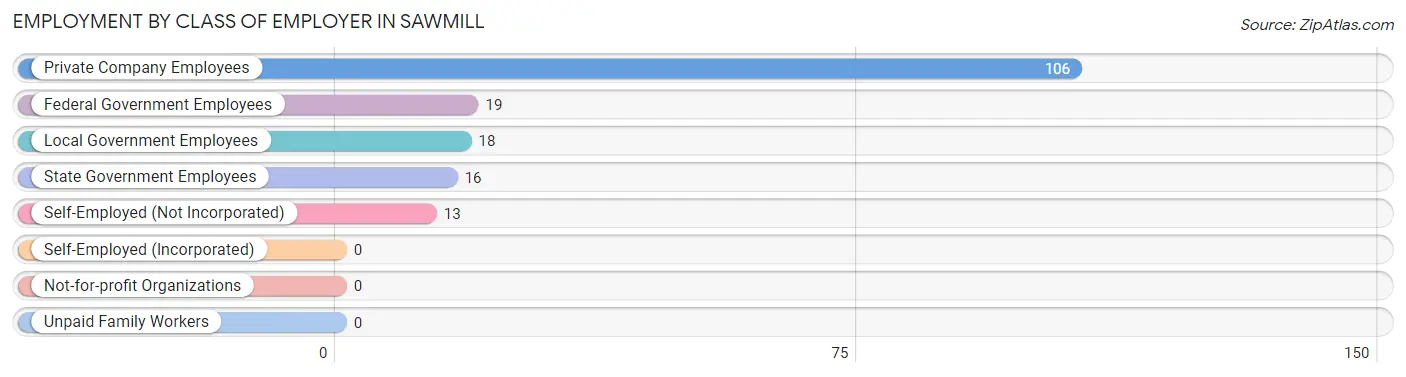
| Employer Class | # Employees | % Employees |
| Private Company Employees | 106 | 61.6% |
| Self-Employed (Incorporated) | 0 | 0.0% |
| Self-Employed (Not Incorporated) | 13 | 7.6% |
| Not-for-profit Organizations | 0 | 0.0% |
| Local Government Employees | 18 | 10.5% |
| State Government Employees | 16 | 9.3% |
| Federal Government Employees | 19 | 11.1% |
| Unpaid Family Workers | 0 | 0.0% |
| Total | 172 | 100.0% |
Employment Status by Age in Sawmill
According to the labor force statistics for Sawmill, out of the total population over 16 years of age (632), 36.2% or 229 individuals are in the labor force, with 24.9% or 57 of them unemployed. The age group with the highest labor force participation rate is 30 to 34 years, with 86.7% or 26 individuals in the labor force. Within the labor force, the 16 to 19 years age range has the highest percentage of unemployed individuals, with 100.0% or 5 of them being unemployed.
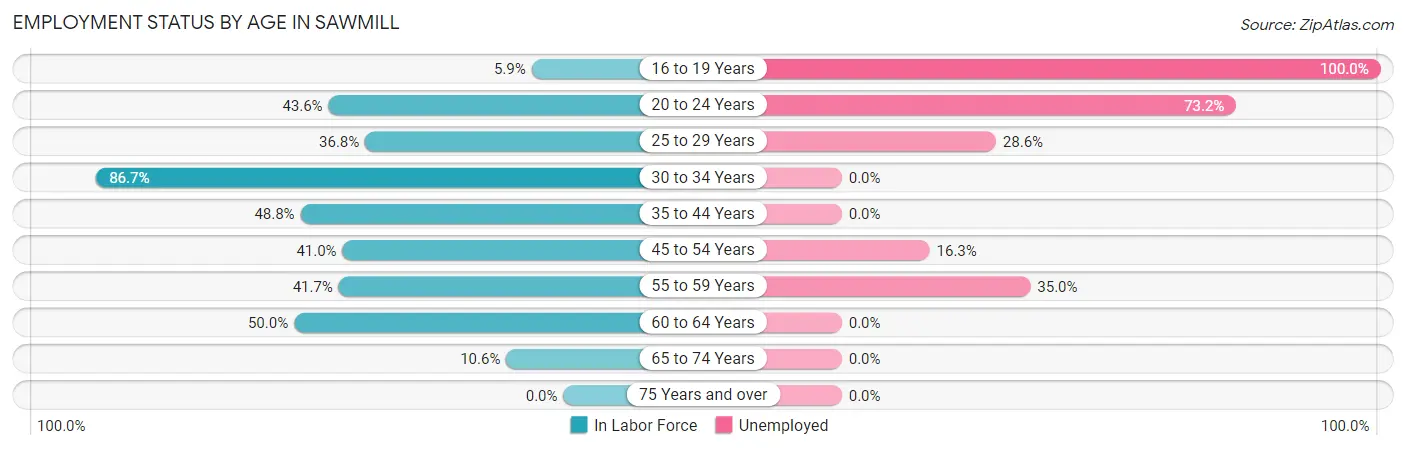
| Age Bracket | In Labor Force | Unemployed |
| 16 to 19 Years | 5 (5.9%) | 5 (100.0%) |
| 20 to 24 Years | 41 (43.6%) | 30 (73.2%) |
| 25 to 29 Years | 28 (36.8%) | 8 (28.6%) |
| 30 to 34 Years | 26 (86.7%) | 0 (0.0%) |
| 35 to 44 Years | 39 (48.8%) | 0 (0.0%) |
| 45 to 54 Years | 43 (41.0%) | 7 (16.3%) |
| 55 to 59 Years | 20 (41.7%) | 7 (35.0%) |
| 60 to 64 Years | 22 (50.0%) | 0 (0.0%) |
| 65 to 74 Years | 5 (10.6%) | 0 (0.0%) |
| 75 Years and over | 0 (0.0%) | 0 (0.0%) |
| Total | 229 (36.2%) | 57 (24.9%) |
Employment Status by Educational Attainment in Sawmill
According to labor force statistics for Sawmill, 46.5% of individuals (178) out of the total population between 25 and 64 years of age (383) are in the labor force, with 12.4% or 22 of them being unemployed. The group with the highest labor force participation rate are those with the educational attainment of bachelor's degree or higher, with 100.0% or 18 individuals in the labor force. Within the labor force, individuals with high school diploma education have the highest percentage of unemployment, with 18.1% or 15 of them being unemployed.
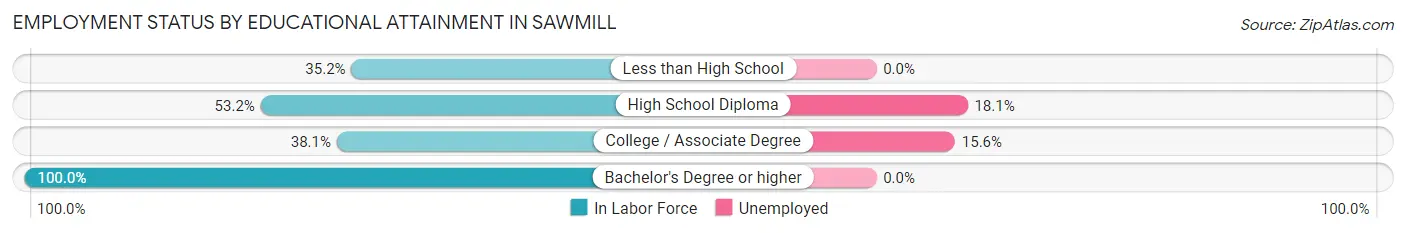
| Educational Attainment | In Labor Force | Unemployed |
| Less than High School | 32 (35.2%) | 0 (0.0%) |
| High School Diploma | 83 (53.2%) | 28 (18.1%) |
| College / Associate Degree | 45 (38.1%) | 18 (15.6%) |
| Bachelor's Degree or higher | 18 (100.0%) | 0 (0.0%) |
| Total | 178 (46.5%) | 47 (12.4%) |
Employment Occupations by Sex in Sawmill
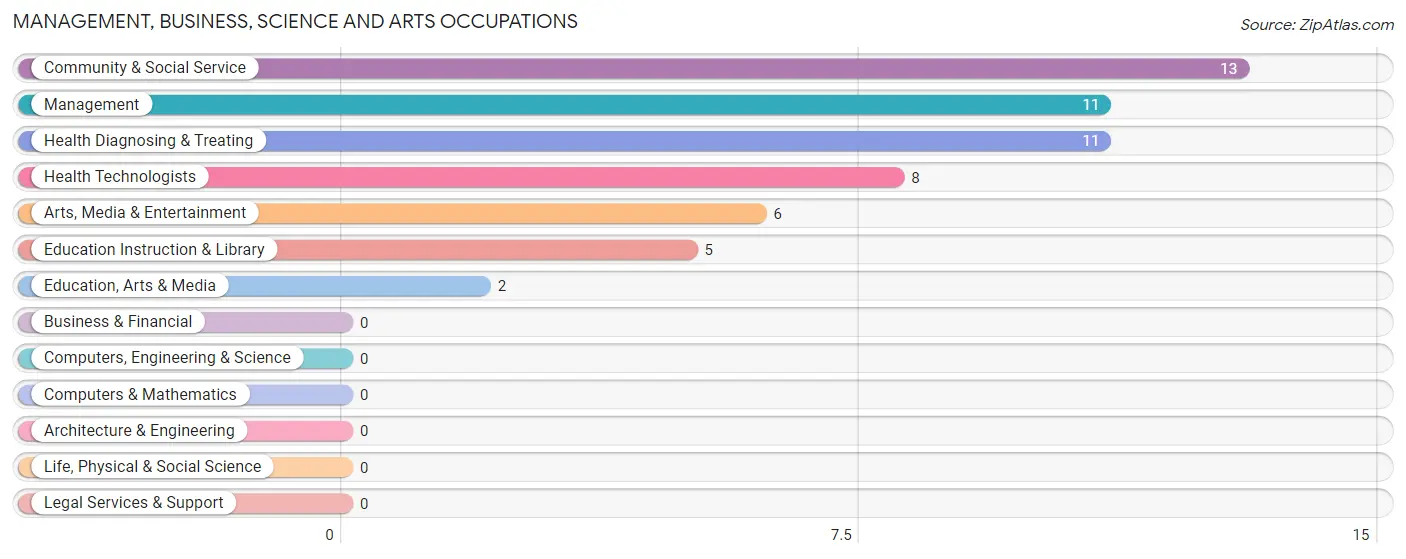
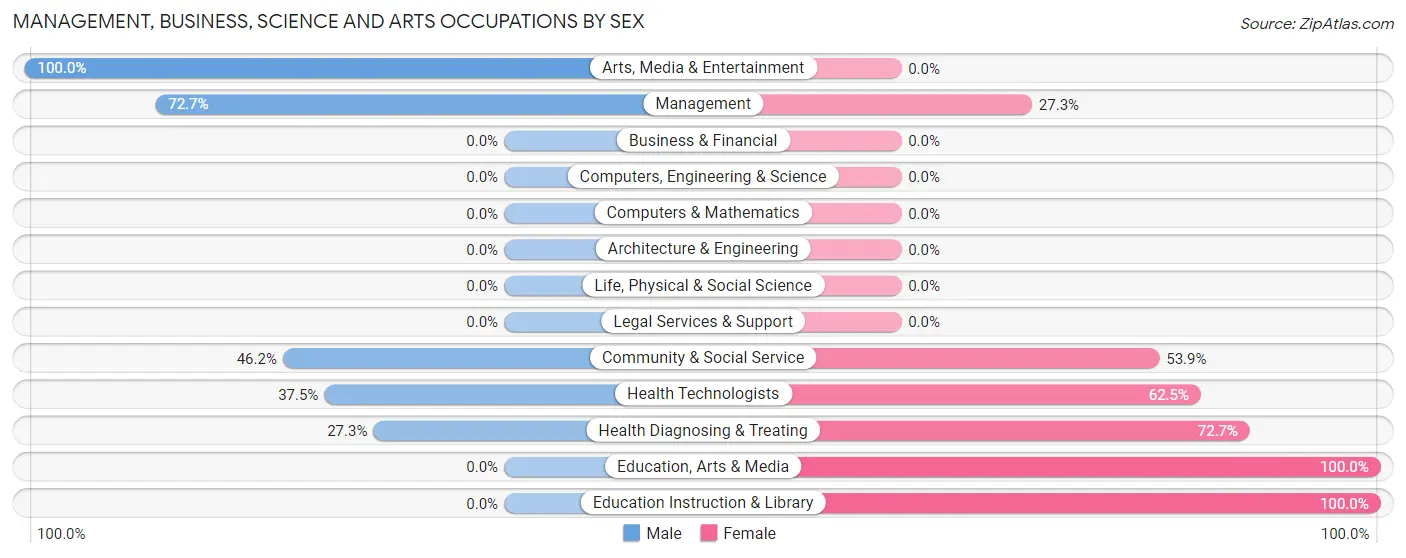
Management, Business, Science and Arts Occupations
The most common Management, Business, Science and Arts occupations in Sawmill are Community & Social Service (13 | 7.6%), Management (11 | 6.4%), Health Diagnosing & Treating (11 | 6.4%), Health Technologists (8 | 4.6%), and Arts, Media & Entertainment (6 | 3.5%).
Management, Business, Science and Arts Occupations by Sex
Within the Management, Business, Science and Arts occupations in Sawmill, the most male-oriented occupations are Arts, Media & Entertainment (100.0%), Management (72.7%), and Community & Social Service (46.2%), while the most female-oriented occupations are Education, Arts & Media (100.0%), Education Instruction & Library (100.0%), and Health Diagnosing & Treating (72.7%).
| Occupation | Male | Female |
| Management | 8 (72.7%) | 3 (27.3%) |
| Business & Financial | 0 (0.0%) | 0 (0.0%) |
| Computers, Engineering & Science | 0 (0.0%) | 0 (0.0%) |
| Computers & Mathematics | 0 (0.0%) | 0 (0.0%) |
| Architecture & Engineering | 0 (0.0%) | 0 (0.0%) |
| Life, Physical & Social Science | 0 (0.0%) | 0 (0.0%) |
| Community & Social Service | 6 (46.2%) | 7 (53.8%) |
| Education, Arts & Media | 0 (0.0%) | 2 (100.0%) |
| Legal Services & Support | 0 (0.0%) | 0 (0.0%) |
| Education Instruction & Library | 0 (0.0%) | 5 (100.0%) |
| Arts, Media & Entertainment | 6 (100.0%) | 0 (0.0%) |
| Health Diagnosing & Treating | 3 (27.3%) | 8 (72.7%) |
| Health Technologists | 3 (37.5%) | 5 (62.5%) |
| Total (Category) | 17 (48.6%) | 18 (51.4%) |
| Total (Overall) | 85 (49.4%) | 87 (50.6%) |
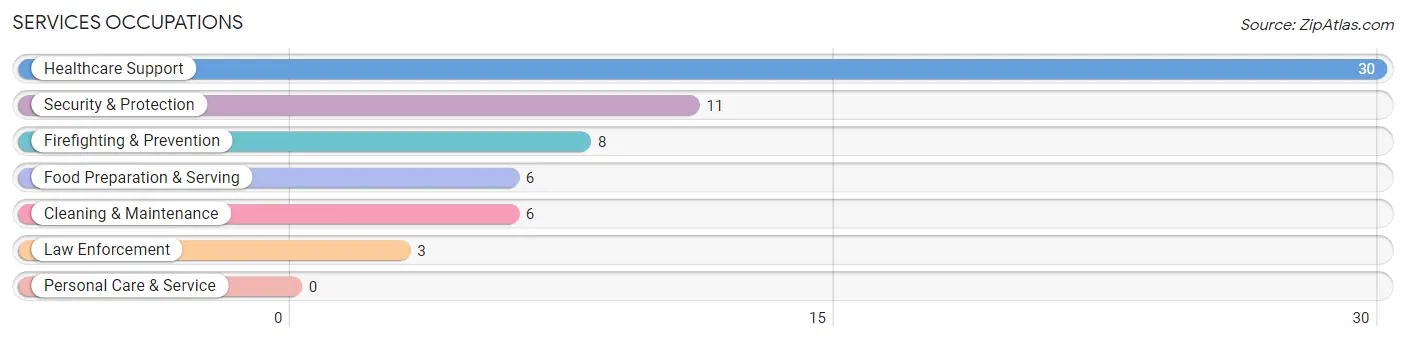
Services Occupations
The most common Services occupations in Sawmill are Healthcare Support (30 | 17.4%), Security & Protection (11 | 6.4%), Firefighting & Prevention (8 | 4.6%), Food Preparation & Serving (6 | 3.5%), and Cleaning & Maintenance (6 | 3.5%).
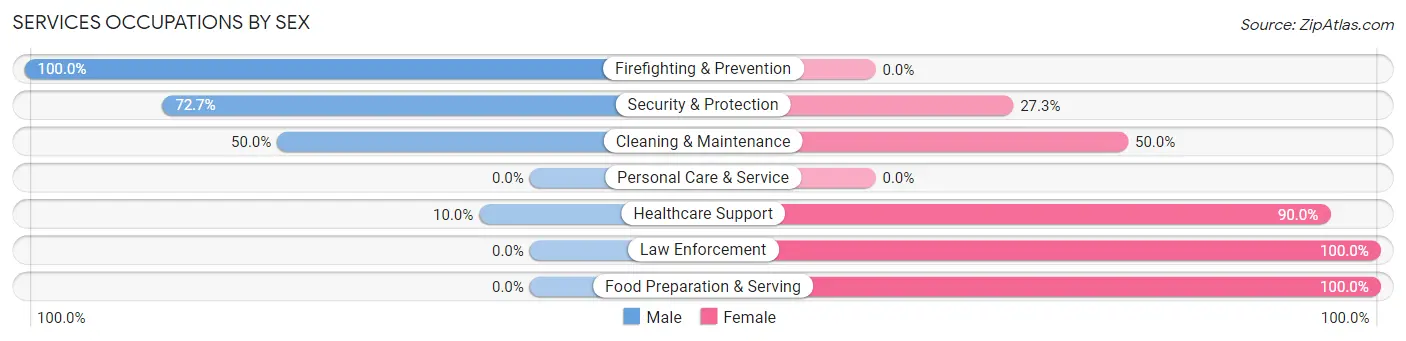
Services Occupations by Sex
Within the Services occupations in Sawmill, the most male-oriented occupations are Firefighting & Prevention (100.0%), Security & Protection (72.7%), and Cleaning & Maintenance (50.0%), while the most female-oriented occupations are Law Enforcement (100.0%), Food Preparation & Serving (100.0%), and Healthcare Support (90.0%).
| Occupation | Male | Female |
| Healthcare Support | 3 (10.0%) | 27 (90.0%) |
| Security & Protection | 8 (72.7%) | 3 (27.3%) |
| Firefighting & Prevention | 8 (100.0%) | 0 (0.0%) |
| Law Enforcement | 0 (0.0%) | 3 (100.0%) |
| Food Preparation & Serving | 0 (0.0%) | 6 (100.0%) |
| Cleaning & Maintenance | 3 (50.0%) | 3 (50.0%) |
| Personal Care & Service | 0 (0.0%) | 0 (0.0%) |
| Total (Category) | 14 (26.4%) | 39 (73.6%) |
| Total (Overall) | 85 (49.4%) | 87 (50.6%) |
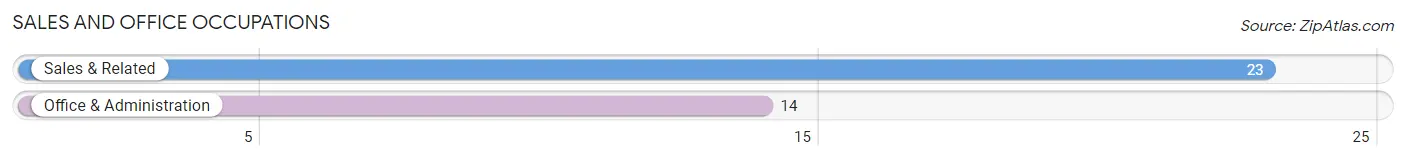
Sales and Office Occupations
The most common Sales and Office occupations in Sawmill are Sales & Related (23 | 13.4%), and Office & Administration (14 | 8.1%).
Sales and Office Occupations by Sex
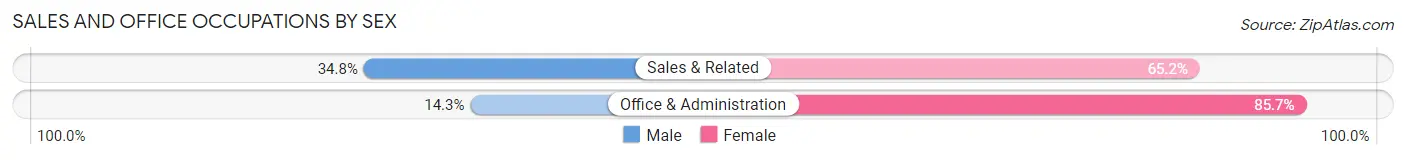
| Occupation | Male | Female |
| Sales & Related | 8 (34.8%) | 15 (65.2%) |
| Office & Administration | 2 (14.3%) | 12 (85.7%) |
| Total (Category) | 10 (27.0%) | 27 (73.0%) |
| Total (Overall) | 85 (49.4%) | 87 (50.6%) |
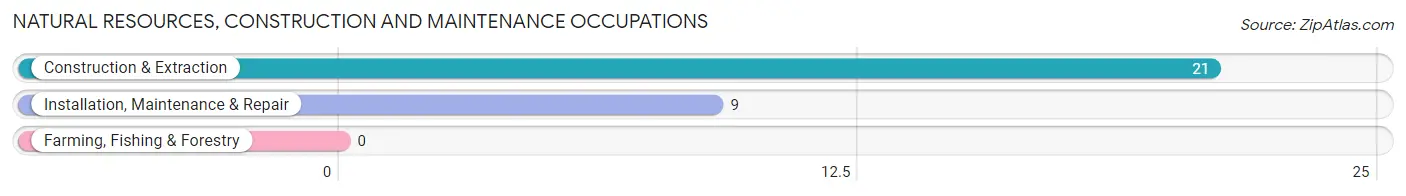
Natural Resources, Construction and Maintenance Occupations
The most common Natural Resources, Construction and Maintenance occupations in Sawmill are Construction & Extraction (21 | 12.2%), and Installation, Maintenance & Repair (9 | 5.2%).
Natural Resources, Construction and Maintenance Occupations by Sex
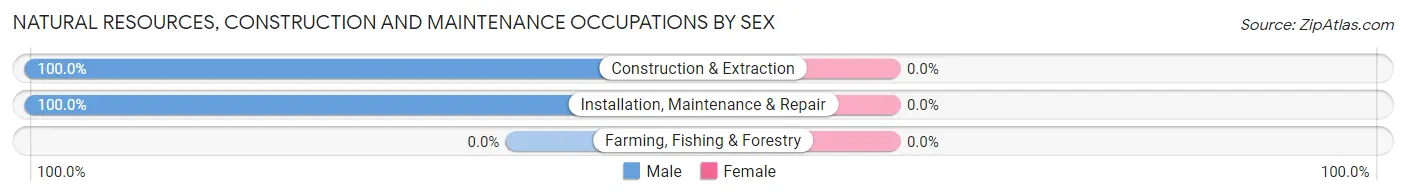
| Occupation | Male | Female |
| Farming, Fishing & Forestry | 0 (0.0%) | 0 (0.0%) |
| Construction & Extraction | 21 (100.0%) | 0 (0.0%) |
| Installation, Maintenance & Repair | 9 (100.0%) | 0 (0.0%) |
| Total (Category) | 30 (100.0%) | 0 (0.0%) |
| Total (Overall) | 85 (49.4%) | 87 (50.6%) |
Production, Transportation and Moving Occupations
The most common Production, Transportation and Moving occupations in Sawmill are Transportation (11 | 6.4%), and Material Moving (6 | 3.5%).
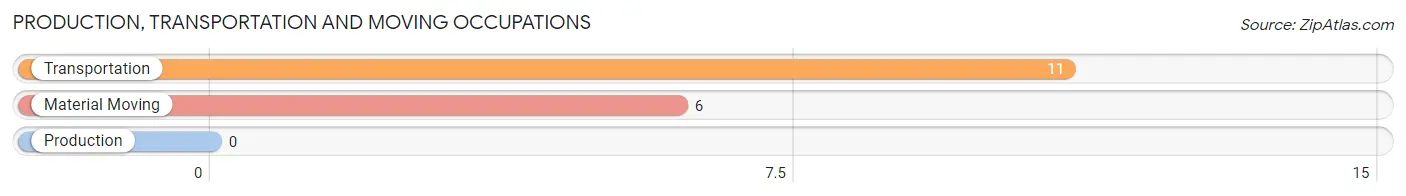
Production, Transportation and Moving Occupations by Sex
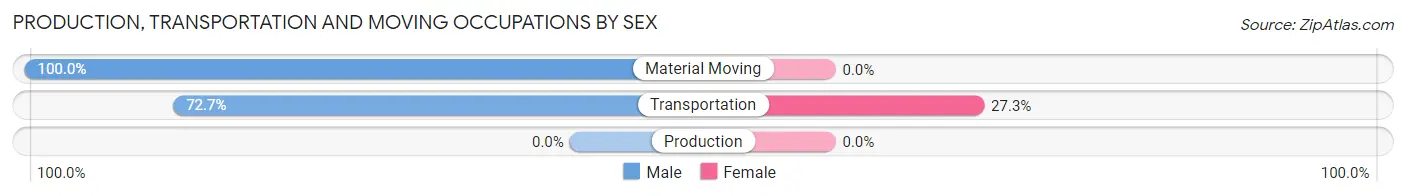
| Occupation | Male | Female |
| Production | 0 (0.0%) | 0 (0.0%) |
| Transportation | 8 (72.7%) | 3 (27.3%) |
| Material Moving | 6 (100.0%) | 0 (0.0%) |
| Total (Category) | 14 (82.4%) | 3 (17.6%) |
| Total (Overall) | 85 (49.4%) | 87 (50.6%) |
Employment Industries by Sex in Sawmill
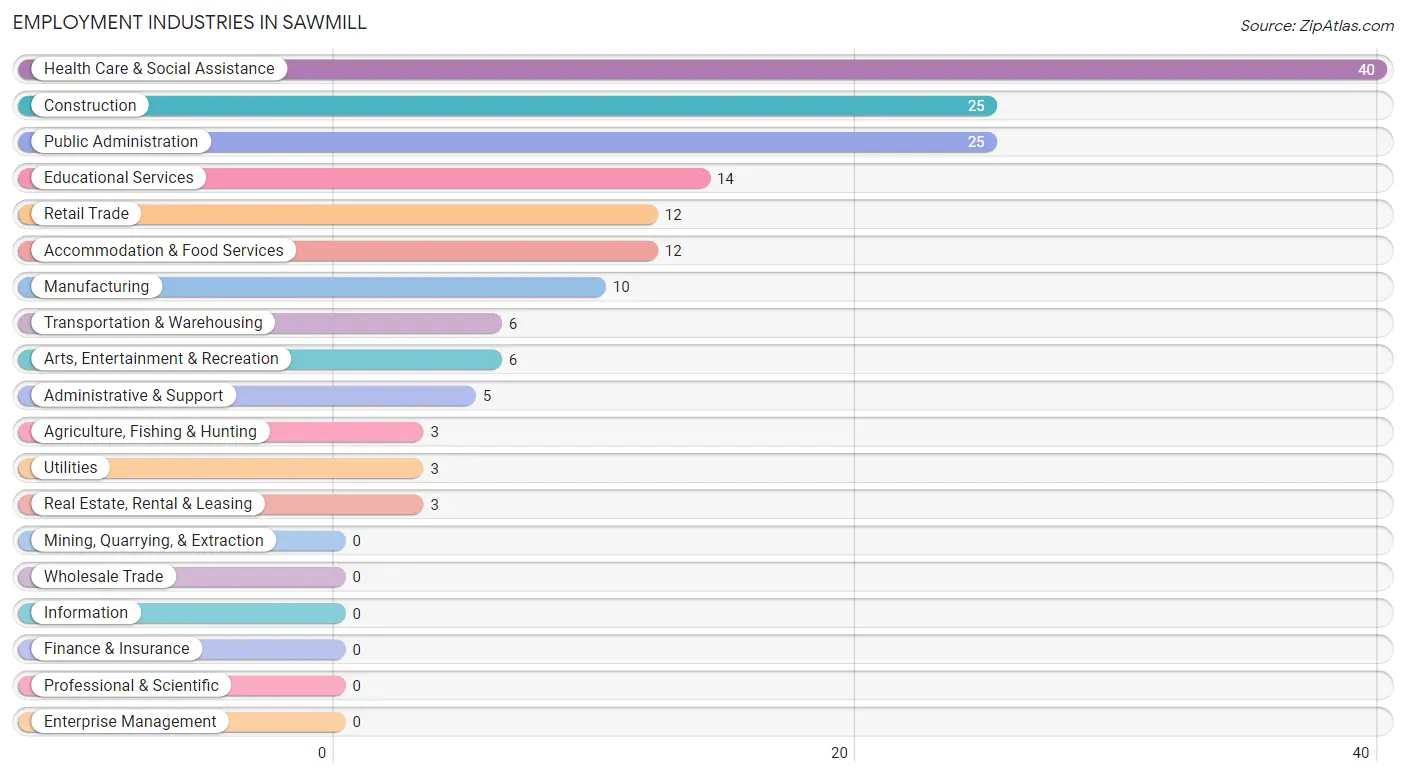
Employment Industries in Sawmill
The major employment industries in Sawmill include Health Care & Social Assistance (40 | 23.3%), Construction (25 | 14.5%), Public Administration (25 | 14.5%), Educational Services (14 | 8.1%), and Retail Trade (12 | 7.0%).
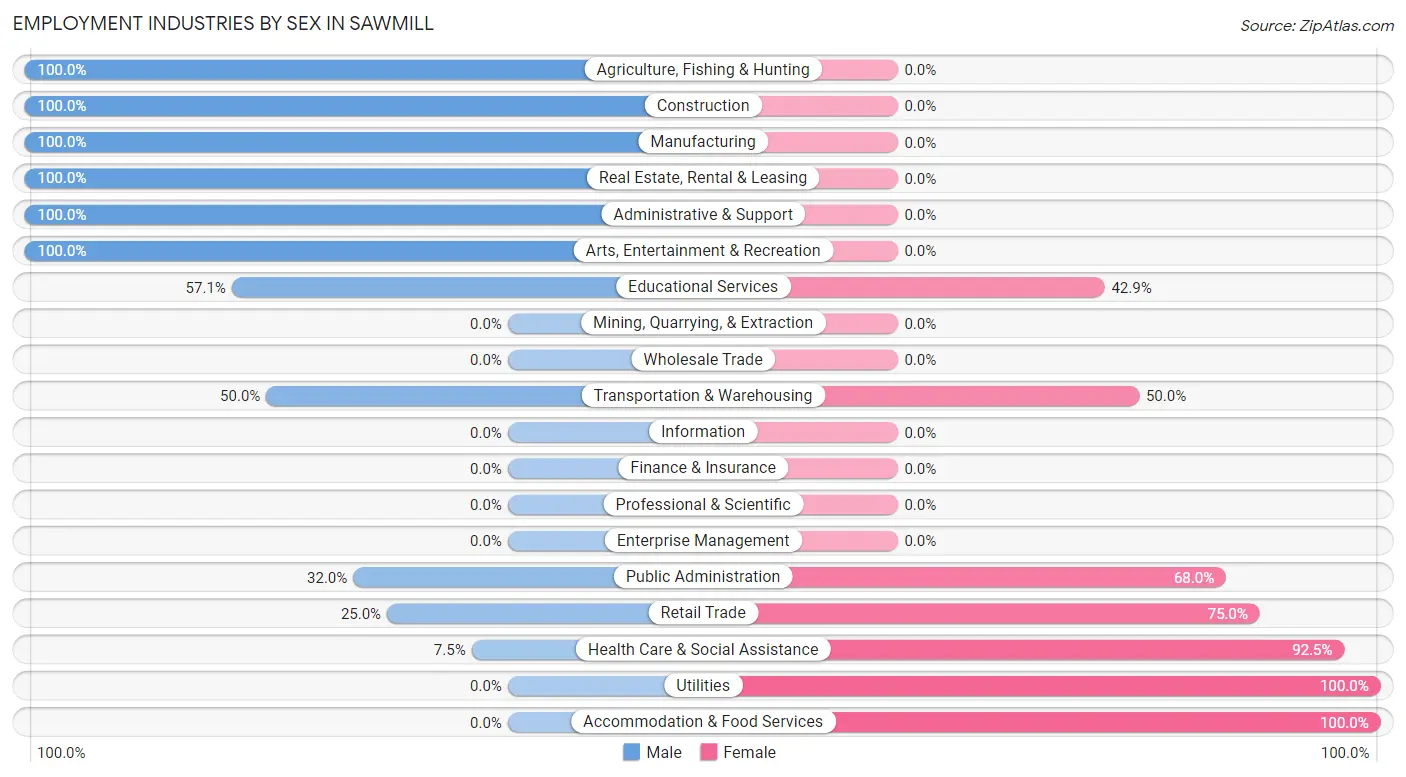
Employment Industries by Sex in Sawmill
The Sawmill industries that see more men than women are Agriculture, Fishing & Hunting (100.0%), Construction (100.0%), and Manufacturing (100.0%), whereas the industries that tend to have a higher number of women are Utilities (100.0%), Accommodation & Food Services (100.0%), and Health Care & Social Assistance (92.5%).
| Industry | Male | Female |
| Agriculture, Fishing & Hunting | 3 (100.0%) | 0 (0.0%) |
| Mining, Quarrying, & Extraction | 0 (0.0%) | 0 (0.0%) |
| Construction | 25 (100.0%) | 0 (0.0%) |
| Manufacturing | 10 (100.0%) | 0 (0.0%) |
| Wholesale Trade | 0 (0.0%) | 0 (0.0%) |
| Retail Trade | 3 (25.0%) | 9 (75.0%) |
| Transportation & Warehousing | 3 (50.0%) | 3 (50.0%) |
| Utilities | 0 (0.0%) | 3 (100.0%) |
| Information | 0 (0.0%) | 0 (0.0%) |
| Finance & Insurance | 0 (0.0%) | 0 (0.0%) |
| Real Estate, Rental & Leasing | 3 (100.0%) | 0 (0.0%) |
| Professional & Scientific | 0 (0.0%) | 0 (0.0%) |
| Enterprise Management | 0 (0.0%) | 0 (0.0%) |
| Administrative & Support | 5 (100.0%) | 0 (0.0%) |
| Educational Services | 8 (57.1%) | 6 (42.9%) |
| Health Care & Social Assistance | 3 (7.5%) | 37 (92.5%) |
| Arts, Entertainment & Recreation | 6 (100.0%) | 0 (0.0%) |
| Accommodation & Food Services | 0 (0.0%) | 12 (100.0%) |
| Public Administration | 8 (32.0%) | 17 (68.0%) |
| Total | 85 (49.4%) | 87 (50.6%) |
Education in Sawmill
School Enrollment in Sawmill
The most common levels of schooling among the 247 students in Sawmill are high school (76 | 30.8%), elementary school (59 | 23.9%), and college / undergraduate (47 | 19.0%).
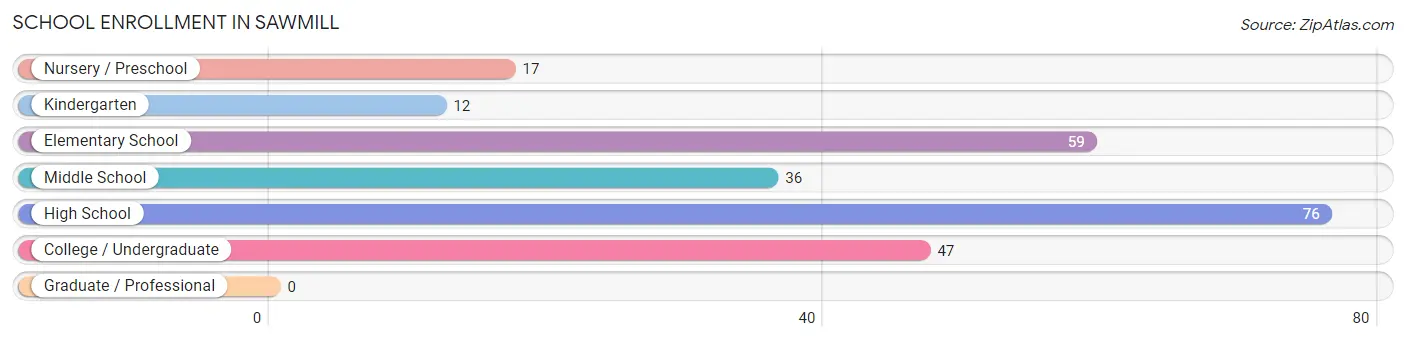
| School Level | # Students | % Students |
| Nursery / Preschool | 17 | 6.9% |
| Kindergarten | 12 | 4.9% |
| Elementary School | 59 | 23.9% |
| Middle School | 36 | 14.6% |
| High School | 76 | 30.8% |
| College / Undergraduate | 47 | 19.0% |
| Graduate / Professional | 0 | 0.0% |
| Total | 247 | 100.0% |
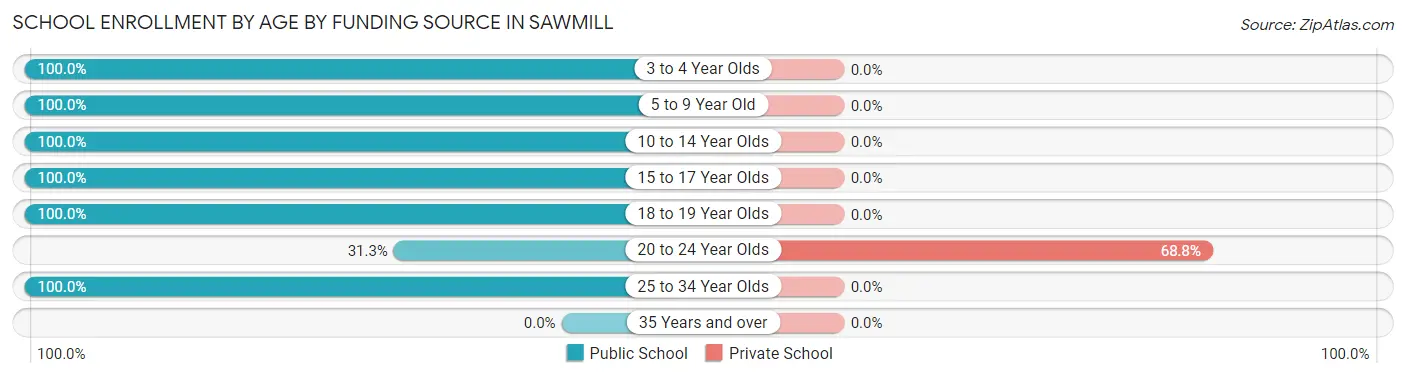
School Enrollment by Age by Funding Source in Sawmill
Out of a total of 247 students who are enrolled in schools in Sawmill, 11 (4.5%) attend a private institution, while the remaining 236 (95.5%) are enrolled in public schools. The age group of 20 to 24 year olds has the highest likelihood of being enrolled in private schools, with 11 (68.8% in the age bracket) enrolled. Conversely, the age group of 3 to 4 year olds has the lowest likelihood of being enrolled in a private school, with 17 (100.0% in the age bracket) attending a public institution.
| Age Bracket | Public School | Private School |
| 3 to 4 Year Olds | 17 (100.0%) | 0 (0.0%) |
| 5 to 9 Year Old | 71 (100.0%) | 0 (0.0%) |
| 10 to 14 Year Olds | 41 (100.0%) | 0 (0.0%) |
| 15 to 17 Year Olds | 47 (100.0%) | 0 (0.0%) |
| 18 to 19 Year Olds | 36 (100.0%) | 0 (0.0%) |
| 20 to 24 Year Olds | 5 (31.2%) | 11 (68.8%) |
| 25 to 34 Year Olds | 19 (100.0%) | 0 (0.0%) |
| 35 Years and over | 0 (0.0%) | 0 (0.0%) |
| Total | 236 (95.5%) | 11 (4.5%) |
Educational Attainment by Field of Study in Sawmill
Science & technology (13 | 43.3%), education (5 | 16.7%), arts & humanities (5 | 16.7%), physical & health sciences (4 | 13.3%), and psychology (3 | 10.0%) are the most common fields of study among 30 individuals in Sawmill who have obtained a bachelor's degree or higher.
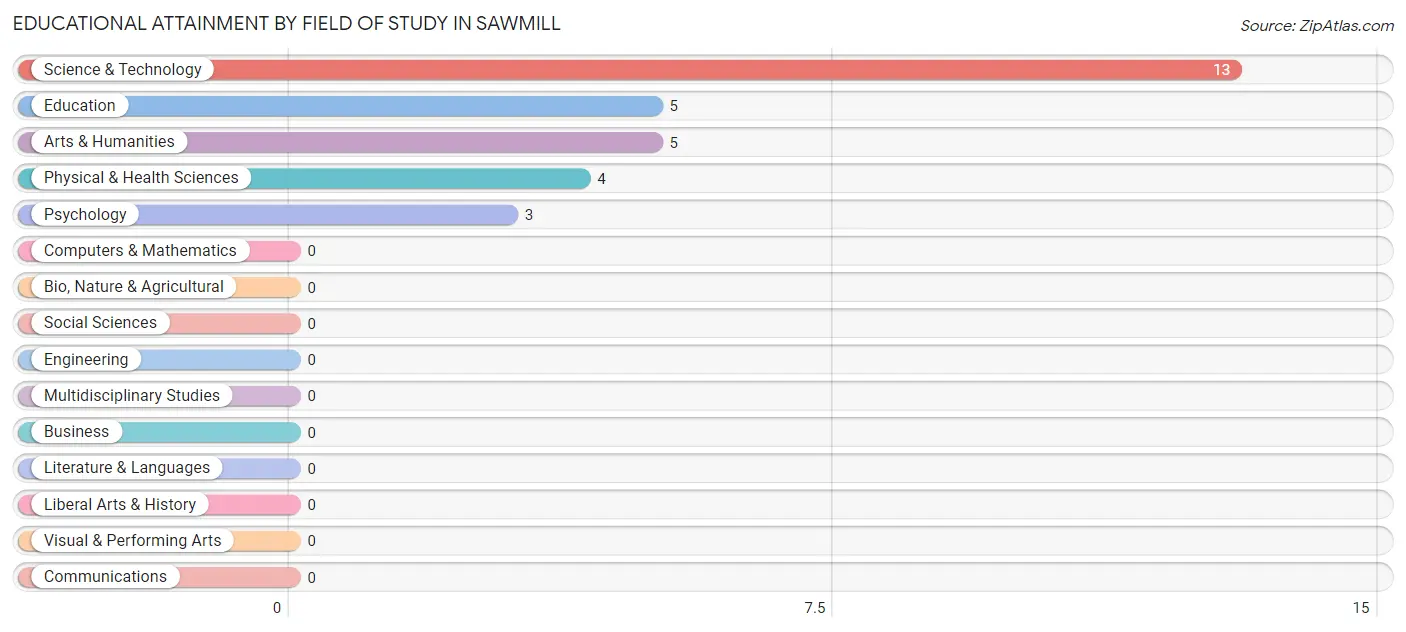
| Field of Study | # Graduates | % Graduates |
| Computers & Mathematics | 0 | 0.0% |
| Bio, Nature & Agricultural | 0 | 0.0% |
| Physical & Health Sciences | 4 | 13.3% |
| Psychology | 3 | 10.0% |
| Social Sciences | 0 | 0.0% |
| Engineering | 0 | 0.0% |
| Multidisciplinary Studies | 0 | 0.0% |
| Science & Technology | 13 | 43.3% |
| Business | 0 | 0.0% |
| Education | 5 | 16.7% |
| Literature & Languages | 0 | 0.0% |
| Liberal Arts & History | 0 | 0.0% |
| Visual & Performing Arts | 0 | 0.0% |
| Communications | 0 | 0.0% |
| Arts & Humanities | 5 | 16.7% |
| Total | 30 | 100.0% |
Transportation & Commute in Sawmill
Vehicle Availability by Sex in Sawmill
The most prevalent vehicle ownership categories in Sawmill are males with 1 vehicle (25, accounting for 29.4%) and females with 1 vehicle (15, making up 28.7%).
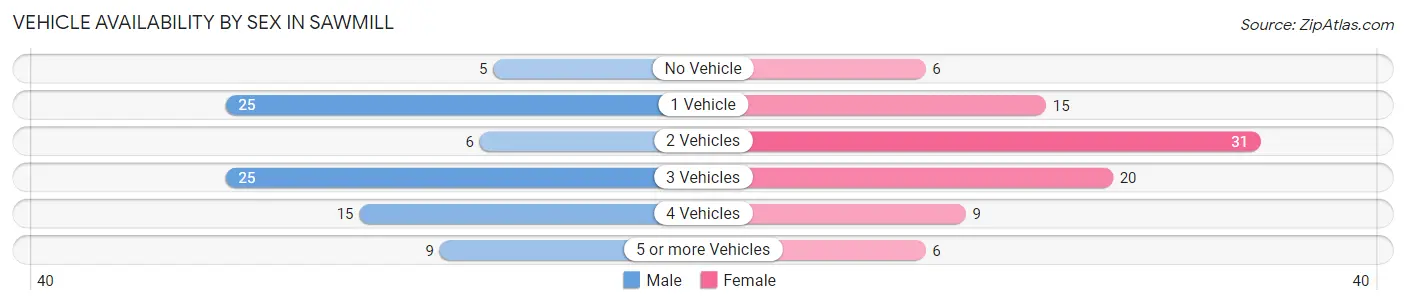
| Vehicles Available | Male | Female |
| No Vehicle | 5 (5.9%) | 6 (6.9%) |
| 1 Vehicle | 25 (29.4%) | 15 (17.2%) |
| 2 Vehicles | 6 (7.1%) | 31 (35.6%) |
| 3 Vehicles | 25 (29.4%) | 20 (23.0%) |
| 4 Vehicles | 15 (17.6%) | 9 (10.3%) |
| 5 or more Vehicles | 9 (10.6%) | 6 (6.9%) |
| Total | 85 (100.0%) | 87 (100.0%) |
Commute Time in Sawmill
The most frequently occuring commute durations in Sawmill are 30 to 34 minutes (60 commuters, 38.5%), 60 to 89 minutes (39 commuters, 25.0%), and 45 to 59 minutes (22 commuters, 14.1%).
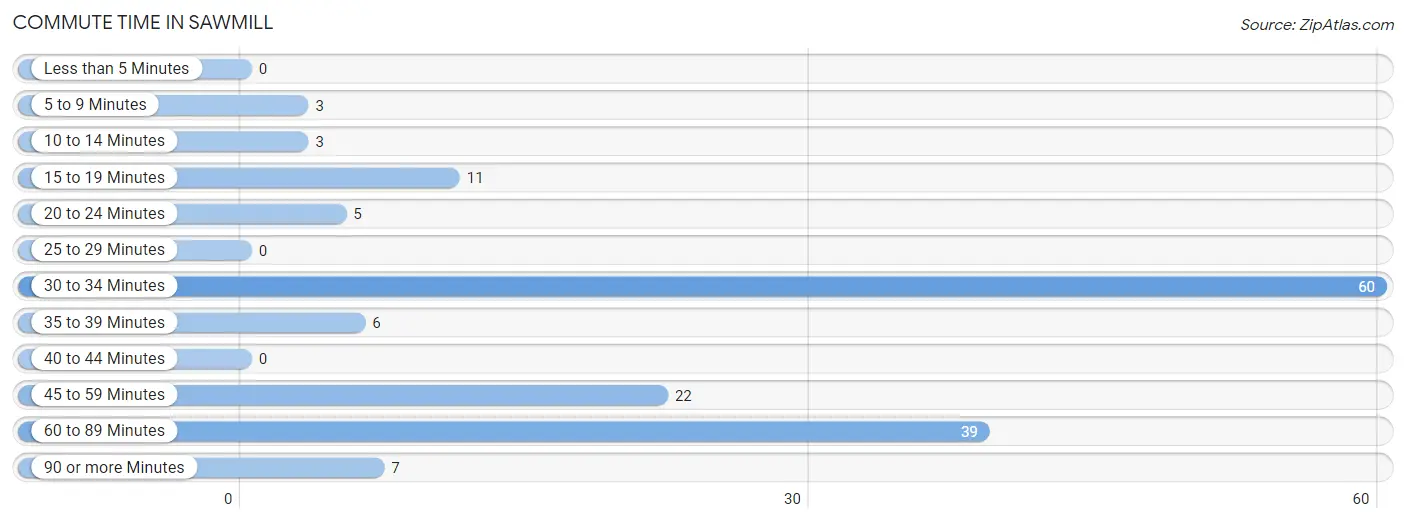
| Commute Time | # Commuters | % Commuters |
| Less than 5 Minutes | 0 | 0.0% |
| 5 to 9 Minutes | 3 | 1.9% |
| 10 to 14 Minutes | 3 | 1.9% |
| 15 to 19 Minutes | 11 | 7.0% |
| 20 to 24 Minutes | 5 | 3.2% |
| 25 to 29 Minutes | 0 | 0.0% |
| 30 to 34 Minutes | 60 | 38.5% |
| 35 to 39 Minutes | 6 | 3.8% |
| 40 to 44 Minutes | 0 | 0.0% |
| 45 to 59 Minutes | 22 | 14.1% |
| 60 to 89 Minutes | 39 | 25.0% |
| 90 or more Minutes | 7 | 4.5% |
Commute Time by Sex in Sawmill
The most common commute times in Sawmill are 60 to 89 minutes (19 commuters, 25.0%) for males and 30 to 34 minutes (42 commuters, 52.5%) for females.
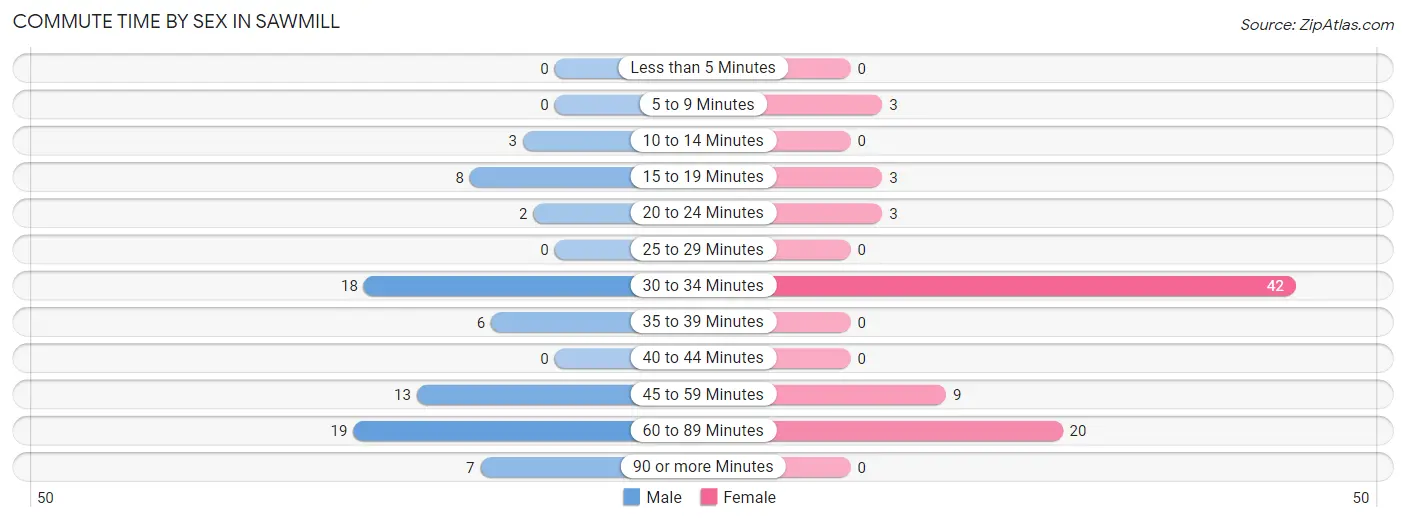
| Commute Time | Male | Female |
| Less than 5 Minutes | 0 (0.0%) | 0 (0.0%) |
| 5 to 9 Minutes | 0 (0.0%) | 3 (3.7%) |
| 10 to 14 Minutes | 3 (4.0%) | 0 (0.0%) |
| 15 to 19 Minutes | 8 (10.5%) | 3 (3.7%) |
| 20 to 24 Minutes | 2 (2.6%) | 3 (3.7%) |
| 25 to 29 Minutes | 0 (0.0%) | 0 (0.0%) |
| 30 to 34 Minutes | 18 (23.7%) | 42 (52.5%) |
| 35 to 39 Minutes | 6 (7.9%) | 0 (0.0%) |
| 40 to 44 Minutes | 0 (0.0%) | 0 (0.0%) |
| 45 to 59 Minutes | 13 (17.1%) | 9 (11.3%) |
| 60 to 89 Minutes | 19 (25.0%) | 20 (25.0%) |
| 90 or more Minutes | 7 (9.2%) | 0 (0.0%) |
Time of Departure to Work by Sex in Sawmill
The most frequent times of departure to work in Sawmill are 7:00 AM to 7:29 AM (34, 44.7%) for males and 7:00 AM to 7:29 AM (23, 28.7%) for females.
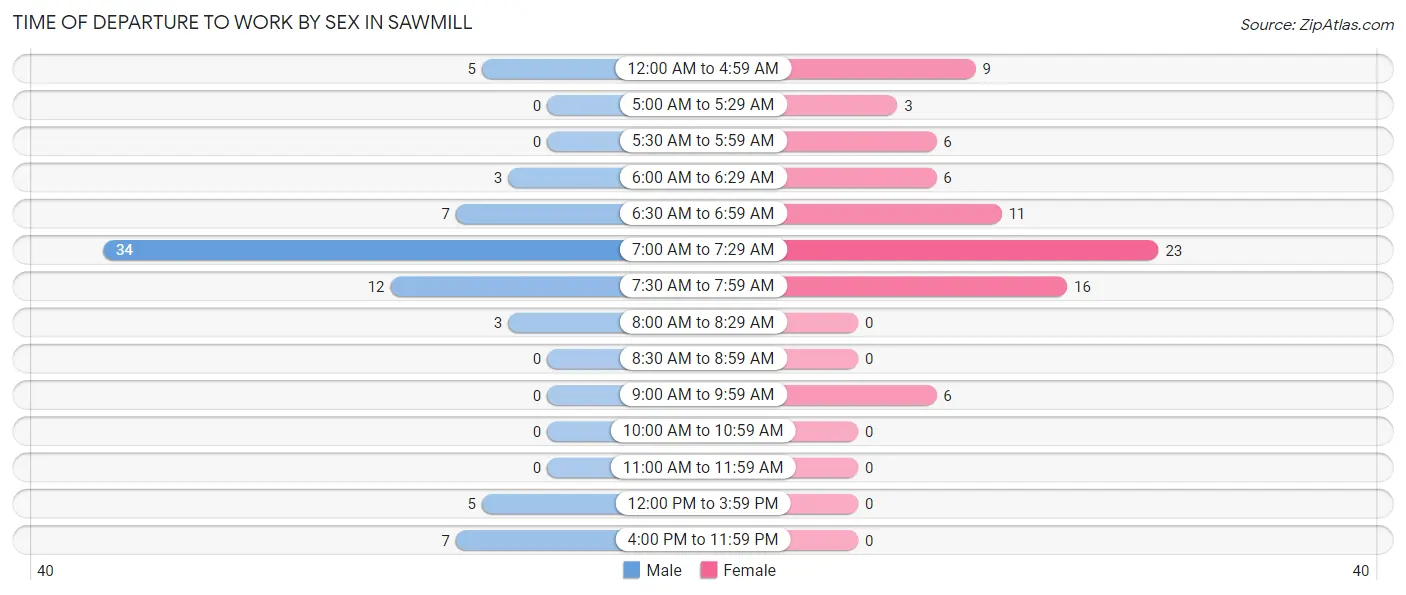
| Time of Departure | Male | Female |
| 12:00 AM to 4:59 AM | 5 (6.6%) | 9 (11.3%) |
| 5:00 AM to 5:29 AM | 0 (0.0%) | 3 (3.7%) |
| 5:30 AM to 5:59 AM | 0 (0.0%) | 6 (7.5%) |
| 6:00 AM to 6:29 AM | 3 (4.0%) | 6 (7.5%) |
| 6:30 AM to 6:59 AM | 7 (9.2%) | 11 (13.8%) |
| 7:00 AM to 7:29 AM | 34 (44.7%) | 23 (28.7%) |
| 7:30 AM to 7:59 AM | 12 (15.8%) | 16 (20.0%) |
| 8:00 AM to 8:29 AM | 3 (4.0%) | 0 (0.0%) |
| 8:30 AM to 8:59 AM | 0 (0.0%) | 0 (0.0%) |
| 9:00 AM to 9:59 AM | 0 (0.0%) | 6 (7.5%) |
| 10:00 AM to 10:59 AM | 0 (0.0%) | 0 (0.0%) |
| 11:00 AM to 11:59 AM | 0 (0.0%) | 0 (0.0%) |
| 12:00 PM to 3:59 PM | 5 (6.6%) | 0 (0.0%) |
| 4:00 PM to 11:59 PM | 7 (9.2%) | 0 (0.0%) |
| Total | 76 (100.0%) | 80 (100.0%) |
Housing Occupancy in Sawmill
Occupancy by Ownership in Sawmill
Of the total 171 dwellings in Sawmill, owner-occupied units account for 153 (89.5%), while renter-occupied units make up 18 (10.5%).
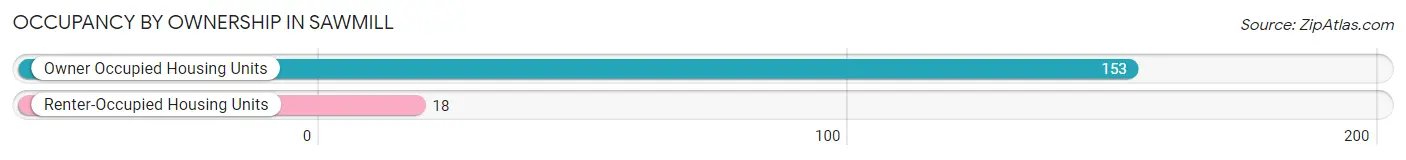
| Occupancy | # Housing Units | % Housing Units |
| Owner Occupied Housing Units | 153 | 89.5% |
| Renter-Occupied Housing Units | 18 | 10.5% |
| Total Occupied Housing Units | 171 | 100.0% |
Occupancy by Household Size in Sawmill
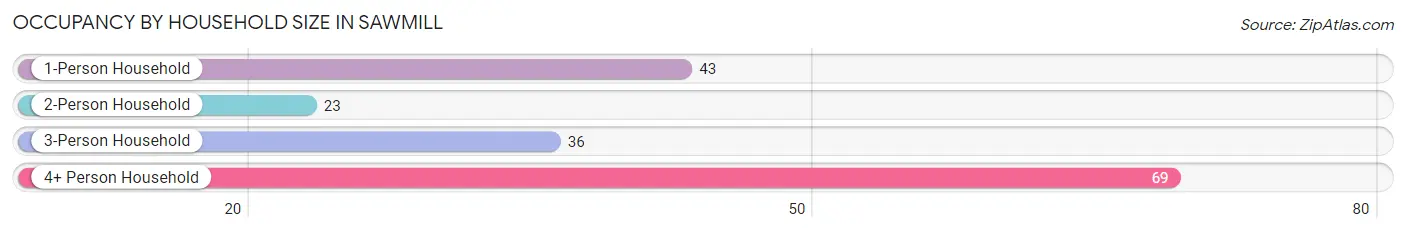
| Household Size | # Housing Units | % Housing Units |
| 1-Person Household | 43 | 25.2% |
| 2-Person Household | 23 | 13.5% |
| 3-Person Household | 36 | 21.0% |
| 4+ Person Household | 69 | 40.4% |
| Total Housing Units | 171 | 100.0% |
Occupancy by Ownership by Household Size in Sawmill
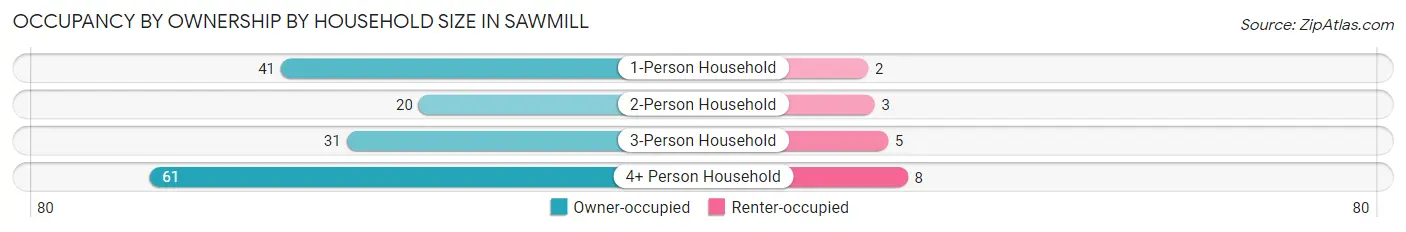
| Household Size | Owner-occupied | Renter-occupied |
| 1-Person Household | 41 (95.4%) | 2 (4.6%) |
| 2-Person Household | 20 (87.0%) | 3 (13.0%) |
| 3-Person Household | 31 (86.1%) | 5 (13.9%) |
| 4+ Person Household | 61 (88.4%) | 8 (11.6%) |
| Total Housing Units | 153 (89.5%) | 18 (10.5%) |
Occupancy by Educational Attainment in Sawmill
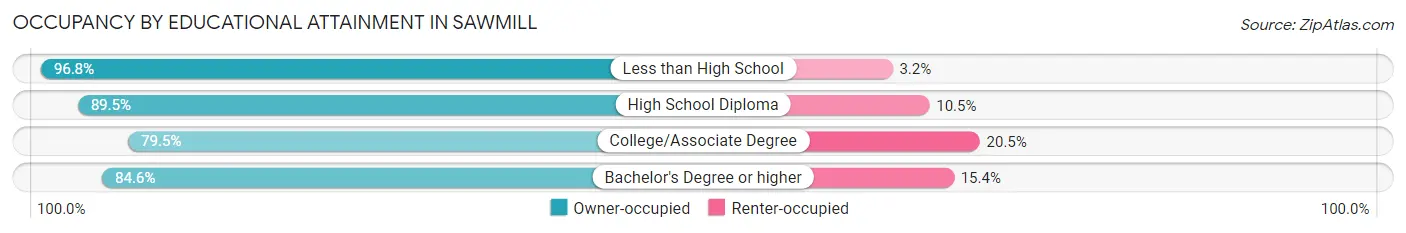
| Household Size | Owner-occupied | Renter-occupied |
| Less than High School | 60 (96.8%) | 2 (3.2%) |
| High School Diploma | 51 (89.5%) | 6 (10.5%) |
| College/Associate Degree | 31 (79.5%) | 8 (20.5%) |
| Bachelor's Degree or higher | 11 (84.6%) | 2 (15.4%) |
Occupancy by Age of Householder in Sawmill
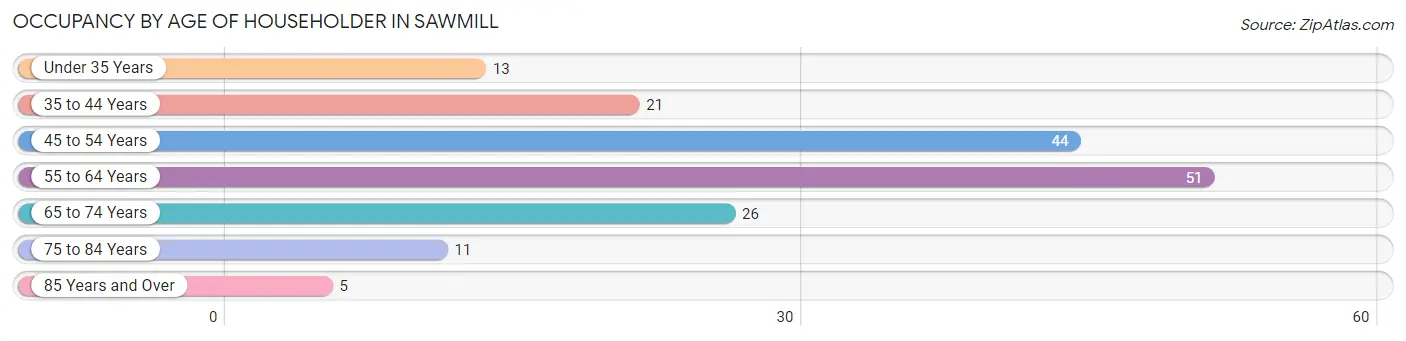
| Age Bracket | # Households | % Households |
| Under 35 Years | 13 | 7.6% |
| 35 to 44 Years | 21 | 12.3% |
| 45 to 54 Years | 44 | 25.7% |
| 55 to 64 Years | 51 | 29.8% |
| 65 to 74 Years | 26 | 15.2% |
| 75 to 84 Years | 11 | 6.4% |
| 85 Years and Over | 5 | 2.9% |
| Total | 171 | 100.0% |
Housing Finances in Sawmill
Median Income by Occupancy in Sawmill
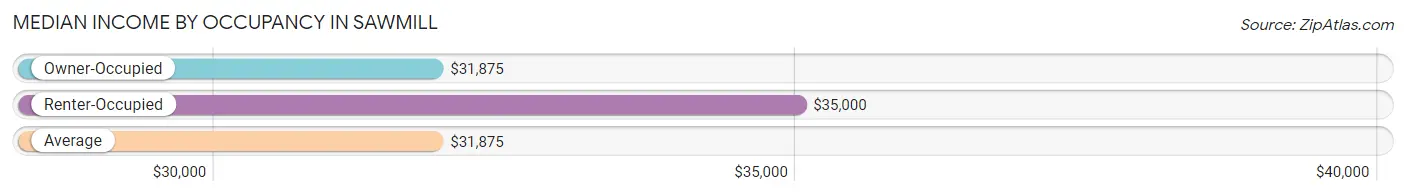
| Occupancy Type | # Households | Median Income |
| Owner-Occupied | 153 (89.5%) | $31,875 |
| Renter-Occupied | 18 (10.5%) | $35,000 |
| Average | 171 (100.0%) | $31,875 |
Occupancy by Householder Income Bracket in Sawmill
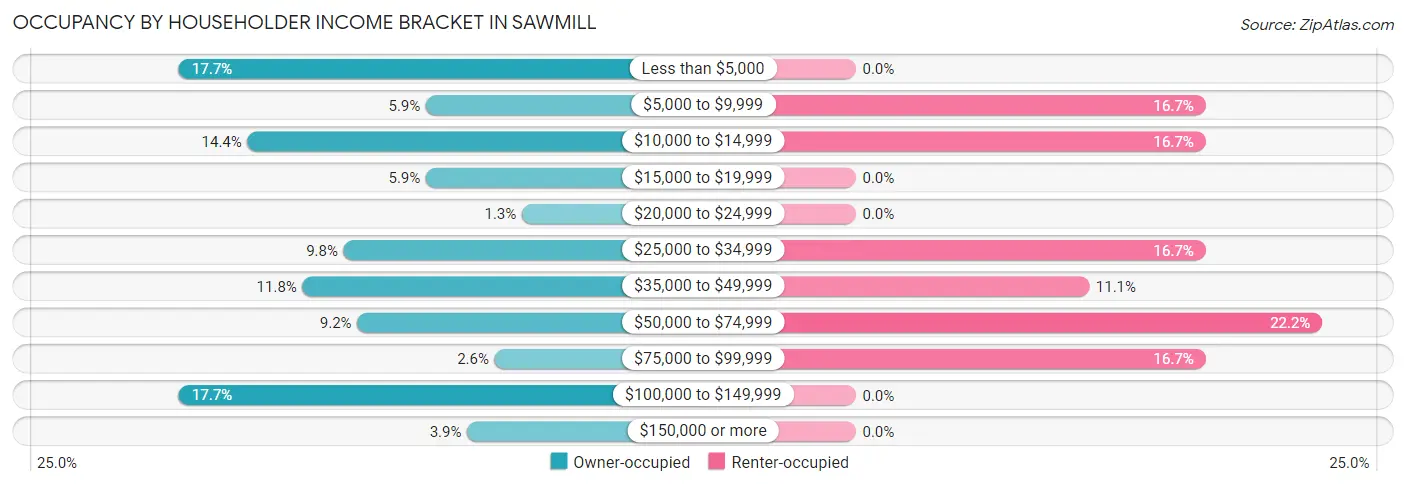
| Income Bracket | Owner-occupied | Renter-occupied |
| Less than $5,000 | 27 (17.6%) | 0 (0.0%) |
| $5,000 to $9,999 | 9 (5.9%) | 3 (16.7%) |
| $10,000 to $14,999 | 22 (14.4%) | 3 (16.7%) |
| $15,000 to $19,999 | 9 (5.9%) | 0 (0.0%) |
| $20,000 to $24,999 | 2 (1.3%) | 0 (0.0%) |
| $25,000 to $34,999 | 15 (9.8%) | 3 (16.7%) |
| $35,000 to $49,999 | 18 (11.8%) | 2 (11.1%) |
| $50,000 to $74,999 | 14 (9.1%) | 4 (22.2%) |
| $75,000 to $99,999 | 4 (2.6%) | 3 (16.7%) |
| $100,000 to $149,999 | 27 (17.6%) | 0 (0.0%) |
| $150,000 or more | 6 (3.9%) | 0 (0.0%) |
| Total | 153 (100.0%) | 18 (100.0%) |
Monthly Housing Cost Tiers in Sawmill
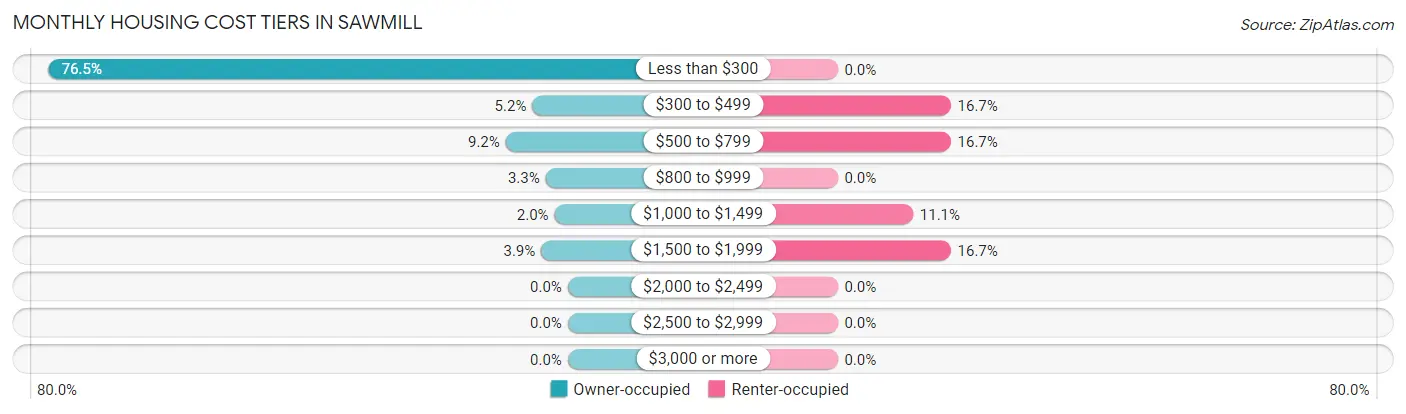
| Monthly Cost | Owner-occupied | Renter-occupied |
| Less than $300 | 117 (76.5%) | 0 (0.0%) |
| $300 to $499 | 8 (5.2%) | 3 (16.7%) |
| $500 to $799 | 14 (9.1%) | 3 (16.7%) |
| $800 to $999 | 5 (3.3%) | 0 (0.0%) |
| $1,000 to $1,499 | 3 (2.0%) | 2 (11.1%) |
| $1,500 to $1,999 | 6 (3.9%) | 3 (16.7%) |
| $2,000 to $2,499 | 0 (0.0%) | 0 (0.0%) |
| $2,500 to $2,999 | 0 (0.0%) | 0 (0.0%) |
| $3,000 or more | 0 (0.0%) | 0 (0.0%) |
| Total | 153 (100.0%) | 18 (100.0%) |
Physical Housing Characteristics in Sawmill
Housing Structures in Sawmill
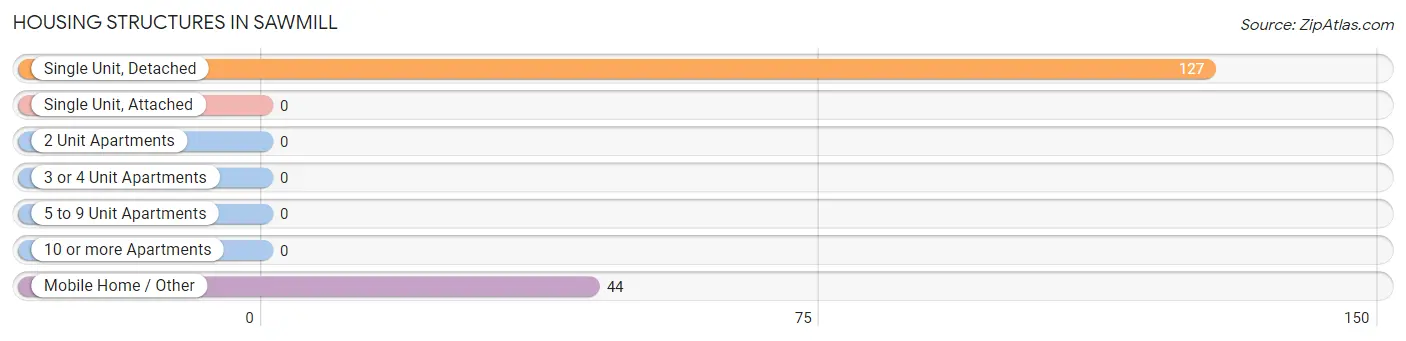
| Structure Type | # Housing Units | % Housing Units |
| Single Unit, Detached | 127 | 74.3% |
| Single Unit, Attached | 0 | 0.0% |
| 2 Unit Apartments | 0 | 0.0% |
| 3 or 4 Unit Apartments | 0 | 0.0% |
| 5 to 9 Unit Apartments | 0 | 0.0% |
| 10 or more Apartments | 0 | 0.0% |
| Mobile Home / Other | 44 | 25.7% |
| Total | 171 | 100.0% |
Housing Structures by Occupancy in Sawmill
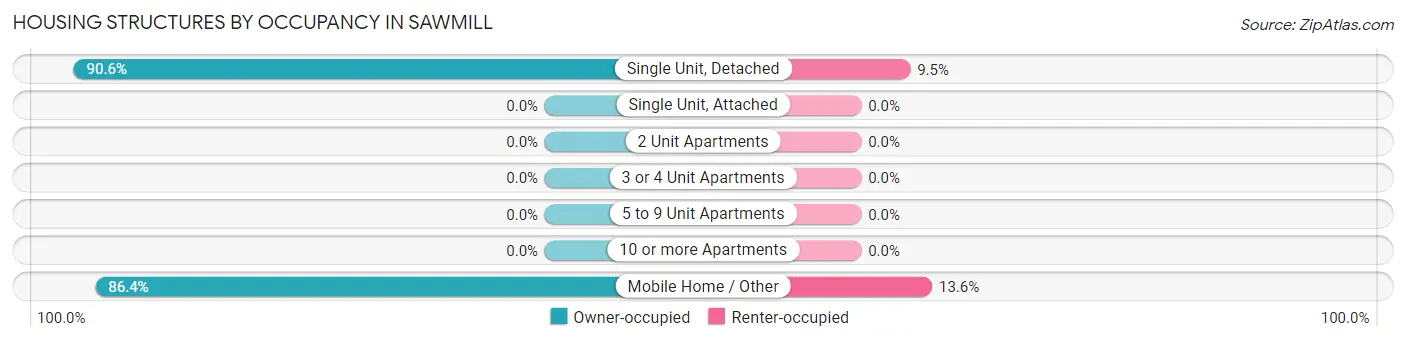
| Structure Type | Owner-occupied | Renter-occupied |
| Single Unit, Detached | 115 (90.5%) | 12 (9.5%) |
| Single Unit, Attached | 0 (0.0%) | 0 (0.0%) |
| 2 Unit Apartments | 0 (0.0%) | 0 (0.0%) |
| 3 or 4 Unit Apartments | 0 (0.0%) | 0 (0.0%) |
| 5 to 9 Unit Apartments | 0 (0.0%) | 0 (0.0%) |
| 10 or more Apartments | 0 (0.0%) | 0 (0.0%) |
| Mobile Home / Other | 38 (86.4%) | 6 (13.6%) |
| Total | 153 (89.5%) | 18 (10.5%) |
Housing Structures by Number of Rooms in Sawmill
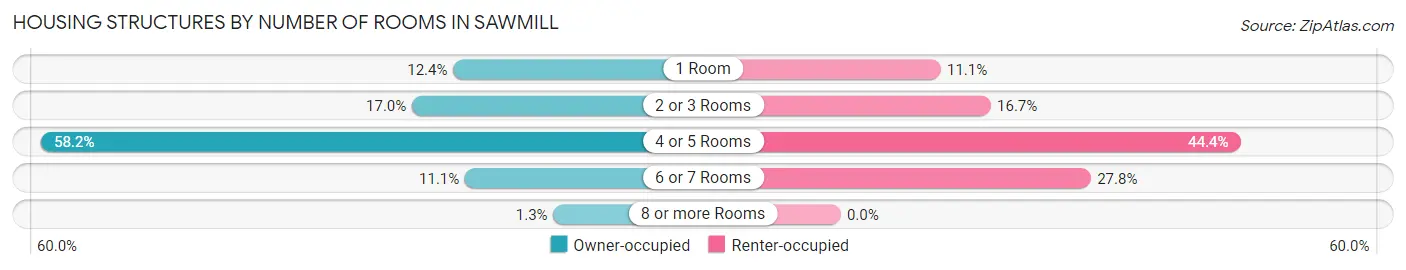
| Number of Rooms | Owner-occupied | Renter-occupied |
| 1 Room | 19 (12.4%) | 2 (11.1%) |
| 2 or 3 Rooms | 26 (17.0%) | 3 (16.7%) |
| 4 or 5 Rooms | 89 (58.2%) | 8 (44.4%) |
| 6 or 7 Rooms | 17 (11.1%) | 5 (27.8%) |
| 8 or more Rooms | 2 (1.3%) | 0 (0.0%) |
| Total | 153 (100.0%) | 18 (100.0%) |
Housing Structure by Heating Type in Sawmill
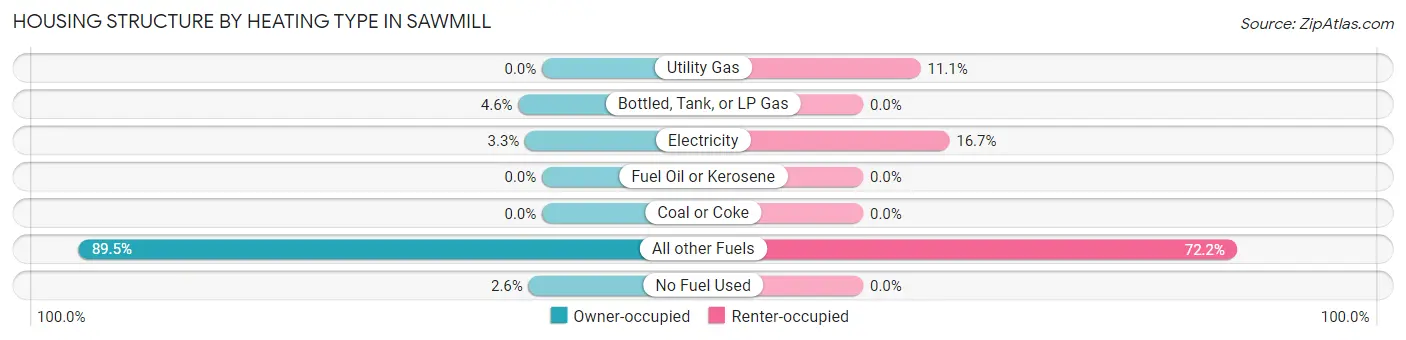
| Heating Type | Owner-occupied | Renter-occupied |
| Utility Gas | 0 (0.0%) | 2 (11.1%) |
| Bottled, Tank, or LP Gas | 7 (4.6%) | 0 (0.0%) |
| Electricity | 5 (3.3%) | 3 (16.7%) |
| Fuel Oil or Kerosene | 0 (0.0%) | 0 (0.0%) |
| Coal or Coke | 0 (0.0%) | 0 (0.0%) |
| All other Fuels | 137 (89.5%) | 13 (72.2%) |
| No Fuel Used | 4 (2.6%) | 0 (0.0%) |
| Total | 153 (100.0%) | 18 (100.0%) |
Household Vehicle Usage in Sawmill
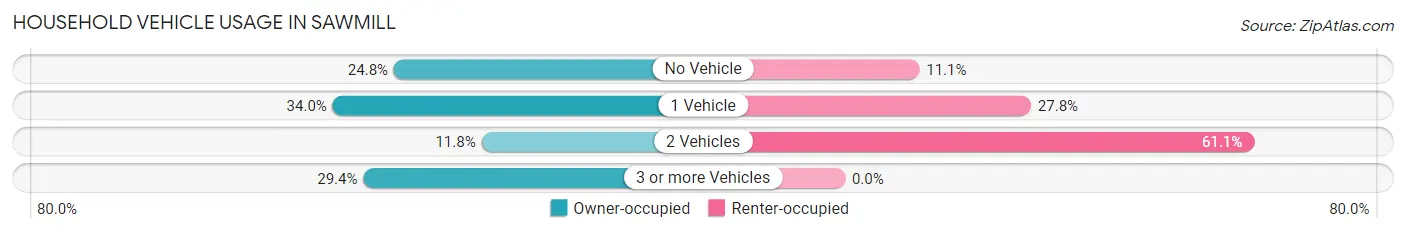
| Vehicles per Household | Owner-occupied | Renter-occupied |
| No Vehicle | 38 (24.8%) | 2 (11.1%) |
| 1 Vehicle | 52 (34.0%) | 5 (27.8%) |
| 2 Vehicles | 18 (11.8%) | 11 (61.1%) |
| 3 or more Vehicles | 45 (29.4%) | 0 (0.0%) |
| Total | 153 (100.0%) | 18 (100.0%) |
Real Estate & Mortgages in Sawmill
Real Estate and Mortgage Overview in Sawmill
| Characteristic | Without Mortgage | With Mortgage |
| Housing Units | 134 | 19 |
| Median Property Value | $30,700 | $0 |
| Median Household Income | $20,000 | $0 |
| Monthly Housing Costs | $159 | $0 |
| Real Estate Taxes | - | - |
Property Value by Mortgage Status in Sawmill
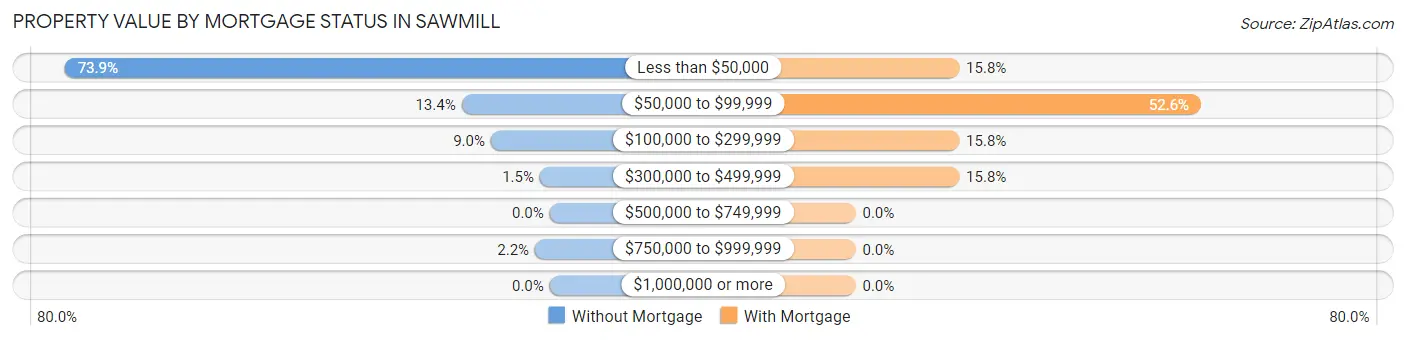
| Property Value | Without Mortgage | With Mortgage |
| Less than $50,000 | 99 (73.9%) | 3 (15.8%) |
| $50,000 to $99,999 | 18 (13.4%) | 10 (52.6%) |
| $100,000 to $299,999 | 12 (9.0%) | 3 (15.8%) |
| $300,000 to $499,999 | 2 (1.5%) | 3 (15.8%) |
| $500,000 to $749,999 | 0 (0.0%) | 0 (0.0%) |
| $750,000 to $999,999 | 3 (2.2%) | 0 (0.0%) |
| $1,000,000 or more | 0 (0.0%) | 0 (0.0%) |
| Total | 134 (100.0%) | 19 (100.0%) |
Household Income by Mortgage Status in Sawmill
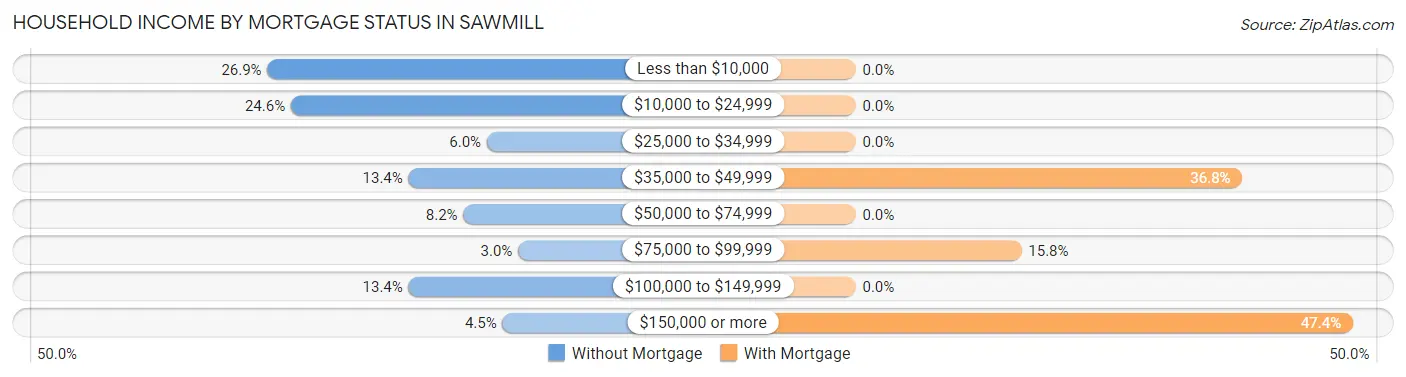
| Household Income | Without Mortgage | With Mortgage |
| Less than $10,000 | 36 (26.9%) | 0 (0.0%) |
| $10,000 to $24,999 | 33 (24.6%) | 0 (0.0%) |
| $25,000 to $34,999 | 8 (6.0%) | 0 (0.0%) |
| $35,000 to $49,999 | 18 (13.4%) | 7 (36.8%) |
| $50,000 to $74,999 | 11 (8.2%) | 0 (0.0%) |
| $75,000 to $99,999 | 4 (3.0%) | 3 (15.8%) |
| $100,000 to $149,999 | 18 (13.4%) | 0 (0.0%) |
| $150,000 or more | 6 (4.5%) | 9 (47.4%) |
| Total | 134 (100.0%) | 19 (100.0%) |
Property Value to Household Income Ratio in Sawmill
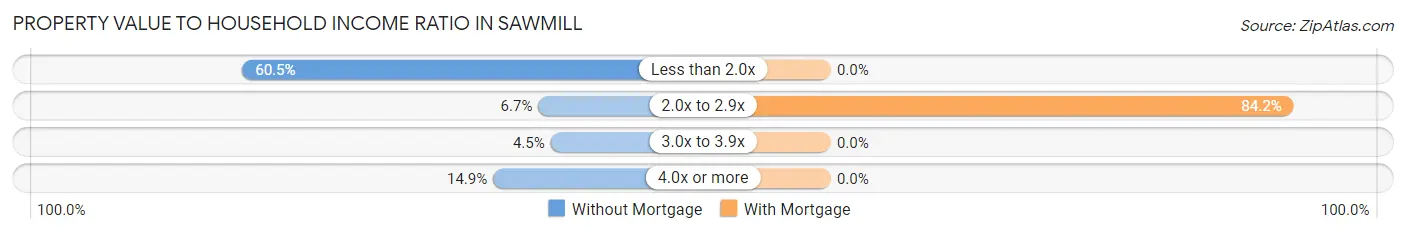
| Value-to-Income Ratio | Without Mortgage | With Mortgage |
| Less than 2.0x | 81 (60.5%) | 0 (0.0%) |
| 2.0x to 2.9x | 9 (6.7%) | 16 (84.2%) |
| 3.0x to 3.9x | 6 (4.5%) | 0 (0.0%) |
| 4.0x or more | 20 (14.9%) | 0 (0.0%) |
| Total | 134 (100.0%) | 19 (100.0%) |
Real Estate Taxes by Mortgage Status in Sawmill
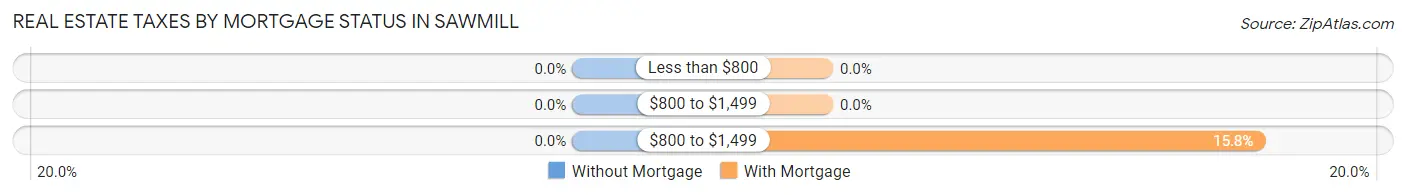
| Property Taxes | Without Mortgage | With Mortgage |
| Less than $800 | 0 (0.0%) | 0 (0.0%) |
| $800 to $1,499 | 0 (0.0%) | 0 (0.0%) |
| $800 to $1,499 | 0 (0.0%) | 3 (15.8%) |
| Total | 134 (100.0%) | 19 (100.0%) |
Health & Disability in Sawmill
Health Insurance Coverage by Age in Sawmill
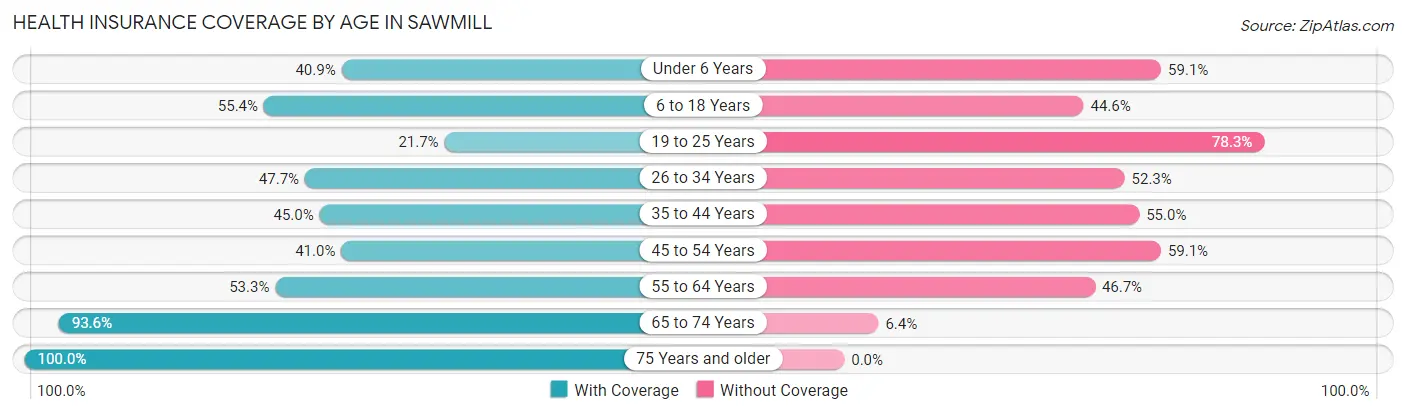
| Age Bracket | With Coverage | Without Coverage |
| Under 6 Years | 18 (40.9%) | 26 (59.1%) |
| 6 to 18 Years | 103 (55.4%) | 83 (44.6%) |
| 19 to 25 Years | 28 (21.7%) | 101 (78.3%) |
| 26 to 34 Years | 42 (47.7%) | 46 (52.3%) |
| 35 to 44 Years | 36 (45.0%) | 44 (55.0%) |
| 45 to 54 Years | 43 (40.9%) | 62 (59.1%) |
| 55 to 64 Years | 49 (53.3%) | 43 (46.7%) |
| 65 to 74 Years | 44 (93.6%) | 3 (6.4%) |
| 75 Years and older | 23 (100.0%) | 0 (0.0%) |
| Total | 386 (48.6%) | 408 (51.4%) |
Health Insurance Coverage by Citizenship Status in Sawmill
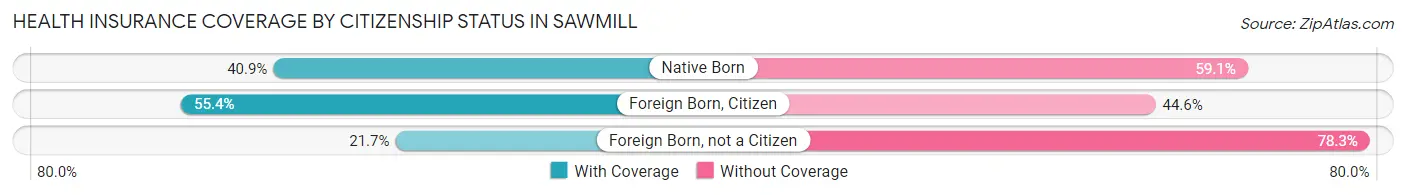
| Citizenship Status | With Coverage | Without Coverage |
| Native Born | 18 (40.9%) | 26 (59.1%) |
| Foreign Born, Citizen | 103 (55.4%) | 83 (44.6%) |
| Foreign Born, not a Citizen | 28 (21.7%) | 101 (78.3%) |
Health Insurance Coverage by Household Income in Sawmill
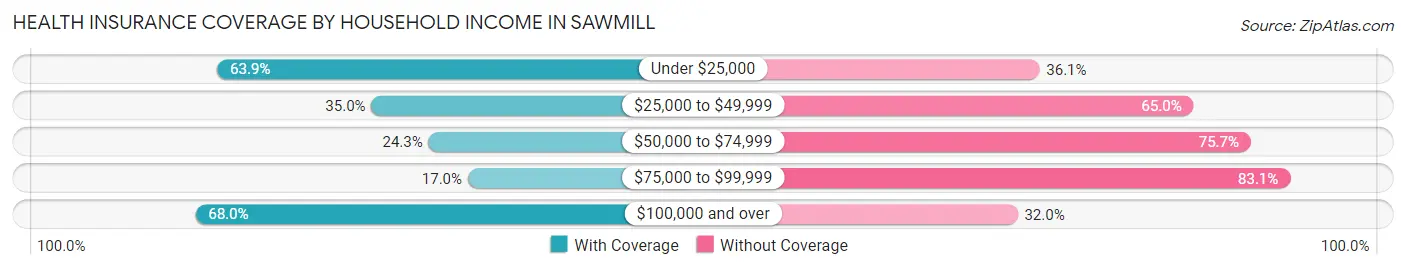
| Household Income | With Coverage | Without Coverage |
| Under $25,000 | 163 (63.9%) | 92 (36.1%) |
| $25,000 to $49,999 | 69 (35.0%) | 128 (65.0%) |
| $50,000 to $74,999 | 27 (24.3%) | 84 (75.7%) |
| $75,000 to $99,999 | 10 (17.0%) | 49 (83.1%) |
| $100,000 and over | 117 (68.0%) | 55 (32.0%) |
Public vs Private Health Insurance Coverage by Age in Sawmill
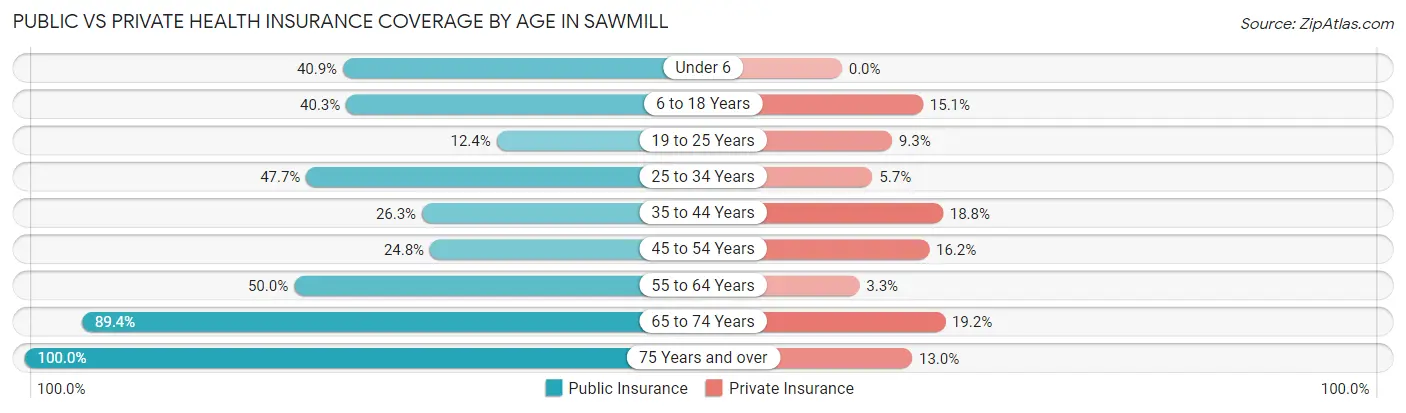
| Age Bracket | Public Insurance | Private Insurance |
| Under 6 | 18 (40.9%) | 0 (0.0%) |
| 6 to 18 Years | 75 (40.3%) | 28 (15.0%) |
| 19 to 25 Years | 16 (12.4%) | 12 (9.3%) |
| 25 to 34 Years | 42 (47.7%) | 5 (5.7%) |
| 35 to 44 Years | 21 (26.3%) | 15 (18.8%) |
| 45 to 54 Years | 26 (24.8%) | 17 (16.2%) |
| 55 to 64 Years | 46 (50.0%) | 3 (3.3%) |
| 65 to 74 Years | 42 (89.4%) | 9 (19.2%) |
| 75 Years and over | 23 (100.0%) | 3 (13.0%) |
| Total | 309 (38.9%) | 92 (11.6%) |
Disability Status by Sex by Age in Sawmill
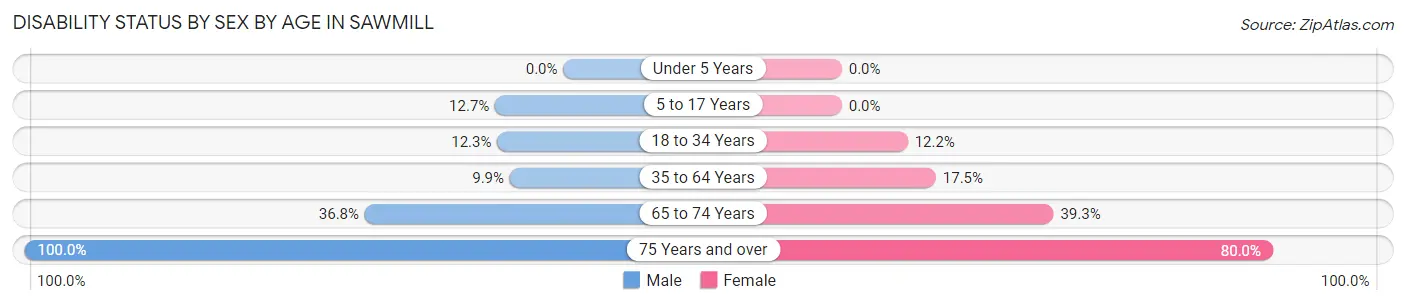
| Age Bracket | Male | Female |
| Under 5 Years | 0 (0.0%) | 0 (0.0%) |
| 5 to 17 Years | 10 (12.7%) | 0 (0.0%) |
| 18 to 34 Years | 13 (12.3%) | 17 (12.2%) |
| 35 to 64 Years | 15 (9.9%) | 22 (17.5%) |
| 65 to 74 Years | 7 (36.8%) | 11 (39.3%) |
| 75 Years and over | 13 (100.0%) | 8 (80.0%) |
Disability Class by Sex by Age in Sawmill
Disability Class: Hearing Difficulty
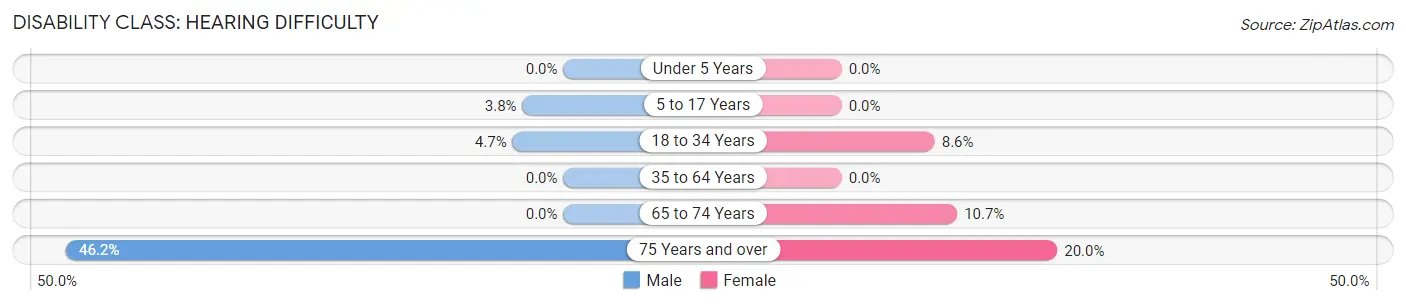
| Age Bracket | Male | Female |
| Under 5 Years | 0 (0.0%) | 0 (0.0%) |
| 5 to 17 Years | 3 (3.8%) | 0 (0.0%) |
| 18 to 34 Years | 5 (4.7%) | 12 (8.6%) |
| 35 to 64 Years | 0 (0.0%) | 0 (0.0%) |
| 65 to 74 Years | 0 (0.0%) | 3 (10.7%) |
| 75 Years and over | 6 (46.2%) | 2 (20.0%) |
Disability Class: Vision Difficulty
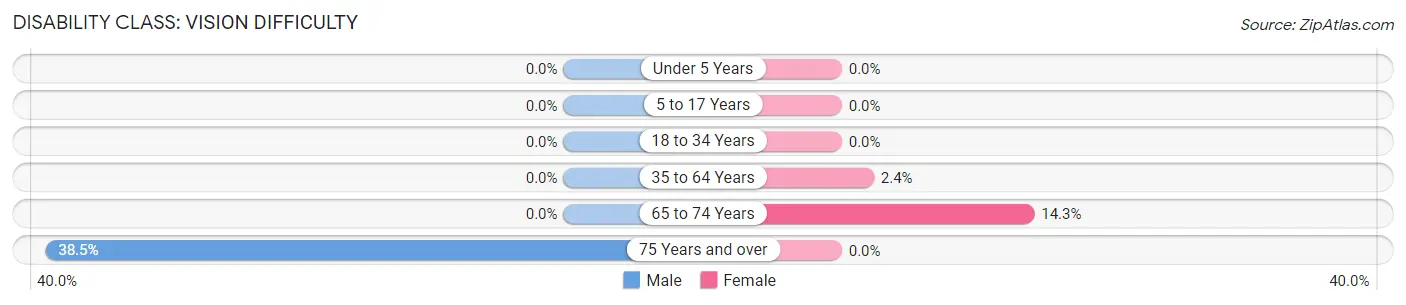
| Age Bracket | Male | Female |
| Under 5 Years | 0 (0.0%) | 0 (0.0%) |
| 5 to 17 Years | 0 (0.0%) | 0 (0.0%) |
| 18 to 34 Years | 0 (0.0%) | 0 (0.0%) |
| 35 to 64 Years | 0 (0.0%) | 3 (2.4%) |
| 65 to 74 Years | 0 (0.0%) | 4 (14.3%) |
| 75 Years and over | 5 (38.5%) | 0 (0.0%) |
Disability Class: Cognitive Difficulty
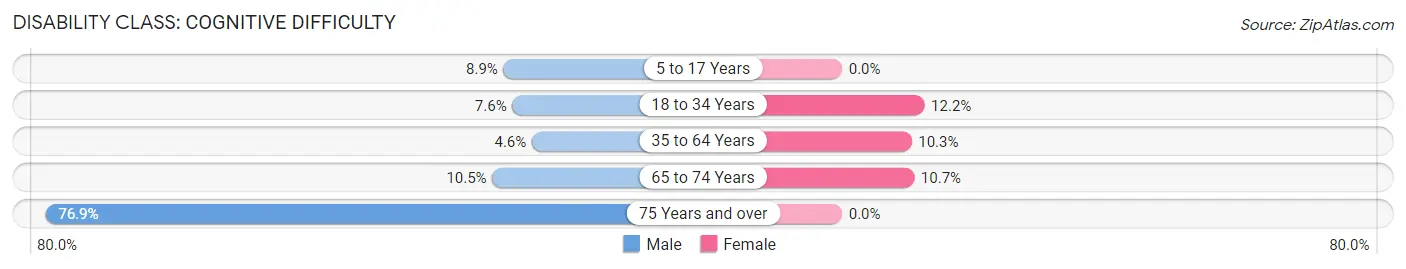
| Age Bracket | Male | Female |
| 5 to 17 Years | 7 (8.9%) | 0 (0.0%) |
| 18 to 34 Years | 8 (7.5%) | 17 (12.2%) |
| 35 to 64 Years | 7 (4.6%) | 13 (10.3%) |
| 65 to 74 Years | 2 (10.5%) | 3 (10.7%) |
| 75 Years and over | 10 (76.9%) | 0 (0.0%) |
Disability Class: Ambulatory Difficulty
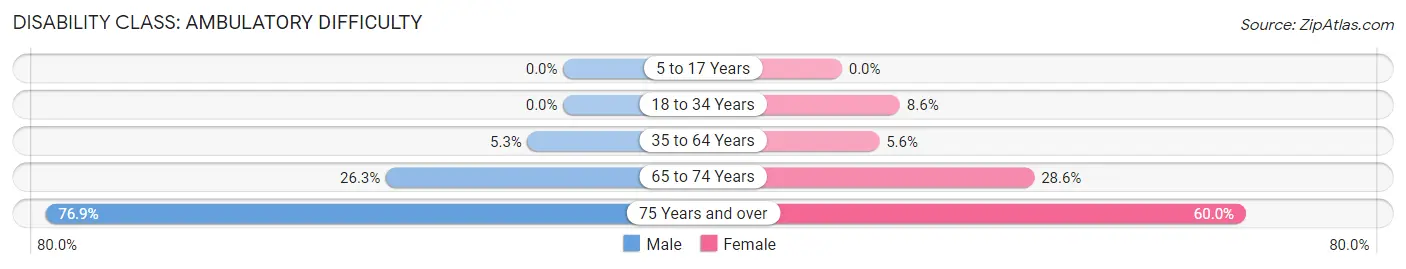
| Age Bracket | Male | Female |
| 5 to 17 Years | 0 (0.0%) | 0 (0.0%) |
| 18 to 34 Years | 0 (0.0%) | 12 (8.6%) |
| 35 to 64 Years | 8 (5.3%) | 7 (5.6%) |
| 65 to 74 Years | 5 (26.3%) | 8 (28.6%) |
| 75 Years and over | 10 (76.9%) | 6 (60.0%) |
Disability Class: Self-Care Difficulty
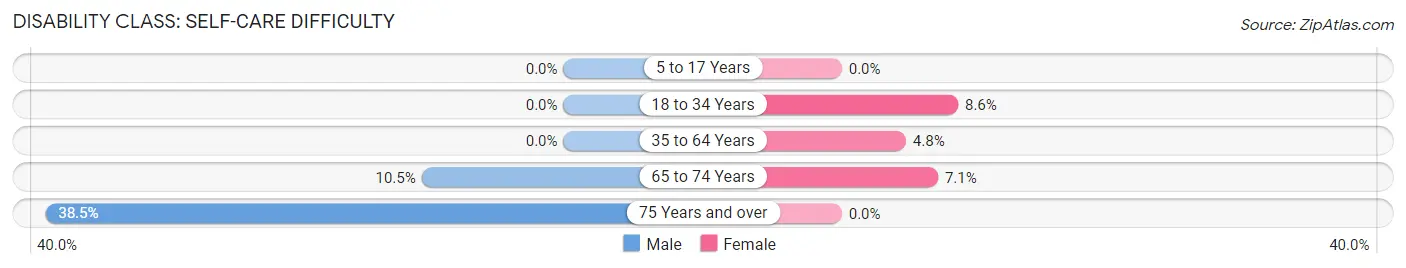
| Age Bracket | Male | Female |
| 5 to 17 Years | 0 (0.0%) | 0 (0.0%) |
| 18 to 34 Years | 0 (0.0%) | 12 (8.6%) |
| 35 to 64 Years | 0 (0.0%) | 6 (4.8%) |
| 65 to 74 Years | 2 (10.5%) | 2 (7.1%) |
| 75 Years and over | 5 (38.5%) | 0 (0.0%) |
Technology Access in Sawmill
Computing Device Access in Sawmill
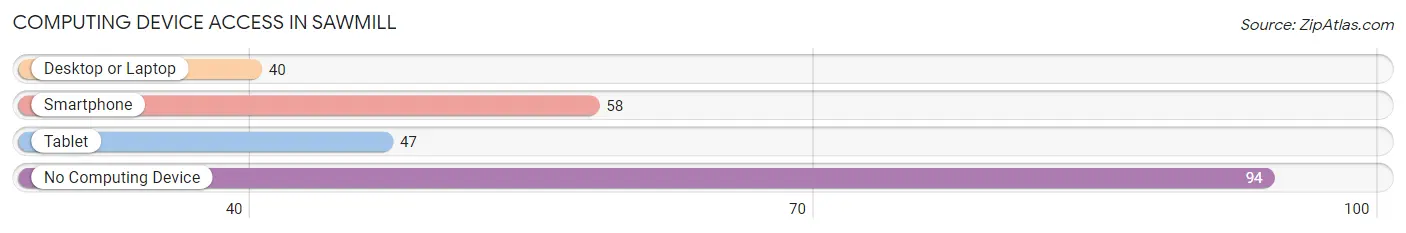
| Device Type | # Households | % Households |
| Desktop or Laptop | 40 | 23.4% |
| Smartphone | 58 | 33.9% |
| Tablet | 47 | 27.5% |
| No Computing Device | 94 | 55.0% |
| Total | 171 | 100.0% |
Internet Access in Sawmill
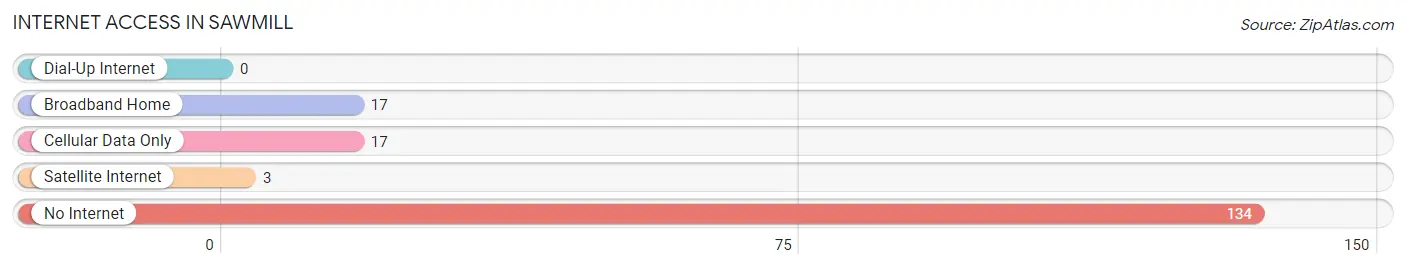
| Internet Type | # Households | % Households |
| Dial-Up Internet | 0 | 0.0% |
| Broadband Home | 17 | 9.9% |
| Cellular Data Only | 17 | 9.9% |
| Satellite Internet | 3 | 1.8% |
| No Internet | 134 | 78.4% |
| Total | 171 | 100.0% |
Sawmill Summary
Sawmill, Arizona is a small unincorporated community located in the Apache County of the state of Arizona. It is situated in the White Mountains of Arizona, approximately 20 miles east of the city of Show Low. The community is located at an elevation of 6,400 feet and is surrounded by the Apache-Sitgreaves National Forest. The population of Sawmill was estimated to be around 200 people in 2020.
History
Sawmill was established in the late 1800s as a logging camp. The town was named after the sawmill that was built in the area to process the lumber that was harvested from the surrounding forests. The sawmill was owned by the White Mountain Lumber Company, which was founded in 1891. The company operated the sawmill until it closed in the early 1900s.
The town of Sawmill was officially established in 1912. The town was initially a small logging community, but it soon grew to include a post office, a general store, a school, and a few other businesses. The town was also home to a number of small farms and ranches.
In the 1950s, the town began to decline as the logging industry in the area declined. The sawmill closed and the population of the town began to dwindle. In the 1970s, the town was almost abandoned, but it was eventually revived in the 1980s when the Apache-Sitgreaves National Forest was established.
Geography
Sawmill is located in the White Mountains of Arizona, approximately 20 miles east of the city of Show Low. The town is situated at an elevation of 6,400 feet and is surrounded by the Apache-Sitgreaves National Forest. The area is known for its rugged terrain and is home to a variety of wildlife, including elk, deer, and black bear.
The climate in Sawmill is generally mild, with temperatures ranging from the mid-30s in the winter to the mid-80s in the summer. The area receives an average of 20 inches of precipitation per year, with most of it falling in the form of snow in the winter months.
Economy
The economy of Sawmill is largely based on tourism and recreation. The town is a popular destination for outdoor enthusiasts, as it is surrounded by the Apache-Sitgreaves National Forest. The area is known for its hiking trails, fishing spots, and camping sites.
The town is also home to a number of small businesses, including a general store, a post office, and a few restaurants. The town is also home to a number of small farms and ranches.
Demographics
The population of Sawmill was estimated to be around 200 people in 2020. The town is predominantly white, with a small Hispanic population. The median household income in the town is around $30,000, and the median home value is around $100,000. The town has a high rate of poverty, with around 25% of the population living below the poverty line.
Common Questions
What is Per Capita Income in Sawmill?
Per Capita income in Sawmill is $13,088.
What is the Median Family Income in Sawmill?
Median Family Income in Sawmill is $36,667.
What is the Median Household income in Sawmill?
Median Household Income in Sawmill is $31,875.
What is Family Income Deficit in Sawmill?
Family Income Deficit in Sawmill is $16,590.
Families that are below poverty line in Sawmill earn $16,590 less on average than the poverty threshold level.
What is Inequality or Gini Index in Sawmill?
Inequality or Gini Index in Sawmill is 0.54.
What is the Total Population of Sawmill?
Total Population of Sawmill is 794.
What is the Total Male Population of Sawmill?
Total Male Population of Sawmill is 389.
What is the Total Female Population of Sawmill?
Total Female Population of Sawmill is 405.
What is the Ratio of Males per 100 Females in Sawmill?
There are 96.05 Males per 100 Females in Sawmill.
What is the Ratio of Females per 100 Males in Sawmill?
There are 104.11 Females per 100 Males in Sawmill.
What is the Median Population Age in Sawmill?
Median Population Age in Sawmill is 28.0 Years.
What is the Average Family Size in Sawmill
Average Family Size in Sawmill is 5.8 People.
What is the Average Household Size in Sawmill
Average Household Size in Sawmill is 4.6 People.
How Large is the Labor Force in Sawmill?
There are 229 People in the Labor Forcein in Sawmill.
What is the Percentage of People in the Labor Force in Sawmill?
36.2% of People are in the Labor Force in Sawmill.
What is the Unemployment Rate in Sawmill?
Unemployment Rate in Sawmill is 24.9%.