Rancho Mesa Verde, AZ Map & Demographics
Rancho Mesa Verde Map
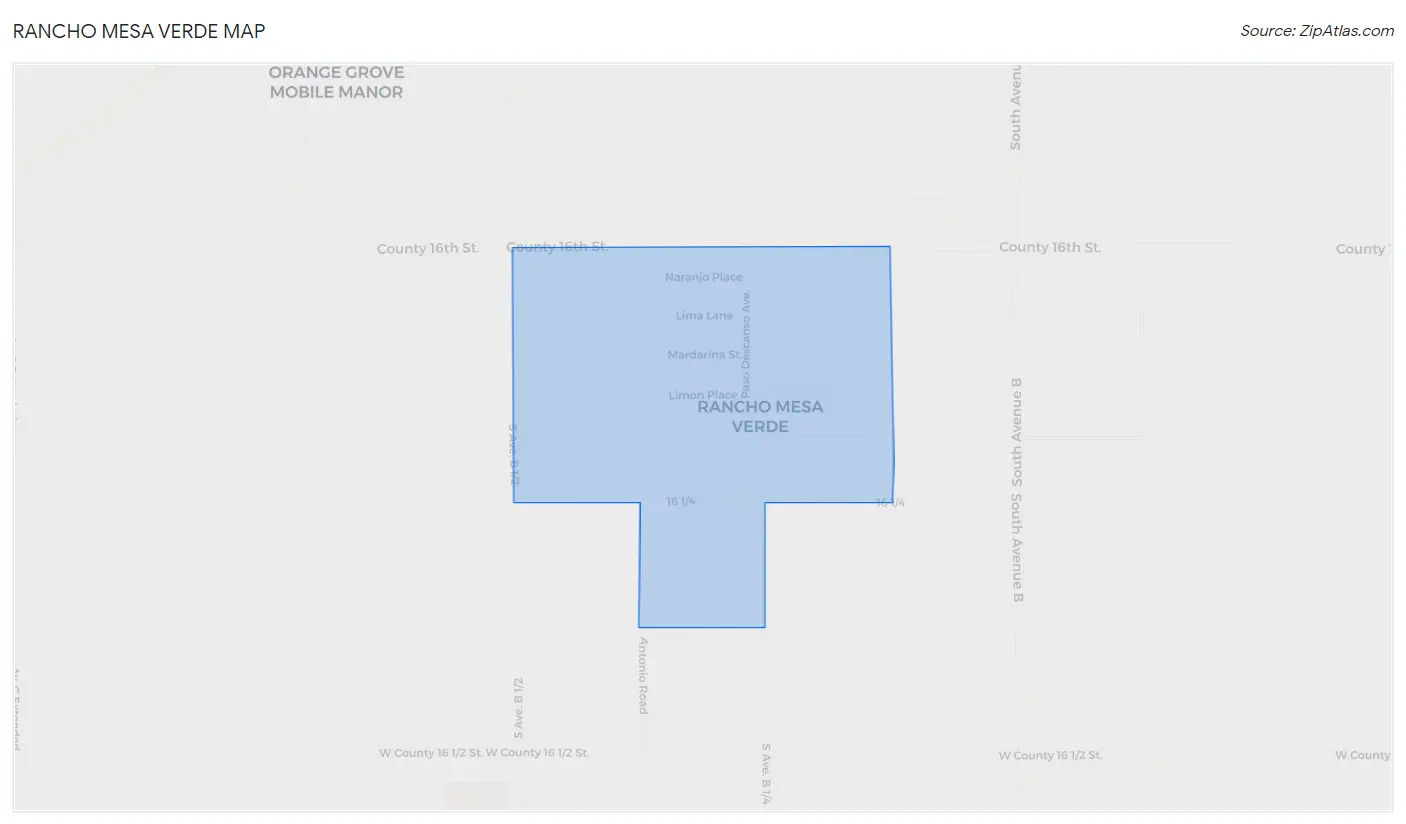
Rancho Mesa Verde Overview
$6,639
PER CAPITA INCOME
0.34
INEQUALITY / GINI INDEX
599
TOTAL POPULATION
369
MALE POPULATION
230
FEMALE POPULATION
160.43
MALES / 100 FEMALES
62.33
FEMALES / 100 MALES
17.9
MEDIAN AGE
4.5
AVG FAMILY SIZE
4.5
AVG HOUSEHOLD SIZE
87
LABOR FORCE [ PEOPLE ]
25.1%
PERCENT IN LABOR FORCE
51.7%
UNEMPLOYMENT RATE
Income in Rancho Mesa Verde
Income Overview in Rancho Mesa Verde
| Characteristic | Number | Measure |
| Per Capita Income | 599 | $6,639 |
| Median Family Income | 133 | $0 |
| Mean Family Income | 133 | $31,618 |
| Median Household Income | 133 | $0 |
| Mean Household Income | 133 | $31,618 |
| Income Deficit | 133 | $0 |
| Wage / Income Gap (%) | 599 | 0.00% |
| Wage / Income Gap ($) | 599 | 100.00¢ per $1 |
| Gini / Inequality Index | 599 | 0.34 |
Earnings by Sex in Rancho Mesa Verde
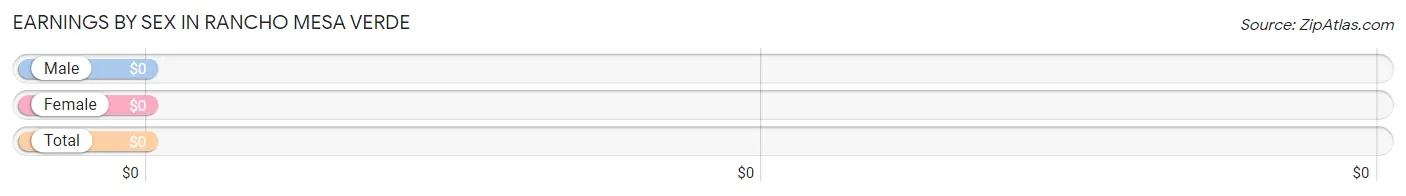
| Sex | Number | Average Earnings |
| Male | 42 (47.7%) | $0 |
| Female | 46 (52.3%) | $0 |
| Total | 88 (100.0%) | $0 |
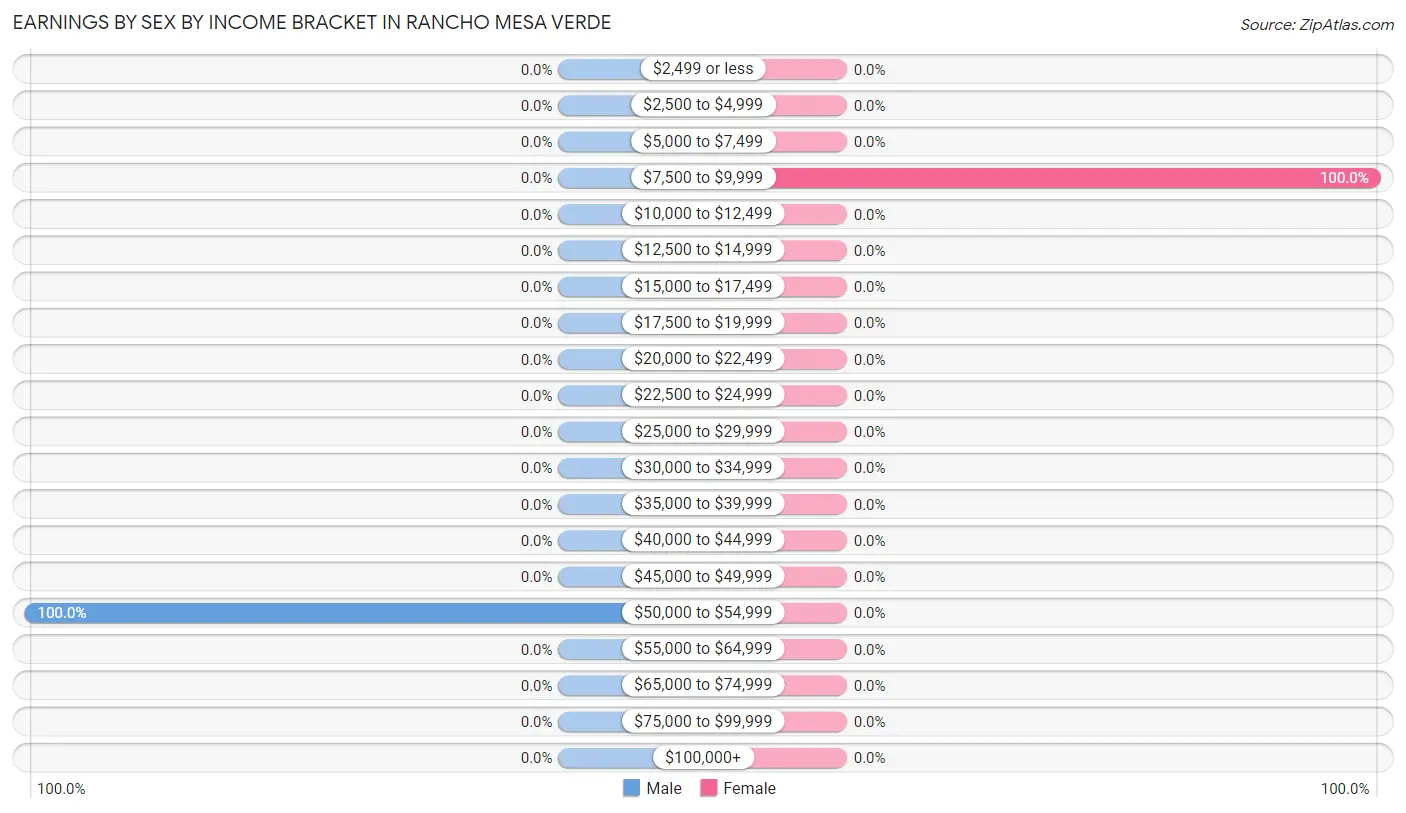
Earnings by Sex by Income Bracket in Rancho Mesa Verde
The most common earnings brackets in Rancho Mesa Verde are $50,000 to $54,999 for men (42 | 100.0%) and $7,500 to $9,999 for women (46 | 100.0%).
| Income | Male | Female |
| $2,499 or less | 0 (0.0%) | 0 (0.0%) |
| $2,500 to $4,999 | 0 (0.0%) | 0 (0.0%) |
| $5,000 to $7,499 | 0 (0.0%) | 0 (0.0%) |
| $7,500 to $9,999 | 0 (0.0%) | 46 (100.0%) |
| $10,000 to $12,499 | 0 (0.0%) | 0 (0.0%) |
| $12,500 to $14,999 | 0 (0.0%) | 0 (0.0%) |
| $15,000 to $17,499 | 0 (0.0%) | 0 (0.0%) |
| $17,500 to $19,999 | 0 (0.0%) | 0 (0.0%) |
| $20,000 to $22,499 | 0 (0.0%) | 0 (0.0%) |
| $22,500 to $24,999 | 0 (0.0%) | 0 (0.0%) |
| $25,000 to $29,999 | 0 (0.0%) | 0 (0.0%) |
| $30,000 to $34,999 | 0 (0.0%) | 0 (0.0%) |
| $35,000 to $39,999 | 0 (0.0%) | 0 (0.0%) |
| $40,000 to $44,999 | 0 (0.0%) | 0 (0.0%) |
| $45,000 to $49,999 | 0 (0.0%) | 0 (0.0%) |
| $50,000 to $54,999 | 42 (100.0%) | 0 (0.0%) |
| $55,000 to $64,999 | 0 (0.0%) | 0 (0.0%) |
| $65,000 to $74,999 | 0 (0.0%) | 0 (0.0%) |
| $75,000 to $99,999 | 0 (0.0%) | 0 (0.0%) |
| $100,000+ | 0 (0.0%) | 0 (0.0%) |
| Total | 42 (100.0%) | 46 (100.0%) |
Earnings by Sex by Educational Attainment in Rancho Mesa Verde
| Educational Attainment | Male Income | Female Income |
| Less than High School | - | - |
| High School Diploma | - | - |
| College or Associate's Degree | - | - |
| Bachelor's Degree | - | - |
| Graduate Degree | - | - |
| Total | - | - |
Family Income in Rancho Mesa Verde
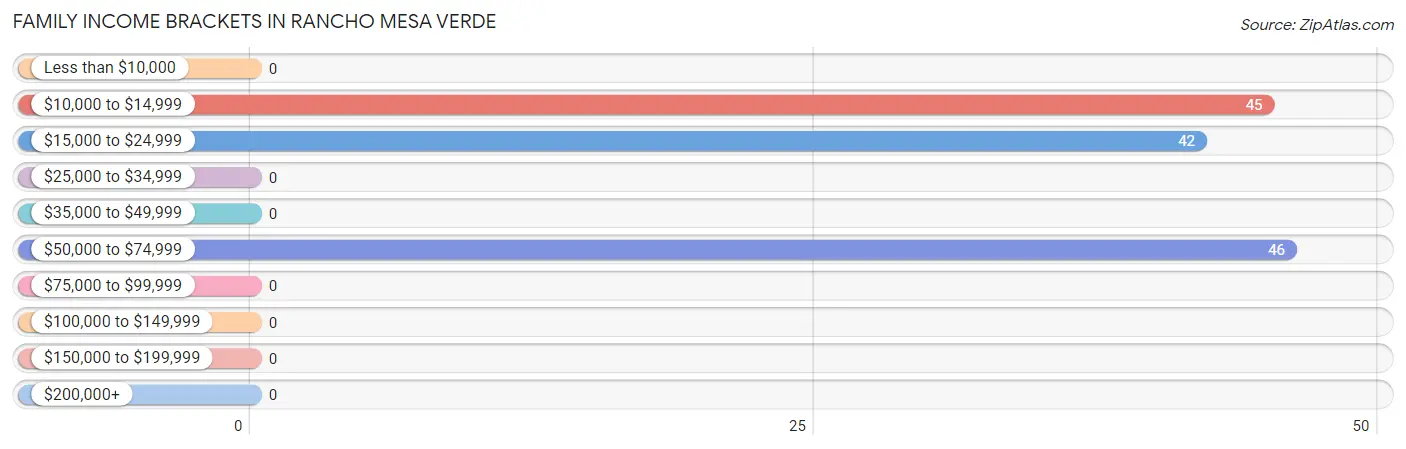
Family Income Brackets in Rancho Mesa Verde
According to the Rancho Mesa Verde family income data, there are 46 families falling into the $50,000 to $74,999 income range, which is the most common income bracket and makes up 34.6% of all families.
| Income Bracket | # Families | % Families |
| Less than $10,000 | 0 | 0.0% |
| $10,000 to $14,999 | 45 | 33.8% |
| $15,000 to $24,999 | 42 | 31.6% |
| $25,000 to $34,999 | 0 | 0.0% |
| $35,000 to $49,999 | 0 | 0.0% |
| $50,000 to $74,999 | 46 | 34.6% |
| $75,000 to $99,999 | 0 | 0.0% |
| $100,000 to $149,999 | 0 | 0.0% |
| $150,000 to $199,999 | 0 | 0.0% |
| $200,000+ | 0 | 0.0% |
Family Income by Famaliy Size in Rancho Mesa Verde
| Income Bracket | # Families | Median Income |
| 2-Person Families | 42 (31.6%) | $0 |
| 3-Person Families | 0 (0.0%) | $0 |
| 4-Person Families | 0 (0.0%) | $0 |
| 5-Person Families | 0 (0.0%) | $0 |
| 6-Person Families | 91 (68.4%) | $0 |
| 7+ Person Families | 0 (0.0%) | $0 |
| Total | 133 (100.0%) | $0 |
Family Income by Number of Earners in Rancho Mesa Verde
| Number of Earners | # Families | Median Income |
| No Earners | 87 (65.4%) | $0 |
| 1 Earner | 0 (0.0%) | $0 |
| 2 Earners | 46 (34.6%) | $0 |
| 3+ Earners | 0 (0.0%) | $0 |
| Total | 133 (100.0%) | $0 |
Household Income in Rancho Mesa Verde
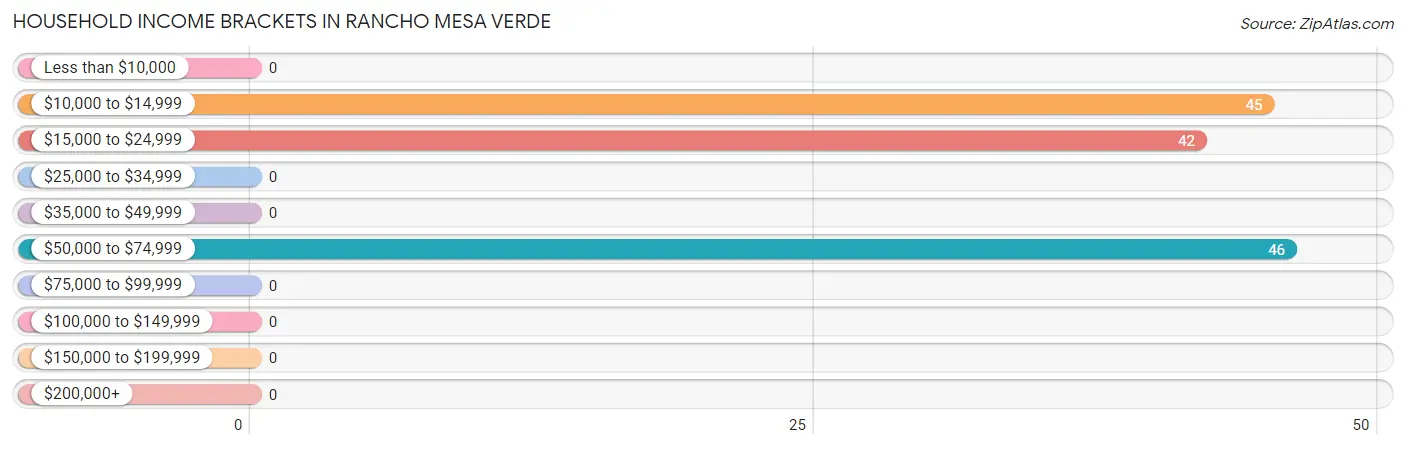
Household Income Brackets in Rancho Mesa Verde
With 46 households falling in the category, the $50,000 to $74,999 income range is the most frequent in Rancho Mesa Verde, accounting for 34.6% of all households.
| Income Bracket | # Households | % Households |
| Less than $10,000 | 0 | 0.0% |
| $10,000 to $14,999 | 45 | 33.8% |
| $15,000 to $24,999 | 42 | 31.6% |
| $25,000 to $34,999 | 0 | 0.0% |
| $35,000 to $49,999 | 0 | 0.0% |
| $50,000 to $74,999 | 46 | 34.6% |
| $75,000 to $99,999 | 0 | 0.0% |
| $100,000 to $149,999 | 0 | 0.0% |
| $150,000 to $199,999 | 0 | 0.0% |
| $200,000+ | 0 | 0.0% |
Household Income by Householder Age in Rancho Mesa Verde
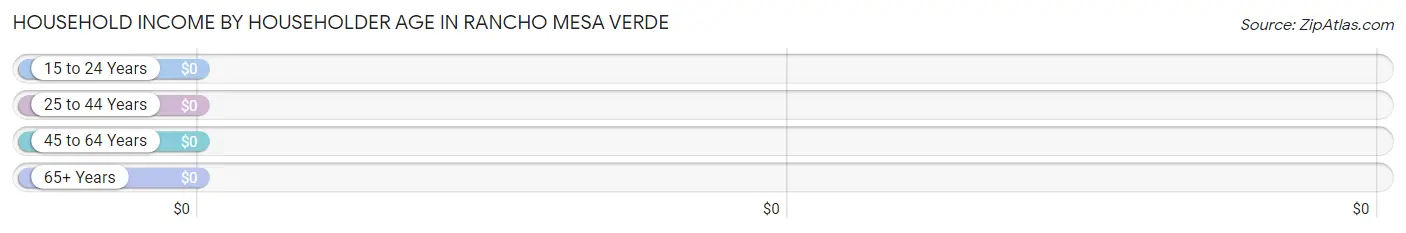
| Income Bracket | # Households | Median Income |
| 15 to 24 Years | 0 (0.0%) | $0 |
| 25 to 44 Years | 46 (34.6%) | $0 |
| 45 to 64 Years | 87 (65.4%) | $0 |
| 65+ Years | 0 (0.0%) | $0 |
| Total | 133 (100.0%) | $0 |
Poverty in Rancho Mesa Verde
Income Below Poverty by Sex and Age in Rancho Mesa Verde
With 67.2% poverty level for males and 19.6% for females among the residents of Rancho Mesa Verde, 15 year old males and 45 to 54 year old females are the most vulnerable to poverty, with 54 males (100.0%) and 45 females (100.0%) in their respective age groups living below the poverty level.
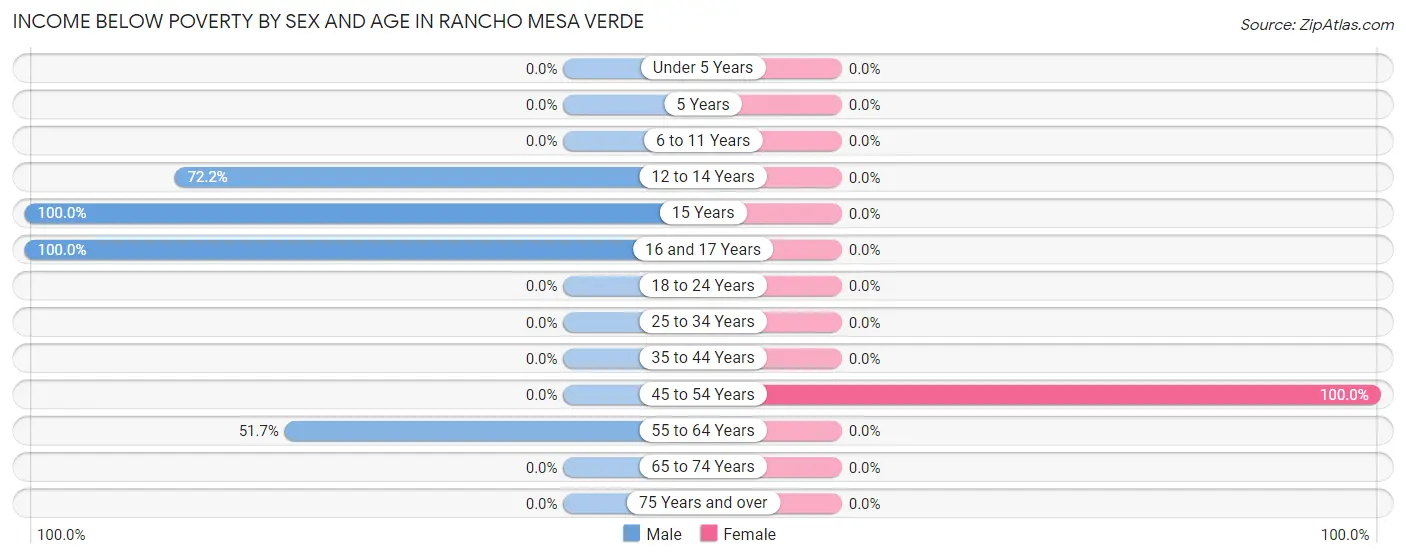
| Age Bracket | Male | Female |
| Under 5 Years | 0 (0.0%) | 0 (0.0%) |
| 5 Years | 0 (0.0%) | 0 (0.0%) |
| 6 to 11 Years | 0 (0.0%) | 0 (0.0%) |
| 12 to 14 Years | 96 (72.2%) | 0 (0.0%) |
| 15 Years | 54 (100.0%) | 0 (0.0%) |
| 16 and 17 Years | 53 (100.0%) | 0 (0.0%) |
| 18 to 24 Years | 0 (0.0%) | 0 (0.0%) |
| 25 to 34 Years | 0 (0.0%) | 0 (0.0%) |
| 35 to 44 Years | 0 (0.0%) | 0 (0.0%) |
| 45 to 54 Years | 0 (0.0%) | 45 (100.0%) |
| 55 to 64 Years | 45 (51.7%) | 0 (0.0%) |
| 65 to 74 Years | 0 (0.0%) | 0 (0.0%) |
| 75 Years and over | 0 (0.0%) | 0 (0.0%) |
| Total | 248 (67.2%) | 45 (19.6%) |
Income Above Poverty by Sex and Age in Rancho Mesa Verde
According to the poverty statistics in Rancho Mesa Verde, males aged 45 to 54 years and females aged 6 to 11 years are the age groups that are most secure financially, with 100.0% of males and 100.0% of females in these age groups living above the poverty line.
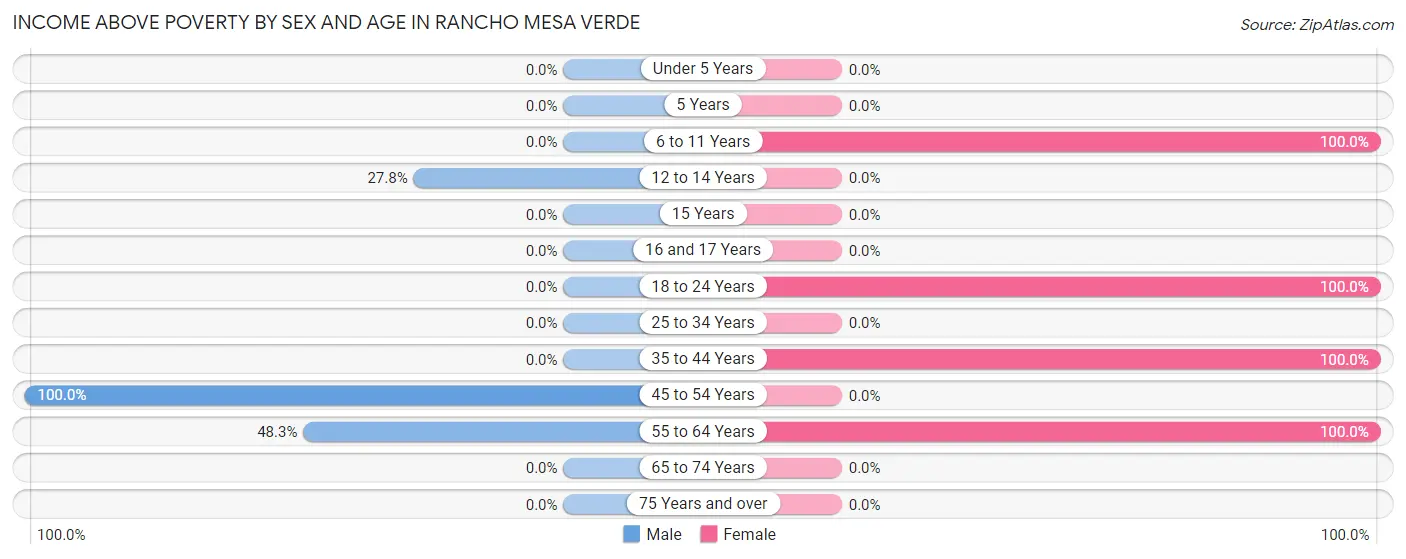
| Age Bracket | Male | Female |
| Under 5 Years | 0 (0.0%) | 0 (0.0%) |
| 5 Years | 0 (0.0%) | 0 (0.0%) |
| 6 to 11 Years | 0 (0.0%) | 66 (100.0%) |
| 12 to 14 Years | 37 (27.8%) | 0 (0.0%) |
| 15 Years | 0 (0.0%) | 0 (0.0%) |
| 16 and 17 Years | 0 (0.0%) | 0 (0.0%) |
| 18 to 24 Years | 0 (0.0%) | 34 (100.0%) |
| 25 to 34 Years | 0 (0.0%) | 0 (0.0%) |
| 35 to 44 Years | 0 (0.0%) | 46 (100.0%) |
| 45 to 54 Years | 42 (100.0%) | 0 (0.0%) |
| 55 to 64 Years | 42 (48.3%) | 39 (100.0%) |
| 65 to 74 Years | 0 (0.0%) | 0 (0.0%) |
| 75 Years and over | 0 (0.0%) | 0 (0.0%) |
| Total | 121 (32.8%) | 185 (80.4%) |
Income Below Poverty Among Married-Couple Families in Rancho Mesa Verde
The poverty statistics for married-couple families in Rancho Mesa Verde show that 33.8% or 45 of the total 133 families live below the poverty line. Families with 3 or 4 children have the highest poverty rate of 49.4%, comprising of 45 families. On the other hand, families with no children have the lowest poverty rate of 0.0%, which includes 0 families.
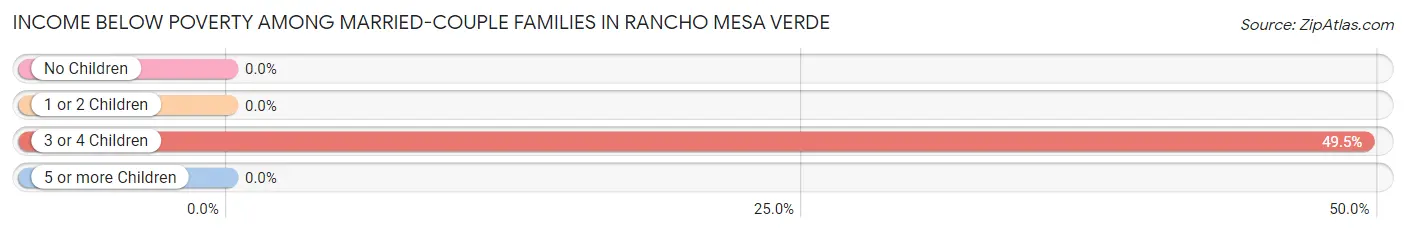
| Children | Above Poverty | Below Poverty |
| No Children | 42 (100.0%) | 0 (0.0%) |
| 1 or 2 Children | 0 (0.0%) | 0 (0.0%) |
| 3 or 4 Children | 46 (50.5%) | 45 (49.4%) |
| 5 or more Children | 0 (0.0%) | 0 (0.0%) |
| Total | 88 (66.2%) | 45 (33.8%) |
Income Below Poverty Among Single-Parent Households in Rancho Mesa Verde
| Children | Single Father | Single Mother |
| No Children | 0 (0.0%) | 0 (0.0%) |
| 1 or 2 Children | 0 (0.0%) | 0 (0.0%) |
| 3 or 4 Children | 0 (0.0%) | 0 (0.0%) |
| 5 or more Children | 0 (0.0%) | 0 (0.0%) |
| Total | 0 (0.0%) | 0 (0.0%) |
Income Below Poverty Among Married-Couple vs Single-Parent Households in Rancho Mesa Verde
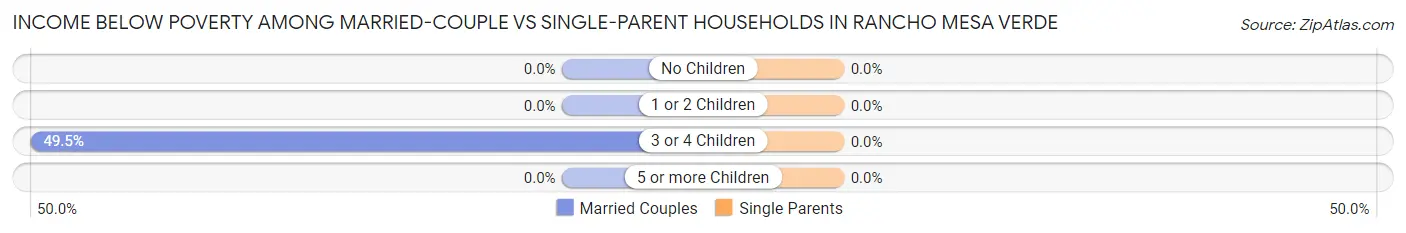
| Children | Married-Couple Families | Single-Parent Households |
| No Children | 0 (0.0%) | 0 (0.0%) |
| 1 or 2 Children | 0 (0.0%) | 0 (0.0%) |
| 3 or 4 Children | 45 (49.4%) | 0 (0.0%) |
| 5 or more Children | 0 (0.0%) | 0 (0.0%) |
| Total | 45 (33.8%) | 0 (0.0%) |
Race in Rancho Mesa Verde
The most populous races in Rancho Mesa Verde are Hispanic or Latino (599 | 100.0%), White / Caucasian (374 | 62.4%), and Two or more Races (225 | 37.6%).
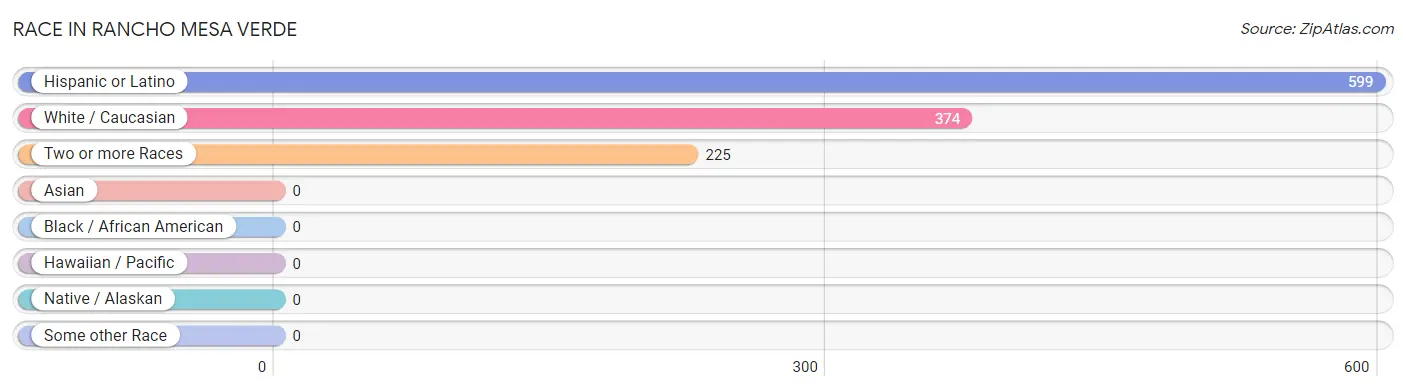
| Race | # Population | % Population |
| Asian | 0 | 0.0% |
| Black / African American | 0 | 0.0% |
| Hawaiian / Pacific | 0 | 0.0% |
| Hispanic or Latino | 599 | 100.0% |
| Native / Alaskan | 0 | 0.0% |
| White / Caucasian | 374 | 62.4% |
| Two or more Races | 225 | 37.6% |
| Some other Race | 0 | 0.0% |
| Total | 599 | 100.0% |
Ancestry in Rancho Mesa Verde
The most populous ancestries reported in Rancho Mesa Verde are , and Mexican (599 | 100.0%), together accounting for 100.0% of all Rancho Mesa Verde residents.

| Ancestry | # Population | % Population |
| Mexican | 599 | 100.0% | View All 1 Rows |
Immigrants in Rancho Mesa Verde
The most numerous immigrant groups reported in Rancho Mesa Verde came from Central America (248 | 41.4%), Latin America (248 | 41.4%), and Mexico (248 | 41.4%), together accounting for 124.2% of all Rancho Mesa Verde residents.
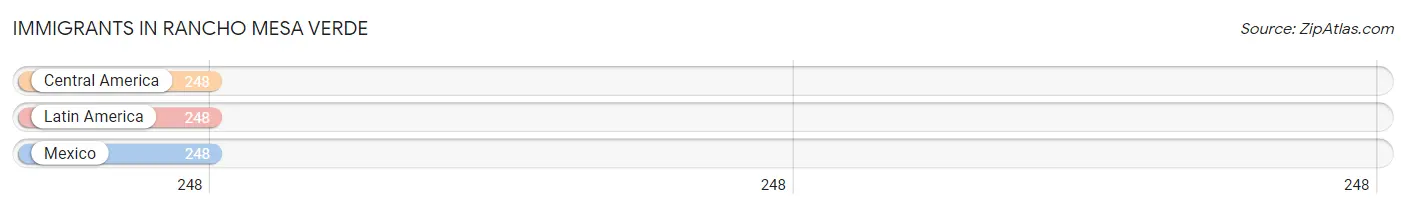
| Immigration Origin | # Population | % Population |
| Central America | 248 | 41.4% |
| Latin America | 248 | 41.4% |
| Mexico | 248 | 41.4% | View All 3 Rows |
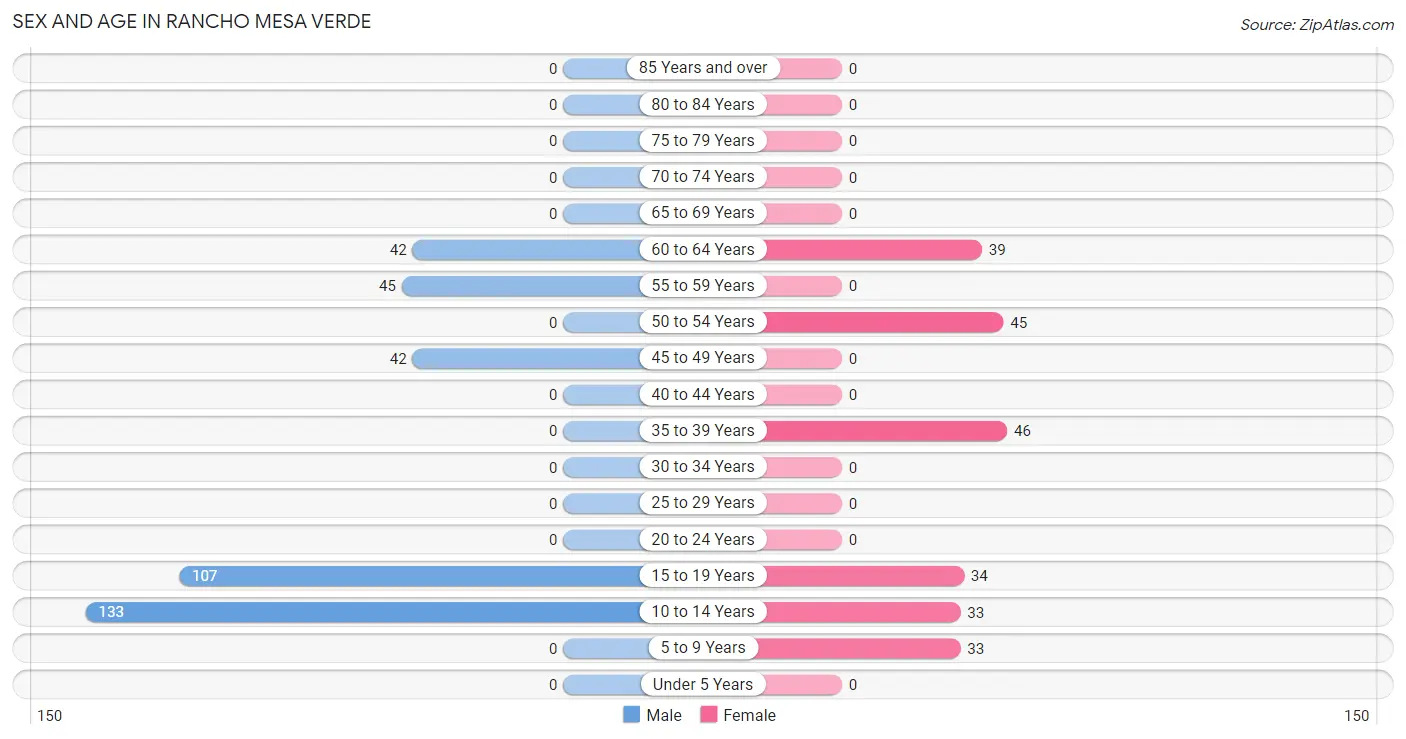
Sex and Age in Rancho Mesa Verde
Sex and Age in Rancho Mesa Verde
The most populous age groups in Rancho Mesa Verde are 10 to 14 Years (133 | 36.0%) for men and 35 to 39 Years (46 | 20.0%) for women.
| Age Bracket | Male | Female |
| Under 5 Years | 0 (0.0%) | 0 (0.0%) |
| 5 to 9 Years | 0 (0.0%) | 33 (14.3%) |
| 10 to 14 Years | 133 (36.0%) | 33 (14.3%) |
| 15 to 19 Years | 107 (29.0%) | 34 (14.8%) |
| 20 to 24 Years | 0 (0.0%) | 0 (0.0%) |
| 25 to 29 Years | 0 (0.0%) | 0 (0.0%) |
| 30 to 34 Years | 0 (0.0%) | 0 (0.0%) |
| 35 to 39 Years | 0 (0.0%) | 46 (20.0%) |
| 40 to 44 Years | 0 (0.0%) | 0 (0.0%) |
| 45 to 49 Years | 42 (11.4%) | 0 (0.0%) |
| 50 to 54 Years | 0 (0.0%) | 45 (19.6%) |
| 55 to 59 Years | 45 (12.2%) | 0 (0.0%) |
| 60 to 64 Years | 42 (11.4%) | 39 (17.0%) |
| 65 to 69 Years | 0 (0.0%) | 0 (0.0%) |
| 70 to 74 Years | 0 (0.0%) | 0 (0.0%) |
| 75 to 79 Years | 0 (0.0%) | 0 (0.0%) |
| 80 to 84 Years | 0 (0.0%) | 0 (0.0%) |
| 85 Years and over | 0 (0.0%) | 0 (0.0%) |
| Total | 369 (100.0%) | 230 (100.0%) |
Families and Households in Rancho Mesa Verde
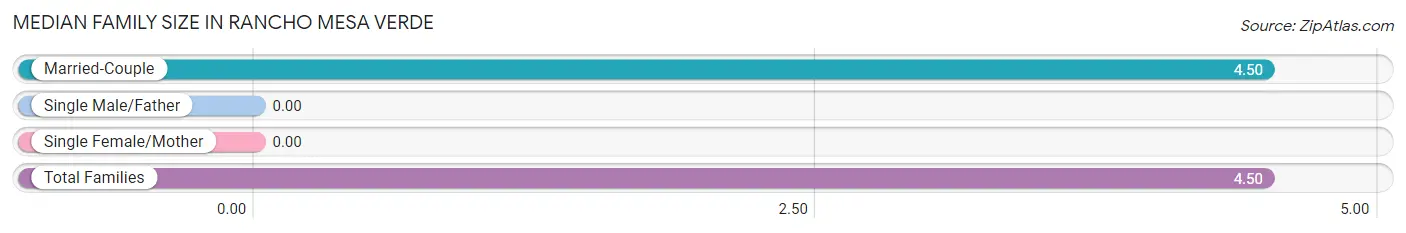
Median Family Size in Rancho Mesa Verde
| Family Type | # Families | Family Size |
| Married-Couple | 133 (100.0%) | 4.50 |
| Single Male/Father | 0 (0.0%) | - |
| Single Female/Mother | 0 (0.0%) | - |
| Total Families | 133 (100.0%) | 4.50 |
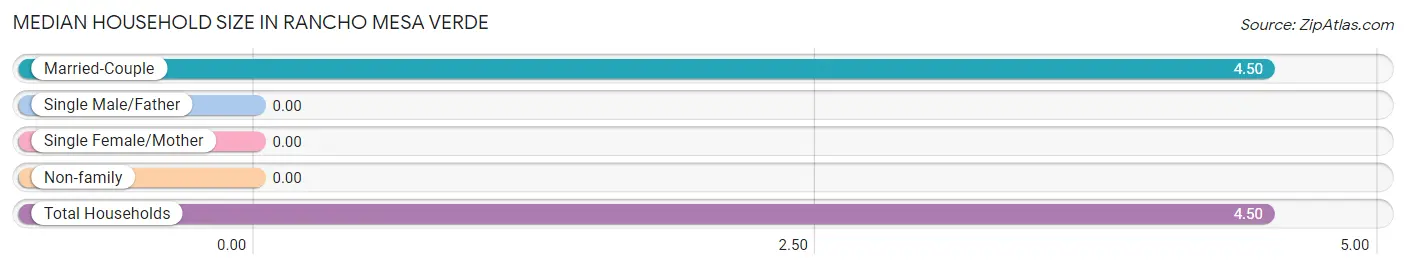
Median Household Size in Rancho Mesa Verde
| Household Type | # Households | Household Size |
| Married-Couple | 133 (100.0%) | 4.50 |
| Single Male/Father | 0 (0.0%) | - |
| Single Female/Mother | 0 (0.0%) | - |
| Non-family | 0 (0.0%) | - |
| Total Households | 133 (100.0%) | 4.50 |
Household Size by Marriage Status in Rancho Mesa Verde
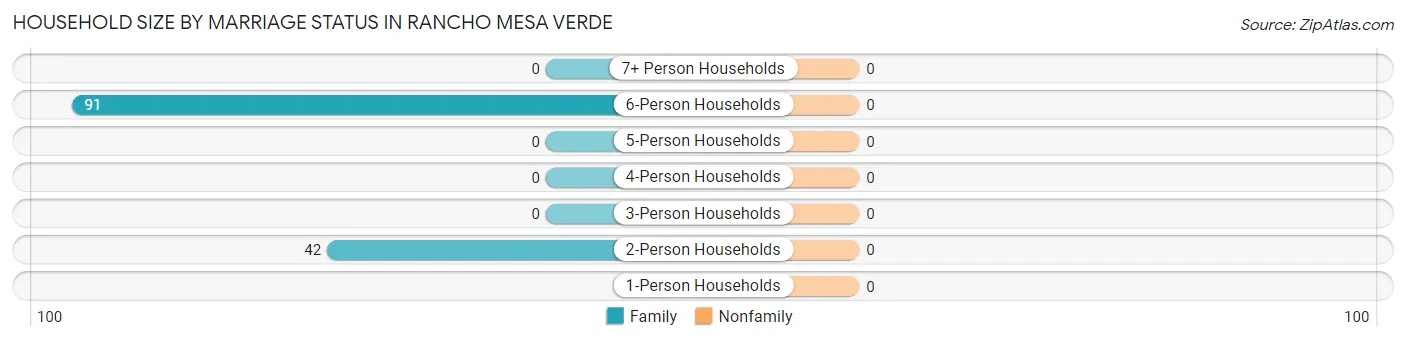
| Household Size | Family Households | Nonfamily Households |
| 1-Person Households | - | 0 (0.0%) |
| 2-Person Households | 42 (31.6%) | 0 (0.0%) |
| 3-Person Households | 0 (0.0%) | 0 (0.0%) |
| 4-Person Households | 0 (0.0%) | 0 (0.0%) |
| 5-Person Households | 0 (0.0%) | 0 (0.0%) |
| 6-Person Households | 91 (68.4%) | 0 (0.0%) |
| 7+ Person Households | 0 (0.0%) | 0 (0.0%) |
| Total | 133 (100.0%) | 0 (0.0%) |
Female Fertility in Rancho Mesa Verde
Fertility by Age in Rancho Mesa Verde
| Age Bracket | Women with Births | Births / 1,000 Women |
| 15 to 19 years | 0 (0.0%) | 0.0 |
| 20 to 34 years | 0 (0.0%) | 0.0 |
| 35 to 50 years | 0 (0.0%) | 0.0 |
| Total | 0 (0.0%) | 0.0 |
Fertility by Age by Marriage Status in Rancho Mesa Verde
| Age Bracket | Married | Unmarried |
| 15 to 19 years | 0 (0.0%) | 0 (0.0%) |
| 20 to 34 years | 0 (0.0%) | 0 (0.0%) |
| 35 to 50 years | 0 (0.0%) | 0 (0.0%) |
| Total | 0 (0.0%) | 0 (0.0%) |
Fertility by Education in Rancho Mesa Verde
| Educational Attainment | Women with Births | Births / 1,000 Women |
| Less than High School | 0 (0.0%) | 0.0 |
| High School Diploma | 0 (0.0%) | 0.0 |
| College or Associate's Degree | 0 (0.0%) | 0.0 |
| Bachelor's Degree | 0 (0.0%) | 0.0 |
| Graduate Degree | 0 (0.0%) | 0.0 |
| Total | 0 (0.0%) | 0.0 |
Fertility by Education by Marriage Status in Rancho Mesa Verde

| Educational Attainment | Married | Unmarried |
| Less than High School | 0 (0.0%) | 0 (0.0%) |
| High School Diploma | 0 (0.0%) | 0 (0.0%) |
| College or Associate's Degree | 0 (0.0%) | 0 (0.0%) |
| Bachelor's Degree | 0 (0.0%) | 0 (0.0%) |
| Graduate Degree | 0 (0.0%) | 0 (0.0%) |
| Total | 0 (0.0%) | 0 (0.0%) |
Employment Characteristics in Rancho Mesa Verde
Employment by Class of Employer in Rancho Mesa Verde
Among the 42 employed individuals in Rancho Mesa Verde, , and private company employees (42 | 100.0%) make up the most common classes of employment.
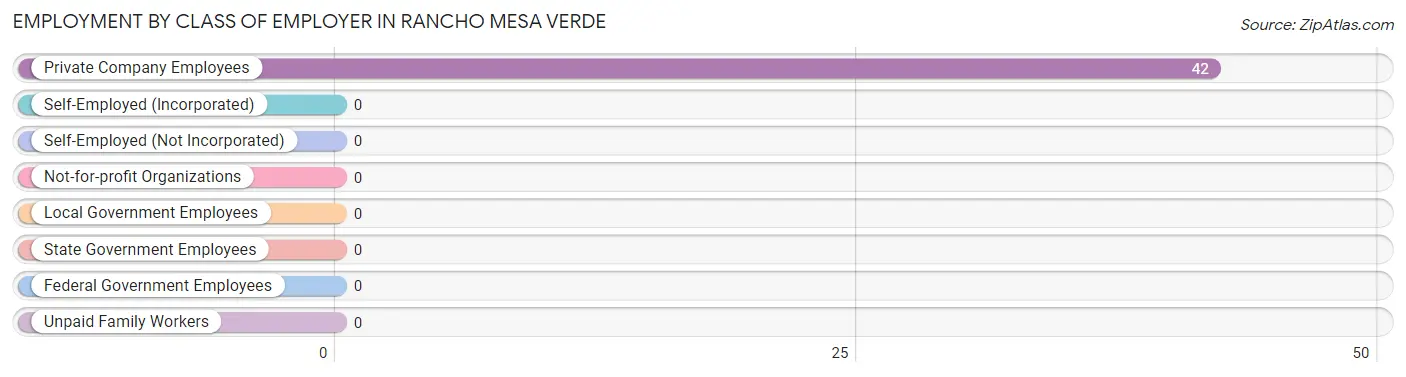
| Employer Class | # Employees | % Employees |
| Private Company Employees | 42 | 100.0% |
| Self-Employed (Incorporated) | 0 | 0.0% |
| Self-Employed (Not Incorporated) | 0 | 0.0% |
| Not-for-profit Organizations | 0 | 0.0% |
| Local Government Employees | 0 | 0.0% |
| State Government Employees | 0 | 0.0% |
| Federal Government Employees | 0 | 0.0% |
| Unpaid Family Workers | 0 | 0.0% |
| Total | 42 | 100.0% |
Employment Status by Age in Rancho Mesa Verde
According to the labor force statistics for Rancho Mesa Verde, out of the total population over 16 years of age (346), 25.1% or 87 individuals are in the labor force, with 51.7% or 45 of them unemployed. The age group with the highest labor force participation rate is 45 to 54 years, with 100.0% or 87 individuals in the labor force. Within the labor force, the 45 to 54 years age range has the highest percentage of unemployed individuals, with 51.7% or 45 of them being unemployed.
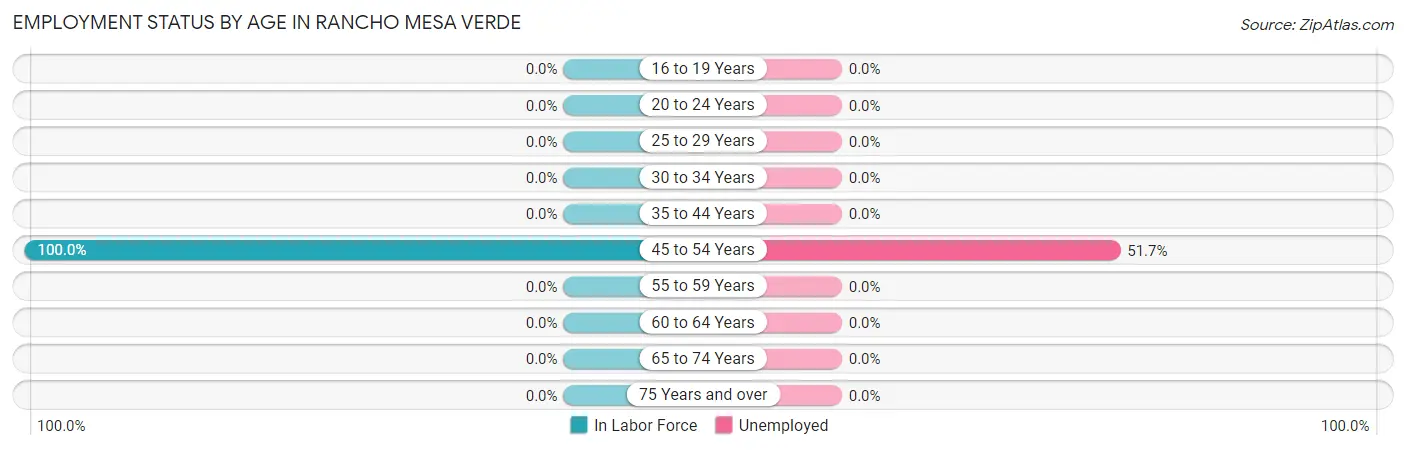
| Age Bracket | In Labor Force | Unemployed |
| 16 to 19 Years | 0 (0.0%) | 0 (0.0%) |
| 20 to 24 Years | 0 (0.0%) | 0 (0.0%) |
| 25 to 29 Years | 0 (0.0%) | 0 (0.0%) |
| 30 to 34 Years | 0 (0.0%) | 0 (0.0%) |
| 35 to 44 Years | 0 (0.0%) | 0 (0.0%) |
| 45 to 54 Years | 87 (100.0%) | 45 (51.7%) |
| 55 to 59 Years | 0 (0.0%) | 0 (0.0%) |
| 60 to 64 Years | 0 (0.0%) | 0 (0.0%) |
| 65 to 74 Years | 0 (0.0%) | 0 (0.0%) |
| 75 Years and over | 0 (0.0%) | 0 (0.0%) |
| Total | 87 (25.1%) | 45 (51.7%) |
Employment Status by Educational Attainment in Rancho Mesa Verde
According to labor force statistics for Rancho Mesa Verde, 33.6% of individuals (87) out of the total population between 25 and 64 years of age (259) are in the labor force, with 51.7% or 45 of them being unemployed. The group with the highest labor force participation rate are those with the educational attainment of less than high school, with 33.6% or 87 individuals in the labor force. Within the labor force, individuals with less than high school education have the highest percentage of unemployment, with 51.7% or 45 of them being unemployed.
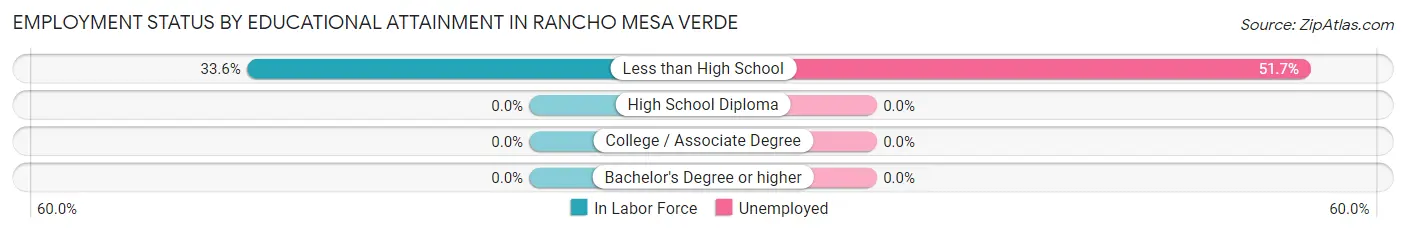
| Educational Attainment | In Labor Force | Unemployed |
| Less than High School | 87 (33.6%) | 134 (51.7%) |
| High School Diploma | 0 (0.0%) | 0 (0.0%) |
| College / Associate Degree | 0 (0.0%) | 0 (0.0%) |
| Bachelor's Degree or higher | 0 (0.0%) | 0 (0.0%) |
| Total | 87 (33.6%) | 134 (51.7%) |
Employment Occupations by Sex in Rancho Mesa Verde
Management, Business, Science and Arts Occupations
Management, Business, Science and Arts Occupations by Sex
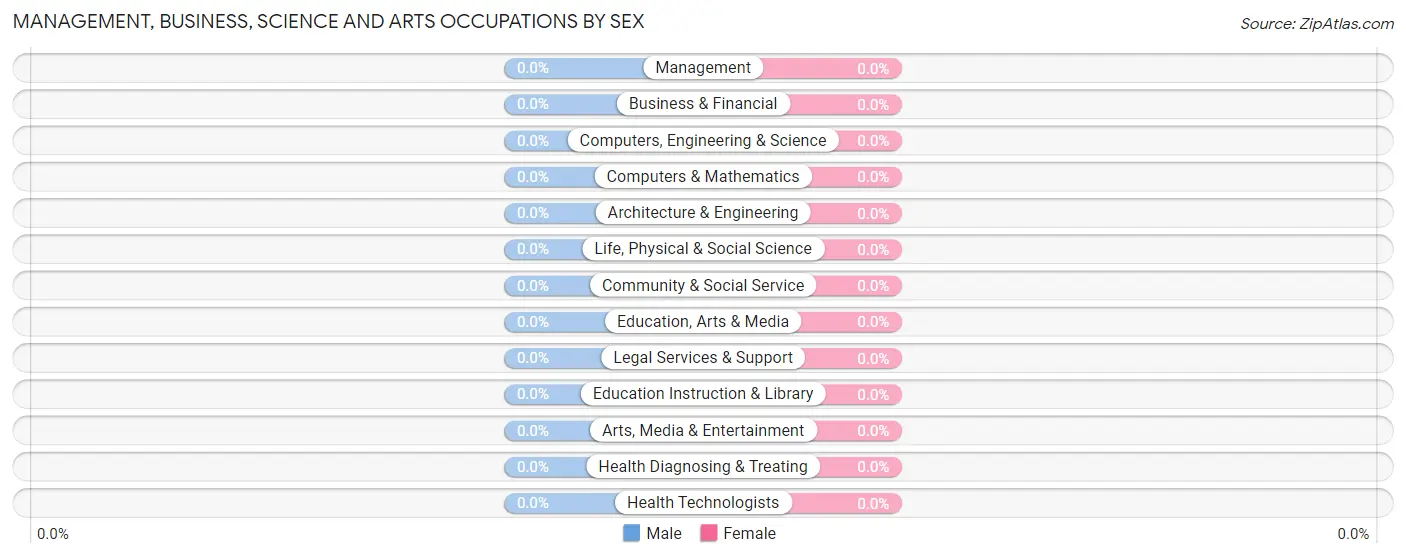
| Occupation | Male | Female |
| Management | 0 (0.0%) | 0 (0.0%) |
| Business & Financial | 0 (0.0%) | 0 (0.0%) |
| Computers, Engineering & Science | 0 (0.0%) | 0 (0.0%) |
| Computers & Mathematics | 0 (0.0%) | 0 (0.0%) |
| Architecture & Engineering | 0 (0.0%) | 0 (0.0%) |
| Life, Physical & Social Science | 0 (0.0%) | 0 (0.0%) |
| Community & Social Service | 0 (0.0%) | 0 (0.0%) |
| Education, Arts & Media | 0 (0.0%) | 0 (0.0%) |
| Legal Services & Support | 0 (0.0%) | 0 (0.0%) |
| Education Instruction & Library | 0 (0.0%) | 0 (0.0%) |
| Arts, Media & Entertainment | 0 (0.0%) | 0 (0.0%) |
| Health Diagnosing & Treating | 0 (0.0%) | 0 (0.0%) |
| Health Technologists | 0 (0.0%) | 0 (0.0%) |
| Total (Category) | 0 (0.0%) | 0 (0.0%) |
| Total (Overall) | 42 (100.0%) | 0 (0.0%) |
Services Occupations
Services Occupations by Sex
| Occupation | Male | Female |
| Healthcare Support | 0 (0.0%) | 0 (0.0%) |
| Security & Protection | 0 (0.0%) | 0 (0.0%) |
| Firefighting & Prevention | 0 (0.0%) | 0 (0.0%) |
| Law Enforcement | 0 (0.0%) | 0 (0.0%) |
| Food Preparation & Serving | 0 (0.0%) | 0 (0.0%) |
| Cleaning & Maintenance | 0 (0.0%) | 0 (0.0%) |
| Personal Care & Service | 0 (0.0%) | 0 (0.0%) |
| Total (Category) | 0 (0.0%) | 0 (0.0%) |
| Total (Overall) | 42 (100.0%) | 0 (0.0%) |
Sales and Office Occupations
Sales and Office Occupations by Sex
| Occupation | Male | Female |
| Sales & Related | 0 (0.0%) | 0 (0.0%) |
| Office & Administration | 0 (0.0%) | 0 (0.0%) |
| Total (Category) | 0 (0.0%) | 0 (0.0%) |
| Total (Overall) | 42 (100.0%) | 0 (0.0%) |
Natural Resources, Construction and Maintenance Occupations
Natural Resources, Construction and Maintenance Occupations by Sex
| Occupation | Male | Female |
| Farming, Fishing & Forestry | 0 (0.0%) | 0 (0.0%) |
| Construction & Extraction | 0 (0.0%) | 0 (0.0%) |
| Installation, Maintenance & Repair | 0 (0.0%) | 0 (0.0%) |
| Total (Category) | 0 (0.0%) | 0 (0.0%) |
| Total (Overall) | 42 (100.0%) | 0 (0.0%) |
Production, Transportation and Moving Occupations
The most common Production, Transportation and Moving occupations in Rancho Mesa Verde are , and Material Moving (42 | 100.0%).
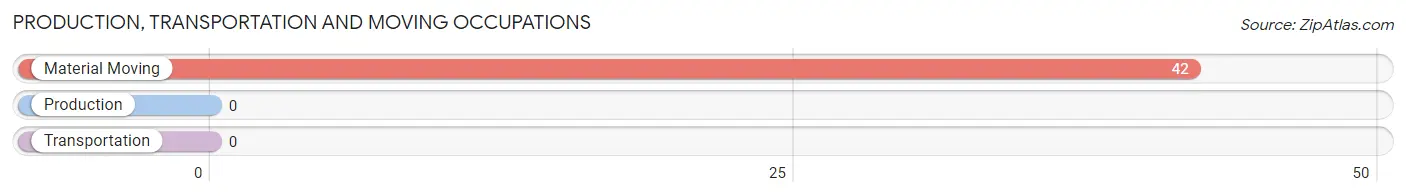
Production, Transportation and Moving Occupations by Sex
| Occupation | Male | Female |
| Production | 0 (0.0%) | 0 (0.0%) |
| Transportation | 0 (0.0%) | 0 (0.0%) |
| Material Moving | 42 (100.0%) | 0 (0.0%) |
| Total (Category) | 42 (100.0%) | 0 (0.0%) |
| Total (Overall) | 42 (100.0%) | 0 (0.0%) |
Employment Industries by Sex in Rancho Mesa Verde
Employment Industries in Rancho Mesa Verde
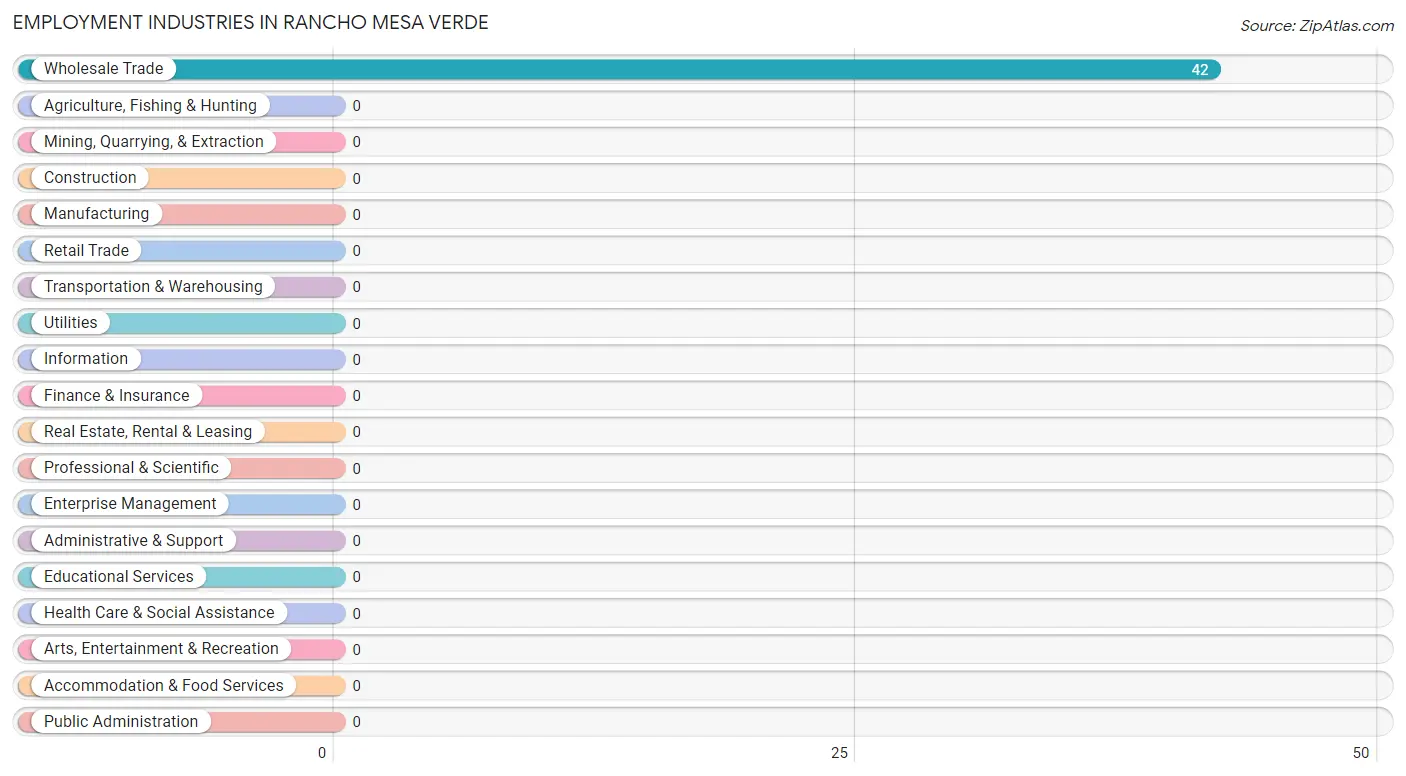
The major employment industries in Rancho Mesa Verde include , and Wholesale Trade (42 | 100.0%).
Employment Industries by Sex in Rancho Mesa Verde
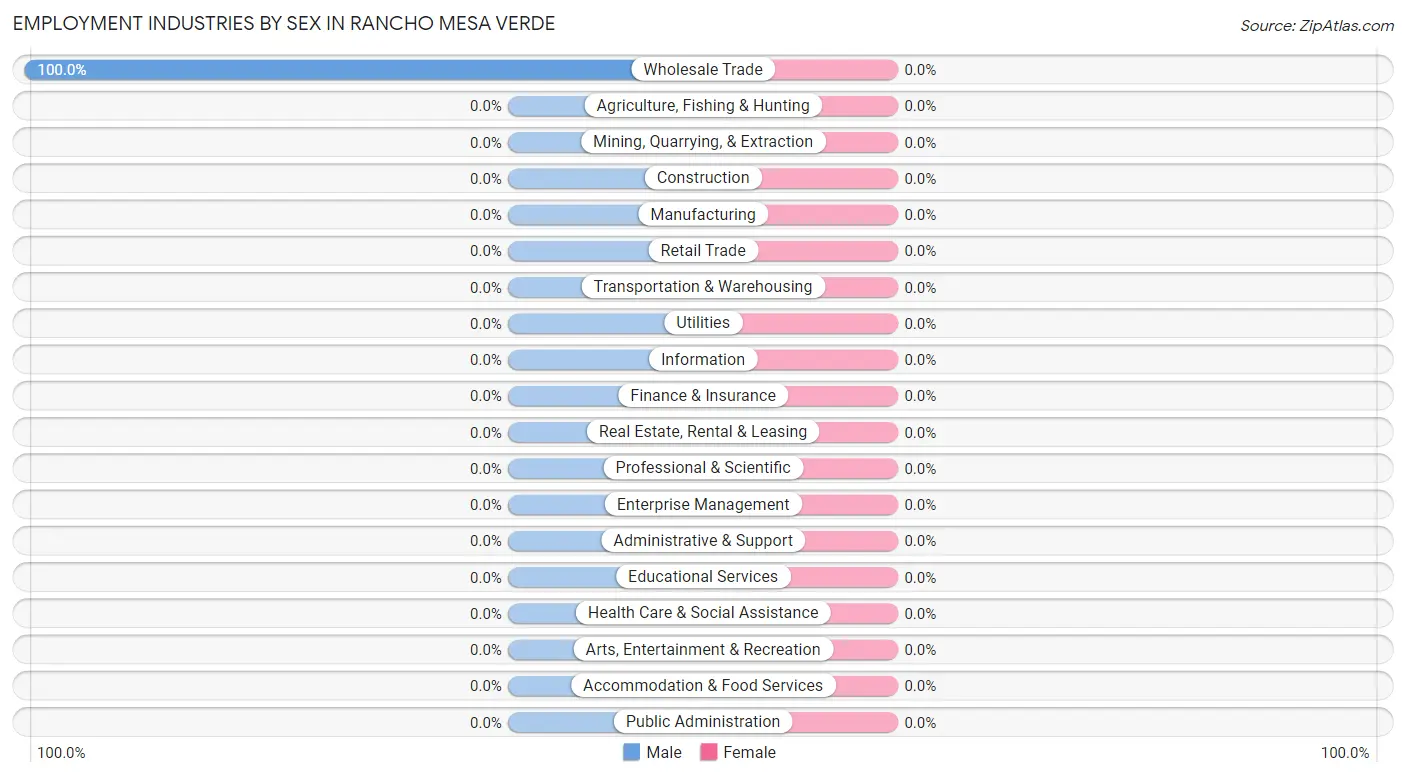
| Industry | Male | Female |
| Agriculture, Fishing & Hunting | 0 (0.0%) | 0 (0.0%) |
| Mining, Quarrying, & Extraction | 0 (0.0%) | 0 (0.0%) |
| Construction | 0 (0.0%) | 0 (0.0%) |
| Manufacturing | 0 (0.0%) | 0 (0.0%) |
| Wholesale Trade | 42 (100.0%) | 0 (0.0%) |
| Retail Trade | 0 (0.0%) | 0 (0.0%) |
| Transportation & Warehousing | 0 (0.0%) | 0 (0.0%) |
| Utilities | 0 (0.0%) | 0 (0.0%) |
| Information | 0 (0.0%) | 0 (0.0%) |
| Finance & Insurance | 0 (0.0%) | 0 (0.0%) |
| Real Estate, Rental & Leasing | 0 (0.0%) | 0 (0.0%) |
| Professional & Scientific | 0 (0.0%) | 0 (0.0%) |
| Enterprise Management | 0 (0.0%) | 0 (0.0%) |
| Administrative & Support | 0 (0.0%) | 0 (0.0%) |
| Educational Services | 0 (0.0%) | 0 (0.0%) |
| Health Care & Social Assistance | 0 (0.0%) | 0 (0.0%) |
| Arts, Entertainment & Recreation | 0 (0.0%) | 0 (0.0%) |
| Accommodation & Food Services | 0 (0.0%) | 0 (0.0%) |
| Public Administration | 0 (0.0%) | 0 (0.0%) |
| Total | 42 (100.0%) | 0 (0.0%) |
Education in Rancho Mesa Verde
School Enrollment in Rancho Mesa Verde
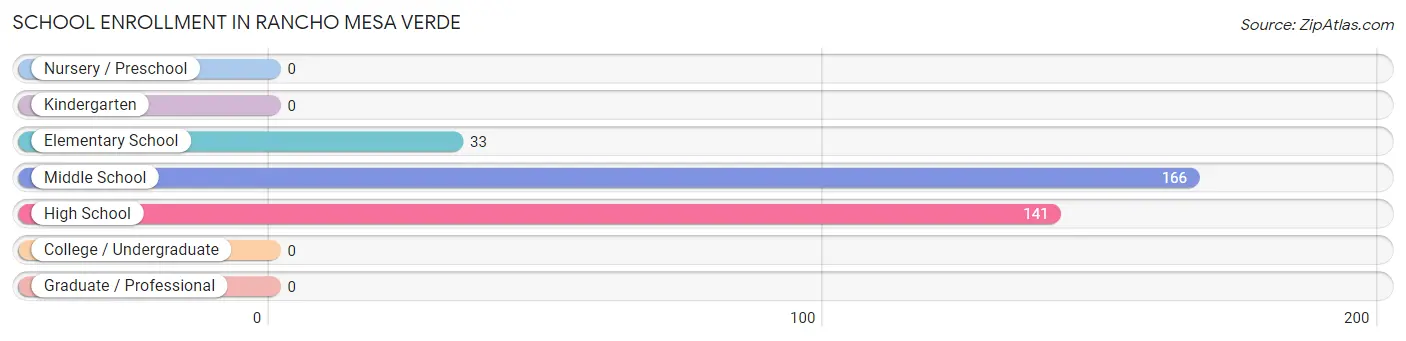
The most common levels of schooling among the 340 students in Rancho Mesa Verde are middle school (166 | 48.8%), high school (141 | 41.5%), and elementary school (33 | 9.7%).
| School Level | # Students | % Students |
| Nursery / Preschool | 0 | 0.0% |
| Kindergarten | 0 | 0.0% |
| Elementary School | 33 | 9.7% |
| Middle School | 166 | 48.8% |
| High School | 141 | 41.5% |
| College / Undergraduate | 0 | 0.0% |
| Graduate / Professional | 0 | 0.0% |
| Total | 340 | 100.0% |
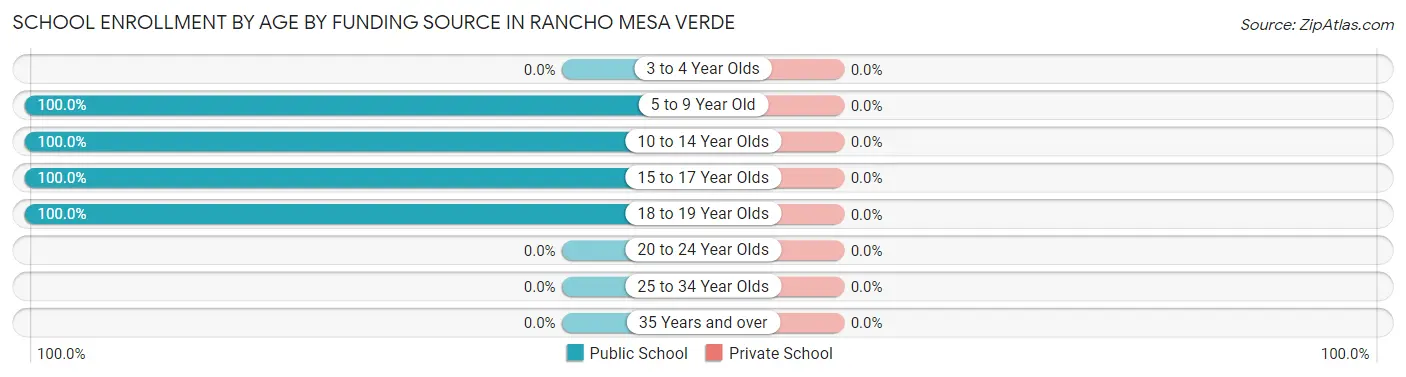
School Enrollment by Age by Funding Source in Rancho Mesa Verde
| Age Bracket | Public School | Private School |
| 3 to 4 Year Olds | 0 (0.0%) | 0 (0.0%) |
| 5 to 9 Year Old | 33 (100.0%) | 0 (0.0%) |
| 10 to 14 Year Olds | 166 (100.0%) | 0 (0.0%) |
| 15 to 17 Year Olds | 107 (100.0%) | 0 (0.0%) |
| 18 to 19 Year Olds | 34 (100.0%) | 0 (0.0%) |
| 20 to 24 Year Olds | 0 (0.0%) | 0 (0.0%) |
| 25 to 34 Year Olds | 0 (0.0%) | 0 (0.0%) |
| 35 Years and over | 0 (0.0%) | 0 (0.0%) |
| Total | 340 (100.0%) | 0 (0.0%) |
Educational Attainment by Field of Study in Rancho Mesa Verde
| Field of Study | # Graduates | % Graduates |
| Computers & Mathematics | 0 | 0.0% |
| Bio, Nature & Agricultural | 0 | 0.0% |
| Physical & Health Sciences | 0 | 0.0% |
| Psychology | 0 | 0.0% |
| Social Sciences | 0 | 0.0% |
| Engineering | 0 | 0.0% |
| Multidisciplinary Studies | 0 | 0.0% |
| Science & Technology | 0 | 0.0% |
| Business | 0 | 0.0% |
| Education | 0 | 0.0% |
| Literature & Languages | 0 | 0.0% |
| Liberal Arts & History | 0 | 0.0% |
| Visual & Performing Arts | 0 | 0.0% |
| Communications | 0 | 0.0% |
| Arts & Humanities | 0 | 0.0% |
| Total | 0 | 0.0% |
Transportation & Commute in Rancho Mesa Verde
Vehicle Availability by Sex in Rancho Mesa Verde
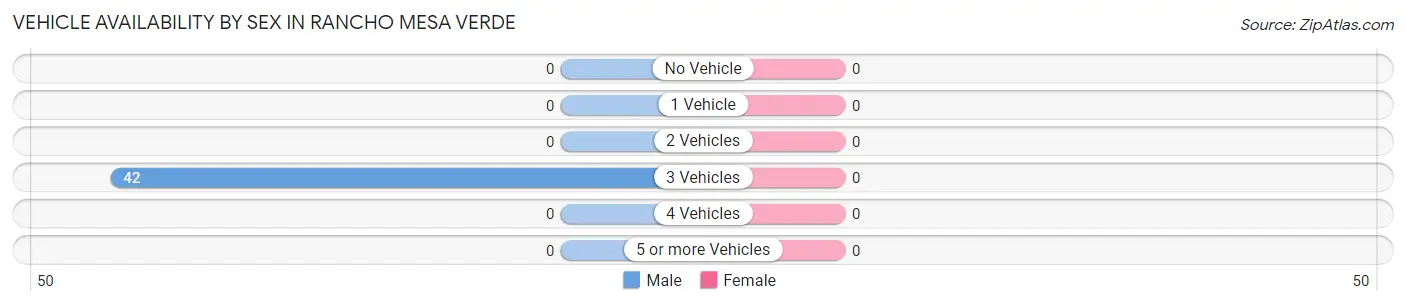
| Vehicles Available | Male | Female |
| No Vehicle | 0 (0.0%) | 0 (0.0%) |
| 1 Vehicle | 0 (0.0%) | 0 (0.0%) |
| 2 Vehicles | 0 (0.0%) | 0 (0.0%) |
| 3 Vehicles | 42 (100.0%) | 0 (0.0%) |
| 4 Vehicles | 0 (0.0%) | 0 (0.0%) |
| 5 or more Vehicles | 0 (0.0%) | 0 (0.0%) |
| Total | 42 (100.0%) | 0 (0.0%) |
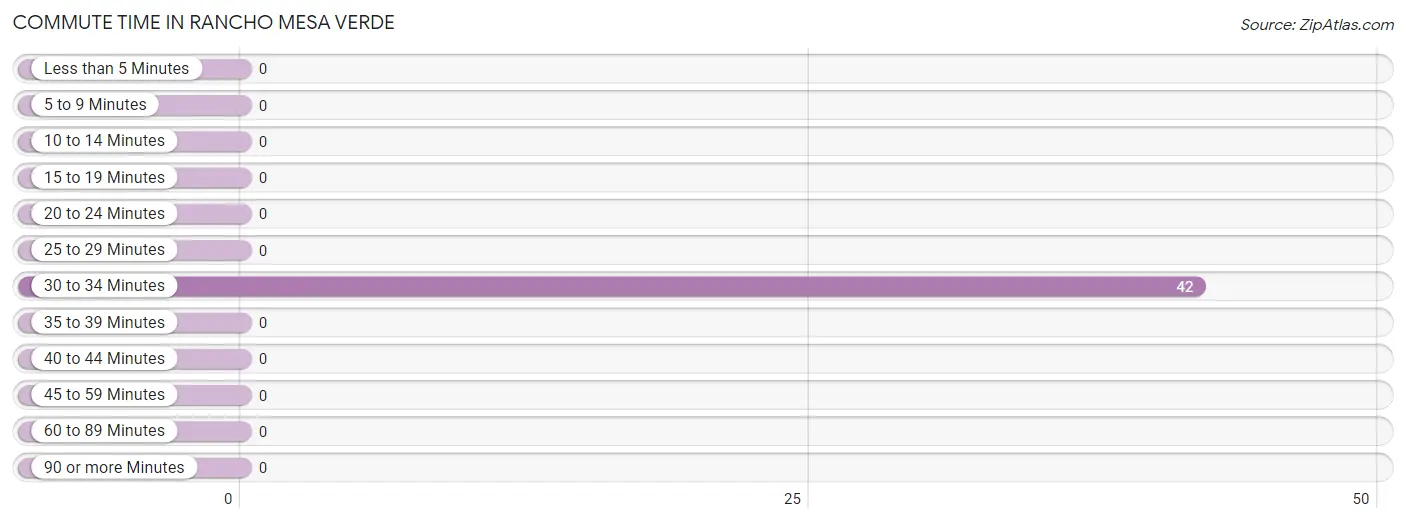
Commute Time in Rancho Mesa Verde
The most frequently occuring commute durations in Rancho Mesa Verde are 30 to 34 minutes (42 commuters, 100.0%), less than 5 minutes (0 commuters, 0.0%), and 5 to 9 minutes (0 commuters, 0.0%).
| Commute Time | # Commuters | % Commuters |
| Less than 5 Minutes | 0 | 0.0% |
| 5 to 9 Minutes | 0 | 0.0% |
| 10 to 14 Minutes | 0 | 0.0% |
| 15 to 19 Minutes | 0 | 0.0% |
| 20 to 24 Minutes | 0 | 0.0% |
| 25 to 29 Minutes | 0 | 0.0% |
| 30 to 34 Minutes | 42 | 100.0% |
| 35 to 39 Minutes | 0 | 0.0% |
| 40 to 44 Minutes | 0 | 0.0% |
| 45 to 59 Minutes | 0 | 0.0% |
| 60 to 89 Minutes | 0 | 0.0% |
| 90 or more Minutes | 0 | 0.0% |
Commute Time by Sex in Rancho Mesa Verde
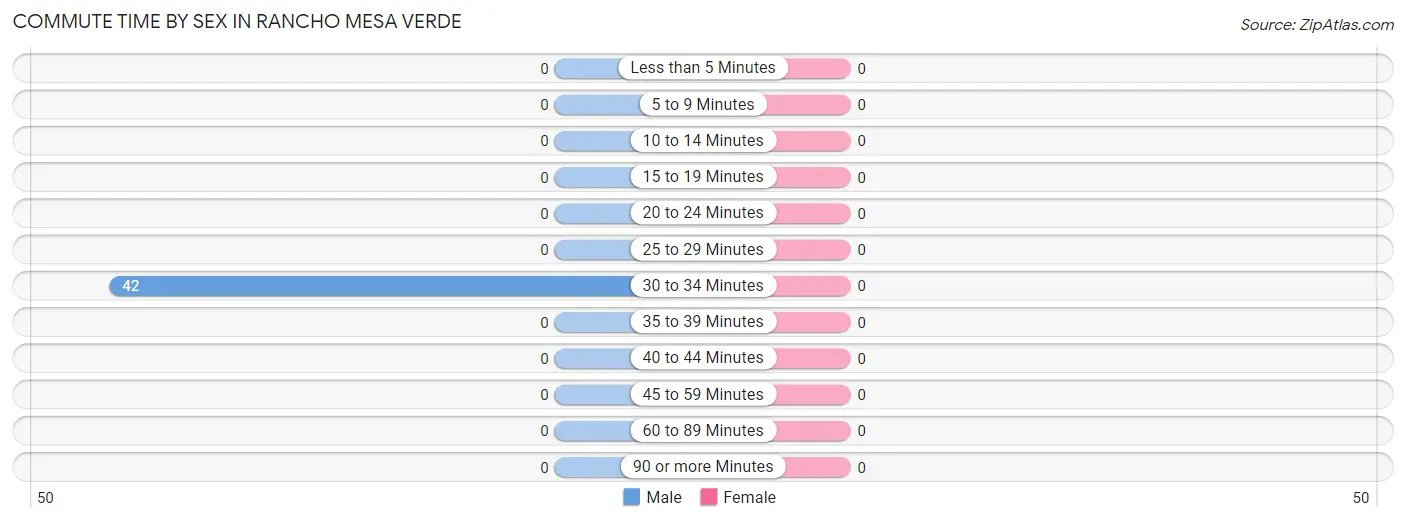
| Commute Time | Male | Female |
| Less than 5 Minutes | 0 (0.0%) | 0 (0.0%) |
| 5 to 9 Minutes | 0 (0.0%) | 0 (0.0%) |
| 10 to 14 Minutes | 0 (0.0%) | 0 (0.0%) |
| 15 to 19 Minutes | 0 (0.0%) | 0 (0.0%) |
| 20 to 24 Minutes | 0 (0.0%) | 0 (0.0%) |
| 25 to 29 Minutes | 0 (0.0%) | 0 (0.0%) |
| 30 to 34 Minutes | 42 (100.0%) | 0 (0.0%) |
| 35 to 39 Minutes | 0 (0.0%) | 0 (0.0%) |
| 40 to 44 Minutes | 0 (0.0%) | 0 (0.0%) |
| 45 to 59 Minutes | 0 (0.0%) | 0 (0.0%) |
| 60 to 89 Minutes | 0 (0.0%) | 0 (0.0%) |
| 90 or more Minutes | 0 (0.0%) | 0 (0.0%) |
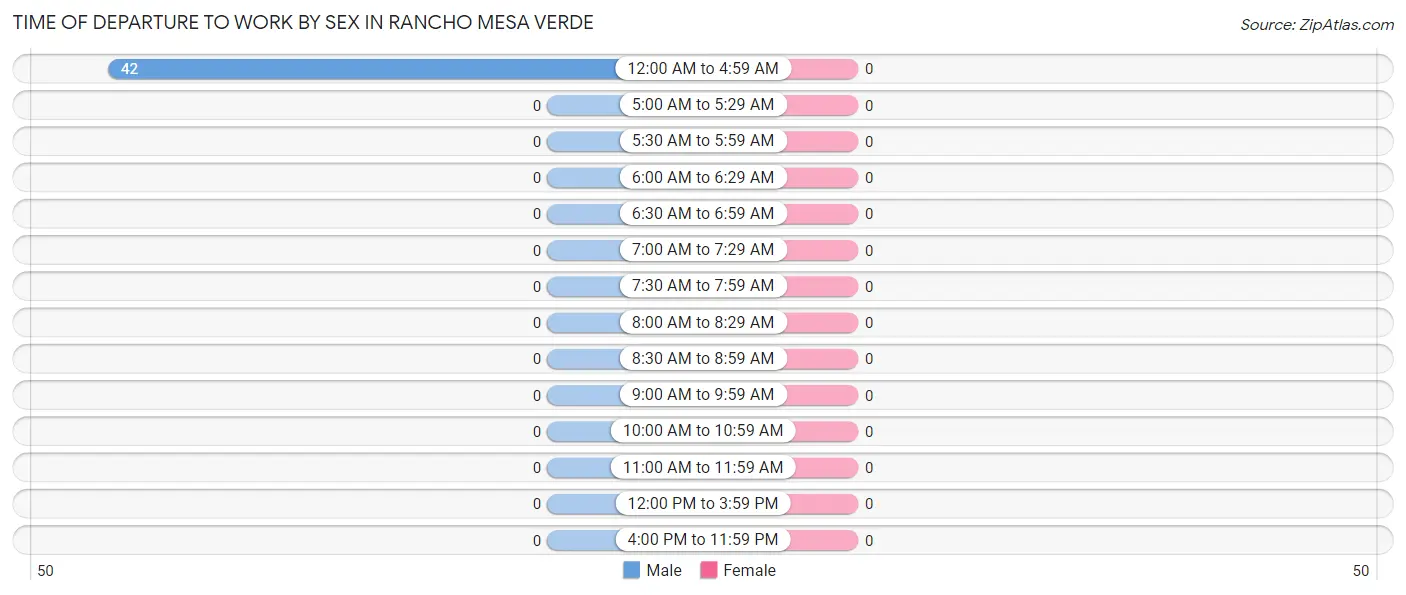
Time of Departure to Work by Sex in Rancho Mesa Verde
| Time of Departure | Male | Female |
| 12:00 AM to 4:59 AM | 42 (100.0%) | 0 (0.0%) |
| 5:00 AM to 5:29 AM | 0 (0.0%) | 0 (0.0%) |
| 5:30 AM to 5:59 AM | 0 (0.0%) | 0 (0.0%) |
| 6:00 AM to 6:29 AM | 0 (0.0%) | 0 (0.0%) |
| 6:30 AM to 6:59 AM | 0 (0.0%) | 0 (0.0%) |
| 7:00 AM to 7:29 AM | 0 (0.0%) | 0 (0.0%) |
| 7:30 AM to 7:59 AM | 0 (0.0%) | 0 (0.0%) |
| 8:00 AM to 8:29 AM | 0 (0.0%) | 0 (0.0%) |
| 8:30 AM to 8:59 AM | 0 (0.0%) | 0 (0.0%) |
| 9:00 AM to 9:59 AM | 0 (0.0%) | 0 (0.0%) |
| 10:00 AM to 10:59 AM | 0 (0.0%) | 0 (0.0%) |
| 11:00 AM to 11:59 AM | 0 (0.0%) | 0 (0.0%) |
| 12:00 PM to 3:59 PM | 0 (0.0%) | 0 (0.0%) |
| 4:00 PM to 11:59 PM | 0 (0.0%) | 0 (0.0%) |
| Total | 42 (100.0%) | 0 (0.0%) |
Housing Occupancy in Rancho Mesa Verde
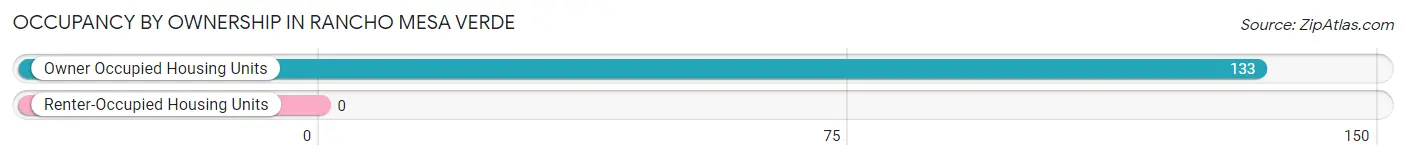
Occupancy by Ownership in Rancho Mesa Verde
Of the total 133 dwellings in Rancho Mesa Verde, owner-occupied units account for 133 (100.0%), while renter-occupied units make up 0 (0.0%).
| Occupancy | # Housing Units | % Housing Units |
| Owner Occupied Housing Units | 133 | 100.0% |
| Renter-Occupied Housing Units | 0 | 0.0% |
| Total Occupied Housing Units | 133 | 100.0% |
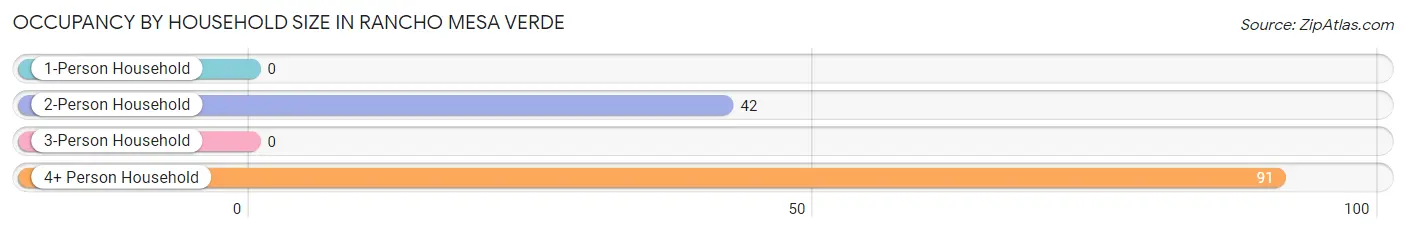
Occupancy by Household Size in Rancho Mesa Verde
| Household Size | # Housing Units | % Housing Units |
| 1-Person Household | 0 | 0.0% |
| 2-Person Household | 42 | 31.6% |
| 3-Person Household | 0 | 0.0% |
| 4+ Person Household | 91 | 68.4% |
| Total Housing Units | 133 | 100.0% |
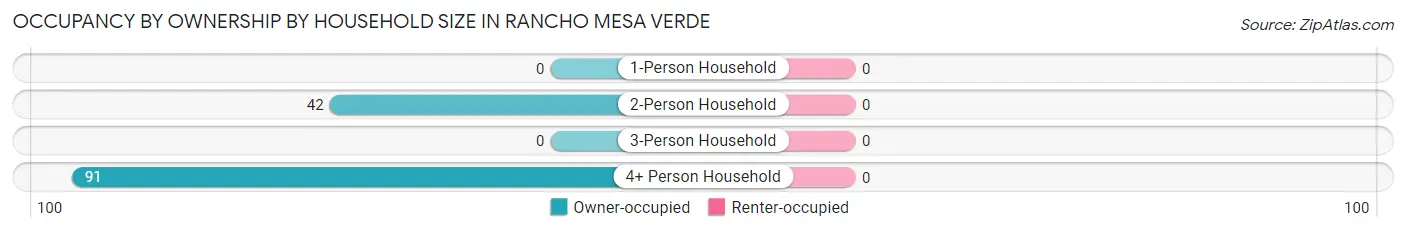
Occupancy by Ownership by Household Size in Rancho Mesa Verde
| Household Size | Owner-occupied | Renter-occupied |
| 1-Person Household | 0 (0.0%) | 0 (0.0%) |
| 2-Person Household | 42 (100.0%) | 0 (0.0%) |
| 3-Person Household | 0 (0.0%) | 0 (0.0%) |
| 4+ Person Household | 91 (100.0%) | 0 (0.0%) |
| Total Housing Units | 133 (100.0%) | 0 (0.0%) |
Occupancy by Educational Attainment in Rancho Mesa Verde
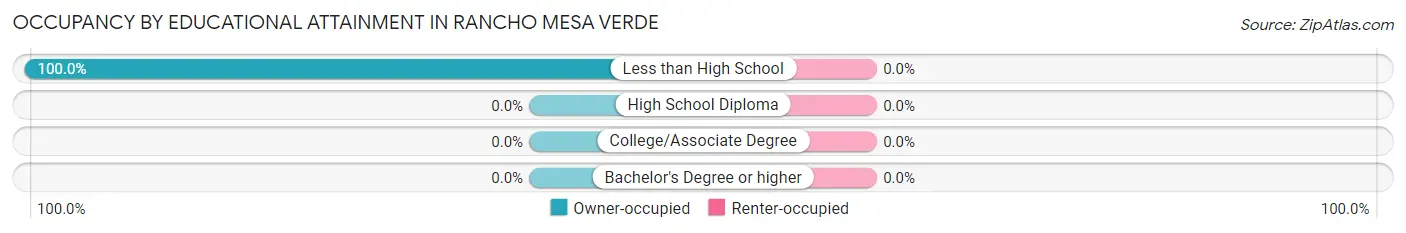
| Household Size | Owner-occupied | Renter-occupied |
| Less than High School | 133 (100.0%) | 0 (0.0%) |
| High School Diploma | 0 (0.0%) | 0 (0.0%) |
| College/Associate Degree | 0 (0.0%) | 0 (0.0%) |
| Bachelor's Degree or higher | 0 (0.0%) | 0 (0.0%) |
Occupancy by Age of Householder in Rancho Mesa Verde
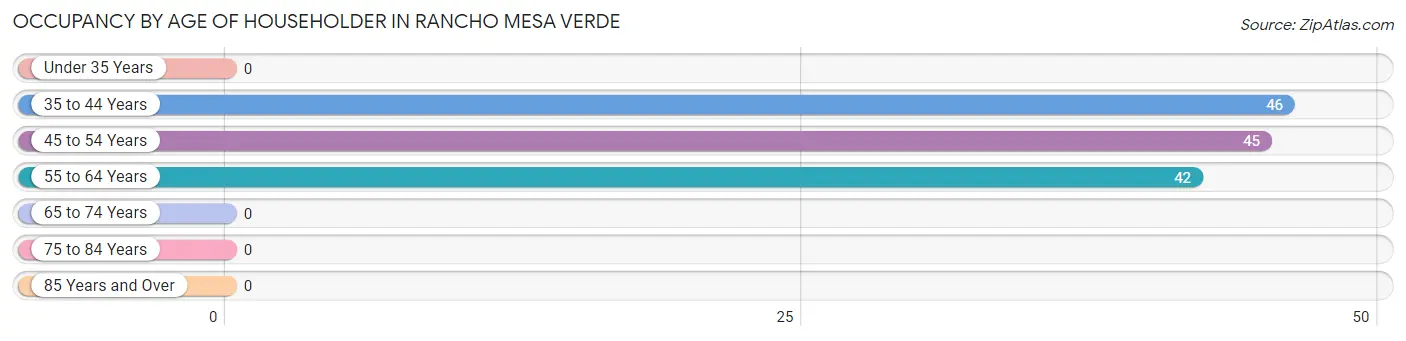
| Age Bracket | # Households | % Households |
| Under 35 Years | 0 | 0.0% |
| 35 to 44 Years | 46 | 34.6% |
| 45 to 54 Years | 45 | 33.8% |
| 55 to 64 Years | 42 | 31.6% |
| 65 to 74 Years | 0 | 0.0% |
| 75 to 84 Years | 0 | 0.0% |
| 85 Years and Over | 0 | 0.0% |
| Total | 133 | 100.0% |
Housing Finances in Rancho Mesa Verde
Median Income by Occupancy in Rancho Mesa Verde
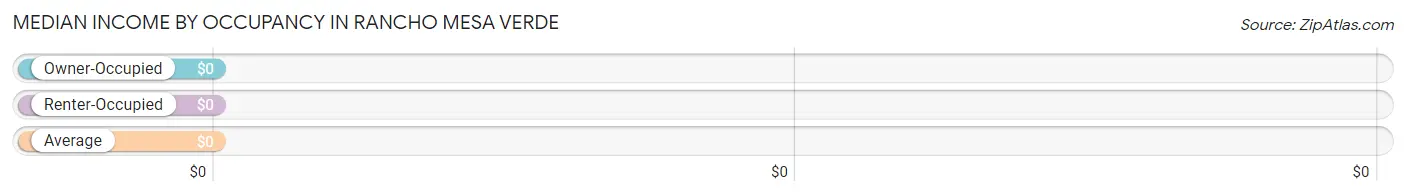
| Occupancy Type | # Households | Median Income |
| Owner-Occupied | 133 (100.0%) | $0 |
| Renter-Occupied | 0 (0.0%) | $0 |
| Average | 133 (100.0%) | $0 |
Occupancy by Householder Income Bracket in Rancho Mesa Verde
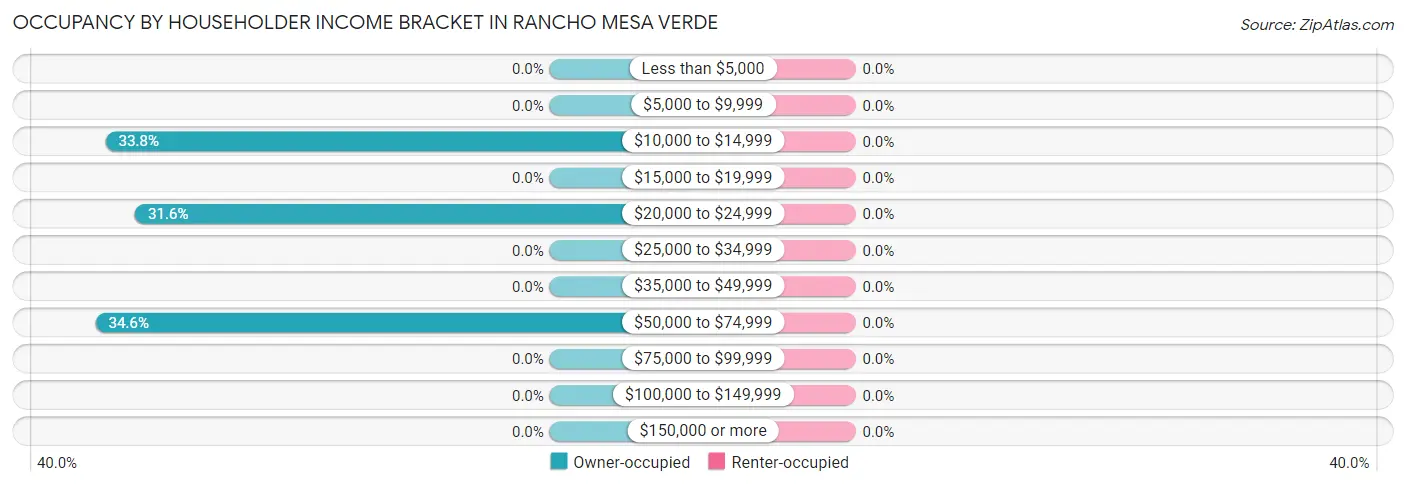
| Income Bracket | Owner-occupied | Renter-occupied |
| Less than $5,000 | 0 (0.0%) | 0 (0.0%) |
| $5,000 to $9,999 | 0 (0.0%) | 0 (0.0%) |
| $10,000 to $14,999 | 45 (33.8%) | 0 (0.0%) |
| $15,000 to $19,999 | 0 (0.0%) | 0 (0.0%) |
| $20,000 to $24,999 | 42 (31.6%) | 0 (0.0%) |
| $25,000 to $34,999 | 0 (0.0%) | 0 (0.0%) |
| $35,000 to $49,999 | 0 (0.0%) | 0 (0.0%) |
| $50,000 to $74,999 | 46 (34.6%) | 0 (0.0%) |
| $75,000 to $99,999 | 0 (0.0%) | 0 (0.0%) |
| $100,000 to $149,999 | 0 (0.0%) | 0 (0.0%) |
| $150,000 or more | 0 (0.0%) | 0 (0.0%) |
| Total | 133 (100.0%) | 0 (0.0%) |
Monthly Housing Cost Tiers in Rancho Mesa Verde
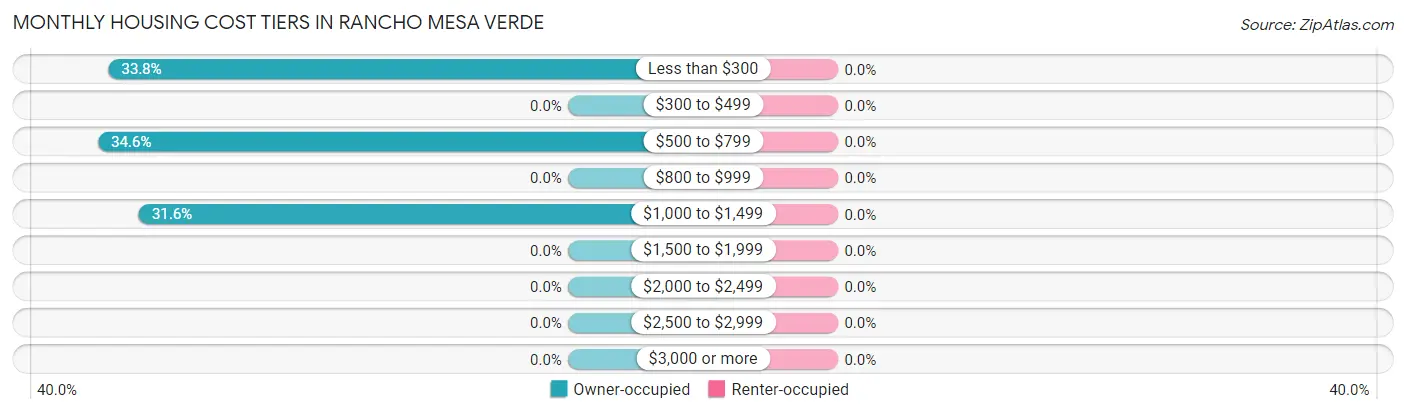
| Monthly Cost | Owner-occupied | Renter-occupied |
| Less than $300 | 45 (33.8%) | 0 (0.0%) |
| $300 to $499 | 0 (0.0%) | 0 (0.0%) |
| $500 to $799 | 46 (34.6%) | 0 (0.0%) |
| $800 to $999 | 0 (0.0%) | 0 (0.0%) |
| $1,000 to $1,499 | 42 (31.6%) | 0 (0.0%) |
| $1,500 to $1,999 | 0 (0.0%) | 0 (0.0%) |
| $2,000 to $2,499 | 0 (0.0%) | 0 (0.0%) |
| $2,500 to $2,999 | 0 (0.0%) | 0 (0.0%) |
| $3,000 or more | 0 (0.0%) | 0 (0.0%) |
| Total | 133 (100.0%) | 0 (0.0%) |
Physical Housing Characteristics in Rancho Mesa Verde
Housing Structures in Rancho Mesa Verde
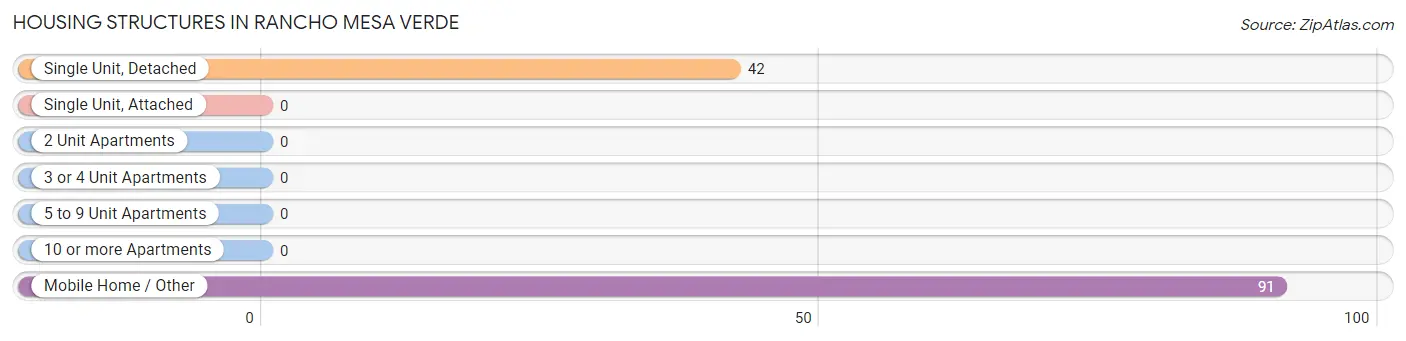
| Structure Type | # Housing Units | % Housing Units |
| Single Unit, Detached | 42 | 31.6% |
| Single Unit, Attached | 0 | 0.0% |
| 2 Unit Apartments | 0 | 0.0% |
| 3 or 4 Unit Apartments | 0 | 0.0% |
| 5 to 9 Unit Apartments | 0 | 0.0% |
| 10 or more Apartments | 0 | 0.0% |
| Mobile Home / Other | 91 | 68.4% |
| Total | 133 | 100.0% |
Housing Structures by Occupancy in Rancho Mesa Verde
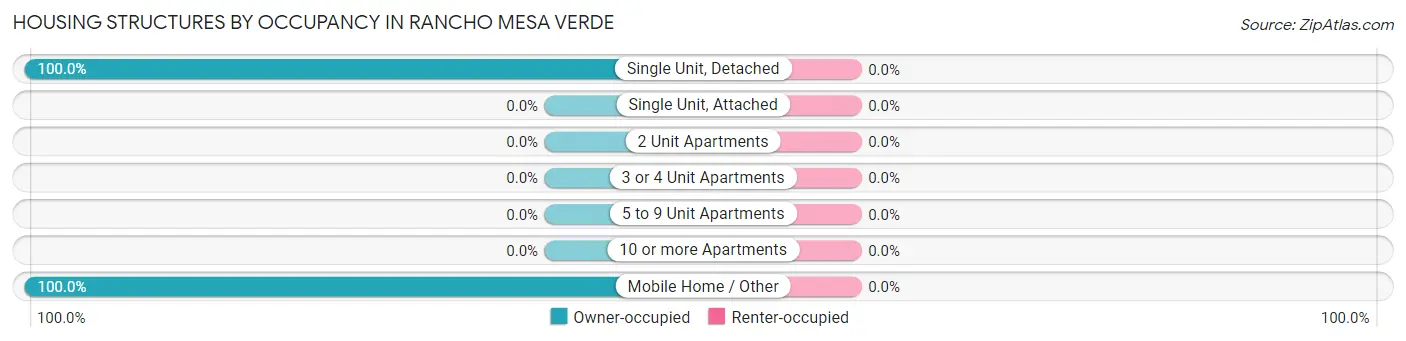
| Structure Type | Owner-occupied | Renter-occupied |
| Single Unit, Detached | 42 (100.0%) | 0 (0.0%) |
| Single Unit, Attached | 0 (0.0%) | 0 (0.0%) |
| 2 Unit Apartments | 0 (0.0%) | 0 (0.0%) |
| 3 or 4 Unit Apartments | 0 (0.0%) | 0 (0.0%) |
| 5 to 9 Unit Apartments | 0 (0.0%) | 0 (0.0%) |
| 10 or more Apartments | 0 (0.0%) | 0 (0.0%) |
| Mobile Home / Other | 91 (100.0%) | 0 (0.0%) |
| Total | 133 (100.0%) | 0 (0.0%) |
Housing Structures by Number of Rooms in Rancho Mesa Verde
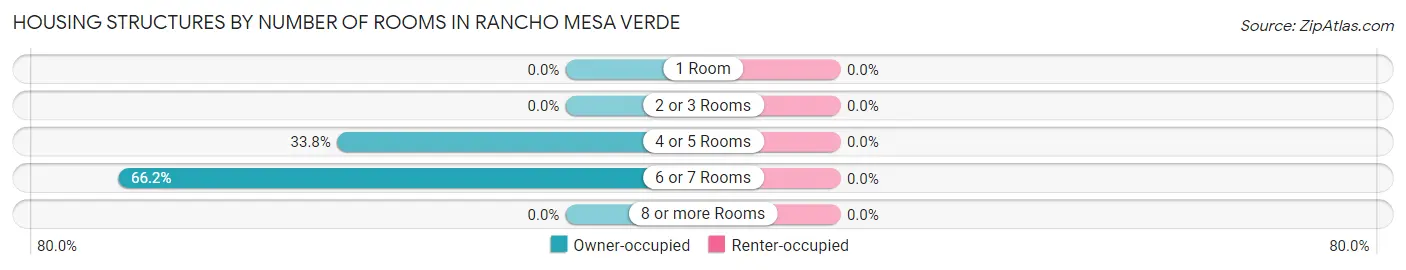
| Number of Rooms | Owner-occupied | Renter-occupied |
| 1 Room | 0 (0.0%) | 0 (0.0%) |
| 2 or 3 Rooms | 0 (0.0%) | 0 (0.0%) |
| 4 or 5 Rooms | 45 (33.8%) | 0 (0.0%) |
| 6 or 7 Rooms | 88 (66.2%) | 0 (0.0%) |
| 8 or more Rooms | 0 (0.0%) | 0 (0.0%) |
| Total | 133 (100.0%) | 0 (0.0%) |
Housing Structure by Heating Type in Rancho Mesa Verde
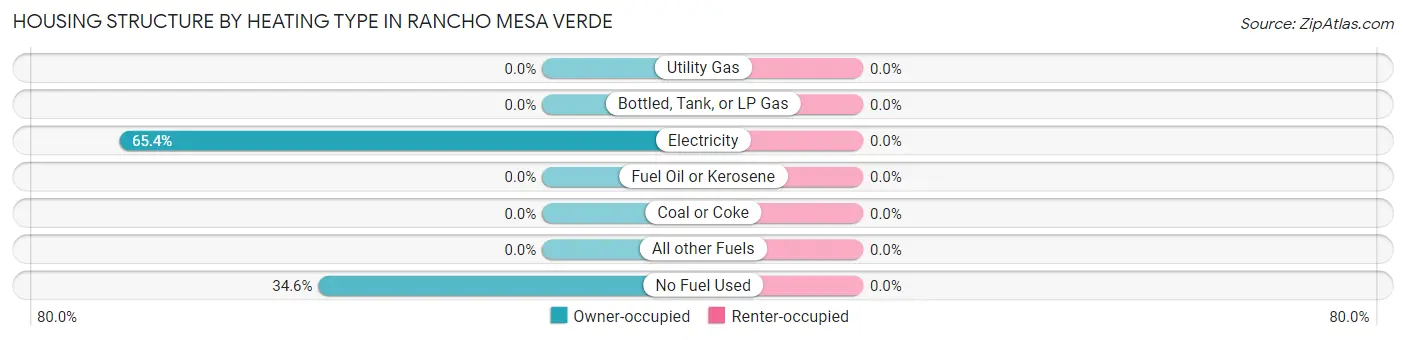
| Heating Type | Owner-occupied | Renter-occupied |
| Utility Gas | 0 (0.0%) | 0 (0.0%) |
| Bottled, Tank, or LP Gas | 0 (0.0%) | 0 (0.0%) |
| Electricity | 87 (65.4%) | 0 (0.0%) |
| Fuel Oil or Kerosene | 0 (0.0%) | 0 (0.0%) |
| Coal or Coke | 0 (0.0%) | 0 (0.0%) |
| All other Fuels | 0 (0.0%) | 0 (0.0%) |
| No Fuel Used | 46 (34.6%) | 0 (0.0%) |
| Total | 133 (100.0%) | 0 (0.0%) |
Household Vehicle Usage in Rancho Mesa Verde
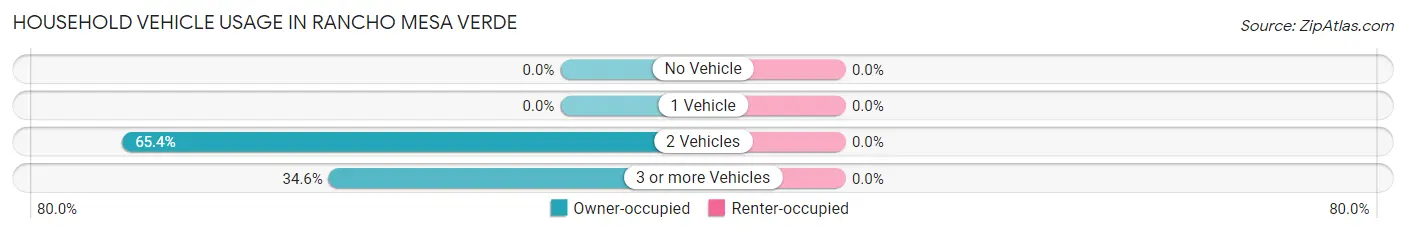
| Vehicles per Household | Owner-occupied | Renter-occupied |
| No Vehicle | 0 (0.0%) | 0 (0.0%) |
| 1 Vehicle | 0 (0.0%) | 0 (0.0%) |
| 2 Vehicles | 87 (65.4%) | 0 (0.0%) |
| 3 or more Vehicles | 46 (34.6%) | 0 (0.0%) |
| Total | 133 (100.0%) | 0 (0.0%) |
Real Estate & Mortgages in Rancho Mesa Verde
Real Estate and Mortgage Overview in Rancho Mesa Verde
| Characteristic | Without Mortgage | With Mortgage |
| Housing Units | 45 | 88 |
| Median Property Value | - | - |
| Median Household Income | - | - |
| Monthly Housing Costs | - | - |
| Real Estate Taxes | - | - |
Property Value by Mortgage Status in Rancho Mesa Verde
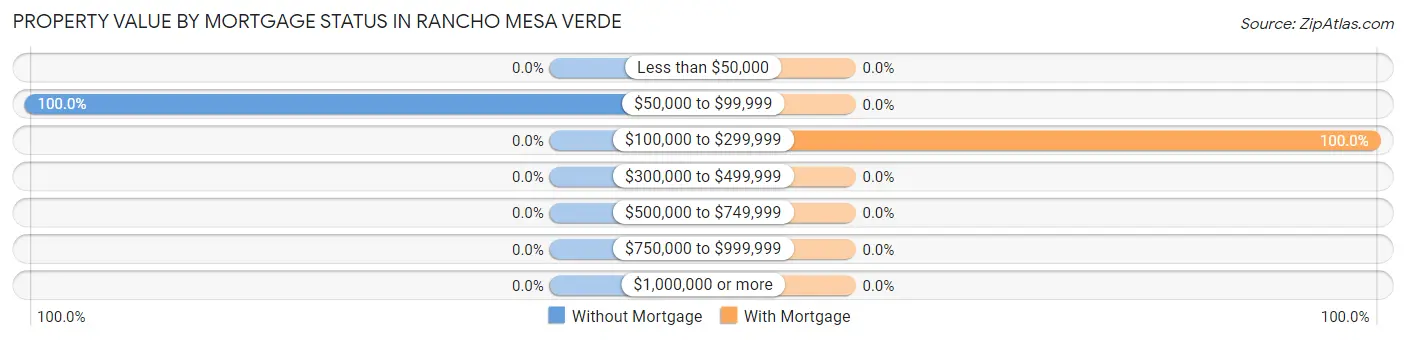
| Property Value | Without Mortgage | With Mortgage |
| Less than $50,000 | 0 (0.0%) | 0 (0.0%) |
| $50,000 to $99,999 | 45 (100.0%) | 0 (0.0%) |
| $100,000 to $299,999 | 0 (0.0%) | 88 (100.0%) |
| $300,000 to $499,999 | 0 (0.0%) | 0 (0.0%) |
| $500,000 to $749,999 | 0 (0.0%) | 0 (0.0%) |
| $750,000 to $999,999 | 0 (0.0%) | 0 (0.0%) |
| $1,000,000 or more | 0 (0.0%) | 0 (0.0%) |
| Total | 45 (100.0%) | 88 (100.0%) |
Household Income by Mortgage Status in Rancho Mesa Verde
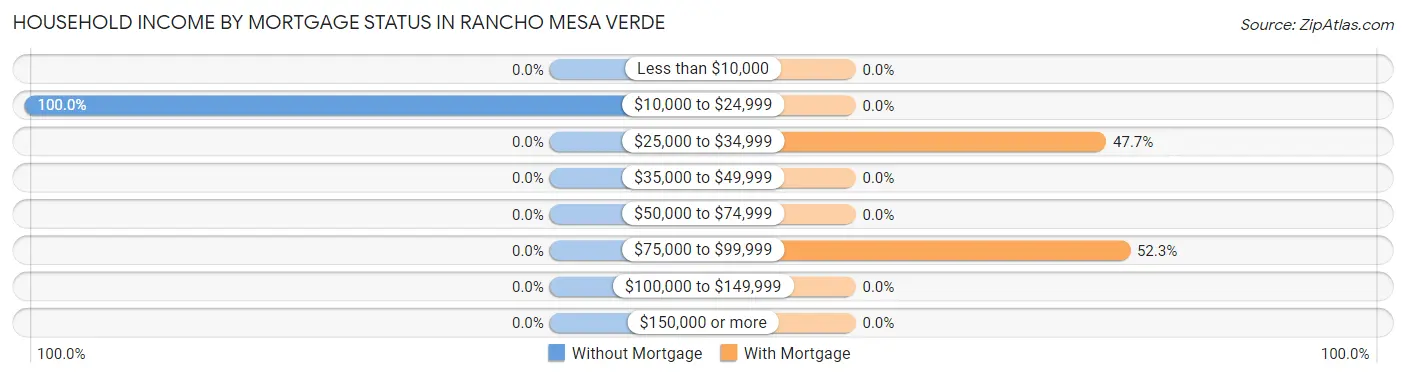
| Household Income | Without Mortgage | With Mortgage |
| Less than $10,000 | 0 (0.0%) | 0 (0.0%) |
| $10,000 to $24,999 | 45 (100.0%) | 0 (0.0%) |
| $25,000 to $34,999 | 0 (0.0%) | 42 (47.7%) |
| $35,000 to $49,999 | 0 (0.0%) | 0 (0.0%) |
| $50,000 to $74,999 | 0 (0.0%) | 0 (0.0%) |
| $75,000 to $99,999 | 0 (0.0%) | 46 (52.3%) |
| $100,000 to $149,999 | 0 (0.0%) | 0 (0.0%) |
| $150,000 or more | 0 (0.0%) | 0 (0.0%) |
| Total | 45 (100.0%) | 88 (100.0%) |
Property Value to Household Income Ratio in Rancho Mesa Verde
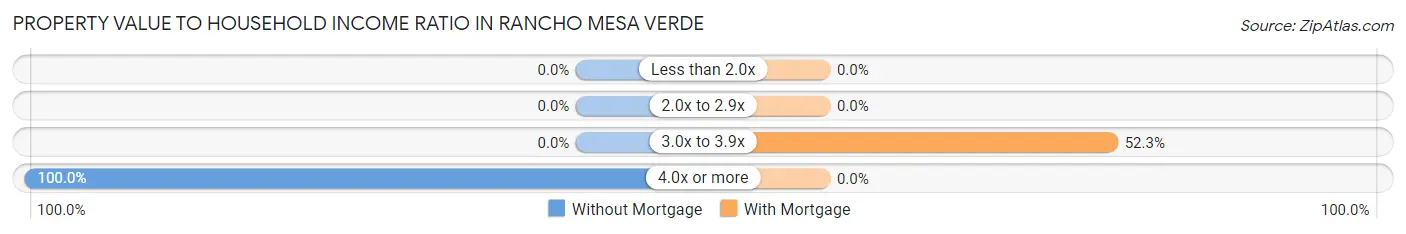
| Value-to-Income Ratio | Without Mortgage | With Mortgage |
| Less than 2.0x | 0 (0.0%) | 0 (0.0%) |
| 2.0x to 2.9x | 0 (0.0%) | 0 (0.0%) |
| 3.0x to 3.9x | 0 (0.0%) | 46 (52.3%) |
| 4.0x or more | 45 (100.0%) | 0 (0.0%) |
| Total | 45 (100.0%) | 88 (100.0%) |
Real Estate Taxes by Mortgage Status in Rancho Mesa Verde
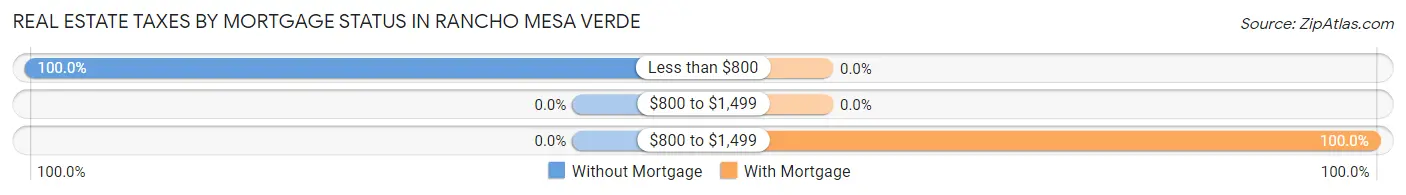
| Property Taxes | Without Mortgage | With Mortgage |
| Less than $800 | 45 (100.0%) | 0 (0.0%) |
| $800 to $1,499 | 0 (0.0%) | 0 (0.0%) |
| $800 to $1,499 | 0 (0.0%) | 88 (100.0%) |
| Total | 45 (100.0%) | 88 (100.0%) |
Health & Disability in Rancho Mesa Verde
Health Insurance Coverage by Age in Rancho Mesa Verde
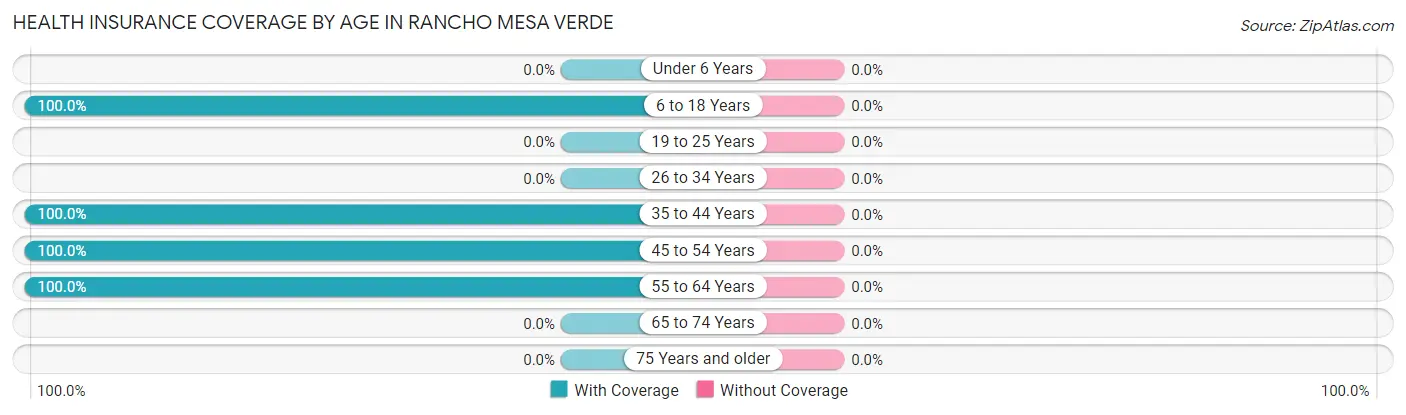
| Age Bracket | With Coverage | Without Coverage |
| Under 6 Years | 0 (0.0%) | 0 (0.0%) |
| 6 to 18 Years | 340 (100.0%) | 0 (0.0%) |
| 19 to 25 Years | 0 (0.0%) | 0 (0.0%) |
| 26 to 34 Years | 0 (0.0%) | 0 (0.0%) |
| 35 to 44 Years | 46 (100.0%) | 0 (0.0%) |
| 45 to 54 Years | 87 (100.0%) | 0 (0.0%) |
| 55 to 64 Years | 126 (100.0%) | 0 (0.0%) |
| 65 to 74 Years | 0 (0.0%) | 0 (0.0%) |
| 75 Years and older | 0 (0.0%) | 0 (0.0%) |
| Total | 599 (100.0%) | 0 (0.0%) |
Health Insurance Coverage by Citizenship Status in Rancho Mesa Verde
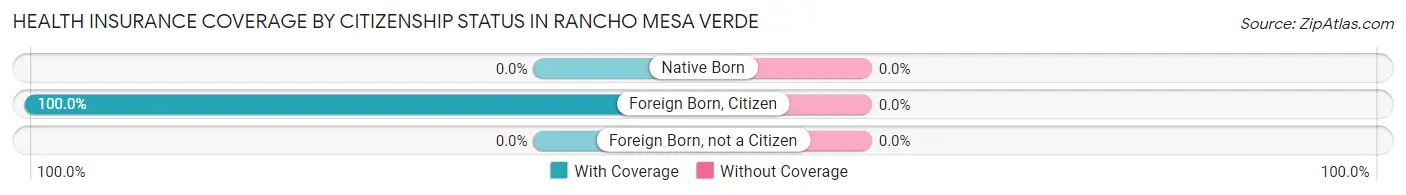
| Citizenship Status | With Coverage | Without Coverage |
| Native Born | 0 (0.0%) | 0 (0.0%) |
| Foreign Born, Citizen | 340 (100.0%) | 0 (0.0%) |
| Foreign Born, not a Citizen | 0 (0.0%) | 0 (0.0%) |
Health Insurance Coverage by Household Income in Rancho Mesa Verde
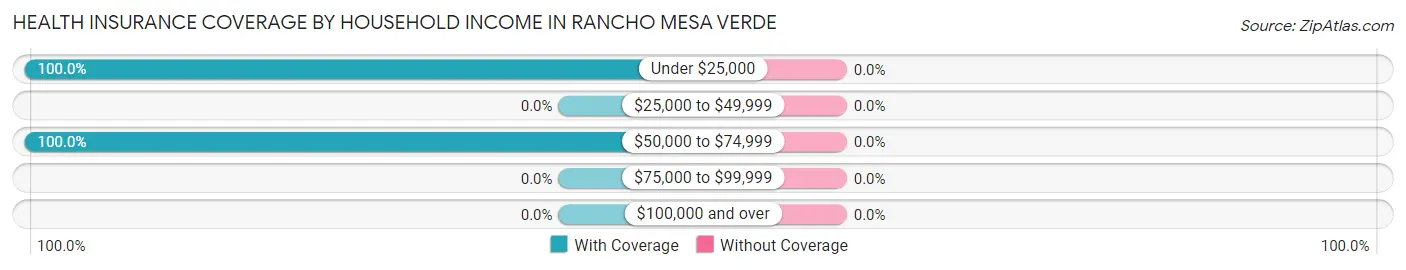
| Household Income | With Coverage | Without Coverage |
| Under $25,000 | 374 (100.0%) | 0 (0.0%) |
| $25,000 to $49,999 | 0 (0.0%) | 0 (0.0%) |
| $50,000 to $74,999 | 225 (100.0%) | 0 (0.0%) |
| $75,000 to $99,999 | 0 (0.0%) | 0 (0.0%) |
| $100,000 and over | 0 (0.0%) | 0 (0.0%) |
Public vs Private Health Insurance Coverage by Age in Rancho Mesa Verde
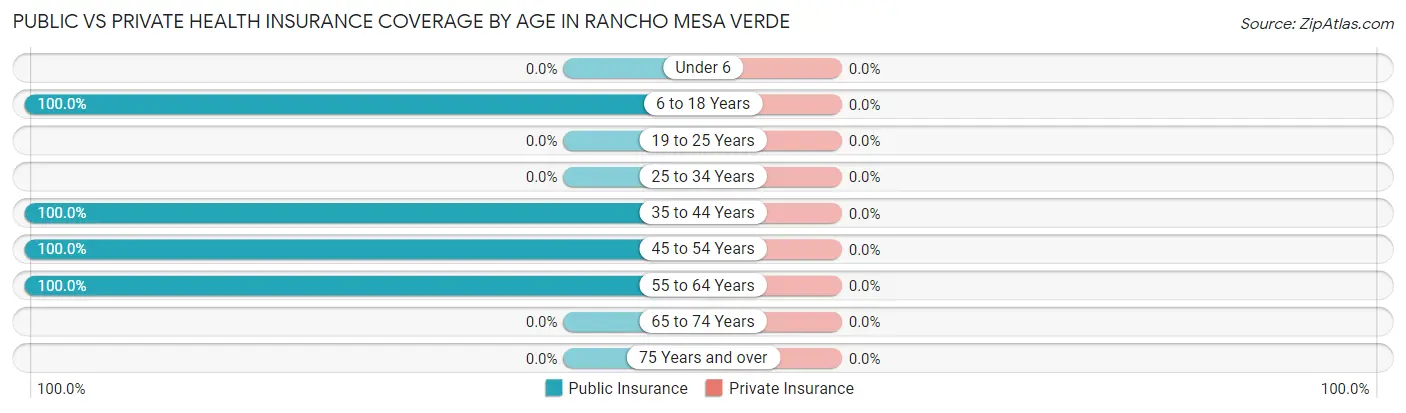
| Age Bracket | Public Insurance | Private Insurance |
| Under 6 | 0 (0.0%) | 0 (0.0%) |
| 6 to 18 Years | 340 (100.0%) | 0 (0.0%) |
| 19 to 25 Years | 0 (0.0%) | 0 (0.0%) |
| 25 to 34 Years | 0 (0.0%) | 0 (0.0%) |
| 35 to 44 Years | 46 (100.0%) | 0 (0.0%) |
| 45 to 54 Years | 87 (100.0%) | 0 (0.0%) |
| 55 to 64 Years | 126 (100.0%) | 0 (0.0%) |
| 65 to 74 Years | 0 (0.0%) | 0 (0.0%) |
| 75 Years and over | 0 (0.0%) | 0 (0.0%) |
| Total | 599 (100.0%) | 0 (0.0%) |
Disability Status by Sex by Age in Rancho Mesa Verde
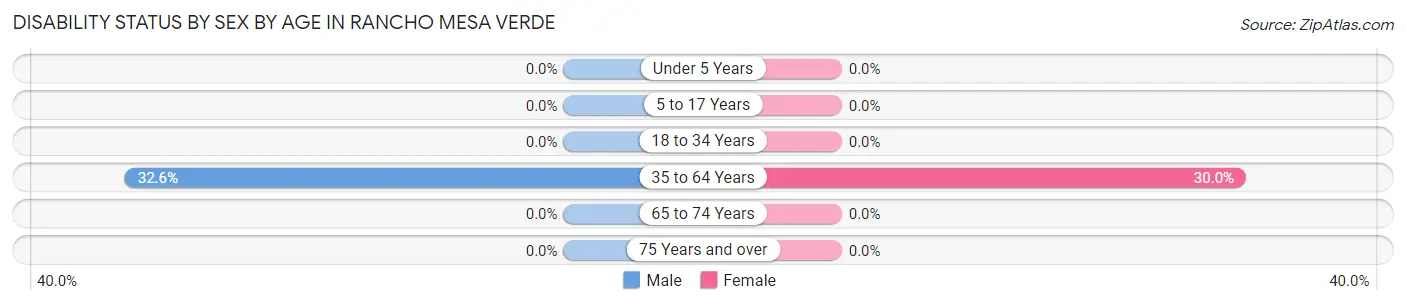
| Age Bracket | Male | Female |
| Under 5 Years | 0 (0.0%) | 0 (0.0%) |
| 5 to 17 Years | 0 (0.0%) | 0 (0.0%) |
| 18 to 34 Years | 0 (0.0%) | 0 (0.0%) |
| 35 to 64 Years | 42 (32.6%) | 39 (30.0%) |
| 65 to 74 Years | 0 (0.0%) | 0 (0.0%) |
| 75 Years and over | 0 (0.0%) | 0 (0.0%) |
Disability Class by Sex by Age in Rancho Mesa Verde
Disability Class: Hearing Difficulty
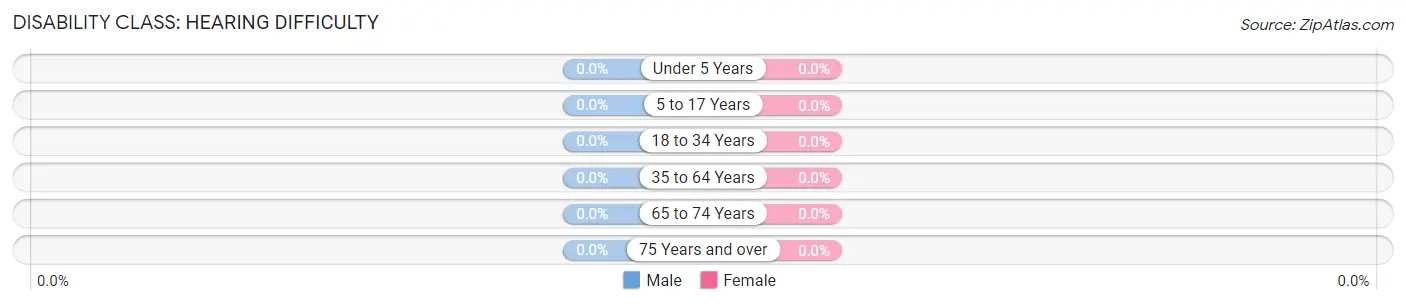
| Age Bracket | Male | Female |
| Under 5 Years | 0 (0.0%) | 0 (0.0%) |
| 5 to 17 Years | 0 (0.0%) | 0 (0.0%) |
| 18 to 34 Years | 0 (0.0%) | 0 (0.0%) |
| 35 to 64 Years | 0 (0.0%) | 0 (0.0%) |
| 65 to 74 Years | 0 (0.0%) | 0 (0.0%) |
| 75 Years and over | 0 (0.0%) | 0 (0.0%) |
Disability Class: Vision Difficulty
| Age Bracket | Male | Female |
| Under 5 Years | 0 (0.0%) | 0 (0.0%) |
| 5 to 17 Years | 0 (0.0%) | 0 (0.0%) |
| 18 to 34 Years | 0 (0.0%) | 0 (0.0%) |
| 35 to 64 Years | 0 (0.0%) | 0 (0.0%) |
| 65 to 74 Years | 0 (0.0%) | 0 (0.0%) |
| 75 Years and over | 0 (0.0%) | 0 (0.0%) |
Disability Class: Cognitive Difficulty
| Age Bracket | Male | Female |
| 5 to 17 Years | 0 (0.0%) | 0 (0.0%) |
| 18 to 34 Years | 0 (0.0%) | 0 (0.0%) |
| 35 to 64 Years | 0 (0.0%) | 0 (0.0%) |
| 65 to 74 Years | 0 (0.0%) | 0 (0.0%) |
| 75 Years and over | 0 (0.0%) | 0 (0.0%) |
Disability Class: Ambulatory Difficulty
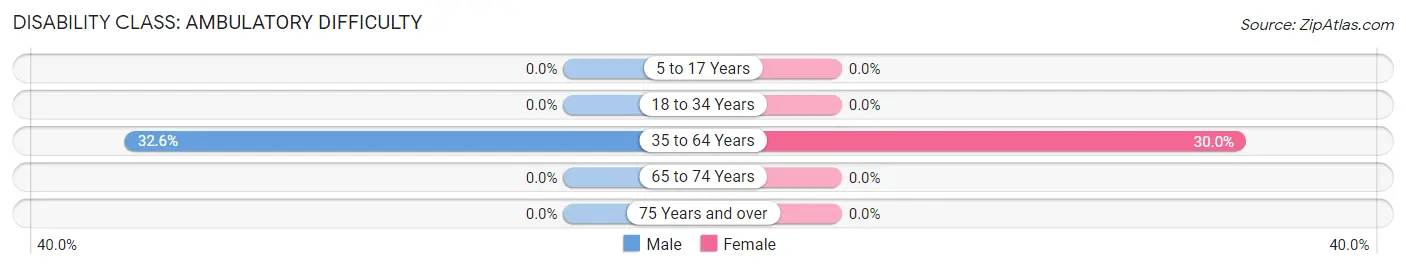
| Age Bracket | Male | Female |
| 5 to 17 Years | 0 (0.0%) | 0 (0.0%) |
| 18 to 34 Years | 0 (0.0%) | 0 (0.0%) |
| 35 to 64 Years | 42 (32.6%) | 39 (30.0%) |
| 65 to 74 Years | 0 (0.0%) | 0 (0.0%) |
| 75 Years and over | 0 (0.0%) | 0 (0.0%) |
Disability Class: Self-Care Difficulty
| Age Bracket | Male | Female |
| 5 to 17 Years | 0 (0.0%) | 0 (0.0%) |
| 18 to 34 Years | 0 (0.0%) | 0 (0.0%) |
| 35 to 64 Years | 0 (0.0%) | 0 (0.0%) |
| 65 to 74 Years | 0 (0.0%) | 0 (0.0%) |
| 75 Years and over | 0 (0.0%) | 0 (0.0%) |
Technology Access in Rancho Mesa Verde
Computing Device Access in Rancho Mesa Verde
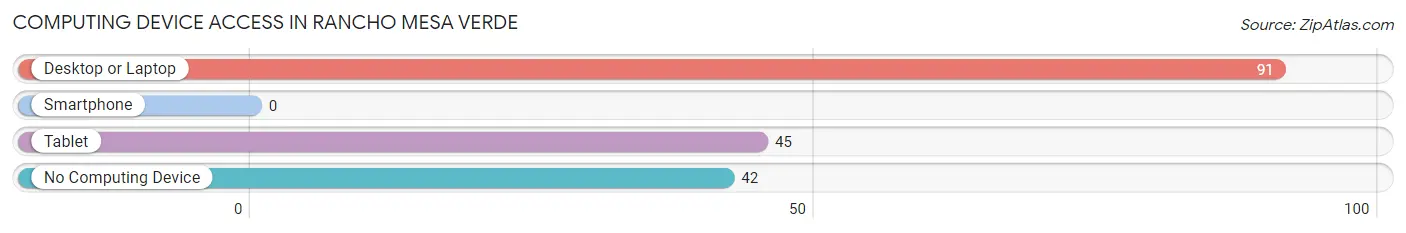
| Device Type | # Households | % Households |
| Desktop or Laptop | 91 | 68.4% |
| Smartphone | 0 | 0.0% |
| Tablet | 45 | 33.8% |
| No Computing Device | 42 | 31.6% |
| Total | 133 | 100.0% |
Internet Access in Rancho Mesa Verde
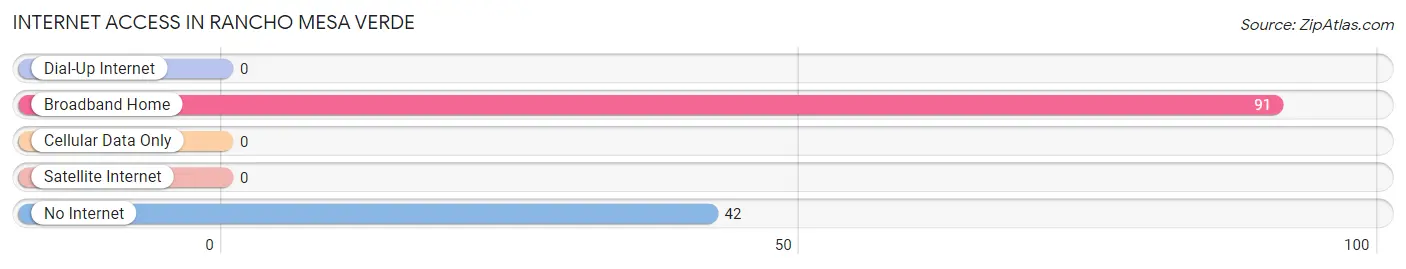
| Internet Type | # Households | % Households |
| Dial-Up Internet | 0 | 0.0% |
| Broadband Home | 91 | 68.4% |
| Cellular Data Only | 0 | 0.0% |
| Satellite Internet | 0 | 0.0% |
| No Internet | 42 | 31.6% |
| Total | 133 | 100.0% |
Rancho Mesa Verde Summary
Rancho Mesa Verde is a small unincorporated community located in the Sonoran Desert of Arizona. It is situated in the western part of the state, approximately 25 miles south of Phoenix. The community is located in Maricopa County and is part of the Phoenix metropolitan area.
History
Rancho Mesa Verde was founded in the late 1800s by a group of Mexican settlers who were looking for a place to settle and raise their families. The settlers were attracted to the area due to its abundant natural resources, including water, timber, and grazing land. The settlers named the area Rancho Mesa Verde, which translates to “green mesa” in Spanish.
The settlers built a small village and began to farm the land. They grew crops such as corn, beans, squash, and melons. They also raised cattle and horses. The settlers also built a small church, which still stands today.
In the early 1900s, the area began to attract more settlers. The population of Rancho Mesa Verde grew to over 500 people by the 1930s. The community was largely self-sufficient, with its own stores, schools, and post office.
Geography
Rancho Mesa Verde is located in the Sonoran Desert of Arizona. The area is characterized by hot, dry summers and mild winters. The average annual temperature is around 70 degrees Fahrenheit. The area receives an average of 8 inches of rain per year.
The terrain of Rancho Mesa Verde is mostly flat, with some rolling hills. The area is surrounded by mountains, including the Sierra Estrella and the White Tank Mountains. The area is also home to several creeks and rivers, including the Gila River and the Salt River.
Economy
Rancho Mesa Verde is a small, rural community with a limited economy. The primary industry in the area is agriculture. The area is home to several farms, which grow crops such as corn, beans, squash, and melons. The area is also home to several ranches, which raise cattle and horses.
The area is also home to several small businesses, including restaurants, stores, and gas stations. The area is also home to several tourist attractions, including the White Tank Mountains and the Gila River.
Demographics
As of the 2010 census, the population of Rancho Mesa Verde was 1,845. The population is largely Hispanic, with over 90% of the population identifying as Hispanic or Latino. The median household income in the area is $35,000, and the median age is 33.
Conclusion
Rancho Mesa Verde is a small, rural community located in the Sonoran Desert of Arizona. The area is characterized by hot, dry summers and mild winters. The area is home to several farms and ranches, as well as several small businesses. The population of the area is largely Hispanic, with over 90% of the population identifying as Hispanic or Latino. The area is also home to several tourist attractions, including the White Tank Mountains and the Gila River.
Common Questions
What is Per Capita Income in Rancho Mesa Verde?
Per Capita income in Rancho Mesa Verde is $6,639.
What is Inequality or Gini Index in Rancho Mesa Verde?
Inequality or Gini Index in Rancho Mesa Verde is 0.34.
What is the Total Population of Rancho Mesa Verde?
Total Population of Rancho Mesa Verde is 599.
What is the Total Male Population of Rancho Mesa Verde?
Total Male Population of Rancho Mesa Verde is 369.
What is the Total Female Population of Rancho Mesa Verde?
Total Female Population of Rancho Mesa Verde is 230.
What is the Ratio of Males per 100 Females in Rancho Mesa Verde?
There are 160.43 Males per 100 Females in Rancho Mesa Verde.
What is the Ratio of Females per 100 Males in Rancho Mesa Verde?
There are 62.33 Females per 100 Males in Rancho Mesa Verde.
What is the Median Population Age in Rancho Mesa Verde?
Median Population Age in Rancho Mesa Verde is 17.9 Years.
What is the Average Family Size in Rancho Mesa Verde
Average Family Size in Rancho Mesa Verde is 4.5 People.
What is the Average Household Size in Rancho Mesa Verde
Average Household Size in Rancho Mesa Verde is 4.5 People.
How Large is the Labor Force in Rancho Mesa Verde?
There are 87 People in the Labor Forcein in Rancho Mesa Verde.
What is the Percentage of People in the Labor Force in Rancho Mesa Verde?
25.1% of People are in the Labor Force in Rancho Mesa Verde.
What is the Unemployment Rate in Rancho Mesa Verde?
Unemployment Rate in Rancho Mesa Verde is 51.7%.