Pinon, AZ Map & Demographics
Pinon Map
Pinon Overview
$18,811
PER CAPITA INCOME
$42,750
AVG FAMILY INCOME
$42,750
AVG HOUSEHOLD INCOME
2.5%
WAGE / INCOME GAP [ % ]
97.5¢/ $1
WAGE / INCOME GAP [ $ ]
$12,482
FAMILY INCOME DEFICIT
0.49
INEQUALITY / GINI INDEX
1,018
TOTAL POPULATION
504
MALE POPULATION
514
FEMALE POPULATION
98.05
MALES / 100 FEMALES
101.98
FEMALES / 100 MALES
34.7
MEDIAN AGE
3.3
AVG FAMILY SIZE
2.7
AVG HOUSEHOLD SIZE
430
LABOR FORCE [ PEOPLE ]
55.0%
PERCENT IN LABOR FORCE
17.9%
UNEMPLOYMENT RATE
Pinon Zip Codes
Pinon Area Codes
Income in Pinon
Income Overview in Pinon
Per Capita Income in Pinon is $18,811, while median incomes of families and households are $42,750 and $42,750 respectively.
| Characteristic | Number | Measure |
| Per Capita Income | 1,018 | $18,811 |
| Median Family Income | 272 | $42,750 |
| Mean Family Income | 272 | $55,671 |
| Median Household Income | 370 | $42,750 |
| Mean Household Income | 370 | $51,624 |
| Income Deficit | 272 | $12,482 |
| Wage / Income Gap (%) | 1,018 | 2.50% |
| Wage / Income Gap ($) | 1,018 | 97.50¢ per $1 |
| Gini / Inequality Index | 1,018 | 0.49 |
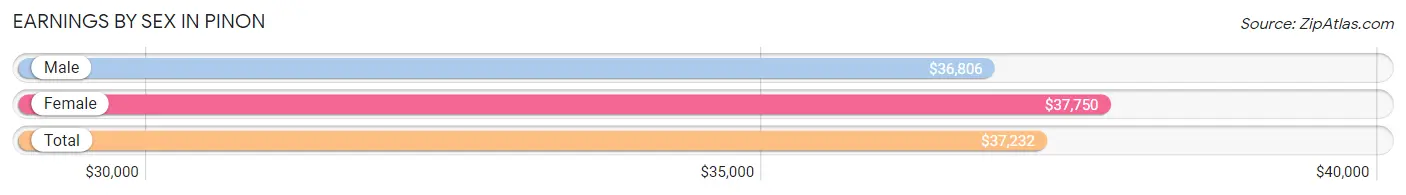
Earnings by Sex in Pinon
Average Earnings in Pinon are $37,232, $36,806 for men and $37,750 for women, a difference of 2.5%.
| Sex | Number | Average Earnings |
| Male | 205 (53.2%) | $36,806 |
| Female | 180 (46.8%) | $37,750 |
| Total | 385 (100.0%) | $37,232 |
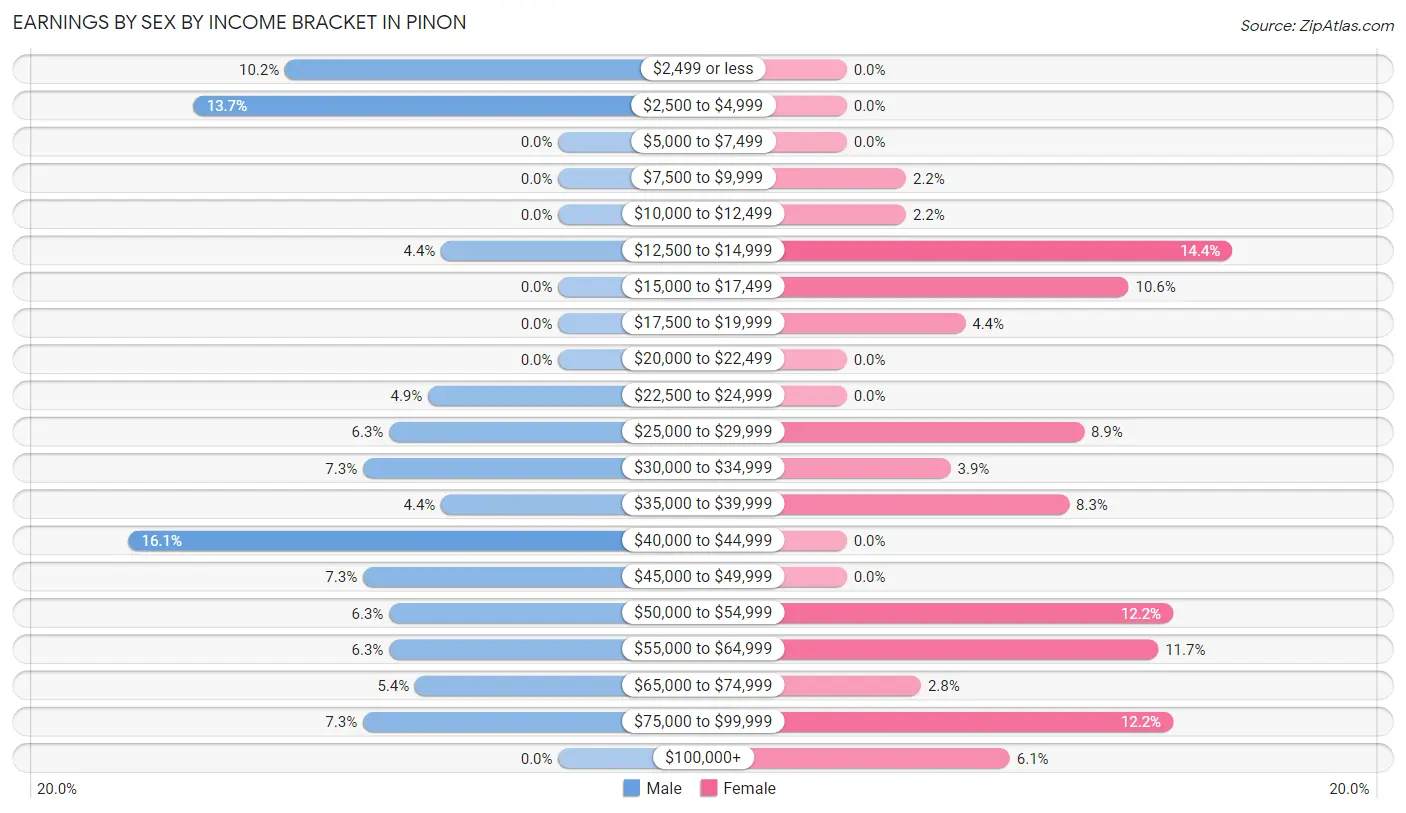
Earnings by Sex by Income Bracket in Pinon
The most common earnings brackets in Pinon are $40,000 to $44,999 for men (33 | 16.1%) and $12,500 to $14,999 for women (26 | 14.4%).
| Income | Male | Female |
| $2,499 or less | 21 (10.2%) | 0 (0.0%) |
| $2,500 to $4,999 | 28 (13.7%) | 0 (0.0%) |
| $5,000 to $7,499 | 0 (0.0%) | 0 (0.0%) |
| $7,500 to $9,999 | 0 (0.0%) | 4 (2.2%) |
| $10,000 to $12,499 | 0 (0.0%) | 4 (2.2%) |
| $12,500 to $14,999 | 9 (4.4%) | 26 (14.4%) |
| $15,000 to $17,499 | 0 (0.0%) | 19 (10.6%) |
| $17,500 to $19,999 | 0 (0.0%) | 8 (4.4%) |
| $20,000 to $22,499 | 0 (0.0%) | 0 (0.0%) |
| $22,500 to $24,999 | 10 (4.9%) | 0 (0.0%) |
| $25,000 to $29,999 | 13 (6.3%) | 16 (8.9%) |
| $30,000 to $34,999 | 15 (7.3%) | 7 (3.9%) |
| $35,000 to $39,999 | 9 (4.4%) | 15 (8.3%) |
| $40,000 to $44,999 | 33 (16.1%) | 0 (0.0%) |
| $45,000 to $49,999 | 15 (7.3%) | 0 (0.0%) |
| $50,000 to $54,999 | 13 (6.3%) | 22 (12.2%) |
| $55,000 to $64,999 | 13 (6.3%) | 21 (11.7%) |
| $65,000 to $74,999 | 11 (5.4%) | 5 (2.8%) |
| $75,000 to $99,999 | 15 (7.3%) | 22 (12.2%) |
| $100,000+ | 0 (0.0%) | 11 (6.1%) |
| Total | 205 (100.0%) | 180 (100.0%) |
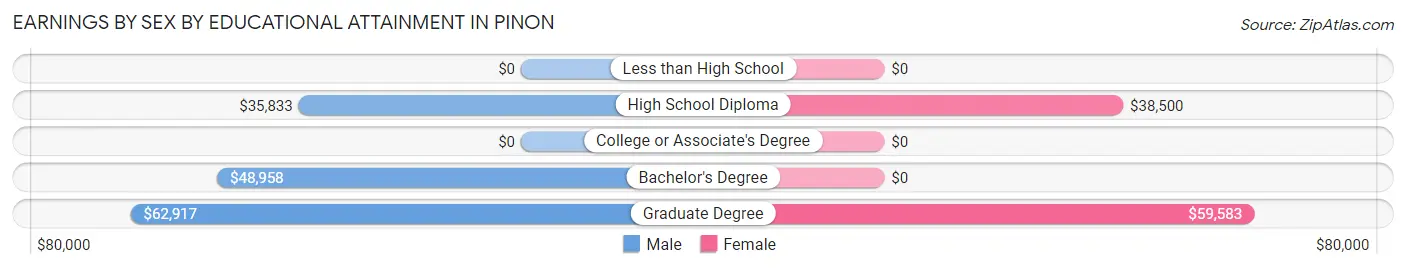
Earnings by Sex by Educational Attainment in Pinon
Average earnings in Pinon are $40,833 for men and $39,875 for women, a difference of 2.4%. Men with an educational attainment of graduate degree enjoy the highest average annual earnings of $62,917, while those with high school diploma education earn the least with $35,833. Women with an educational attainment of graduate degree earn the most with the average annual earnings of $59,583, while those with high school diploma education have the smallest earnings of $38,500.
| Educational Attainment | Male Income | Female Income |
| Less than High School | - | - |
| High School Diploma | $35,833 | $38,500 |
| College or Associate's Degree | - | - |
| Bachelor's Degree | $48,958 | $0 |
| Graduate Degree | $62,917 | $59,583 |
| Total | $40,833 | $39,875 |
Family Income in Pinon
Family Income Brackets in Pinon
According to the Pinon family income data, there are 55 families falling into the $75,000 to $99,999 income range, which is the most common income bracket and makes up 20.2% of all families.
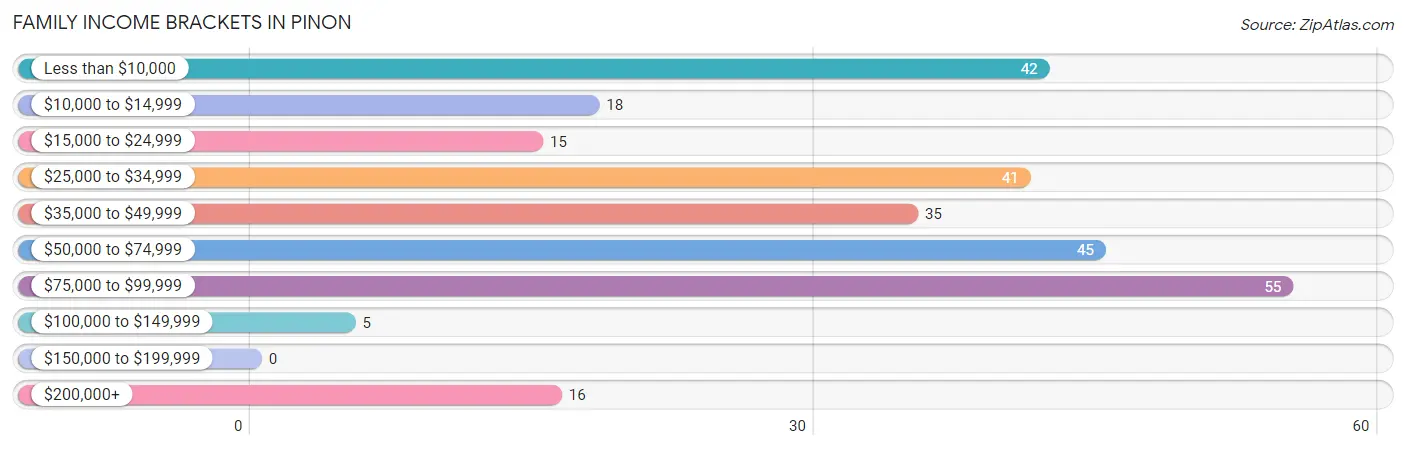
| Income Bracket | # Families | % Families |
| Less than $10,000 | 42 | 15.4% |
| $10,000 to $14,999 | 18 | 6.6% |
| $15,000 to $24,999 | 15 | 5.5% |
| $25,000 to $34,999 | 41 | 15.1% |
| $35,000 to $49,999 | 35 | 12.9% |
| $50,000 to $74,999 | 45 | 16.5% |
| $75,000 to $99,999 | 55 | 20.2% |
| $100,000 to $149,999 | 5 | 1.8% |
| $150,000 to $199,999 | 0 | 0.0% |
| $200,000+ | 16 | 5.9% |
Family Income by Famaliy Size in Pinon
7+ person families (21 | 7.7%) account for the highest median family income in Pinon with $50,625 per family, while 2-person families (106 | 39.0%) have the highest median income of $22,250 per family member.
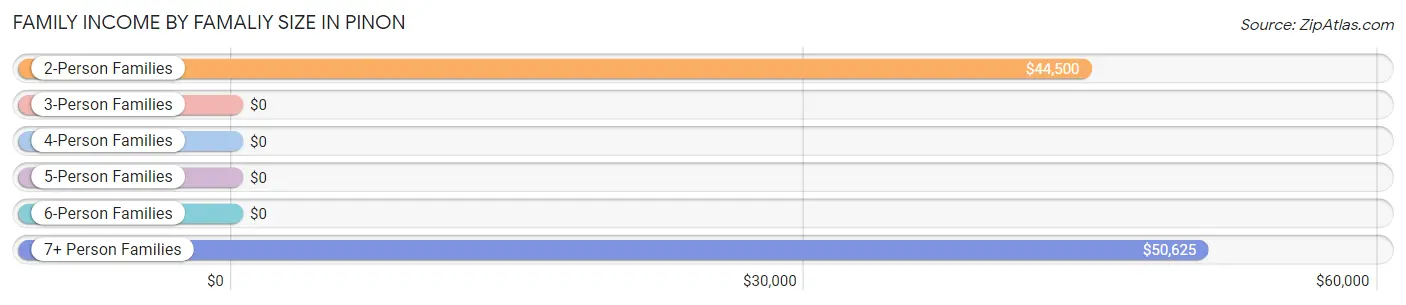
| Income Bracket | # Families | Median Income |
| 2-Person Families | 106 (39.0%) | $44,500 |
| 3-Person Families | 68 (25.0%) | $0 |
| 4-Person Families | 49 (18.0%) | $0 |
| 5-Person Families | 9 (3.3%) | $0 |
| 6-Person Families | 19 (7.0%) | $0 |
| 7+ Person Families | 21 (7.7%) | $50,625 |
| Total | 272 (100.0%) | $42,750 |
Family Income by Number of Earners in Pinon
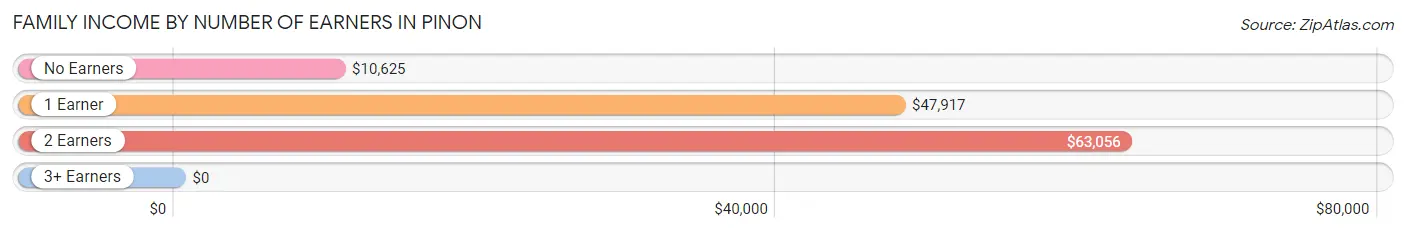
| Number of Earners | # Families | Median Income |
| No Earners | 90 (33.1%) | $10,625 |
| 1 Earner | 86 (31.6%) | $47,917 |
| 2 Earners | 70 (25.7%) | $63,056 |
| 3+ Earners | 26 (9.6%) | $0 |
| Total | 272 (100.0%) | $42,750 |
Household Income in Pinon
Household Income Brackets in Pinon
With 79 households falling in the category, the $75,000 to $99,999 income range is the most frequent in Pinon, accounting for 21.3% of all households.
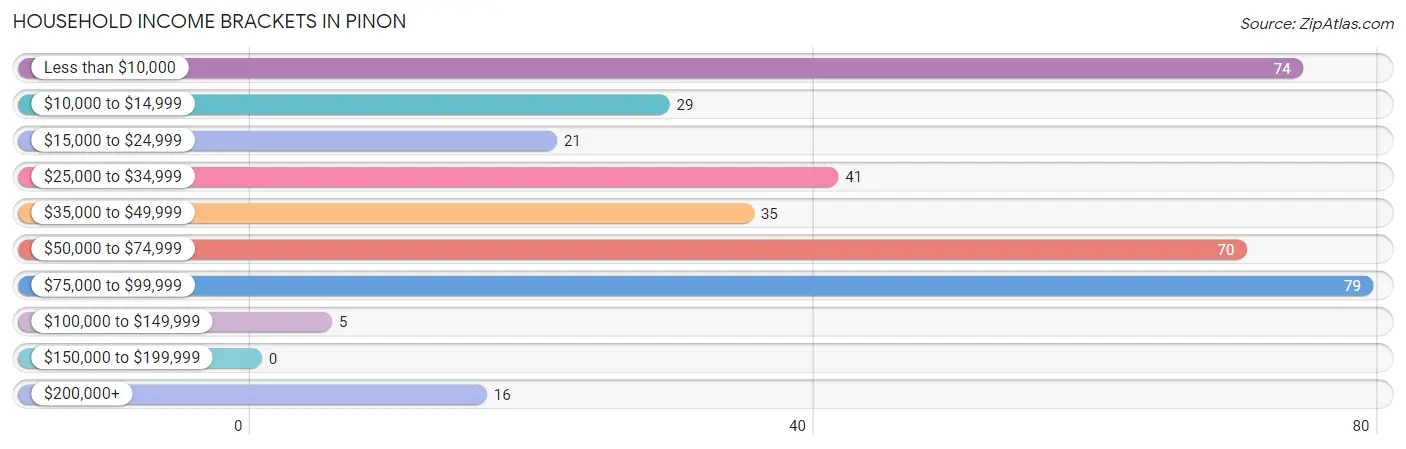
| Income Bracket | # Households | % Households |
| Less than $10,000 | 74 | 20.0% |
| $10,000 to $14,999 | 29 | 7.8% |
| $15,000 to $24,999 | 21 | 5.7% |
| $25,000 to $34,999 | 41 | 11.1% |
| $35,000 to $49,999 | 35 | 9.5% |
| $50,000 to $74,999 | 70 | 18.9% |
| $75,000 to $99,999 | 79 | 21.4% |
| $100,000 to $149,999 | 5 | 1.4% |
| $150,000 to $199,999 | 0 | 0.0% |
| $200,000+ | 16 | 4.3% |
Household Income by Householder Age in Pinon
The median household income in Pinon is $42,750, with the highest median household income of $52,500 found in the 45 to 64 years age bracket for the primary householder. A total of 156 households (42.2%) fall into this category. Meanwhile, the 15 to 24 years age bracket for the primary householder has the lowest median household income of $0, with 10 households (2.7%) in this group.
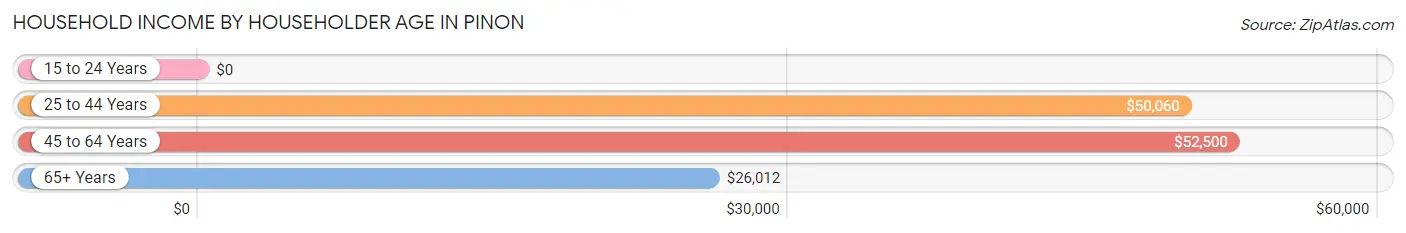
| Income Bracket | # Households | Median Income |
| 15 to 24 Years | 10 (2.7%) | $0 |
| 25 to 44 Years | 117 (31.6%) | $50,060 |
| 45 to 64 Years | 156 (42.2%) | $52,500 |
| 65+ Years | 87 (23.5%) | $26,012 |
| Total | 370 (100.0%) | $42,750 |
Poverty in Pinon
Income Below Poverty by Sex and Age in Pinon
With 34.1% poverty level for males and 44.6% for females among the residents of Pinon, 15 year old males and 15 year old females are the most vulnerable to poverty, with 6 males (100.0%) and 7 females (100.0%) in their respective age groups living below the poverty level.
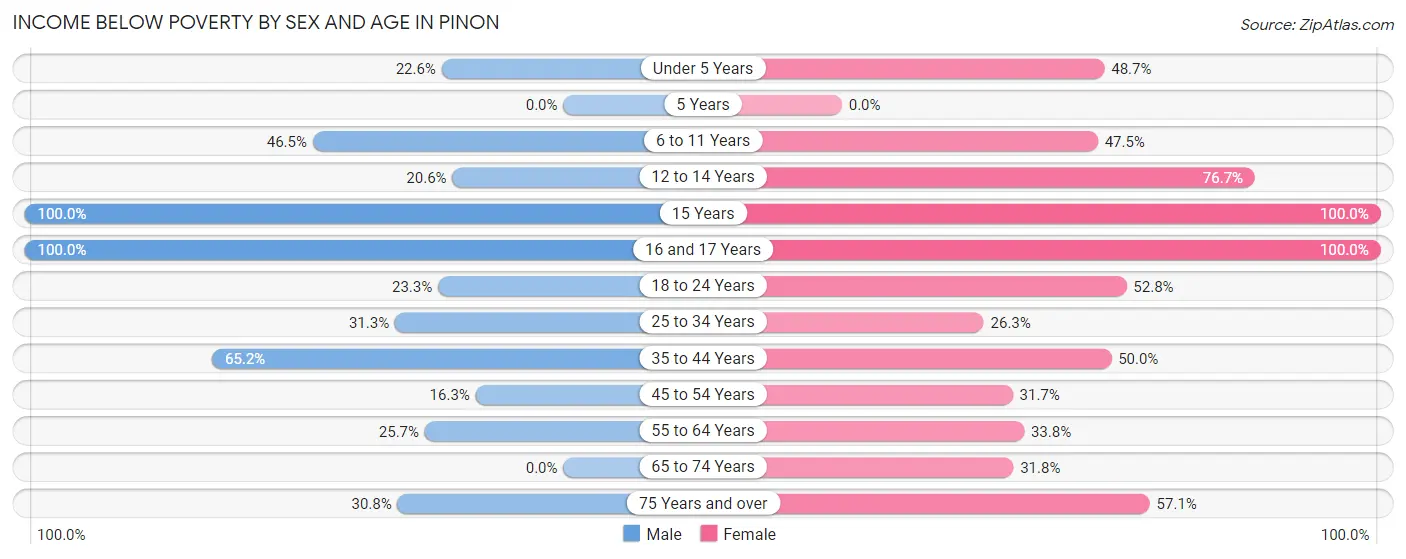
| Age Bracket | Male | Female |
| Under 5 Years | 7 (22.6%) | 19 (48.7%) |
| 5 Years | 0 (0.0%) | 0 (0.0%) |
| 6 to 11 Years | 20 (46.5%) | 19 (47.5%) |
| 12 to 14 Years | 7 (20.6%) | 23 (76.7%) |
| 15 Years | 6 (100.0%) | 7 (100.0%) |
| 16 and 17 Years | 16 (100.0%) | 13 (100.0%) |
| 18 to 24 Years | 10 (23.3%) | 28 (52.8%) |
| 25 to 34 Years | 30 (31.2%) | 15 (26.3%) |
| 35 to 44 Years | 45 (65.2%) | 30 (50.0%) |
| 45 to 54 Years | 7 (16.3%) | 26 (31.7%) |
| 55 to 64 Years | 18 (25.7%) | 23 (33.8%) |
| 65 to 74 Years | 0 (0.0%) | 14 (31.8%) |
| 75 Years and over | 4 (30.8%) | 12 (57.1%) |
| Total | 170 (34.1%) | 229 (44.6%) |
Income Above Poverty by Sex and Age in Pinon
According to the poverty statistics in Pinon, males aged 65 to 74 years and females aged 25 to 34 years are the age groups that are most secure financially, with 100.0% of males and 73.7% of females in these age groups living above the poverty line.
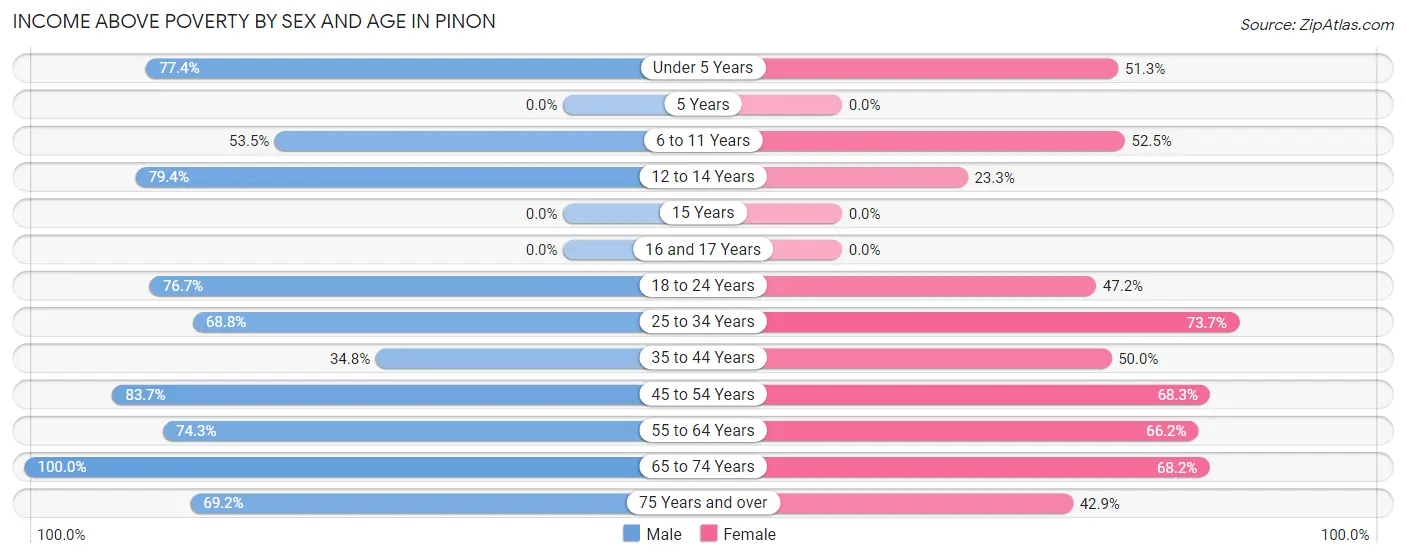
| Age Bracket | Male | Female |
| Under 5 Years | 24 (77.4%) | 20 (51.3%) |
| 5 Years | 0 (0.0%) | 0 (0.0%) |
| 6 to 11 Years | 23 (53.5%) | 21 (52.5%) |
| 12 to 14 Years | 27 (79.4%) | 7 (23.3%) |
| 15 Years | 0 (0.0%) | 0 (0.0%) |
| 16 and 17 Years | 0 (0.0%) | 0 (0.0%) |
| 18 to 24 Years | 33 (76.7%) | 25 (47.2%) |
| 25 to 34 Years | 66 (68.8%) | 42 (73.7%) |
| 35 to 44 Years | 24 (34.8%) | 30 (50.0%) |
| 45 to 54 Years | 36 (83.7%) | 56 (68.3%) |
| 55 to 64 Years | 52 (74.3%) | 45 (66.2%) |
| 65 to 74 Years | 34 (100.0%) | 30 (68.2%) |
| 75 Years and over | 9 (69.2%) | 9 (42.9%) |
| Total | 328 (65.9%) | 285 (55.4%) |
Income Below Poverty Among Married-Couple Families in Pinon
The poverty statistics for married-couple families in Pinon show that 27.2% or 47 of the total 173 families live below the poverty line. Families with 5 or more children have the highest poverty rate of 100.0%, comprising of 4 families. On the other hand, families with no children have the lowest poverty rate of 18.1%, which includes 17 families.
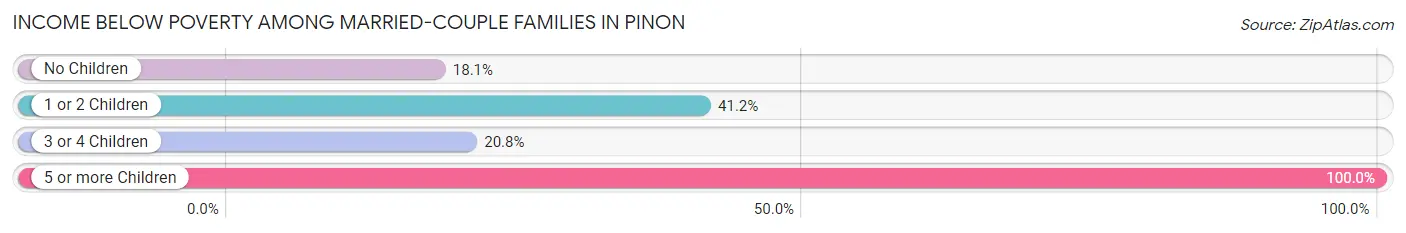
| Children | Above Poverty | Below Poverty |
| No Children | 77 (81.9%) | 17 (18.1%) |
| 1 or 2 Children | 30 (58.8%) | 21 (41.2%) |
| 3 or 4 Children | 19 (79.2%) | 5 (20.8%) |
| 5 or more Children | 0 (0.0%) | 4 (100.0%) |
| Total | 126 (72.8%) | 47 (27.2%) |
Income Below Poverty Among Single-Parent Households in Pinon
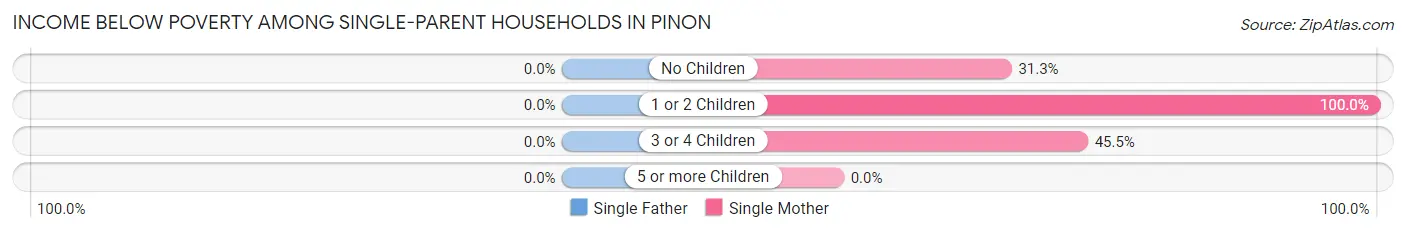
| Children | Single Father | Single Mother |
| No Children | 0 (0.0%) | 5 (31.2%) |
| 1 or 2 Children | 0 (0.0%) | 39 (100.0%) |
| 3 or 4 Children | 0 (0.0%) | 5 (45.5%) |
| 5 or more Children | 0 (0.0%) | 0 (0.0%) |
| Total | 0 (0.0%) | 49 (74.2%) |
Income Below Poverty Among Married-Couple vs Single-Parent Households in Pinon
The poverty data for Pinon shows that 47 of the married-couple family households (27.2%) and 49 of the single-parent households (49.5%) are living below the poverty level. Within the married-couple family households, those with 5 or more children have the highest poverty rate, with 4 households (100.0%) falling below the poverty line. Among the single-parent households, those with 1 or 2 children have the highest poverty rate, with 39 household (100.0%) living below poverty.
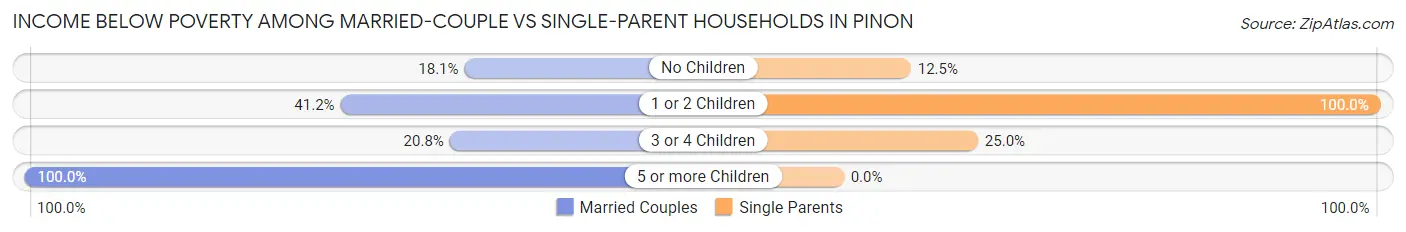
| Children | Married-Couple Families | Single-Parent Households |
| No Children | 17 (18.1%) | 5 (12.5%) |
| 1 or 2 Children | 21 (41.2%) | 39 (100.0%) |
| 3 or 4 Children | 5 (20.8%) | 5 (25.0%) |
| 5 or more Children | 4 (100.0%) | 0 (0.0%) |
| Total | 47 (27.2%) | 49 (49.5%) |
Race in Pinon
The most populous races in Pinon are Native / Alaskan (944 | 92.7%), White / Caucasian (40 | 3.9%), and Hawaiian / Pacific (33 | 3.2%).
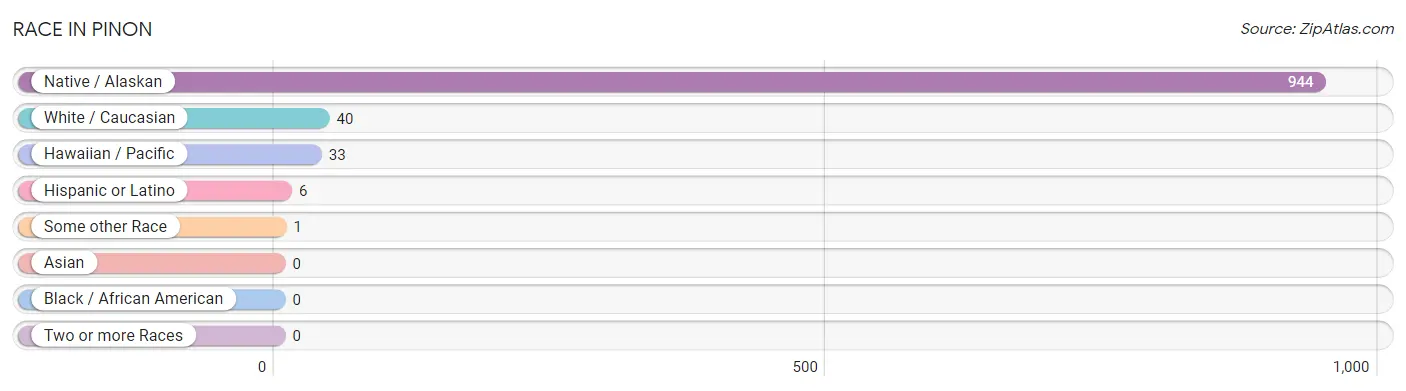
| Race | # Population | % Population |
| Asian | 0 | 0.0% |
| Black / African American | 0 | 0.0% |
| Hawaiian / Pacific | 33 | 3.2% |
| Hispanic or Latino | 6 | 0.6% |
| Native / Alaskan | 944 | 92.7% |
| White / Caucasian | 40 | 3.9% |
| Two or more Races | 0 | 0.0% |
| Some other Race | 1 | 0.1% |
| Total | 1,018 | 100.0% |
Ancestry in Pinon
The most populous ancestries reported in Pinon are Navajo (924 | 90.8%), Native Hawaiian (33 | 3.2%), Sioux (24 | 2.4%), German (21 | 2.1%), and Hopi (13 | 1.3%), together accounting for 99.7% of all Pinon residents.
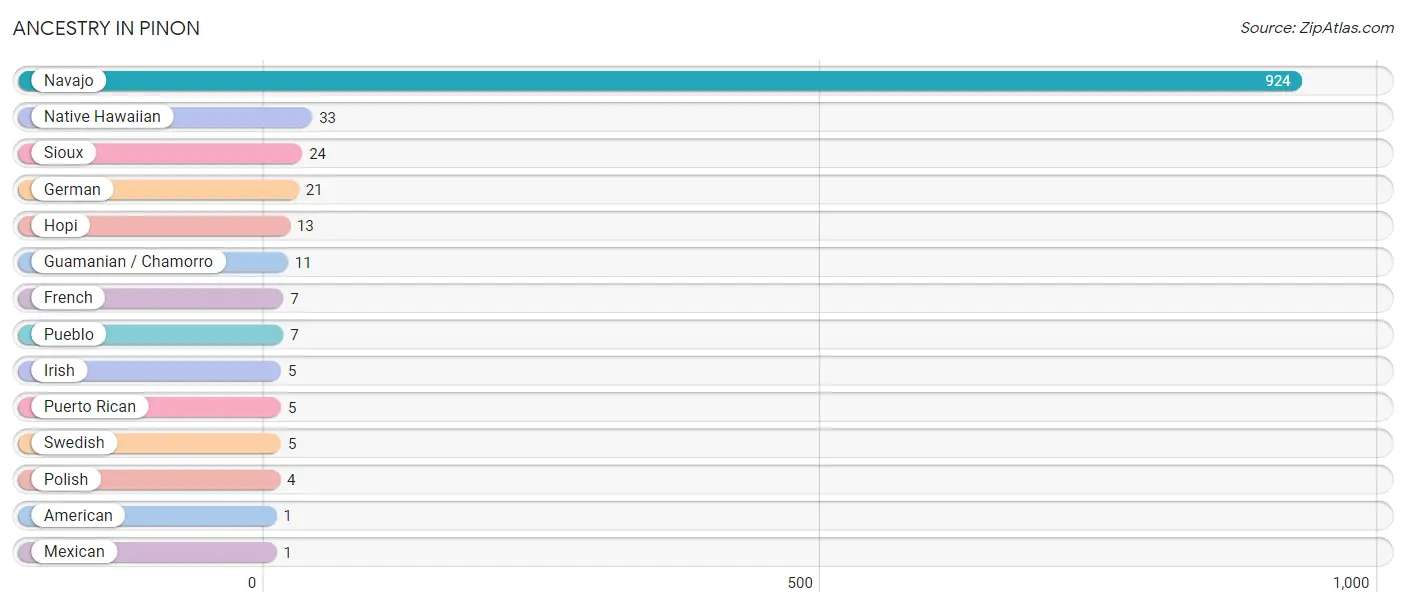
| Ancestry | # Population | % Population |
| American | 1 | 0.1% |
| French | 7 | 0.7% |
| German | 21 | 2.1% |
| Guamanian / Chamorro | 11 | 1.1% |
| Hopi | 13 | 1.3% |
| Irish | 5 | 0.5% |
| Mexican | 1 | 0.1% |
| Native Hawaiian | 33 | 3.2% |
| Navajo | 924 | 90.8% |
| Polish | 4 | 0.4% |
| Pueblo | 7 | 0.7% |
| Puerto Rican | 5 | 0.5% |
| Sioux | 24 | 2.4% |
| Swedish | 5 | 0.5% | View All 14 Rows |
Immigrants in Pinon
The most numerous immigrant groups reported in Pinon came from Central America (1 | 0.1%), Latin America (1 | 0.1%), and Mexico (1 | 0.1%), together accounting for 0.3% of all Pinon residents.
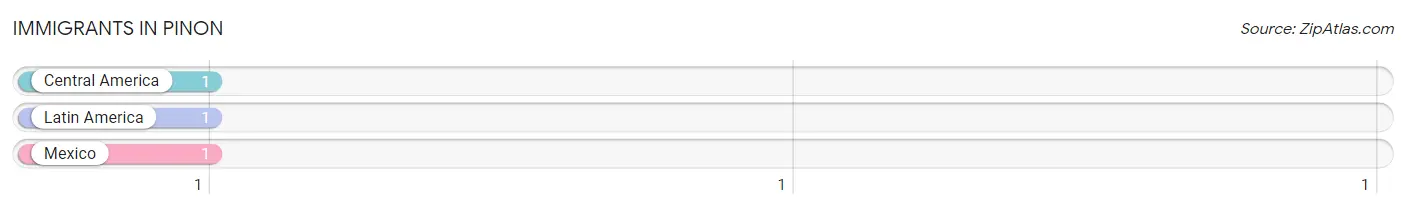
| Immigration Origin | # Population | % Population |
| Central America | 1 | 0.1% |
| Latin America | 1 | 0.1% |
| Mexico | 1 | 0.1% | View All 3 Rows |
Sex and Age in Pinon
Sex and Age in Pinon
The most populous age groups in Pinon are 25 to 29 Years (60 | 11.9%) for men and 45 to 49 Years (49 | 9.5%) for women.
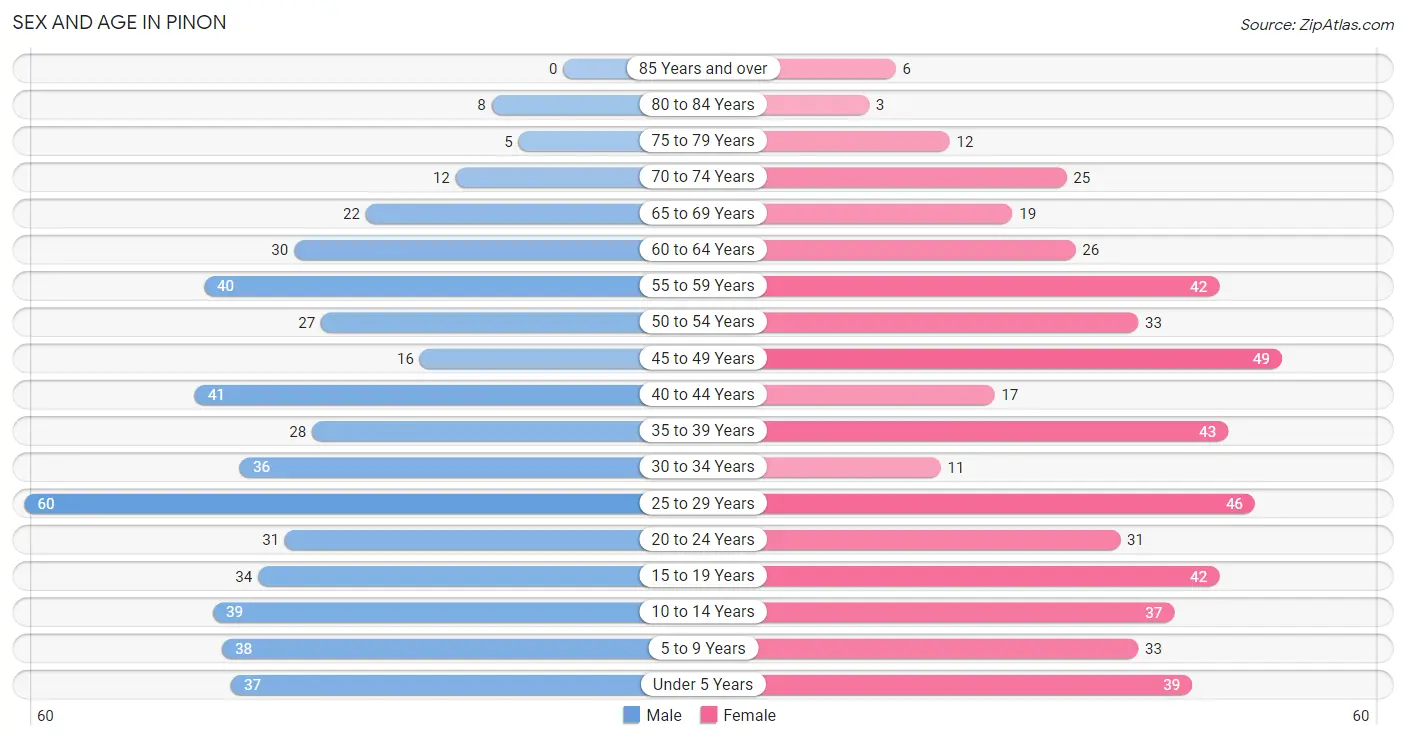
| Age Bracket | Male | Female |
| Under 5 Years | 37 (7.3%) | 39 (7.6%) |
| 5 to 9 Years | 38 (7.5%) | 33 (6.4%) |
| 10 to 14 Years | 39 (7.7%) | 37 (7.2%) |
| 15 to 19 Years | 34 (6.8%) | 42 (8.2%) |
| 20 to 24 Years | 31 (6.1%) | 31 (6.0%) |
| 25 to 29 Years | 60 (11.9%) | 46 (8.9%) |
| 30 to 34 Years | 36 (7.1%) | 11 (2.1%) |
| 35 to 39 Years | 28 (5.6%) | 43 (8.4%) |
| 40 to 44 Years | 41 (8.1%) | 17 (3.3%) |
| 45 to 49 Years | 16 (3.2%) | 49 (9.5%) |
| 50 to 54 Years | 27 (5.4%) | 33 (6.4%) |
| 55 to 59 Years | 40 (7.9%) | 42 (8.2%) |
| 60 to 64 Years | 30 (5.9%) | 26 (5.1%) |
| 65 to 69 Years | 22 (4.4%) | 19 (3.7%) |
| 70 to 74 Years | 12 (2.4%) | 25 (4.9%) |
| 75 to 79 Years | 5 (1.0%) | 12 (2.3%) |
| 80 to 84 Years | 8 (1.6%) | 3 (0.6%) |
| 85 Years and over | 0 (0.0%) | 6 (1.2%) |
| Total | 504 (100.0%) | 514 (100.0%) |
Families and Households in Pinon
Median Family Size in Pinon
The median family size in Pinon is 3.29 persons per family, with single female/mother families (66 | 24.3%) accounting for the largest median family size of 3.65 persons per family. On the other hand, married-couple families (173 | 63.6%) represent the smallest median family size with 3.09 persons per family.
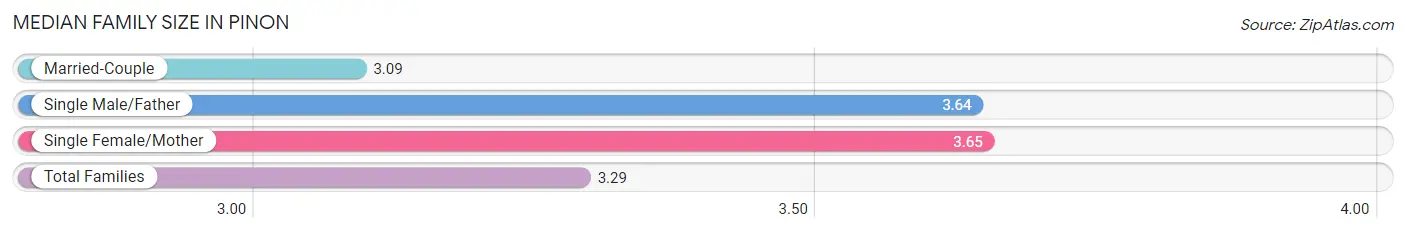
| Family Type | # Families | Family Size |
| Married-Couple | 173 (63.6%) | 3.09 |
| Single Male/Father | 33 (12.1%) | 3.64 |
| Single Female/Mother | 66 (24.3%) | 3.65 |
| Total Families | 272 (100.0%) | 3.29 |
Median Household Size in Pinon
The median household size in Pinon is 2.72 persons per household, with single female/mother households (66 | 17.8%) accounting for the largest median household size of 3.65 persons per household. non-family households (98 | 26.5%) represent the smallest median household size with 1.13 persons per household.
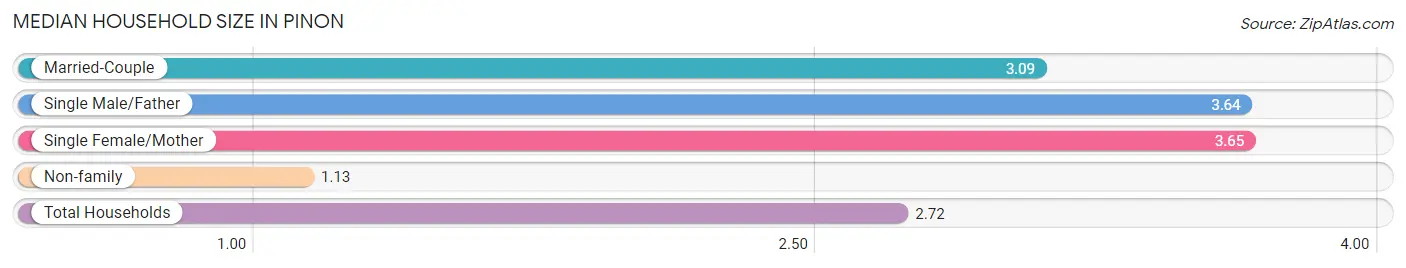
| Household Type | # Households | Household Size |
| Married-Couple | 173 (46.8%) | 3.09 |
| Single Male/Father | 33 (8.9%) | 3.64 |
| Single Female/Mother | 66 (17.8%) | 3.65 |
| Non-family | 98 (26.5%) | 1.13 |
| Total Households | 370 (100.0%) | 2.72 |
Household Size by Marriage Status in Pinon
Out of a total of 370 households in Pinon, 272 (73.5%) are family households, while 98 (26.5%) are nonfamily households. The most numerous type of family households are 2-person households, comprising 106, and the most common type of nonfamily households are 1-person households, comprising 88.
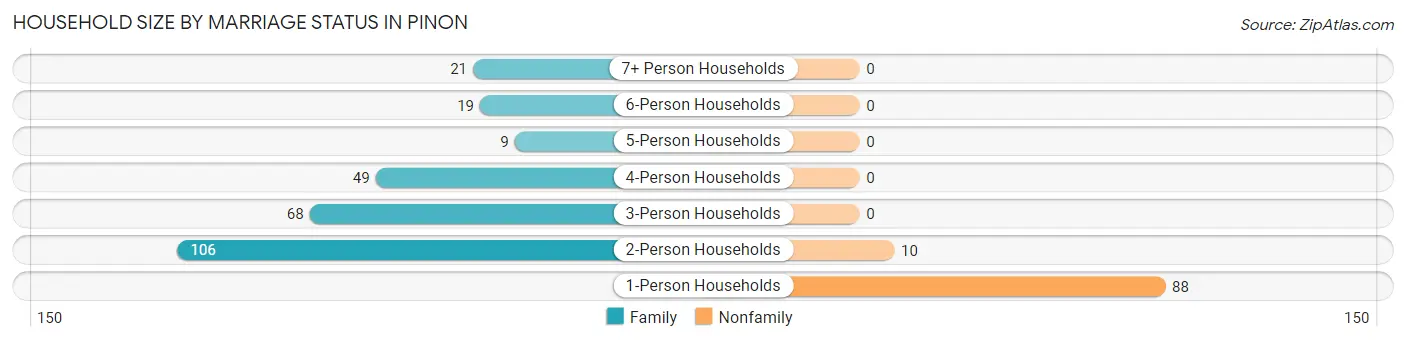
| Household Size | Family Households | Nonfamily Households |
| 1-Person Households | - | 88 (23.8%) |
| 2-Person Households | 106 (28.6%) | 10 (2.7%) |
| 3-Person Households | 68 (18.4%) | 0 (0.0%) |
| 4-Person Households | 49 (13.2%) | 0 (0.0%) |
| 5-Person Households | 9 (2.4%) | 0 (0.0%) |
| 6-Person Households | 19 (5.1%) | 0 (0.0%) |
| 7+ Person Households | 21 (5.7%) | 0 (0.0%) |
| Total | 272 (73.5%) | 98 (26.5%) |
Female Fertility in Pinon
Fertility by Age in Pinon
Average fertility rate in Pinon is 71.0 births per 1,000 women. Women in the age bracket of 20 to 34 years have the highest fertility rate with 193.0 births per 1,000 women. Women in the age bracket of 20 to 34 years acount for 100.0% of all women with births.
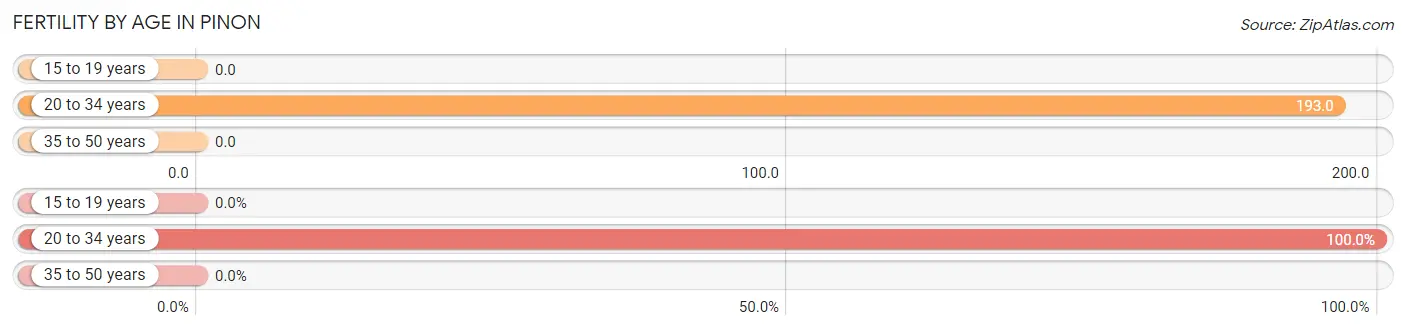
| Age Bracket | Women with Births | Births / 1,000 Women |
| 15 to 19 years | 0 (0.0%) | 0.0 |
| 20 to 34 years | 17 (100.0%) | 193.0 |
| 35 to 50 years | 0 (0.0%) | 0.0 |
| Total | 17 (100.0%) | 71.0 |
Fertility by Age by Marriage Status in Pinon
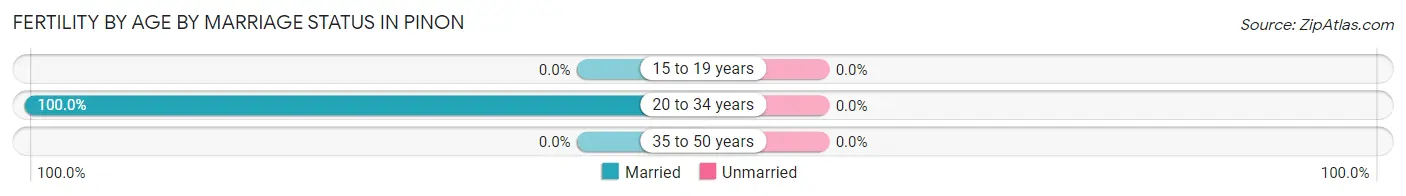
| Age Bracket | Married | Unmarried |
| 15 to 19 years | 0 (0.0%) | 0 (0.0%) |
| 20 to 34 years | 17 (100.0%) | 0 (0.0%) |
| 35 to 50 years | 0 (0.0%) | 0 (0.0%) |
| Total | 17 (100.0%) | 0 (0.0%) |
Fertility by Education in Pinon
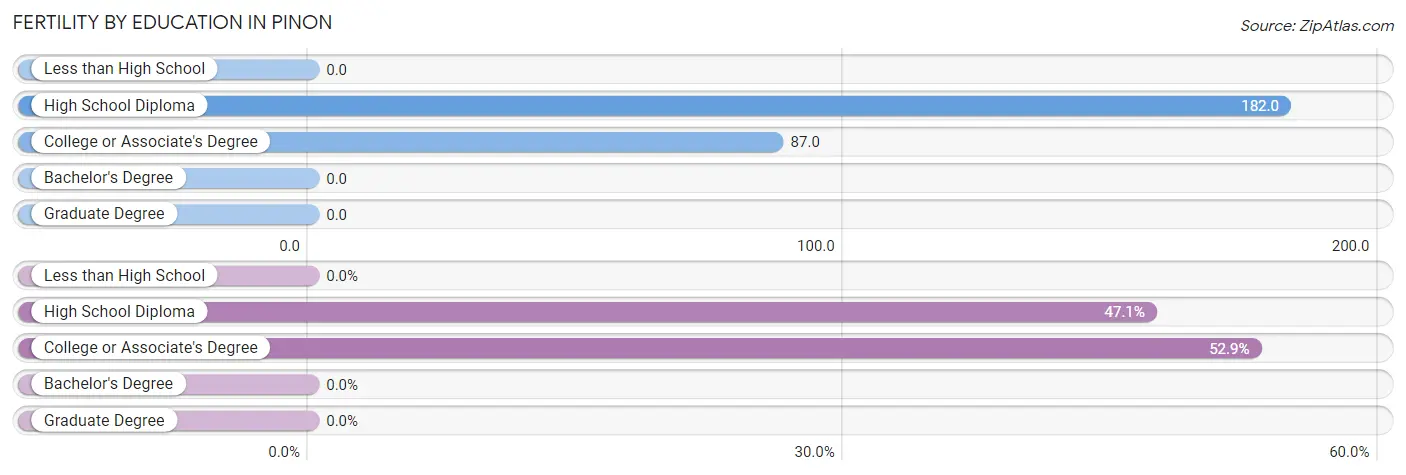
| Educational Attainment | Women with Births | Births / 1,000 Women |
| Less than High School | 0 (0.0%) | 0.0 |
| High School Diploma | 8 (47.1%) | 182.0 |
| College or Associate's Degree | 9 (52.9%) | 87.0 |
| Bachelor's Degree | 0 (0.0%) | 0.0 |
| Graduate Degree | 0 (0.0%) | 0.0 |
| Total | 17 (100.0%) | 71.0 |
Fertility by Education by Marriage Status in Pinon
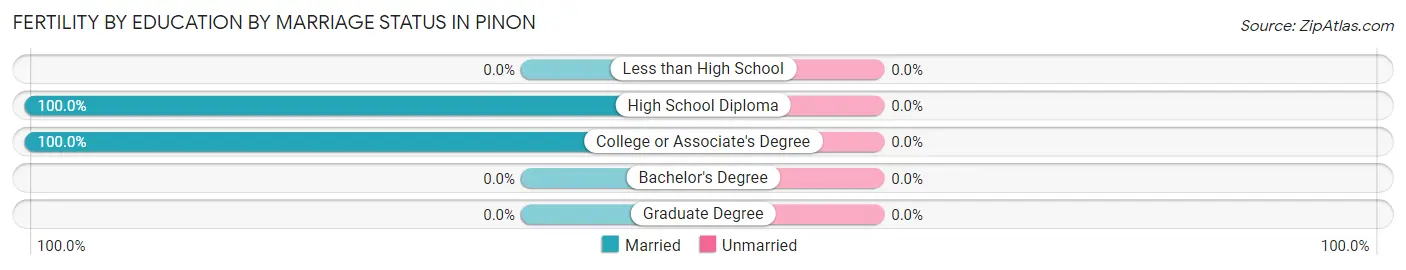
| Educational Attainment | Married | Unmarried |
| Less than High School | 0 (0.0%) | 0 (0.0%) |
| High School Diploma | 8 (100.0%) | 0 (0.0%) |
| College or Associate's Degree | 9 (100.0%) | 0 (0.0%) |
| Bachelor's Degree | 0 (0.0%) | 0 (0.0%) |
| Graduate Degree | 0 (0.0%) | 0 (0.0%) |
| Total | 17 (100.0%) | 0 (0.0%) |
Employment Characteristics in Pinon
Employment by Class of Employer in Pinon
Among the 348 employed individuals in Pinon, private company employees (138 | 39.7%), state government employees (116 | 33.3%), and federal government employees (45 | 12.9%) make up the most common classes of employment.
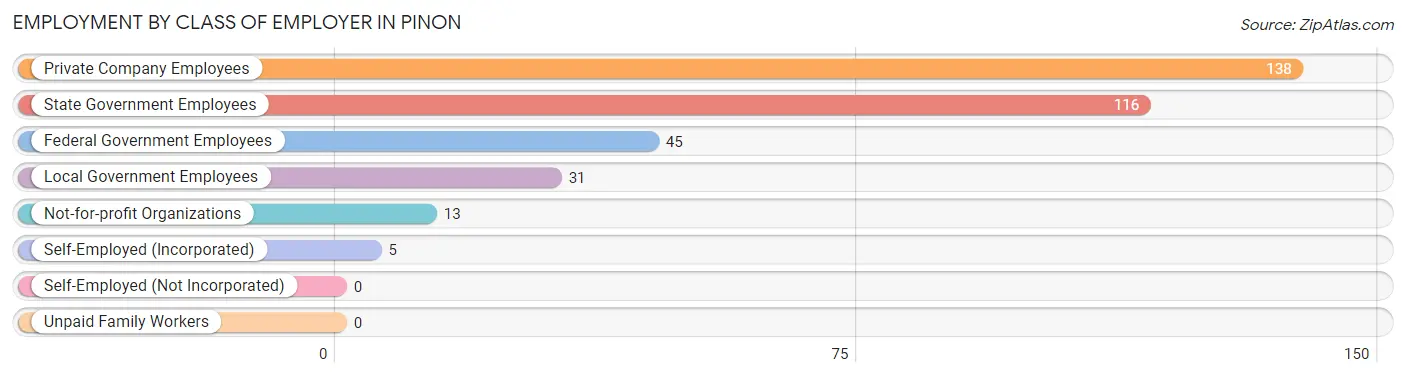
| Employer Class | # Employees | % Employees |
| Private Company Employees | 138 | 39.7% |
| Self-Employed (Incorporated) | 5 | 1.4% |
| Self-Employed (Not Incorporated) | 0 | 0.0% |
| Not-for-profit Organizations | 13 | 3.7% |
| Local Government Employees | 31 | 8.9% |
| State Government Employees | 116 | 33.3% |
| Federal Government Employees | 45 | 12.9% |
| Unpaid Family Workers | 0 | 0.0% |
| Total | 348 | 100.0% |
Employment Status by Age in Pinon
According to the labor force statistics for Pinon, out of the total population over 16 years of age (782), 55.0% or 430 individuals are in the labor force, with 17.9% or 77 of them unemployed. The age group with the highest labor force participation rate is 45 to 54 years, with 82.4% or 103 individuals in the labor force. Within the labor force, the 20 to 24 years age range has the highest percentage of unemployed individuals, with 48.5% or 16 of them being unemployed.
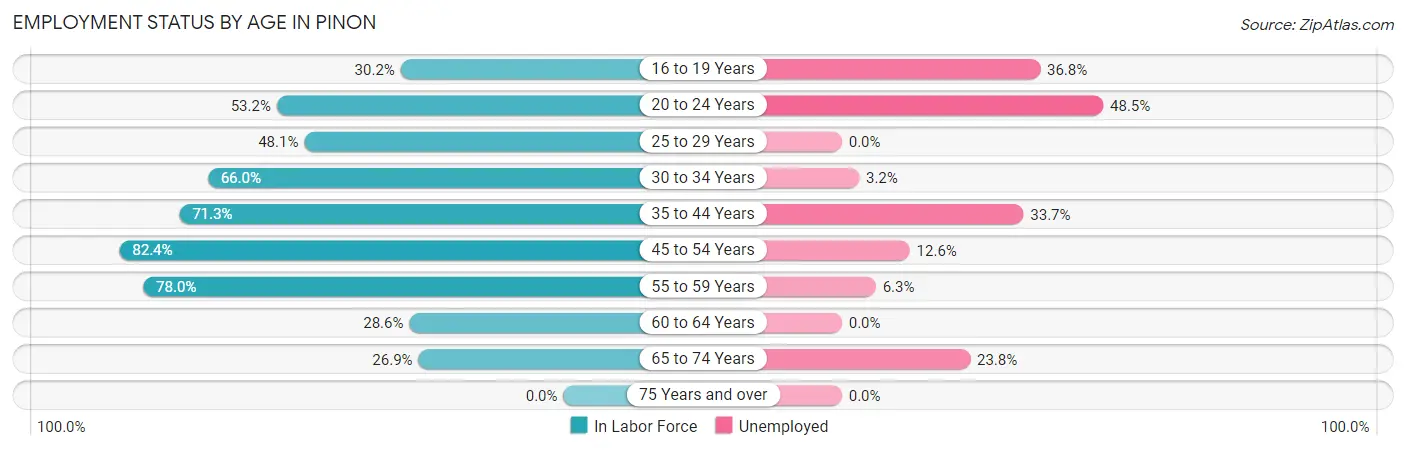
| Age Bracket | In Labor Force | Unemployed |
| 16 to 19 Years | 19 (30.2%) | 7 (36.8%) |
| 20 to 24 Years | 33 (53.2%) | 16 (48.5%) |
| 25 to 29 Years | 51 (48.1%) | 0 (0.0%) |
| 30 to 34 Years | 31 (66.0%) | 1 (3.2%) |
| 35 to 44 Years | 92 (71.3%) | 31 (33.7%) |
| 45 to 54 Years | 103 (82.4%) | 13 (12.6%) |
| 55 to 59 Years | 64 (78.0%) | 4 (6.3%) |
| 60 to 64 Years | 16 (28.6%) | 0 (0.0%) |
| 65 to 74 Years | 21 (26.9%) | 5 (23.8%) |
| 75 Years and over | 0 (0.0%) | 0 (0.0%) |
| Total | 430 (55.0%) | 77 (17.9%) |
Employment Status by Educational Attainment in Pinon
According to labor force statistics for Pinon, 65.5% of individuals (357) out of the total population between 25 and 64 years of age (545) are in the labor force, with 13.7% or 49 of them being unemployed. The group with the highest labor force participation rate are those with the educational attainment of bachelor's degree or higher, with 89.4% or 76 individuals in the labor force. Within the labor force, individuals with high school diploma education have the highest percentage of unemployment, with 29.1% or 32 of them being unemployed.
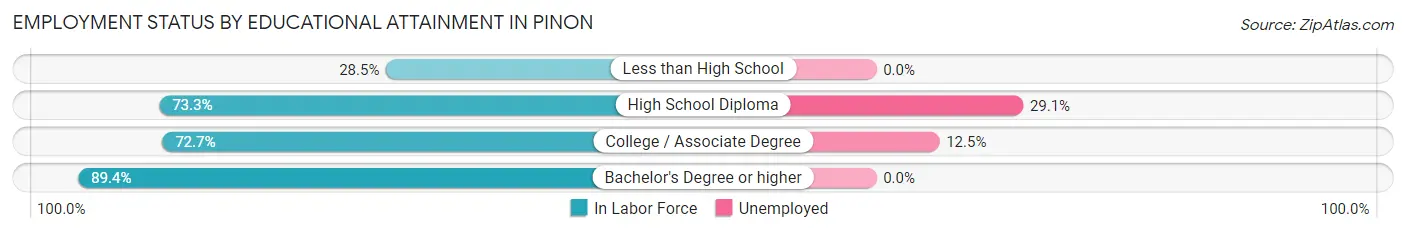
| Educational Attainment | In Labor Force | Unemployed |
| Less than High School | 35 (28.5%) | 0 (0.0%) |
| High School Diploma | 110 (73.3%) | 44 (29.1%) |
| College / Associate Degree | 136 (72.7%) | 23 (12.5%) |
| Bachelor's Degree or higher | 76 (89.4%) | 0 (0.0%) |
| Total | 357 (65.5%) | 75 (13.7%) |
Employment Occupations by Sex in Pinon
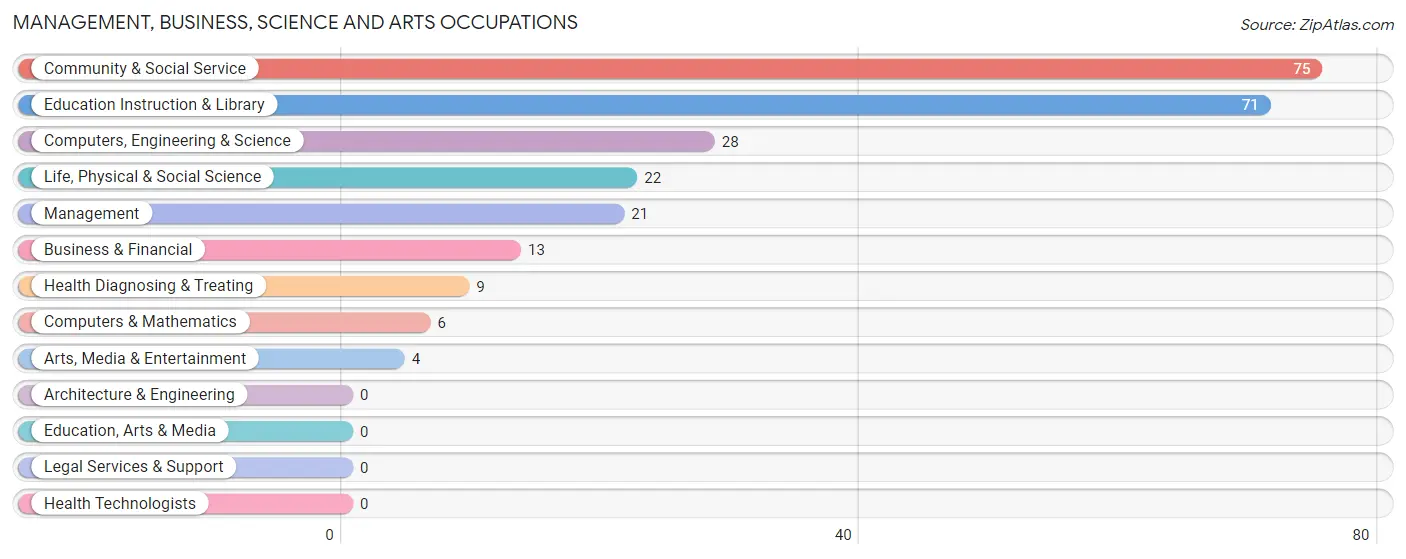
Management, Business, Science and Arts Occupations
The most common Management, Business, Science and Arts occupations in Pinon are Community & Social Service (75 | 21.2%), Education Instruction & Library (71 | 20.1%), Computers, Engineering & Science (28 | 7.9%), Life, Physical & Social Science (22 | 6.2%), and Management (21 | 5.9%).
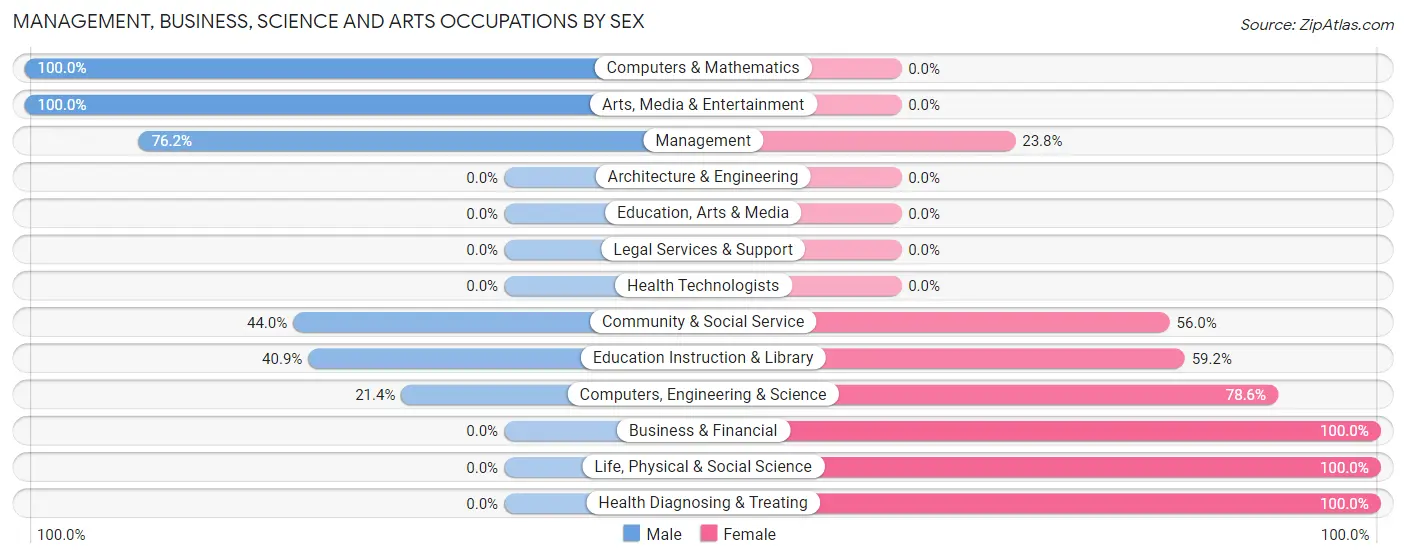
Management, Business, Science and Arts Occupations by Sex
Within the Management, Business, Science and Arts occupations in Pinon, the most male-oriented occupations are Computers & Mathematics (100.0%), Arts, Media & Entertainment (100.0%), and Management (76.2%), while the most female-oriented occupations are Business & Financial (100.0%), Life, Physical & Social Science (100.0%), and Health Diagnosing & Treating (100.0%).
| Occupation | Male | Female |
| Management | 16 (76.2%) | 5 (23.8%) |
| Business & Financial | 0 (0.0%) | 13 (100.0%) |
| Computers, Engineering & Science | 6 (21.4%) | 22 (78.6%) |
| Computers & Mathematics | 6 (100.0%) | 0 (0.0%) |
| Architecture & Engineering | 0 (0.0%) | 0 (0.0%) |
| Life, Physical & Social Science | 0 (0.0%) | 22 (100.0%) |
| Community & Social Service | 33 (44.0%) | 42 (56.0%) |
| Education, Arts & Media | 0 (0.0%) | 0 (0.0%) |
| Legal Services & Support | 0 (0.0%) | 0 (0.0%) |
| Education Instruction & Library | 29 (40.8%) | 42 (59.2%) |
| Arts, Media & Entertainment | 4 (100.0%) | 0 (0.0%) |
| Health Diagnosing & Treating | 0 (0.0%) | 9 (100.0%) |
| Health Technologists | 0 (0.0%) | 0 (0.0%) |
| Total (Category) | 55 (37.7%) | 91 (62.3%) |
| Total (Overall) | 173 (49.0%) | 180 (51.0%) |
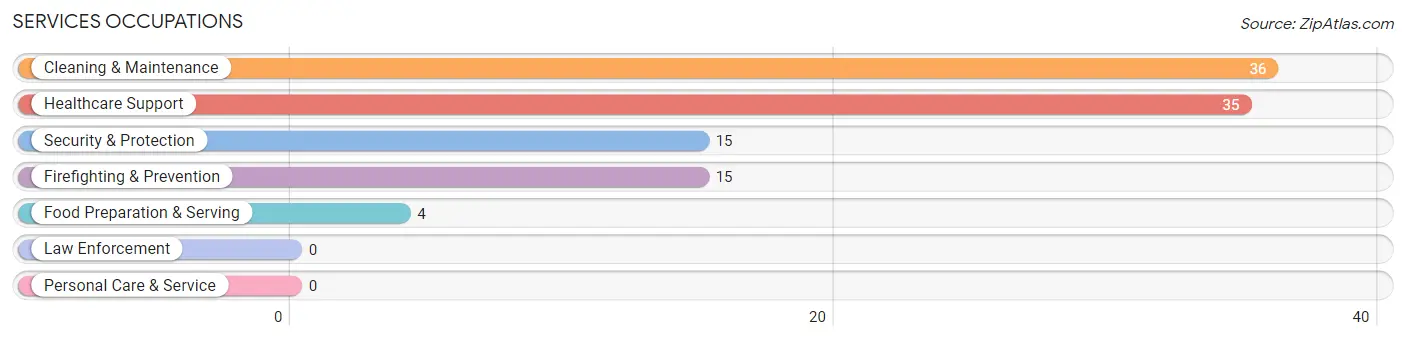
Services Occupations
The most common Services occupations in Pinon are Cleaning & Maintenance (36 | 10.2%), Healthcare Support (35 | 9.9%), Security & Protection (15 | 4.3%), Firefighting & Prevention (15 | 4.3%), and Food Preparation & Serving (4 | 1.1%).
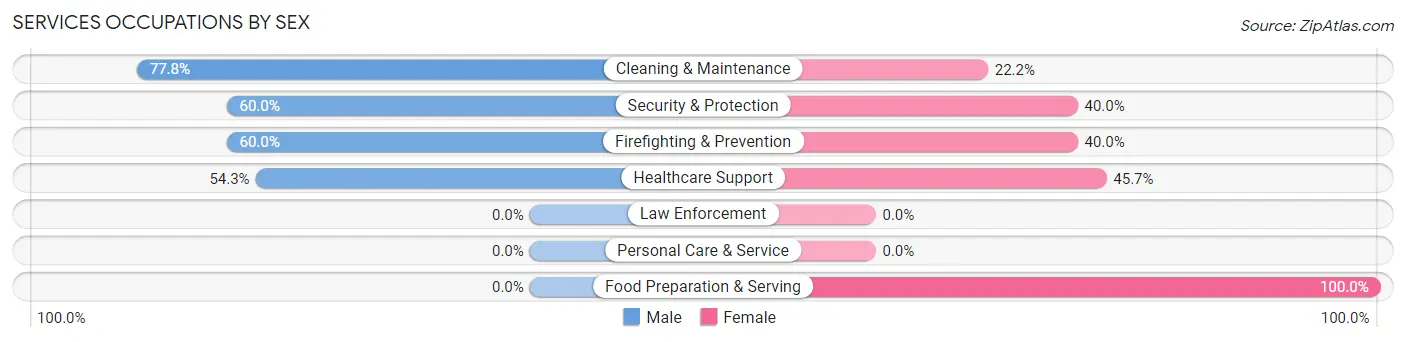
Services Occupations by Sex
Within the Services occupations in Pinon, the most male-oriented occupations are Cleaning & Maintenance (77.8%), Security & Protection (60.0%), and Firefighting & Prevention (60.0%), while the most female-oriented occupations are Food Preparation & Serving (100.0%), Healthcare Support (45.7%), and Security & Protection (40.0%).
| Occupation | Male | Female |
| Healthcare Support | 19 (54.3%) | 16 (45.7%) |
| Security & Protection | 9 (60.0%) | 6 (40.0%) |
| Firefighting & Prevention | 9 (60.0%) | 6 (40.0%) |
| Law Enforcement | 0 (0.0%) | 0 (0.0%) |
| Food Preparation & Serving | 0 (0.0%) | 4 (100.0%) |
| Cleaning & Maintenance | 28 (77.8%) | 8 (22.2%) |
| Personal Care & Service | 0 (0.0%) | 0 (0.0%) |
| Total (Category) | 56 (62.2%) | 34 (37.8%) |
| Total (Overall) | 173 (49.0%) | 180 (51.0%) |
Sales and Office Occupations
The most common Sales and Office occupations in Pinon are Office & Administration (20 | 5.7%), and Sales & Related (10 | 2.8%).
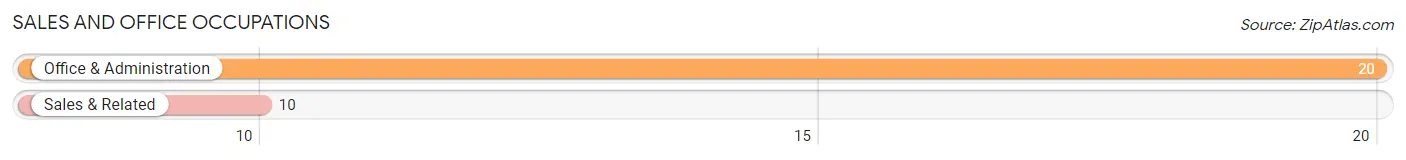
Sales and Office Occupations by Sex
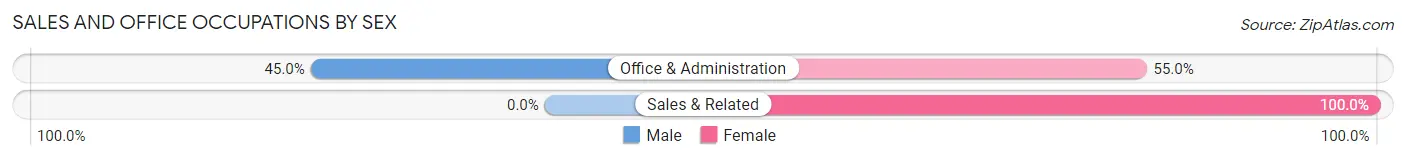
| Occupation | Male | Female |
| Sales & Related | 0 (0.0%) | 10 (100.0%) |
| Office & Administration | 9 (45.0%) | 11 (55.0%) |
| Total (Category) | 9 (30.0%) | 21 (70.0%) |
| Total (Overall) | 173 (49.0%) | 180 (51.0%) |
Natural Resources, Construction and Maintenance Occupations
The most common Natural Resources, Construction and Maintenance occupations in Pinon are , and Construction & Extraction (43 | 12.2%).
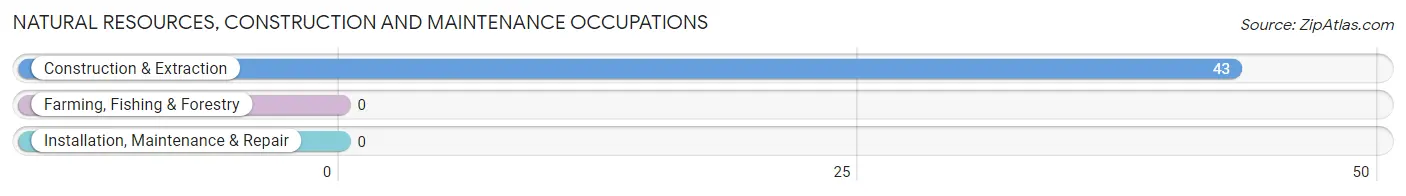
Natural Resources, Construction and Maintenance Occupations by Sex
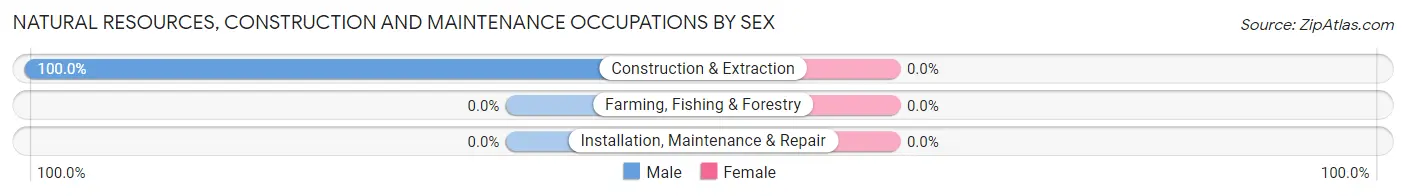
| Occupation | Male | Female |
| Farming, Fishing & Forestry | 0 (0.0%) | 0 (0.0%) |
| Construction & Extraction | 43 (100.0%) | 0 (0.0%) |
| Installation, Maintenance & Repair | 0 (0.0%) | 0 (0.0%) |
| Total (Category) | 43 (100.0%) | 0 (0.0%) |
| Total (Overall) | 173 (49.0%) | 180 (51.0%) |
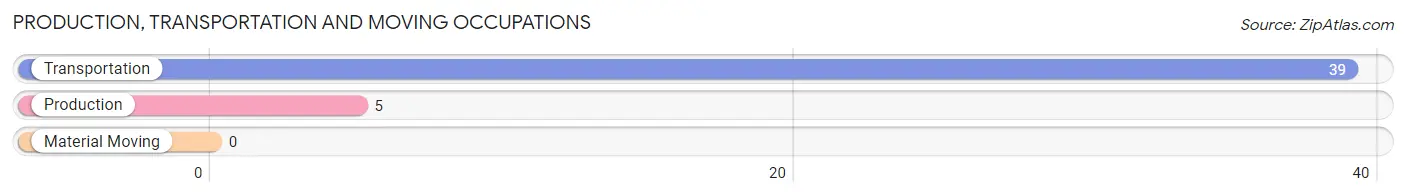
Production, Transportation and Moving Occupations
The most common Production, Transportation and Moving occupations in Pinon are Transportation (39 | 11.1%), and Production (5 | 1.4%).
Production, Transportation and Moving Occupations by Sex
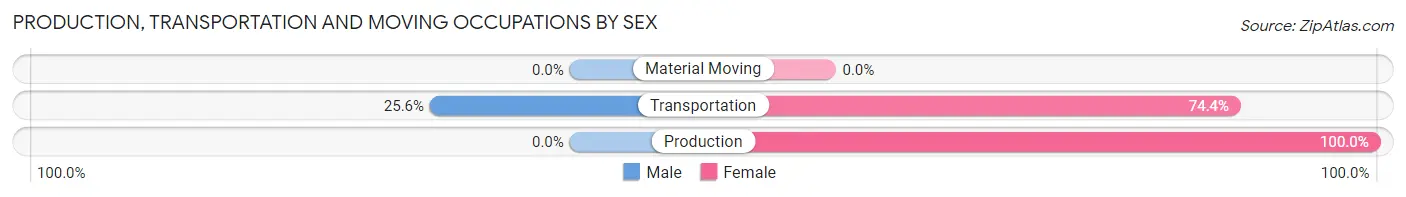
| Occupation | Male | Female |
| Production | 0 (0.0%) | 5 (100.0%) |
| Transportation | 10 (25.6%) | 29 (74.4%) |
| Material Moving | 0 (0.0%) | 0 (0.0%) |
| Total (Category) | 10 (22.7%) | 34 (77.3%) |
| Total (Overall) | 173 (49.0%) | 180 (51.0%) |
Employment Industries by Sex in Pinon
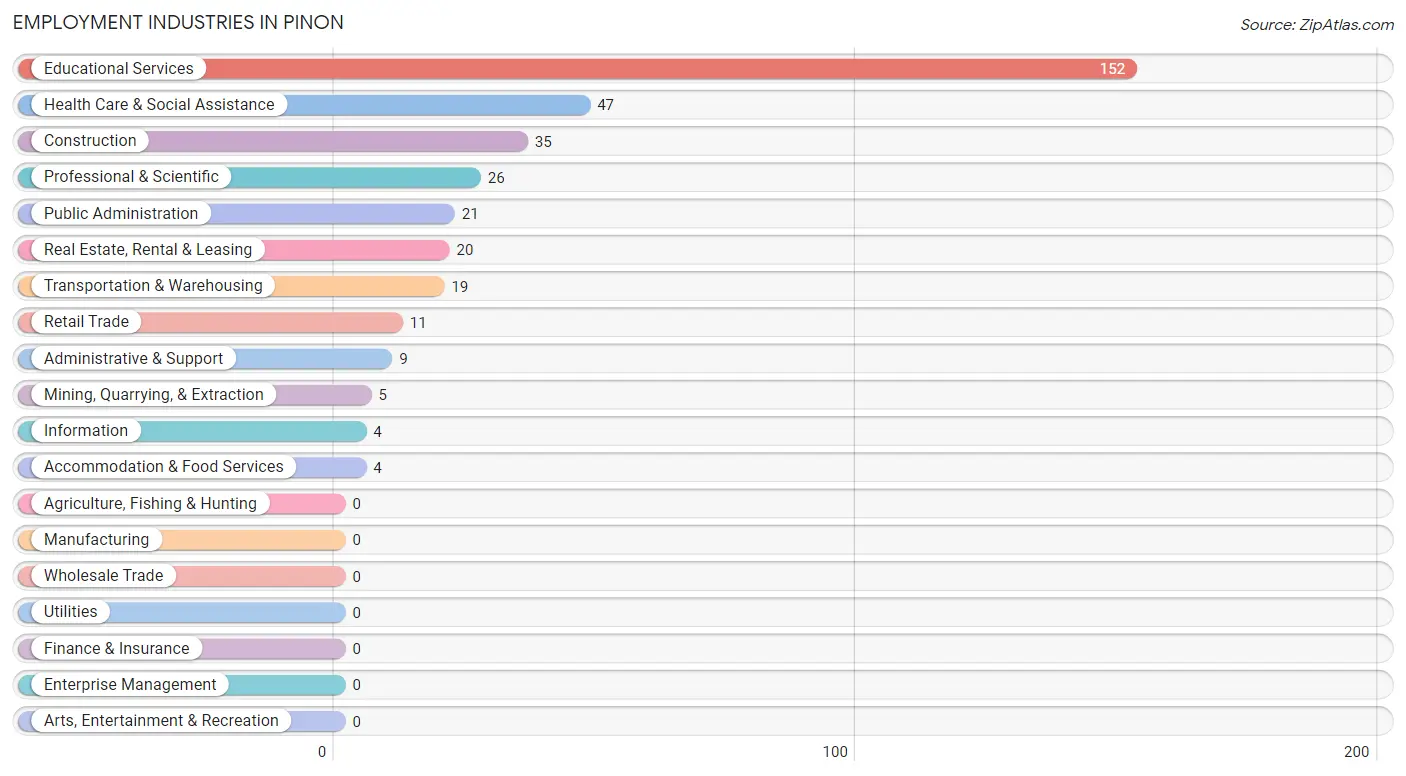
Employment Industries in Pinon
The major employment industries in Pinon include Educational Services (152 | 43.1%), Health Care & Social Assistance (47 | 13.3%), Construction (35 | 9.9%), Professional & Scientific (26 | 7.4%), and Public Administration (21 | 5.9%).
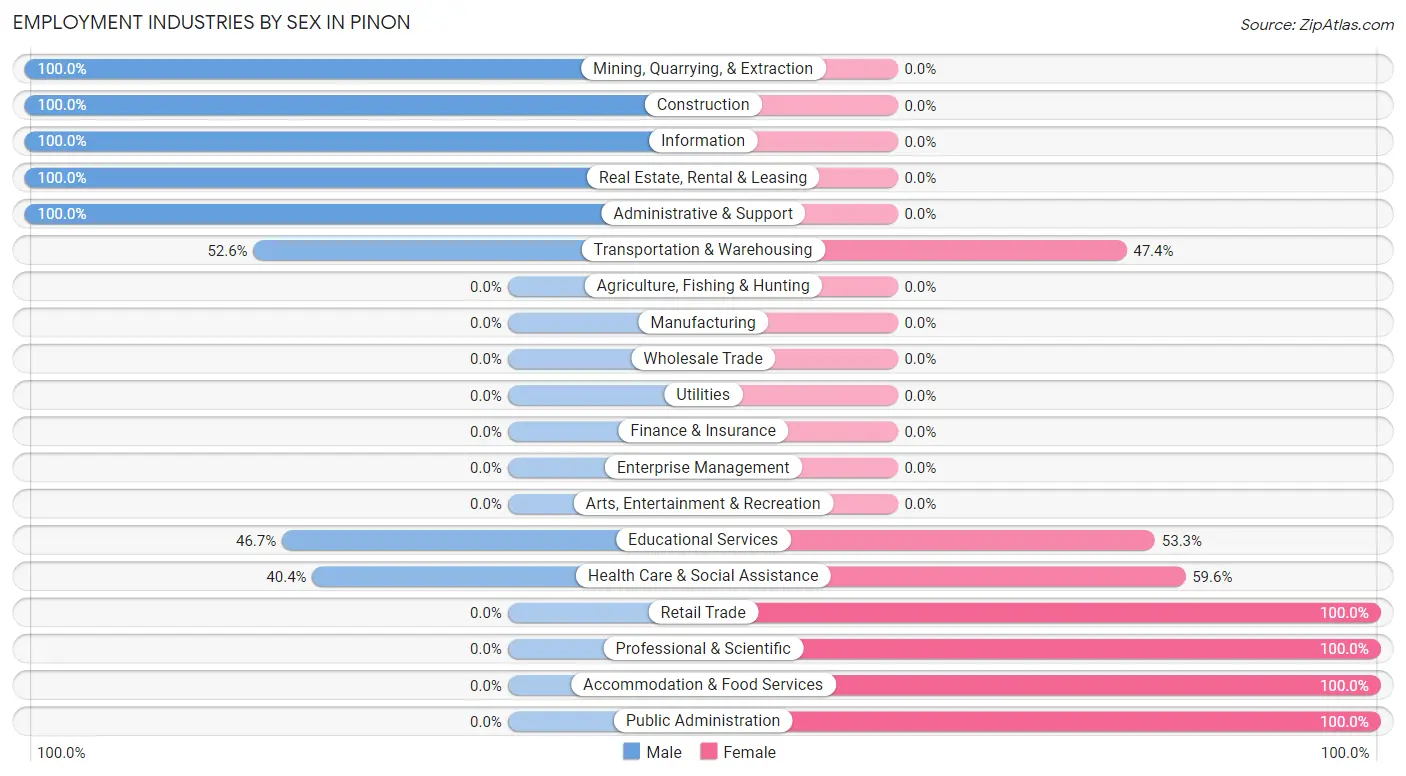
Employment Industries by Sex in Pinon
The Pinon industries that see more men than women are Mining, Quarrying, & Extraction (100.0%), Construction (100.0%), and Information (100.0%), whereas the industries that tend to have a higher number of women are Retail Trade (100.0%), Professional & Scientific (100.0%), and Accommodation & Food Services (100.0%).
| Industry | Male | Female |
| Agriculture, Fishing & Hunting | 0 (0.0%) | 0 (0.0%) |
| Mining, Quarrying, & Extraction | 5 (100.0%) | 0 (0.0%) |
| Construction | 35 (100.0%) | 0 (0.0%) |
| Manufacturing | 0 (0.0%) | 0 (0.0%) |
| Wholesale Trade | 0 (0.0%) | 0 (0.0%) |
| Retail Trade | 0 (0.0%) | 11 (100.0%) |
| Transportation & Warehousing | 10 (52.6%) | 9 (47.4%) |
| Utilities | 0 (0.0%) | 0 (0.0%) |
| Information | 4 (100.0%) | 0 (0.0%) |
| Finance & Insurance | 0 (0.0%) | 0 (0.0%) |
| Real Estate, Rental & Leasing | 20 (100.0%) | 0 (0.0%) |
| Professional & Scientific | 0 (0.0%) | 26 (100.0%) |
| Enterprise Management | 0 (0.0%) | 0 (0.0%) |
| Administrative & Support | 9 (100.0%) | 0 (0.0%) |
| Educational Services | 71 (46.7%) | 81 (53.3%) |
| Health Care & Social Assistance | 19 (40.4%) | 28 (59.6%) |
| Arts, Entertainment & Recreation | 0 (0.0%) | 0 (0.0%) |
| Accommodation & Food Services | 0 (0.0%) | 4 (100.0%) |
| Public Administration | 0 (0.0%) | 21 (100.0%) |
| Total | 173 (49.0%) | 180 (51.0%) |
Education in Pinon
School Enrollment in Pinon
The most common levels of schooling among the 259 students in Pinon are high school (95 | 36.7%), elementary school (78 | 30.1%), and middle school (56 | 21.6%).
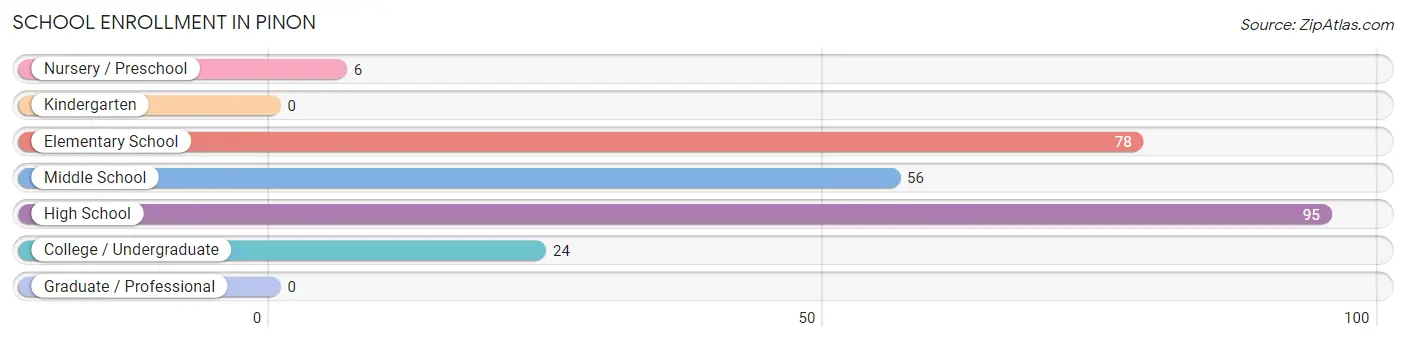
| School Level | # Students | % Students |
| Nursery / Preschool | 6 | 2.3% |
| Kindergarten | 0 | 0.0% |
| Elementary School | 78 | 30.1% |
| Middle School | 56 | 21.6% |
| High School | 95 | 36.7% |
| College / Undergraduate | 24 | 9.3% |
| Graduate / Professional | 0 | 0.0% |
| Total | 259 | 100.0% |
School Enrollment by Age by Funding Source in Pinon
Out of a total of 259 students who are enrolled in schools in Pinon, 42 (16.2%) attend a private institution, while the remaining 217 (83.8%) are enrolled in public schools. The age group of 25 to 34 year olds has the highest likelihood of being enrolled in private schools, with 9 (52.9% in the age bracket) enrolled. Conversely, the age group of 3 to 4 year olds has the lowest likelihood of being enrolled in a private school, with 6 (100.0% in the age bracket) attending a public institution.
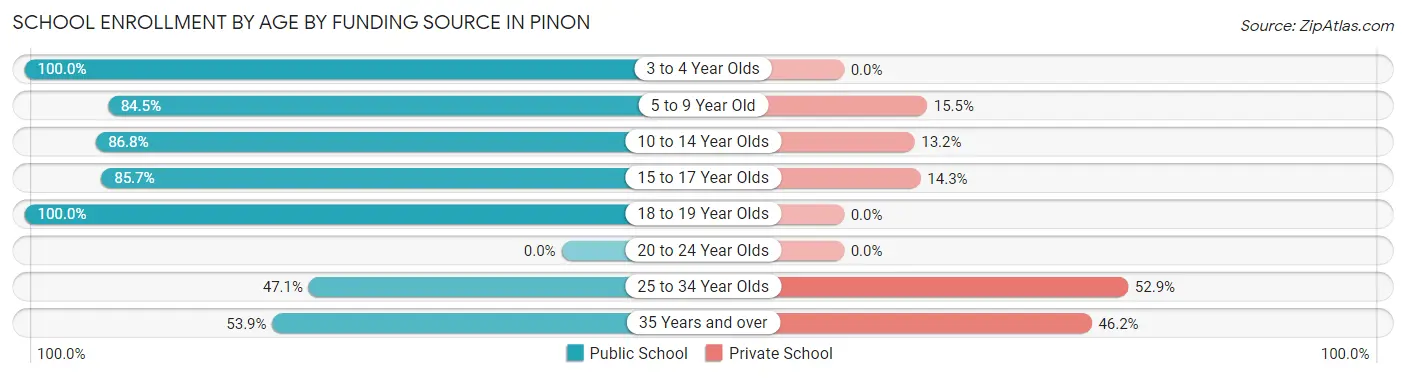
| Age Bracket | Public School | Private School |
| 3 to 4 Year Olds | 6 (100.0%) | 0 (0.0%) |
| 5 to 9 Year Old | 60 (84.5%) | 11 (15.5%) |
| 10 to 14 Year Olds | 66 (86.8%) | 10 (13.2%) |
| 15 to 17 Year Olds | 36 (85.7%) | 6 (14.3%) |
| 18 to 19 Year Olds | 34 (100.0%) | 0 (0.0%) |
| 20 to 24 Year Olds | 0 (0.0%) | 0 (0.0%) |
| 25 to 34 Year Olds | 8 (47.1%) | 9 (52.9%) |
| 35 Years and over | 7 (53.8%) | 6 (46.2%) |
| Total | 217 (83.8%) | 42 (16.2%) |
Educational Attainment by Field of Study in Pinon
Education (37 | 28.9%), social sciences (18 | 14.1%), business (18 | 14.1%), literature & languages (16 | 12.5%), and multidisciplinary studies (13 | 10.2%) are the most common fields of study among 128 individuals in Pinon who have obtained a bachelor's degree or higher.
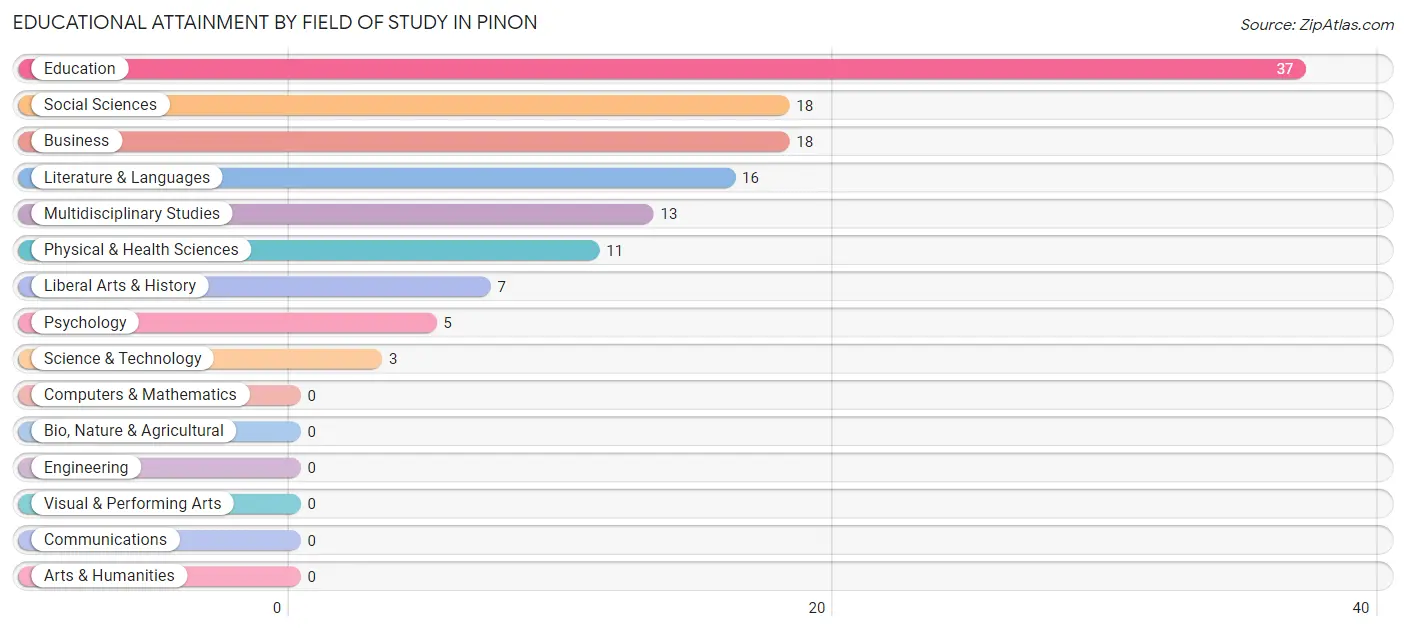
| Field of Study | # Graduates | % Graduates |
| Computers & Mathematics | 0 | 0.0% |
| Bio, Nature & Agricultural | 0 | 0.0% |
| Physical & Health Sciences | 11 | 8.6% |
| Psychology | 5 | 3.9% |
| Social Sciences | 18 | 14.1% |
| Engineering | 0 | 0.0% |
| Multidisciplinary Studies | 13 | 10.2% |
| Science & Technology | 3 | 2.3% |
| Business | 18 | 14.1% |
| Education | 37 | 28.9% |
| Literature & Languages | 16 | 12.5% |
| Liberal Arts & History | 7 | 5.5% |
| Visual & Performing Arts | 0 | 0.0% |
| Communications | 0 | 0.0% |
| Arts & Humanities | 0 | 0.0% |
| Total | 128 | 100.0% |
Transportation & Commute in Pinon
Vehicle Availability by Sex in Pinon
The most prevalent vehicle ownership categories in Pinon are males with 1 vehicle (92, accounting for 53.2%) and females with 1 vehicle (37, making up 53.8%).
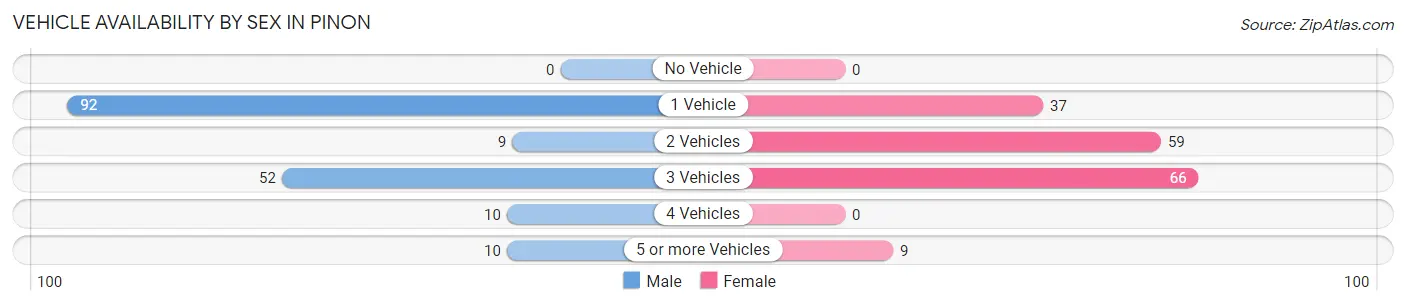
| Vehicles Available | Male | Female |
| No Vehicle | 0 (0.0%) | 0 (0.0%) |
| 1 Vehicle | 92 (53.2%) | 37 (21.6%) |
| 2 Vehicles | 9 (5.2%) | 59 (34.5%) |
| 3 Vehicles | 52 (30.1%) | 66 (38.6%) |
| 4 Vehicles | 10 (5.8%) | 0 (0.0%) |
| 5 or more Vehicles | 10 (5.8%) | 9 (5.3%) |
| Total | 173 (100.0%) | 171 (100.0%) |
Commute Time in Pinon
The most frequently occuring commute durations in Pinon are 5 to 9 minutes (102 commuters, 29.7%), less than 5 minutes (87 commuters, 25.4%), and 10 to 14 minutes (45 commuters, 13.1%).
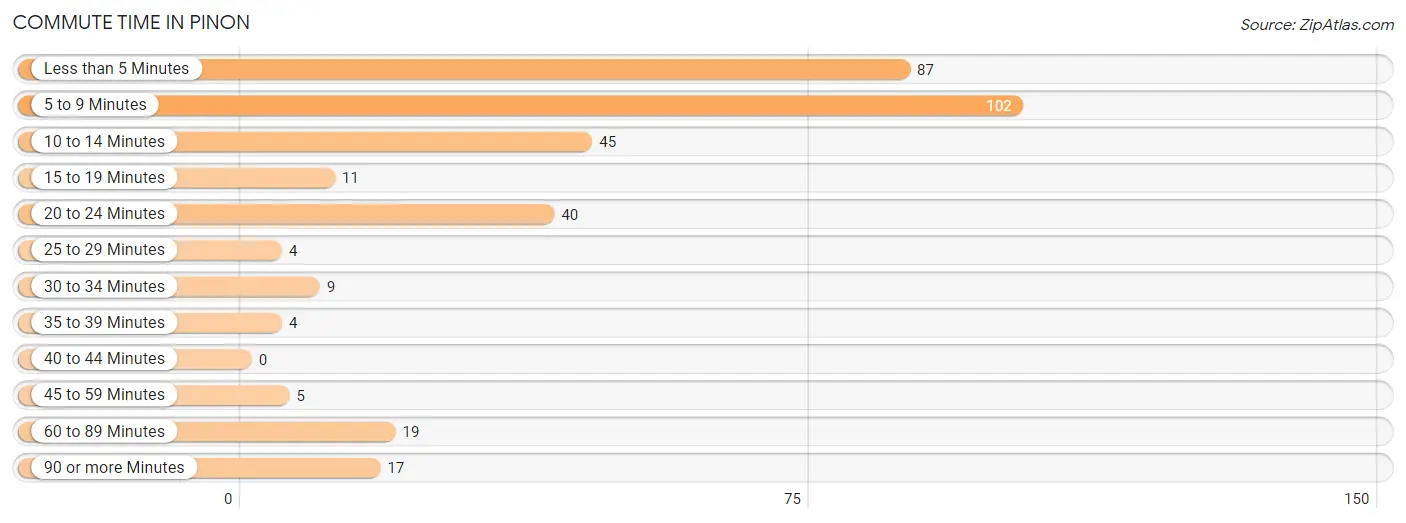
| Commute Time | # Commuters | % Commuters |
| Less than 5 Minutes | 87 | 25.4% |
| 5 to 9 Minutes | 102 | 29.7% |
| 10 to 14 Minutes | 45 | 13.1% |
| 15 to 19 Minutes | 11 | 3.2% |
| 20 to 24 Minutes | 40 | 11.7% |
| 25 to 29 Minutes | 4 | 1.2% |
| 30 to 34 Minutes | 9 | 2.6% |
| 35 to 39 Minutes | 4 | 1.2% |
| 40 to 44 Minutes | 0 | 0.0% |
| 45 to 59 Minutes | 5 | 1.5% |
| 60 to 89 Minutes | 19 | 5.5% |
| 90 or more Minutes | 17 | 5.0% |
Commute Time by Sex in Pinon
The most common commute times in Pinon are less than 5 minutes (49 commuters, 28.3%) for males and 5 to 9 minutes (80 commuters, 47.1%) for females.
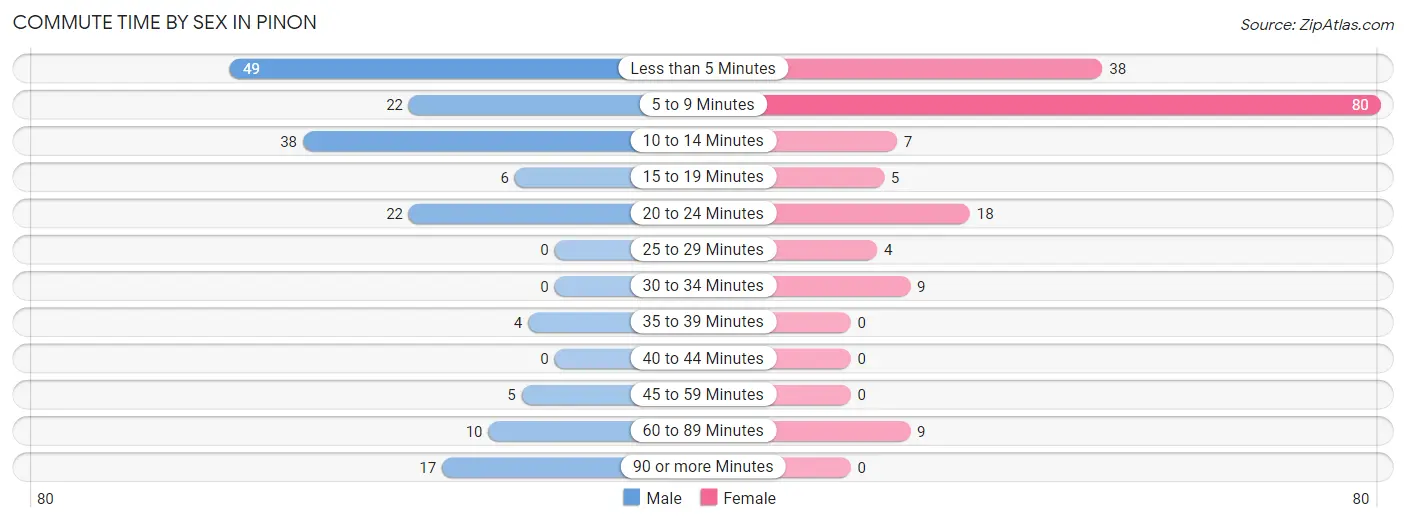
| Commute Time | Male | Female |
| Less than 5 Minutes | 49 (28.3%) | 38 (22.4%) |
| 5 to 9 Minutes | 22 (12.7%) | 80 (47.1%) |
| 10 to 14 Minutes | 38 (22.0%) | 7 (4.1%) |
| 15 to 19 Minutes | 6 (3.5%) | 5 (2.9%) |
| 20 to 24 Minutes | 22 (12.7%) | 18 (10.6%) |
| 25 to 29 Minutes | 0 (0.0%) | 4 (2.4%) |
| 30 to 34 Minutes | 0 (0.0%) | 9 (5.3%) |
| 35 to 39 Minutes | 4 (2.3%) | 0 (0.0%) |
| 40 to 44 Minutes | 0 (0.0%) | 0 (0.0%) |
| 45 to 59 Minutes | 5 (2.9%) | 0 (0.0%) |
| 60 to 89 Minutes | 10 (5.8%) | 9 (5.3%) |
| 90 or more Minutes | 17 (9.8%) | 0 (0.0%) |
Time of Departure to Work by Sex in Pinon
The most frequent times of departure to work in Pinon are 7:00 AM to 7:29 AM (44, 25.4%) for males and 7:00 AM to 7:29 AM (62, 36.5%) for females.
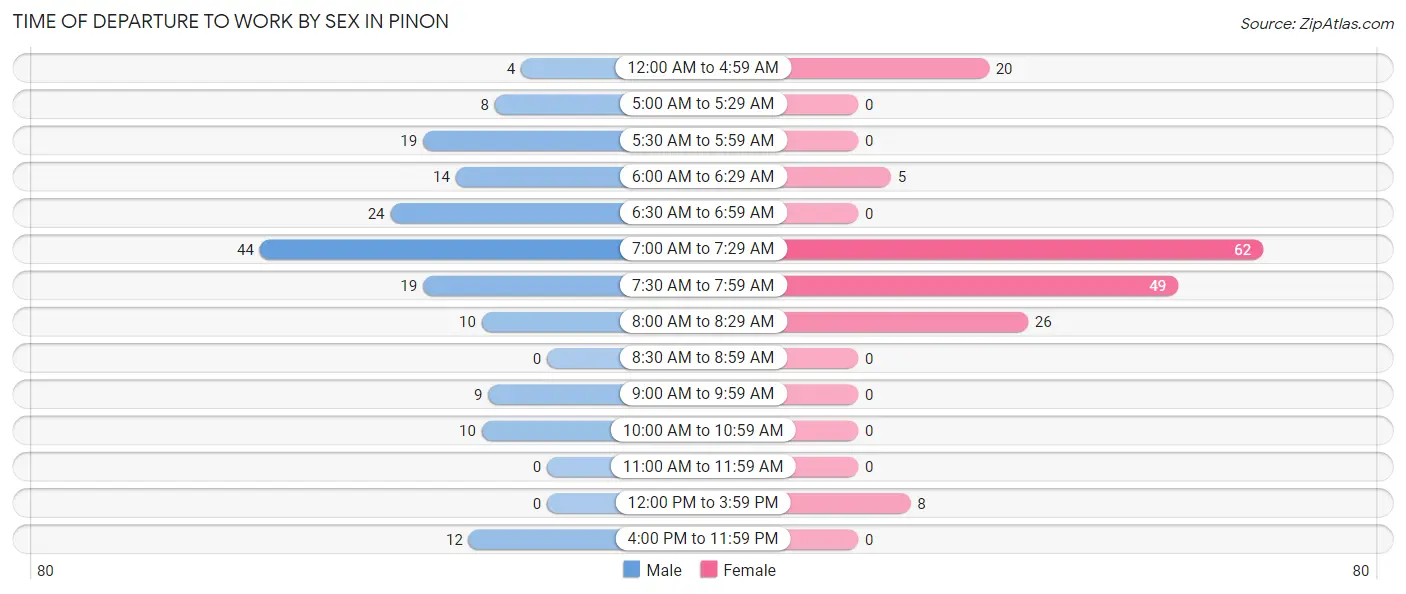
| Time of Departure | Male | Female |
| 12:00 AM to 4:59 AM | 4 (2.3%) | 20 (11.8%) |
| 5:00 AM to 5:29 AM | 8 (4.6%) | 0 (0.0%) |
| 5:30 AM to 5:59 AM | 19 (11.0%) | 0 (0.0%) |
| 6:00 AM to 6:29 AM | 14 (8.1%) | 5 (2.9%) |
| 6:30 AM to 6:59 AM | 24 (13.9%) | 0 (0.0%) |
| 7:00 AM to 7:29 AM | 44 (25.4%) | 62 (36.5%) |
| 7:30 AM to 7:59 AM | 19 (11.0%) | 49 (28.8%) |
| 8:00 AM to 8:29 AM | 10 (5.8%) | 26 (15.3%) |
| 8:30 AM to 8:59 AM | 0 (0.0%) | 0 (0.0%) |
| 9:00 AM to 9:59 AM | 9 (5.2%) | 0 (0.0%) |
| 10:00 AM to 10:59 AM | 10 (5.8%) | 0 (0.0%) |
| 11:00 AM to 11:59 AM | 0 (0.0%) | 0 (0.0%) |
| 12:00 PM to 3:59 PM | 0 (0.0%) | 8 (4.7%) |
| 4:00 PM to 11:59 PM | 12 (6.9%) | 0 (0.0%) |
| Total | 173 (100.0%) | 170 (100.0%) |
Housing Occupancy in Pinon
Occupancy by Ownership in Pinon
Of the total 370 dwellings in Pinon, owner-occupied units account for 173 (46.8%), while renter-occupied units make up 197 (53.2%).
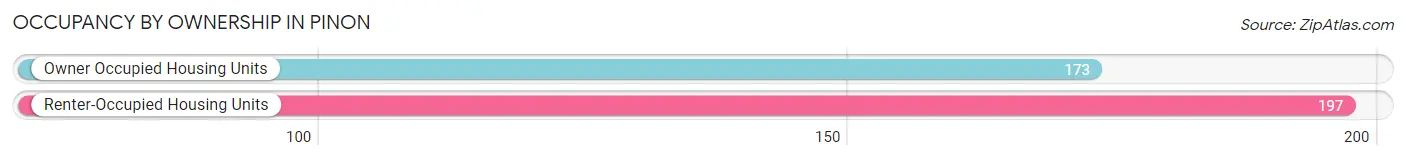
| Occupancy | # Housing Units | % Housing Units |
| Owner Occupied Housing Units | 173 | 46.8% |
| Renter-Occupied Housing Units | 197 | 53.2% |
| Total Occupied Housing Units | 370 | 100.0% |
Occupancy by Household Size in Pinon
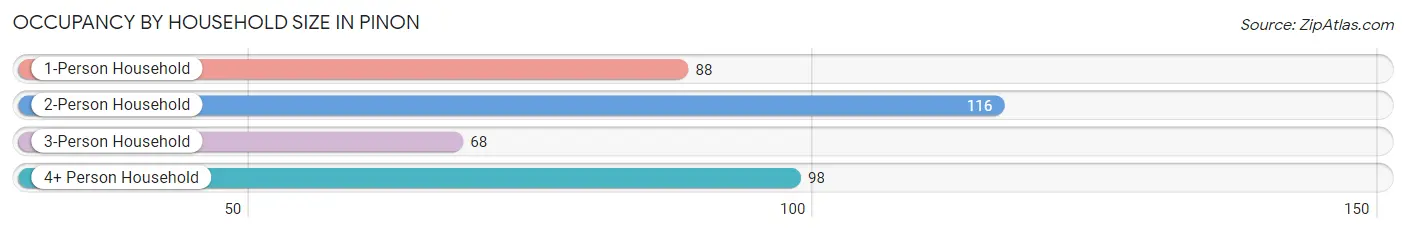
| Household Size | # Housing Units | % Housing Units |
| 1-Person Household | 88 | 23.8% |
| 2-Person Household | 116 | 31.4% |
| 3-Person Household | 68 | 18.4% |
| 4+ Person Household | 98 | 26.5% |
| Total Housing Units | 370 | 100.0% |
Occupancy by Ownership by Household Size in Pinon
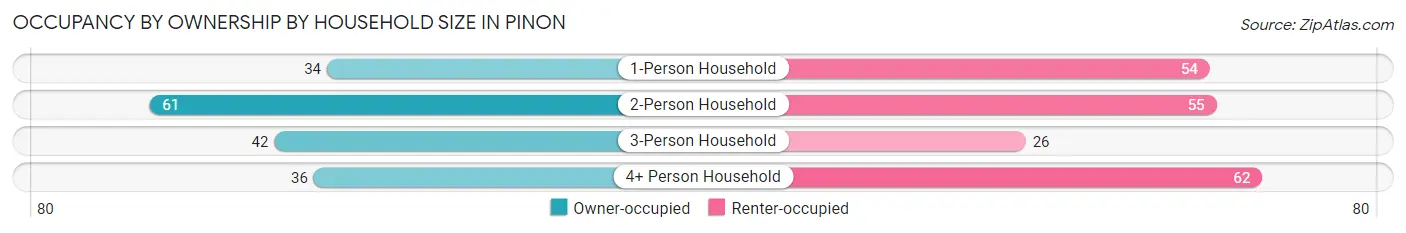
| Household Size | Owner-occupied | Renter-occupied |
| 1-Person Household | 34 (38.6%) | 54 (61.4%) |
| 2-Person Household | 61 (52.6%) | 55 (47.4%) |
| 3-Person Household | 42 (61.8%) | 26 (38.2%) |
| 4+ Person Household | 36 (36.7%) | 62 (63.3%) |
| Total Housing Units | 173 (46.8%) | 197 (53.2%) |
Occupancy by Educational Attainment in Pinon
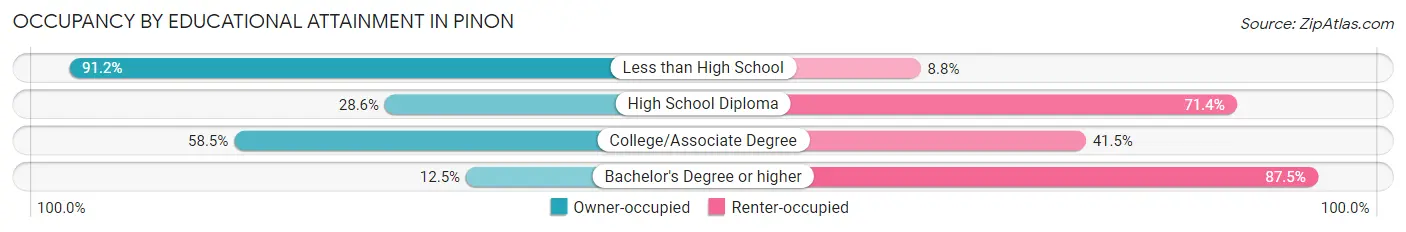
| Household Size | Owner-occupied | Renter-occupied |
| Less than High School | 62 (91.2%) | 6 (8.8%) |
| High School Diploma | 24 (28.6%) | 60 (71.4%) |
| College/Associate Degree | 76 (58.5%) | 54 (41.5%) |
| Bachelor's Degree or higher | 11 (12.5%) | 77 (87.5%) |
Occupancy by Age of Householder in Pinon
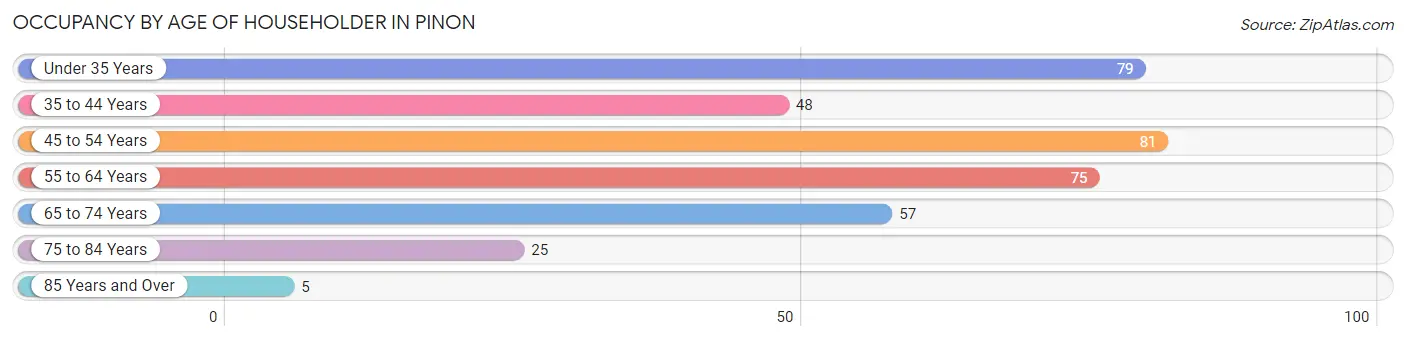
| Age Bracket | # Households | % Households |
| Under 35 Years | 79 | 21.3% |
| 35 to 44 Years | 48 | 13.0% |
| 45 to 54 Years | 81 | 21.9% |
| 55 to 64 Years | 75 | 20.3% |
| 65 to 74 Years | 57 | 15.4% |
| 75 to 84 Years | 25 | 6.8% |
| 85 Years and Over | 5 | 1.3% |
| Total | 370 | 100.0% |
Housing Finances in Pinon
Median Income by Occupancy in Pinon
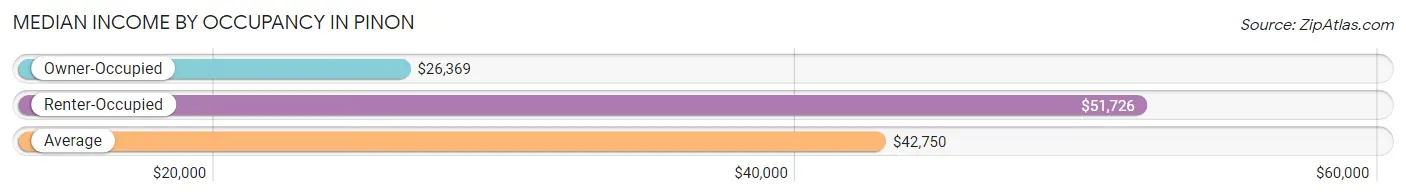
| Occupancy Type | # Households | Median Income |
| Owner-Occupied | 173 (46.8%) | $26,369 |
| Renter-Occupied | 197 (53.2%) | $51,726 |
| Average | 370 (100.0%) | $42,750 |
Occupancy by Householder Income Bracket in Pinon
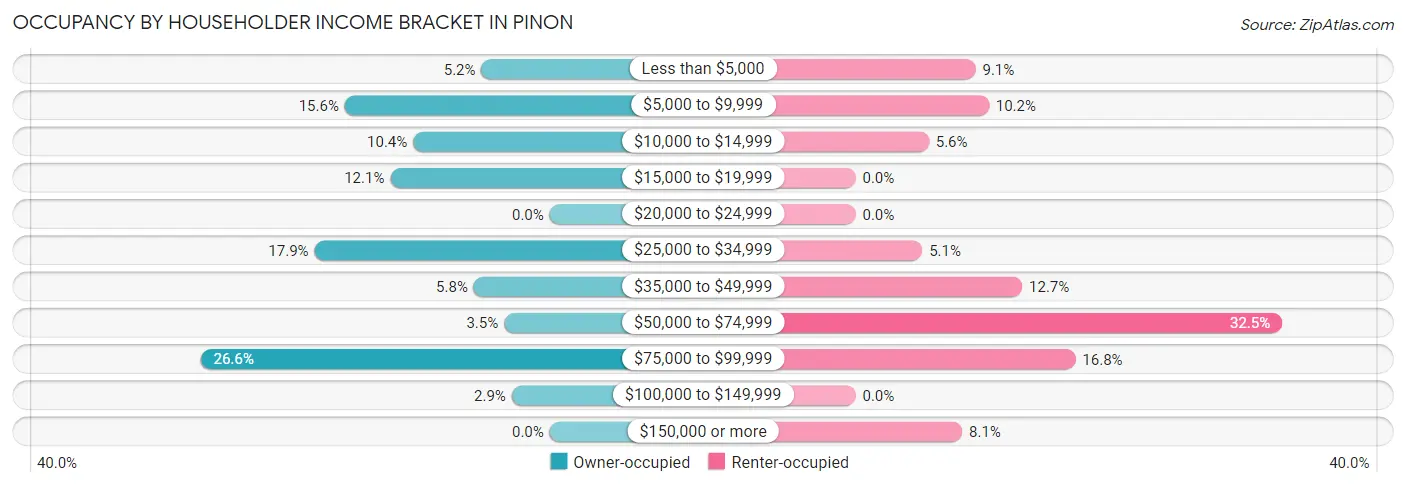
| Income Bracket | Owner-occupied | Renter-occupied |
| Less than $5,000 | 9 (5.2%) | 18 (9.1%) |
| $5,000 to $9,999 | 27 (15.6%) | 20 (10.2%) |
| $10,000 to $14,999 | 18 (10.4%) | 11 (5.6%) |
| $15,000 to $19,999 | 21 (12.1%) | 0 (0.0%) |
| $20,000 to $24,999 | 0 (0.0%) | 0 (0.0%) |
| $25,000 to $34,999 | 31 (17.9%) | 10 (5.1%) |
| $35,000 to $49,999 | 10 (5.8%) | 25 (12.7%) |
| $50,000 to $74,999 | 6 (3.5%) | 64 (32.5%) |
| $75,000 to $99,999 | 46 (26.6%) | 33 (16.8%) |
| $100,000 to $149,999 | 5 (2.9%) | 0 (0.0%) |
| $150,000 or more | 0 (0.0%) | 16 (8.1%) |
| Total | 173 (100.0%) | 197 (100.0%) |
Monthly Housing Cost Tiers in Pinon
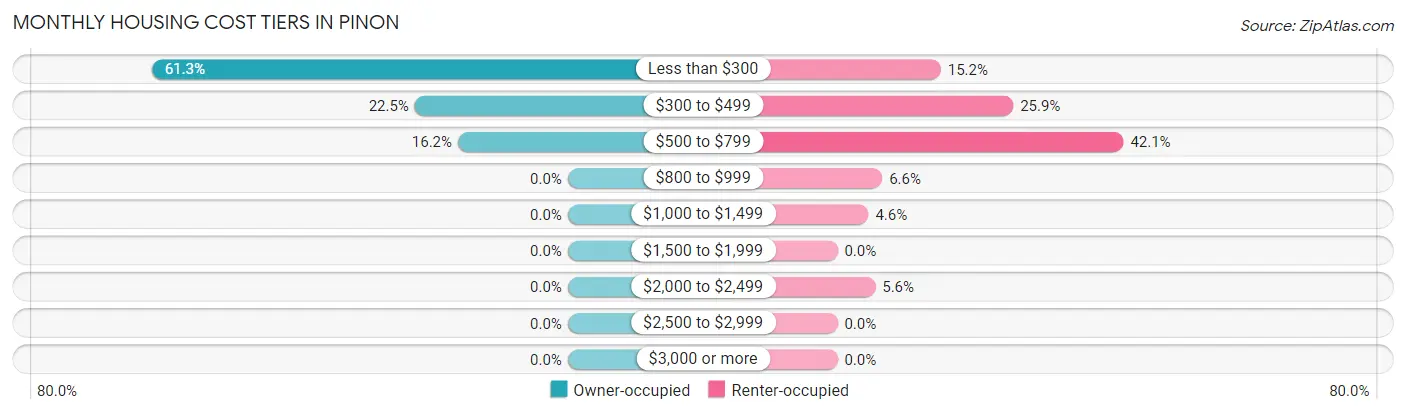
| Monthly Cost | Owner-occupied | Renter-occupied |
| Less than $300 | 106 (61.3%) | 30 (15.2%) |
| $300 to $499 | 39 (22.5%) | 51 (25.9%) |
| $500 to $799 | 28 (16.2%) | 83 (42.1%) |
| $800 to $999 | 0 (0.0%) | 13 (6.6%) |
| $1,000 to $1,499 | 0 (0.0%) | 9 (4.6%) |
| $1,500 to $1,999 | 0 (0.0%) | 0 (0.0%) |
| $2,000 to $2,499 | 0 (0.0%) | 11 (5.6%) |
| $2,500 to $2,999 | 0 (0.0%) | 0 (0.0%) |
| $3,000 or more | 0 (0.0%) | 0 (0.0%) |
| Total | 173 (100.0%) | 197 (100.0%) |
Physical Housing Characteristics in Pinon
Housing Structures in Pinon
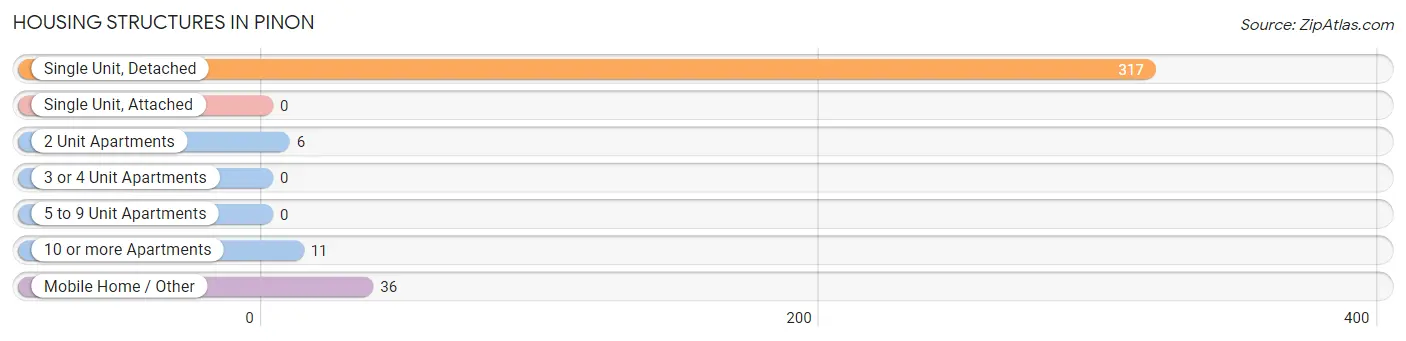
| Structure Type | # Housing Units | % Housing Units |
| Single Unit, Detached | 317 | 85.7% |
| Single Unit, Attached | 0 | 0.0% |
| 2 Unit Apartments | 6 | 1.6% |
| 3 or 4 Unit Apartments | 0 | 0.0% |
| 5 to 9 Unit Apartments | 0 | 0.0% |
| 10 or more Apartments | 11 | 3.0% |
| Mobile Home / Other | 36 | 9.7% |
| Total | 370 | 100.0% |
Housing Structures by Occupancy in Pinon
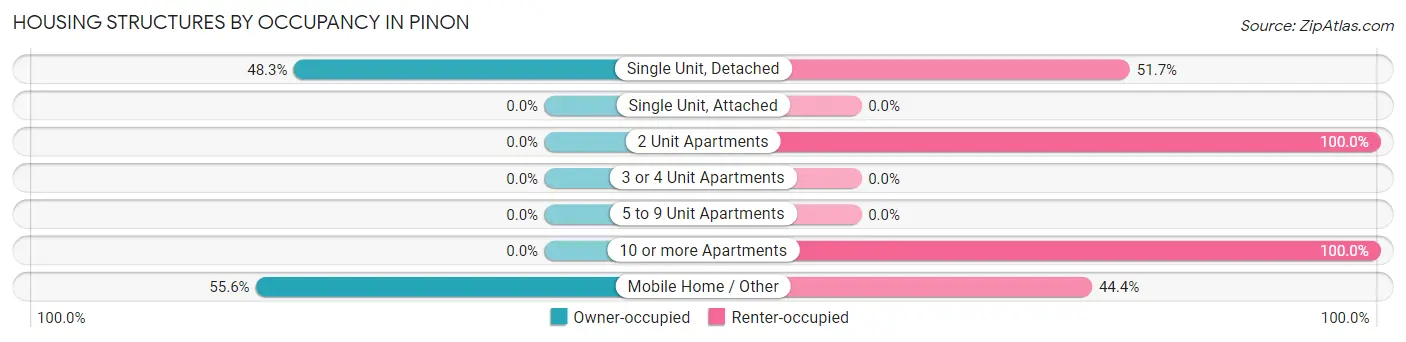
| Structure Type | Owner-occupied | Renter-occupied |
| Single Unit, Detached | 153 (48.3%) | 164 (51.7%) |
| Single Unit, Attached | 0 (0.0%) | 0 (0.0%) |
| 2 Unit Apartments | 0 (0.0%) | 6 (100.0%) |
| 3 or 4 Unit Apartments | 0 (0.0%) | 0 (0.0%) |
| 5 to 9 Unit Apartments | 0 (0.0%) | 0 (0.0%) |
| 10 or more Apartments | 0 (0.0%) | 11 (100.0%) |
| Mobile Home / Other | 20 (55.6%) | 16 (44.4%) |
| Total | 173 (46.8%) | 197 (53.2%) |
Housing Structures by Number of Rooms in Pinon
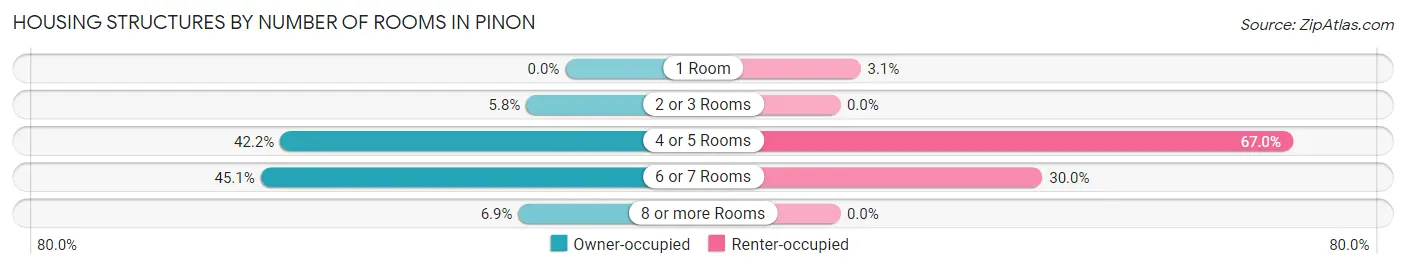
| Number of Rooms | Owner-occupied | Renter-occupied |
| 1 Room | 0 (0.0%) | 6 (3.0%) |
| 2 or 3 Rooms | 10 (5.8%) | 0 (0.0%) |
| 4 or 5 Rooms | 73 (42.2%) | 132 (67.0%) |
| 6 or 7 Rooms | 78 (45.1%) | 59 (29.9%) |
| 8 or more Rooms | 12 (6.9%) | 0 (0.0%) |
| Total | 173 (100.0%) | 197 (100.0%) |
Housing Structure by Heating Type in Pinon
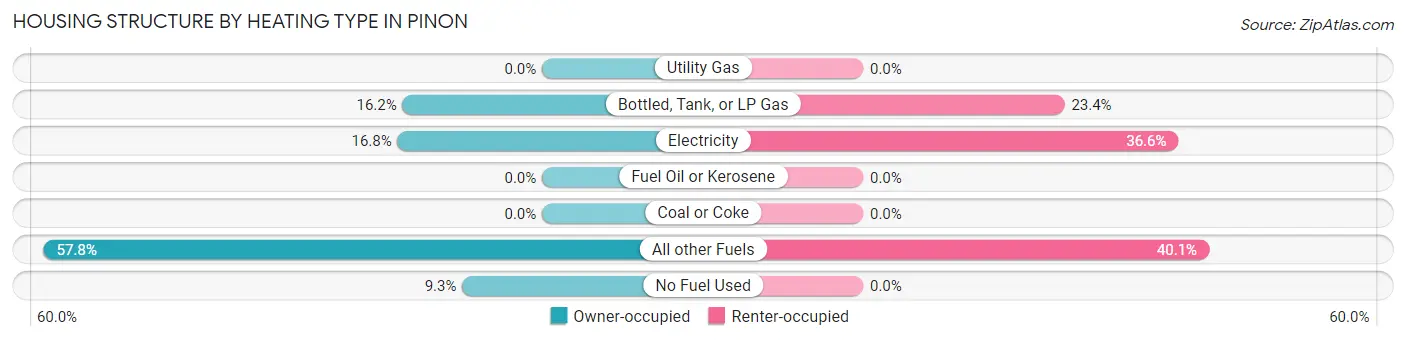
| Heating Type | Owner-occupied | Renter-occupied |
| Utility Gas | 0 (0.0%) | 0 (0.0%) |
| Bottled, Tank, or LP Gas | 28 (16.2%) | 46 (23.4%) |
| Electricity | 29 (16.8%) | 72 (36.5%) |
| Fuel Oil or Kerosene | 0 (0.0%) | 0 (0.0%) |
| Coal or Coke | 0 (0.0%) | 0 (0.0%) |
| All other Fuels | 100 (57.8%) | 79 (40.1%) |
| No Fuel Used | 16 (9.2%) | 0 (0.0%) |
| Total | 173 (100.0%) | 197 (100.0%) |
Household Vehicle Usage in Pinon
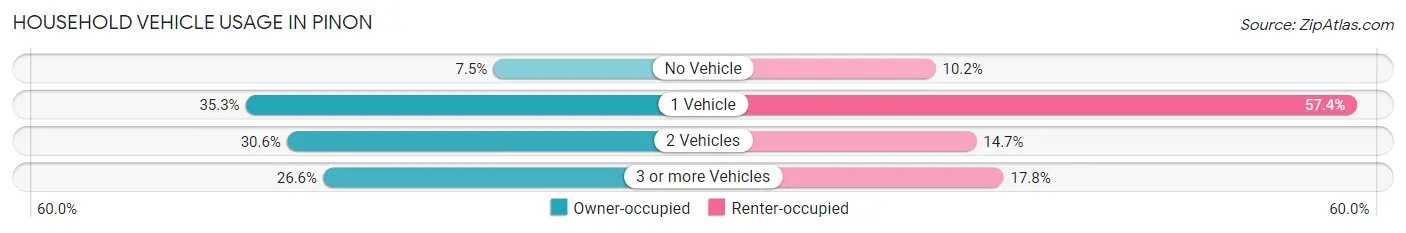
| Vehicles per Household | Owner-occupied | Renter-occupied |
| No Vehicle | 13 (7.5%) | 20 (10.2%) |
| 1 Vehicle | 61 (35.3%) | 113 (57.4%) |
| 2 Vehicles | 53 (30.6%) | 29 (14.7%) |
| 3 or more Vehicles | 46 (26.6%) | 35 (17.8%) |
| Total | 173 (100.0%) | 197 (100.0%) |
Real Estate & Mortgages in Pinon
Real Estate and Mortgage Overview in Pinon
| Characteristic | Without Mortgage | With Mortgage |
| Housing Units | 173 | 0 |
| Median Property Value | - | - |
| Median Household Income | $26,369 | $0 |
| Monthly Housing Costs | $266 | $0 |
| Real Estate Taxes | - | - |
Property Value by Mortgage Status in Pinon
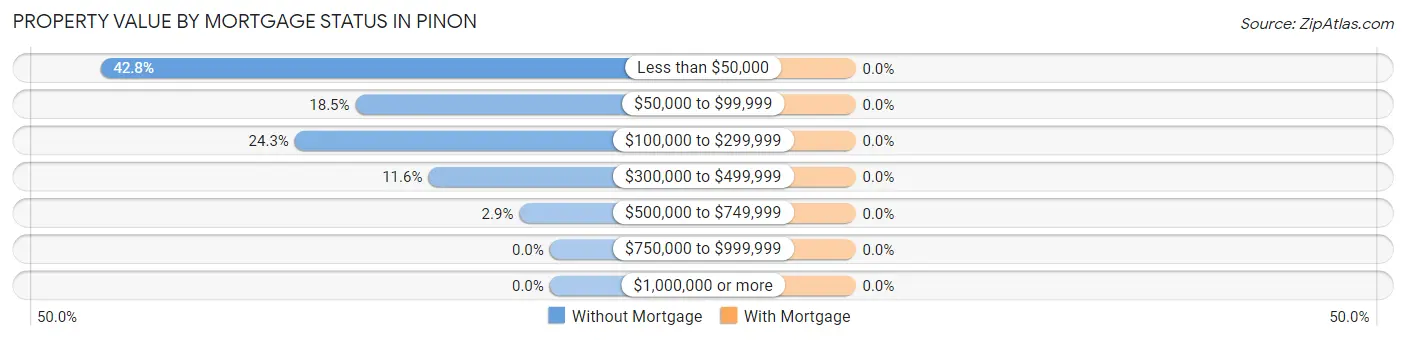
| Property Value | Without Mortgage | With Mortgage |
| Less than $50,000 | 74 (42.8%) | 0 (0.0%) |
| $50,000 to $99,999 | 32 (18.5%) | 0 (0.0%) |
| $100,000 to $299,999 | 42 (24.3%) | 0 (0.0%) |
| $300,000 to $499,999 | 20 (11.6%) | 0 (0.0%) |
| $500,000 to $749,999 | 5 (2.9%) | 0 (0.0%) |
| $750,000 to $999,999 | 0 (0.0%) | 0 (0.0%) |
| $1,000,000 or more | 0 (0.0%) | 0 (0.0%) |
| Total | 173 (100.0%) | 0 (0.0%) |
Household Income by Mortgage Status in Pinon
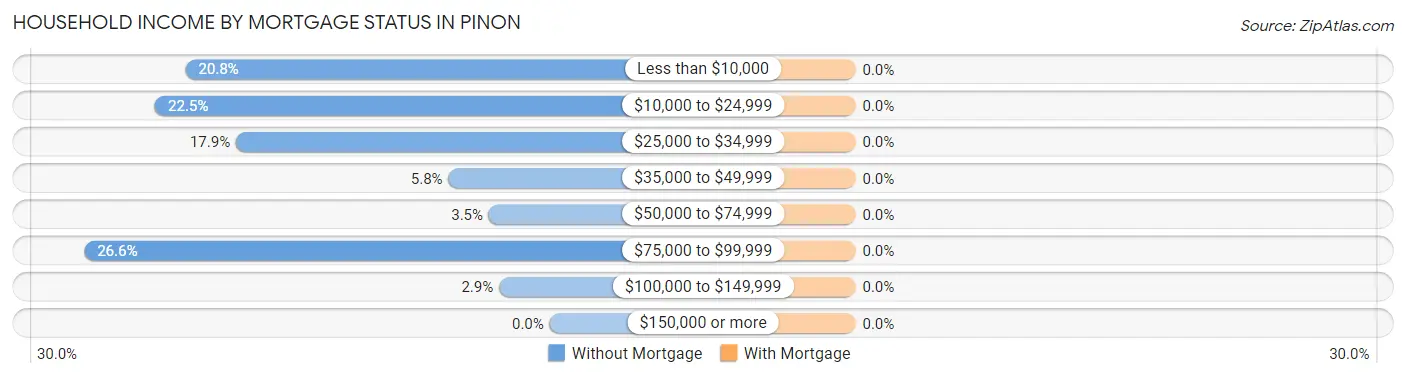
| Household Income | Without Mortgage | With Mortgage |
| Less than $10,000 | 36 (20.8%) | 0 (0.0%) |
| $10,000 to $24,999 | 39 (22.5%) | 0 (0.0%) |
| $25,000 to $34,999 | 31 (17.9%) | 0 (0.0%) |
| $35,000 to $49,999 | 10 (5.8%) | 0 (0.0%) |
| $50,000 to $74,999 | 6 (3.5%) | 0 (0.0%) |
| $75,000 to $99,999 | 46 (26.6%) | 0 (0.0%) |
| $100,000 to $149,999 | 5 (2.9%) | 0 (0.0%) |
| $150,000 or more | 0 (0.0%) | 0 (0.0%) |
| Total | 173 (100.0%) | 0 (0.0%) |
Property Value to Household Income Ratio in Pinon
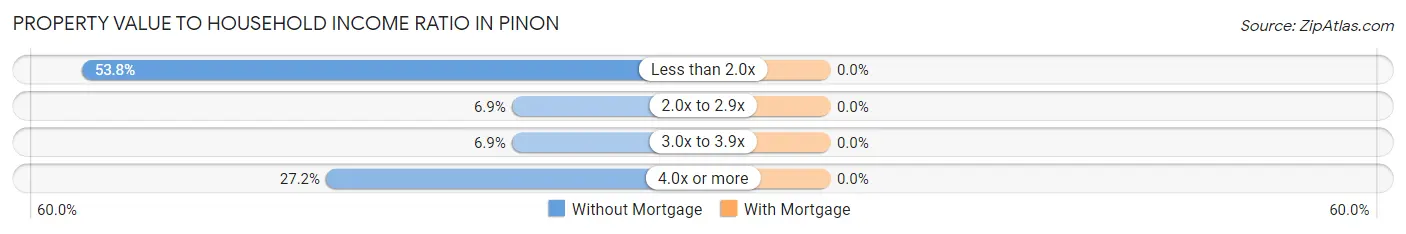
| Value-to-Income Ratio | Without Mortgage | With Mortgage |
| Less than 2.0x | 93 (53.8%) | 0 (0.0%) |
| 2.0x to 2.9x | 12 (6.9%) | 0 (0.0%) |
| 3.0x to 3.9x | 12 (6.9%) | 0 (0.0%) |
| 4.0x or more | 47 (27.2%) | 0 (0.0%) |
| Total | 173 (100.0%) | 0 (0.0%) |
Real Estate Taxes by Mortgage Status in Pinon
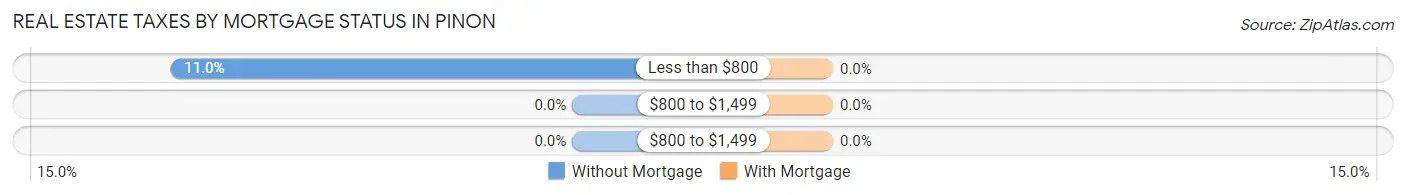
| Property Taxes | Without Mortgage | With Mortgage |
| Less than $800 | 19 (11.0%) | 0 (0.0%) |
| $800 to $1,499 | 0 (0.0%) | 0 (0.0%) |
| $800 to $1,499 | 0 (0.0%) | 0 (0.0%) |
| Total | 173 (100.0%) | 0 (0.0%) |
Health & Disability in Pinon
Health Insurance Coverage by Age in Pinon
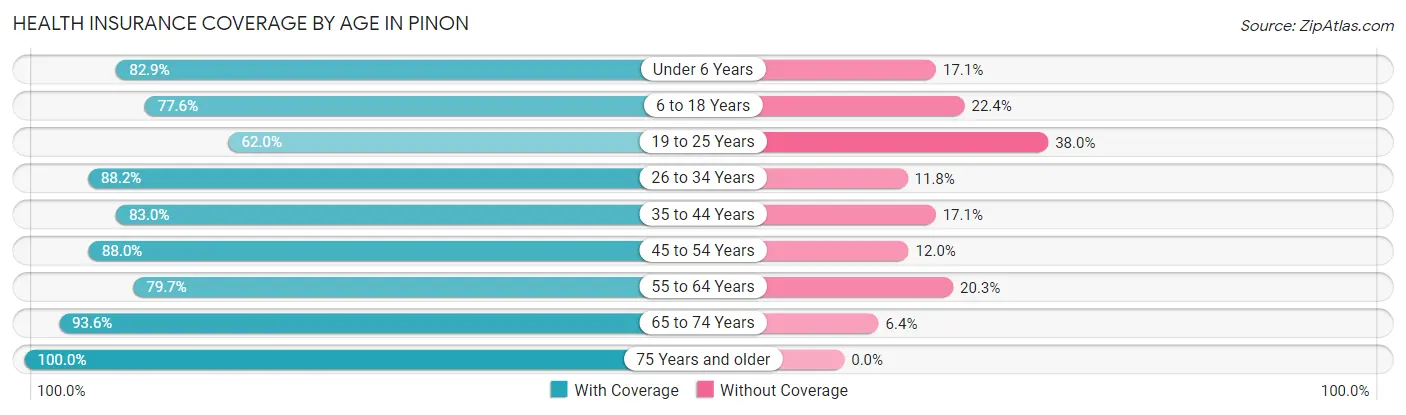
| Age Bracket | With Coverage | Without Coverage |
| Under 6 Years | 63 (82.9%) | 13 (17.1%) |
| 6 to 18 Years | 173 (77.6%) | 50 (22.4%) |
| 19 to 25 Years | 44 (62.0%) | 27 (38.0%) |
| 26 to 34 Years | 127 (88.2%) | 17 (11.8%) |
| 35 to 44 Years | 107 (83.0%) | 22 (17.1%) |
| 45 to 54 Years | 110 (88.0%) | 15 (12.0%) |
| 55 to 64 Years | 110 (79.7%) | 28 (20.3%) |
| 65 to 74 Years | 73 (93.6%) | 5 (6.4%) |
| 75 Years and older | 34 (100.0%) | 0 (0.0%) |
| Total | 841 (82.6%) | 177 (17.4%) |
Health Insurance Coverage by Citizenship Status in Pinon
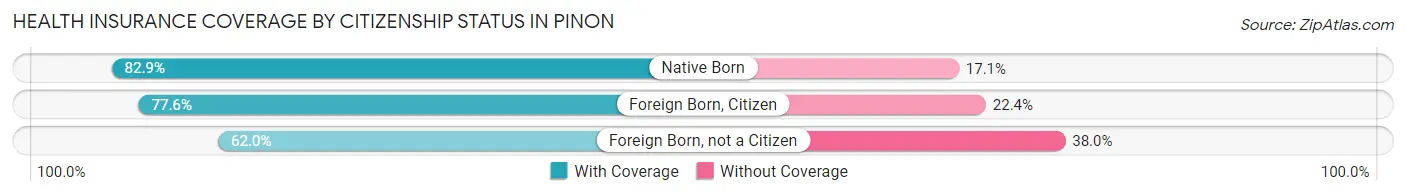
| Citizenship Status | With Coverage | Without Coverage |
| Native Born | 63 (82.9%) | 13 (17.1%) |
| Foreign Born, Citizen | 173 (77.6%) | 50 (22.4%) |
| Foreign Born, not a Citizen | 44 (62.0%) | 27 (38.0%) |
Health Insurance Coverage by Household Income in Pinon
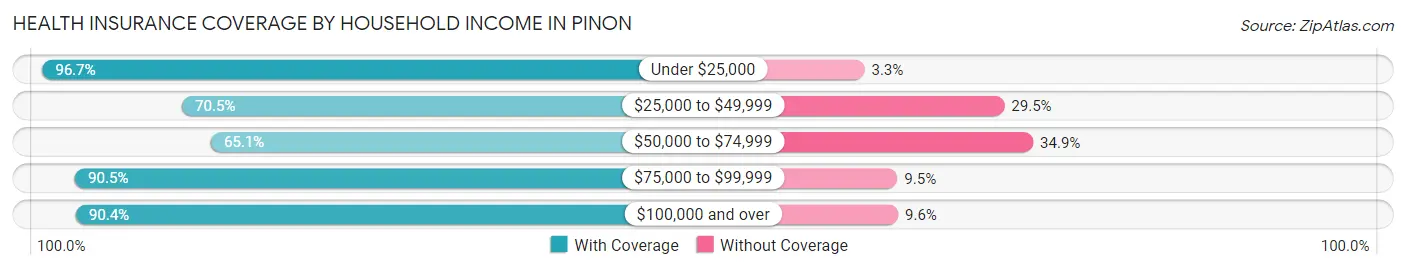
| Household Income | With Coverage | Without Coverage |
| Under $25,000 | 291 (96.7%) | 10 (3.3%) |
| $25,000 to $49,999 | 179 (70.5%) | 75 (29.5%) |
| $50,000 to $74,999 | 123 (65.1%) | 66 (34.9%) |
| $75,000 to $99,999 | 191 (90.5%) | 20 (9.5%) |
| $100,000 and over | 47 (90.4%) | 5 (9.6%) |
Public vs Private Health Insurance Coverage by Age in Pinon
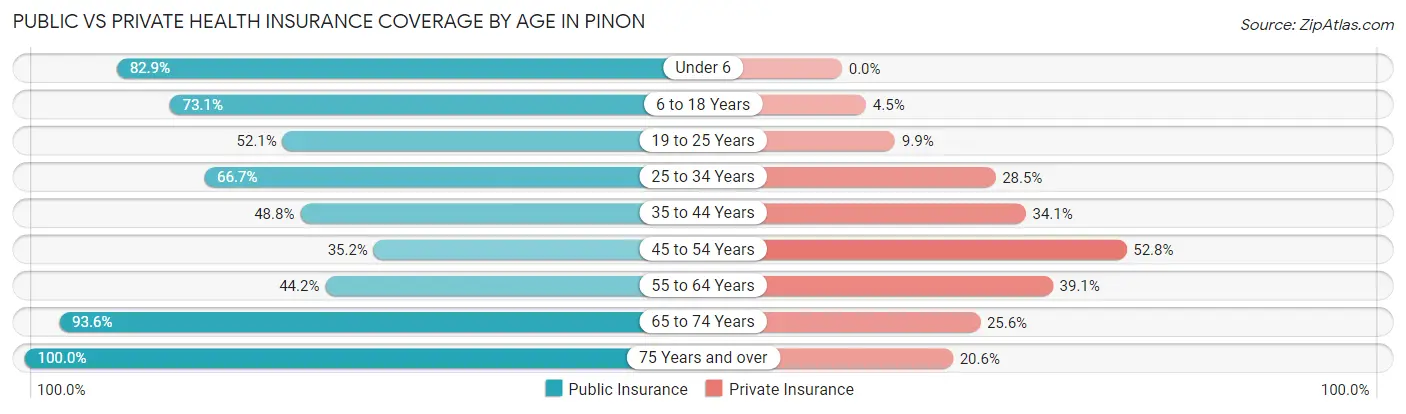
| Age Bracket | Public Insurance | Private Insurance |
| Under 6 | 63 (82.9%) | 0 (0.0%) |
| 6 to 18 Years | 163 (73.1%) | 10 (4.5%) |
| 19 to 25 Years | 37 (52.1%) | 7 (9.9%) |
| 25 to 34 Years | 96 (66.7%) | 41 (28.5%) |
| 35 to 44 Years | 63 (48.8%) | 44 (34.1%) |
| 45 to 54 Years | 44 (35.2%) | 66 (52.8%) |
| 55 to 64 Years | 61 (44.2%) | 54 (39.1%) |
| 65 to 74 Years | 73 (93.6%) | 20 (25.6%) |
| 75 Years and over | 34 (100.0%) | 7 (20.6%) |
| Total | 634 (62.3%) | 249 (24.5%) |
Disability Status by Sex by Age in Pinon
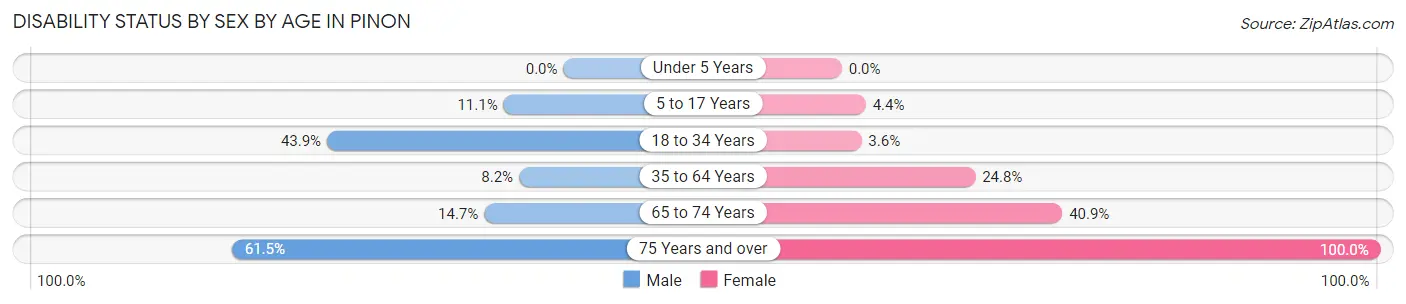
| Age Bracket | Male | Female |
| Under 5 Years | 0 (0.0%) | 0 (0.0%) |
| 5 to 17 Years | 11 (11.1%) | 4 (4.4%) |
| 18 to 34 Years | 61 (43.9%) | 4 (3.6%) |
| 35 to 64 Years | 15 (8.2%) | 52 (24.8%) |
| 65 to 74 Years | 5 (14.7%) | 18 (40.9%) |
| 75 Years and over | 8 (61.5%) | 21 (100.0%) |
Disability Class by Sex by Age in Pinon
Disability Class: Hearing Difficulty
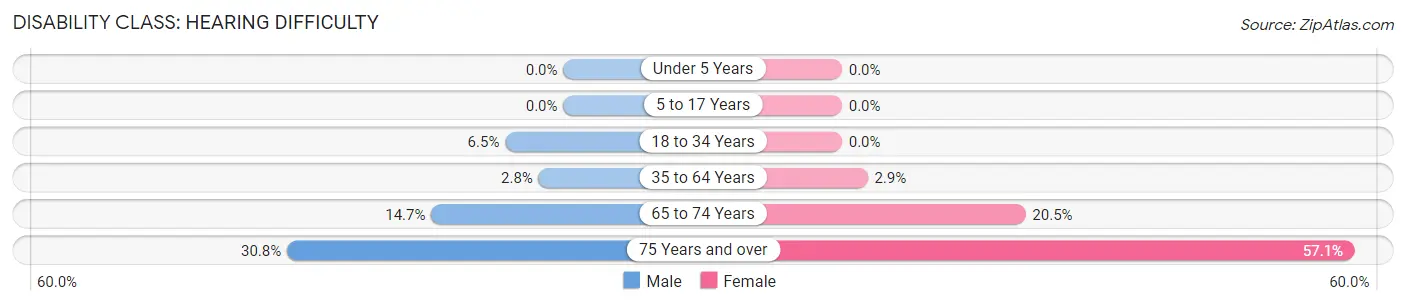
| Age Bracket | Male | Female |
| Under 5 Years | 0 (0.0%) | 0 (0.0%) |
| 5 to 17 Years | 0 (0.0%) | 0 (0.0%) |
| 18 to 34 Years | 9 (6.5%) | 0 (0.0%) |
| 35 to 64 Years | 5 (2.8%) | 6 (2.9%) |
| 65 to 74 Years | 5 (14.7%) | 9 (20.4%) |
| 75 Years and over | 4 (30.8%) | 12 (57.1%) |
Disability Class: Vision Difficulty
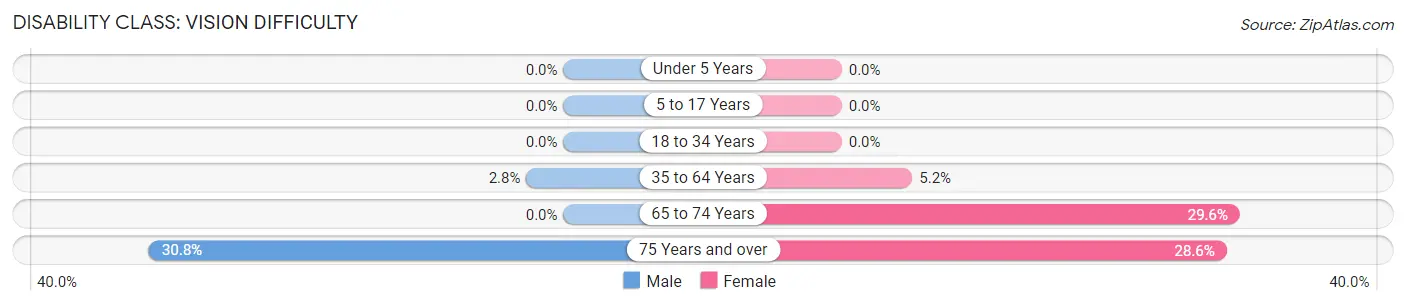
| Age Bracket | Male | Female |
| Under 5 Years | 0 (0.0%) | 0 (0.0%) |
| 5 to 17 Years | 0 (0.0%) | 0 (0.0%) |
| 18 to 34 Years | 0 (0.0%) | 0 (0.0%) |
| 35 to 64 Years | 5 (2.8%) | 11 (5.2%) |
| 65 to 74 Years | 0 (0.0%) | 13 (29.5%) |
| 75 Years and over | 4 (30.8%) | 6 (28.6%) |
Disability Class: Cognitive Difficulty
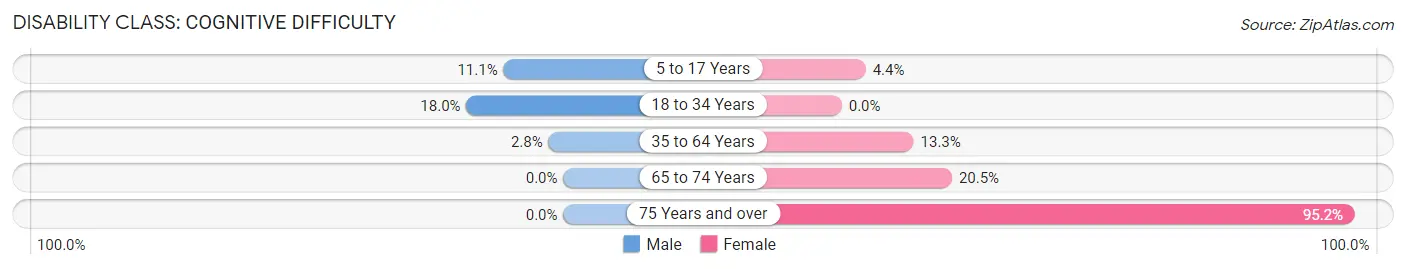
| Age Bracket | Male | Female |
| 5 to 17 Years | 11 (11.1%) | 4 (4.4%) |
| 18 to 34 Years | 25 (18.0%) | 0 (0.0%) |
| 35 to 64 Years | 5 (2.8%) | 28 (13.3%) |
| 65 to 74 Years | 0 (0.0%) | 9 (20.4%) |
| 75 Years and over | 0 (0.0%) | 20 (95.2%) |
Disability Class: Ambulatory Difficulty
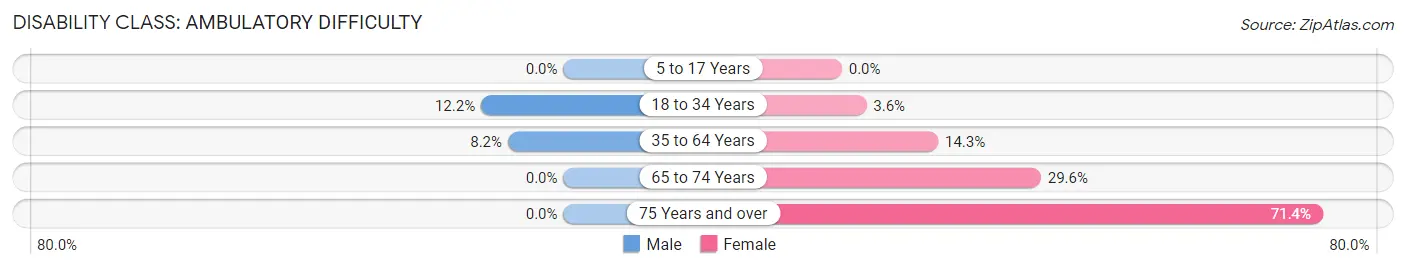
| Age Bracket | Male | Female |
| 5 to 17 Years | 0 (0.0%) | 0 (0.0%) |
| 18 to 34 Years | 17 (12.2%) | 4 (3.6%) |
| 35 to 64 Years | 15 (8.2%) | 30 (14.3%) |
| 65 to 74 Years | 0 (0.0%) | 13 (29.5%) |
| 75 Years and over | 0 (0.0%) | 15 (71.4%) |
Disability Class: Self-Care Difficulty
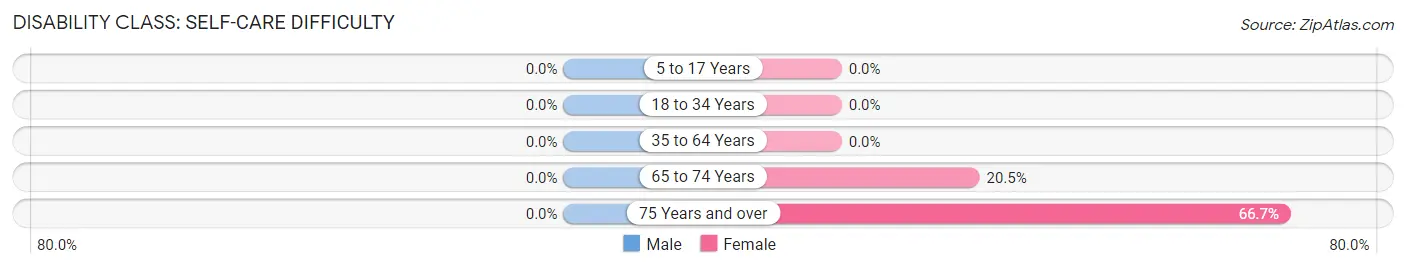
| Age Bracket | Male | Female |
| 5 to 17 Years | 0 (0.0%) | 0 (0.0%) |
| 18 to 34 Years | 0 (0.0%) | 0 (0.0%) |
| 35 to 64 Years | 0 (0.0%) | 0 (0.0%) |
| 65 to 74 Years | 0 (0.0%) | 9 (20.4%) |
| 75 Years and over | 0 (0.0%) | 14 (66.7%) |
Technology Access in Pinon
Computing Device Access in Pinon
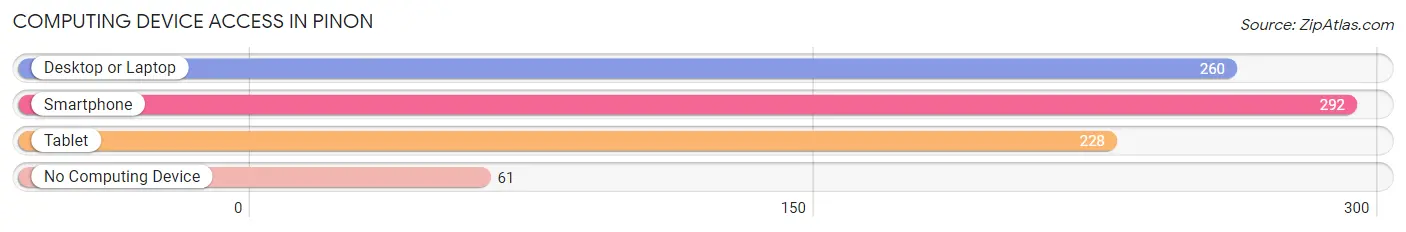
| Device Type | # Households | % Households |
| Desktop or Laptop | 260 | 70.3% |
| Smartphone | 292 | 78.9% |
| Tablet | 228 | 61.6% |
| No Computing Device | 61 | 16.5% |
| Total | 370 | 100.0% |
Internet Access in Pinon
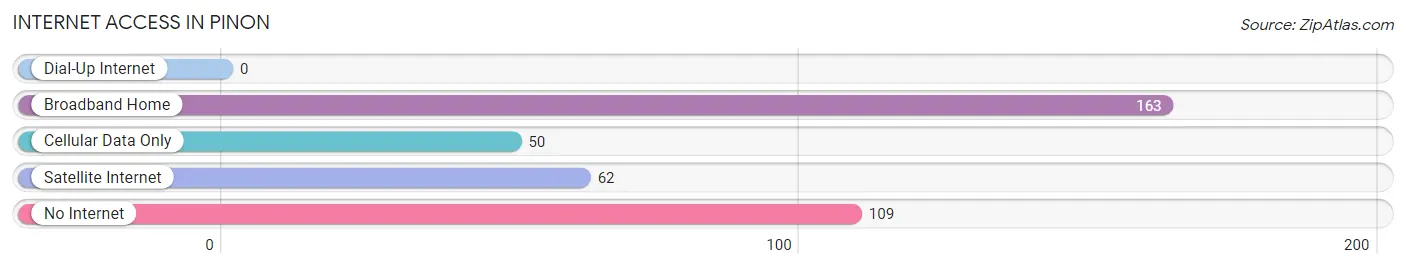
| Internet Type | # Households | % Households |
| Dial-Up Internet | 0 | 0.0% |
| Broadband Home | 163 | 44.1% |
| Cellular Data Only | 50 | 13.5% |
| Satellite Internet | 62 | 16.8% |
| No Internet | 109 | 29.5% |
| Total | 370 | 100.0% |
Pinon Summary
Pinon, Arizona is a small town located in Navajo County, Arizona. It is situated in the northeastern part of the state, approximately 30 miles south of the Utah border. The town is located in the heart of the Navajo Nation, the largest Native American reservation in the United States. Pinon is a rural community with a population of just over 1,000 people.
Geography
Pinon is located in the northeastern part of Arizona, in Navajo County. It is situated in the heart of the Navajo Nation, the largest Native American reservation in the United States. The town is located in the Four Corners region, where the states of Arizona, New Mexico, Colorado, and Utah meet. Pinon is surrounded by the Navajo Nation Reservation, which covers over 27,000 square miles. The town is located at an elevation of 5,400 feet, and the surrounding area is mostly flat desert terrain.
Economy
The economy of Pinon is largely based on agriculture and tourism. The town is home to several farms and ranches, which produce a variety of crops, including corn, alfalfa, and hay. The town is also home to several tourist attractions, including the Navajo Nation Museum, the Navajo National Monument, and the Monument Valley Navajo Tribal Park.
Demographics
As of the 2010 census, the population of Pinon was 1,072. The racial makeup of the town was 95.3% Native American, 2.2% White, 0.3% African American, 0.2% Asian, 0.1% Pacific Islander, and 1.9% from two or more races. The median age of the population was 28.7 years, and the median household income was $25,972.
History
Pinon was founded in the late 1800s by Navajo settlers. The town was originally known as “Pinon Springs”, and was named after the nearby Pinon Springs, which was a popular watering hole for the Navajo people. The town was officially incorporated in 1912, and the name was changed to Pinon.
In the early 1900s, the town was a popular stop for travelers on the Santa Fe Railroad. The town was also home to several trading posts, which served as a hub for trading between the Navajo people and the settlers.
In the 1950s, the town began to decline as the railroad stopped running and the trading posts closed. The town was revitalized in the 1970s, when the Navajo Nation opened the Navajo Nation Museum and the Monument Valley Navajo Tribal Park. Today, Pinon is a small, rural community with a population of just over 1,000 people.
Common Questions
What is Per Capita Income in Pinon?
Per Capita income in Pinon is $18,811.
What is the Median Family Income in Pinon?
Median Family Income in Pinon is $42,750.
What is the Median Household income in Pinon?
Median Household Income in Pinon is $42,750.
What is Income or Wage Gap in Pinon?
Income or Wage Gap in Pinon is 2.5%.
Women in Pinon earn 97.5 cents for every dollar earned by a man.
What is Family Income Deficit in Pinon?
Family Income Deficit in Pinon is $12,482.
Families that are below poverty line in Pinon earn $12,482 less on average than the poverty threshold level.
What is Inequality or Gini Index in Pinon?
Inequality or Gini Index in Pinon is 0.49.
What is the Total Population of Pinon?
Total Population of Pinon is 1,018.
What is the Total Male Population of Pinon?
Total Male Population of Pinon is 504.
What is the Total Female Population of Pinon?
Total Female Population of Pinon is 514.
What is the Ratio of Males per 100 Females in Pinon?
There are 98.05 Males per 100 Females in Pinon.
What is the Ratio of Females per 100 Males in Pinon?
There are 101.98 Females per 100 Males in Pinon.
What is the Median Population Age in Pinon?
Median Population Age in Pinon is 34.7 Years.
What is the Average Family Size in Pinon
Average Family Size in Pinon is 3.3 People.
What is the Average Household Size in Pinon
Average Household Size in Pinon is 2.7 People.
How Large is the Labor Force in Pinon?
There are 430 People in the Labor Forcein in Pinon.
What is the Percentage of People in the Labor Force in Pinon?
55.0% of People are in the Labor Force in Pinon.
What is the Unemployment Rate in Pinon?
Unemployment Rate in Pinon is 17.9%.