Peridot, AZ Map & Demographics
Peridot Map
Peridot Overview
$8,736
PER CAPITA INCOME
$41,765
AVG FAMILY INCOME
$40,074
AVG HOUSEHOLD INCOME
14.6%
WAGE / INCOME GAP [ % ]
85.4¢/ $1
WAGE / INCOME GAP [ $ ]
0.35
INEQUALITY / GINI INDEX
1,465
TOTAL POPULATION
682
MALE POPULATION
783
FEMALE POPULATION
87.10
MALES / 100 FEMALES
114.81
FEMALES / 100 MALES
25.9
MEDIAN AGE
5.4
AVG FAMILY SIZE
4.8
AVG HOUSEHOLD SIZE
374
LABOR FORCE [ PEOPLE ]
33.5%
PERCENT IN LABOR FORCE
40.6%
UNEMPLOYMENT RATE
Peridot Zip Codes
Peridot Area Codes
Income in Peridot
Income Overview in Peridot
Per Capita Income in Peridot is $8,736, while median incomes of families and households are $41,765 and $40,074 respectively.
| Characteristic | Number | Measure |
| Per Capita Income | 1,465 | $8,736 |
| Median Family Income | 260 | $41,765 |
| Mean Family Income | 260 | $40,885 |
| Median Household Income | 306 | $40,074 |
| Mean Household Income | 306 | $37,058 |
| Income Deficit | 260 | $0 |
| Wage / Income Gap (%) | 1,465 | 14.59% |
| Wage / Income Gap ($) | 1,465 | 85.41¢ per $1 |
| Gini / Inequality Index | 1,465 | 0.35 |
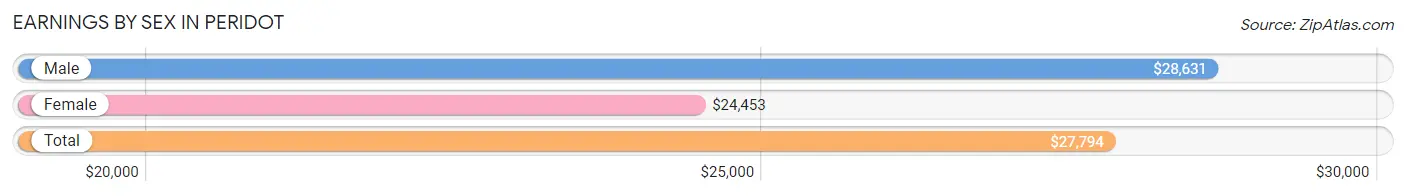
Earnings by Sex in Peridot
Average Earnings in Peridot are $27,794, $28,631 for men and $24,453 for women, a difference of 14.6%.
| Sex | Number | Average Earnings |
| Male | 119 (33.8%) | $28,631 |
| Female | 233 (66.2%) | $24,453 |
| Total | 352 (100.0%) | $27,794 |
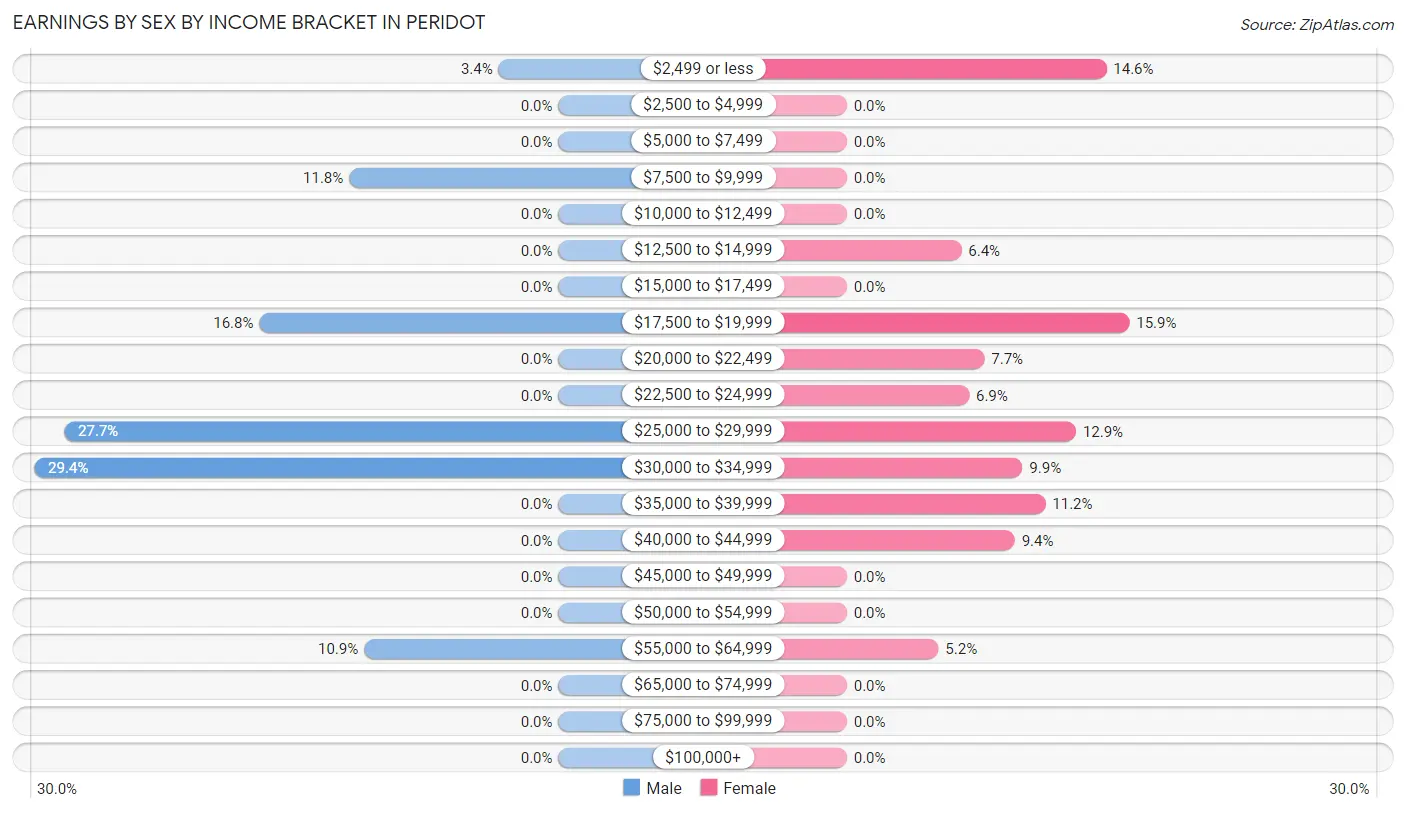
Earnings by Sex by Income Bracket in Peridot
The most common earnings brackets in Peridot are $30,000 to $34,999 for men (35 | 29.4%) and $17,500 to $19,999 for women (37 | 15.9%).
| Income | Male | Female |
| $2,499 or less | 4 (3.4%) | 34 (14.6%) |
| $2,500 to $4,999 | 0 (0.0%) | 0 (0.0%) |
| $5,000 to $7,499 | 0 (0.0%) | 0 (0.0%) |
| $7,500 to $9,999 | 14 (11.8%) | 0 (0.0%) |
| $10,000 to $12,499 | 0 (0.0%) | 0 (0.0%) |
| $12,500 to $14,999 | 0 (0.0%) | 15 (6.4%) |
| $15,000 to $17,499 | 0 (0.0%) | 0 (0.0%) |
| $17,500 to $19,999 | 20 (16.8%) | 37 (15.9%) |
| $20,000 to $22,499 | 0 (0.0%) | 18 (7.7%) |
| $22,500 to $24,999 | 0 (0.0%) | 16 (6.9%) |
| $25,000 to $29,999 | 33 (27.7%) | 30 (12.9%) |
| $30,000 to $34,999 | 35 (29.4%) | 23 (9.9%) |
| $35,000 to $39,999 | 0 (0.0%) | 26 (11.2%) |
| $40,000 to $44,999 | 0 (0.0%) | 22 (9.4%) |
| $45,000 to $49,999 | 0 (0.0%) | 0 (0.0%) |
| $50,000 to $54,999 | 0 (0.0%) | 0 (0.0%) |
| $55,000 to $64,999 | 13 (10.9%) | 12 (5.1%) |
| $65,000 to $74,999 | 0 (0.0%) | 0 (0.0%) |
| $75,000 to $99,999 | 0 (0.0%) | 0 (0.0%) |
| $100,000+ | 0 (0.0%) | 0 (0.0%) |
| Total | 119 (100.0%) | 233 (100.0%) |
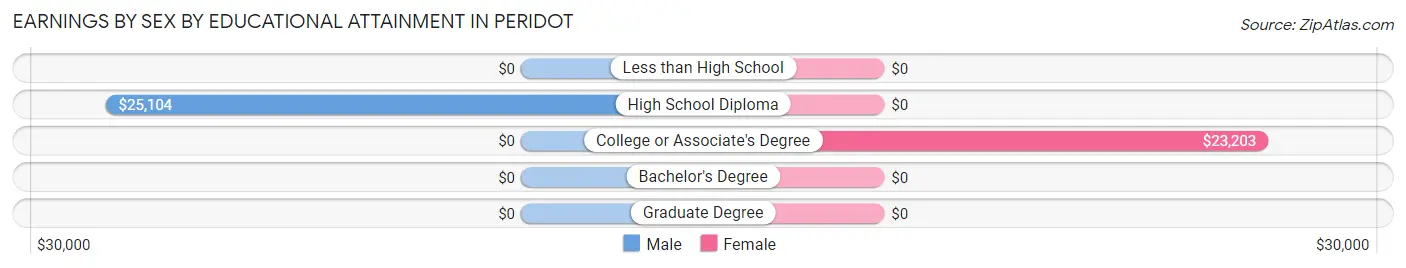
Earnings by Sex by Educational Attainment in Peridot
Average earnings in Peridot are $27,679 for men and $21,111 for women, a difference of 23.7%. Men with an educational attainment of high school diploma enjoy the highest average annual earnings of $25,104, while those with high school diploma education earn the least with $25,104. Women with an educational attainment of college or associate's degree earn the most with the average annual earnings of $23,203, while those with college or associate's degree education have the smallest earnings of $23,203.
| Educational Attainment | Male Income | Female Income |
| Less than High School | - | - |
| High School Diploma | $25,104 | $0 |
| College or Associate's Degree | - | - |
| Bachelor's Degree | - | - |
| Graduate Degree | - | - |
| Total | $27,679 | $21,111 |
Family Income in Peridot
Family Income Brackets in Peridot
According to the Peridot family income data, there are 92 families falling into the $35,000 to $49,999 income range, which is the most common income bracket and makes up 35.4% of all families.
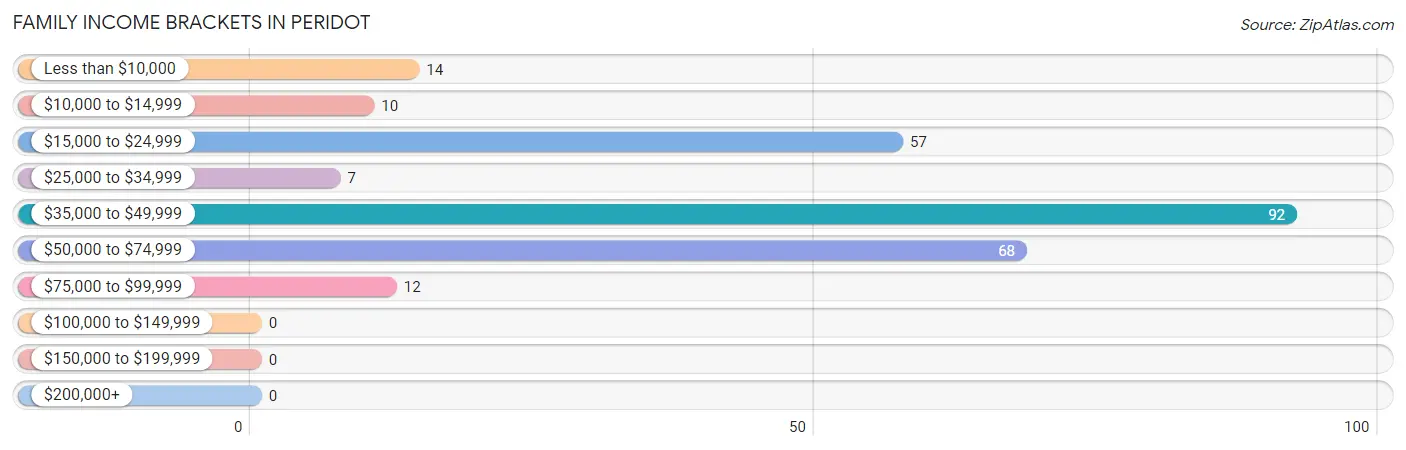
| Income Bracket | # Families | % Families |
| Less than $10,000 | 14 | 5.4% |
| $10,000 to $14,999 | 10 | 3.8% |
| $15,000 to $24,999 | 57 | 21.9% |
| $25,000 to $34,999 | 7 | 2.7% |
| $35,000 to $49,999 | 92 | 35.4% |
| $50,000 to $74,999 | 68 | 26.2% |
| $75,000 to $99,999 | 12 | 4.6% |
| $100,000 to $149,999 | 0 | 0.0% |
| $150,000 to $199,999 | 0 | 0.0% |
| $200,000+ | 0 | 0.0% |
Family Income by Famaliy Size in Peridot
5-person families (37 | 14.2%) account for the highest median family income in Peridot with $54,432 per family, while 3-person families (69 | 26.5%) have the highest median income of $14,299 per family member.
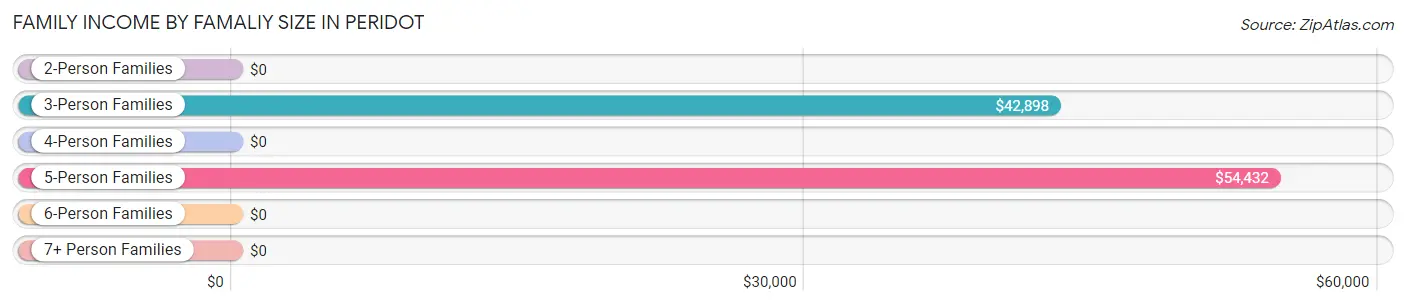
| Income Bracket | # Families | Median Income |
| 2-Person Families | 58 (22.3%) | $0 |
| 3-Person Families | 69 (26.5%) | $42,898 |
| 4-Person Families | 13 (5.0%) | $0 |
| 5-Person Families | 37 (14.2%) | $54,432 |
| 6-Person Families | 39 (15.0%) | $0 |
| 7+ Person Families | 44 (16.9%) | $0 |
| Total | 260 (100.0%) | $41,765 |
Family Income by Number of Earners in Peridot
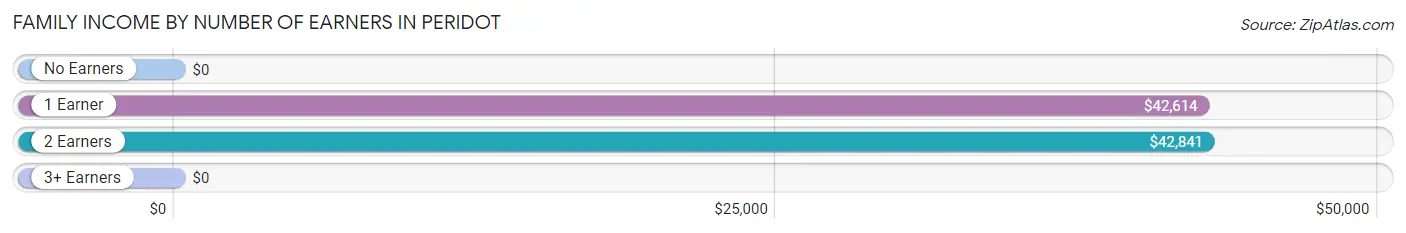
| Number of Earners | # Families | Median Income |
| No Earners | 88 (33.9%) | $0 |
| 1 Earner | 93 (35.8%) | $42,614 |
| 2 Earners | 51 (19.6%) | $42,841 |
| 3+ Earners | 28 (10.8%) | $0 |
| Total | 260 (100.0%) | $41,765 |
Household Income in Peridot
Household Income Brackets in Peridot
With 92 households falling in the category, the $35,000 to $49,999 income range is the most frequent in Peridot, accounting for 30.1% of all households.
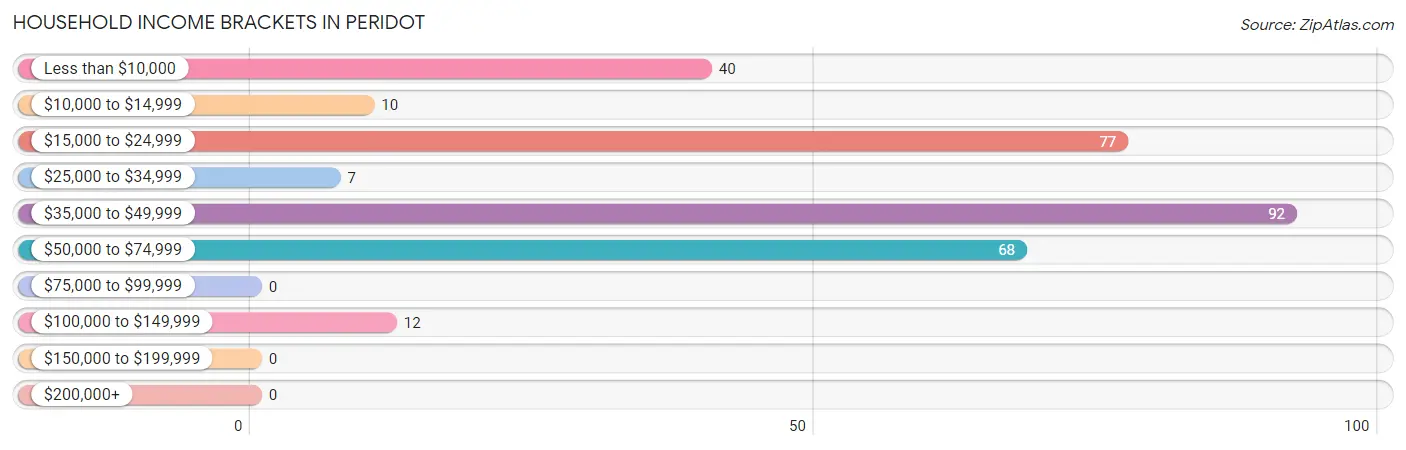
| Income Bracket | # Households | % Households |
| Less than $10,000 | 40 | 13.1% |
| $10,000 to $14,999 | 10 | 3.3% |
| $15,000 to $24,999 | 77 | 25.2% |
| $25,000 to $34,999 | 7 | 2.3% |
| $35,000 to $49,999 | 92 | 30.1% |
| $50,000 to $74,999 | 68 | 22.2% |
| $75,000 to $99,999 | 0 | 0.0% |
| $100,000 to $149,999 | 12 | 3.9% |
| $150,000 to $199,999 | 0 | 0.0% |
| $200,000+ | 0 | 0.0% |
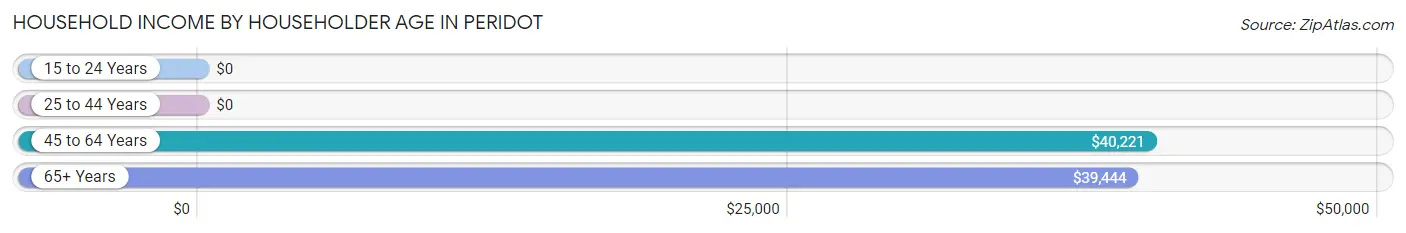
Household Income by Householder Age in Peridot
The median household income in Peridot is $40,074, with the highest median household income of $40,221 found in the 45 to 64 years age bracket for the primary householder. A total of 132 households (43.1%) fall into this category. Meanwhile, the 15 to 24 years age bracket for the primary householder has the lowest median household income of $0, with 16 households (5.2%) in this group.
| Income Bracket | # Households | Median Income |
| 15 to 24 Years | 16 (5.2%) | $0 |
| 25 to 44 Years | 82 (26.8%) | $0 |
| 45 to 64 Years | 132 (43.1%) | $40,221 |
| 65+ Years | 76 (24.8%) | $39,444 |
| Total | 306 (100.0%) | $40,074 |
Poverty in Peridot
Income Below Poverty by Sex and Age in Peridot
With 39.6% poverty level for males and 31.9% for females among the residents of Peridot, 35 to 44 year old males and 5 year old females are the most vulnerable to poverty, with 56 males (81.2%) and 8 females (100.0%) in their respective age groups living below the poverty level.
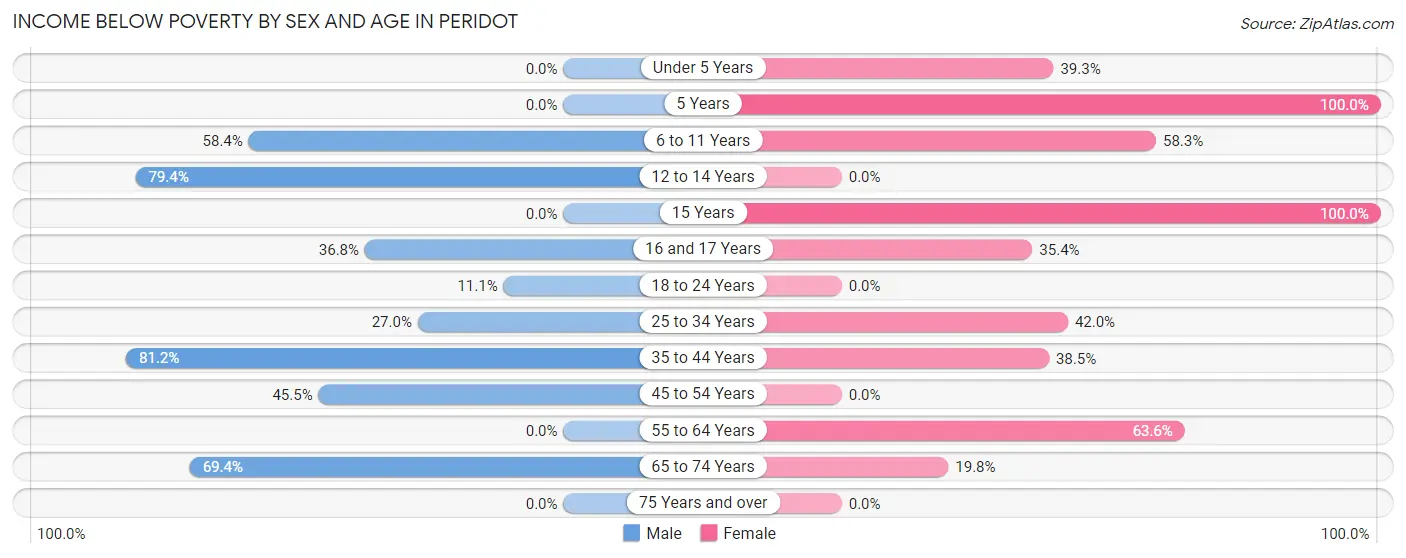
| Age Bracket | Male | Female |
| Under 5 Years | 0 (0.0%) | 22 (39.3%) |
| 5 Years | 0 (0.0%) | 8 (100.0%) |
| 6 to 11 Years | 59 (58.4%) | 28 (58.3%) |
| 12 to 14 Years | 54 (79.4%) | 0 (0.0%) |
| 15 Years | 0 (0.0%) | 14 (100.0%) |
| 16 and 17 Years | 14 (36.8%) | 23 (35.4%) |
| 18 to 24 Years | 14 (11.1%) | 0 (0.0%) |
| 25 to 34 Years | 20 (27.0%) | 55 (42.0%) |
| 35 to 44 Years | 56 (81.2%) | 40 (38.5%) |
| 45 to 54 Years | 10 (45.5%) | 0 (0.0%) |
| 55 to 64 Years | 0 (0.0%) | 42 (63.6%) |
| 65 to 74 Years | 43 (69.4%) | 18 (19.8%) |
| 75 Years and over | 0 (0.0%) | 0 (0.0%) |
| Total | 270 (39.6%) | 250 (31.9%) |
Income Above Poverty by Sex and Age in Peridot
According to the poverty statistics in Peridot, males aged under 5 years and females aged 12 to 14 years are the age groups that are most secure financially, with 100.0% of males and 100.0% of females in these age groups living above the poverty line.
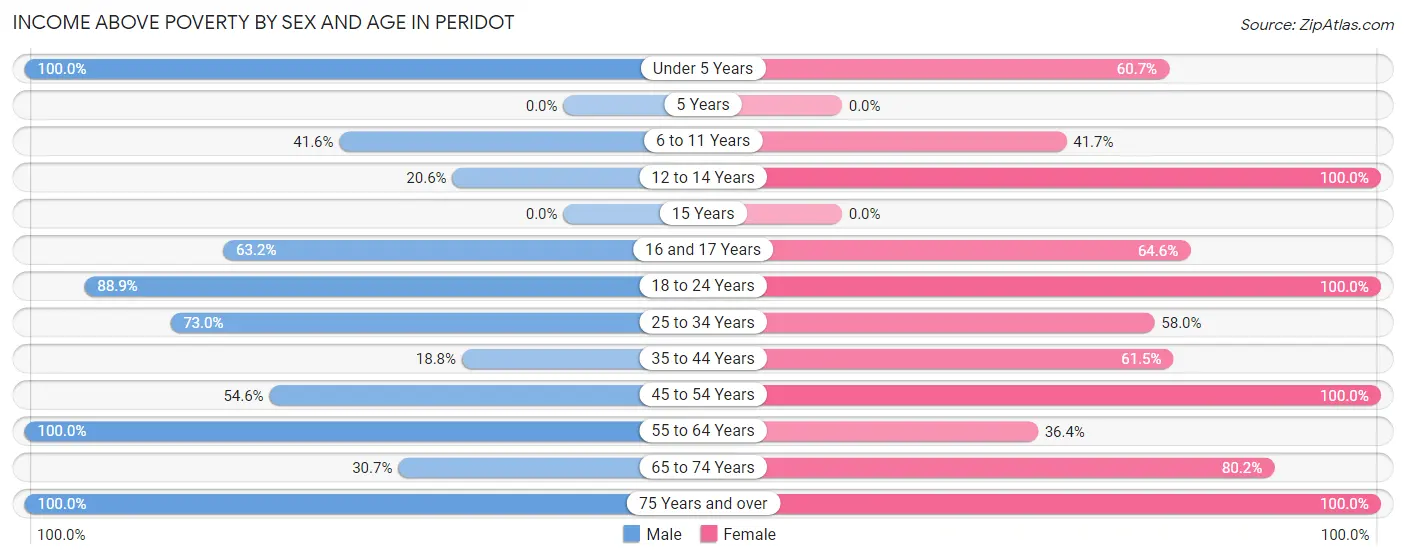
| Age Bracket | Male | Female |
| Under 5 Years | 45 (100.0%) | 34 (60.7%) |
| 5 Years | 0 (0.0%) | 0 (0.0%) |
| 6 to 11 Years | 42 (41.6%) | 20 (41.7%) |
| 12 to 14 Years | 14 (20.6%) | 10 (100.0%) |
| 15 Years | 0 (0.0%) | 0 (0.0%) |
| 16 and 17 Years | 24 (63.2%) | 42 (64.6%) |
| 18 to 24 Years | 112 (88.9%) | 100 (100.0%) |
| 25 to 34 Years | 54 (73.0%) | 76 (58.0%) |
| 35 to 44 Years | 13 (18.8%) | 64 (61.5%) |
| 45 to 54 Years | 12 (54.5%) | 45 (100.0%) |
| 55 to 64 Years | 59 (100.0%) | 24 (36.4%) |
| 65 to 74 Years | 19 (30.6%) | 73 (80.2%) |
| 75 Years and over | 18 (100.0%) | 45 (100.0%) |
| Total | 412 (60.4%) | 533 (68.1%) |
Income Below Poverty Among Married-Couple Families in Peridot
The poverty statistics for married-couple families in Peridot show that 35.6% or 48 of the total 135 families live below the poverty line. Families with 3 or 4 children have the highest poverty rate of 100.0%, comprising of 24 families. On the other hand, families with 1 or 2 children have the lowest poverty rate of 0.0%, which includes 0 families.
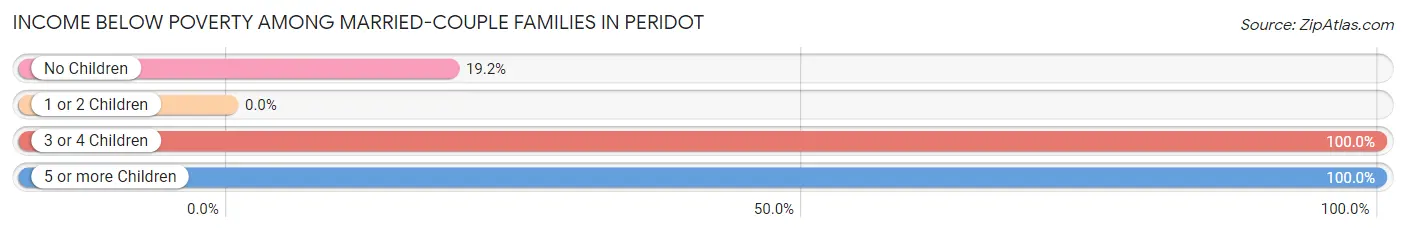
| Children | Above Poverty | Below Poverty |
| No Children | 42 (80.8%) | 10 (19.2%) |
| 1 or 2 Children | 45 (100.0%) | 0 (0.0%) |
| 3 or 4 Children | 0 (0.0%) | 24 (100.0%) |
| 5 or more Children | 0 (0.0%) | 14 (100.0%) |
| Total | 87 (64.4%) | 48 (35.6%) |
Income Below Poverty Among Single-Parent Households in Peridot
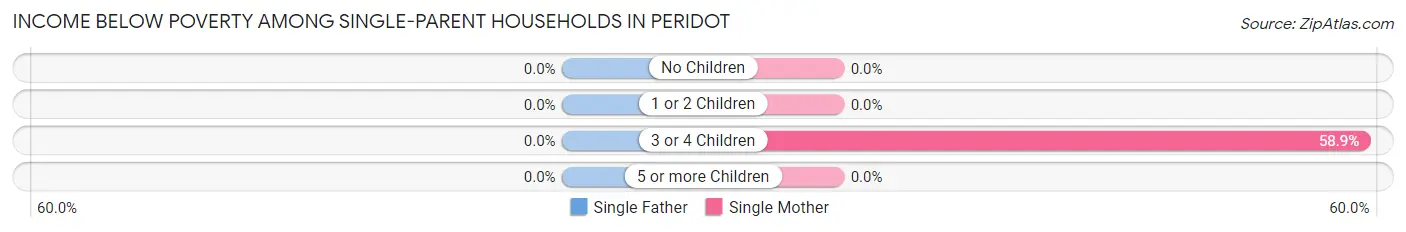
| Children | Single Father | Single Mother |
| No Children | 0 (0.0%) | 0 (0.0%) |
| 1 or 2 Children | 0 (0.0%) | 0 (0.0%) |
| 3 or 4 Children | 0 (0.0%) | 33 (58.9%) |
| 5 or more Children | 0 (0.0%) | 0 (0.0%) |
| Total | 0 (0.0%) | 33 (30.8%) |
Income Below Poverty Among Married-Couple vs Single-Parent Households in Peridot
The poverty data for Peridot shows that 48 of the married-couple family households (35.6%) and 33 of the single-parent households (26.4%) are living below the poverty level. Within the married-couple family households, those with 3 or 4 children have the highest poverty rate, with 24 households (100.0%) falling below the poverty line. Among the single-parent households, those with 3 or 4 children have the highest poverty rate, with 33 household (58.9%) living below poverty.
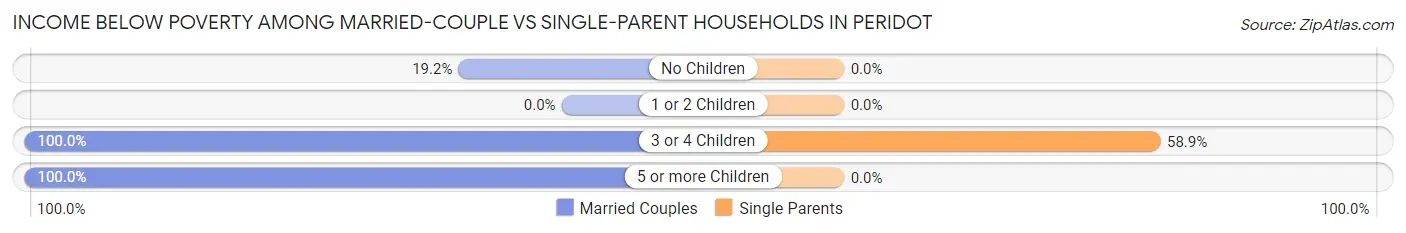
| Children | Married-Couple Families | Single-Parent Households |
| No Children | 10 (19.2%) | 0 (0.0%) |
| 1 or 2 Children | 0 (0.0%) | 0 (0.0%) |
| 3 or 4 Children | 24 (100.0%) | 33 (58.9%) |
| 5 or more Children | 14 (100.0%) | 0 (0.0%) |
| Total | 48 (35.6%) | 33 (26.4%) |
Race in Peridot
The most populous races in Peridot are Native / Alaskan (1,308 | 89.3%), Hispanic or Latino (88 | 6.0%), and Two or more Races (88 | 6.0%).
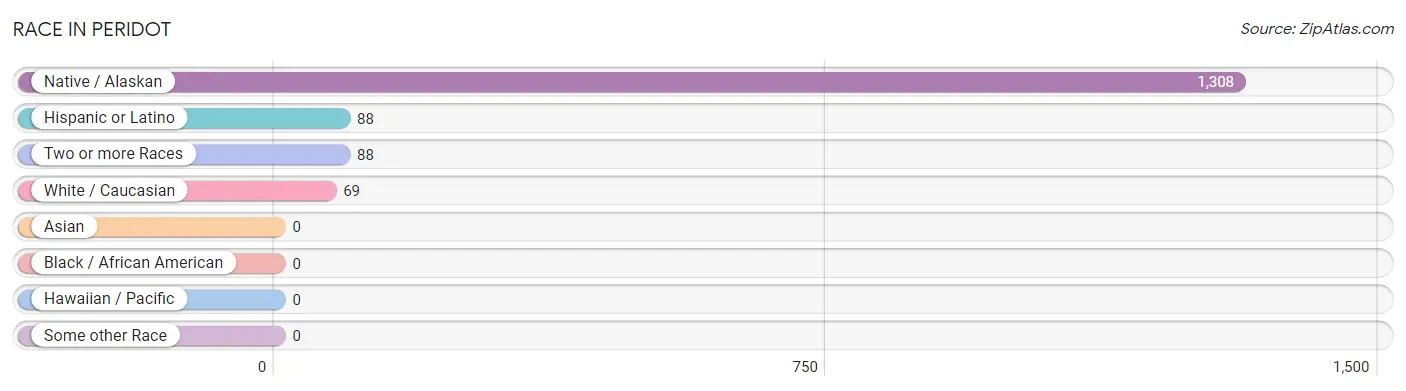
| Race | # Population | % Population |
| Asian | 0 | 0.0% |
| Black / African American | 0 | 0.0% |
| Hawaiian / Pacific | 0 | 0.0% |
| Hispanic or Latino | 88 | 6.0% |
| Native / Alaskan | 1,308 | 89.3% |
| White / Caucasian | 69 | 4.7% |
| Two or more Races | 88 | 6.0% |
| Some other Race | 0 | 0.0% |
| Total | 1,465 | 100.0% |
Ancestry in Peridot
The most populous ancestries reported in Peridot are Apache (1,380 | 94.2%), Mexican (88 | 6.0%), German (69 | 4.7%), Pima (45 | 3.1%), and Serbian (43 | 2.9%), together accounting for 110.9% of all Peridot residents.
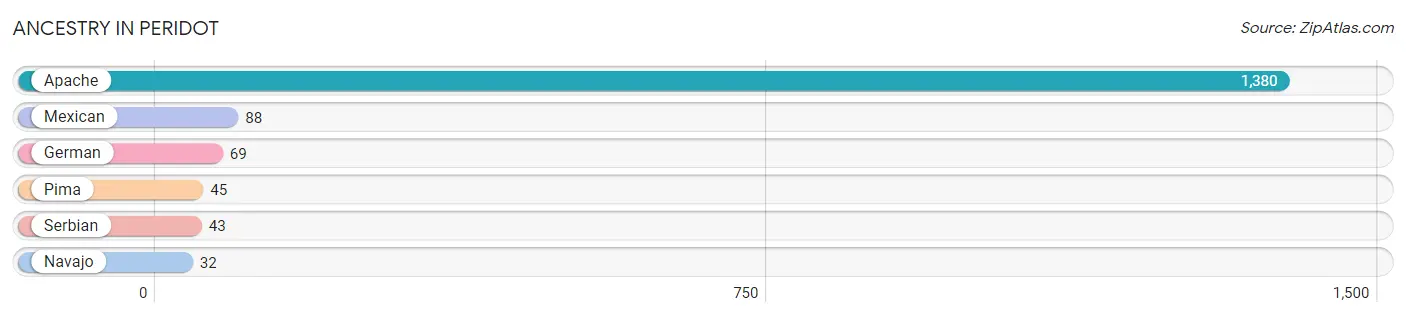
| Ancestry | # Population | % Population |
| Apache | 1,380 | 94.2% |
| German | 69 | 4.7% |
| Mexican | 88 | 6.0% |
| Navajo | 32 | 2.2% |
| Pima | 45 | 3.1% |
| Serbian | 43 | 2.9% | View All 6 Rows |
Immigrants in Peridot

| Immigration Origin | # Population | % Population | View All 0 Rows |
Sex and Age in Peridot
Sex and Age in Peridot
The most populous age groups in Peridot are 20 to 24 Years (126 | 18.5%) for men and 15 to 19 Years (134 | 17.1%) for women.
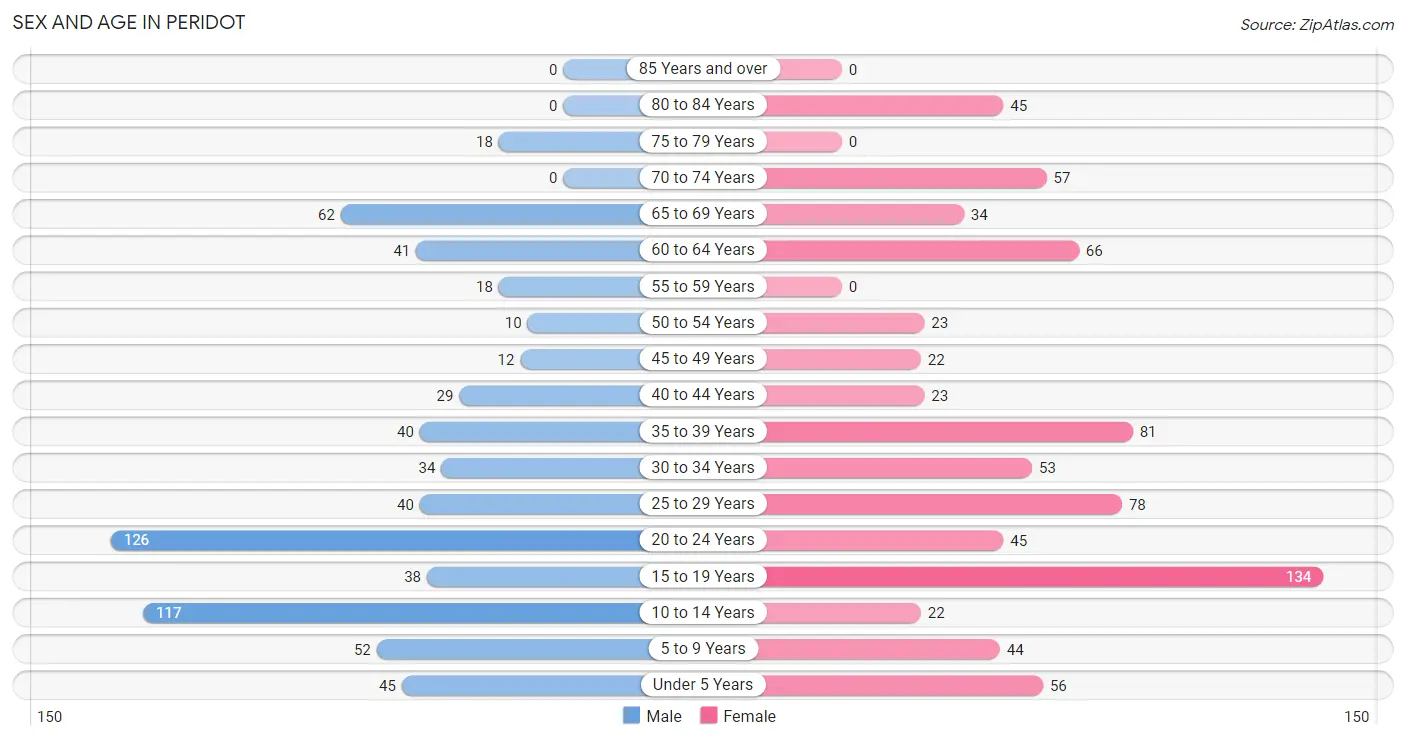
| Age Bracket | Male | Female |
| Under 5 Years | 45 (6.6%) | 56 (7.1%) |
| 5 to 9 Years | 52 (7.6%) | 44 (5.6%) |
| 10 to 14 Years | 117 (17.2%) | 22 (2.8%) |
| 15 to 19 Years | 38 (5.6%) | 134 (17.1%) |
| 20 to 24 Years | 126 (18.5%) | 45 (5.8%) |
| 25 to 29 Years | 40 (5.9%) | 78 (10.0%) |
| 30 to 34 Years | 34 (5.0%) | 53 (6.8%) |
| 35 to 39 Years | 40 (5.9%) | 81 (10.3%) |
| 40 to 44 Years | 29 (4.3%) | 23 (2.9%) |
| 45 to 49 Years | 12 (1.8%) | 22 (2.8%) |
| 50 to 54 Years | 10 (1.5%) | 23 (2.9%) |
| 55 to 59 Years | 18 (2.6%) | 0 (0.0%) |
| 60 to 64 Years | 41 (6.0%) | 66 (8.4%) |
| 65 to 69 Years | 62 (9.1%) | 34 (4.3%) |
| 70 to 74 Years | 0 (0.0%) | 57 (7.3%) |
| 75 to 79 Years | 18 (2.6%) | 0 (0.0%) |
| 80 to 84 Years | 0 (0.0%) | 45 (5.8%) |
| 85 Years and over | 0 (0.0%) | 0 (0.0%) |
| Total | 682 (100.0%) | 783 (100.0%) |
Families and Households in Peridot
Median Family Size in Peridot
The median family size in Peridot is 5.36 persons per family, with single female/mother families (107 | 41.1%) accounting for the largest median family size of 7.15 persons per family. On the other hand, single male/father families (18 | 6.9%) represent the smallest median family size with 1.78 persons per family.
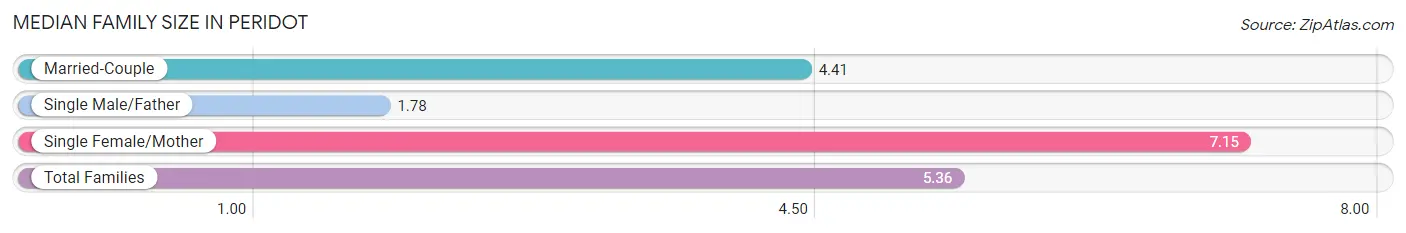
| Family Type | # Families | Family Size |
| Married-Couple | 135 (51.9%) | 4.41 |
| Single Male/Father | 18 (6.9%) | 1.78 |
| Single Female/Mother | 107 (41.1%) | 7.15 |
| Total Families | 260 (100.0%) | 5.36 |
Median Household Size in Peridot
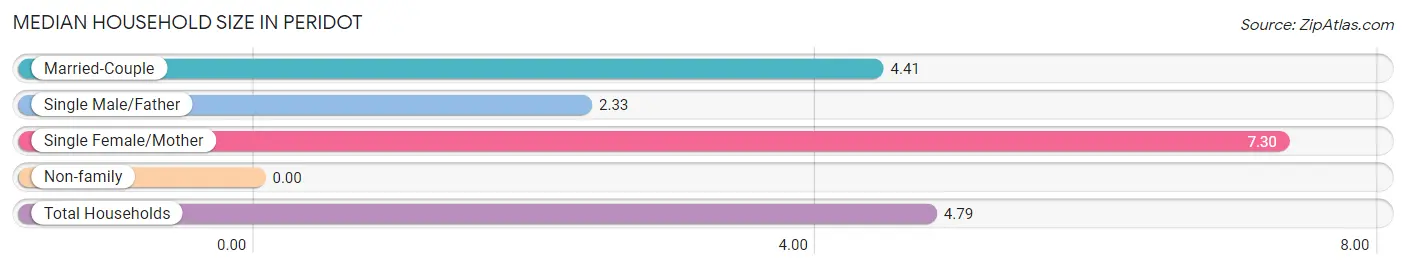
| Household Type | # Households | Household Size |
| Married-Couple | 135 (44.1%) | 4.41 |
| Single Male/Father | 18 (5.9%) | 2.33 |
| Single Female/Mother | 107 (35.0%) | 7.30 |
| Non-family | 46 (15.0%) | - |
| Total Households | 306 (100.0%) | 4.79 |
Household Size by Marriage Status in Peridot
Out of a total of 306 households in Peridot, 260 (85.0%) are family households, while 46 (15.0%) are nonfamily households. The most numerous type of family households are 3-person households, comprising 87, and the most common type of nonfamily households are 1-person households, comprising 46.
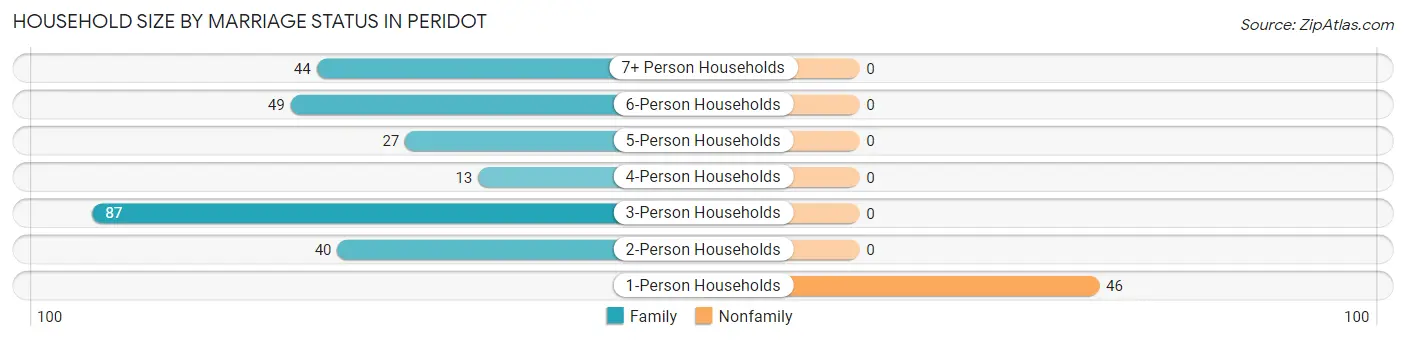
| Household Size | Family Households | Nonfamily Households |
| 1-Person Households | - | 46 (15.0%) |
| 2-Person Households | 40 (13.1%) | 0 (0.0%) |
| 3-Person Households | 87 (28.4%) | 0 (0.0%) |
| 4-Person Households | 13 (4.3%) | 0 (0.0%) |
| 5-Person Households | 27 (8.8%) | 0 (0.0%) |
| 6-Person Households | 49 (16.0%) | 0 (0.0%) |
| 7+ Person Households | 44 (14.4%) | 0 (0.0%) |
| Total | 260 (85.0%) | 46 (15.0%) |
Female Fertility in Peridot
Fertility by Age in Peridot
Average fertility rate in Peridot is 44.0 births per 1,000 women. Women in the age bracket of 20 to 34 years have the highest fertility rate with 108.0 births per 1,000 women. Women in the age bracket of 20 to 34 years acount for 100.0% of all women with births.
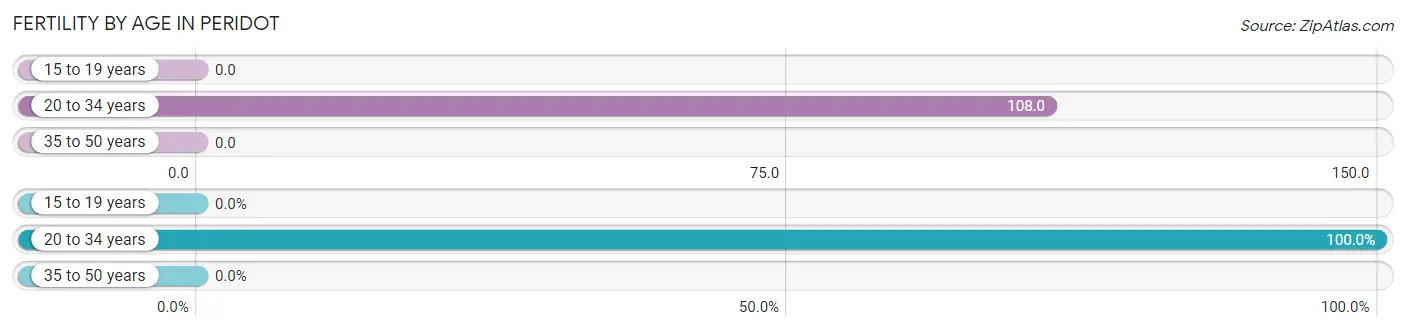
| Age Bracket | Women with Births | Births / 1,000 Women |
| 15 to 19 years | 0 (0.0%) | 0.0 |
| 20 to 34 years | 19 (100.0%) | 108.0 |
| 35 to 50 years | 0 (0.0%) | 0.0 |
| Total | 19 (100.0%) | 44.0 |
Fertility by Age by Marriage Status in Peridot
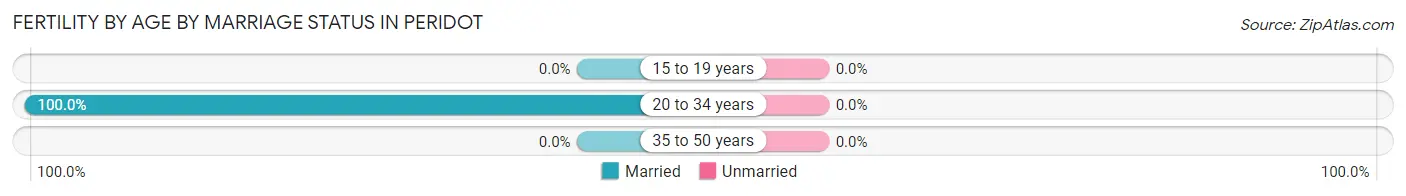
| Age Bracket | Married | Unmarried |
| 15 to 19 years | 0 (0.0%) | 0 (0.0%) |
| 20 to 34 years | 19 (100.0%) | 0 (0.0%) |
| 35 to 50 years | 0 (0.0%) | 0 (0.0%) |
| Total | 19 (100.0%) | 0 (0.0%) |
Fertility by Education in Peridot
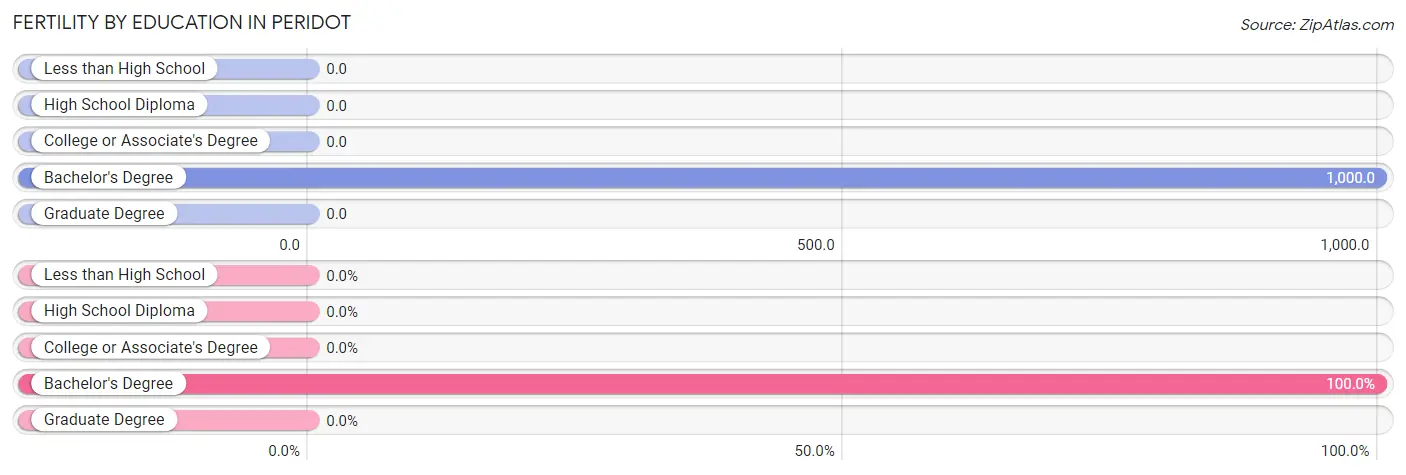
| Educational Attainment | Women with Births | Births / 1,000 Women |
| Less than High School | 0 (0.0%) | 0.0 |
| High School Diploma | 0 (0.0%) | 0.0 |
| College or Associate's Degree | 0 (0.0%) | 0.0 |
| Bachelor's Degree | 19 (100.0%) | 1,000.0 |
| Graduate Degree | 0 (0.0%) | 0.0 |
| Total | 19 (100.0%) | 44.0 |
Fertility by Education by Marriage Status in Peridot
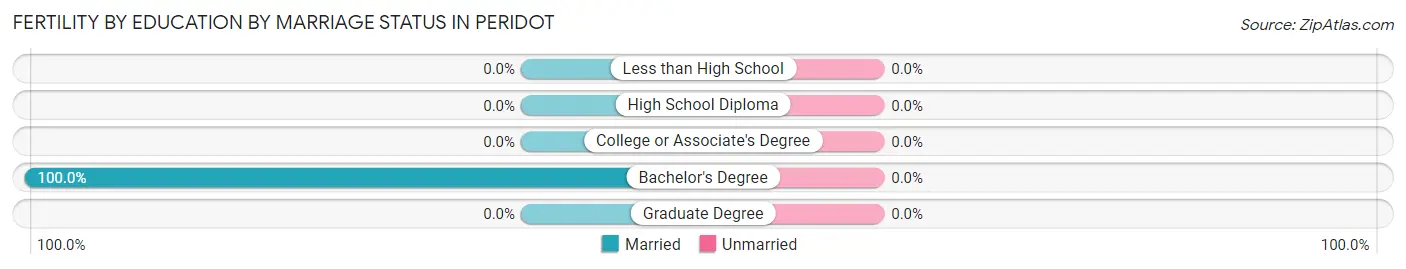
| Educational Attainment | Married | Unmarried |
| Less than High School | 0 (0.0%) | 0 (0.0%) |
| High School Diploma | 0 (0.0%) | 0 (0.0%) |
| College or Associate's Degree | 0 (0.0%) | 0 (0.0%) |
| Bachelor's Degree | 19 (100.0%) | 0 (0.0%) |
| Graduate Degree | 0 (0.0%) | 0 (0.0%) |
| Total | 19 (100.0%) | 0 (0.0%) |
Employment Characteristics in Peridot
Employment by Class of Employer in Peridot
Among the 222 employed individuals in Peridot, local government employees (124 | 55.9%), private company employees (70 | 31.5%), and not-for-profit organizations (16 | 7.2%) make up the most common classes of employment.
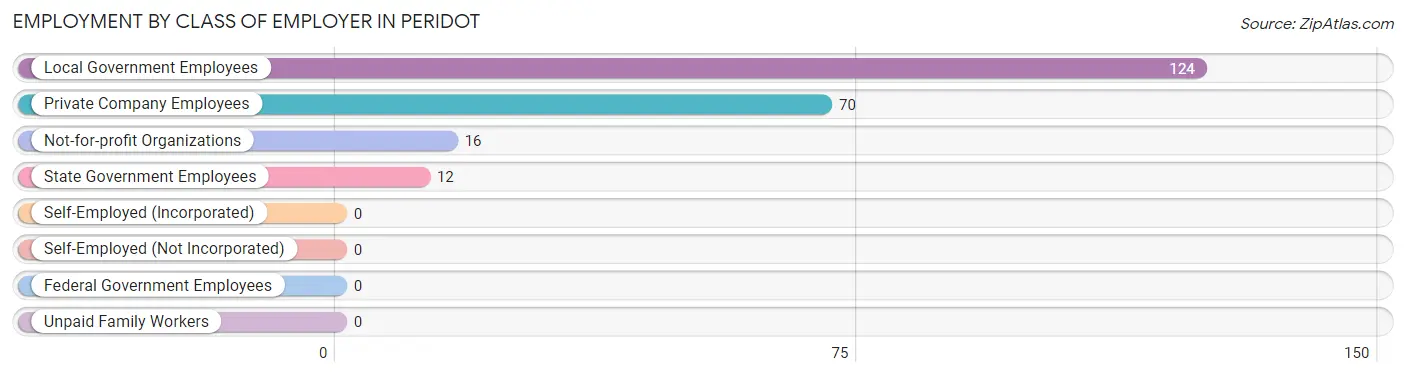
| Employer Class | # Employees | % Employees |
| Private Company Employees | 70 | 31.5% |
| Self-Employed (Incorporated) | 0 | 0.0% |
| Self-Employed (Not Incorporated) | 0 | 0.0% |
| Not-for-profit Organizations | 16 | 7.2% |
| Local Government Employees | 124 | 55.9% |
| State Government Employees | 12 | 5.4% |
| Federal Government Employees | 0 | 0.0% |
| Unpaid Family Workers | 0 | 0.0% |
| Total | 222 | 100.0% |
Employment Status by Age in Peridot
According to the labor force statistics for Peridot, out of the total population over 16 years of age (1,115), 33.5% or 374 individuals are in the labor force, with 40.6% or 152 of them unemployed. The age group with the highest labor force participation rate is 45 to 54 years, with 100.0% or 67 individuals in the labor force. Within the labor force, the 30 to 34 years age range has the highest percentage of unemployed individuals, with 100.0% or 14 of them being unemployed.
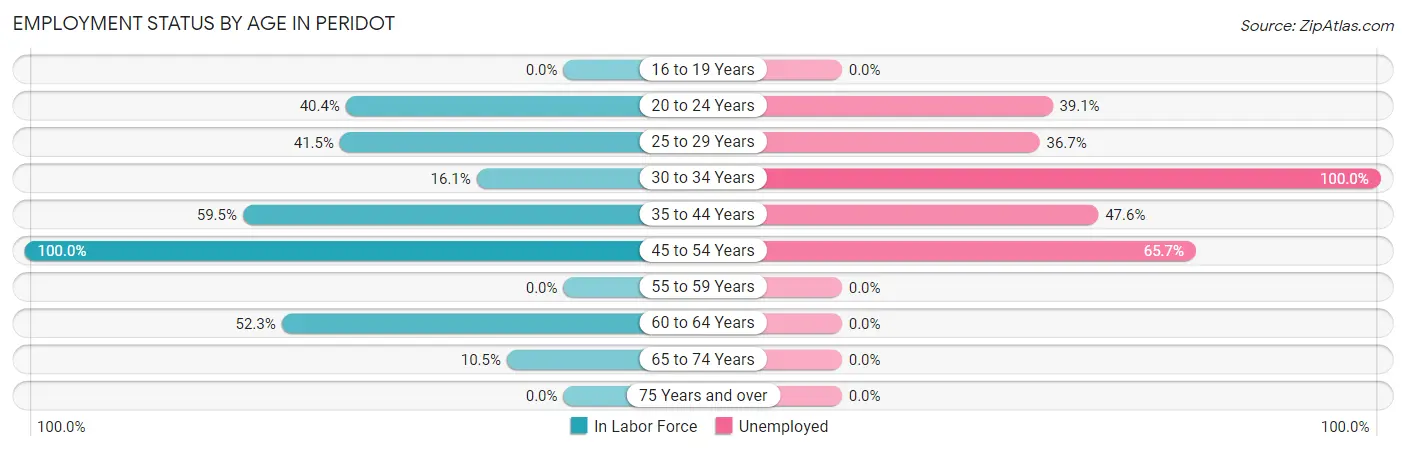
| Age Bracket | In Labor Force | Unemployed |
| 16 to 19 Years | 0 (0.0%) | 0 (0.0%) |
| 20 to 24 Years | 69 (40.4%) | 27 (39.1%) |
| 25 to 29 Years | 49 (41.5%) | 18 (36.7%) |
| 30 to 34 Years | 14 (16.1%) | 14 (100.0%) |
| 35 to 44 Years | 103 (59.5%) | 49 (47.6%) |
| 45 to 54 Years | 67 (100.0%) | 44 (65.7%) |
| 55 to 59 Years | 0 (0.0%) | 0 (0.0%) |
| 60 to 64 Years | 56 (52.3%) | 0 (0.0%) |
| 65 to 74 Years | 16 (10.5%) | 0 (0.0%) |
| 75 Years and over | 0 (0.0%) | 0 (0.0%) |
| Total | 374 (33.5%) | 152 (40.6%) |
Employment Status by Educational Attainment in Peridot
According to labor force statistics for Peridot, 50.7% of individuals (289) out of the total population between 25 and 64 years of age (570) are in the labor force, with 43.3% or 125 of them being unemployed. The group with the highest labor force participation rate are those with the educational attainment of college / associate degree, with 72.4% or 110 individuals in the labor force. Within the labor force, individuals with less than high school education have the highest percentage of unemployment, with 63.0% or 46 of them being unemployed.
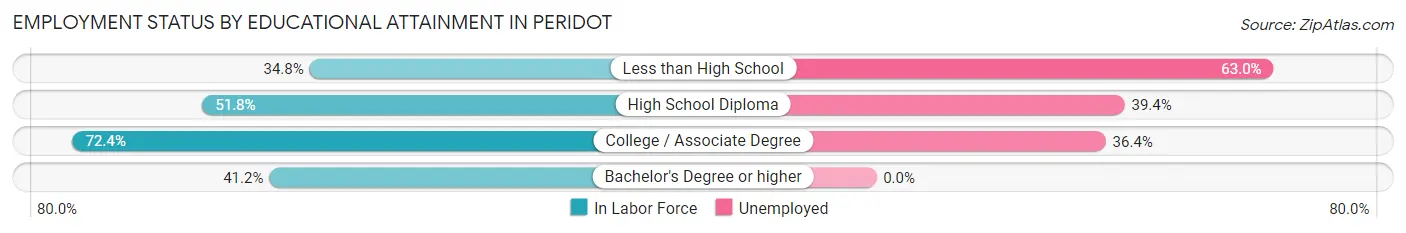
| Educational Attainment | In Labor Force | Unemployed |
| Less than High School | 73 (34.8%) | 132 (63.0%) |
| High School Diploma | 99 (51.8%) | 75 (39.4%) |
| College / Associate Degree | 110 (72.4%) | 55 (36.4%) |
| Bachelor's Degree or higher | 7 (41.2%) | 0 (0.0%) |
| Total | 289 (50.7%) | 247 (43.3%) |
Employment Occupations by Sex in Peridot
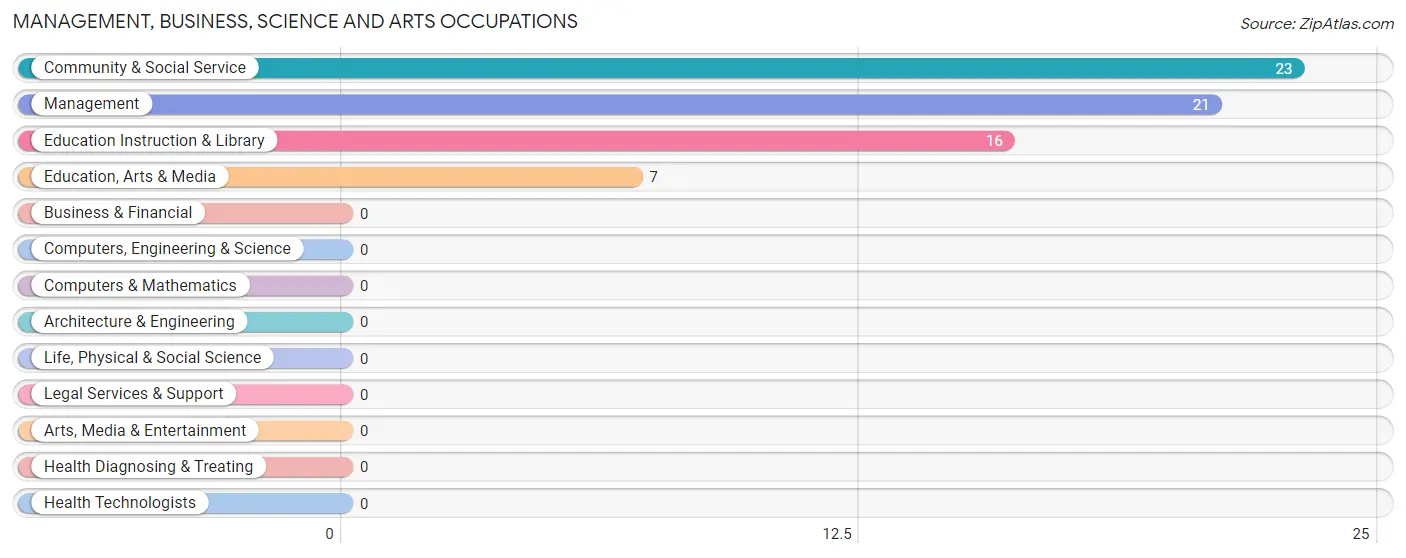
Management, Business, Science and Arts Occupations
The most common Management, Business, Science and Arts occupations in Peridot are Community & Social Service (23 | 10.4%), Management (21 | 9.5%), Education Instruction & Library (16 | 7.2%), and Education, Arts & Media (7 | 3.2%).
Management, Business, Science and Arts Occupations by Sex
Within the Management, Business, Science and Arts occupations in Peridot, the most male-oriented occupations are Management (100.0%), Education Instruction & Library (100.0%), and Community & Social Service (69.6%), while the most female-oriented occupations are Education, Arts & Media (100.0%), and Community & Social Service (30.4%).
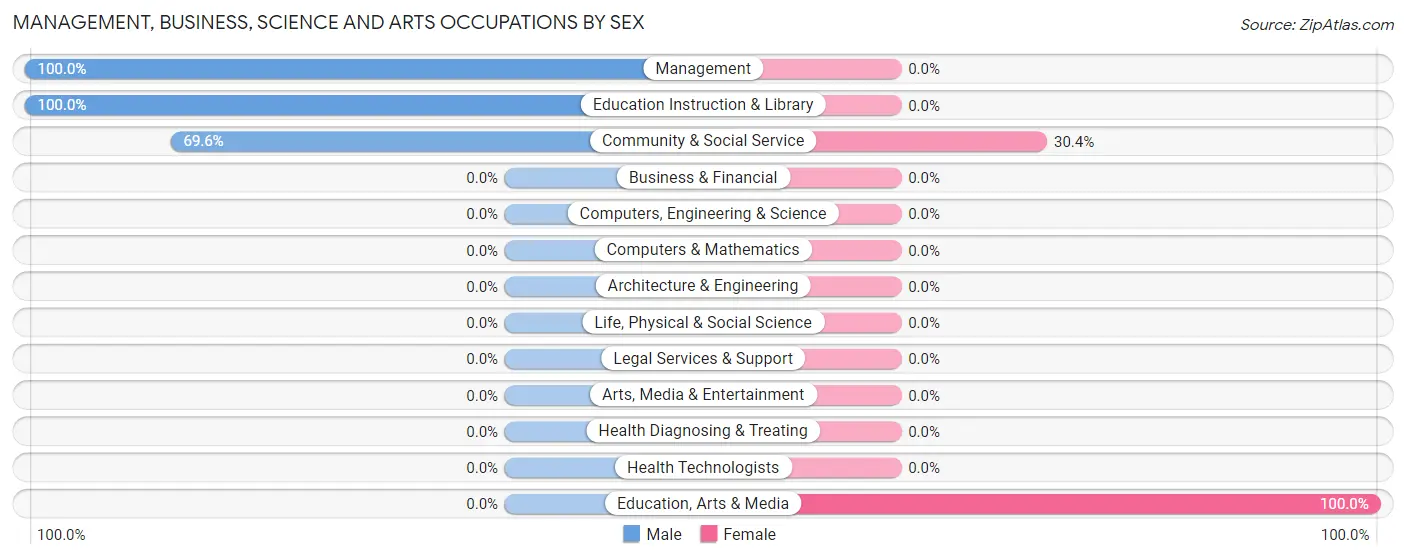
| Occupation | Male | Female |
| Management | 21 (100.0%) | 0 (0.0%) |
| Business & Financial | 0 (0.0%) | 0 (0.0%) |
| Computers, Engineering & Science | 0 (0.0%) | 0 (0.0%) |
| Computers & Mathematics | 0 (0.0%) | 0 (0.0%) |
| Architecture & Engineering | 0 (0.0%) | 0 (0.0%) |
| Life, Physical & Social Science | 0 (0.0%) | 0 (0.0%) |
| Community & Social Service | 16 (69.6%) | 7 (30.4%) |
| Education, Arts & Media | 0 (0.0%) | 7 (100.0%) |
| Legal Services & Support | 0 (0.0%) | 0 (0.0%) |
| Education Instruction & Library | 16 (100.0%) | 0 (0.0%) |
| Arts, Media & Entertainment | 0 (0.0%) | 0 (0.0%) |
| Health Diagnosing & Treating | 0 (0.0%) | 0 (0.0%) |
| Health Technologists | 0 (0.0%) | 0 (0.0%) |
| Total (Category) | 37 (84.1%) | 7 (15.9%) |
| Total (Overall) | 70 (31.5%) | 152 (68.5%) |
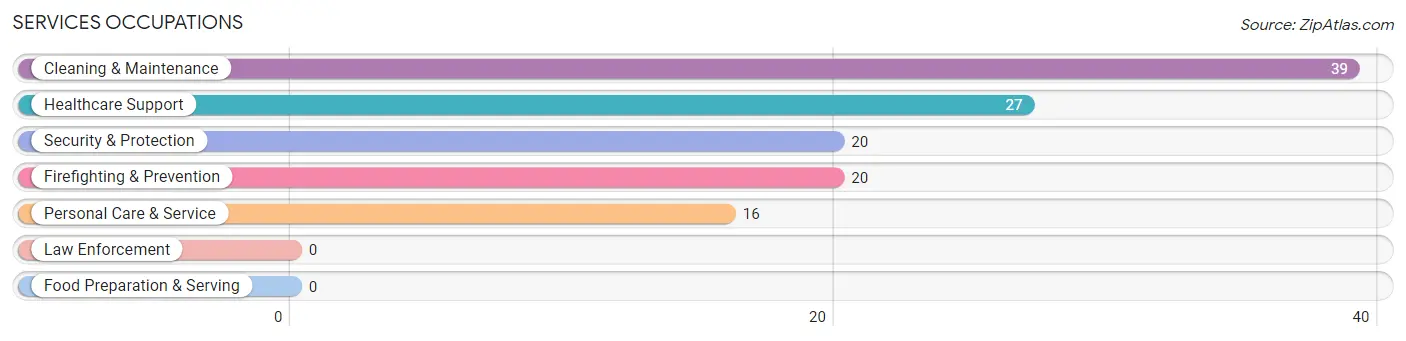
Services Occupations
The most common Services occupations in Peridot are Cleaning & Maintenance (39 | 17.6%), Healthcare Support (27 | 12.2%), Security & Protection (20 | 9.0%), Firefighting & Prevention (20 | 9.0%), and Personal Care & Service (16 | 7.2%).
Services Occupations by Sex
Within the Services occupations in Peridot, the most male-oriented occupations are Security & Protection (100.0%), and Firefighting & Prevention (100.0%), while the most female-oriented occupations are Healthcare Support (100.0%), Cleaning & Maintenance (100.0%), and Personal Care & Service (100.0%).
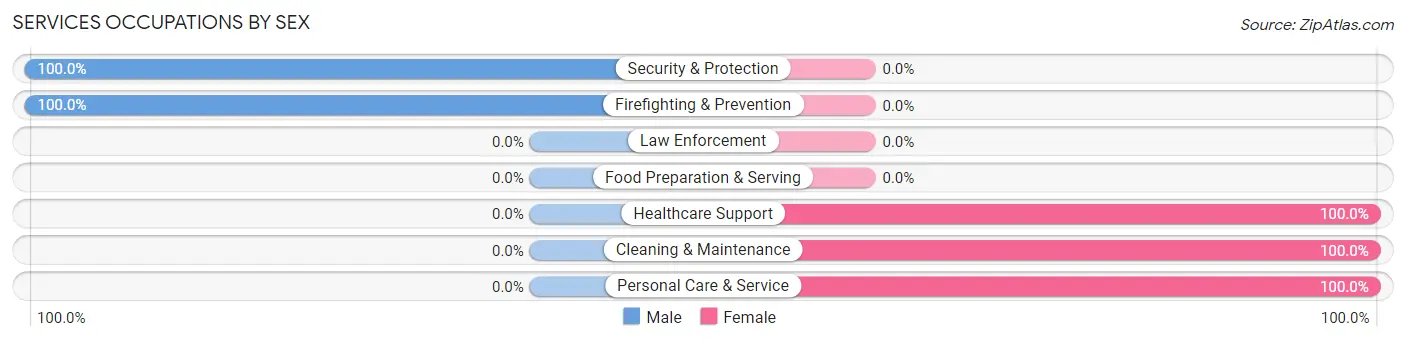
| Occupation | Male | Female |
| Healthcare Support | 0 (0.0%) | 27 (100.0%) |
| Security & Protection | 20 (100.0%) | 0 (0.0%) |
| Firefighting & Prevention | 20 (100.0%) | 0 (0.0%) |
| Law Enforcement | 0 (0.0%) | 0 (0.0%) |
| Food Preparation & Serving | 0 (0.0%) | 0 (0.0%) |
| Cleaning & Maintenance | 0 (0.0%) | 39 (100.0%) |
| Personal Care & Service | 0 (0.0%) | 16 (100.0%) |
| Total (Category) | 20 (19.6%) | 82 (80.4%) |
| Total (Overall) | 70 (31.5%) | 152 (68.5%) |
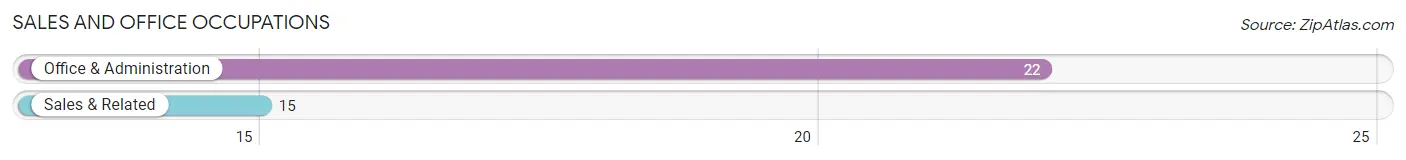
Sales and Office Occupations
The most common Sales and Office occupations in Peridot are Office & Administration (22 | 9.9%), and Sales & Related (15 | 6.8%).
Sales and Office Occupations by Sex
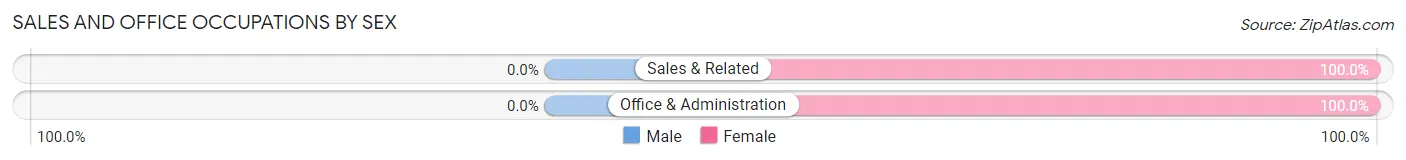
| Occupation | Male | Female |
| Sales & Related | 0 (0.0%) | 15 (100.0%) |
| Office & Administration | 0 (0.0%) | 22 (100.0%) |
| Total (Category) | 0 (0.0%) | 37 (100.0%) |
| Total (Overall) | 70 (31.5%) | 152 (68.5%) |
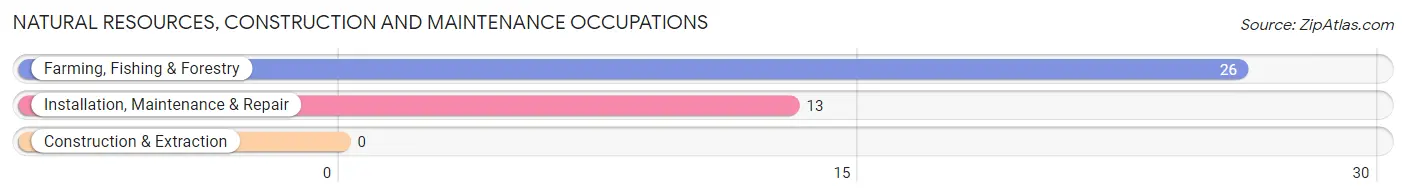
Natural Resources, Construction and Maintenance Occupations
The most common Natural Resources, Construction and Maintenance occupations in Peridot are Farming, Fishing & Forestry (26 | 11.7%), and Installation, Maintenance & Repair (13 | 5.9%).
Natural Resources, Construction and Maintenance Occupations by Sex
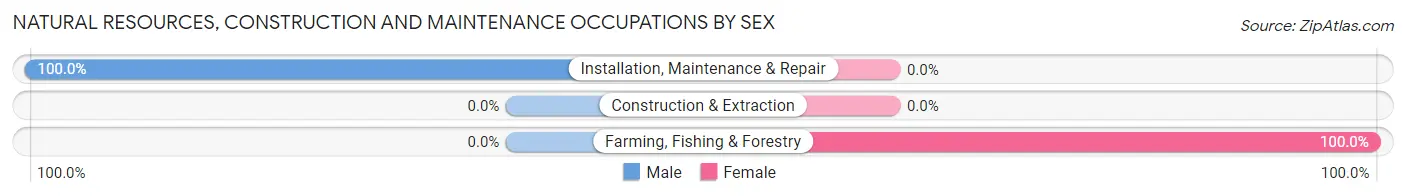
| Occupation | Male | Female |
| Farming, Fishing & Forestry | 0 (0.0%) | 26 (100.0%) |
| Construction & Extraction | 0 (0.0%) | 0 (0.0%) |
| Installation, Maintenance & Repair | 13 (100.0%) | 0 (0.0%) |
| Total (Category) | 13 (33.3%) | 26 (66.7%) |
| Total (Overall) | 70 (31.5%) | 152 (68.5%) |
Production, Transportation and Moving Occupations
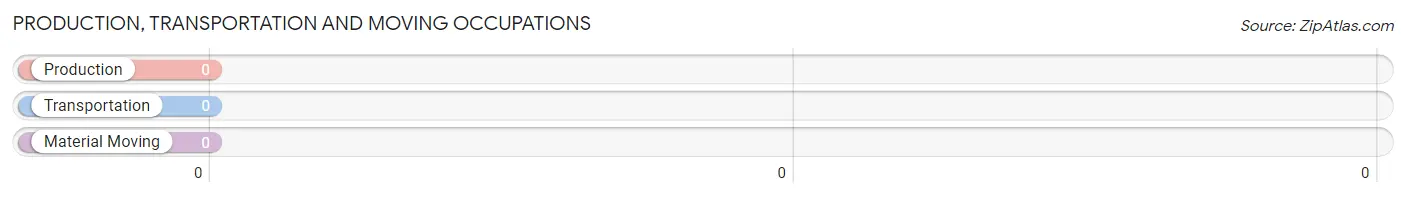
Production, Transportation and Moving Occupations by Sex
| Occupation | Male | Female |
| Production | 0 (0.0%) | 0 (0.0%) |
| Transportation | 0 (0.0%) | 0 (0.0%) |
| Material Moving | 0 (0.0%) | 0 (0.0%) |
| Total (Category) | 0 (0.0%) | 0 (0.0%) |
| Total (Overall) | 70 (31.5%) | 152 (68.5%) |
Employment Industries by Sex in Peridot
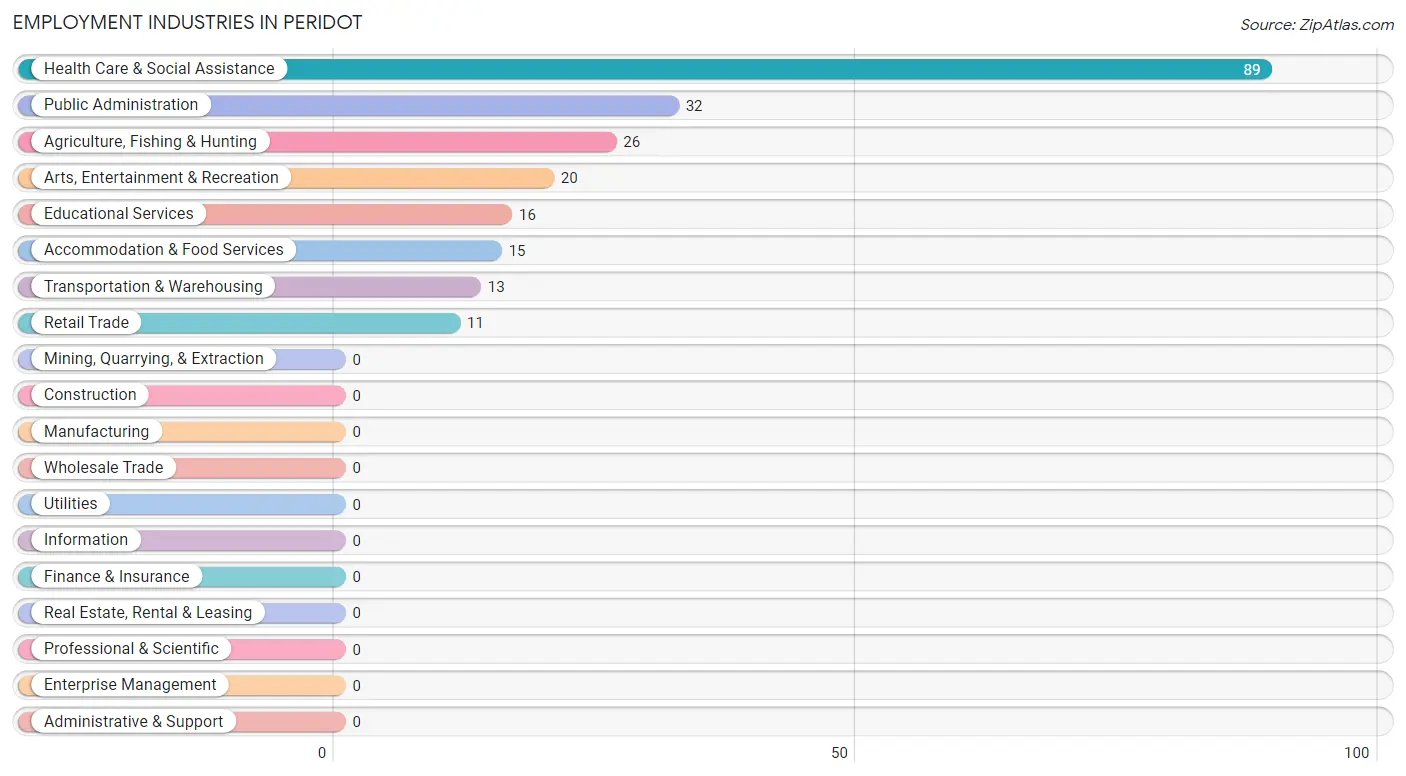
Employment Industries in Peridot
The major employment industries in Peridot include Health Care & Social Assistance (89 | 40.1%), Public Administration (32 | 14.4%), Agriculture, Fishing & Hunting (26 | 11.7%), Arts, Entertainment & Recreation (20 | 9.0%), and Educational Services (16 | 7.2%).
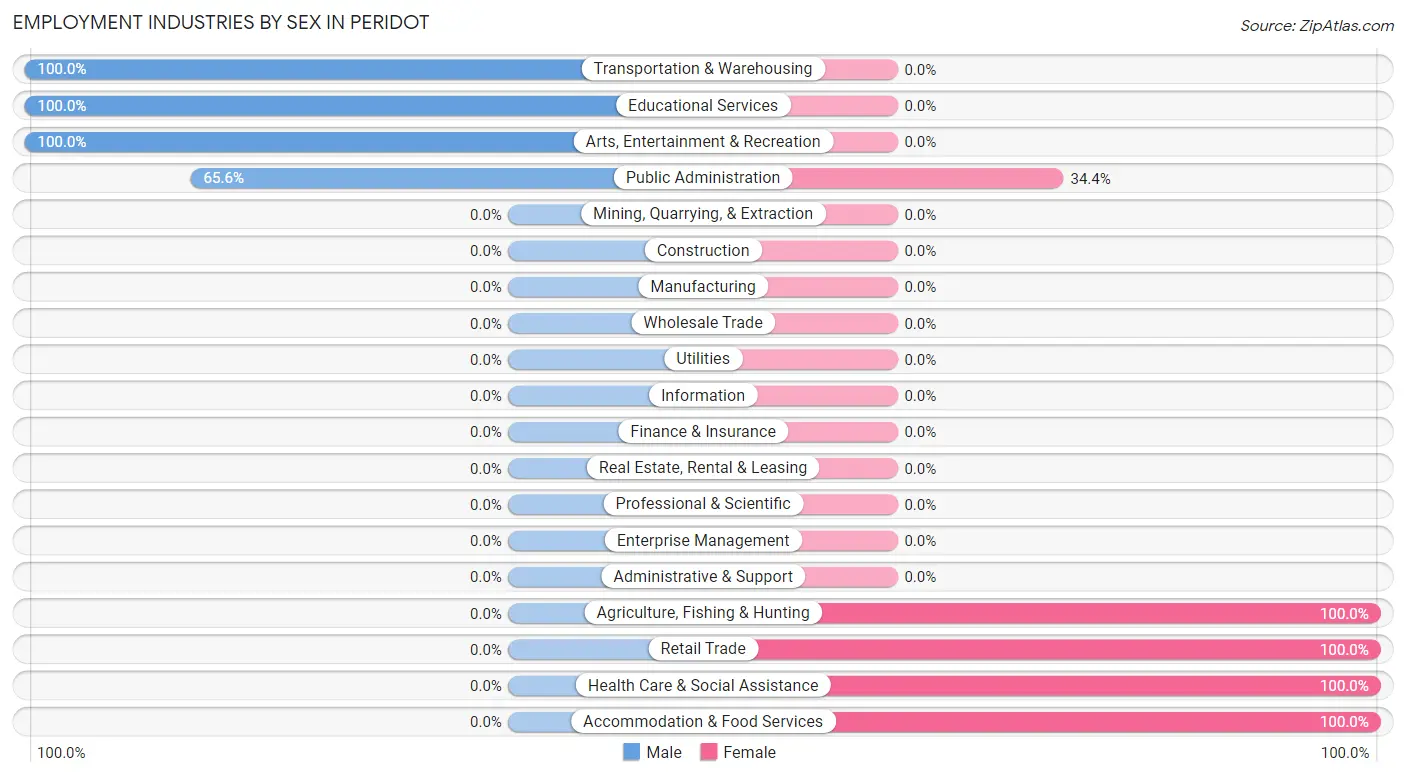
Employment Industries by Sex in Peridot
The Peridot industries that see more men than women are Transportation & Warehousing (100.0%), Educational Services (100.0%), and Arts, Entertainment & Recreation (100.0%), whereas the industries that tend to have a higher number of women are Agriculture, Fishing & Hunting (100.0%), Retail Trade (100.0%), and Health Care & Social Assistance (100.0%).
| Industry | Male | Female |
| Agriculture, Fishing & Hunting | 0 (0.0%) | 26 (100.0%) |
| Mining, Quarrying, & Extraction | 0 (0.0%) | 0 (0.0%) |
| Construction | 0 (0.0%) | 0 (0.0%) |
| Manufacturing | 0 (0.0%) | 0 (0.0%) |
| Wholesale Trade | 0 (0.0%) | 0 (0.0%) |
| Retail Trade | 0 (0.0%) | 11 (100.0%) |
| Transportation & Warehousing | 13 (100.0%) | 0 (0.0%) |
| Utilities | 0 (0.0%) | 0 (0.0%) |
| Information | 0 (0.0%) | 0 (0.0%) |
| Finance & Insurance | 0 (0.0%) | 0 (0.0%) |
| Real Estate, Rental & Leasing | 0 (0.0%) | 0 (0.0%) |
| Professional & Scientific | 0 (0.0%) | 0 (0.0%) |
| Enterprise Management | 0 (0.0%) | 0 (0.0%) |
| Administrative & Support | 0 (0.0%) | 0 (0.0%) |
| Educational Services | 16 (100.0%) | 0 (0.0%) |
| Health Care & Social Assistance | 0 (0.0%) | 89 (100.0%) |
| Arts, Entertainment & Recreation | 20 (100.0%) | 0 (0.0%) |
| Accommodation & Food Services | 0 (0.0%) | 15 (100.0%) |
| Public Administration | 21 (65.6%) | 11 (34.4%) |
| Total | 70 (31.5%) | 152 (68.5%) |
Education in Peridot
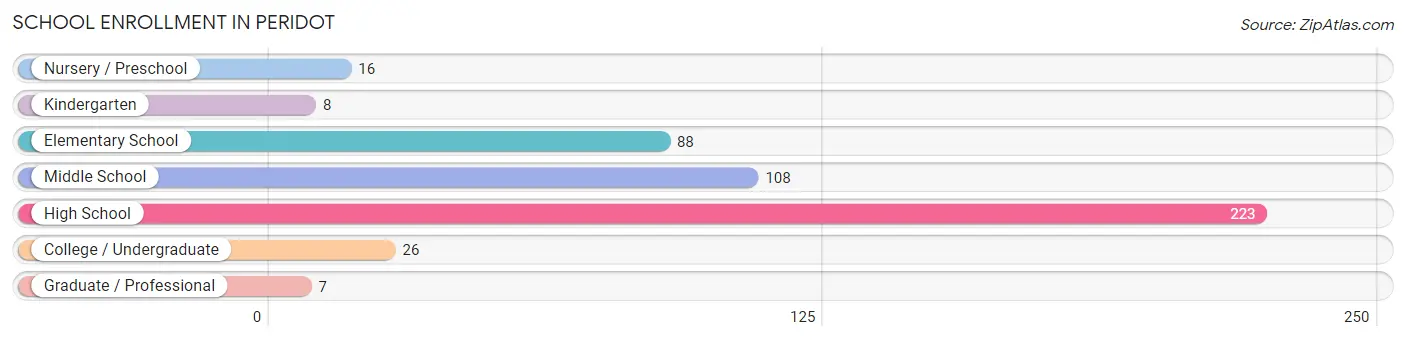
School Enrollment in Peridot
The most common levels of schooling among the 476 students in Peridot are high school (223 | 46.9%), middle school (108 | 22.7%), and elementary school (88 | 18.5%).
| School Level | # Students | % Students |
| Nursery / Preschool | 16 | 3.4% |
| Kindergarten | 8 | 1.7% |
| Elementary School | 88 | 18.5% |
| Middle School | 108 | 22.7% |
| High School | 223 | 46.9% |
| College / Undergraduate | 26 | 5.5% |
| Graduate / Professional | 7 | 1.5% |
| Total | 476 | 100.0% |
School Enrollment by Age by Funding Source in Peridot
Out of a total of 476 students who are enrolled in schools in Peridot, 19 (4.0%) attend a private institution, while the remaining 457 (96.0%) are enrolled in public schools. The age group of 10 to 14 year olds has the highest likelihood of being enrolled in private schools, with 19 (13.7% in the age bracket) enrolled. Conversely, the age group of 3 to 4 year olds has the lowest likelihood of being enrolled in a private school, with 16 (100.0% in the age bracket) attending a public institution.
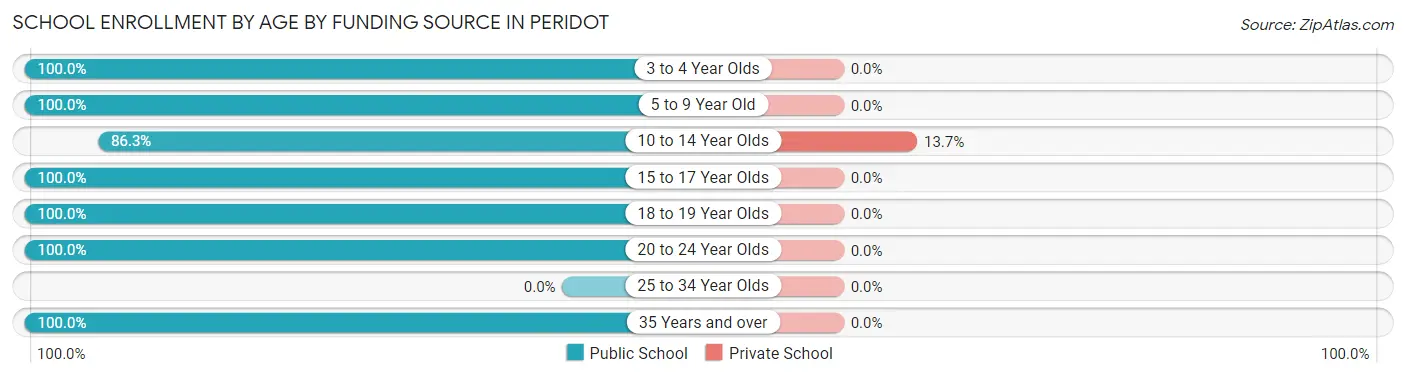
| Age Bracket | Public School | Private School |
| 3 to 4 Year Olds | 16 (100.0%) | 0 (0.0%) |
| 5 to 9 Year Old | 96 (100.0%) | 0 (0.0%) |
| 10 to 14 Year Olds | 120 (86.3%) | 19 (13.7%) |
| 15 to 17 Year Olds | 103 (100.0%) | 0 (0.0%) |
| 18 to 19 Year Olds | 55 (100.0%) | 0 (0.0%) |
| 20 to 24 Year Olds | 60 (100.0%) | 0 (0.0%) |
| 25 to 34 Year Olds | 0 (0.0%) | 0 (0.0%) |
| 35 Years and over | 7 (100.0%) | 0 (0.0%) |
| Total | 457 (96.0%) | 19 (4.0%) |
Educational Attainment by Field of Study in Peridot
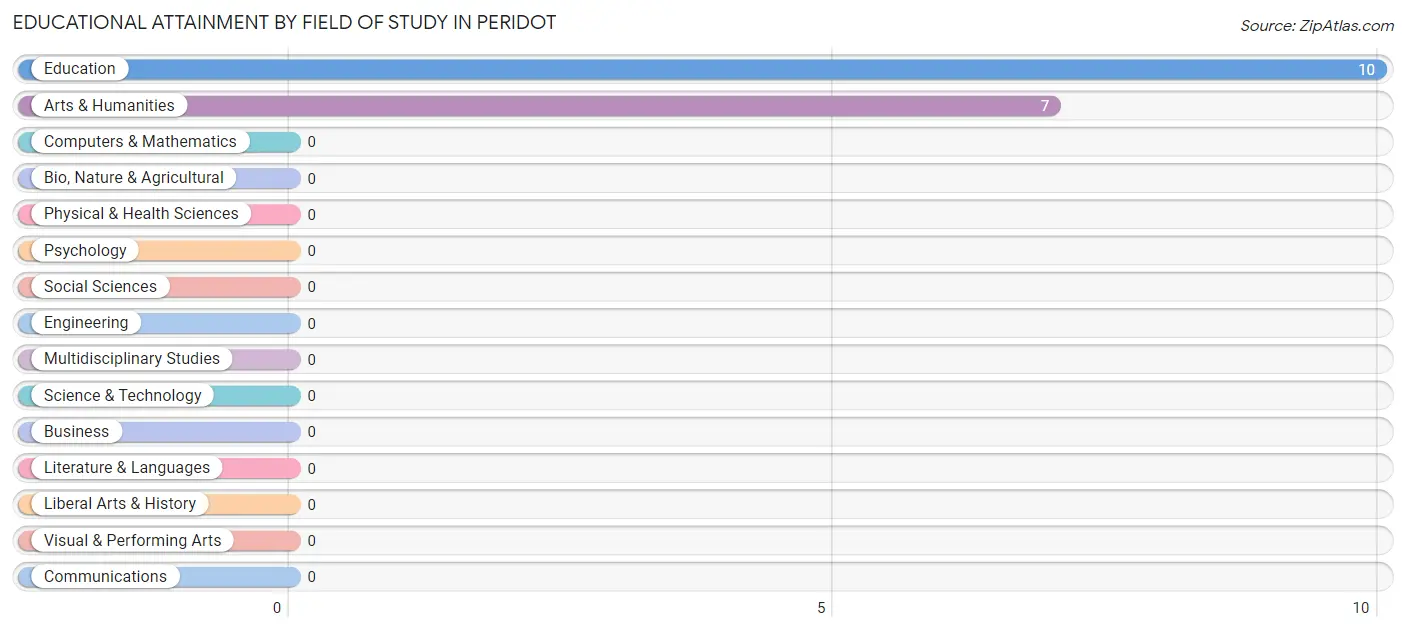
Education (10 | 58.8%), and arts & humanities (7 | 41.2%) are the most common fields of study among 17 individuals in Peridot who have obtained a bachelor's degree or higher.
| Field of Study | # Graduates | % Graduates |
| Computers & Mathematics | 0 | 0.0% |
| Bio, Nature & Agricultural | 0 | 0.0% |
| Physical & Health Sciences | 0 | 0.0% |
| Psychology | 0 | 0.0% |
| Social Sciences | 0 | 0.0% |
| Engineering | 0 | 0.0% |
| Multidisciplinary Studies | 0 | 0.0% |
| Science & Technology | 0 | 0.0% |
| Business | 0 | 0.0% |
| Education | 10 | 58.8% |
| Literature & Languages | 0 | 0.0% |
| Liberal Arts & History | 0 | 0.0% |
| Visual & Performing Arts | 0 | 0.0% |
| Communications | 0 | 0.0% |
| Arts & Humanities | 7 | 41.2% |
| Total | 17 | 100.0% |
Transportation & Commute in Peridot
Vehicle Availability by Sex in Peridot
The most prevalent vehicle ownership categories in Peridot are males with 1 vehicle (29, accounting for 41.4%) and females with 1 vehicle (30, making up 19.1%).
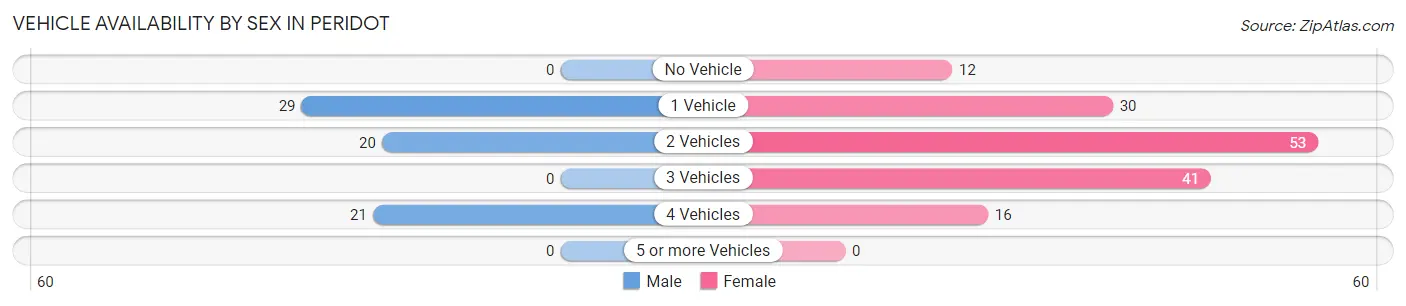
| Vehicles Available | Male | Female |
| No Vehicle | 0 (0.0%) | 12 (7.9%) |
| 1 Vehicle | 29 (41.4%) | 30 (19.7%) |
| 2 Vehicles | 20 (28.6%) | 53 (34.9%) |
| 3 Vehicles | 0 (0.0%) | 41 (27.0%) |
| 4 Vehicles | 21 (30.0%) | 16 (10.5%) |
| 5 or more Vehicles | 0 (0.0%) | 0 (0.0%) |
| Total | 70 (100.0%) | 152 (100.0%) |
Commute Time in Peridot
The most frequently occuring commute durations in Peridot are 15 to 19 minutes (111 commuters, 50.0%), 20 to 24 minutes (56 commuters, 25.2%), and less than 5 minutes (16 commuters, 7.2%).
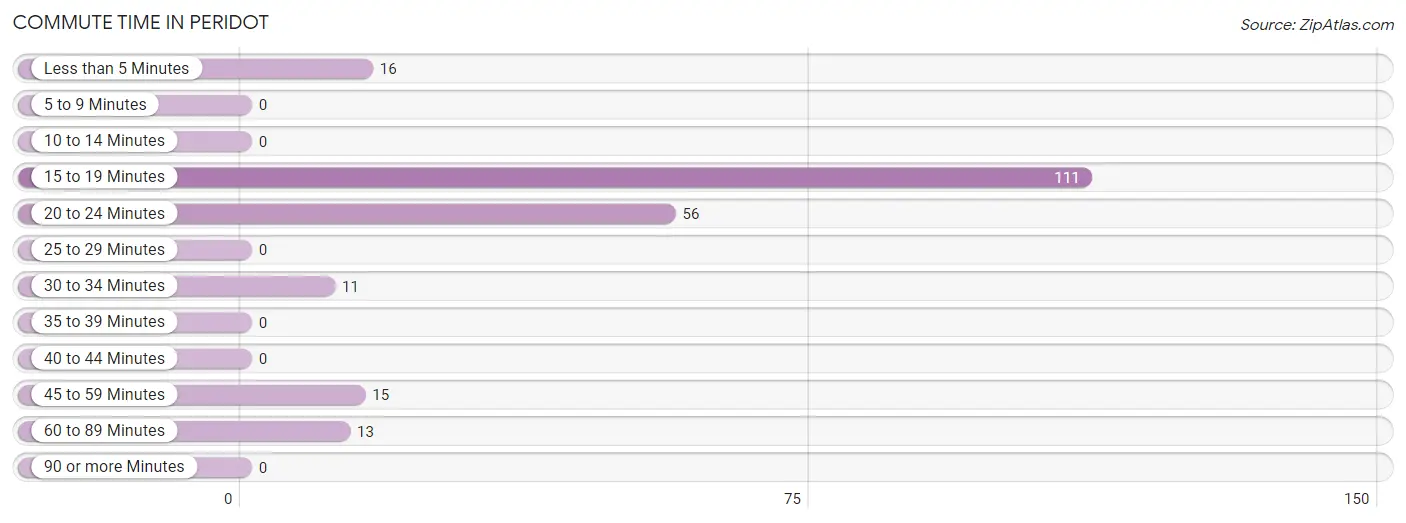
| Commute Time | # Commuters | % Commuters |
| Less than 5 Minutes | 16 | 7.2% |
| 5 to 9 Minutes | 0 | 0.0% |
| 10 to 14 Minutes | 0 | 0.0% |
| 15 to 19 Minutes | 111 | 50.0% |
| 20 to 24 Minutes | 56 | 25.2% |
| 25 to 29 Minutes | 0 | 0.0% |
| 30 to 34 Minutes | 11 | 5.0% |
| 35 to 39 Minutes | 0 | 0.0% |
| 40 to 44 Minutes | 0 | 0.0% |
| 45 to 59 Minutes | 15 | 6.8% |
| 60 to 89 Minutes | 13 | 5.9% |
| 90 or more Minutes | 0 | 0.0% |
Commute Time by Sex in Peridot
The most common commute times in Peridot are 20 to 24 minutes (41 commuters, 58.6%) for males and 15 to 19 minutes (111 commuters, 73.0%) for females.
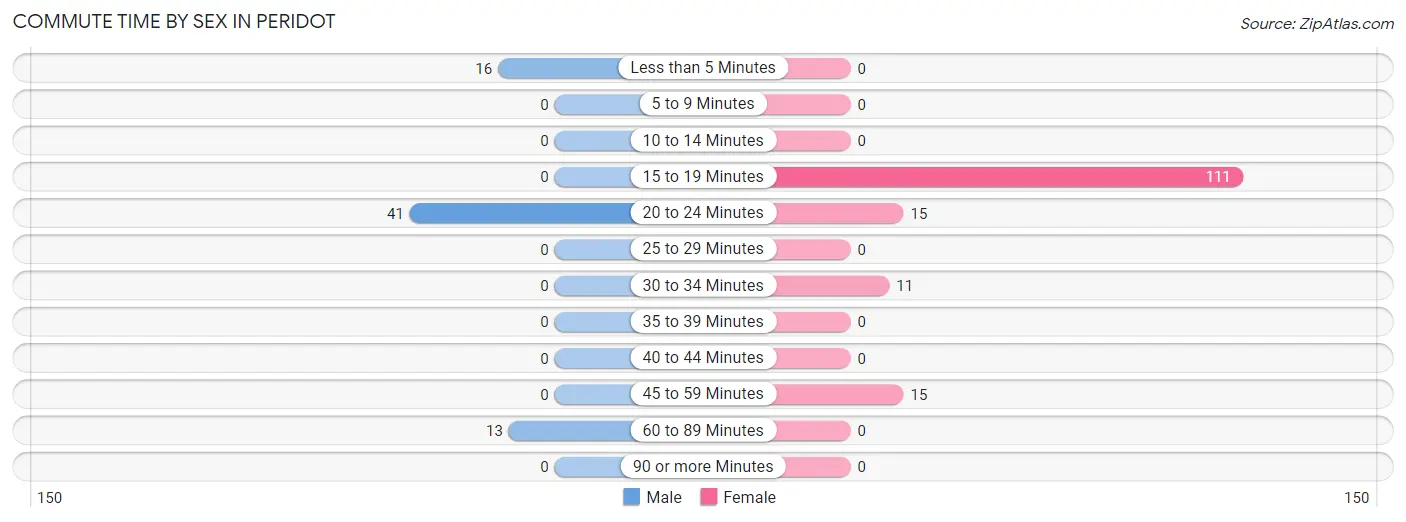
| Commute Time | Male | Female |
| Less than 5 Minutes | 16 (22.9%) | 0 (0.0%) |
| 5 to 9 Minutes | 0 (0.0%) | 0 (0.0%) |
| 10 to 14 Minutes | 0 (0.0%) | 0 (0.0%) |
| 15 to 19 Minutes | 0 (0.0%) | 111 (73.0%) |
| 20 to 24 Minutes | 41 (58.6%) | 15 (9.9%) |
| 25 to 29 Minutes | 0 (0.0%) | 0 (0.0%) |
| 30 to 34 Minutes | 0 (0.0%) | 11 (7.2%) |
| 35 to 39 Minutes | 0 (0.0%) | 0 (0.0%) |
| 40 to 44 Minutes | 0 (0.0%) | 0 (0.0%) |
| 45 to 59 Minutes | 0 (0.0%) | 15 (9.9%) |
| 60 to 89 Minutes | 13 (18.6%) | 0 (0.0%) |
| 90 or more Minutes | 0 (0.0%) | 0 (0.0%) |
Time of Departure to Work by Sex in Peridot
The most frequent times of departure to work in Peridot are 12:00 PM to 3:59 PM (41, 58.6%) for males and 6:30 AM to 6:59 AM (42, 27.6%) for females.
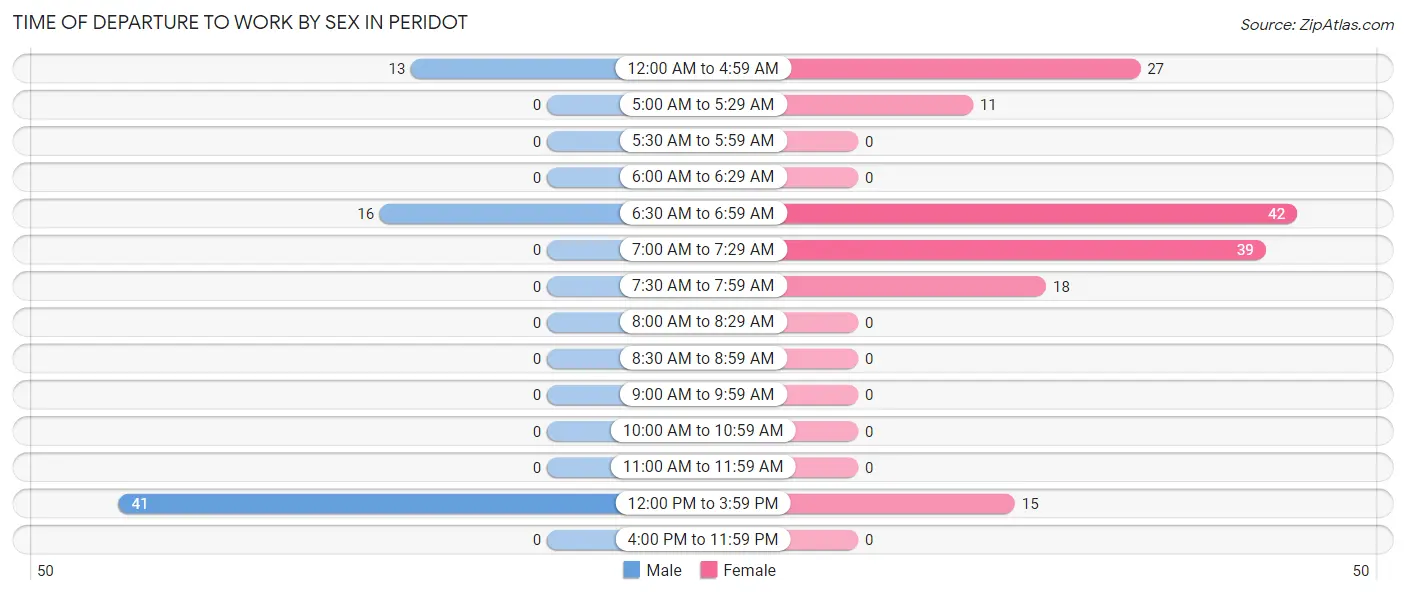
| Time of Departure | Male | Female |
| 12:00 AM to 4:59 AM | 13 (18.6%) | 27 (17.8%) |
| 5:00 AM to 5:29 AM | 0 (0.0%) | 11 (7.2%) |
| 5:30 AM to 5:59 AM | 0 (0.0%) | 0 (0.0%) |
| 6:00 AM to 6:29 AM | 0 (0.0%) | 0 (0.0%) |
| 6:30 AM to 6:59 AM | 16 (22.9%) | 42 (27.6%) |
| 7:00 AM to 7:29 AM | 0 (0.0%) | 39 (25.7%) |
| 7:30 AM to 7:59 AM | 0 (0.0%) | 18 (11.8%) |
| 8:00 AM to 8:29 AM | 0 (0.0%) | 0 (0.0%) |
| 8:30 AM to 8:59 AM | 0 (0.0%) | 0 (0.0%) |
| 9:00 AM to 9:59 AM | 0 (0.0%) | 0 (0.0%) |
| 10:00 AM to 10:59 AM | 0 (0.0%) | 0 (0.0%) |
| 11:00 AM to 11:59 AM | 0 (0.0%) | 0 (0.0%) |
| 12:00 PM to 3:59 PM | 41 (58.6%) | 15 (9.9%) |
| 4:00 PM to 11:59 PM | 0 (0.0%) | 0 (0.0%) |
| Total | 70 (100.0%) | 152 (100.0%) |
Housing Occupancy in Peridot
Occupancy by Ownership in Peridot
Of the total 306 dwellings in Peridot, owner-occupied units account for 230 (75.2%), while renter-occupied units make up 76 (24.8%).
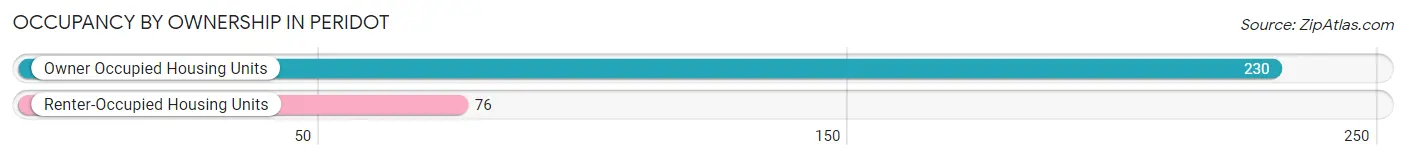
| Occupancy | # Housing Units | % Housing Units |
| Owner Occupied Housing Units | 230 | 75.2% |
| Renter-Occupied Housing Units | 76 | 24.8% |
| Total Occupied Housing Units | 306 | 100.0% |
Occupancy by Household Size in Peridot
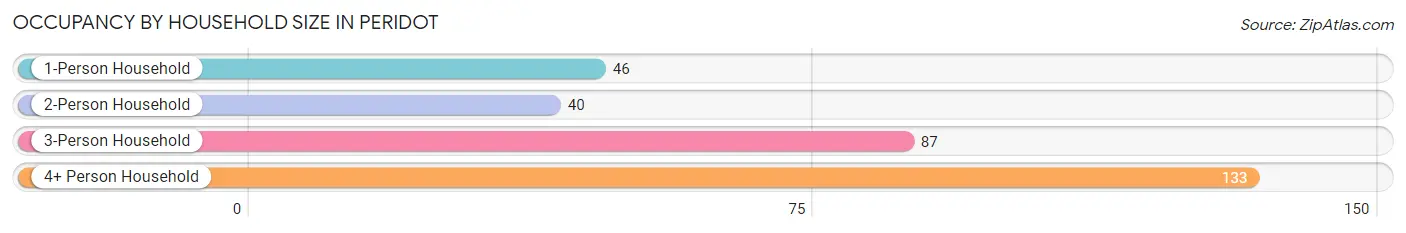
| Household Size | # Housing Units | % Housing Units |
| 1-Person Household | 46 | 15.0% |
| 2-Person Household | 40 | 13.1% |
| 3-Person Household | 87 | 28.4% |
| 4+ Person Household | 133 | 43.5% |
| Total Housing Units | 306 | 100.0% |
Occupancy by Ownership by Household Size in Peridot
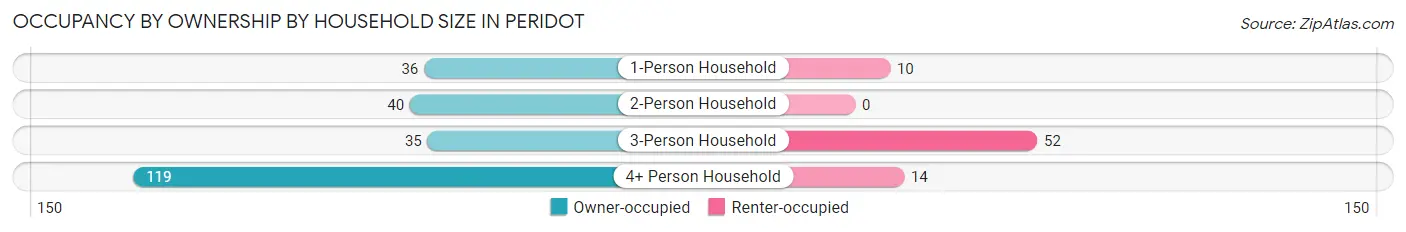
| Household Size | Owner-occupied | Renter-occupied |
| 1-Person Household | 36 (78.3%) | 10 (21.7%) |
| 2-Person Household | 40 (100.0%) | 0 (0.0%) |
| 3-Person Household | 35 (40.2%) | 52 (59.8%) |
| 4+ Person Household | 119 (89.5%) | 14 (10.5%) |
| Total Housing Units | 230 (75.2%) | 76 (24.8%) |
Occupancy by Educational Attainment in Peridot
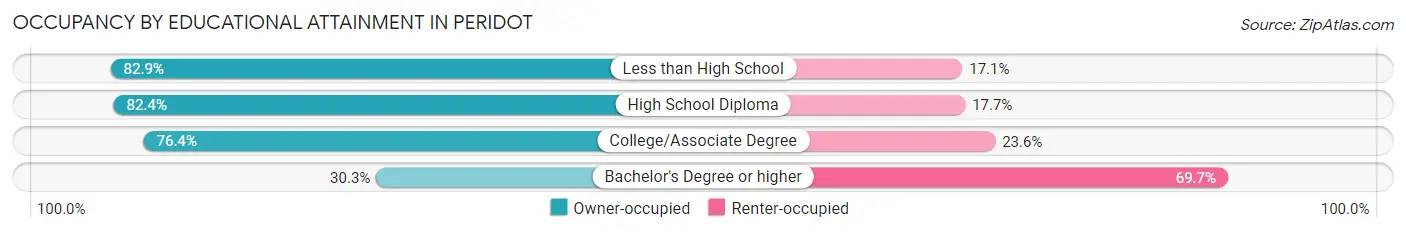
| Household Size | Owner-occupied | Renter-occupied |
| Less than High School | 68 (82.9%) | 14 (17.1%) |
| High School Diploma | 84 (82.4%) | 18 (17.6%) |
| College/Associate Degree | 68 (76.4%) | 21 (23.6%) |
| Bachelor's Degree or higher | 10 (30.3%) | 23 (69.7%) |
Occupancy by Age of Householder in Peridot
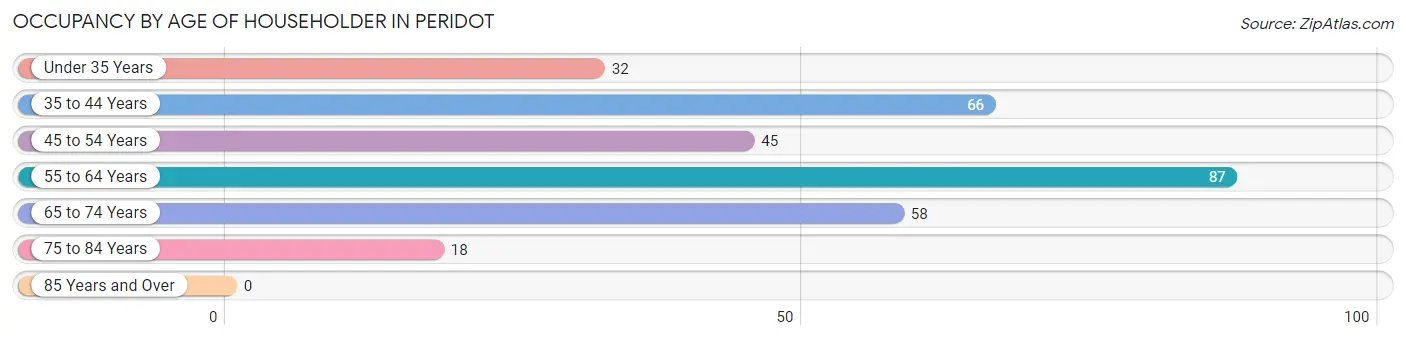
| Age Bracket | # Households | % Households |
| Under 35 Years | 32 | 10.5% |
| 35 to 44 Years | 66 | 21.6% |
| 45 to 54 Years | 45 | 14.7% |
| 55 to 64 Years | 87 | 28.4% |
| 65 to 74 Years | 58 | 19.0% |
| 75 to 84 Years | 18 | 5.9% |
| 85 Years and Over | 0 | 0.0% |
| Total | 306 | 100.0% |
Housing Finances in Peridot
Median Income by Occupancy in Peridot
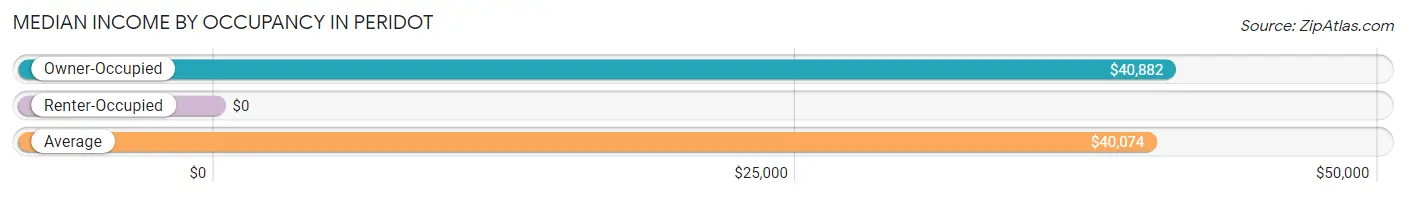
| Occupancy Type | # Households | Median Income |
| Owner-Occupied | 230 (75.2%) | $40,882 |
| Renter-Occupied | 76 (24.8%) | $0 |
| Average | 306 (100.0%) | $40,074 |
Occupancy by Householder Income Bracket in Peridot
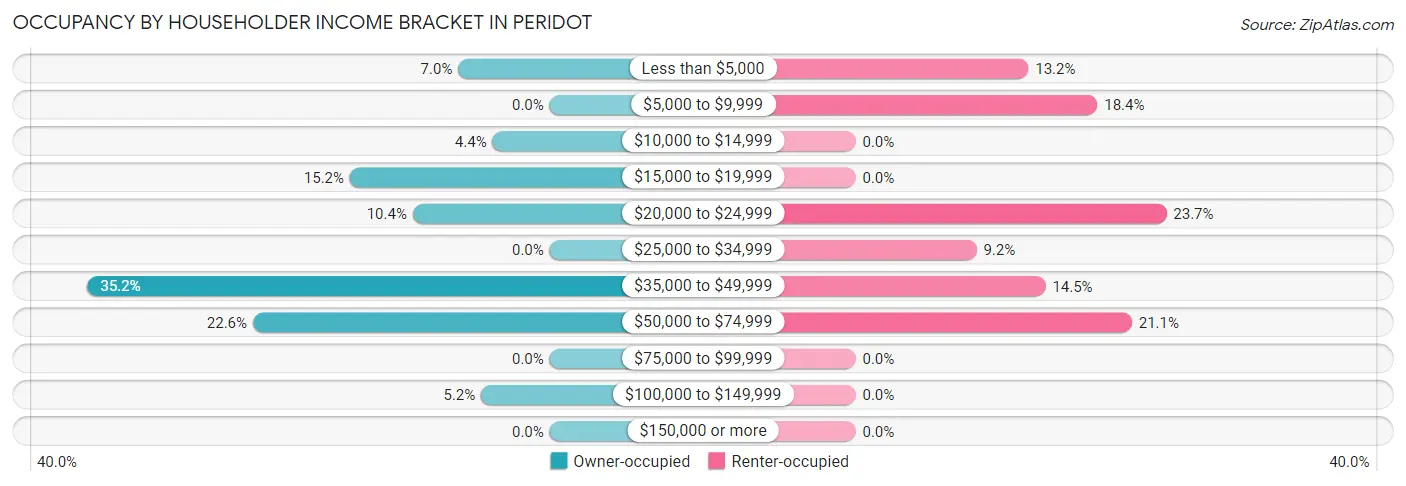
| Income Bracket | Owner-occupied | Renter-occupied |
| Less than $5,000 | 16 (7.0%) | 10 (13.2%) |
| $5,000 to $9,999 | 0 (0.0%) | 14 (18.4%) |
| $10,000 to $14,999 | 10 (4.3%) | 0 (0.0%) |
| $15,000 to $19,999 | 35 (15.2%) | 0 (0.0%) |
| $20,000 to $24,999 | 24 (10.4%) | 18 (23.7%) |
| $25,000 to $34,999 | 0 (0.0%) | 7 (9.2%) |
| $35,000 to $49,999 | 81 (35.2%) | 11 (14.5%) |
| $50,000 to $74,999 | 52 (22.6%) | 16 (21.0%) |
| $75,000 to $99,999 | 0 (0.0%) | 0 (0.0%) |
| $100,000 to $149,999 | 12 (5.2%) | 0 (0.0%) |
| $150,000 or more | 0 (0.0%) | 0 (0.0%) |
| Total | 230 (100.0%) | 76 (100.0%) |
Monthly Housing Cost Tiers in Peridot
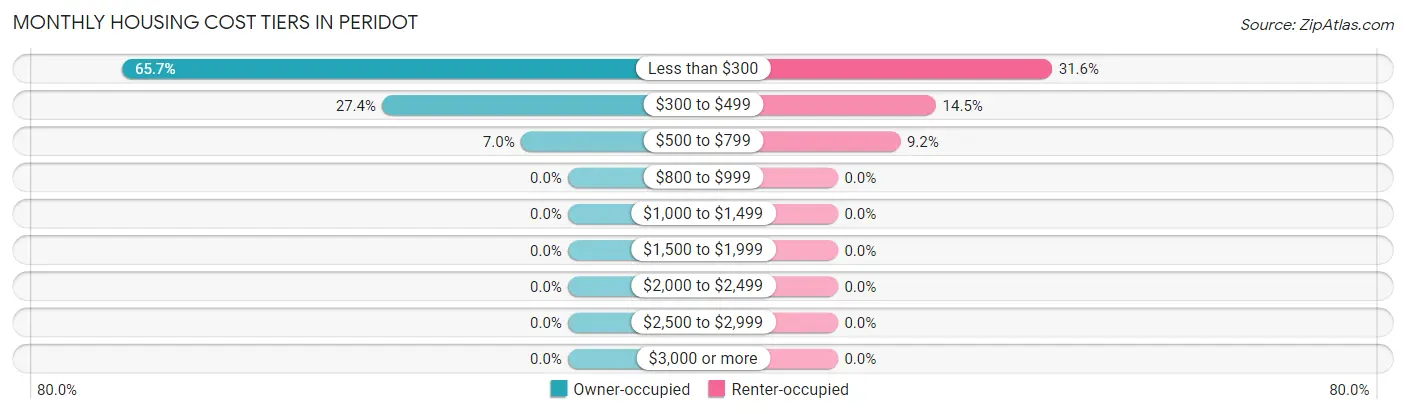
| Monthly Cost | Owner-occupied | Renter-occupied |
| Less than $300 | 151 (65.6%) | 24 (31.6%) |
| $300 to $499 | 63 (27.4%) | 11 (14.5%) |
| $500 to $799 | 16 (7.0%) | 7 (9.2%) |
| $800 to $999 | 0 (0.0%) | 0 (0.0%) |
| $1,000 to $1,499 | 0 (0.0%) | 0 (0.0%) |
| $1,500 to $1,999 | 0 (0.0%) | 0 (0.0%) |
| $2,000 to $2,499 | 0 (0.0%) | 0 (0.0%) |
| $2,500 to $2,999 | 0 (0.0%) | 0 (0.0%) |
| $3,000 or more | 0 (0.0%) | 0 (0.0%) |
| Total | 230 (100.0%) | 76 (100.0%) |
Physical Housing Characteristics in Peridot
Housing Structures in Peridot
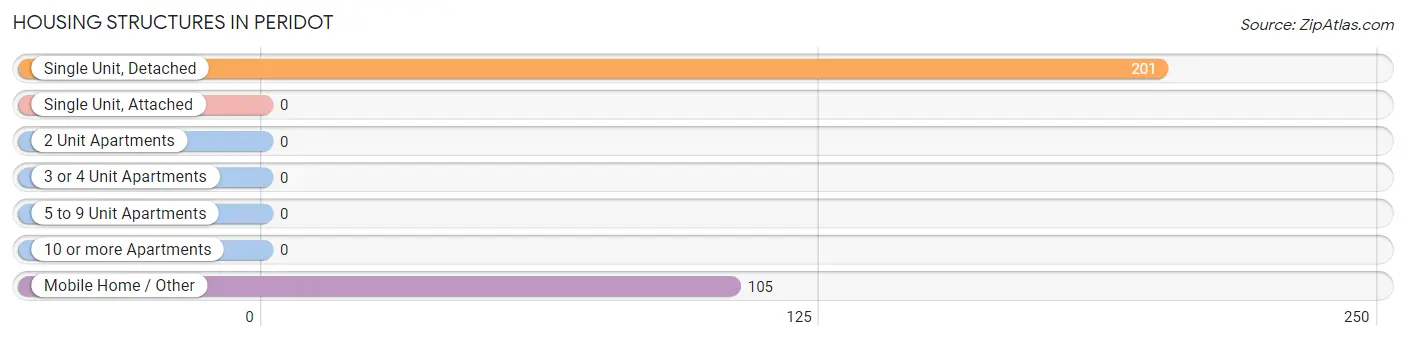
| Structure Type | # Housing Units | % Housing Units |
| Single Unit, Detached | 201 | 65.7% |
| Single Unit, Attached | 0 | 0.0% |
| 2 Unit Apartments | 0 | 0.0% |
| 3 or 4 Unit Apartments | 0 | 0.0% |
| 5 to 9 Unit Apartments | 0 | 0.0% |
| 10 or more Apartments | 0 | 0.0% |
| Mobile Home / Other | 105 | 34.3% |
| Total | 306 | 100.0% |
Housing Structures by Occupancy in Peridot
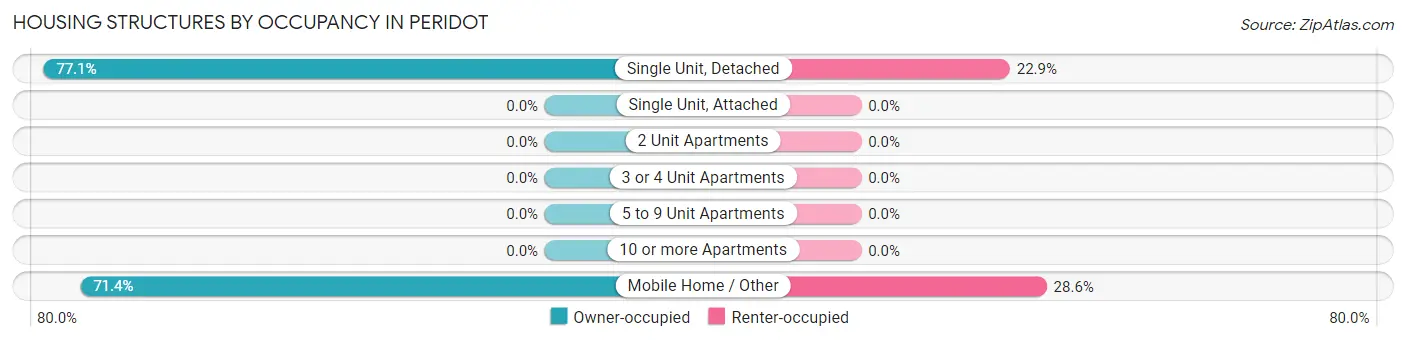
| Structure Type | Owner-occupied | Renter-occupied |
| Single Unit, Detached | 155 (77.1%) | 46 (22.9%) |
| Single Unit, Attached | 0 (0.0%) | 0 (0.0%) |
| 2 Unit Apartments | 0 (0.0%) | 0 (0.0%) |
| 3 or 4 Unit Apartments | 0 (0.0%) | 0 (0.0%) |
| 5 to 9 Unit Apartments | 0 (0.0%) | 0 (0.0%) |
| 10 or more Apartments | 0 (0.0%) | 0 (0.0%) |
| Mobile Home / Other | 75 (71.4%) | 30 (28.6%) |
| Total | 230 (75.2%) | 76 (24.8%) |
Housing Structures by Number of Rooms in Peridot
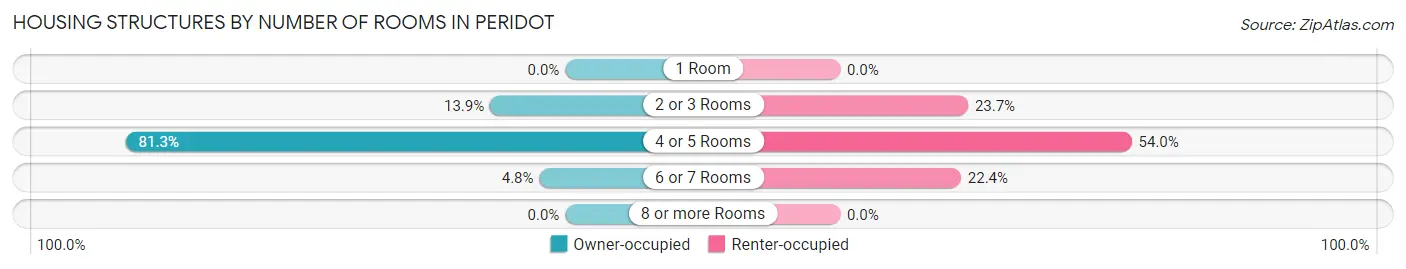
| Number of Rooms | Owner-occupied | Renter-occupied |
| 1 Room | 0 (0.0%) | 0 (0.0%) |
| 2 or 3 Rooms | 32 (13.9%) | 18 (23.7%) |
| 4 or 5 Rooms | 187 (81.3%) | 41 (53.9%) |
| 6 or 7 Rooms | 11 (4.8%) | 17 (22.4%) |
| 8 or more Rooms | 0 (0.0%) | 0 (0.0%) |
| Total | 230 (100.0%) | 76 (100.0%) |
Housing Structure by Heating Type in Peridot
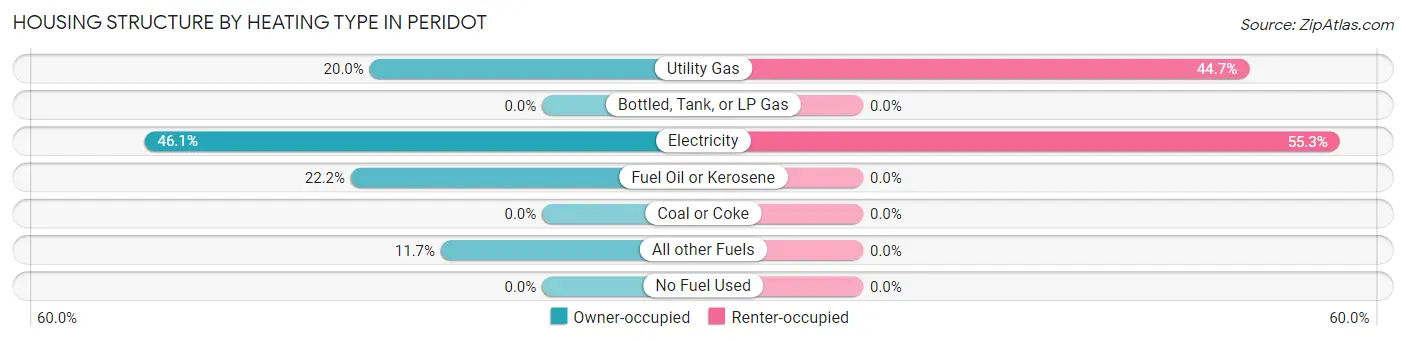
| Heating Type | Owner-occupied | Renter-occupied |
| Utility Gas | 46 (20.0%) | 34 (44.7%) |
| Bottled, Tank, or LP Gas | 0 (0.0%) | 0 (0.0%) |
| Electricity | 106 (46.1%) | 42 (55.3%) |
| Fuel Oil or Kerosene | 51 (22.2%) | 0 (0.0%) |
| Coal or Coke | 0 (0.0%) | 0 (0.0%) |
| All other Fuels | 27 (11.7%) | 0 (0.0%) |
| No Fuel Used | 0 (0.0%) | 0 (0.0%) |
| Total | 230 (100.0%) | 76 (100.0%) |
Household Vehicle Usage in Peridot
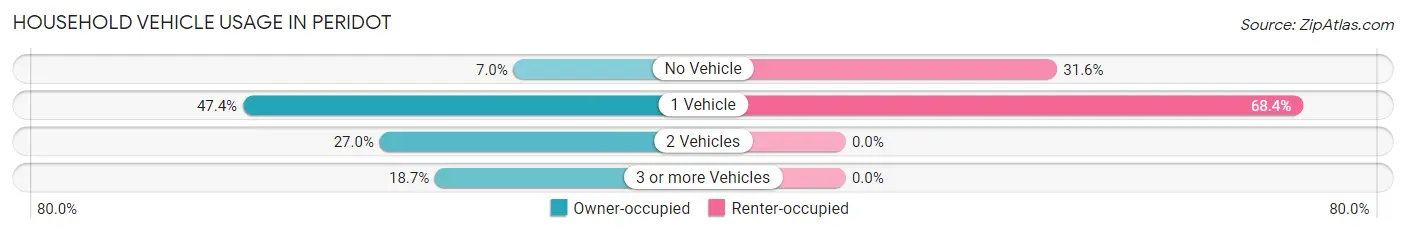
| Vehicles per Household | Owner-occupied | Renter-occupied |
| No Vehicle | 16 (7.0%) | 24 (31.6%) |
| 1 Vehicle | 109 (47.4%) | 52 (68.4%) |
| 2 Vehicles | 62 (27.0%) | 0 (0.0%) |
| 3 or more Vehicles | 43 (18.7%) | 0 (0.0%) |
| Total | 230 (100.0%) | 76 (100.0%) |
Real Estate & Mortgages in Peridot
Real Estate and Mortgage Overview in Peridot
| Characteristic | Without Mortgage | With Mortgage |
| Housing Units | 214 | 16 |
| Median Property Value | $27,100 | $0 |
| Median Household Income | $40,294 | $0 |
| Monthly Housing Costs | $255 | $0 |
| Real Estate Taxes | - | - |
Property Value by Mortgage Status in Peridot
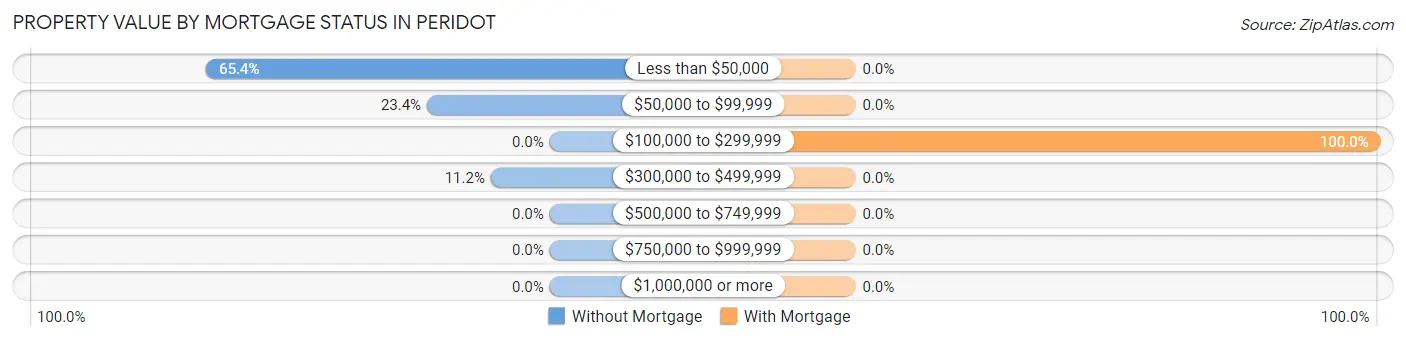
| Property Value | Without Mortgage | With Mortgage |
| Less than $50,000 | 140 (65.4%) | 0 (0.0%) |
| $50,000 to $99,999 | 50 (23.4%) | 0 (0.0%) |
| $100,000 to $299,999 | 0 (0.0%) | 16 (100.0%) |
| $300,000 to $499,999 | 24 (11.2%) | 0 (0.0%) |
| $500,000 to $749,999 | 0 (0.0%) | 0 (0.0%) |
| $750,000 to $999,999 | 0 (0.0%) | 0 (0.0%) |
| $1,000,000 or more | 0 (0.0%) | 0 (0.0%) |
| Total | 214 (100.0%) | 16 (100.0%) |
Household Income by Mortgage Status in Peridot
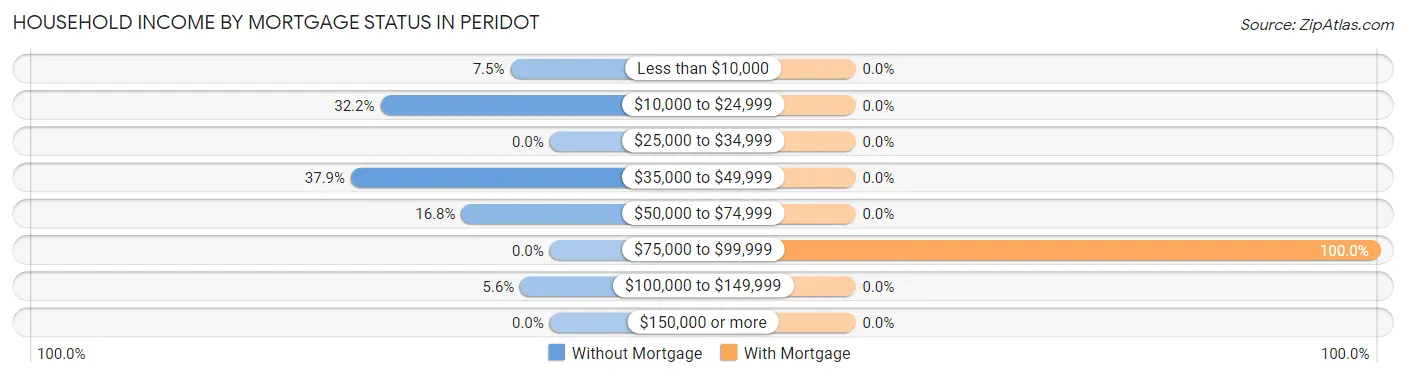
| Household Income | Without Mortgage | With Mortgage |
| Less than $10,000 | 16 (7.5%) | 0 (0.0%) |
| $10,000 to $24,999 | 69 (32.2%) | 0 (0.0%) |
| $25,000 to $34,999 | 0 (0.0%) | 0 (0.0%) |
| $35,000 to $49,999 | 81 (37.9%) | 0 (0.0%) |
| $50,000 to $74,999 | 36 (16.8%) | 0 (0.0%) |
| $75,000 to $99,999 | 0 (0.0%) | 16 (100.0%) |
| $100,000 to $149,999 | 12 (5.6%) | 0 (0.0%) |
| $150,000 or more | 0 (0.0%) | 0 (0.0%) |
| Total | 214 (100.0%) | 16 (100.0%) |
Property Value to Household Income Ratio in Peridot
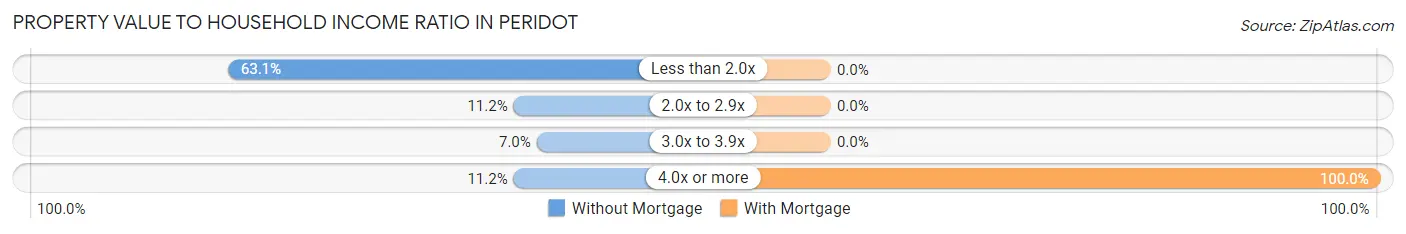
| Value-to-Income Ratio | Without Mortgage | With Mortgage |
| Less than 2.0x | 135 (63.1%) | 0 (0.0%) |
| 2.0x to 2.9x | 24 (11.2%) | 0 (0.0%) |
| 3.0x to 3.9x | 15 (7.0%) | 0 (0.0%) |
| 4.0x or more | 24 (11.2%) | 16 (100.0%) |
| Total | 214 (100.0%) | 16 (100.0%) |
Real Estate Taxes by Mortgage Status in Peridot
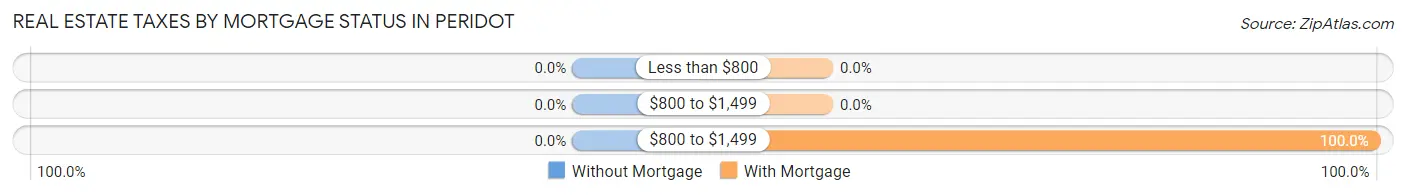
| Property Taxes | Without Mortgage | With Mortgage |
| Less than $800 | 0 (0.0%) | 0 (0.0%) |
| $800 to $1,499 | 0 (0.0%) | 0 (0.0%) |
| $800 to $1,499 | 0 (0.0%) | 16 (100.0%) |
| Total | 214 (100.0%) | 16 (100.0%) |
Health & Disability in Peridot
Health Insurance Coverage by Age in Peridot
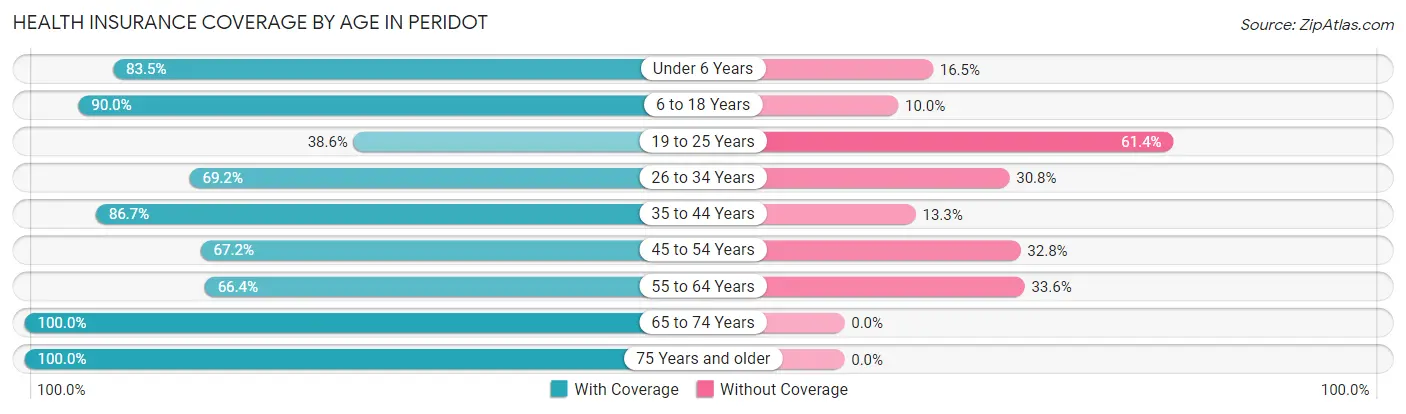
| Age Bracket | With Coverage | Without Coverage |
| Under 6 Years | 91 (83.5%) | 18 (16.5%) |
| 6 to 18 Years | 359 (90.0%) | 40 (10.0%) |
| 19 to 25 Years | 90 (38.6%) | 143 (61.4%) |
| 26 to 34 Years | 99 (69.2%) | 44 (30.8%) |
| 35 to 44 Years | 150 (86.7%) | 23 (13.3%) |
| 45 to 54 Years | 45 (67.2%) | 22 (32.8%) |
| 55 to 64 Years | 83 (66.4%) | 42 (33.6%) |
| 65 to 74 Years | 153 (100.0%) | 0 (0.0%) |
| 75 Years and older | 63 (100.0%) | 0 (0.0%) |
| Total | 1,133 (77.3%) | 332 (22.7%) |
Health Insurance Coverage by Citizenship Status in Peridot
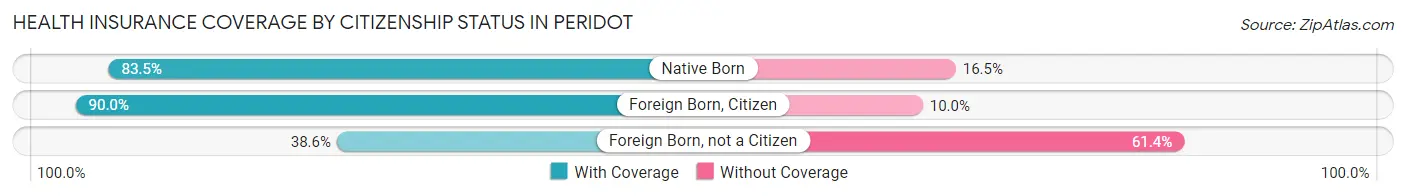
| Citizenship Status | With Coverage | Without Coverage |
| Native Born | 91 (83.5%) | 18 (16.5%) |
| Foreign Born, Citizen | 359 (90.0%) | 40 (10.0%) |
| Foreign Born, not a Citizen | 90 (38.6%) | 143 (61.4%) |
Health Insurance Coverage by Household Income in Peridot
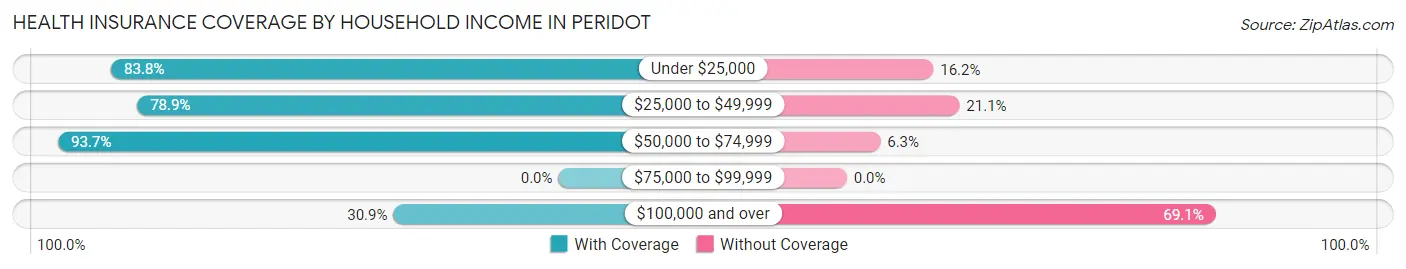
| Household Income | With Coverage | Without Coverage |
| Under $25,000 | 336 (83.8%) | 65 (16.2%) |
| $25,000 to $49,999 | 374 (78.9%) | 100 (21.1%) |
| $50,000 to $74,999 | 359 (93.7%) | 24 (6.3%) |
| $75,000 to $99,999 | 0 (0.0%) | 0 (0.0%) |
| $100,000 and over | 64 (30.9%) | 143 (69.1%) |
Public vs Private Health Insurance Coverage by Age in Peridot
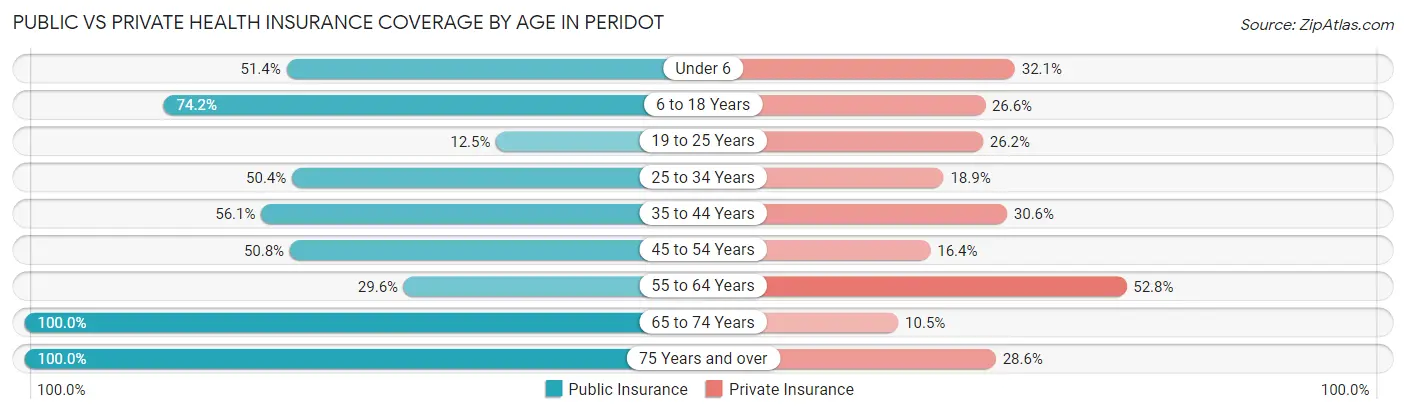
| Age Bracket | Public Insurance | Private Insurance |
| Under 6 | 56 (51.4%) | 35 (32.1%) |
| 6 to 18 Years | 296 (74.2%) | 106 (26.6%) |
| 19 to 25 Years | 29 (12.4%) | 61 (26.2%) |
| 25 to 34 Years | 72 (50.3%) | 27 (18.9%) |
| 35 to 44 Years | 97 (56.1%) | 53 (30.6%) |
| 45 to 54 Years | 34 (50.7%) | 11 (16.4%) |
| 55 to 64 Years | 37 (29.6%) | 66 (52.8%) |
| 65 to 74 Years | 153 (100.0%) | 16 (10.5%) |
| 75 Years and over | 63 (100.0%) | 18 (28.6%) |
| Total | 837 (57.1%) | 393 (26.8%) |
Disability Status by Sex by Age in Peridot
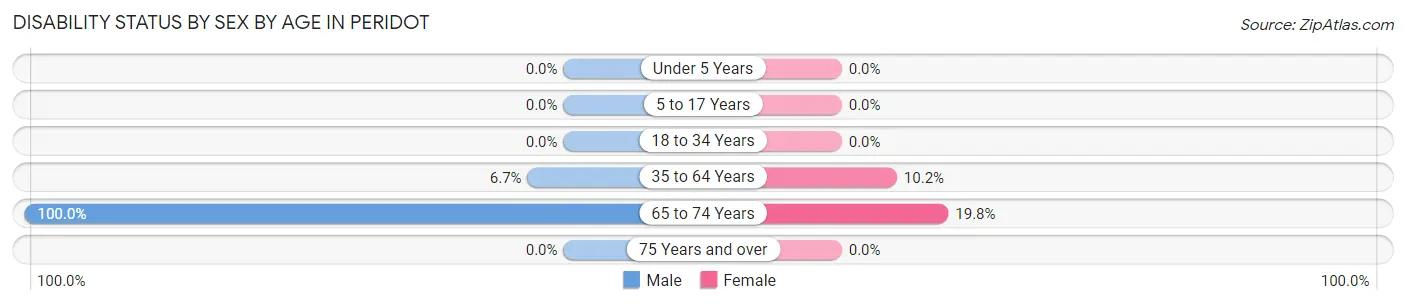
| Age Bracket | Male | Female |
| Under 5 Years | 0 (0.0%) | 0 (0.0%) |
| 5 to 17 Years | 0 (0.0%) | 0 (0.0%) |
| 18 to 34 Years | 0 (0.0%) | 0 (0.0%) |
| 35 to 64 Years | 10 (6.7%) | 22 (10.2%) |
| 65 to 74 Years | 62 (100.0%) | 18 (19.8%) |
| 75 Years and over | 0 (0.0%) | 0 (0.0%) |
Disability Class by Sex by Age in Peridot
Disability Class: Hearing Difficulty
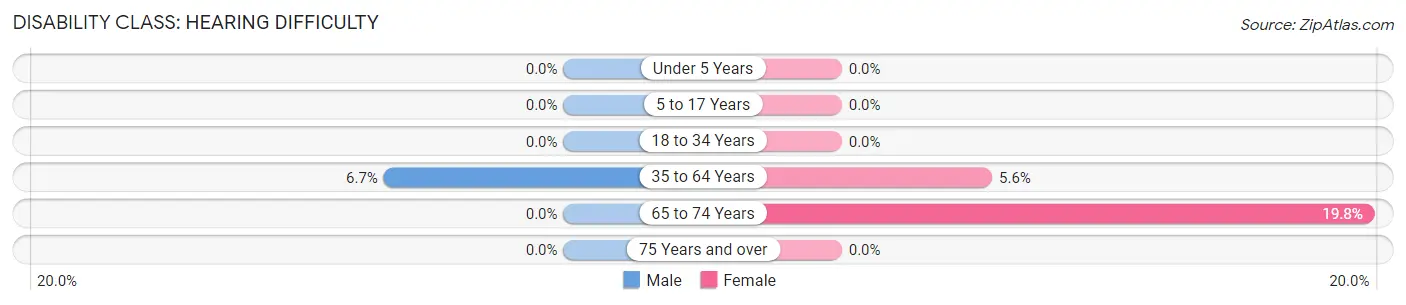
| Age Bracket | Male | Female |
| Under 5 Years | 0 (0.0%) | 0 (0.0%) |
| 5 to 17 Years | 0 (0.0%) | 0 (0.0%) |
| 18 to 34 Years | 0 (0.0%) | 0 (0.0%) |
| 35 to 64 Years | 10 (6.7%) | 12 (5.6%) |
| 65 to 74 Years | 0 (0.0%) | 18 (19.8%) |
| 75 Years and over | 0 (0.0%) | 0 (0.0%) |
Disability Class: Vision Difficulty
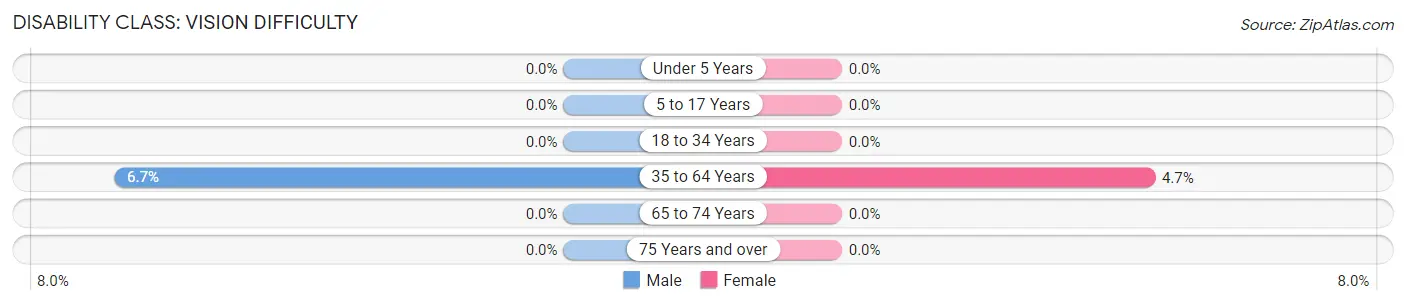
| Age Bracket | Male | Female |
| Under 5 Years | 0 (0.0%) | 0 (0.0%) |
| 5 to 17 Years | 0 (0.0%) | 0 (0.0%) |
| 18 to 34 Years | 0 (0.0%) | 0 (0.0%) |
| 35 to 64 Years | 10 (6.7%) | 10 (4.6%) |
| 65 to 74 Years | 0 (0.0%) | 0 (0.0%) |
| 75 Years and over | 0 (0.0%) | 0 (0.0%) |
Disability Class: Cognitive Difficulty
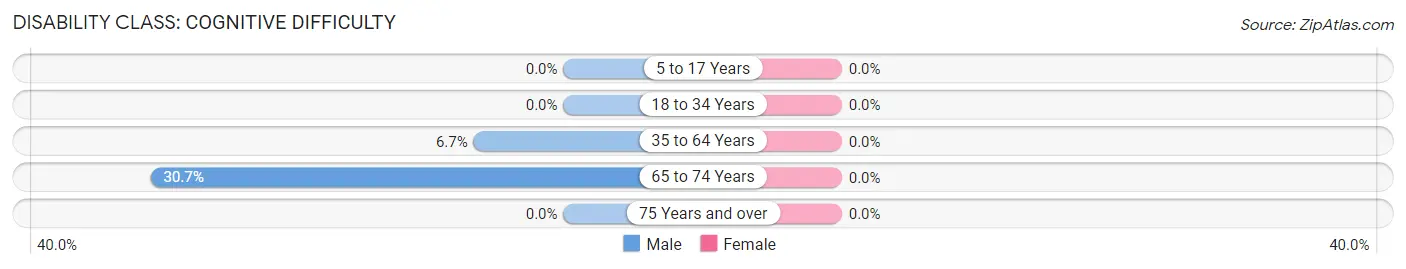
| Age Bracket | Male | Female |
| 5 to 17 Years | 0 (0.0%) | 0 (0.0%) |
| 18 to 34 Years | 0 (0.0%) | 0 (0.0%) |
| 35 to 64 Years | 10 (6.7%) | 0 (0.0%) |
| 65 to 74 Years | 19 (30.6%) | 0 (0.0%) |
| 75 Years and over | 0 (0.0%) | 0 (0.0%) |
Disability Class: Ambulatory Difficulty
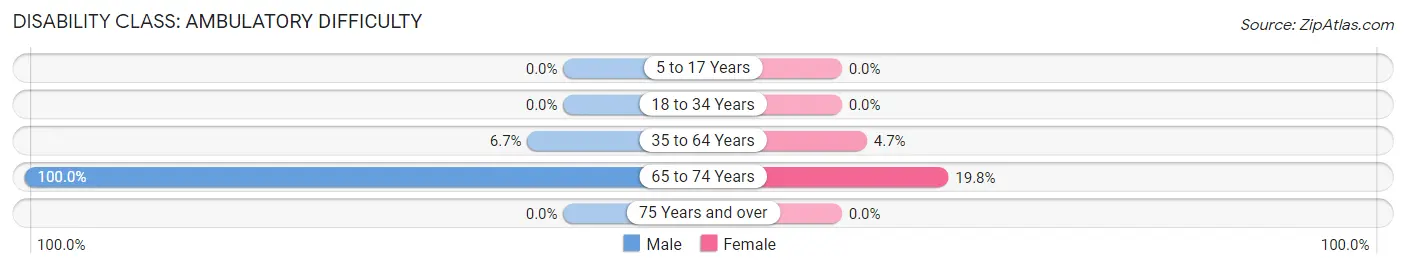
| Age Bracket | Male | Female |
| 5 to 17 Years | 0 (0.0%) | 0 (0.0%) |
| 18 to 34 Years | 0 (0.0%) | 0 (0.0%) |
| 35 to 64 Years | 10 (6.7%) | 10 (4.6%) |
| 65 to 74 Years | 62 (100.0%) | 18 (19.8%) |
| 75 Years and over | 0 (0.0%) | 0 (0.0%) |
Disability Class: Self-Care Difficulty
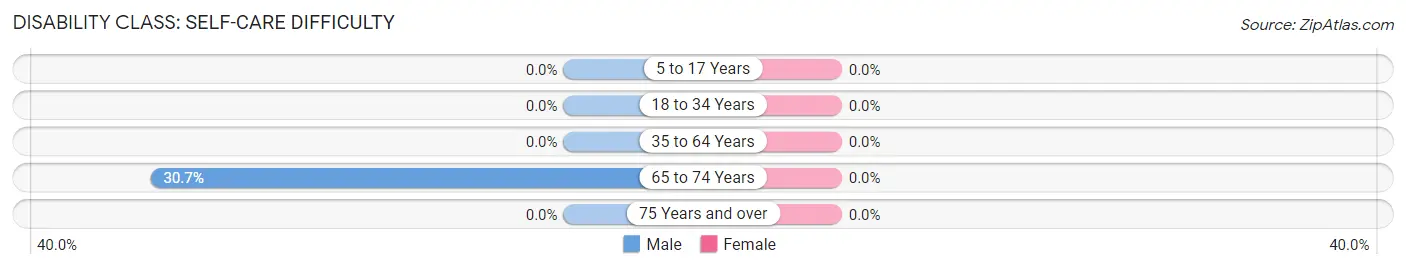
| Age Bracket | Male | Female |
| 5 to 17 Years | 0 (0.0%) | 0 (0.0%) |
| 18 to 34 Years | 0 (0.0%) | 0 (0.0%) |
| 35 to 64 Years | 0 (0.0%) | 0 (0.0%) |
| 65 to 74 Years | 19 (30.6%) | 0 (0.0%) |
| 75 Years and over | 0 (0.0%) | 0 (0.0%) |
Technology Access in Peridot
Computing Device Access in Peridot
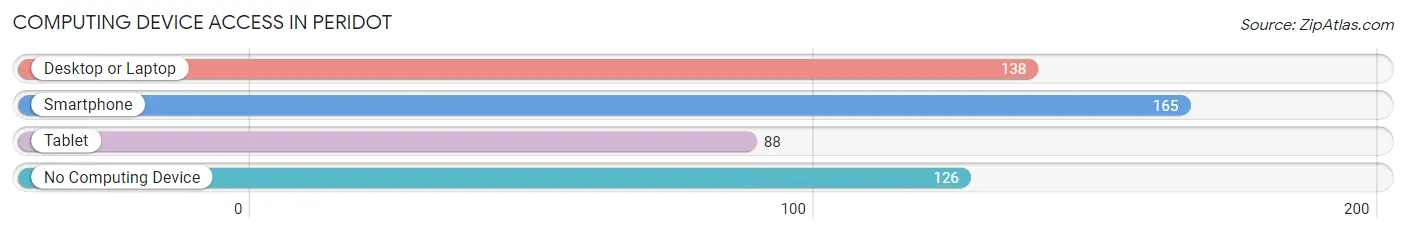
| Device Type | # Households | % Households |
| Desktop or Laptop | 138 | 45.1% |
| Smartphone | 165 | 53.9% |
| Tablet | 88 | 28.8% |
| No Computing Device | 126 | 41.2% |
| Total | 306 | 100.0% |
Internet Access in Peridot
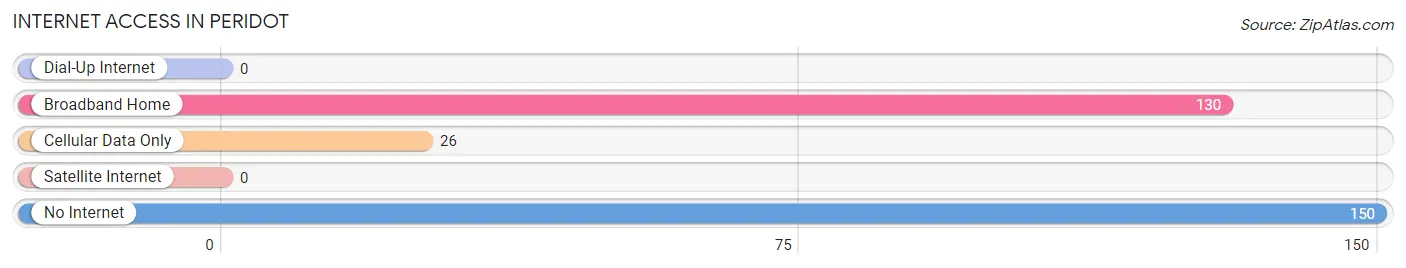
| Internet Type | # Households | % Households |
| Dial-Up Internet | 0 | 0.0% |
| Broadband Home | 130 | 42.5% |
| Cellular Data Only | 26 | 8.5% |
| Satellite Internet | 0 | 0.0% |
| No Internet | 150 | 49.0% |
| Total | 306 | 100.0% |
Peridot Summary
Peridot, Arizona is a small unincorporated community located in the Gila River Indian Community in the state of Arizona. It is located in the southwestern part of the state, approximately 40 miles east of Phoenix. The population of Peridot was estimated to be 1,072 in the 2010 census.
Geography
Peridot is located in the Gila River Indian Community, which is a federally recognized Indian reservation. The reservation is located in the southwestern part of the state, and is bordered by the Gila River to the south, the Salt River to the east, and the San Carlos Apache Indian Reservation to the north. The reservation covers an area of approximately 5,400 square miles, and is home to the Pima and Maricopa tribes.
The climate in Peridot is arid and semi-arid, with hot summers and mild winters. The average annual temperature is around 70 degrees Fahrenheit, with temperatures reaching up to 110 degrees in the summer months. The average annual precipitation is around 8 inches, with most of the precipitation occurring in the summer months.
Economy
The economy of Peridot is largely based on agriculture and tourism. The Gila River Indian Community is home to several agricultural operations, including cotton, alfalfa, and melon farms. The community also has several casinos, which provide employment opportunities for local residents.
Tourism is also an important part of the economy in Peridot. The Gila River Indian Community is home to several tourist attractions, including the Gila River Indian Reservation Museum, the Gila River Indian Reservation Cultural Center, and the Gila River Indian Reservation Wildlife Refuge.
Demographics
As of the 2010 census, the population of Peridot was estimated to be 1,072. The population is primarily Native American, with the majority of the population belonging to the Pima and Maricopa tribes. The median age of the population is 28.7 years, and the median household income is $25,000.
The majority of the population is employed in the agricultural and tourism industries. The unemployment rate in Peridot is 8.2%, which is higher than the national average.
Conclusion
Peridot, Arizona is a small unincorporated community located in the Gila River Indian Community in the state of Arizona. The population of Peridot is primarily Native American, with the majority of the population belonging to the Pima and Maricopa tribes. The economy of Peridot is largely based on agriculture and tourism, and the unemployment rate is 8.2%. Peridot is a unique community with a rich history and culture, and is an important part of the Gila River Indian Community.
Common Questions
What is Per Capita Income in Peridot?
Per Capita income in Peridot is $8,736.
What is the Median Family Income in Peridot?
Median Family Income in Peridot is $41,765.
What is the Median Household income in Peridot?
Median Household Income in Peridot is $40,074.
What is Income or Wage Gap in Peridot?
Income or Wage Gap in Peridot is 14.6%.
Women in Peridot earn 85.4 cents for every dollar earned by a man.
What is Inequality or Gini Index in Peridot?
Inequality or Gini Index in Peridot is 0.35.
What is the Total Population of Peridot?
Total Population of Peridot is 1,465.
What is the Total Male Population of Peridot?
Total Male Population of Peridot is 682.
What is the Total Female Population of Peridot?
Total Female Population of Peridot is 783.
What is the Ratio of Males per 100 Females in Peridot?
There are 87.10 Males per 100 Females in Peridot.
What is the Ratio of Females per 100 Males in Peridot?
There are 114.81 Females per 100 Males in Peridot.
What is the Median Population Age in Peridot?
Median Population Age in Peridot is 25.9 Years.
What is the Average Family Size in Peridot
Average Family Size in Peridot is 5.4 People.
What is the Average Household Size in Peridot
Average Household Size in Peridot is 4.8 People.
How Large is the Labor Force in Peridot?
There are 374 People in the Labor Forcein in Peridot.
What is the Percentage of People in the Labor Force in Peridot?
33.5% of People are in the Labor Force in Peridot.
What is the Unemployment Rate in Peridot?
Unemployment Rate in Peridot is 40.6%.