Parks, AZ Map & Demographics
Parks Map
Parks Overview
$42,436
PER CAPITA INCOME
$119,063
AVG FAMILY INCOME
$93,854
AVG HOUSEHOLD INCOME
21.9%
WAGE / INCOME GAP [ % ]
78.1¢/ $1
WAGE / INCOME GAP [ $ ]
0.39
INEQUALITY / GINI INDEX
1,352
TOTAL POPULATION
589
MALE POPULATION
763
FEMALE POPULATION
77.20
MALES / 100 FEMALES
129.54
FEMALES / 100 MALES
43.9
MEDIAN AGE
3.1
AVG FAMILY SIZE
2.7
AVG HOUSEHOLD SIZE
532
LABOR FORCE [ PEOPLE ]
48.6%
PERCENT IN LABOR FORCE
1.1%
UNEMPLOYMENT RATE
Parks Zip Codes
Parks Area Codes
Income in Parks
Income Overview in Parks
Per Capita Income in Parks is $42,436, while median incomes of families and households are $119,063 and $93,854 respectively.
| Characteristic | Number | Measure |
| Per Capita Income | 1,352 | $42,436 |
| Median Family Income | 383 | $119,063 |
| Mean Family Income | 383 | $126,626 |
| Median Household Income | 509 | $93,854 |
| Mean Household Income | 509 | $110,776 |
| Income Deficit | 383 | $0 |
| Wage / Income Gap (%) | 1,352 | 21.93% |
| Wage / Income Gap ($) | 1,352 | 78.07¢ per $1 |
| Gini / Inequality Index | 1,352 | 0.39 |
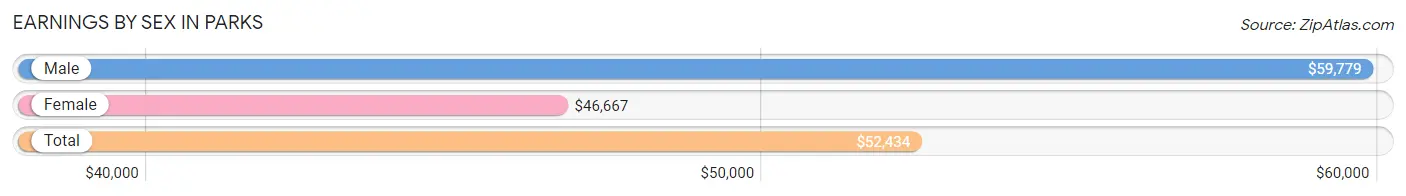
Earnings by Sex in Parks
Average Earnings in Parks are $52,434, $59,779 for men and $46,667 for women, a difference of 21.9%.
| Sex | Number | Average Earnings |
| Male | 277 (44.8%) | $59,779 |
| Female | 342 (55.2%) | $46,667 |
| Total | 619 (100.0%) | $52,434 |
Earnings by Sex by Income Bracket in Parks
The most common earnings brackets in Parks are $100,000+ for men (65 | 23.5%) and $65,000 to $74,999 for women (68 | 19.9%).
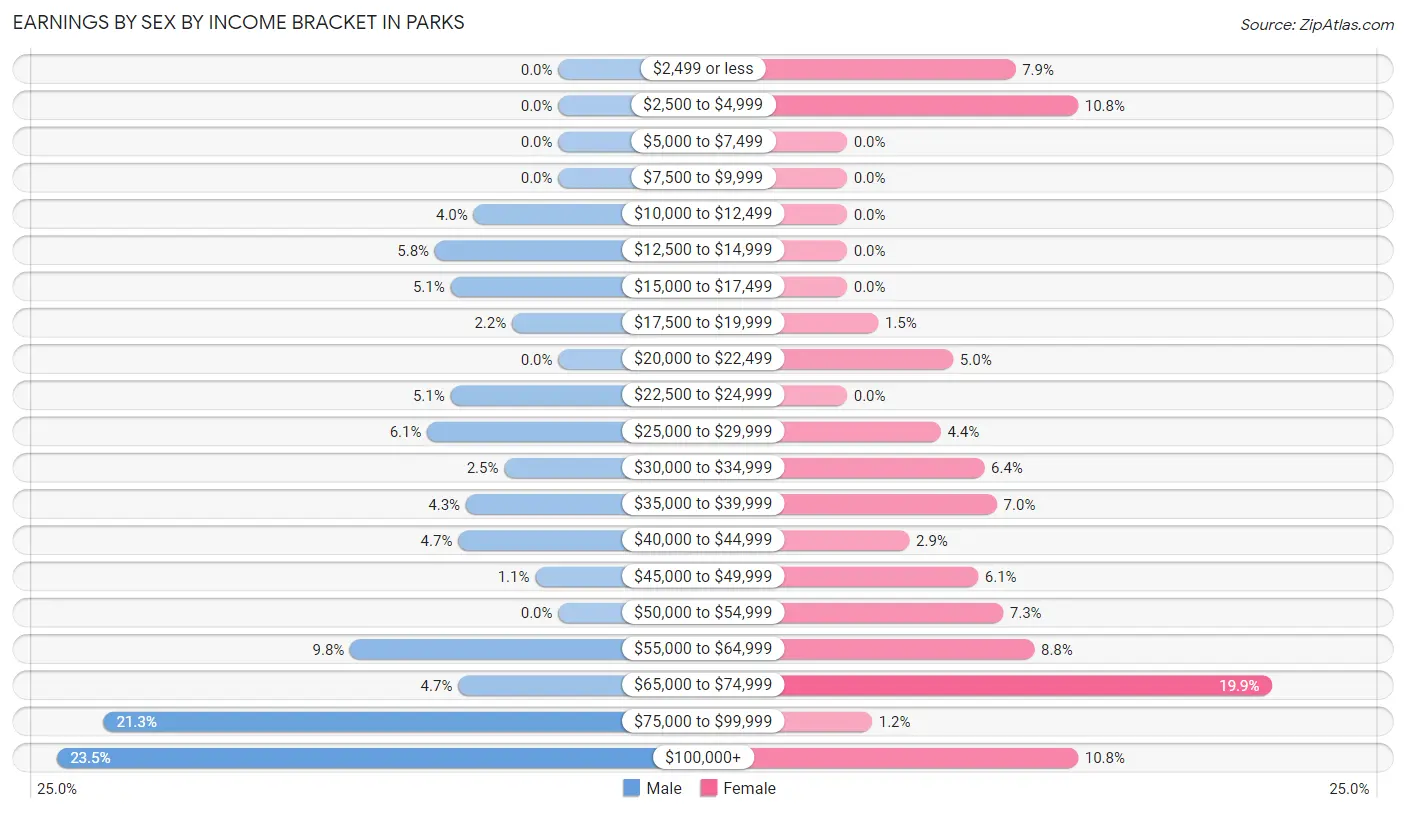
| Income | Male | Female |
| $2,499 or less | 0 (0.0%) | 27 (7.9%) |
| $2,500 to $4,999 | 0 (0.0%) | 37 (10.8%) |
| $5,000 to $7,499 | 0 (0.0%) | 0 (0.0%) |
| $7,500 to $9,999 | 0 (0.0%) | 0 (0.0%) |
| $10,000 to $12,499 | 11 (4.0%) | 0 (0.0%) |
| $12,500 to $14,999 | 16 (5.8%) | 0 (0.0%) |
| $15,000 to $17,499 | 14 (5.1%) | 0 (0.0%) |
| $17,500 to $19,999 | 6 (2.2%) | 5 (1.5%) |
| $20,000 to $22,499 | 0 (0.0%) | 17 (5.0%) |
| $22,500 to $24,999 | 14 (5.1%) | 0 (0.0%) |
| $25,000 to $29,999 | 17 (6.1%) | 15 (4.4%) |
| $30,000 to $34,999 | 7 (2.5%) | 22 (6.4%) |
| $35,000 to $39,999 | 12 (4.3%) | 24 (7.0%) |
| $40,000 to $44,999 | 13 (4.7%) | 10 (2.9%) |
| $45,000 to $49,999 | 3 (1.1%) | 21 (6.1%) |
| $50,000 to $54,999 | 0 (0.0%) | 25 (7.3%) |
| $55,000 to $64,999 | 27 (9.8%) | 30 (8.8%) |
| $65,000 to $74,999 | 13 (4.7%) | 68 (19.9%) |
| $75,000 to $99,999 | 59 (21.3%) | 4 (1.2%) |
| $100,000+ | 65 (23.5%) | 37 (10.8%) |
| Total | 277 (100.0%) | 342 (100.0%) |
Earnings by Sex by Educational Attainment in Parks
Average earnings in Parks are $74,615 for men and $52,434 for women, a difference of 29.7%. Men with an educational attainment of bachelor's degree enjoy the highest average annual earnings of $82,188, while those with college or associate's degree education earn the least with $41,827. Women with an educational attainment of bachelor's degree earn the most with the average annual earnings of $68,407, while those with high school diploma education have the smallest earnings of $2,499.
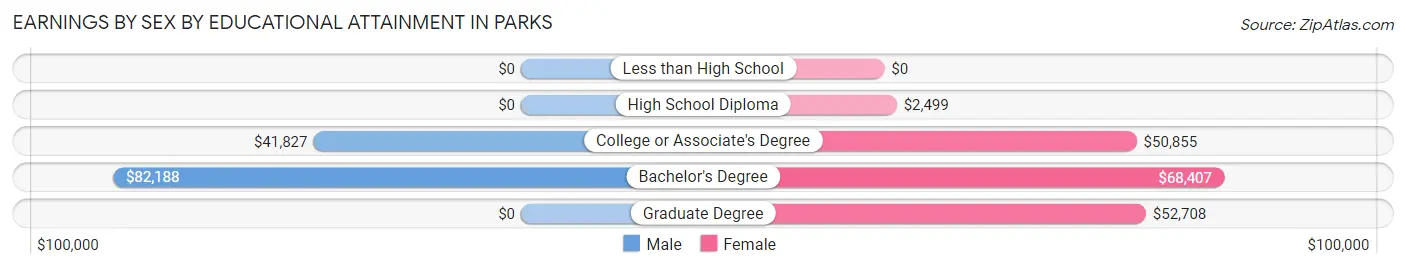
| Educational Attainment | Male Income | Female Income |
| Less than High School | - | - |
| High School Diploma | - | - |
| College or Associate's Degree | $41,827 | $50,855 |
| Bachelor's Degree | $82,188 | $68,407 |
| Graduate Degree | - | - |
| Total | $74,615 | $52,434 |
Family Income in Parks
Family Income Brackets in Parks
According to the Parks family income data, there are 88 families falling into the $100,000 to $149,999 income range, which is the most common income bracket and makes up 23.0% of all families. Conversely, the $10,000 to $14,999 income bracket is the least frequent group with only 4 families (1.0%) belonging to this category.
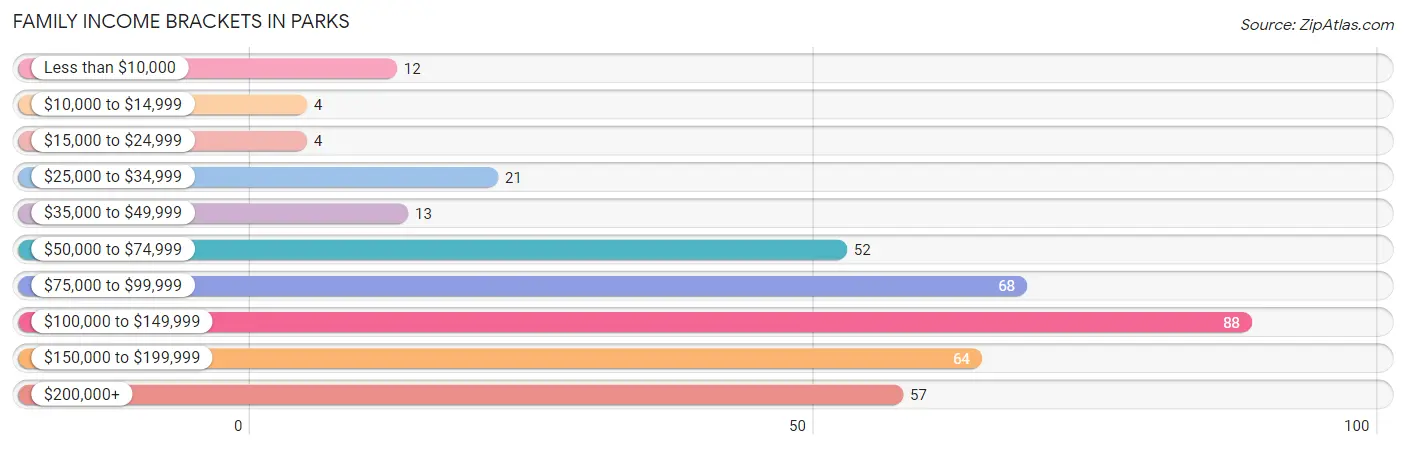
| Income Bracket | # Families | % Families |
| Less than $10,000 | 12 | 3.1% |
| $10,000 to $14,999 | 4 | 1.0% |
| $15,000 to $24,999 | 4 | 1.0% |
| $25,000 to $34,999 | 21 | 5.5% |
| $35,000 to $49,999 | 13 | 3.4% |
| $50,000 to $74,999 | 52 | 13.6% |
| $75,000 to $99,999 | 68 | 17.8% |
| $100,000 to $149,999 | 88 | 23.0% |
| $150,000 to $199,999 | 64 | 16.7% |
| $200,000+ | 57 | 14.9% |
Family Income by Famaliy Size in Parks
3-person families (31 | 8.1%) account for the highest median family income in Parks with $99,479 per family, while 2-person families (270 | 70.5%) have the highest median income of $47,188 per family member.
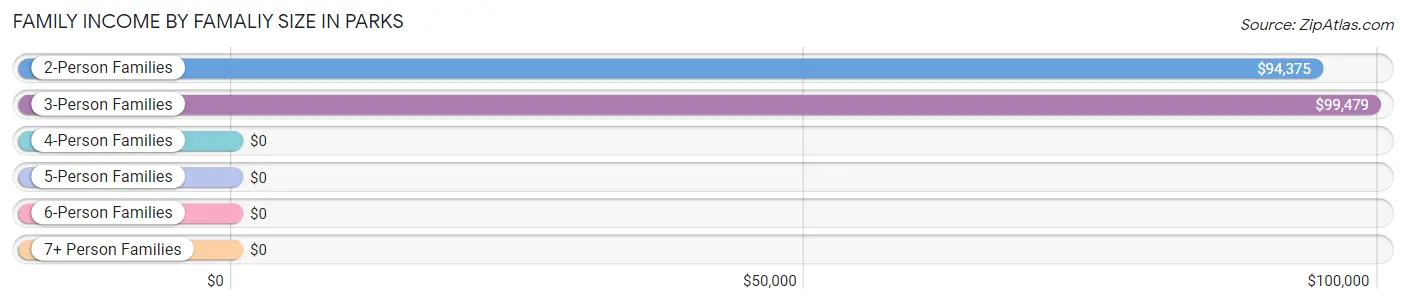
| Income Bracket | # Families | Median Income |
| 2-Person Families | 270 (70.5%) | $94,375 |
| 3-Person Families | 31 (8.1%) | $99,479 |
| 4-Person Families | 14 (3.7%) | $0 |
| 5-Person Families | 13 (3.4%) | $0 |
| 6-Person Families | 25 (6.5%) | $0 |
| 7+ Person Families | 30 (7.8%) | $0 |
| Total | 383 (100.0%) | $119,063 |
Family Income by Number of Earners in Parks
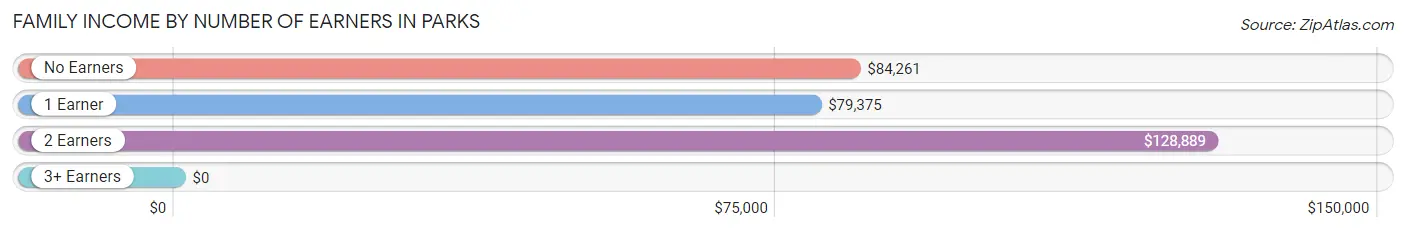
| Number of Earners | # Families | Median Income |
| No Earners | 109 (28.5%) | $84,261 |
| 1 Earner | 107 (27.9%) | $79,375 |
| 2 Earners | 124 (32.4%) | $128,889 |
| 3+ Earners | 43 (11.2%) | $0 |
| Total | 383 (100.0%) | $119,063 |
Household Income in Parks
Household Income Brackets in Parks
With 102 households falling in the category, the $100,000 to $149,999 income range is the most frequent in Parks, accounting for 20.0% of all households. In contrast, only 4 households (0.8%) fall into the $10,000 to $14,999 income bracket, making it the least populous group.
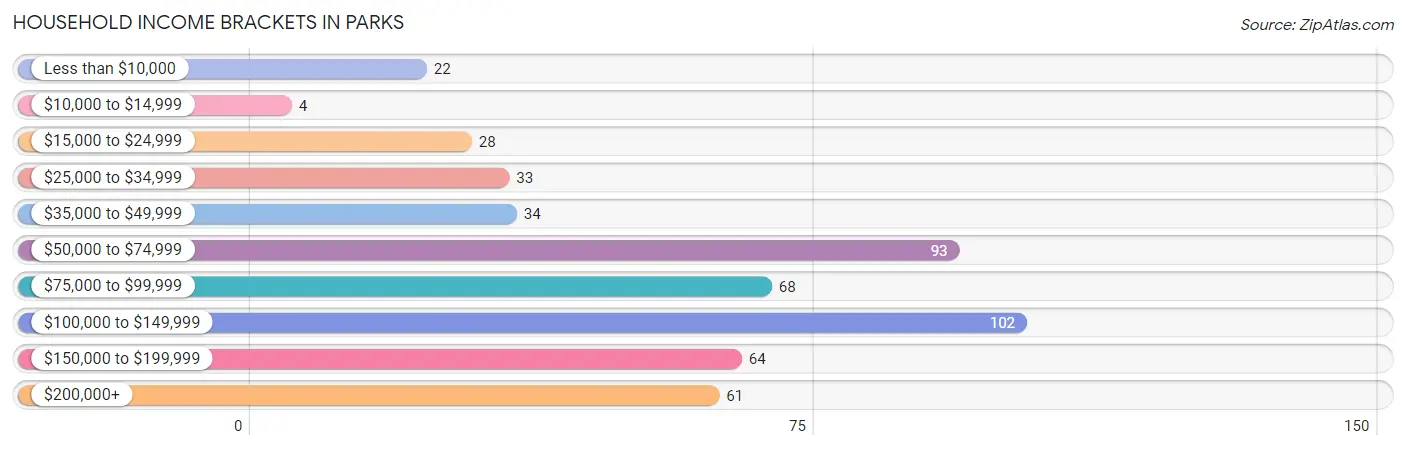
| Income Bracket | # Households | % Households |
| Less than $10,000 | 22 | 4.3% |
| $10,000 to $14,999 | 4 | 0.8% |
| $15,000 to $24,999 | 28 | 5.5% |
| $25,000 to $34,999 | 33 | 6.5% |
| $35,000 to $49,999 | 34 | 6.7% |
| $50,000 to $74,999 | 93 | 18.3% |
| $75,000 to $99,999 | 68 | 13.4% |
| $100,000 to $149,999 | 102 | 20.0% |
| $150,000 to $199,999 | 64 | 12.6% |
| $200,000+ | 61 | 12.0% |
Household Income by Householder Age in Parks
The median household income in Parks is $93,854, with the highest median household income of $145,917 found in the 25 to 44 years age bracket for the primary householder. A total of 137 households (26.9%) fall into this category.
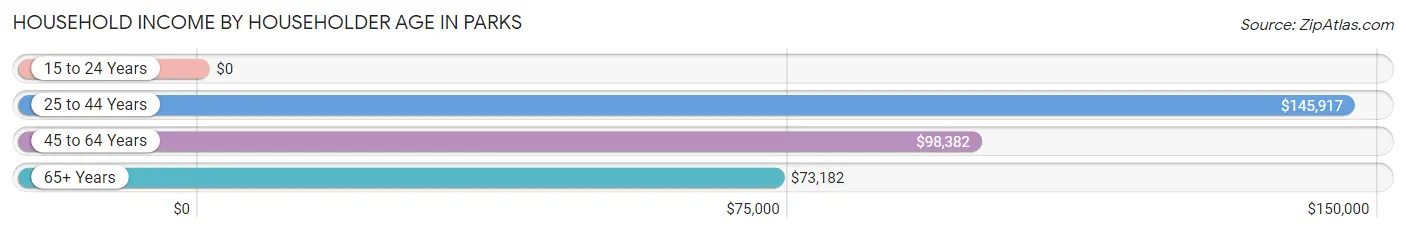
| Income Bracket | # Households | Median Income |
| 15 to 24 Years | 0 (0.0%) | $0 |
| 25 to 44 Years | 137 (26.9%) | $145,917 |
| 45 to 64 Years | 148 (29.1%) | $98,382 |
| 65+ Years | 224 (44.0%) | $73,182 |
| Total | 509 (100.0%) | $93,854 |
Poverty in Parks
Income Below Poverty by Sex and Age in Parks
With 2.4% poverty level for males and 3.4% for females among the residents of Parks, 65 to 74 year old males and 75 year old and over females are the most vulnerable to poverty, with 14 males (9.9%) and 10 females (13.2%) in their respective age groups living below the poverty level.
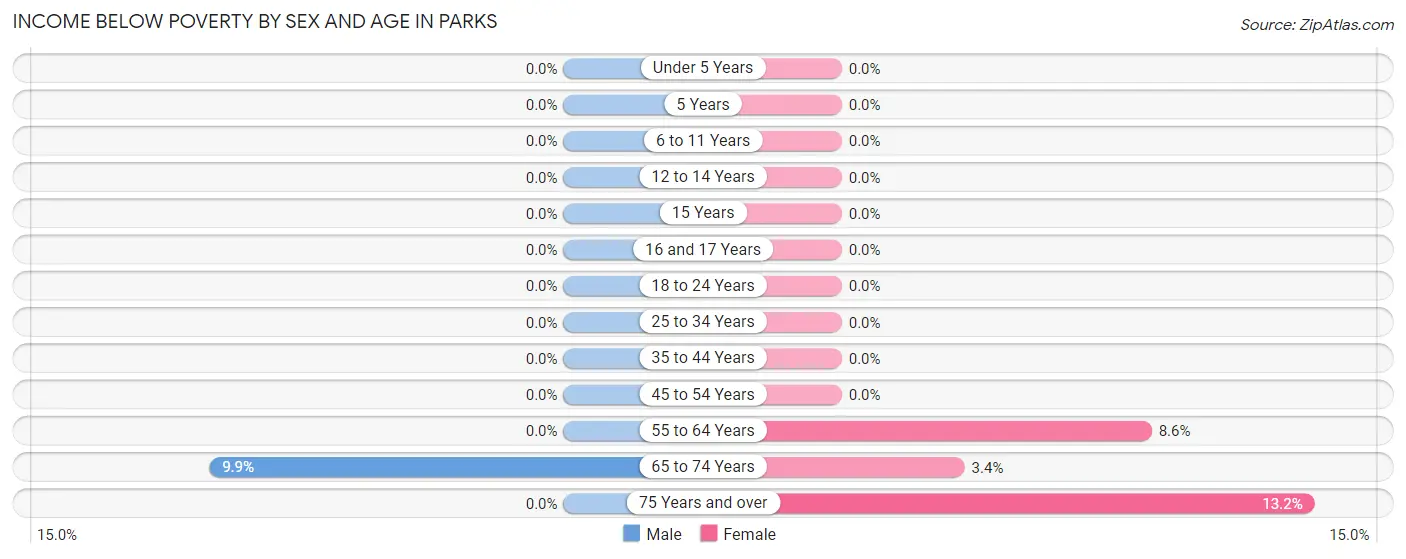
| Age Bracket | Male | Female |
| Under 5 Years | 0 (0.0%) | 0 (0.0%) |
| 5 Years | 0 (0.0%) | 0 (0.0%) |
| 6 to 11 Years | 0 (0.0%) | 0 (0.0%) |
| 12 to 14 Years | 0 (0.0%) | 0 (0.0%) |
| 15 Years | 0 (0.0%) | 0 (0.0%) |
| 16 and 17 Years | 0 (0.0%) | 0 (0.0%) |
| 18 to 24 Years | 0 (0.0%) | 0 (0.0%) |
| 25 to 34 Years | 0 (0.0%) | 0 (0.0%) |
| 35 to 44 Years | 0 (0.0%) | 0 (0.0%) |
| 45 to 54 Years | 0 (0.0%) | 0 (0.0%) |
| 55 to 64 Years | 0 (0.0%) | 12 (8.6%) |
| 65 to 74 Years | 14 (9.9%) | 4 (3.4%) |
| 75 Years and over | 0 (0.0%) | 10 (13.2%) |
| Total | 14 (2.4%) | 26 (3.4%) |
Income Above Poverty by Sex and Age in Parks
According to the poverty statistics in Parks, males aged under 5 years and females aged under 5 years are the age groups that are most secure financially, with 100.0% of males and 100.0% of females in these age groups living above the poverty line.
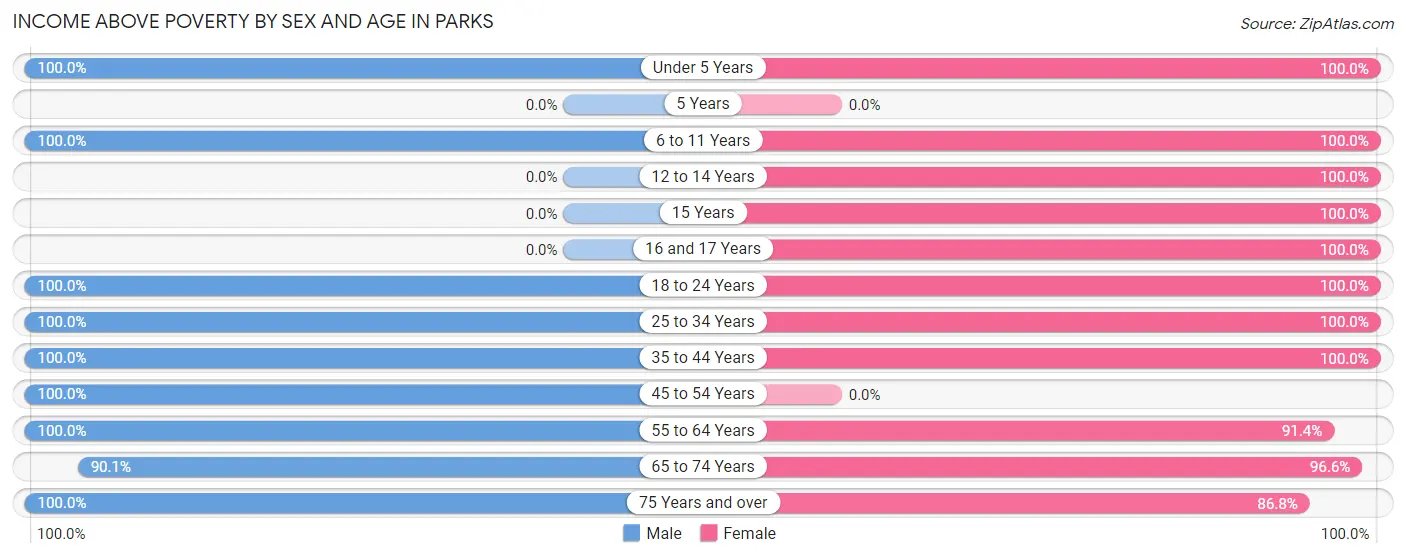
| Age Bracket | Male | Female |
| Under 5 Years | 23 (100.0%) | 51 (100.0%) |
| 5 Years | 0 (0.0%) | 0 (0.0%) |
| 6 to 11 Years | 51 (100.0%) | 82 (100.0%) |
| 12 to 14 Years | 0 (0.0%) | 38 (100.0%) |
| 15 Years | 0 (0.0%) | 12 (100.0%) |
| 16 and 17 Years | 0 (0.0%) | 43 (100.0%) |
| 18 to 24 Years | 60 (100.0%) | 51 (100.0%) |
| 25 to 34 Years | 39 (100.0%) | 64 (100.0%) |
| 35 to 44 Years | 80 (100.0%) | 90 (100.0%) |
| 45 to 54 Years | 56 (100.0%) | 0 (0.0%) |
| 55 to 64 Years | 84 (100.0%) | 127 (91.4%) |
| 65 to 74 Years | 128 (90.1%) | 113 (96.6%) |
| 75 Years and over | 54 (100.0%) | 66 (86.8%) |
| Total | 575 (97.6%) | 737 (96.6%) |
Income Below Poverty Among Married-Couple Families in Parks
The poverty statistics for married-couple families in Parks show that 4.7% or 16 of the total 340 families live below the poverty line. Families with no children have the highest poverty rate of 6.4%, comprising of 16 families. On the other hand, families with 1 or 2 children have the lowest poverty rate of 0.0%, which includes 0 families.
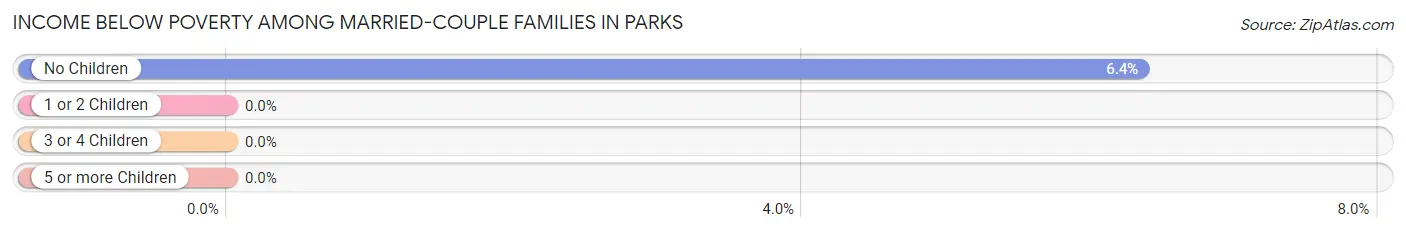
| Children | Above Poverty | Below Poverty |
| No Children | 236 (93.6%) | 16 (6.4%) |
| 1 or 2 Children | 20 (100.0%) | 0 (0.0%) |
| 3 or 4 Children | 68 (100.0%) | 0 (0.0%) |
| 5 or more Children | 0 (0.0%) | 0 (0.0%) |
| Total | 324 (95.3%) | 16 (4.7%) |
Income Below Poverty Among Single-Parent Households in Parks
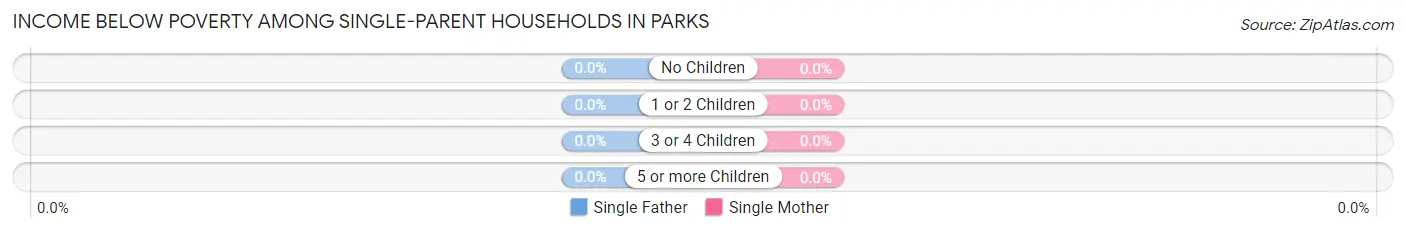
| Children | Single Father | Single Mother |
| No Children | 0 (0.0%) | 0 (0.0%) |
| 1 or 2 Children | 0 (0.0%) | 0 (0.0%) |
| 3 or 4 Children | 0 (0.0%) | 0 (0.0%) |
| 5 or more Children | 0 (0.0%) | 0 (0.0%) |
| Total | 0 (0.0%) | 0 (0.0%) |
Income Below Poverty Among Married-Couple vs Single-Parent Households in Parks
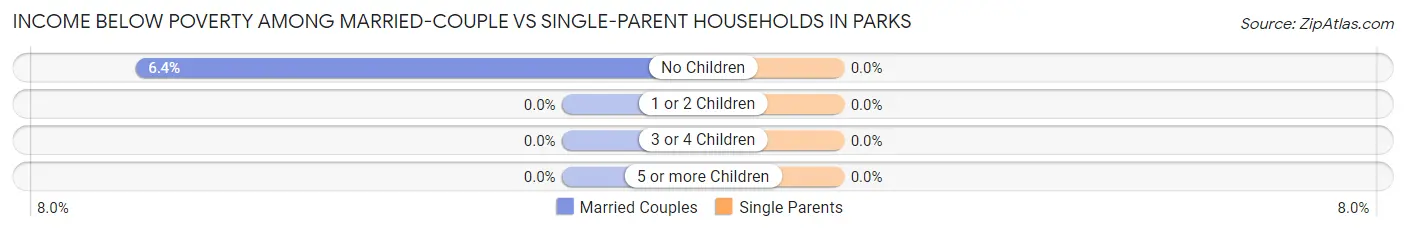
| Children | Married-Couple Families | Single-Parent Households |
| No Children | 16 (6.4%) | 0 (0.0%) |
| 1 or 2 Children | 0 (0.0%) | 0 (0.0%) |
| 3 or 4 Children | 0 (0.0%) | 0 (0.0%) |
| 5 or more Children | 0 (0.0%) | 0 (0.0%) |
| Total | 16 (4.7%) | 0 (0.0%) |
Race in Parks
The most populous races in Parks are White / Caucasian (1,322 | 97.8%), Two or more Races (24 | 1.8%), and Native / Alaskan (6 | 0.4%).
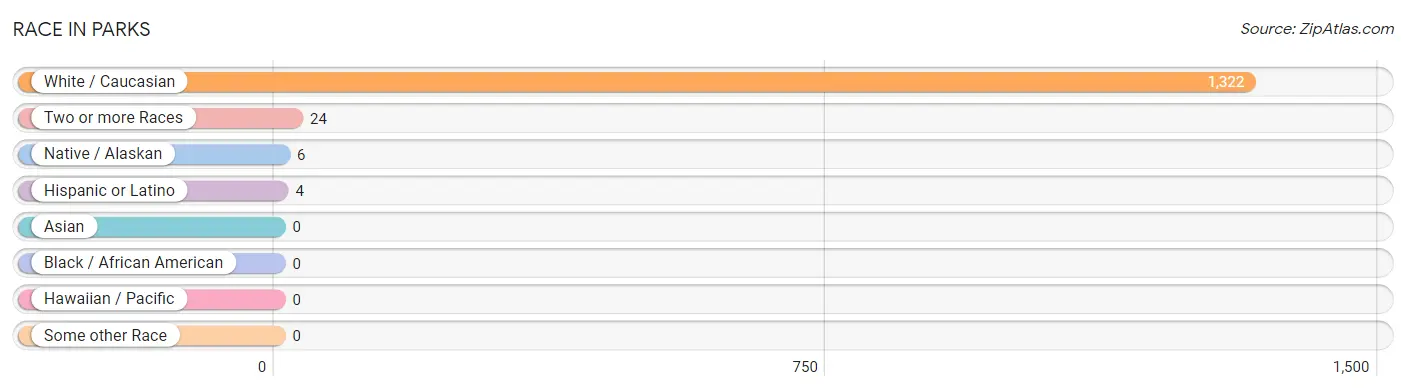
| Race | # Population | % Population |
| Asian | 0 | 0.0% |
| Black / African American | 0 | 0.0% |
| Hawaiian / Pacific | 0 | 0.0% |
| Hispanic or Latino | 4 | 0.3% |
| Native / Alaskan | 6 | 0.4% |
| White / Caucasian | 1,322 | 97.8% |
| Two or more Races | 24 | 1.8% |
| Some other Race | 0 | 0.0% |
| Total | 1,352 | 100.0% |
Ancestry in Parks
The most populous ancestries reported in Parks are German (517 | 38.2%), English (325 | 24.0%), Danish (156 | 11.5%), Irish (108 | 8.0%), and American (75 | 5.6%), together accounting for 87.4% of all Parks residents.
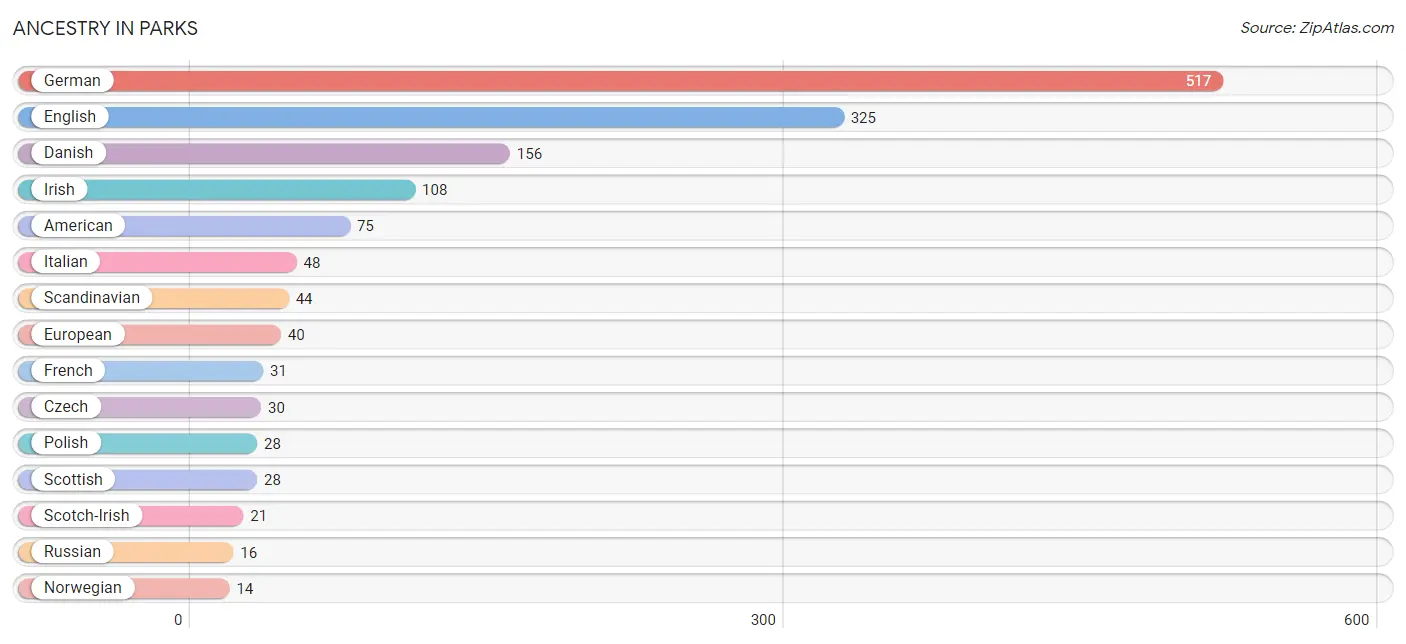
| Ancestry | # Population | % Population |
| American | 75 | 5.6% |
| Austrian | 5 | 0.4% |
| Bhutanese | 13 | 1.0% |
| Cherokee | 11 | 0.8% |
| Czech | 30 | 2.2% |
| Czechoslovakian | 5 | 0.4% |
| Danish | 156 | 11.5% |
| English | 325 | 24.0% |
| European | 40 | 3.0% |
| French | 31 | 2.3% |
| German | 517 | 38.2% |
| Greek | 3 | 0.2% |
| Hungarian | 13 | 1.0% |
| Irish | 108 | 8.0% |
| Italian | 48 | 3.5% |
| Macedonian | 3 | 0.2% |
| Mexican | 4 | 0.3% |
| Navajo | 6 | 0.4% |
| Norwegian | 14 | 1.0% |
| Polish | 28 | 2.1% |
| Portuguese | 6 | 0.4% |
| Russian | 16 | 1.2% |
| Scandinavian | 44 | 3.3% |
| Scotch-Irish | 21 | 1.5% |
| Scottish | 28 | 2.1% |
| Swedish | 5 | 0.4% |
| Swiss | 9 | 0.7% |
| Ukrainian | 6 | 0.4% |
| Welsh | 14 | 1.0% | View All 29 Rows |
Immigrants in Parks

| Immigration Origin | # Population | % Population | View All 0 Rows |
Sex and Age in Parks
Sex and Age in Parks
The most populous age groups in Parks are 65 to 69 Years (95 | 16.1%) for men and 60 to 64 Years (78 | 10.2%) for women.
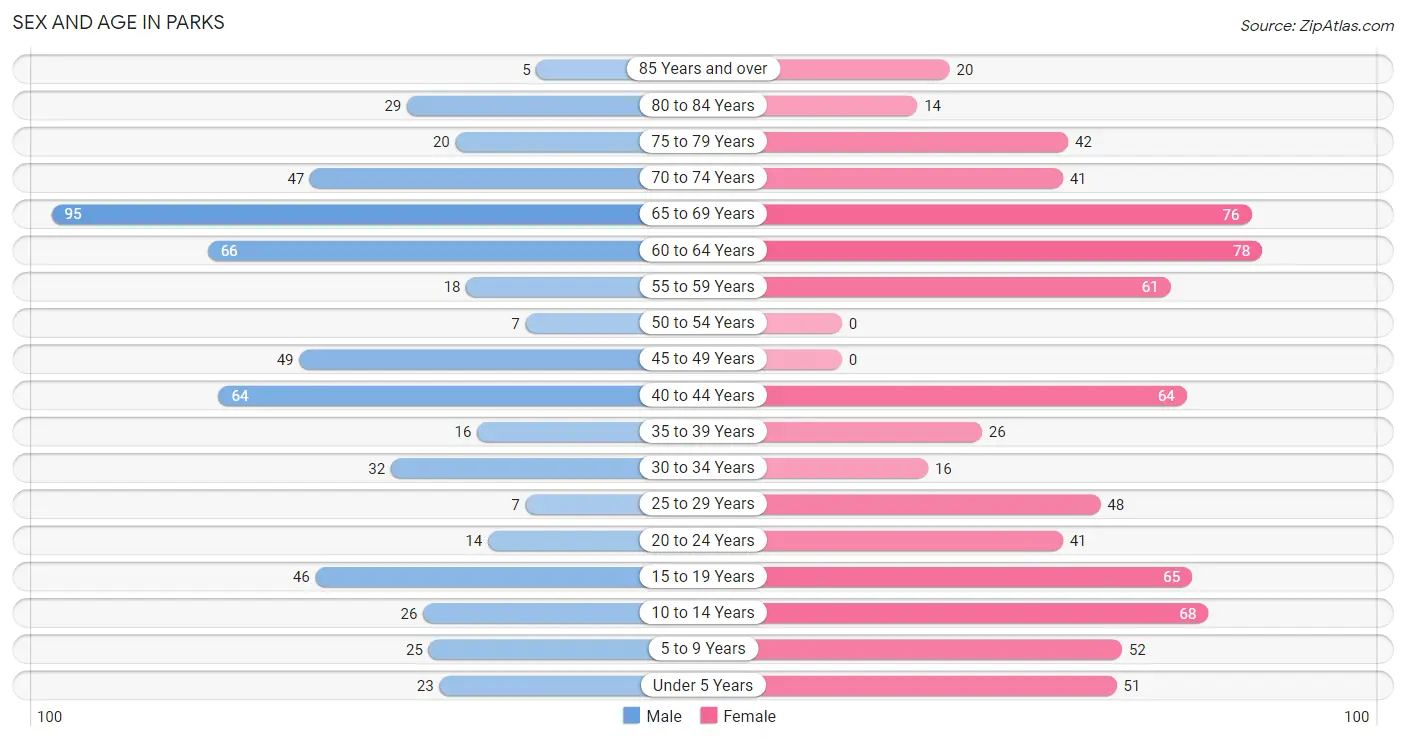
| Age Bracket | Male | Female |
| Under 5 Years | 23 (3.9%) | 51 (6.7%) |
| 5 to 9 Years | 25 (4.2%) | 52 (6.8%) |
| 10 to 14 Years | 26 (4.4%) | 68 (8.9%) |
| 15 to 19 Years | 46 (7.8%) | 65 (8.5%) |
| 20 to 24 Years | 14 (2.4%) | 41 (5.4%) |
| 25 to 29 Years | 7 (1.2%) | 48 (6.3%) |
| 30 to 34 Years | 32 (5.4%) | 16 (2.1%) |
| 35 to 39 Years | 16 (2.7%) | 26 (3.4%) |
| 40 to 44 Years | 64 (10.9%) | 64 (8.4%) |
| 45 to 49 Years | 49 (8.3%) | 0 (0.0%) |
| 50 to 54 Years | 7 (1.2%) | 0 (0.0%) |
| 55 to 59 Years | 18 (3.1%) | 61 (8.0%) |
| 60 to 64 Years | 66 (11.2%) | 78 (10.2%) |
| 65 to 69 Years | 95 (16.1%) | 76 (10.0%) |
| 70 to 74 Years | 47 (8.0%) | 41 (5.4%) |
| 75 to 79 Years | 20 (3.4%) | 42 (5.5%) |
| 80 to 84 Years | 29 (4.9%) | 14 (1.8%) |
| 85 Years and over | 5 (0.9%) | 20 (2.6%) |
| Total | 589 (100.0%) | 763 (100.0%) |
Families and Households in Parks
Median Family Size in Parks
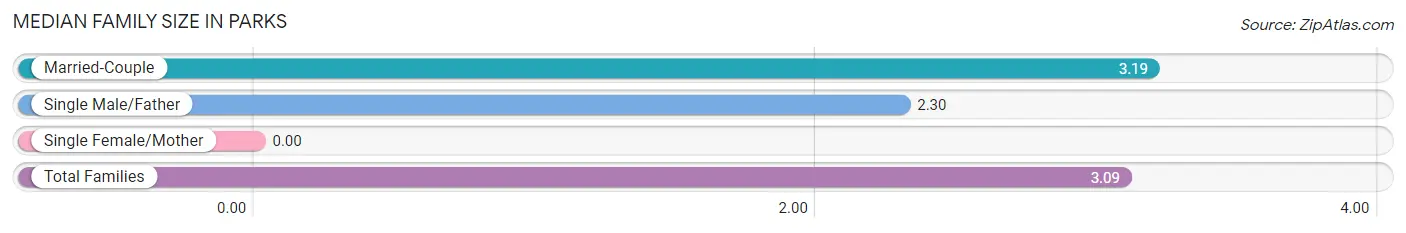
| Family Type | # Families | Family Size |
| Married-Couple | 340 (88.8%) | 3.19 |
| Single Male/Father | 43 (11.2%) | 2.30 |
| Single Female/Mother | 0 (0.0%) | - |
| Total Families | 383 (100.0%) | 3.09 |
Median Household Size in Parks
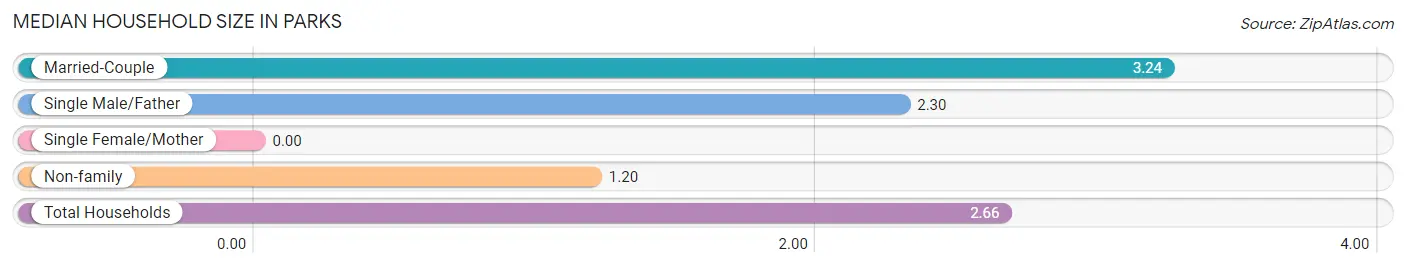
| Household Type | # Households | Household Size |
| Married-Couple | 340 (66.8%) | 3.24 |
| Single Male/Father | 43 (8.5%) | 2.30 |
| Single Female/Mother | 0 (0.0%) | - |
| Non-family | 126 (24.7%) | 1.20 |
| Total Households | 509 (100.0%) | 2.66 |
Household Size by Marriage Status in Parks
Out of a total of 509 households in Parks, 383 (75.2%) are family households, while 126 (24.7%) are nonfamily households. The most numerous type of family households are 2-person households, comprising 265, and the most common type of nonfamily households are 1-person households, comprising 94.
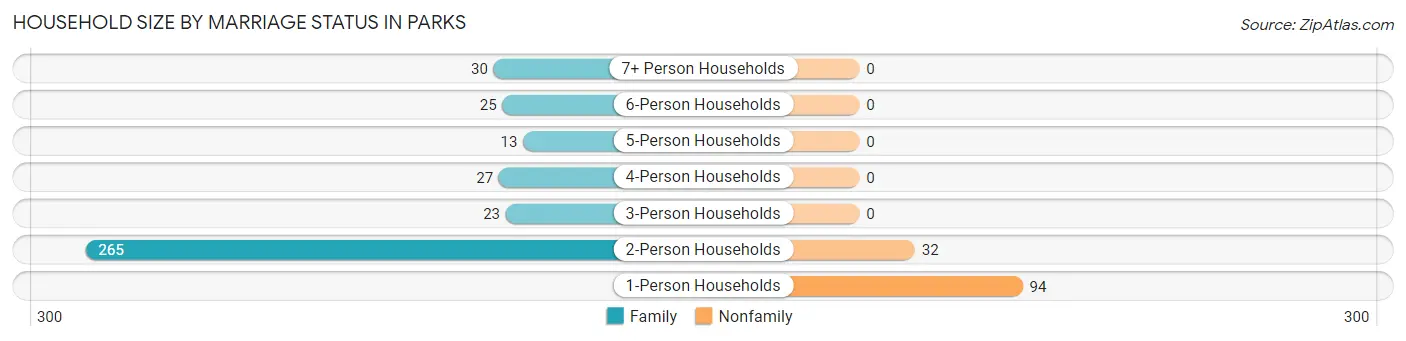
| Household Size | Family Households | Nonfamily Households |
| 1-Person Households | - | 94 (18.5%) |
| 2-Person Households | 265 (52.1%) | 32 (6.3%) |
| 3-Person Households | 23 (4.5%) | 0 (0.0%) |
| 4-Person Households | 27 (5.3%) | 0 (0.0%) |
| 5-Person Households | 13 (2.5%) | 0 (0.0%) |
| 6-Person Households | 25 (4.9%) | 0 (0.0%) |
| 7+ Person Households | 30 (5.9%) | 0 (0.0%) |
| Total | 383 (75.2%) | 126 (24.7%) |
Female Fertility in Parks
Fertility by Age in Parks
Average fertility rate in Parks is 46.0 births per 1,000 women. Women in the age bracket of 35 to 50 years have the highest fertility rate with 133.0 births per 1,000 women. Women in the age bracket of 35 to 50 years acount for 100.0% of all women with births.
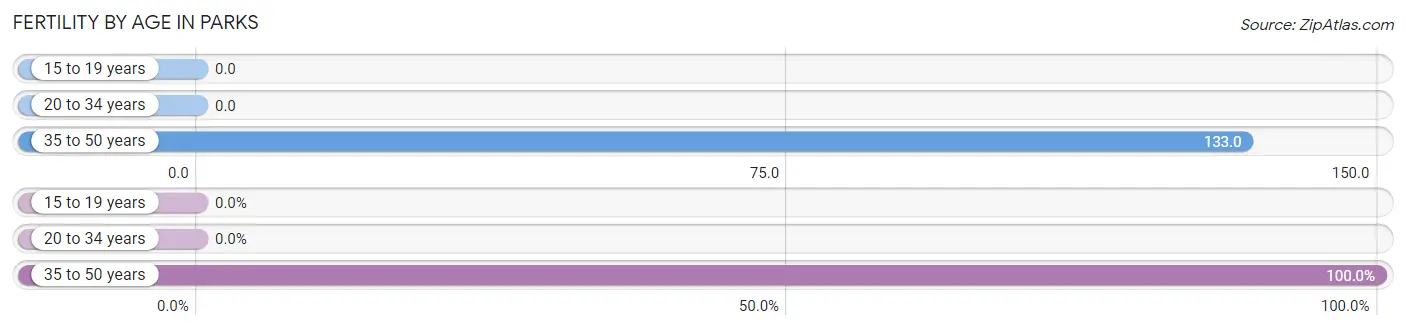
| Age Bracket | Women with Births | Births / 1,000 Women |
| 15 to 19 years | 0 (0.0%) | 0.0 |
| 20 to 34 years | 0 (0.0%) | 0.0 |
| 35 to 50 years | 12 (100.0%) | 133.0 |
| Total | 12 (100.0%) | 46.0 |
Fertility by Age by Marriage Status in Parks
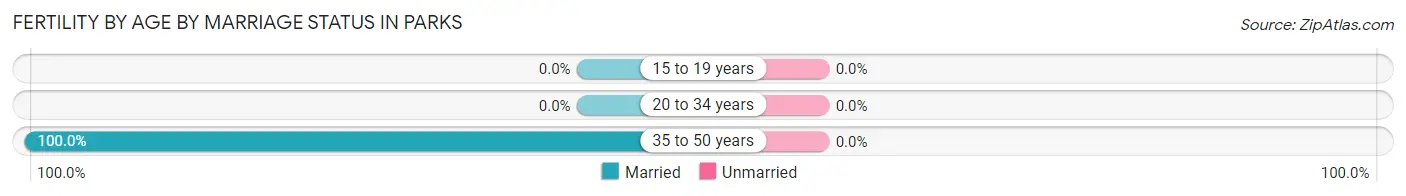
| Age Bracket | Married | Unmarried |
| 15 to 19 years | 0 (0.0%) | 0 (0.0%) |
| 20 to 34 years | 0 (0.0%) | 0 (0.0%) |
| 35 to 50 years | 12 (100.0%) | 0 (0.0%) |
| Total | 12 (100.0%) | 0 (0.0%) |
Fertility by Education in Parks
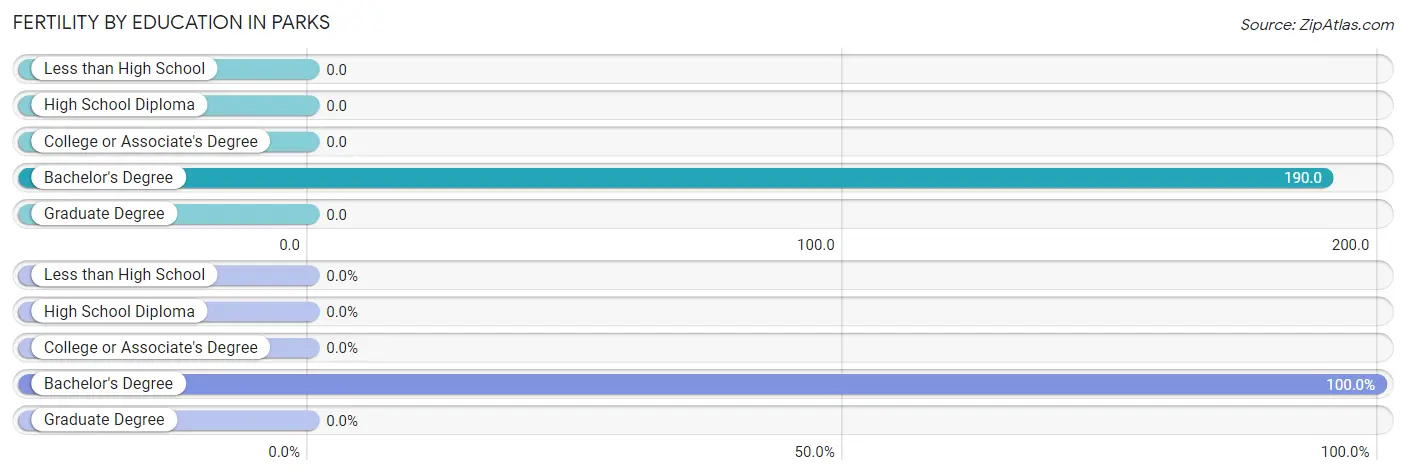
| Educational Attainment | Women with Births | Births / 1,000 Women |
| Less than High School | 0 (0.0%) | 0.0 |
| High School Diploma | 0 (0.0%) | 0.0 |
| College or Associate's Degree | 0 (0.0%) | 0.0 |
| Bachelor's Degree | 12 (100.0%) | 190.0 |
| Graduate Degree | 0 (0.0%) | 0.0 |
| Total | 12 (100.0%) | 46.0 |
Fertility by Education by Marriage Status in Parks
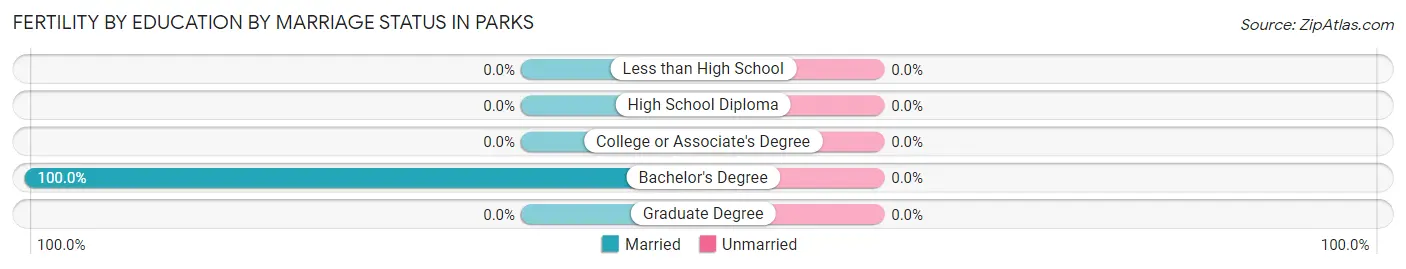
| Educational Attainment | Married | Unmarried |
| Less than High School | 0 (0.0%) | 0 (0.0%) |
| High School Diploma | 0 (0.0%) | 0 (0.0%) |
| College or Associate's Degree | 0 (0.0%) | 0 (0.0%) |
| Bachelor's Degree | 12 (100.0%) | 0 (0.0%) |
| Graduate Degree | 0 (0.0%) | 0 (0.0%) |
| Total | 12 (100.0%) | 0 (0.0%) |
Employment Characteristics in Parks
Employment by Class of Employer in Parks
Among the 514 employed individuals in Parks, private company employees (286 | 55.6%), self-employed (not incorporated) (53 | 10.3%), and state government employees (52 | 10.1%) make up the most common classes of employment.
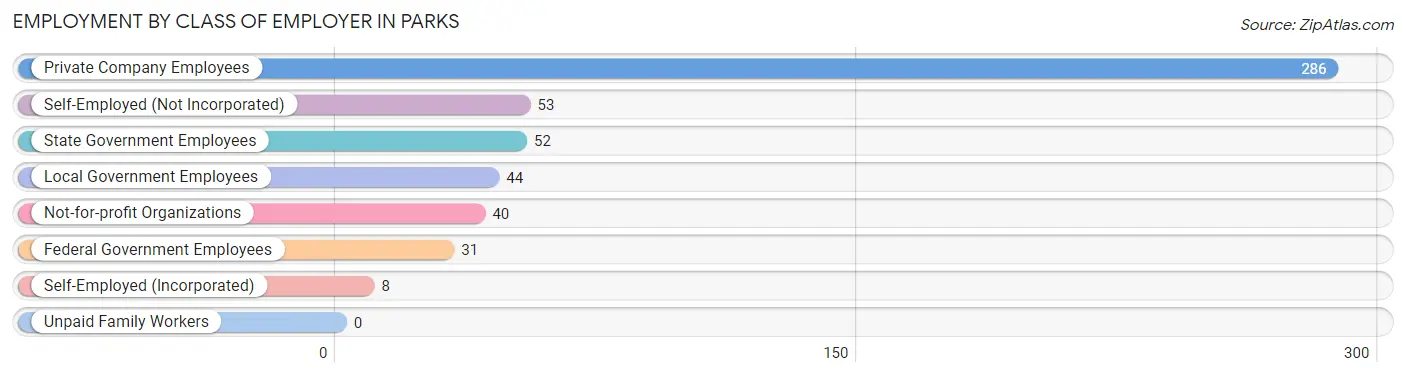
| Employer Class | # Employees | % Employees |
| Private Company Employees | 286 | 55.6% |
| Self-Employed (Incorporated) | 8 | 1.6% |
| Self-Employed (Not Incorporated) | 53 | 10.3% |
| Not-for-profit Organizations | 40 | 7.8% |
| Local Government Employees | 44 | 8.6% |
| State Government Employees | 52 | 10.1% |
| Federal Government Employees | 31 | 6.0% |
| Unpaid Family Workers | 0 | 0.0% |
| Total | 514 | 100.0% |
Employment Status by Age in Parks
According to the labor force statistics for Parks, out of the total population over 16 years of age (1,095), 48.6% or 532 individuals are in the labor force, with 1.1% or 6 of them unemployed. The age group with the highest labor force participation rate is 20 to 24 years, with 100.0% or 55 individuals in the labor force. Within the labor force, the 30 to 34 years age range has the highest percentage of unemployed individuals, with 12.5% or 6 of them being unemployed.
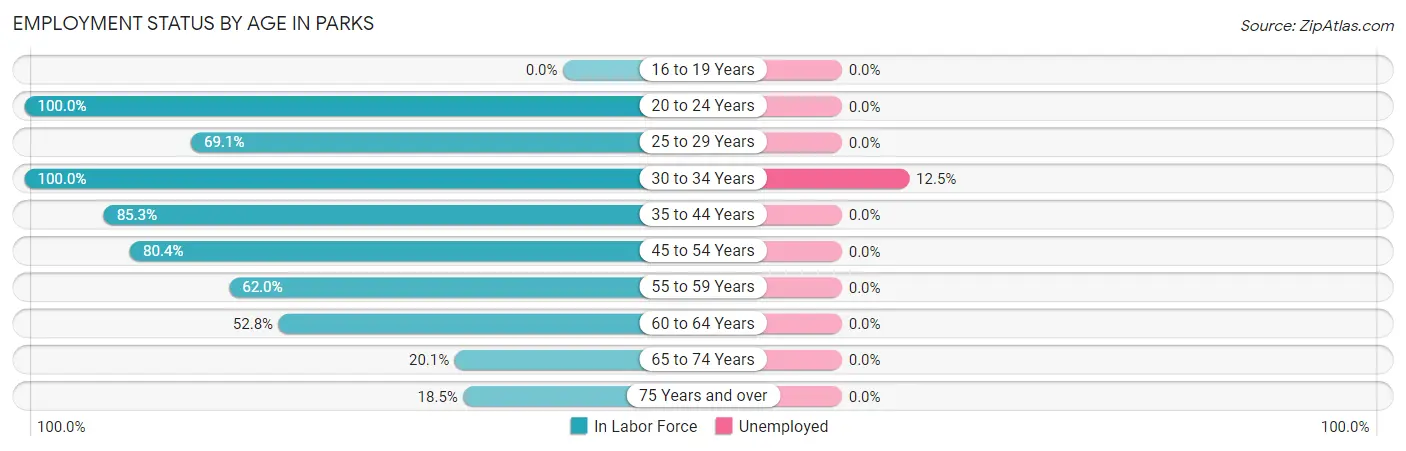
| Age Bracket | In Labor Force | Unemployed |
| 16 to 19 Years | 0 (0.0%) | 0 (0.0%) |
| 20 to 24 Years | 55 (100.0%) | 0 (0.0%) |
| 25 to 29 Years | 38 (69.1%) | 0 (0.0%) |
| 30 to 34 Years | 48 (100.0%) | 6 (12.5%) |
| 35 to 44 Years | 145 (85.3%) | 0 (0.0%) |
| 45 to 54 Years | 45 (80.4%) | 0 (0.0%) |
| 55 to 59 Years | 49 (62.0%) | 0 (0.0%) |
| 60 to 64 Years | 76 (52.8%) | 0 (0.0%) |
| 65 to 74 Years | 52 (20.1%) | 0 (0.0%) |
| 75 Years and over | 24 (18.5%) | 0 (0.0%) |
| Total | 532 (48.6%) | 6 (1.1%) |
Employment Status by Educational Attainment in Parks
According to labor force statistics for Parks, 72.6% of individuals (401) out of the total population between 25 and 64 years of age (552) are in the labor force, with 1.5% or 6 of them being unemployed. The group with the highest labor force participation rate are those with the educational attainment of bachelor's degree or higher, with 83.0% or 171 individuals in the labor force. Within the labor force, individuals with high school diploma education have the highest percentage of unemployment, with 15.8% or 6 of them being unemployed.
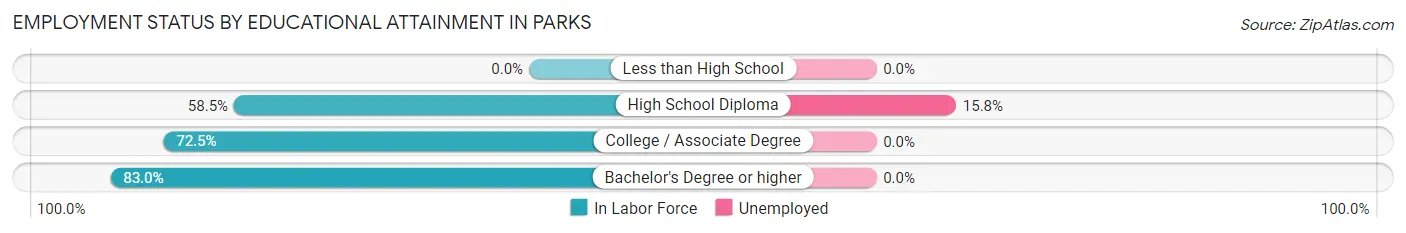
| Educational Attainment | In Labor Force | Unemployed |
| Less than High School | 0 (0.0%) | 0 (0.0%) |
| High School Diploma | 38 (58.5%) | 10 (15.8%) |
| College / Associate Degree | 192 (72.5%) | 0 (0.0%) |
| Bachelor's Degree or higher | 171 (83.0%) | 0 (0.0%) |
| Total | 401 (72.6%) | 8 (1.5%) |
Employment Occupations by Sex in Parks
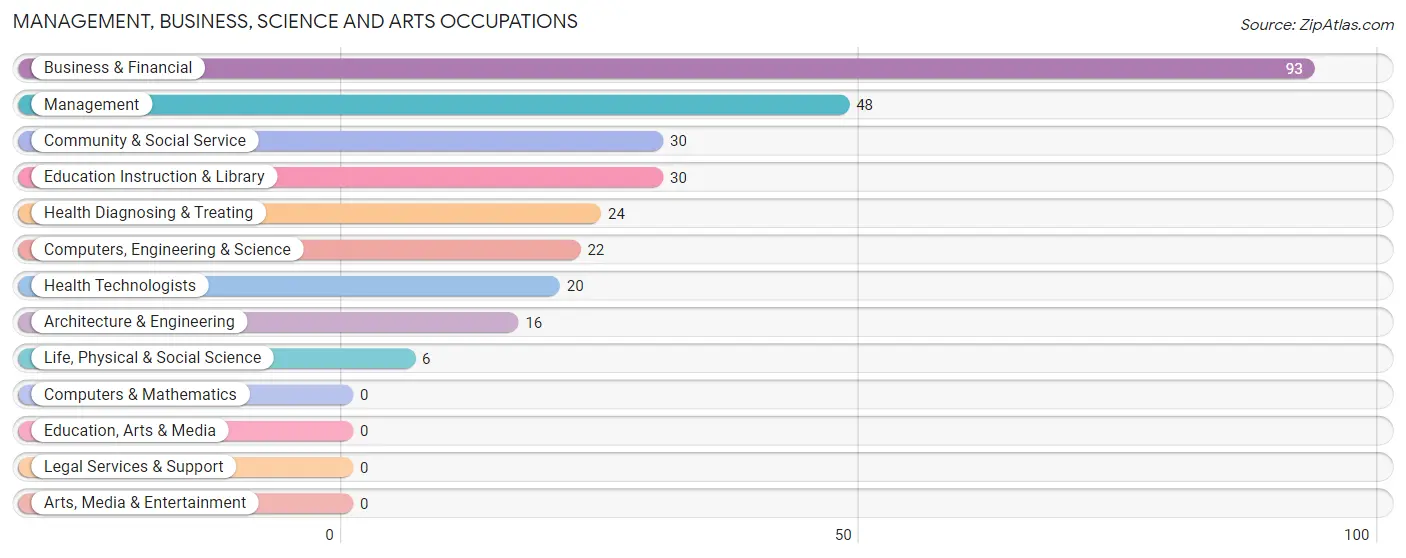
Management, Business, Science and Arts Occupations
The most common Management, Business, Science and Arts occupations in Parks are Business & Financial (93 | 17.7%), Management (48 | 9.1%), Community & Social Service (30 | 5.7%), Education Instruction & Library (30 | 5.7%), and Health Diagnosing & Treating (24 | 4.6%).
Management, Business, Science and Arts Occupations by Sex
Within the Management, Business, Science and Arts occupations in Parks, the most male-oriented occupations are Computers, Engineering & Science (100.0%), Architecture & Engineering (100.0%), and Life, Physical & Social Science (100.0%), while the most female-oriented occupations are Community & Social Service (100.0%), Education Instruction & Library (100.0%), and Business & Financial (94.6%).
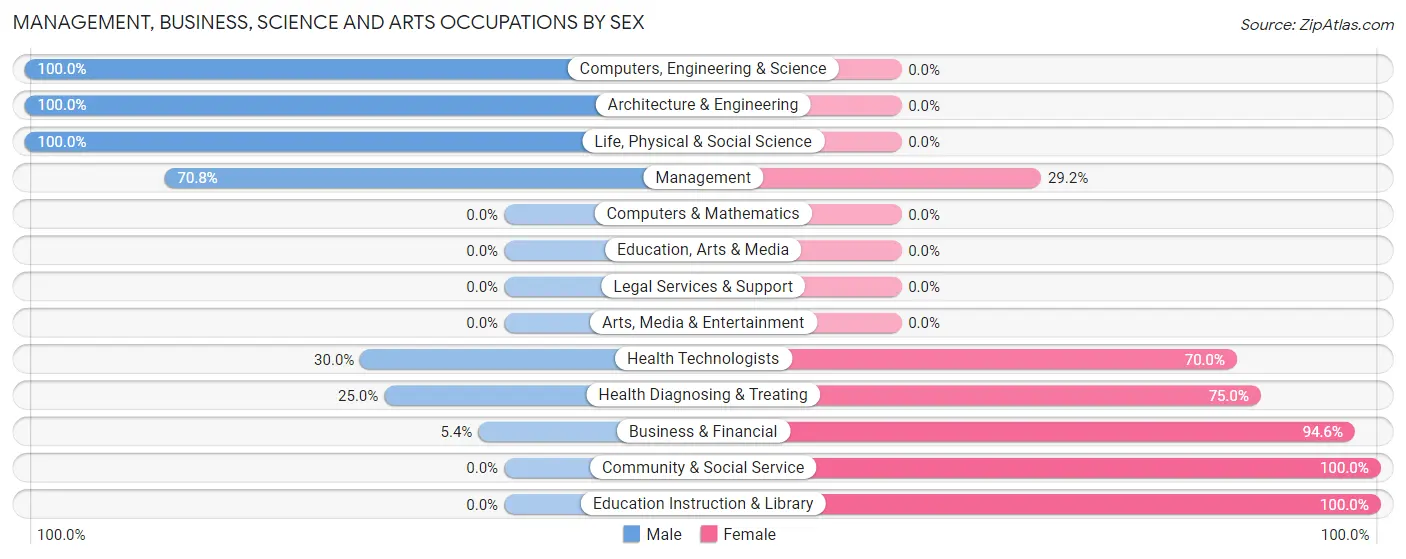
| Occupation | Male | Female |
| Management | 34 (70.8%) | 14 (29.2%) |
| Business & Financial | 5 (5.4%) | 88 (94.6%) |
| Computers, Engineering & Science | 22 (100.0%) | 0 (0.0%) |
| Computers & Mathematics | 0 (0.0%) | 0 (0.0%) |
| Architecture & Engineering | 16 (100.0%) | 0 (0.0%) |
| Life, Physical & Social Science | 6 (100.0%) | 0 (0.0%) |
| Community & Social Service | 0 (0.0%) | 30 (100.0%) |
| Education, Arts & Media | 0 (0.0%) | 0 (0.0%) |
| Legal Services & Support | 0 (0.0%) | 0 (0.0%) |
| Education Instruction & Library | 0 (0.0%) | 30 (100.0%) |
| Arts, Media & Entertainment | 0 (0.0%) | 0 (0.0%) |
| Health Diagnosing & Treating | 6 (25.0%) | 18 (75.0%) |
| Health Technologists | 6 (30.0%) | 14 (70.0%) |
| Total (Category) | 67 (30.9%) | 150 (69.1%) |
| Total (Overall) | 249 (47.3%) | 277 (52.7%) |
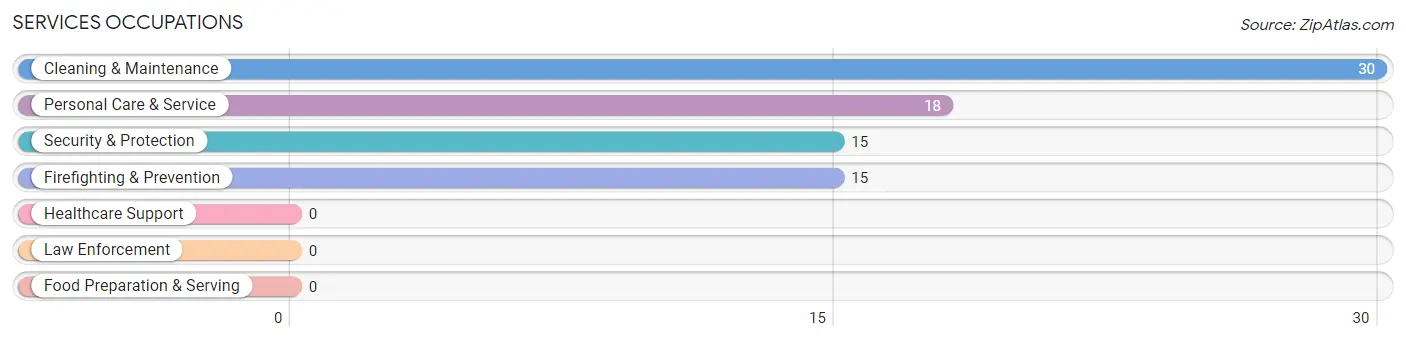
Services Occupations
The most common Services occupations in Parks are Cleaning & Maintenance (30 | 5.7%), Personal Care & Service (18 | 3.4%), Security & Protection (15 | 2.9%), and Firefighting & Prevention (15 | 2.9%).
Services Occupations by Sex
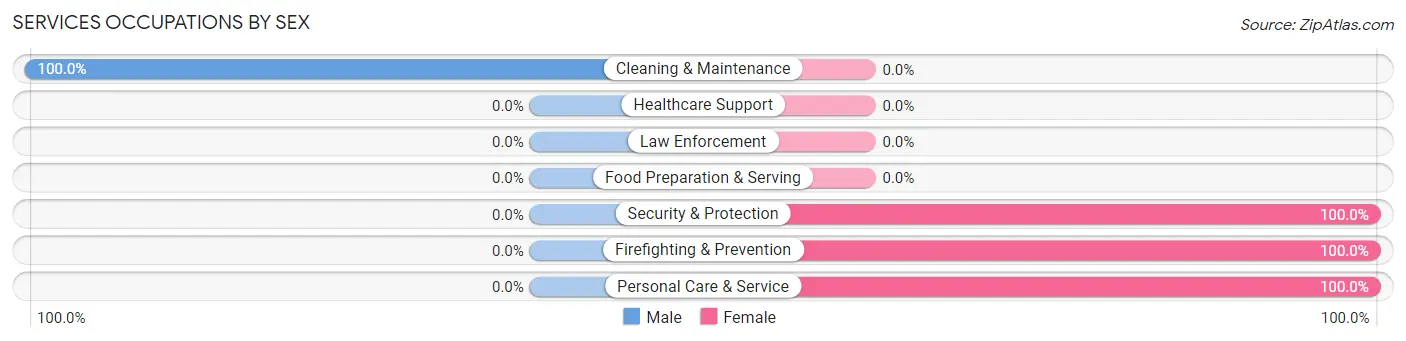
| Occupation | Male | Female |
| Healthcare Support | 0 (0.0%) | 0 (0.0%) |
| Security & Protection | 0 (0.0%) | 15 (100.0%) |
| Firefighting & Prevention | 0 (0.0%) | 15 (100.0%) |
| Law Enforcement | 0 (0.0%) | 0 (0.0%) |
| Food Preparation & Serving | 0 (0.0%) | 0 (0.0%) |
| Cleaning & Maintenance | 30 (100.0%) | 0 (0.0%) |
| Personal Care & Service | 0 (0.0%) | 18 (100.0%) |
| Total (Category) | 30 (47.6%) | 33 (52.4%) |
| Total (Overall) | 249 (47.3%) | 277 (52.7%) |
Sales and Office Occupations
The most common Sales and Office occupations in Parks are Office & Administration (66 | 12.6%), and Sales & Related (54 | 10.3%).
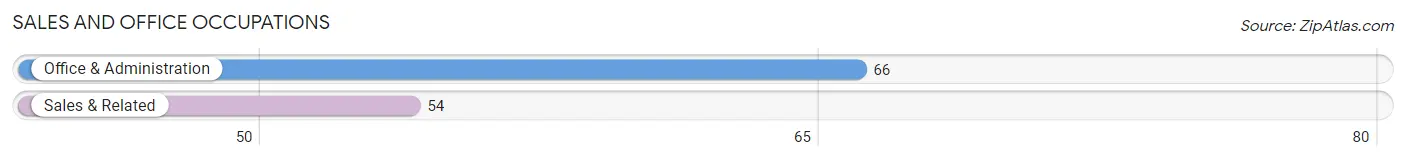
Sales and Office Occupations by Sex
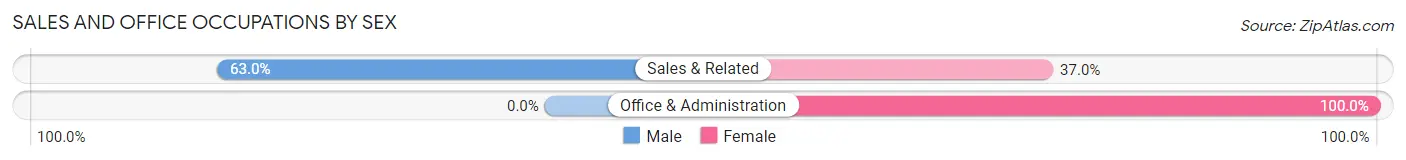
| Occupation | Male | Female |
| Sales & Related | 34 (63.0%) | 20 (37.0%) |
| Office & Administration | 0 (0.0%) | 66 (100.0%) |
| Total (Category) | 34 (28.3%) | 86 (71.7%) |
| Total (Overall) | 249 (47.3%) | 277 (52.7%) |
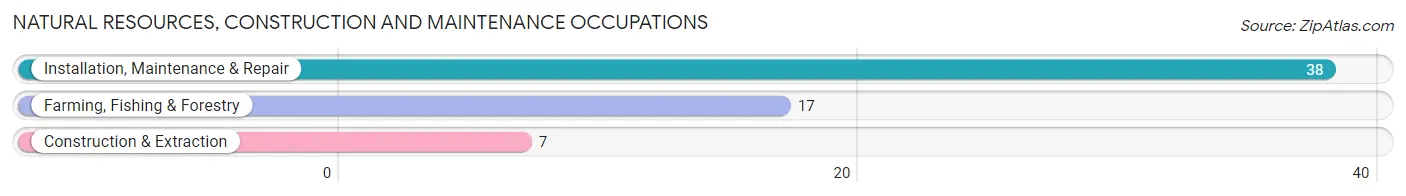
Natural Resources, Construction and Maintenance Occupations
The most common Natural Resources, Construction and Maintenance occupations in Parks are Installation, Maintenance & Repair (38 | 7.2%), Farming, Fishing & Forestry (17 | 3.2%), and Construction & Extraction (7 | 1.3%).
Natural Resources, Construction and Maintenance Occupations by Sex
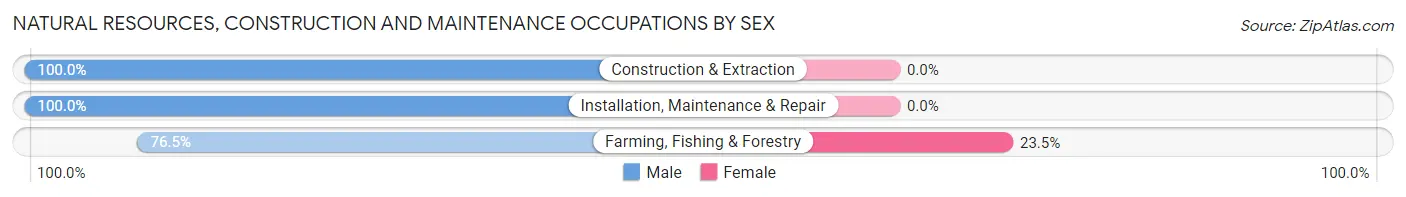
| Occupation | Male | Female |
| Farming, Fishing & Forestry | 13 (76.5%) | 4 (23.5%) |
| Construction & Extraction | 7 (100.0%) | 0 (0.0%) |
| Installation, Maintenance & Repair | 38 (100.0%) | 0 (0.0%) |
| Total (Category) | 58 (93.5%) | 4 (6.5%) |
| Total (Overall) | 249 (47.3%) | 277 (52.7%) |
Production, Transportation and Moving Occupations
The most common Production, Transportation and Moving occupations in Parks are Transportation (27 | 5.1%), Production (23 | 4.4%), and Material Moving (14 | 2.7%).
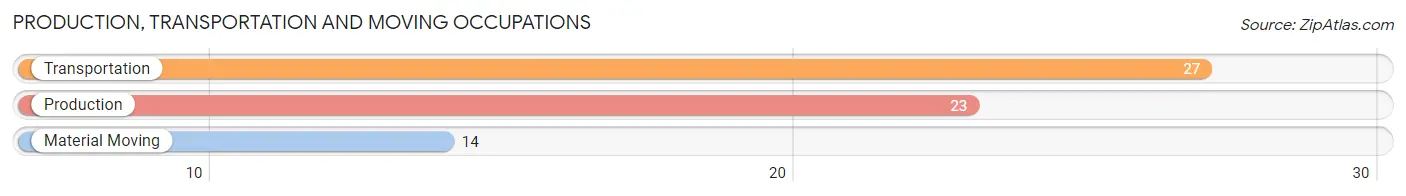
Production, Transportation and Moving Occupations by Sex
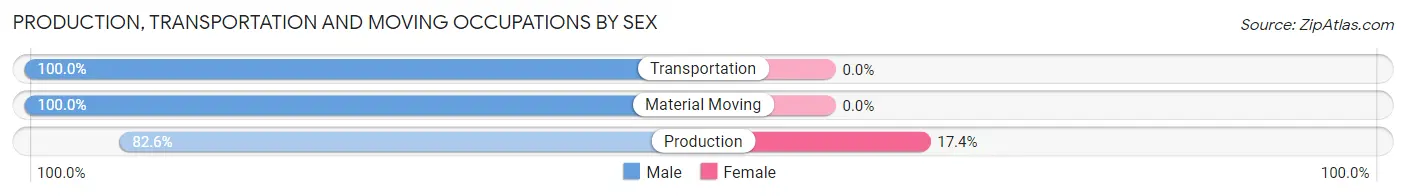
| Occupation | Male | Female |
| Production | 19 (82.6%) | 4 (17.4%) |
| Transportation | 27 (100.0%) | 0 (0.0%) |
| Material Moving | 14 (100.0%) | 0 (0.0%) |
| Total (Category) | 60 (93.8%) | 4 (6.2%) |
| Total (Overall) | 249 (47.3%) | 277 (52.7%) |
Employment Industries by Sex in Parks
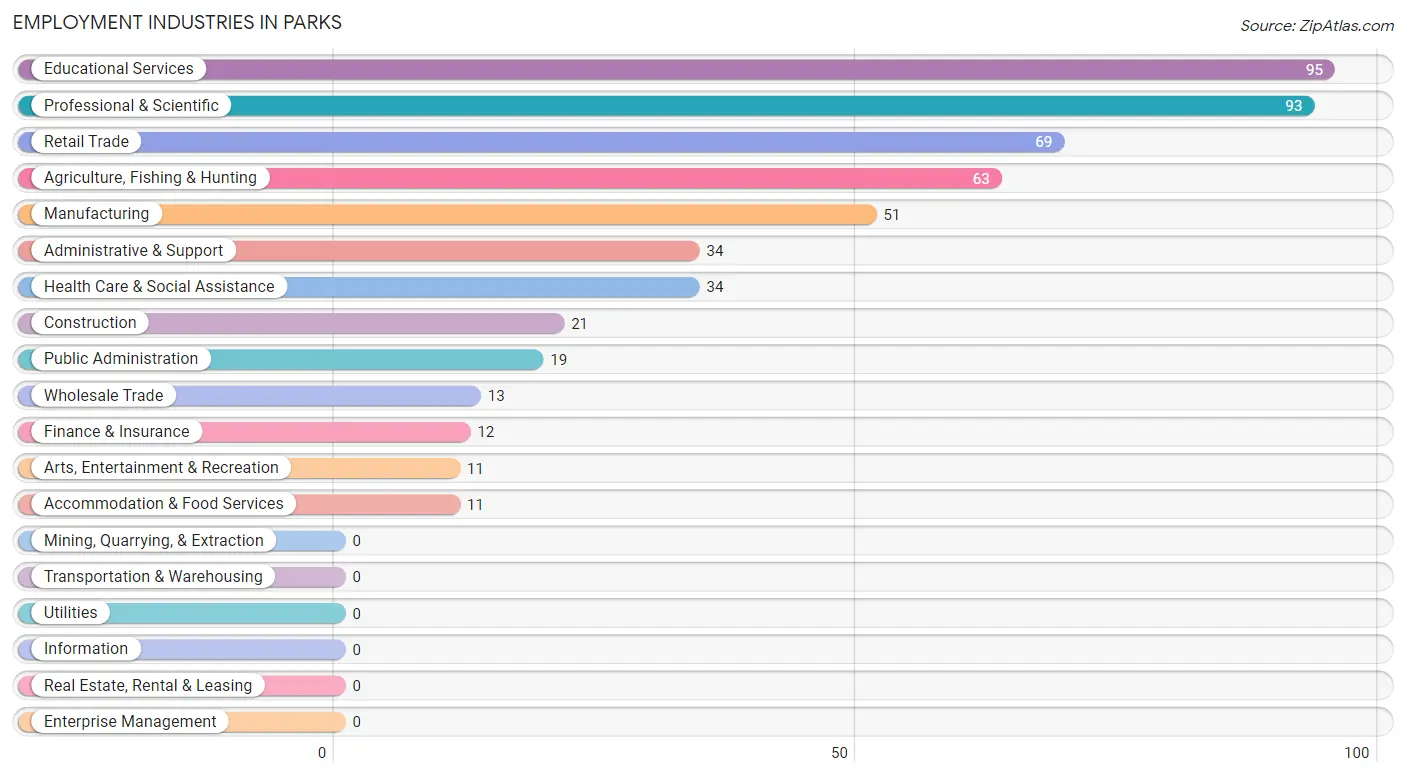
Employment Industries in Parks
The major employment industries in Parks include Educational Services (95 | 18.1%), Professional & Scientific (93 | 17.7%), Retail Trade (69 | 13.1%), Agriculture, Fishing & Hunting (63 | 12.0%), and Manufacturing (51 | 9.7%).
Employment Industries by Sex in Parks
The Parks industries that see more men than women are Construction (100.0%), Wholesale Trade (100.0%), and Finance & Insurance (100.0%), whereas the industries that tend to have a higher number of women are Arts, Entertainment & Recreation (100.0%), Accommodation & Food Services (100.0%), and Public Administration (100.0%).
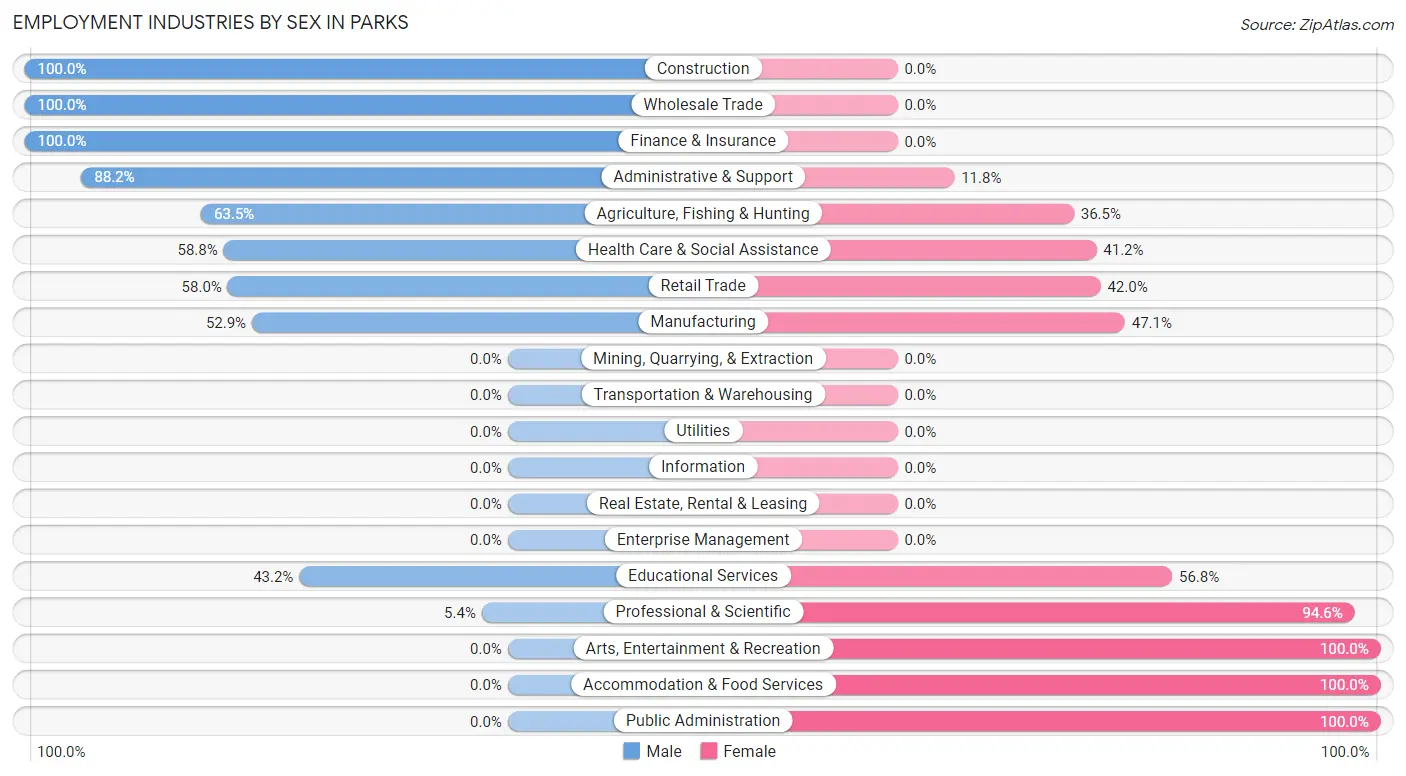
| Industry | Male | Female |
| Agriculture, Fishing & Hunting | 40 (63.5%) | 23 (36.5%) |
| Mining, Quarrying, & Extraction | 0 (0.0%) | 0 (0.0%) |
| Construction | 21 (100.0%) | 0 (0.0%) |
| Manufacturing | 27 (52.9%) | 24 (47.1%) |
| Wholesale Trade | 13 (100.0%) | 0 (0.0%) |
| Retail Trade | 40 (58.0%) | 29 (42.0%) |
| Transportation & Warehousing | 0 (0.0%) | 0 (0.0%) |
| Utilities | 0 (0.0%) | 0 (0.0%) |
| Information | 0 (0.0%) | 0 (0.0%) |
| Finance & Insurance | 12 (100.0%) | 0 (0.0%) |
| Real Estate, Rental & Leasing | 0 (0.0%) | 0 (0.0%) |
| Professional & Scientific | 5 (5.4%) | 88 (94.6%) |
| Enterprise Management | 0 (0.0%) | 0 (0.0%) |
| Administrative & Support | 30 (88.2%) | 4 (11.8%) |
| Educational Services | 41 (43.2%) | 54 (56.8%) |
| Health Care & Social Assistance | 20 (58.8%) | 14 (41.2%) |
| Arts, Entertainment & Recreation | 0 (0.0%) | 11 (100.0%) |
| Accommodation & Food Services | 0 (0.0%) | 11 (100.0%) |
| Public Administration | 0 (0.0%) | 19 (100.0%) |
| Total | 249 (47.3%) | 277 (52.7%) |
Education in Parks
School Enrollment in Parks
The most common levels of schooling among the 253 students in Parks are elementary school (91 | 36.0%), high school (69 | 27.3%), and nursery / preschool (39 | 15.4%).
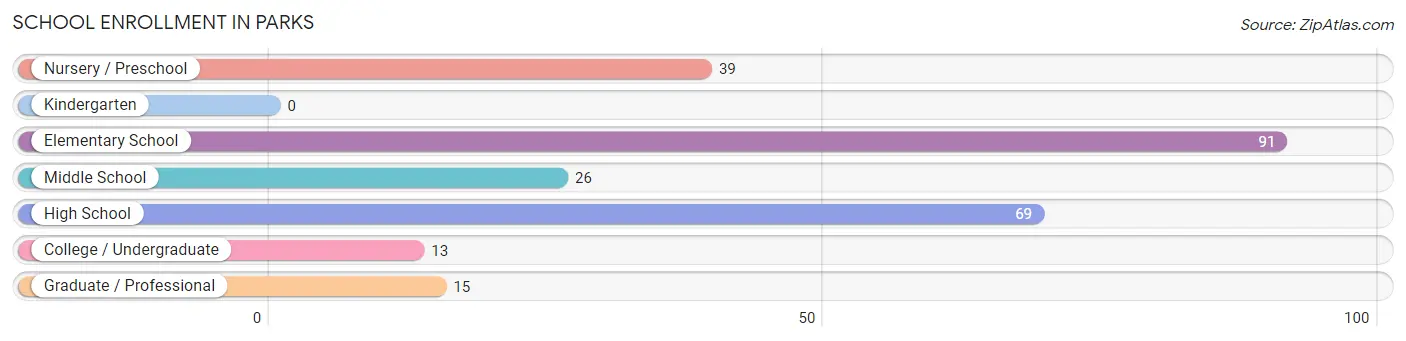
| School Level | # Students | % Students |
| Nursery / Preschool | 39 | 15.4% |
| Kindergarten | 0 | 0.0% |
| Elementary School | 91 | 36.0% |
| Middle School | 26 | 10.3% |
| High School | 69 | 27.3% |
| College / Undergraduate | 13 | 5.1% |
| Graduate / Professional | 15 | 5.9% |
| Total | 253 | 100.0% |
School Enrollment by Age by Funding Source in Parks
Out of a total of 253 students who are enrolled in schools in Parks, 11 (4.3%) attend a private institution, while the remaining 242 (95.7%) are enrolled in public schools. The age group of 35 years and over has the highest likelihood of being enrolled in private schools, with 11 (52.4% in the age bracket) enrolled. Conversely, the age group of 3 to 4 year olds has the lowest likelihood of being enrolled in a private school, with 39 (100.0% in the age bracket) attending a public institution.
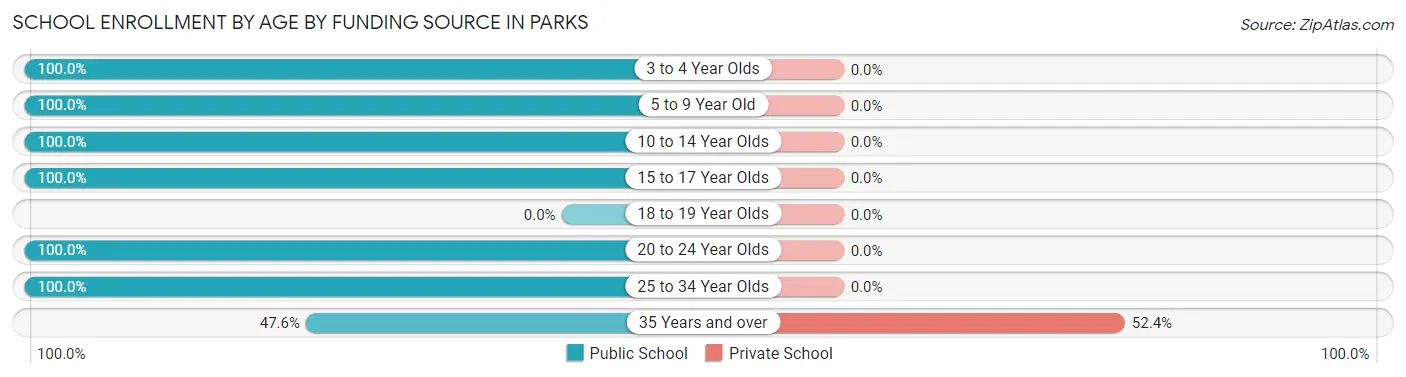
| Age Bracket | Public School | Private School |
| 3 to 4 Year Olds | 39 (100.0%) | 0 (0.0%) |
| 5 to 9 Year Old | 77 (100.0%) | 0 (0.0%) |
| 10 to 14 Year Olds | 40 (100.0%) | 0 (0.0%) |
| 15 to 17 Year Olds | 55 (100.0%) | 0 (0.0%) |
| 18 to 19 Year Olds | 0 (0.0%) | 0 (0.0%) |
| 20 to 24 Year Olds | 14 (100.0%) | 0 (0.0%) |
| 25 to 34 Year Olds | 7 (100.0%) | 0 (0.0%) |
| 35 Years and over | 10 (47.6%) | 11 (52.4%) |
| Total | 242 (95.7%) | 11 (4.3%) |
Educational Attainment by Field of Study in Parks
Business (107 | 28.2%), education (84 | 22.1%), arts & humanities (40 | 10.5%), physical & health sciences (39 | 10.3%), and bio, nature & agricultural (24 | 6.3%) are the most common fields of study among 380 individuals in Parks who have obtained a bachelor's degree or higher.
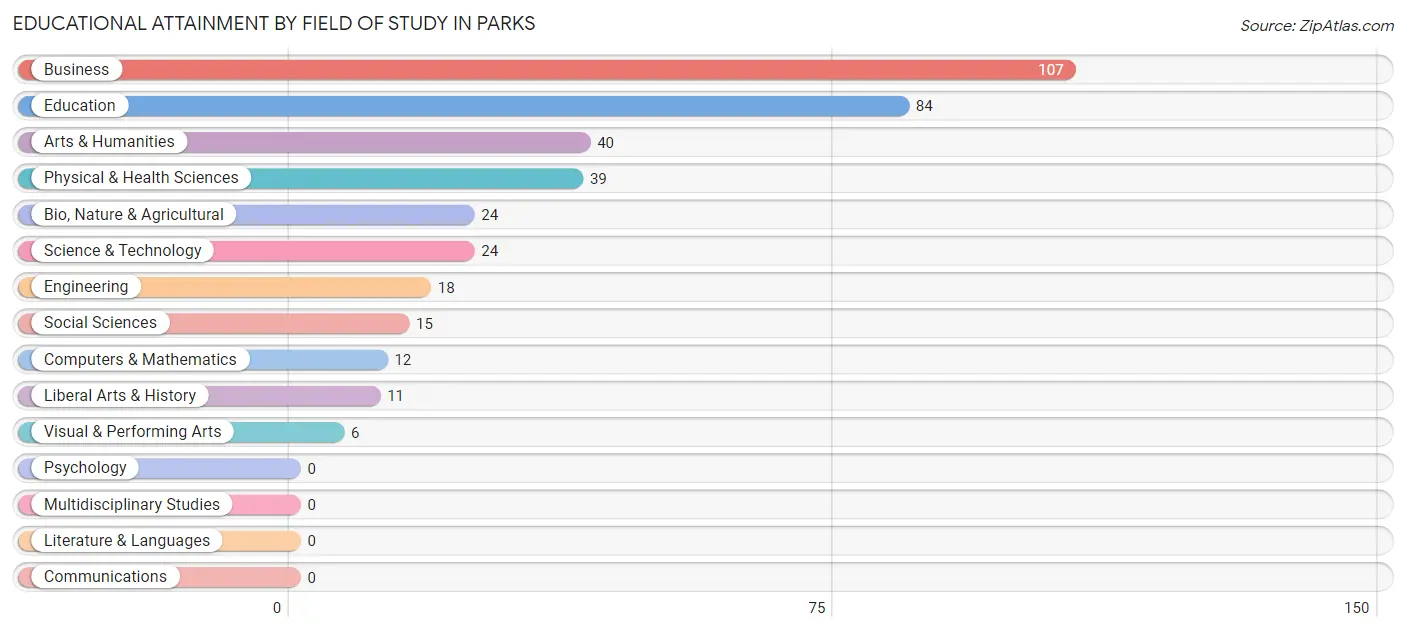
| Field of Study | # Graduates | % Graduates |
| Computers & Mathematics | 12 | 3.2% |
| Bio, Nature & Agricultural | 24 | 6.3% |
| Physical & Health Sciences | 39 | 10.3% |
| Psychology | 0 | 0.0% |
| Social Sciences | 15 | 4.0% |
| Engineering | 18 | 4.7% |
| Multidisciplinary Studies | 0 | 0.0% |
| Science & Technology | 24 | 6.3% |
| Business | 107 | 28.2% |
| Education | 84 | 22.1% |
| Literature & Languages | 0 | 0.0% |
| Liberal Arts & History | 11 | 2.9% |
| Visual & Performing Arts | 6 | 1.6% |
| Communications | 0 | 0.0% |
| Arts & Humanities | 40 | 10.5% |
| Total | 380 | 100.0% |
Transportation & Commute in Parks
Vehicle Availability by Sex in Parks
The most prevalent vehicle ownership categories in Parks are males with 5 or more vehicles (105, accounting for 42.2%) and females with 5 or more vehicles (136, making up 39.6%).
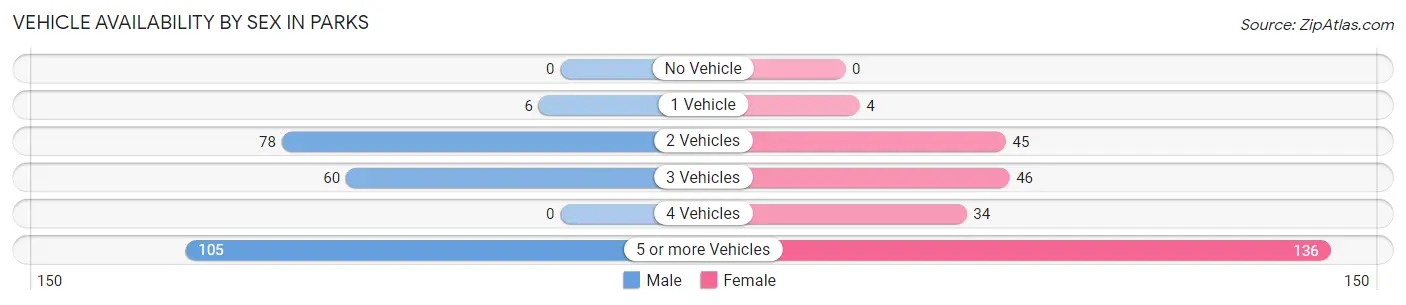
| Vehicles Available | Male | Female |
| No Vehicle | 0 (0.0%) | 0 (0.0%) |
| 1 Vehicle | 6 (2.4%) | 4 (1.5%) |
| 2 Vehicles | 78 (31.3%) | 45 (17.0%) |
| 3 Vehicles | 60 (24.1%) | 46 (17.4%) |
| 4 Vehicles | 0 (0.0%) | 34 (12.8%) |
| 5 or more Vehicles | 105 (42.2%) | 136 (51.3%) |
| Total | 249 (100.0%) | 265 (100.0%) |
Commute Time in Parks
The most frequently occuring commute durations in Parks are 30 to 34 minutes (157 commuters, 34.2%), 20 to 24 minutes (86 commuters, 18.7%), and 40 to 44 minutes (72 commuters, 15.7%).
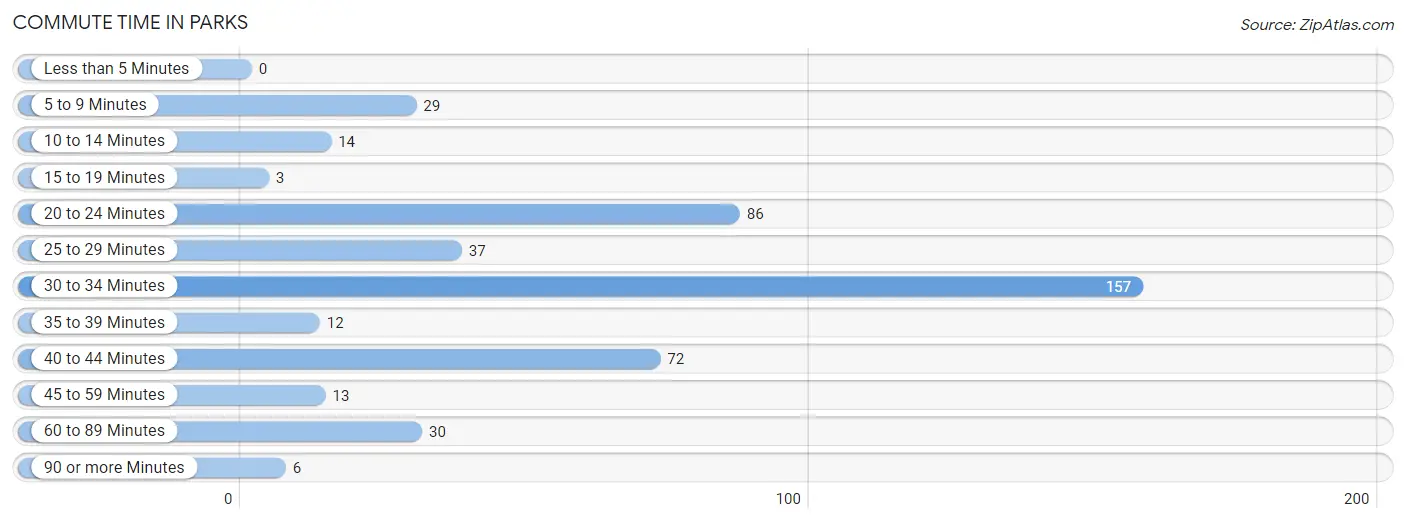
| Commute Time | # Commuters | % Commuters |
| Less than 5 Minutes | 0 | 0.0% |
| 5 to 9 Minutes | 29 | 6.3% |
| 10 to 14 Minutes | 14 | 3.0% |
| 15 to 19 Minutes | 3 | 0.6% |
| 20 to 24 Minutes | 86 | 18.7% |
| 25 to 29 Minutes | 37 | 8.1% |
| 30 to 34 Minutes | 157 | 34.2% |
| 35 to 39 Minutes | 12 | 2.6% |
| 40 to 44 Minutes | 72 | 15.7% |
| 45 to 59 Minutes | 13 | 2.8% |
| 60 to 89 Minutes | 30 | 6.5% |
| 90 or more Minutes | 6 | 1.3% |
Commute Time by Sex in Parks
The most common commute times in Parks are 20 to 24 minutes (54 commuters, 25.7%) for males and 30 to 34 minutes (106 commuters, 42.6%) for females.
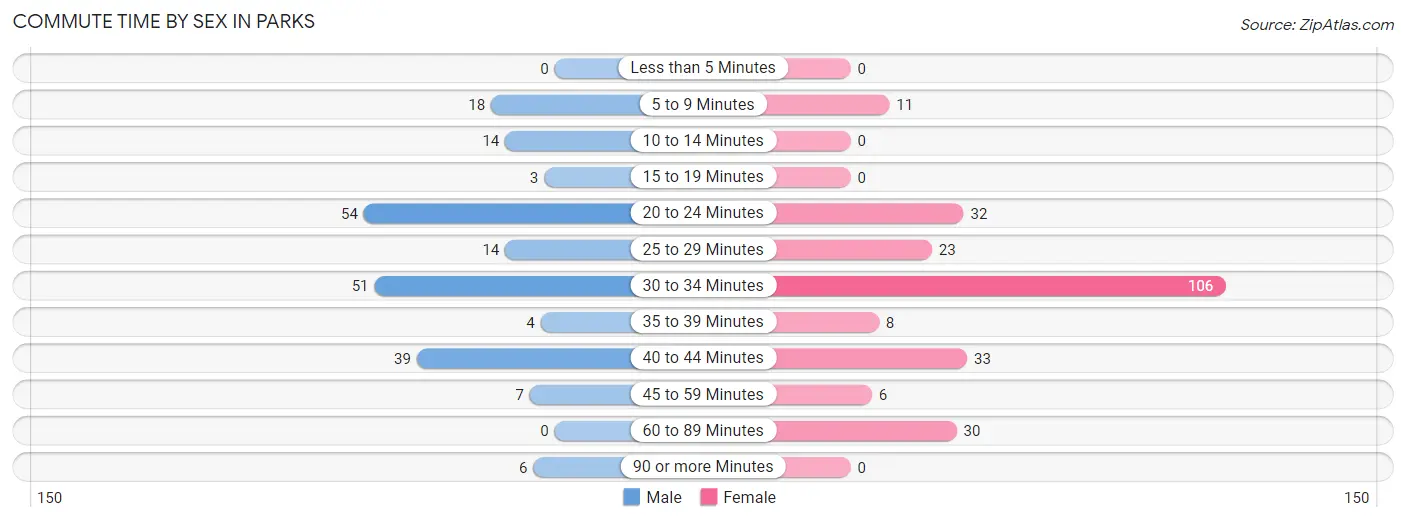
| Commute Time | Male | Female |
| Less than 5 Minutes | 0 (0.0%) | 0 (0.0%) |
| 5 to 9 Minutes | 18 (8.6%) | 11 (4.4%) |
| 10 to 14 Minutes | 14 (6.7%) | 0 (0.0%) |
| 15 to 19 Minutes | 3 (1.4%) | 0 (0.0%) |
| 20 to 24 Minutes | 54 (25.7%) | 32 (12.9%) |
| 25 to 29 Minutes | 14 (6.7%) | 23 (9.2%) |
| 30 to 34 Minutes | 51 (24.3%) | 106 (42.6%) |
| 35 to 39 Minutes | 4 (1.9%) | 8 (3.2%) |
| 40 to 44 Minutes | 39 (18.6%) | 33 (13.3%) |
| 45 to 59 Minutes | 7 (3.3%) | 6 (2.4%) |
| 60 to 89 Minutes | 0 (0.0%) | 30 (12.0%) |
| 90 or more Minutes | 6 (2.9%) | 0 (0.0%) |
Time of Departure to Work by Sex in Parks
The most frequent times of departure to work in Parks are 5:00 AM to 5:29 AM (50, 23.8%) for males and 10:00 AM to 10:59 AM (60, 24.1%) for females.
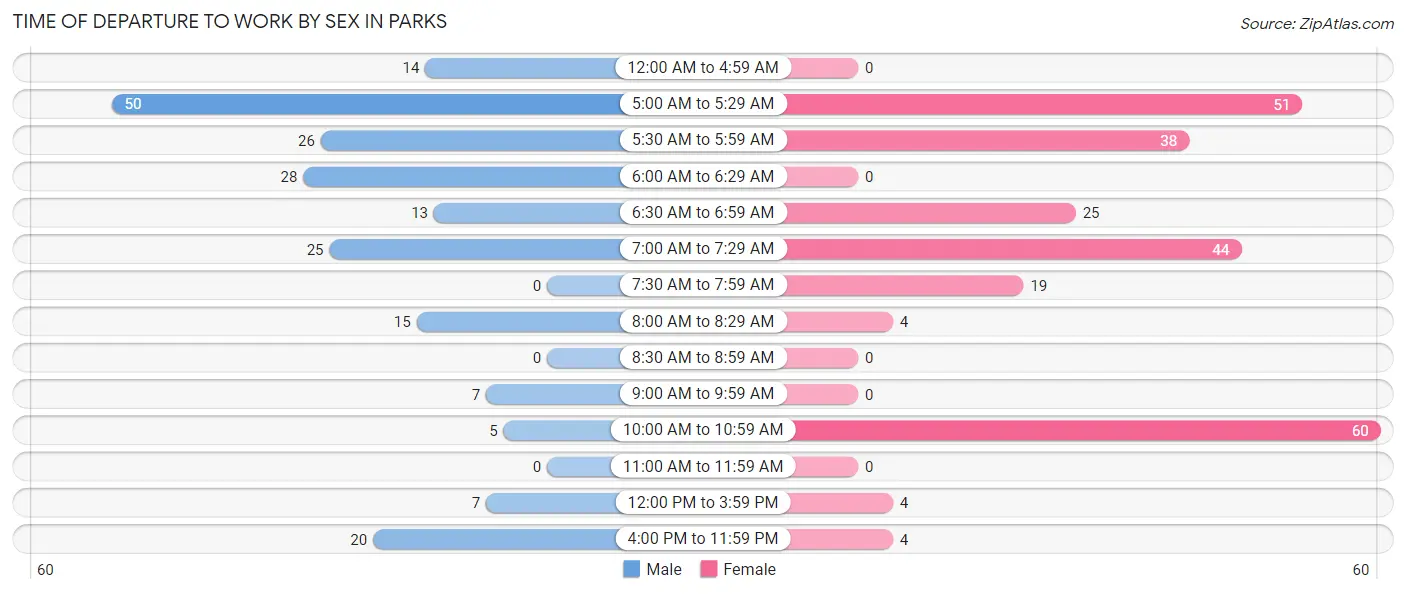
| Time of Departure | Male | Female |
| 12:00 AM to 4:59 AM | 14 (6.7%) | 0 (0.0%) |
| 5:00 AM to 5:29 AM | 50 (23.8%) | 51 (20.5%) |
| 5:30 AM to 5:59 AM | 26 (12.4%) | 38 (15.3%) |
| 6:00 AM to 6:29 AM | 28 (13.3%) | 0 (0.0%) |
| 6:30 AM to 6:59 AM | 13 (6.2%) | 25 (10.0%) |
| 7:00 AM to 7:29 AM | 25 (11.9%) | 44 (17.7%) |
| 7:30 AM to 7:59 AM | 0 (0.0%) | 19 (7.6%) |
| 8:00 AM to 8:29 AM | 15 (7.1%) | 4 (1.6%) |
| 8:30 AM to 8:59 AM | 0 (0.0%) | 0 (0.0%) |
| 9:00 AM to 9:59 AM | 7 (3.3%) | 0 (0.0%) |
| 10:00 AM to 10:59 AM | 5 (2.4%) | 60 (24.1%) |
| 11:00 AM to 11:59 AM | 0 (0.0%) | 0 (0.0%) |
| 12:00 PM to 3:59 PM | 7 (3.3%) | 4 (1.6%) |
| 4:00 PM to 11:59 PM | 20 (9.5%) | 4 (1.6%) |
| Total | 210 (100.0%) | 249 (100.0%) |
Housing Occupancy in Parks
Occupancy by Ownership in Parks
Of the total 509 dwellings in Parks, owner-occupied units account for 441 (86.6%), while renter-occupied units make up 68 (13.4%).
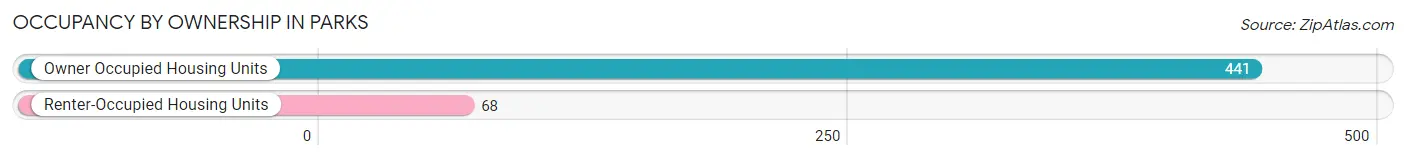
| Occupancy | # Housing Units | % Housing Units |
| Owner Occupied Housing Units | 441 | 86.6% |
| Renter-Occupied Housing Units | 68 | 13.4% |
| Total Occupied Housing Units | 509 | 100.0% |
Occupancy by Household Size in Parks
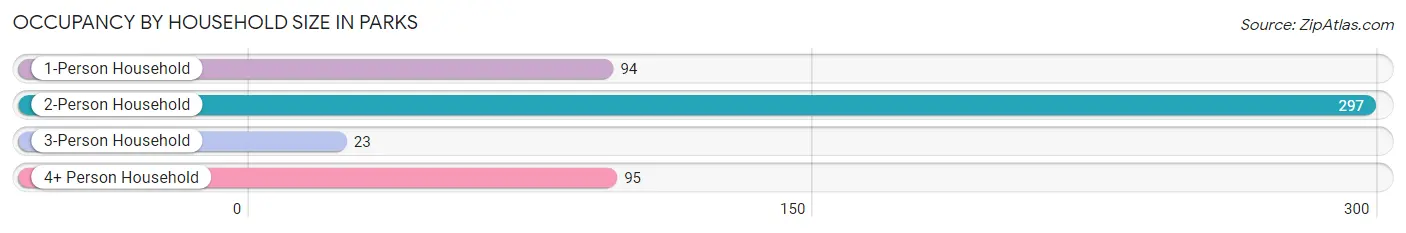
| Household Size | # Housing Units | % Housing Units |
| 1-Person Household | 94 | 18.5% |
| 2-Person Household | 297 | 58.4% |
| 3-Person Household | 23 | 4.5% |
| 4+ Person Household | 95 | 18.7% |
| Total Housing Units | 509 | 100.0% |
Occupancy by Ownership by Household Size in Parks
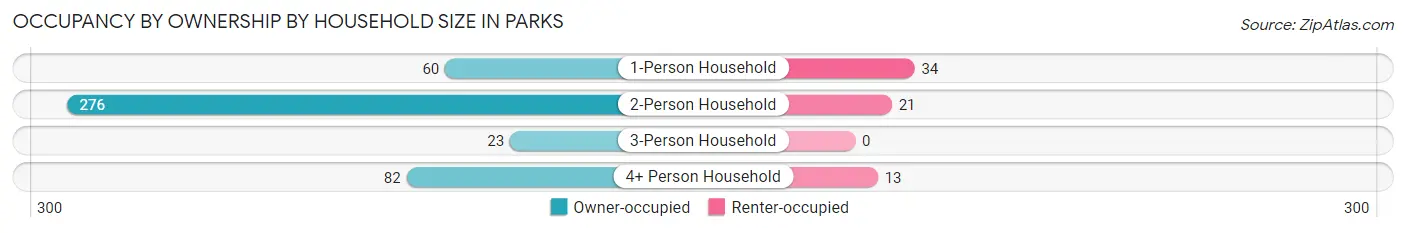
| Household Size | Owner-occupied | Renter-occupied |
| 1-Person Household | 60 (63.8%) | 34 (36.2%) |
| 2-Person Household | 276 (92.9%) | 21 (7.1%) |
| 3-Person Household | 23 (100.0%) | 0 (0.0%) |
| 4+ Person Household | 82 (86.3%) | 13 (13.7%) |
| Total Housing Units | 441 (86.6%) | 68 (13.4%) |
Occupancy by Educational Attainment in Parks
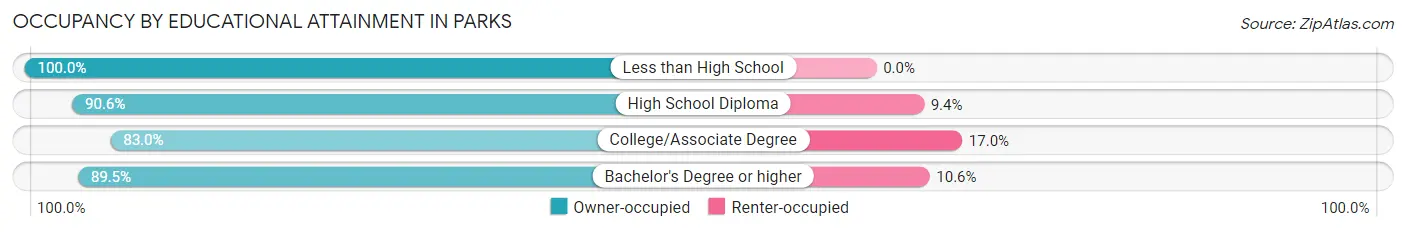
| Household Size | Owner-occupied | Renter-occupied |
| Less than High School | 10 (100.0%) | 0 (0.0%) |
| High School Diploma | 48 (90.6%) | 5 (9.4%) |
| College/Associate Degree | 205 (83.0%) | 42 (17.0%) |
| Bachelor's Degree or higher | 178 (89.4%) | 21 (10.5%) |
Occupancy by Age of Householder in Parks
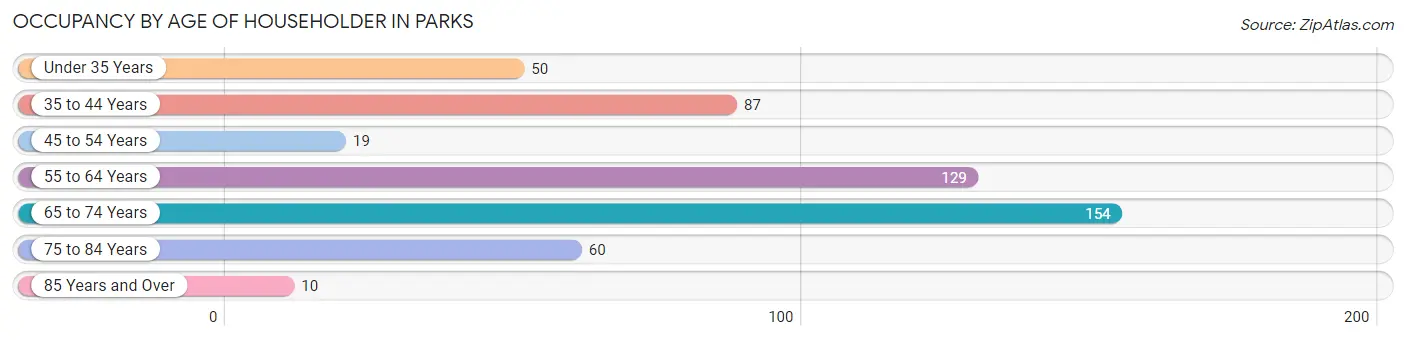
| Age Bracket | # Households | % Households |
| Under 35 Years | 50 | 9.8% |
| 35 to 44 Years | 87 | 17.1% |
| 45 to 54 Years | 19 | 3.7% |
| 55 to 64 Years | 129 | 25.3% |
| 65 to 74 Years | 154 | 30.3% |
| 75 to 84 Years | 60 | 11.8% |
| 85 Years and Over | 10 | 2.0% |
| Total | 509 | 100.0% |
Housing Finances in Parks
Median Income by Occupancy in Parks
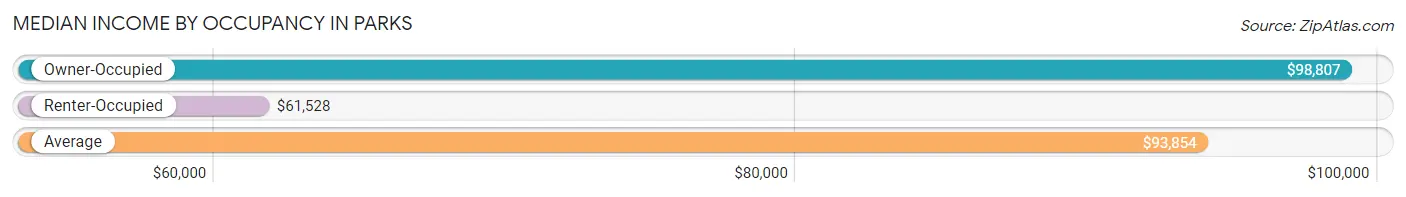
| Occupancy Type | # Households | Median Income |
| Owner-Occupied | 441 (86.6%) | $98,807 |
| Renter-Occupied | 68 (13.4%) | $61,528 |
| Average | 509 (100.0%) | $93,854 |
Occupancy by Householder Income Bracket in Parks
| Income Bracket | Owner-occupied | Renter-occupied |
| Less than $5,000 | 10 (2.3%) | 0 (0.0%) |
| $5,000 to $9,999 | 12 (2.7%) | 0 (0.0%) |
| $10,000 to $14,999 | 4 (0.9%) | 0 (0.0%) |
| $15,000 to $19,999 | 0 (0.0%) | 5 (7.3%) |
| $20,000 to $24,999 | 23 (5.2%) | 0 (0.0%) |
| $25,000 to $34,999 | 26 (5.9%) | 7 (10.3%) |
| $35,000 to $49,999 | 23 (5.2%) | 11 (16.2%) |
| $50,000 to $74,999 | 75 (17.0%) | 18 (26.5%) |
| $75,000 to $99,999 | 58 (13.2%) | 10 (14.7%) |
| $100,000 to $149,999 | 98 (22.2%) | 4 (5.9%) |
| $150,000 or more | 112 (25.4%) | 13 (19.1%) |
| Total | 441 (100.0%) | 68 (100.0%) |
Monthly Housing Cost Tiers in Parks
| Monthly Cost | Owner-occupied | Renter-occupied |
| Less than $300 | 10 (2.3%) | 11 (16.2%) |
| $300 to $499 | 37 (8.4%) | 0 (0.0%) |
| $500 to $799 | 118 (26.8%) | 0 (0.0%) |
| $800 to $999 | 58 (13.2%) | 7 (10.3%) |
| $1,000 to $1,499 | 72 (16.3%) | 7 (10.3%) |
| $1,500 to $1,999 | 54 (12.2%) | 4 (5.9%) |
| $2,000 to $2,499 | 40 (9.1%) | 34 (50.0%) |
| $2,500 to $2,999 | 18 (4.1%) | 0 (0.0%) |
| $3,000 or more | 34 (7.7%) | 0 (0.0%) |
| Total | 441 (100.0%) | 68 (100.0%) |
Physical Housing Characteristics in Parks
Housing Structures in Parks
| Structure Type | # Housing Units | % Housing Units |
| Single Unit, Detached | 451 | 88.6% |
| Single Unit, Attached | 0 | 0.0% |
| 2 Unit Apartments | 0 | 0.0% |
| 3 or 4 Unit Apartments | 0 | 0.0% |
| 5 to 9 Unit Apartments | 0 | 0.0% |
| 10 or more Apartments | 0 | 0.0% |
| Mobile Home / Other | 58 | 11.4% |
| Total | 509 | 100.0% |
Housing Structures by Occupancy in Parks
| Structure Type | Owner-occupied | Renter-occupied |
| Single Unit, Detached | 395 (87.6%) | 56 (12.4%) |
| Single Unit, Attached | 0 (0.0%) | 0 (0.0%) |
| 2 Unit Apartments | 0 (0.0%) | 0 (0.0%) |
| 3 or 4 Unit Apartments | 0 (0.0%) | 0 (0.0%) |
| 5 to 9 Unit Apartments | 0 (0.0%) | 0 (0.0%) |
| 10 or more Apartments | 0 (0.0%) | 0 (0.0%) |
| Mobile Home / Other | 46 (79.3%) | 12 (20.7%) |
| Total | 441 (86.6%) | 68 (13.4%) |
Housing Structures by Number of Rooms in Parks
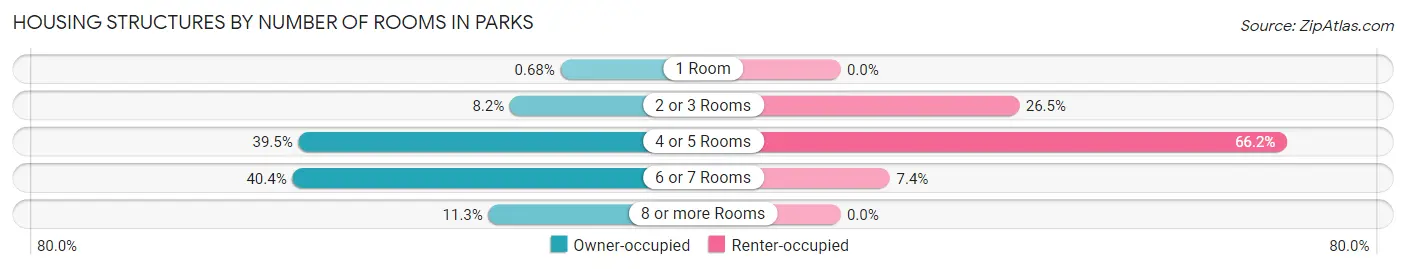
| Number of Rooms | Owner-occupied | Renter-occupied |
| 1 Room | 3 (0.7%) | 0 (0.0%) |
| 2 or 3 Rooms | 36 (8.2%) | 18 (26.5%) |
| 4 or 5 Rooms | 174 (39.5%) | 45 (66.2%) |
| 6 or 7 Rooms | 178 (40.4%) | 5 (7.3%) |
| 8 or more Rooms | 50 (11.3%) | 0 (0.0%) |
| Total | 441 (100.0%) | 68 (100.0%) |
Housing Structure by Heating Type in Parks
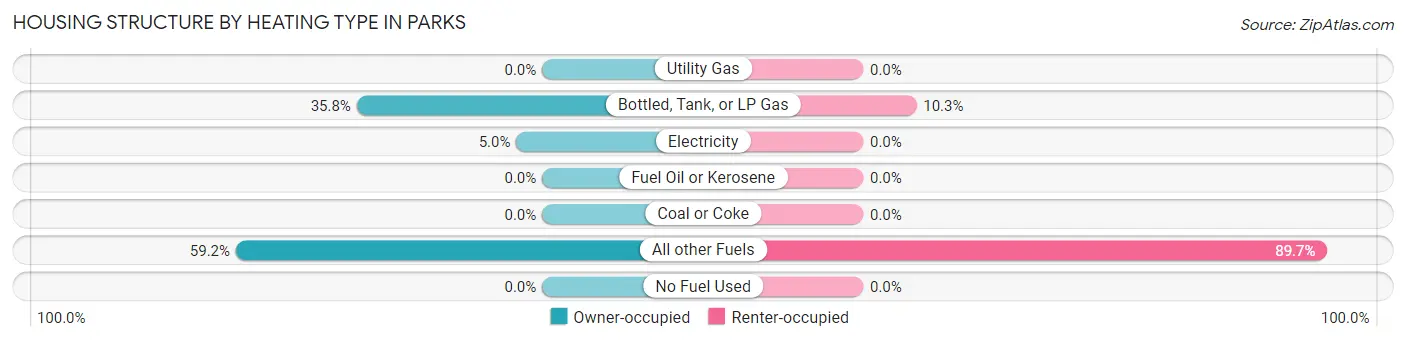
| Heating Type | Owner-occupied | Renter-occupied |
| Utility Gas | 0 (0.0%) | 0 (0.0%) |
| Bottled, Tank, or LP Gas | 158 (35.8%) | 7 (10.3%) |
| Electricity | 22 (5.0%) | 0 (0.0%) |
| Fuel Oil or Kerosene | 0 (0.0%) | 0 (0.0%) |
| Coal or Coke | 0 (0.0%) | 0 (0.0%) |
| All other Fuels | 261 (59.2%) | 61 (89.7%) |
| No Fuel Used | 0 (0.0%) | 0 (0.0%) |
| Total | 441 (100.0%) | 68 (100.0%) |
Household Vehicle Usage in Parks
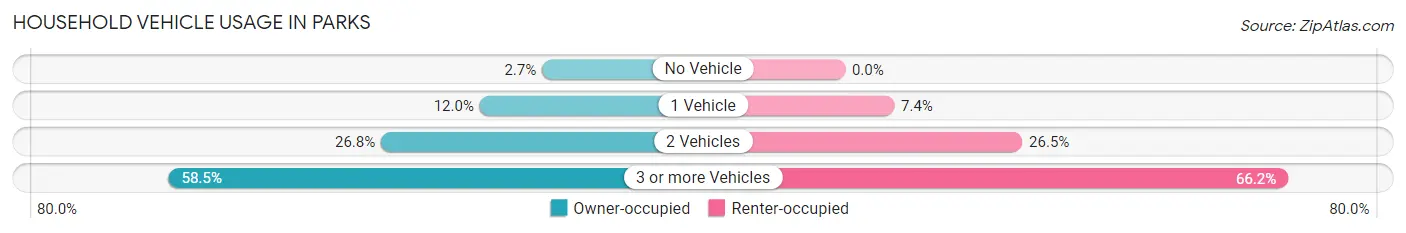
| Vehicles per Household | Owner-occupied | Renter-occupied |
| No Vehicle | 12 (2.7%) | 0 (0.0%) |
| 1 Vehicle | 53 (12.0%) | 5 (7.3%) |
| 2 Vehicles | 118 (26.8%) | 18 (26.5%) |
| 3 or more Vehicles | 258 (58.5%) | 45 (66.2%) |
| Total | 441 (100.0%) | 68 (100.0%) |
Real Estate & Mortgages in Parks
Real Estate and Mortgage Overview in Parks
| Characteristic | Without Mortgage | With Mortgage |
| Housing Units | 226 | 215 |
| Median Property Value | $552,200 | $459,500 |
| Median Household Income | $84,318 | $38 |
| Monthly Housing Costs | $635 | $34 |
| Real Estate Taxes | $2,169 | $30 |
Property Value by Mortgage Status in Parks
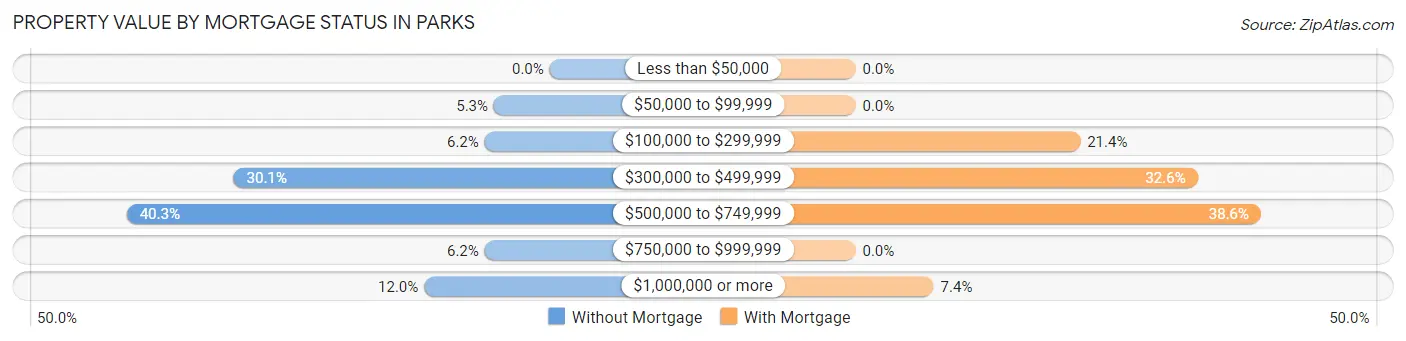
| Property Value | Without Mortgage | With Mortgage |
| Less than $50,000 | 0 (0.0%) | 0 (0.0%) |
| $50,000 to $99,999 | 12 (5.3%) | 0 (0.0%) |
| $100,000 to $299,999 | 14 (6.2%) | 46 (21.4%) |
| $300,000 to $499,999 | 68 (30.1%) | 70 (32.6%) |
| $500,000 to $749,999 | 91 (40.3%) | 83 (38.6%) |
| $750,000 to $999,999 | 14 (6.2%) | 0 (0.0%) |
| $1,000,000 or more | 27 (11.9%) | 16 (7.4%) |
| Total | 226 (100.0%) | 215 (100.0%) |
Household Income by Mortgage Status in Parks
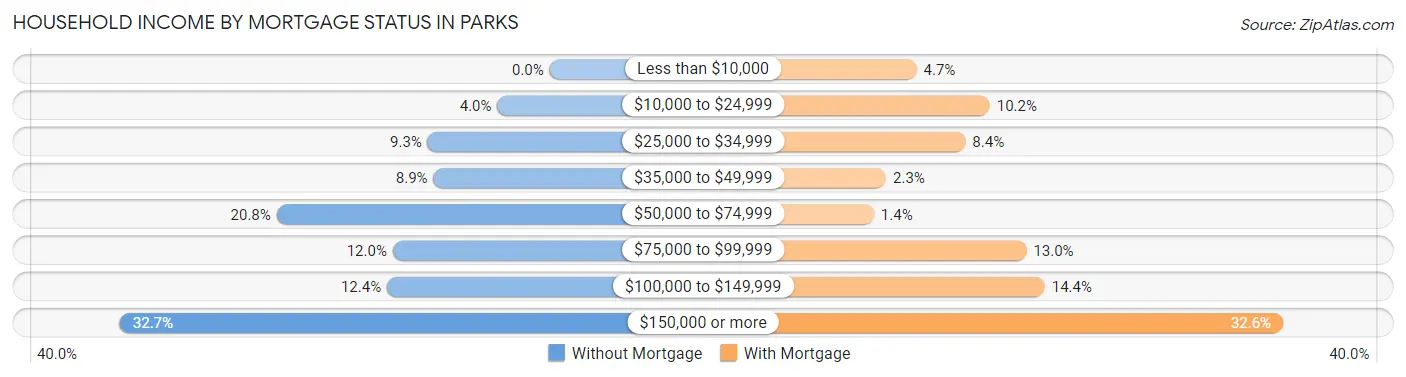
| Household Income | Without Mortgage | With Mortgage |
| Less than $10,000 | 0 (0.0%) | 10 (4.6%) |
| $10,000 to $24,999 | 9 (4.0%) | 22 (10.2%) |
| $25,000 to $34,999 | 21 (9.3%) | 18 (8.4%) |
| $35,000 to $49,999 | 20 (8.8%) | 5 (2.3%) |
| $50,000 to $74,999 | 47 (20.8%) | 3 (1.4%) |
| $75,000 to $99,999 | 27 (11.9%) | 28 (13.0%) |
| $100,000 to $149,999 | 28 (12.4%) | 31 (14.4%) |
| $150,000 or more | 74 (32.7%) | 70 (32.6%) |
| Total | 226 (100.0%) | 215 (100.0%) |
Property Value to Household Income Ratio in Parks
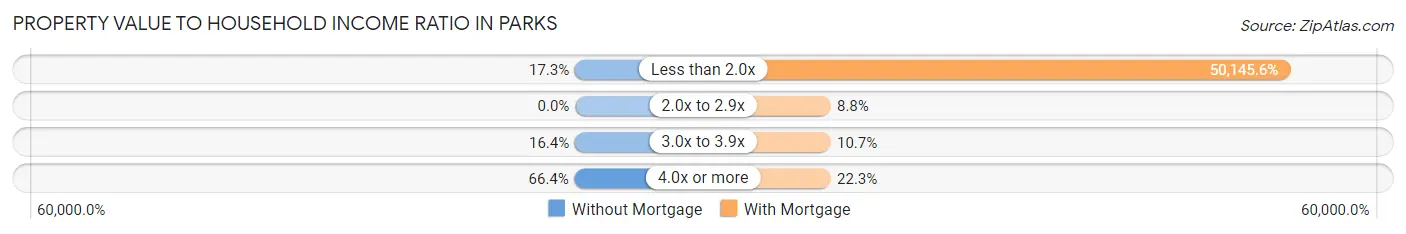
| Value-to-Income Ratio | Without Mortgage | With Mortgage |
| Less than 2.0x | 39 (17.3%) | 107,813 (50,145.6%) |
| 2.0x to 2.9x | 0 (0.0%) | 19 (8.8%) |
| 3.0x to 3.9x | 37 (16.4%) | 23 (10.7%) |
| 4.0x or more | 150 (66.4%) | 48 (22.3%) |
| Total | 226 (100.0%) | 215 (100.0%) |
Real Estate Taxes by Mortgage Status in Parks
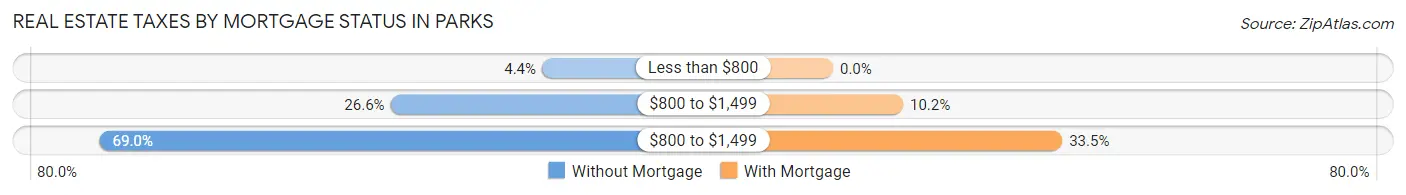
| Property Taxes | Without Mortgage | With Mortgage |
| Less than $800 | 10 (4.4%) | 0 (0.0%) |
| $800 to $1,499 | 60 (26.6%) | 22 (10.2%) |
| $800 to $1,499 | 156 (69.0%) | 72 (33.5%) |
| Total | 226 (100.0%) | 215 (100.0%) |
Health & Disability in Parks
Health Insurance Coverage by Age in Parks
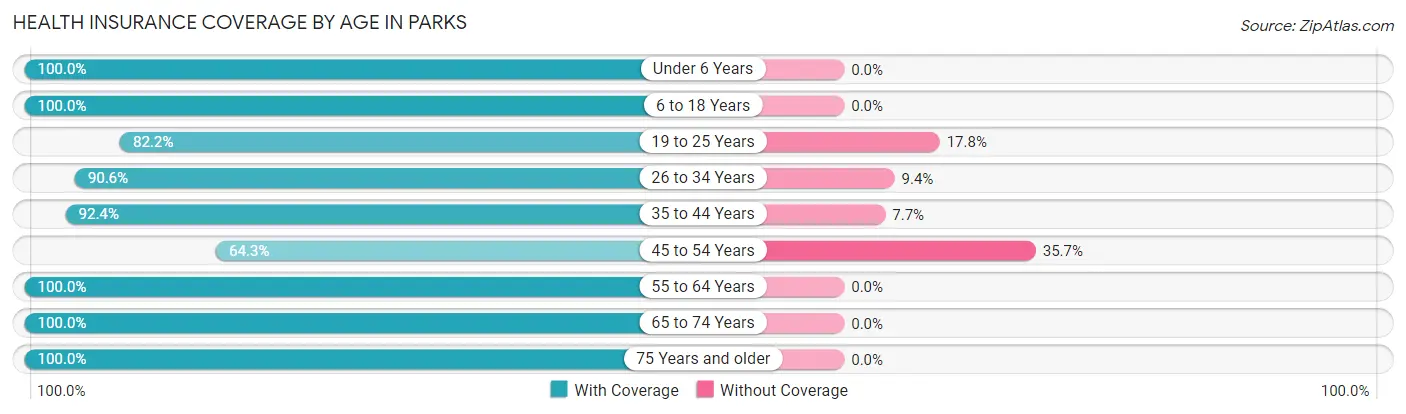
| Age Bracket | With Coverage | Without Coverage |
| Under 6 Years | 74 (100.0%) | 0 (0.0%) |
| 6 to 18 Years | 226 (100.0%) | 0 (0.0%) |
| 19 to 25 Years | 97 (82.2%) | 21 (17.8%) |
| 26 to 34 Years | 87 (90.6%) | 9 (9.4%) |
| 35 to 44 Years | 157 (92.3%) | 13 (7.6%) |
| 45 to 54 Years | 36 (64.3%) | 20 (35.7%) |
| 55 to 64 Years | 223 (100.0%) | 0 (0.0%) |
| 65 to 74 Years | 259 (100.0%) | 0 (0.0%) |
| 75 Years and older | 130 (100.0%) | 0 (0.0%) |
| Total | 1,289 (95.3%) | 63 (4.7%) |
Health Insurance Coverage by Citizenship Status in Parks
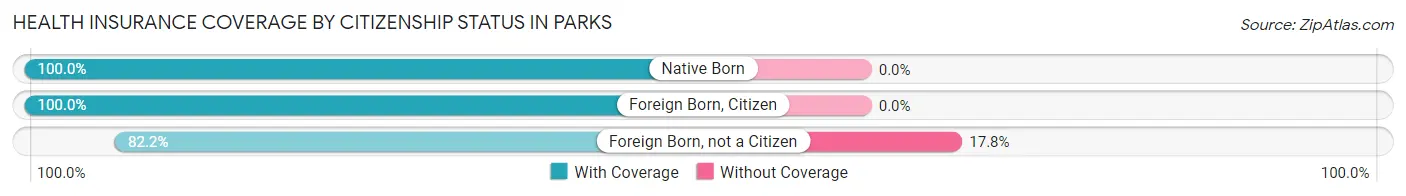
| Citizenship Status | With Coverage | Without Coverage |
| Native Born | 74 (100.0%) | 0 (0.0%) |
| Foreign Born, Citizen | 226 (100.0%) | 0 (0.0%) |
| Foreign Born, not a Citizen | 97 (82.2%) | 21 (17.8%) |
Health Insurance Coverage by Household Income in Parks
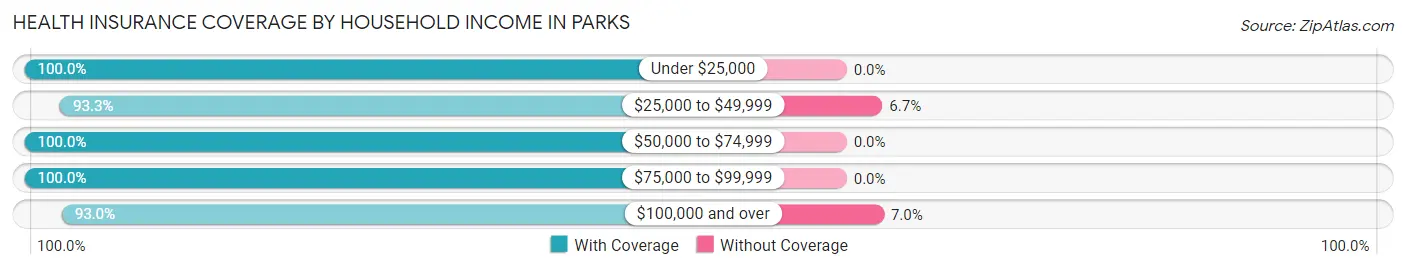
| Household Income | With Coverage | Without Coverage |
| Under $25,000 | 71 (100.0%) | 0 (0.0%) |
| $25,000 to $49,999 | 98 (93.3%) | 7 (6.7%) |
| $50,000 to $74,999 | 209 (100.0%) | 0 (0.0%) |
| $75,000 to $99,999 | 163 (100.0%) | 0 (0.0%) |
| $100,000 and over | 748 (93.0%) | 56 (7.0%) |
Public vs Private Health Insurance Coverage by Age in Parks
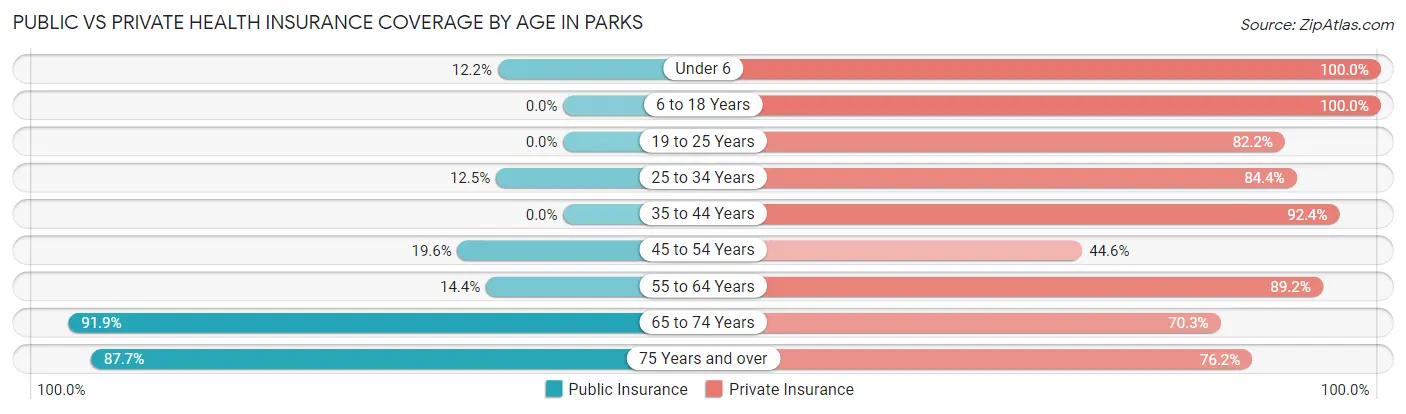
| Age Bracket | Public Insurance | Private Insurance |
| Under 6 | 9 (12.2%) | 74 (100.0%) |
| 6 to 18 Years | 0 (0.0%) | 226 (100.0%) |
| 19 to 25 Years | 0 (0.0%) | 97 (82.2%) |
| 25 to 34 Years | 12 (12.5%) | 81 (84.4%) |
| 35 to 44 Years | 0 (0.0%) | 157 (92.3%) |
| 45 to 54 Years | 11 (19.6%) | 25 (44.6%) |
| 55 to 64 Years | 32 (14.3%) | 199 (89.2%) |
| 65 to 74 Years | 238 (91.9%) | 182 (70.3%) |
| 75 Years and over | 114 (87.7%) | 99 (76.1%) |
| Total | 416 (30.8%) | 1,140 (84.3%) |
Disability Status by Sex by Age in Parks
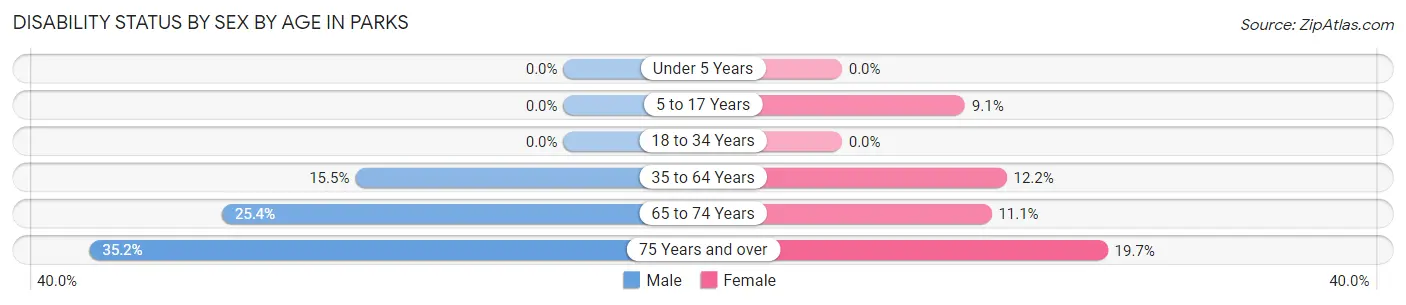
| Age Bracket | Male | Female |
| Under 5 Years | 0 (0.0%) | 0 (0.0%) |
| 5 to 17 Years | 0 (0.0%) | 16 (9.1%) |
| 18 to 34 Years | 0 (0.0%) | 0 (0.0%) |
| 35 to 64 Years | 34 (15.4%) | 28 (12.2%) |
| 65 to 74 Years | 36 (25.4%) | 13 (11.1%) |
| 75 Years and over | 19 (35.2%) | 15 (19.7%) |
Disability Class by Sex by Age in Parks
Disability Class: Hearing Difficulty
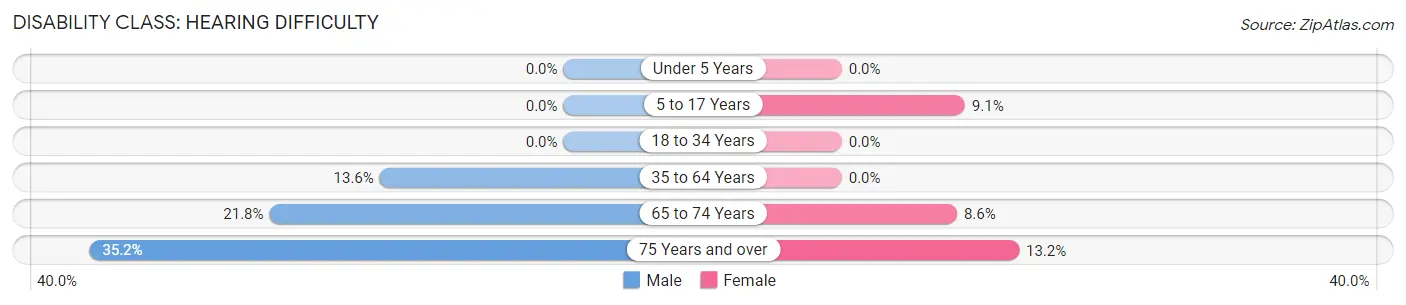
| Age Bracket | Male | Female |
| Under 5 Years | 0 (0.0%) | 0 (0.0%) |
| 5 to 17 Years | 0 (0.0%) | 16 (9.1%) |
| 18 to 34 Years | 0 (0.0%) | 0 (0.0%) |
| 35 to 64 Years | 30 (13.6%) | 0 (0.0%) |
| 65 to 74 Years | 31 (21.8%) | 10 (8.6%) |
| 75 Years and over | 19 (35.2%) | 10 (13.2%) |
Disability Class: Vision Difficulty
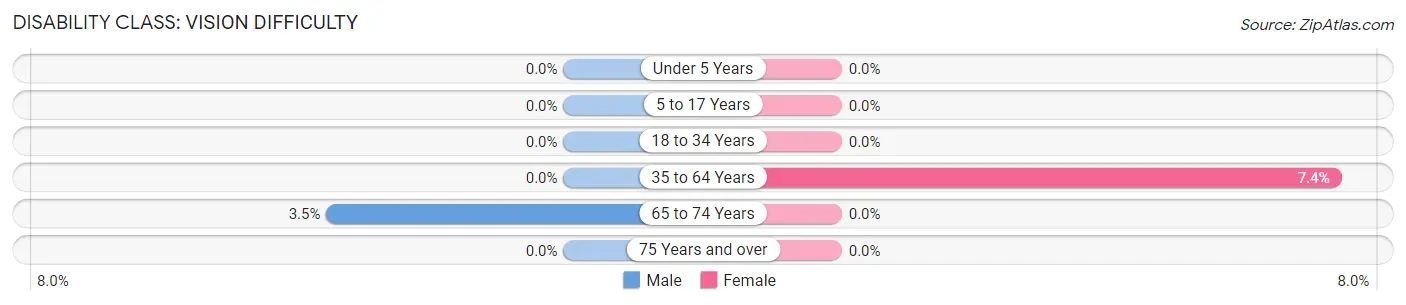
| Age Bracket | Male | Female |
| Under 5 Years | 0 (0.0%) | 0 (0.0%) |
| 5 to 17 Years | 0 (0.0%) | 0 (0.0%) |
| 18 to 34 Years | 0 (0.0%) | 0 (0.0%) |
| 35 to 64 Years | 0 (0.0%) | 17 (7.4%) |
| 65 to 74 Years | 5 (3.5%) | 0 (0.0%) |
| 75 Years and over | 0 (0.0%) | 0 (0.0%) |
Disability Class: Cognitive Difficulty
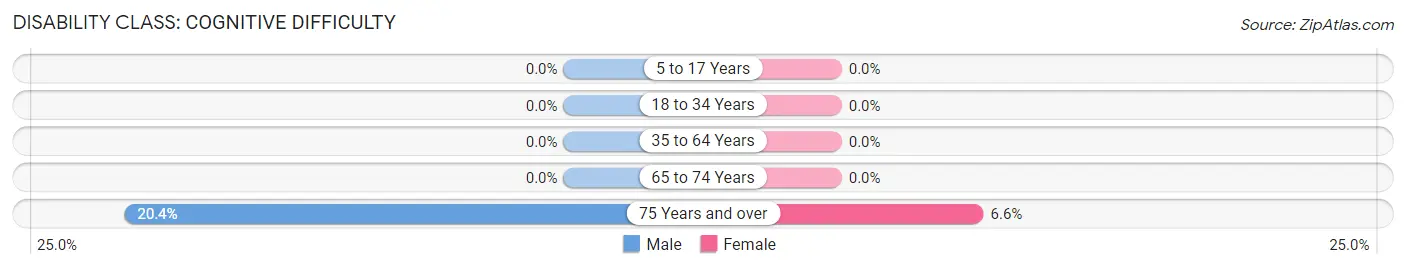
| Age Bracket | Male | Female |
| 5 to 17 Years | 0 (0.0%) | 0 (0.0%) |
| 18 to 34 Years | 0 (0.0%) | 0 (0.0%) |
| 35 to 64 Years | 0 (0.0%) | 0 (0.0%) |
| 65 to 74 Years | 0 (0.0%) | 0 (0.0%) |
| 75 Years and over | 11 (20.4%) | 5 (6.6%) |
Disability Class: Ambulatory Difficulty
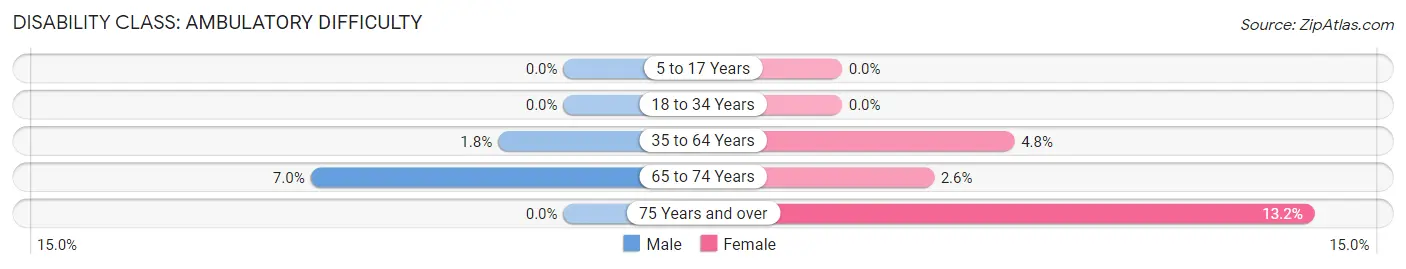
| Age Bracket | Male | Female |
| 5 to 17 Years | 0 (0.0%) | 0 (0.0%) |
| 18 to 34 Years | 0 (0.0%) | 0 (0.0%) |
| 35 to 64 Years | 4 (1.8%) | 11 (4.8%) |
| 65 to 74 Years | 10 (7.0%) | 3 (2.6%) |
| 75 Years and over | 0 (0.0%) | 10 (13.2%) |
Disability Class: Self-Care Difficulty
| Age Bracket | Male | Female |
| 5 to 17 Years | 0 (0.0%) | 0 (0.0%) |
| 18 to 34 Years | 0 (0.0%) | 0 (0.0%) |
| 35 to 64 Years | 0 (0.0%) | 0 (0.0%) |
| 65 to 74 Years | 0 (0.0%) | 0 (0.0%) |
| 75 Years and over | 0 (0.0%) | 0 (0.0%) |
Technology Access in Parks
Computing Device Access in Parks
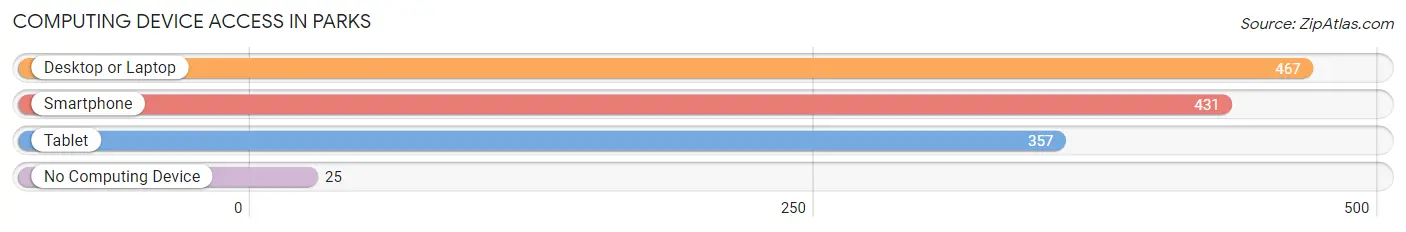
| Device Type | # Households | % Households |
| Desktop or Laptop | 467 | 91.7% |
| Smartphone | 431 | 84.7% |
| Tablet | 357 | 70.1% |
| No Computing Device | 25 | 4.9% |
| Total | 509 | 100.0% |
Internet Access in Parks
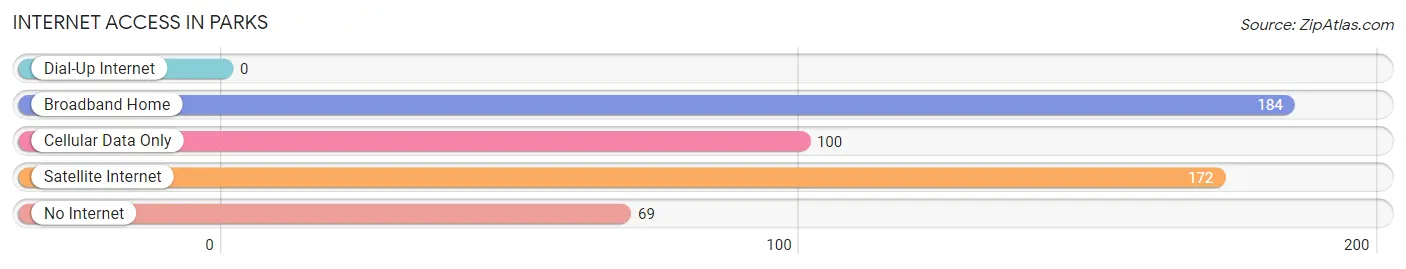
| Internet Type | # Households | % Households |
| Dial-Up Internet | 0 | 0.0% |
| Broadband Home | 184 | 36.1% |
| Cellular Data Only | 100 | 19.7% |
| Satellite Internet | 172 | 33.8% |
| No Internet | 69 | 13.6% |
| Total | 509 | 100.0% |
Parks Summary
Arizona is a state located in the southwestern region of the United States. It is bordered by New Mexico to the east, Utah to the north, Nevada to the northwest, California to the west, and Mexico to the south. Arizona is the sixth largest state in the United States, with an area of 113,998 square miles. It is also the 14th most populous state, with a population of 7,278,717 as of 2019.
Arizona is known for its diverse geography, ranging from the Sonoran Desert in the south to the pine-covered mountains of the north. The state is home to the Grand Canyon, one of the seven natural wonders of the world. Arizona is also home to numerous national parks, monuments, and other protected areas, including Saguaro National Park, Petrified Forest National Park, and Monument Valley Navajo Tribal Park.
The economy of Arizona is largely based on tourism, agriculture, and mining. Tourism is a major industry in the state, with visitors drawn to its natural beauty and attractions such as the Grand Canyon, Monument Valley, and the Petrified Forest. Agriculture is also an important part of the state’s economy, with crops such as cotton, hay, and citrus fruits being grown in the state. Mining is also a major industry in Arizona, with copper being the state’s most valuable mineral.
The demographics of Arizona are diverse, with the state being home to a variety of ethnic and racial groups. The largest racial group in the state is White, making up 57.3% of the population. The second largest racial group is Hispanic or Latino, making up 30.2% of the population. Other racial groups in the state include Native American (4.9%), Asian (3.2%), and African American (2.7%).
Arizona is also home to a variety of religious groups, with the largest being Christianity, making up 63.2% of the population. Other religious groups in the state include Judaism (2.2%), Islam (1.2%), and Buddhism (0.7%).
Arizona is a state with a rich history and culture. It has been home to numerous Native American tribes for centuries, and was part of Mexico until the Mexican-American War in 1848. The state was admitted to the Union in 1912, and has since become an important part of the United States. Arizona is a state with a diverse population, economy, and geography, and is a great place to visit and explore.
Common Questions
What is Per Capita Income in Parks?
Per Capita income in Parks is $42,436.
What is the Median Family Income in Parks?
Median Family Income in Parks is $119,063.
What is the Median Household income in Parks?
Median Household Income in Parks is $93,854.
What is Income or Wage Gap in Parks?
Income or Wage Gap in Parks is 21.9%.
Women in Parks earn 78.1 cents for every dollar earned by a man.
What is Inequality or Gini Index in Parks?
Inequality or Gini Index in Parks is 0.39.
What is the Total Population of Parks?
Total Population of Parks is 1,352.
What is the Total Male Population of Parks?
Total Male Population of Parks is 589.
What is the Total Female Population of Parks?
Total Female Population of Parks is 763.
What is the Ratio of Males per 100 Females in Parks?
There are 77.20 Males per 100 Females in Parks.
What is the Ratio of Females per 100 Males in Parks?
There are 129.54 Females per 100 Males in Parks.
What is the Median Population Age in Parks?
Median Population Age in Parks is 43.9 Years.
What is the Average Family Size in Parks
Average Family Size in Parks is 3.1 People.
What is the Average Household Size in Parks
Average Household Size in Parks is 2.7 People.
How Large is the Labor Force in Parks?
There are 532 People in the Labor Forcein in Parks.
What is the Percentage of People in the Labor Force in Parks?
48.6% of People are in the Labor Force in Parks.
What is the Unemployment Rate in Parks?
Unemployment Rate in Parks is 1.1%.