Page, AZ Map & Demographics
Page Map
Page Overview
$31,581
PER CAPITA INCOME
$122,789
AVG FAMILY INCOME
$79,521
AVG HOUSEHOLD INCOME
38.7%
WAGE / INCOME GAP [ % ]
61.3¢/ $1
WAGE / INCOME GAP [ $ ]
0.42
INEQUALITY / GINI INDEX
7,444
TOTAL POPULATION
3,922
MALE POPULATION
3,522
FEMALE POPULATION
111.36
MALES / 100 FEMALES
89.80
FEMALES / 100 MALES
32.1
MEDIAN AGE
3.4
AVG FAMILY SIZE
2.6
AVG HOUSEHOLD SIZE
3,675
LABOR FORCE [ PEOPLE ]
65.5%
PERCENT IN LABOR FORCE
12.5%
UNEMPLOYMENT RATE
Page Zip Codes
Page Area Codes
Income in Page
Income Overview in Page
Per Capita Income in Page is $31,581, while median incomes of families and households are $122,789 and $79,521 respectively.
| Characteristic | Number | Measure |
| Per Capita Income | 7,444 | $31,581 |
| Median Family Income | 1,735 | $122,789 |
| Mean Family Income | 1,735 | $115,924 |
| Median Household Income | 2,854 | $79,521 |
| Mean Household Income | 2,854 | $89,666 |
| Income Deficit | 1,735 | $0 |
| Wage / Income Gap (%) | 7,444 | 38.67% |
| Wage / Income Gap ($) | 7,444 | 61.33¢ per $1 |
| Gini / Inequality Index | 7,444 | 0.42 |
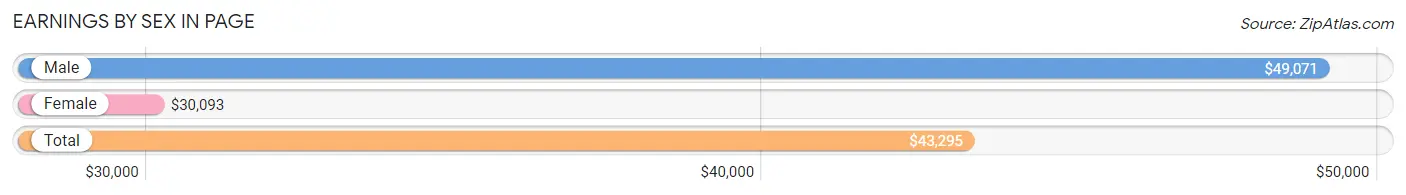
Earnings by Sex in Page
Average Earnings in Page are $43,295, $49,071 for men and $30,093 for women, a difference of 38.7%.
| Sex | Number | Average Earnings |
| Male | 2,008 (54.0%) | $49,071 |
| Female | 1,713 (46.0%) | $30,093 |
| Total | 3,721 (100.0%) | $43,295 |
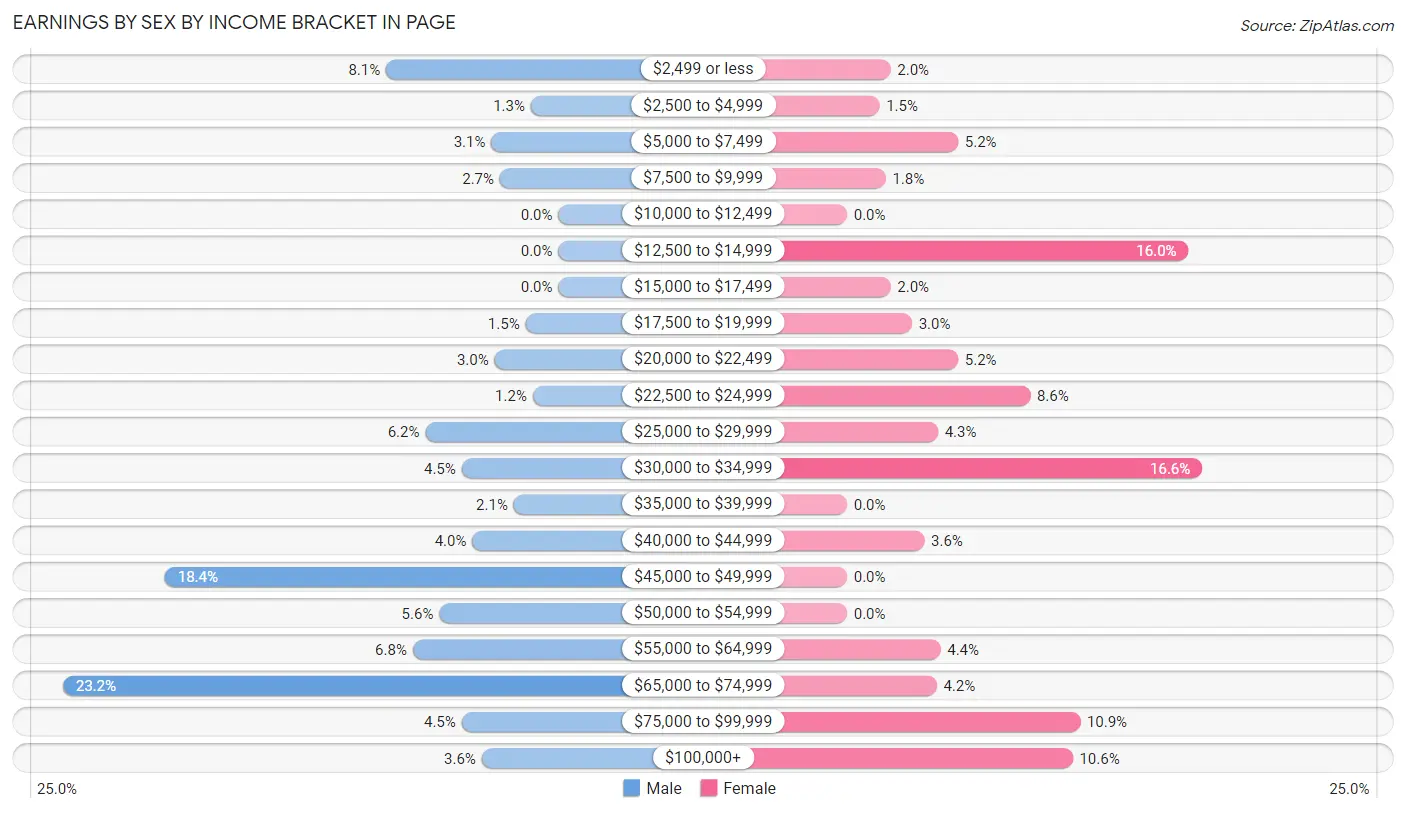
Earnings by Sex by Income Bracket in Page
The most common earnings brackets in Page are $65,000 to $74,999 for men (466 | 23.2%) and $30,000 to $34,999 for women (285 | 16.6%).
| Income | Male | Female |
| $2,499 or less | 162 (8.1%) | 35 (2.0%) |
| $2,500 to $4,999 | 26 (1.3%) | 26 (1.5%) |
| $5,000 to $7,499 | 63 (3.1%) | 89 (5.2%) |
| $7,500 to $9,999 | 55 (2.7%) | 31 (1.8%) |
| $10,000 to $12,499 | 0 (0.0%) | 0 (0.0%) |
| $12,500 to $14,999 | 0 (0.0%) | 274 (16.0%) |
| $15,000 to $17,499 | 0 (0.0%) | 35 (2.0%) |
| $17,500 to $19,999 | 31 (1.5%) | 52 (3.0%) |
| $20,000 to $22,499 | 60 (3.0%) | 89 (5.2%) |
| $22,500 to $24,999 | 24 (1.2%) | 147 (8.6%) |
| $25,000 to $29,999 | 125 (6.2%) | 73 (4.3%) |
| $30,000 to $34,999 | 91 (4.5%) | 285 (16.6%) |
| $35,000 to $39,999 | 42 (2.1%) | 0 (0.0%) |
| $40,000 to $44,999 | 81 (4.0%) | 62 (3.6%) |
| $45,000 to $49,999 | 370 (18.4%) | 0 (0.0%) |
| $50,000 to $54,999 | 112 (5.6%) | 0 (0.0%) |
| $55,000 to $64,999 | 137 (6.8%) | 75 (4.4%) |
| $65,000 to $74,999 | 466 (23.2%) | 72 (4.2%) |
| $75,000 to $99,999 | 91 (4.5%) | 187 (10.9%) |
| $100,000+ | 72 (3.6%) | 181 (10.6%) |
| Total | 2,008 (100.0%) | 1,713 (100.0%) |
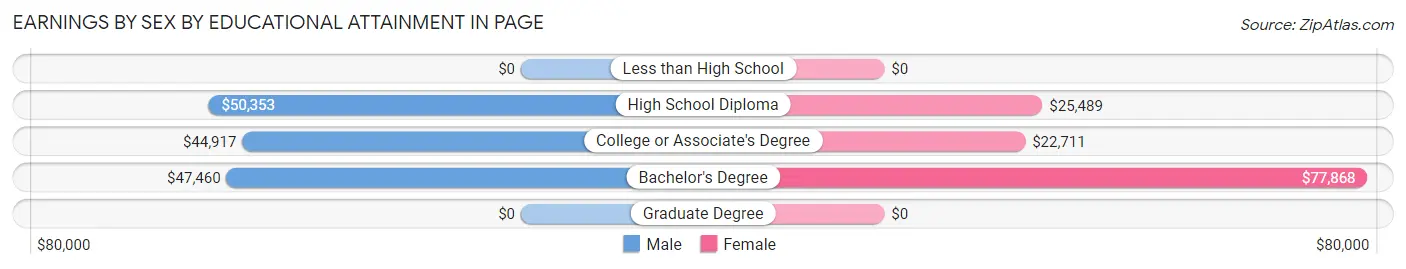
Earnings by Sex by Educational Attainment in Page
Average earnings in Page are $50,353 for men and $30,735 for women, a difference of 39.0%. Men with an educational attainment of high school diploma enjoy the highest average annual earnings of $50,353, while those with college or associate's degree education earn the least with $44,917. Women with an educational attainment of bachelor's degree earn the most with the average annual earnings of $77,868, while those with college or associate's degree education have the smallest earnings of $22,711.
| Educational Attainment | Male Income | Female Income |
| Less than High School | - | - |
| High School Diploma | $50,353 | $25,489 |
| College or Associate's Degree | $44,917 | $22,711 |
| Bachelor's Degree | $47,460 | $77,868 |
| Graduate Degree | - | - |
| Total | $50,353 | $30,735 |
Family Income in Page
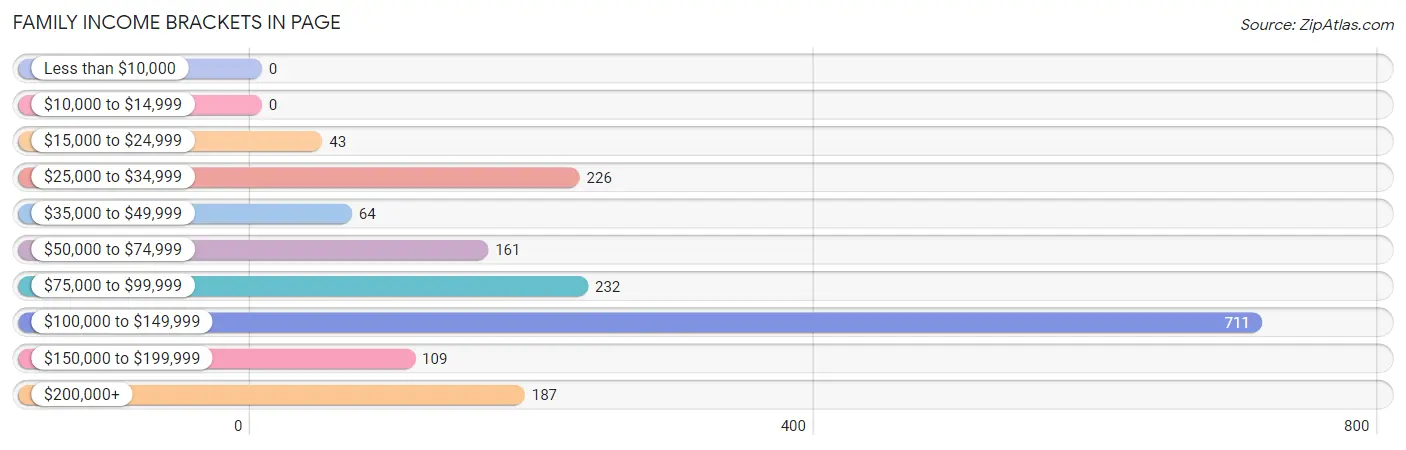
Family Income Brackets in Page
According to the Page family income data, there are 711 families falling into the $100,000 to $149,999 income range, which is the most common income bracket and makes up 41.0% of all families.
| Income Bracket | # Families | % Families |
| Less than $10,000 | 0 | 0.0% |
| $10,000 to $14,999 | 0 | 0.0% |
| $15,000 to $24,999 | 43 | 2.5% |
| $25,000 to $34,999 | 226 | 13.0% |
| $35,000 to $49,999 | 64 | 3.7% |
| $50,000 to $74,999 | 161 | 9.3% |
| $75,000 to $99,999 | 232 | 13.4% |
| $100,000 to $149,999 | 711 | 41.0% |
| $150,000 to $199,999 | 109 | 6.3% |
| $200,000+ | 187 | 10.8% |
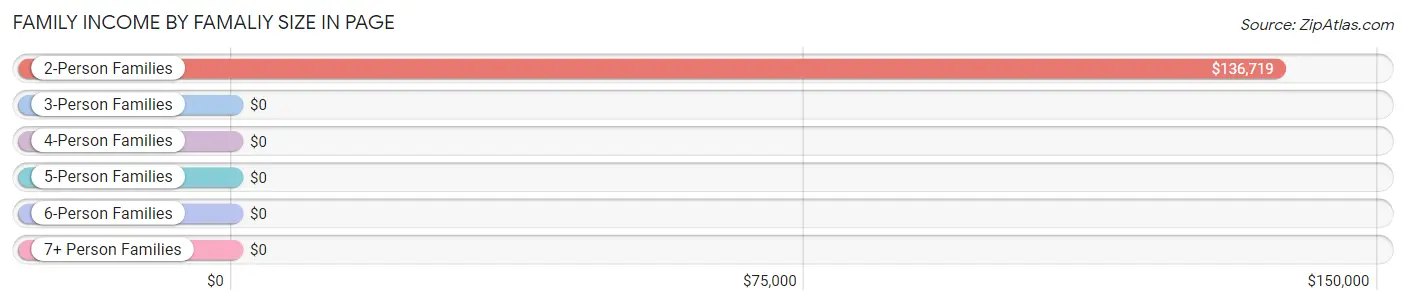
Family Income by Famaliy Size in Page
2-person families (595 | 34.3%) account for the highest median family income in Page with $136,719 per family, while 2-person families (595 | 34.3%) have the highest median income of $68,360 per family member.
| Income Bracket | # Families | Median Income |
| 2-Person Families | 595 (34.3%) | $136,719 |
| 3-Person Families | 420 (24.2%) | $0 |
| 4-Person Families | 298 (17.2%) | $0 |
| 5-Person Families | 106 (6.1%) | $0 |
| 6-Person Families | 316 (18.2%) | $0 |
| 7+ Person Families | 0 (0.0%) | $0 |
| Total | 1,735 (100.0%) | $122,789 |
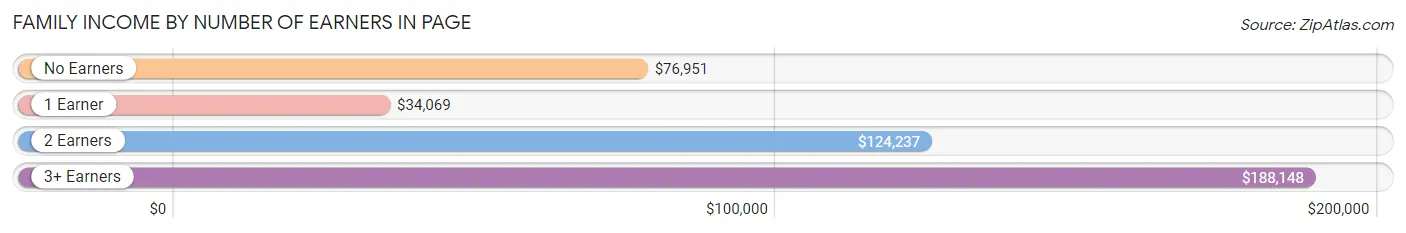
Family Income by Number of Earners in Page
The median family income in Page is $122,789, with families comprising 3+ earners (200) having the highest median family income of $188,148, while families with 1 earner (436) have the lowest median family income of $34,069, accounting for 11.5% and 25.1% of families, respectively.
| Number of Earners | # Families | Median Income |
| No Earners | 194 (11.2%) | $76,951 |
| 1 Earner | 436 (25.1%) | $34,069 |
| 2 Earners | 905 (52.2%) | $124,237 |
| 3+ Earners | 200 (11.5%) | $188,148 |
| Total | 1,735 (100.0%) | $122,789 |
Household Income in Page
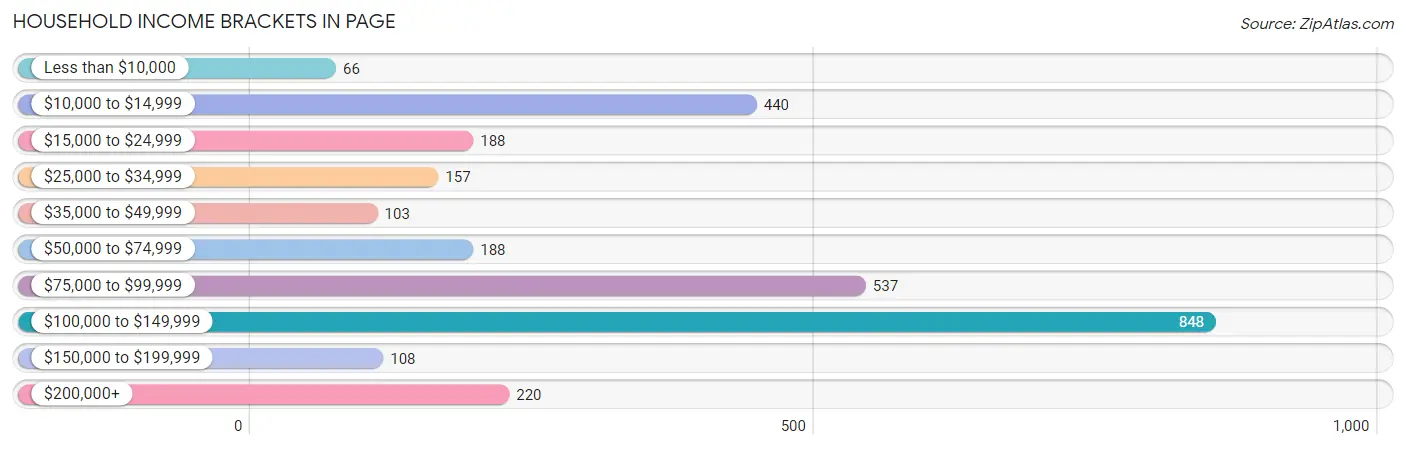
Household Income Brackets in Page
With 848 households falling in the category, the $100,000 to $149,999 income range is the most frequent in Page, accounting for 29.7% of all households. In contrast, only 66 households (2.3%) fall into the less than $10,000 income bracket, making it the least populous group.
| Income Bracket | # Households | % Households |
| Less than $10,000 | 66 | 2.3% |
| $10,000 to $14,999 | 440 | 15.4% |
| $15,000 to $24,999 | 188 | 6.6% |
| $25,000 to $34,999 | 157 | 5.5% |
| $35,000 to $49,999 | 103 | 3.6% |
| $50,000 to $74,999 | 188 | 6.6% |
| $75,000 to $99,999 | 537 | 18.8% |
| $100,000 to $149,999 | 848 | 29.7% |
| $150,000 to $199,999 | 108 | 3.8% |
| $200,000+ | 220 | 7.7% |
Household Income by Householder Age in Page
The median household income in Page is $79,521, with the highest median household income of $121,968 found in the 45 to 64 years age bracket for the primary householder. A total of 1,485 households (52.0%) fall into this category. Meanwhile, the 15 to 24 years age bracket for the primary householder has the lowest median household income of $0, with 42 households (1.5%) in this group.
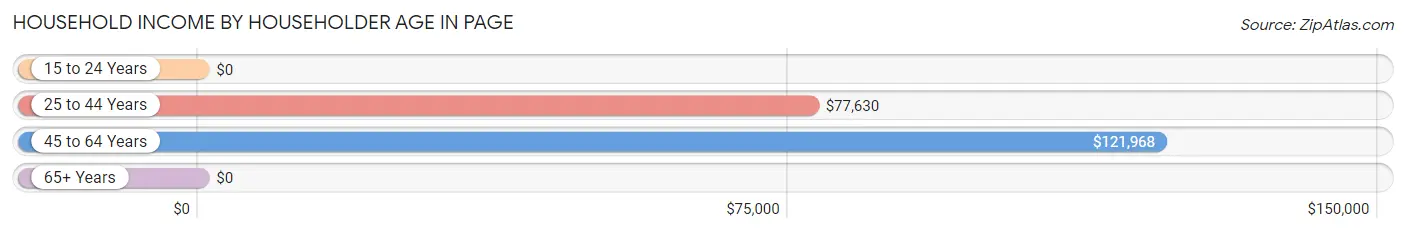
| Income Bracket | # Households | Median Income |
| 15 to 24 Years | 42 (1.5%) | $0 |
| 25 to 44 Years | 702 (24.6%) | $77,630 |
| 45 to 64 Years | 1,485 (52.0%) | $121,968 |
| 65+ Years | 625 (21.9%) | $0 |
| Total | 2,854 (100.0%) | $79,521 |
Poverty in Page
Income Below Poverty by Sex and Age in Page
With 10.8% poverty level for males and 14.0% for females among the residents of Page, 55 to 64 year old males and under 5 year old females are the most vulnerable to poverty, with 205 males (46.8%) and 49 females (100.0%) in their respective age groups living below the poverty level.
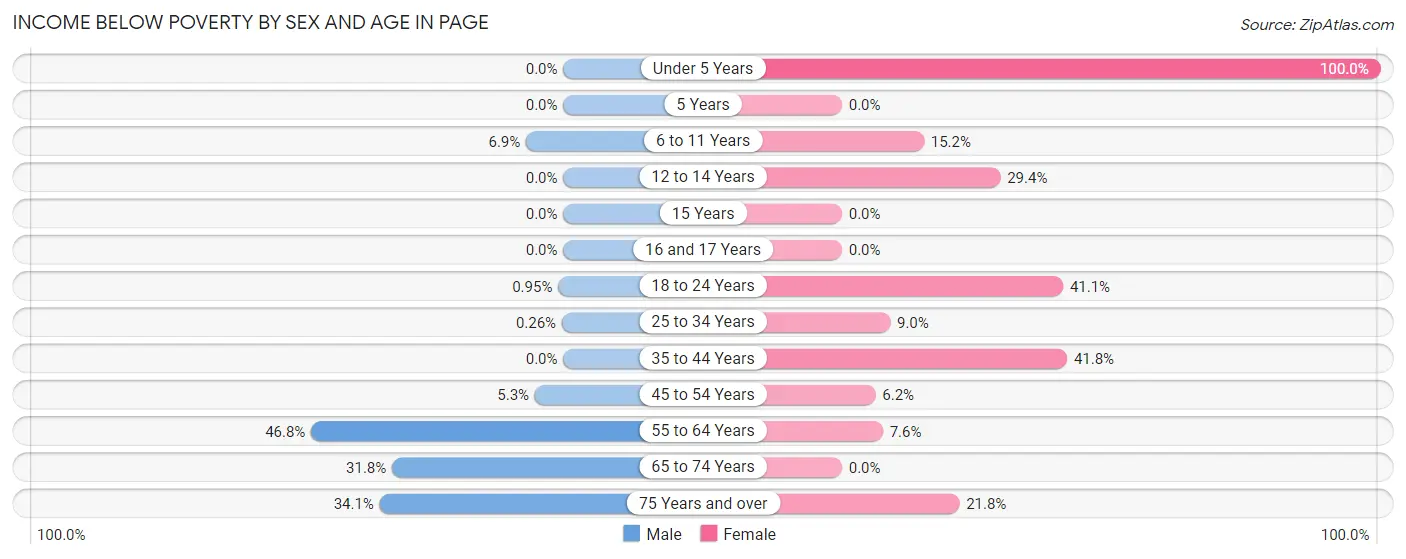
| Age Bracket | Male | Female |
| Under 5 Years | 0 (0.0%) | 49 (100.0%) |
| 5 Years | 0 (0.0%) | 0 (0.0%) |
| 6 to 11 Years | 36 (6.9%) | 51 (15.2%) |
| 12 to 14 Years | 0 (0.0%) | 50 (29.4%) |
| 15 Years | 0 (0.0%) | 0 (0.0%) |
| 16 and 17 Years | 0 (0.0%) | 0 (0.0%) |
| 18 to 24 Years | 2 (0.9%) | 39 (41.0%) |
| 25 to 34 Years | 2 (0.3%) | 52 (8.9%) |
| 35 to 44 Years | 0 (0.0%) | 117 (41.8%) |
| 45 to 54 Years | 31 (5.3%) | 46 (6.2%) |
| 55 to 64 Years | 205 (46.8%) | 39 (7.6%) |
| 65 to 74 Years | 116 (31.8%) | 0 (0.0%) |
| 75 Years and over | 30 (34.1%) | 51 (21.8%) |
| Total | 422 (10.8%) | 494 (14.0%) |
Income Above Poverty by Sex and Age in Page
According to the poverty statistics in Page, males aged under 5 years and females aged 15 years are the age groups that are most secure financially, with 100.0% of males and 100.0% of females in these age groups living above the poverty line.
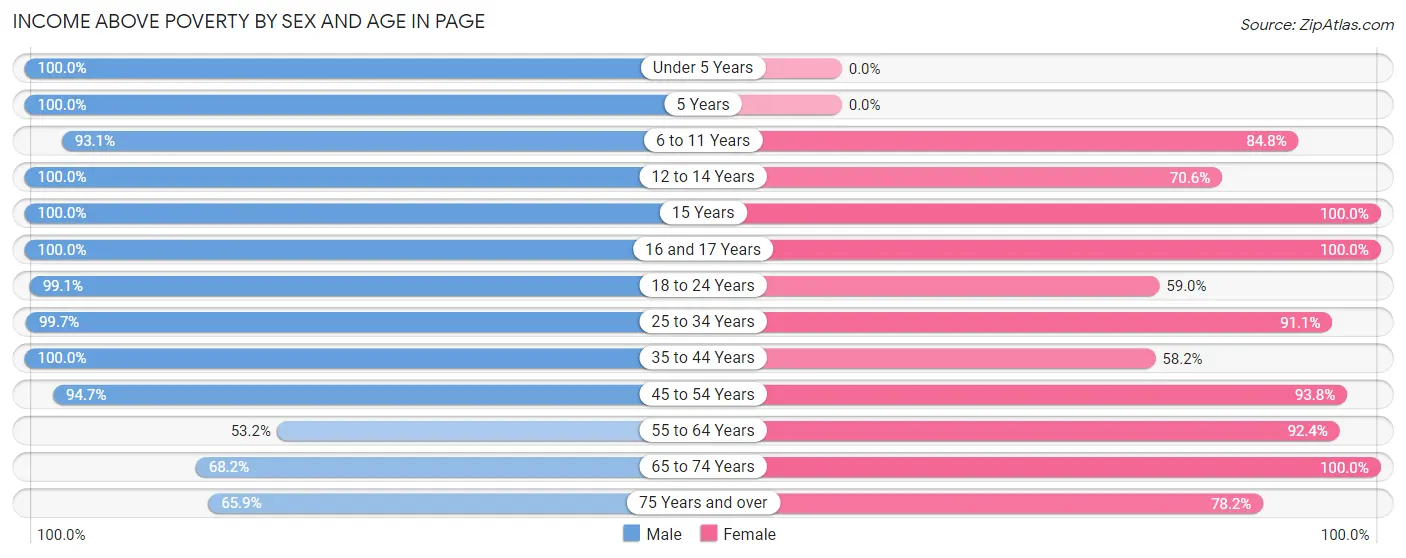
| Age Bracket | Male | Female |
| Under 5 Years | 593 (100.0%) | 0 (0.0%) |
| 5 Years | 70 (100.0%) | 0 (0.0%) |
| 6 to 11 Years | 485 (93.1%) | 284 (84.8%) |
| 12 to 14 Years | 37 (100.0%) | 120 (70.6%) |
| 15 Years | 29 (100.0%) | 30 (100.0%) |
| 16 and 17 Years | 55 (100.0%) | 331 (100.0%) |
| 18 to 24 Years | 208 (99.1%) | 56 (59.0%) |
| 25 to 34 Years | 782 (99.7%) | 529 (91.0%) |
| 35 to 44 Years | 145 (100.0%) | 163 (58.2%) |
| 45 to 54 Years | 556 (94.7%) | 692 (93.8%) |
| 55 to 64 Years | 233 (53.2%) | 475 (92.4%) |
| 65 to 74 Years | 249 (68.2%) | 165 (100.0%) |
| 75 Years and over | 58 (65.9%) | 183 (78.2%) |
| Total | 3,500 (89.2%) | 3,028 (86.0%) |
Income Below Poverty Among Married-Couple Families in Page
The poverty statistics for married-couple families in Page show that 3.2% or 43 of the total 1,367 families live below the poverty line. Families with no children have the highest poverty rate of 6.2%, comprising of 43 families. On the other hand, families with 1 or 2 children have the lowest poverty rate of 0.0%, which includes 0 families.
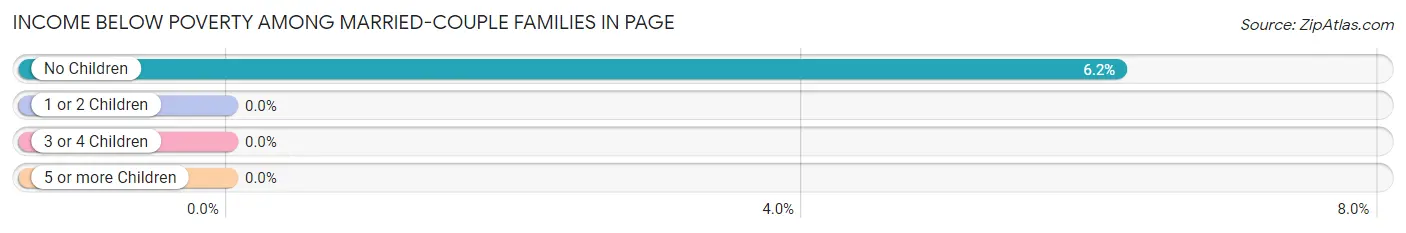
| Children | Above Poverty | Below Poverty |
| No Children | 652 (93.8%) | 43 (6.2%) |
| 1 or 2 Children | 356 (100.0%) | 0 (0.0%) |
| 3 or 4 Children | 316 (100.0%) | 0 (0.0%) |
| 5 or more Children | 0 (0.0%) | 0 (0.0%) |
| Total | 1,324 (96.9%) | 43 (3.2%) |
Income Below Poverty Among Single-Parent Households in Page
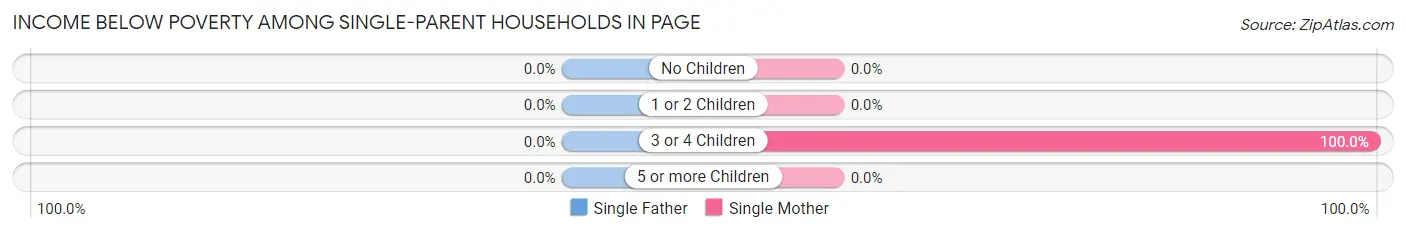
| Children | Single Father | Single Mother |
| No Children | 0 (0.0%) | 0 (0.0%) |
| 1 or 2 Children | 0 (0.0%) | 0 (0.0%) |
| 3 or 4 Children | 0 (0.0%) | 52 (100.0%) |
| 5 or more Children | 0 (0.0%) | 0 (0.0%) |
| Total | 0 (0.0%) | 52 (15.7%) |
Income Below Poverty Among Married-Couple vs Single-Parent Households in Page
The poverty data for Page shows that 43 of the married-couple family households (3.2%) and 52 of the single-parent households (14.1%) are living below the poverty level. Within the married-couple family households, those with no children have the highest poverty rate, with 43 households (6.2%) falling below the poverty line. Among the single-parent households, those with 3 or 4 children have the highest poverty rate, with 52 household (100.0%) living below poverty.
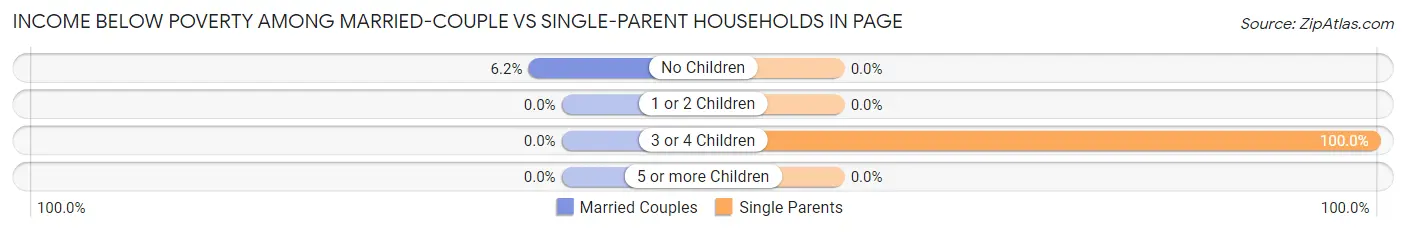
| Children | Married-Couple Families | Single-Parent Households |
| No Children | 43 (6.2%) | 0 (0.0%) |
| 1 or 2 Children | 0 (0.0%) | 0 (0.0%) |
| 3 or 4 Children | 0 (0.0%) | 52 (100.0%) |
| 5 or more Children | 0 (0.0%) | 0 (0.0%) |
| Total | 43 (3.2%) | 52 (14.1%) |
Race in Page
The most populous races in Page are Native / Alaskan (4,146 | 55.7%), White / Caucasian (2,838 | 38.1%), and Hispanic or Latino (464 | 6.2%).
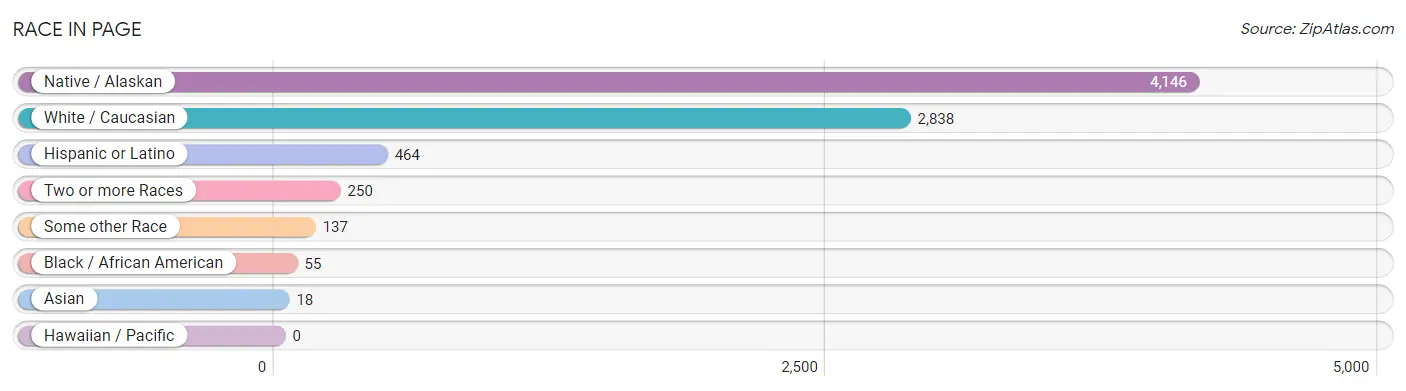
| Race | # Population | % Population |
| Asian | 18 | 0.2% |
| Black / African American | 55 | 0.7% |
| Hawaiian / Pacific | 0 | 0.0% |
| Hispanic or Latino | 464 | 6.2% |
| Native / Alaskan | 4,146 | 55.7% |
| White / Caucasian | 2,838 | 38.1% |
| Two or more Races | 250 | 3.4% |
| Some other Race | 137 | 1.8% |
| Total | 7,444 | 100.0% |
Ancestry in Page
The most populous ancestries reported in Page are Navajo (4,203 | 56.5%), English (792 | 10.6%), German (627 | 8.4%), Irish (442 | 5.9%), and Mexican (264 | 3.5%), together accounting for 85.0% of all Page residents.
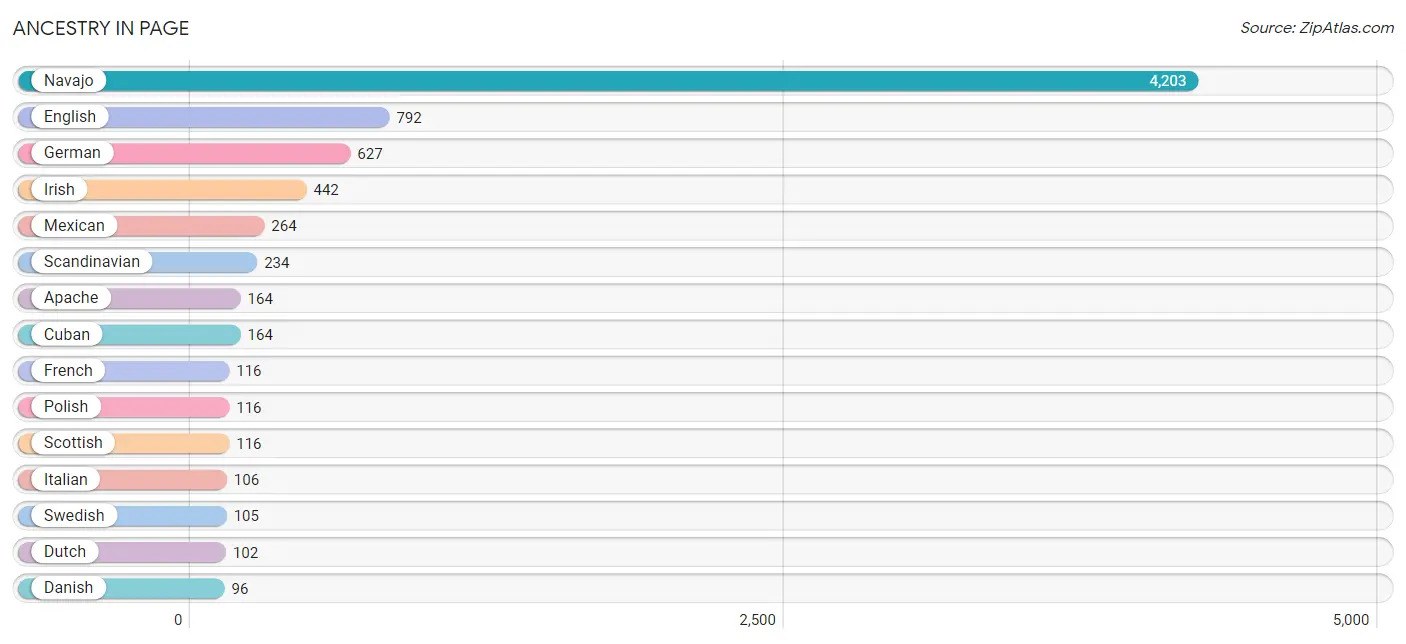
| Ancestry | # Population | % Population |
| American | 79 | 1.1% |
| Apache | 164 | 2.2% |
| Cuban | 164 | 2.2% |
| Danish | 96 | 1.3% |
| Dutch | 102 | 1.4% |
| English | 792 | 10.6% |
| European | 2 | 0.0% |
| French | 116 | 1.6% |
| French Canadian | 18 | 0.2% |
| German | 627 | 8.4% |
| Hungarian | 30 | 0.4% |
| Indian (Asian) | 42 | 0.6% |
| Irish | 442 | 5.9% |
| Italian | 106 | 1.4% |
| Maltese | 27 | 0.4% |
| Mexican | 264 | 3.5% |
| Navajo | 4,203 | 56.5% |
| New Zealander | 51 | 0.7% |
| Norwegian | 39 | 0.5% |
| Polish | 116 | 1.6% |
| Scandinavian | 234 | 3.1% |
| Scottish | 116 | 1.6% |
| Swedish | 105 | 1.4% |
| Swiss | 33 | 0.4% |
| Ukrainian | 24 | 0.3% |
| Welsh | 17 | 0.2% | View All 26 Rows |
Immigrants in Page
The most numerous immigrant groups reported in Page came from Latin America (125 | 1.7%), Central America (106 | 1.4%), Mexico (106 | 1.4%), Oceania (51 | 0.7%), and Caribbean (19 | 0.3%), together accounting for 5.5% of all Page residents.
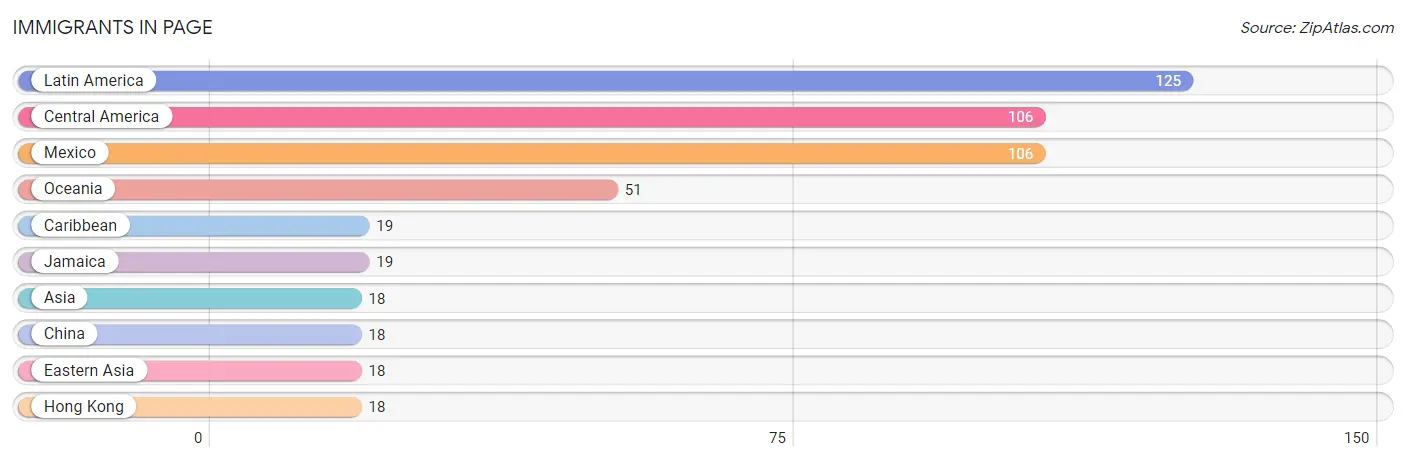
| Immigration Origin | # Population | % Population |
| Asia | 18 | 0.2% |
| Caribbean | 19 | 0.3% |
| Central America | 106 | 1.4% |
| China | 18 | 0.2% |
| Eastern Asia | 18 | 0.2% |
| Hong Kong | 18 | 0.2% |
| Jamaica | 19 | 0.3% |
| Latin America | 125 | 1.7% |
| Mexico | 106 | 1.4% |
| Oceania | 51 | 0.7% | View All 10 Rows |
Sex and Age in Page
Sex and Age in Page
The most populous age groups in Page are Under 5 Years (593 | 15.1%) for men and 45 to 49 Years (635 | 18.0%) for women.
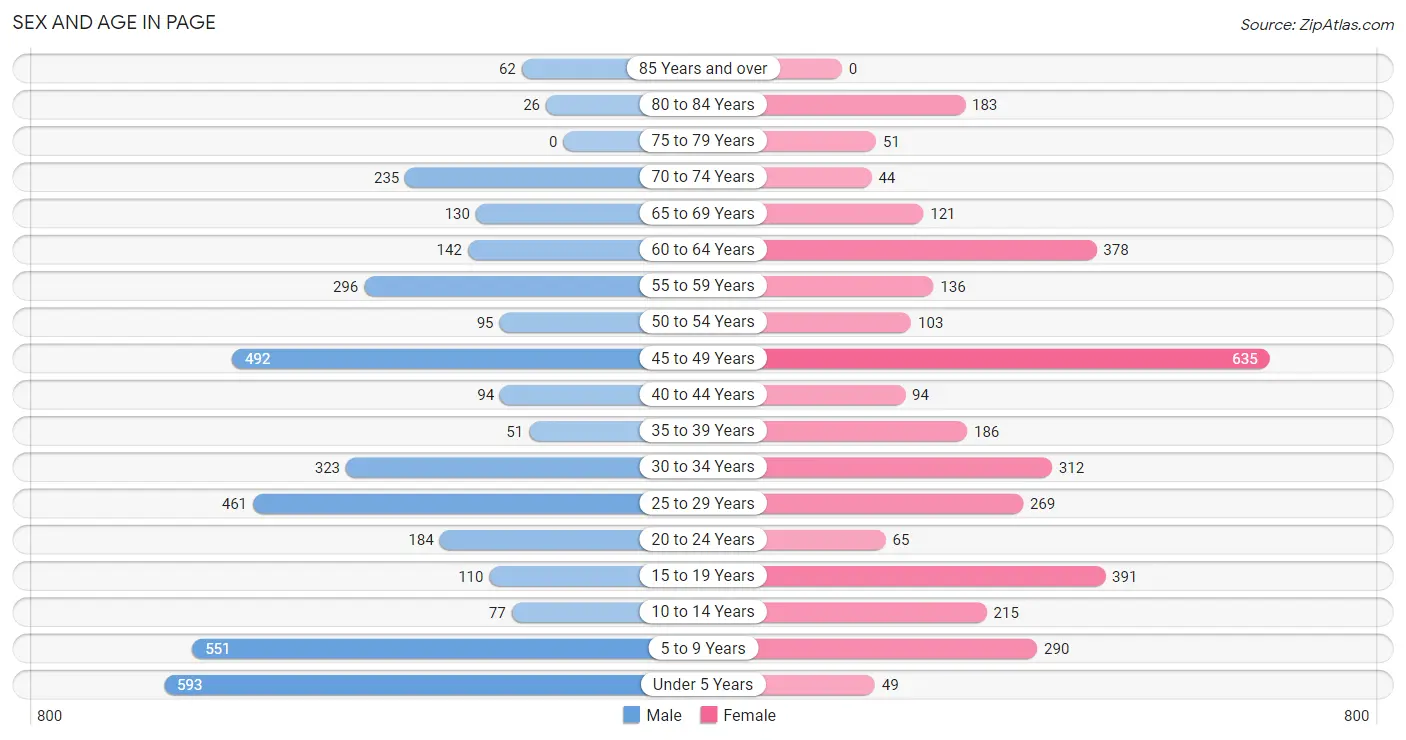
| Age Bracket | Male | Female |
| Under 5 Years | 593 (15.1%) | 49 (1.4%) |
| 5 to 9 Years | 551 (14.1%) | 290 (8.2%) |
| 10 to 14 Years | 77 (2.0%) | 215 (6.1%) |
| 15 to 19 Years | 110 (2.8%) | 391 (11.1%) |
| 20 to 24 Years | 184 (4.7%) | 65 (1.8%) |
| 25 to 29 Years | 461 (11.7%) | 269 (7.6%) |
| 30 to 34 Years | 323 (8.2%) | 312 (8.9%) |
| 35 to 39 Years | 51 (1.3%) | 186 (5.3%) |
| 40 to 44 Years | 94 (2.4%) | 94 (2.7%) |
| 45 to 49 Years | 492 (12.5%) | 635 (18.0%) |
| 50 to 54 Years | 95 (2.4%) | 103 (2.9%) |
| 55 to 59 Years | 296 (7.5%) | 136 (3.9%) |
| 60 to 64 Years | 142 (3.6%) | 378 (10.7%) |
| 65 to 69 Years | 130 (3.3%) | 121 (3.4%) |
| 70 to 74 Years | 235 (6.0%) | 44 (1.3%) |
| 75 to 79 Years | 0 (0.0%) | 51 (1.5%) |
| 80 to 84 Years | 26 (0.7%) | 183 (5.2%) |
| 85 Years and over | 62 (1.6%) | 0 (0.0%) |
| Total | 3,922 (100.0%) | 3,522 (100.0%) |
Families and Households in Page
Median Family Size in Page
The median family size in Page is 3.42 persons per family, with married-couple families (1,367 | 78.8%) accounting for the largest median family size of 3.5 persons per family. On the other hand, single male/father families (37 | 2.1%) represent the smallest median family size with 1.89 persons per family.
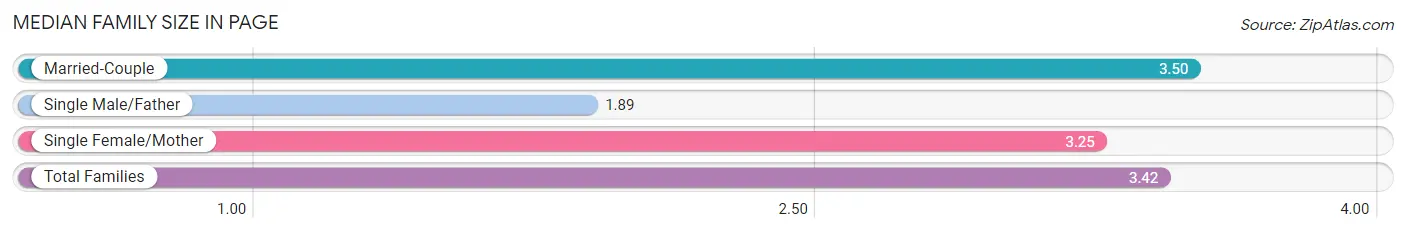
| Family Type | # Families | Family Size |
| Married-Couple | 1,367 (78.8%) | 3.50 |
| Single Male/Father | 37 (2.1%) | 1.89 |
| Single Female/Mother | 331 (19.1%) | 3.25 |
| Total Families | 1,735 (100.0%) | 3.42 |
Median Household Size in Page
The median household size in Page is 2.60 persons per household, with single female/mother households (331 | 11.6%) accounting for the largest median household size of 3.75 persons per household. non-family households (1,119 | 39.2%) represent the smallest median household size with 1.14 persons per household.
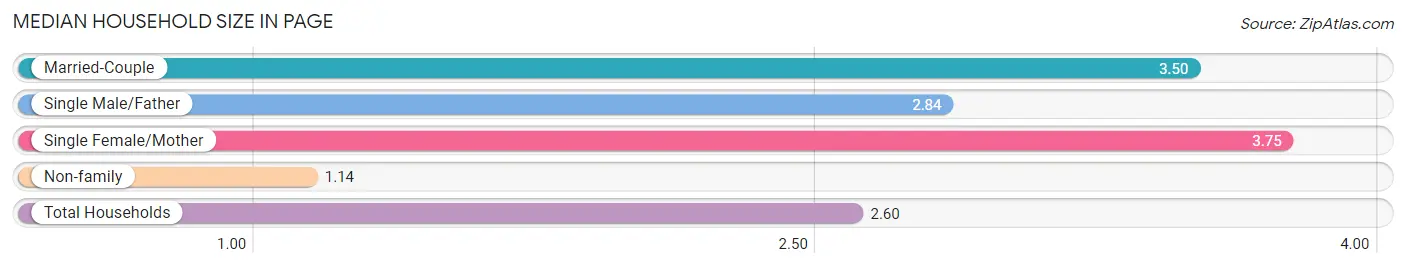
| Household Type | # Households | Household Size |
| Married-Couple | 1,367 (47.9%) | 3.50 |
| Single Male/Father | 37 (1.3%) | 2.84 |
| Single Female/Mother | 331 (11.6%) | 3.75 |
| Non-family | 1,119 (39.2%) | 1.14 |
| Total Households | 2,854 (100.0%) | 2.60 |
Household Size by Marriage Status in Page
Out of a total of 2,854 households in Page, 1,735 (60.8%) are family households, while 1,119 (39.2%) are nonfamily households. The most numerous type of family households are 2-person households, comprising 558, and the most common type of nonfamily households are 1-person households, comprising 850.
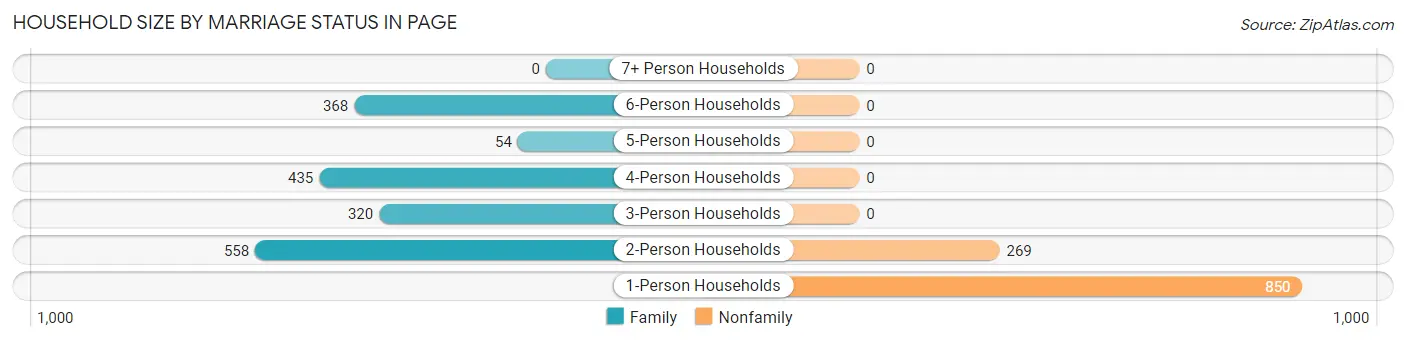
| Household Size | Family Households | Nonfamily Households |
| 1-Person Households | - | 850 (29.8%) |
| 2-Person Households | 558 (19.6%) | 269 (9.4%) |
| 3-Person Households | 320 (11.2%) | 0 (0.0%) |
| 4-Person Households | 435 (15.2%) | 0 (0.0%) |
| 5-Person Households | 54 (1.9%) | 0 (0.0%) |
| 6-Person Households | 368 (12.9%) | 0 (0.0%) |
| 7+ Person Households | 0 (0.0%) | 0 (0.0%) |
| Total | 1,735 (60.8%) | 1,119 (39.2%) |
Female Fertility in Page
Fertility by Age in Page
| Age Bracket | Women with Births | Births / 1,000 Women |
| 15 to 19 years | 0 (0.0%) | 0.0 |
| 20 to 34 years | 0 (0.0%) | 0.0 |
| 35 to 50 years | 0 (0.0%) | 0.0 |
| Total | 0 (0.0%) | 0.0 |
Fertility by Age by Marriage Status in Page
| Age Bracket | Married | Unmarried |
| 15 to 19 years | 0 (0.0%) | 0 (0.0%) |
| 20 to 34 years | 0 (0.0%) | 0 (0.0%) |
| 35 to 50 years | 0 (0.0%) | 0 (0.0%) |
| Total | 0 (0.0%) | 0 (0.0%) |
Fertility by Education in Page
| Educational Attainment | Women with Births | Births / 1,000 Women |
| Less than High School | 0 (0.0%) | 0.0 |
| High School Diploma | 0 (0.0%) | 0.0 |
| College or Associate's Degree | 0 (0.0%) | 0.0 |
| Bachelor's Degree | 0 (0.0%) | 0.0 |
| Graduate Degree | 0 (0.0%) | 0.0 |
| Total | 0 (0.0%) | 0.0 |
Fertility by Education by Marriage Status in Page
| Educational Attainment | Married | Unmarried |
| Less than High School | 0 (0.0%) | 0 (0.0%) |
| High School Diploma | 0 (0.0%) | 0 (0.0%) |
| College or Associate's Degree | 0 (0.0%) | 0 (0.0%) |
| Bachelor's Degree | 0 (0.0%) | 0 (0.0%) |
| Graduate Degree | 0 (0.0%) | 0 (0.0%) |
| Total | 0 (0.0%) | 0 (0.0%) |
Employment Characteristics in Page
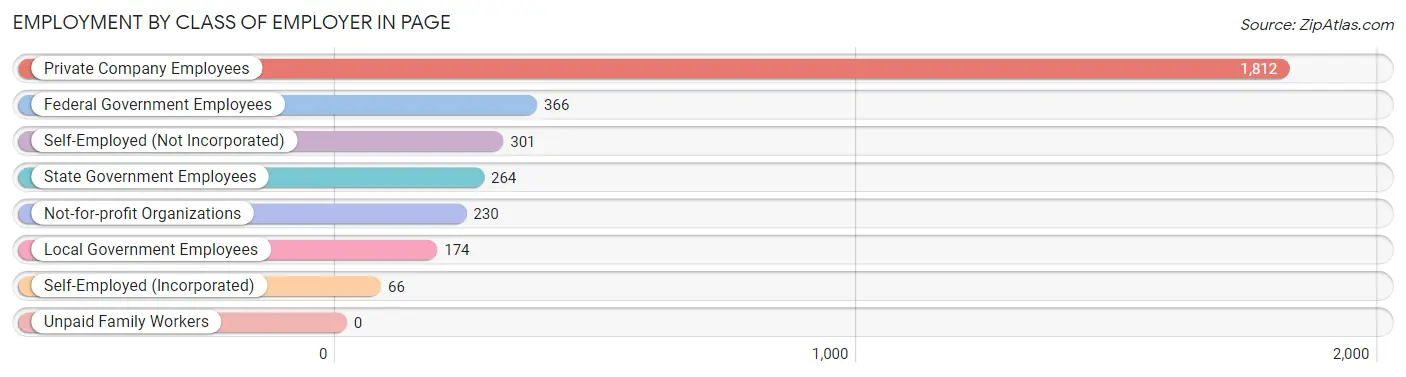
Employment by Class of Employer in Page
Among the 3,213 employed individuals in Page, private company employees (1,812 | 56.4%), federal government employees (366 | 11.4%), and self-employed (not incorporated) (301 | 9.4%) make up the most common classes of employment.
| Employer Class | # Employees | % Employees |
| Private Company Employees | 1,812 | 56.4% |
| Self-Employed (Incorporated) | 66 | 2.1% |
| Self-Employed (Not Incorporated) | 301 | 9.4% |
| Not-for-profit Organizations | 230 | 7.2% |
| Local Government Employees | 174 | 5.4% |
| State Government Employees | 264 | 8.2% |
| Federal Government Employees | 366 | 11.4% |
| Unpaid Family Workers | 0 | 0.0% |
| Total | 3,213 | 100.0% |
Employment Status by Age in Page
According to the labor force statistics for Page, out of the total population over 16 years of age (5,610), 65.5% or 3,675 individuals are in the labor force, with 12.5% or 459 of them unemployed. The age group with the highest labor force participation rate is 16 to 19 years, with 93.7% or 414 individuals in the labor force. Within the labor force, the 16 to 19 years age range has the highest percentage of unemployed individuals, with 75.1% or 311 of them being unemployed.
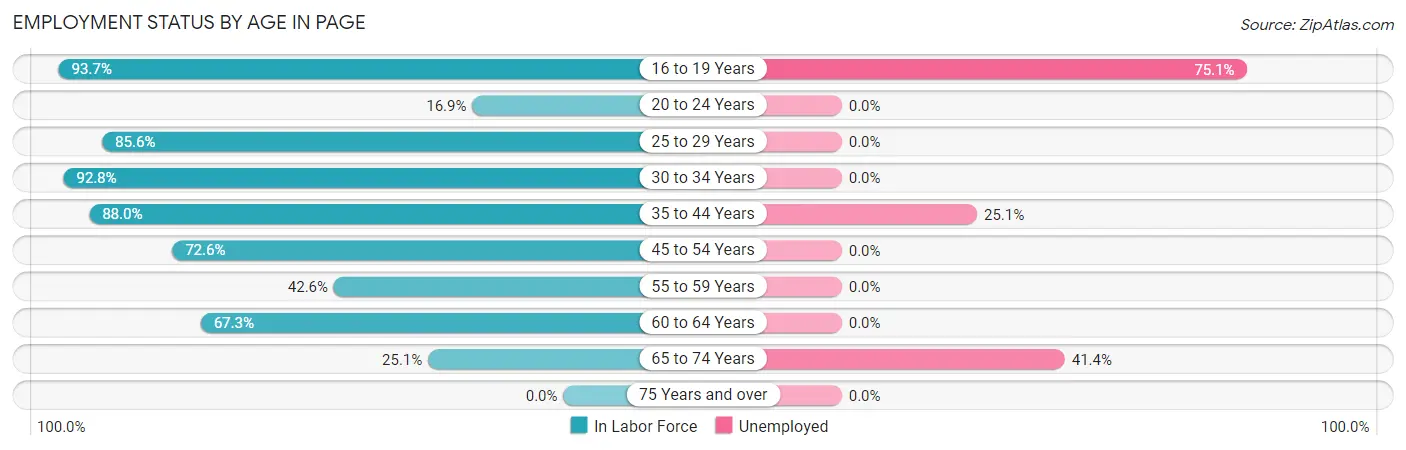
| Age Bracket | In Labor Force | Unemployed |
| 16 to 19 Years | 414 (93.7%) | 311 (75.1%) |
| 20 to 24 Years | 42 (16.9%) | 0 (0.0%) |
| 25 to 29 Years | 625 (85.6%) | 0 (0.0%) |
| 30 to 34 Years | 589 (92.8%) | 0 (0.0%) |
| 35 to 44 Years | 374 (88.0%) | 94 (25.1%) |
| 45 to 54 Years | 962 (72.6%) | 0 (0.0%) |
| 55 to 59 Years | 184 (42.6%) | 0 (0.0%) |
| 60 to 64 Years | 350 (67.3%) | 0 (0.0%) |
| 65 to 74 Years | 133 (25.1%) | 55 (41.4%) |
| 75 Years and over | 0 (0.0%) | 0 (0.0%) |
| Total | 3,675 (65.5%) | 459 (12.5%) |
Employment Status by Educational Attainment in Page
According to labor force statistics for Page, 75.8% of individuals (3,083) out of the total population between 25 and 64 years of age (4,067) are in the labor force, with 3.0% or 92 of them being unemployed. The group with the highest labor force participation rate are those with the educational attainment of bachelor's degree or higher, with 100.0% or 800 individuals in the labor force. Within the labor force, individuals with bachelor's degree or higher education have the highest percentage of unemployment, with 11.8% or 94 of them being unemployed.
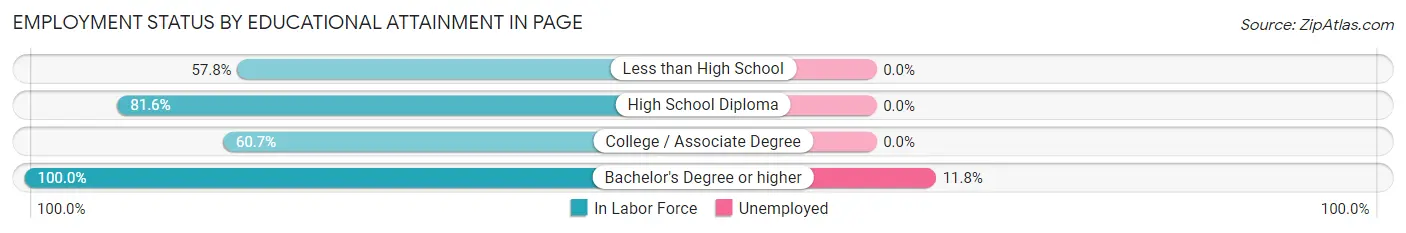
| Educational Attainment | In Labor Force | Unemployed |
| Less than High School | 74 (57.8%) | 0 (0.0%) |
| High School Diploma | 1,186 (81.6%) | 0 (0.0%) |
| College / Associate Degree | 1,023 (60.7%) | 0 (0.0%) |
| Bachelor's Degree or higher | 800 (100.0%) | 94 (11.8%) |
| Total | 3,083 (75.8%) | 122 (3.0%) |
Employment Occupations by Sex in Page
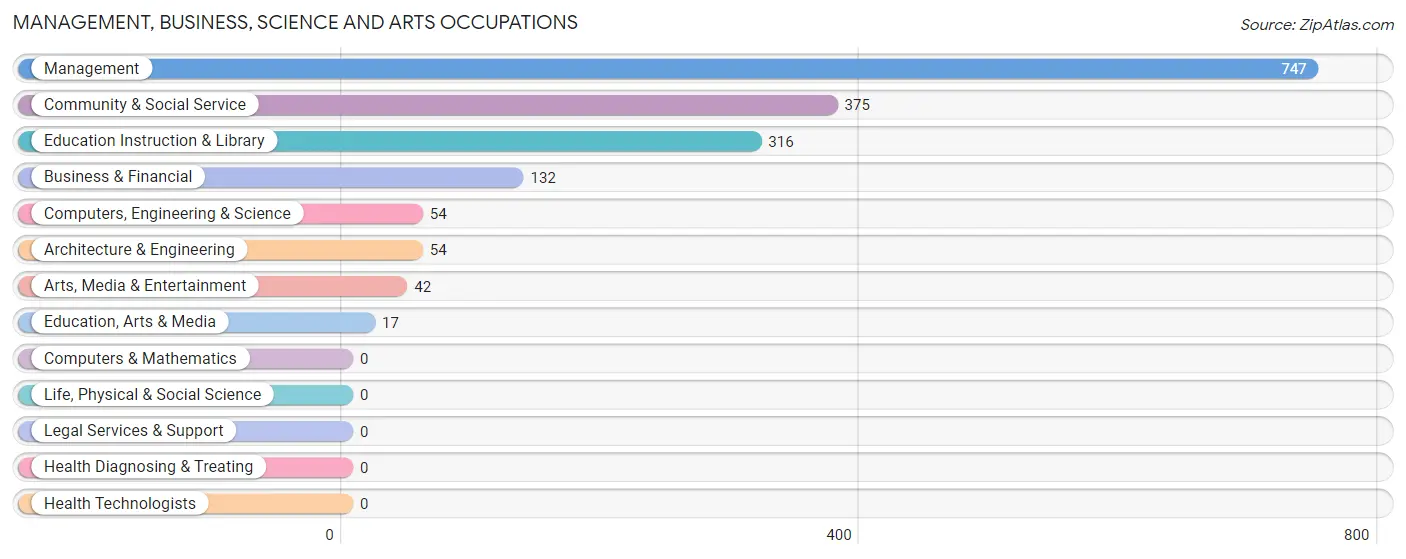
Management, Business, Science and Arts Occupations
The most common Management, Business, Science and Arts occupations in Page are Management (747 | 23.3%), Community & Social Service (375 | 11.7%), Education Instruction & Library (316 | 9.8%), Business & Financial (132 | 4.1%), and Computers, Engineering & Science (54 | 1.7%).
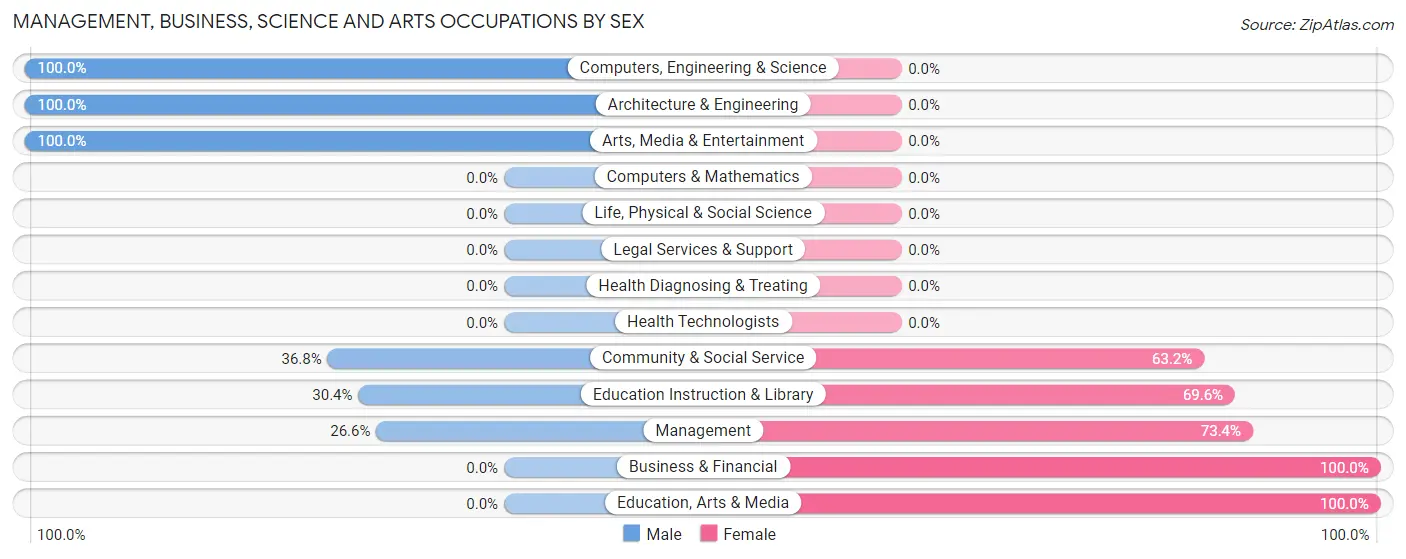
Management, Business, Science and Arts Occupations by Sex
Within the Management, Business, Science and Arts occupations in Page, the most male-oriented occupations are Computers, Engineering & Science (100.0%), Architecture & Engineering (100.0%), and Arts, Media & Entertainment (100.0%), while the most female-oriented occupations are Business & Financial (100.0%), Education, Arts & Media (100.0%), and Management (73.4%).
| Occupation | Male | Female |
| Management | 199 (26.6%) | 548 (73.4%) |
| Business & Financial | 0 (0.0%) | 132 (100.0%) |
| Computers, Engineering & Science | 54 (100.0%) | 0 (0.0%) |
| Computers & Mathematics | 0 (0.0%) | 0 (0.0%) |
| Architecture & Engineering | 54 (100.0%) | 0 (0.0%) |
| Life, Physical & Social Science | 0 (0.0%) | 0 (0.0%) |
| Community & Social Service | 138 (36.8%) | 237 (63.2%) |
| Education, Arts & Media | 0 (0.0%) | 17 (100.0%) |
| Legal Services & Support | 0 (0.0%) | 0 (0.0%) |
| Education Instruction & Library | 96 (30.4%) | 220 (69.6%) |
| Arts, Media & Entertainment | 42 (100.0%) | 0 (0.0%) |
| Health Diagnosing & Treating | 0 (0.0%) | 0 (0.0%) |
| Health Technologists | 0 (0.0%) | 0 (0.0%) |
| Total (Category) | 391 (29.9%) | 917 (70.1%) |
| Total (Overall) | 1,603 (49.9%) | 1,610 (50.1%) |
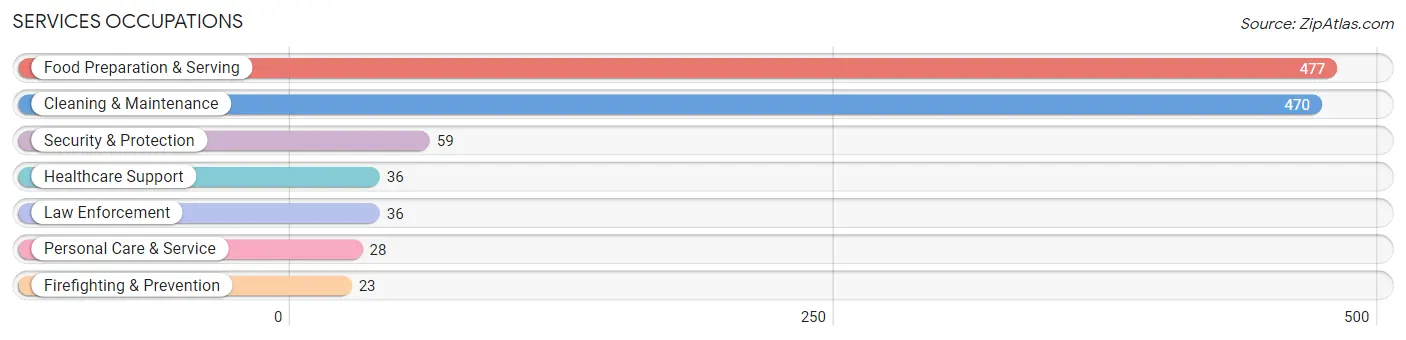
Services Occupations
The most common Services occupations in Page are Food Preparation & Serving (477 | 14.8%), Cleaning & Maintenance (470 | 14.6%), Security & Protection (59 | 1.8%), Healthcare Support (36 | 1.1%), and Law Enforcement (36 | 1.1%).
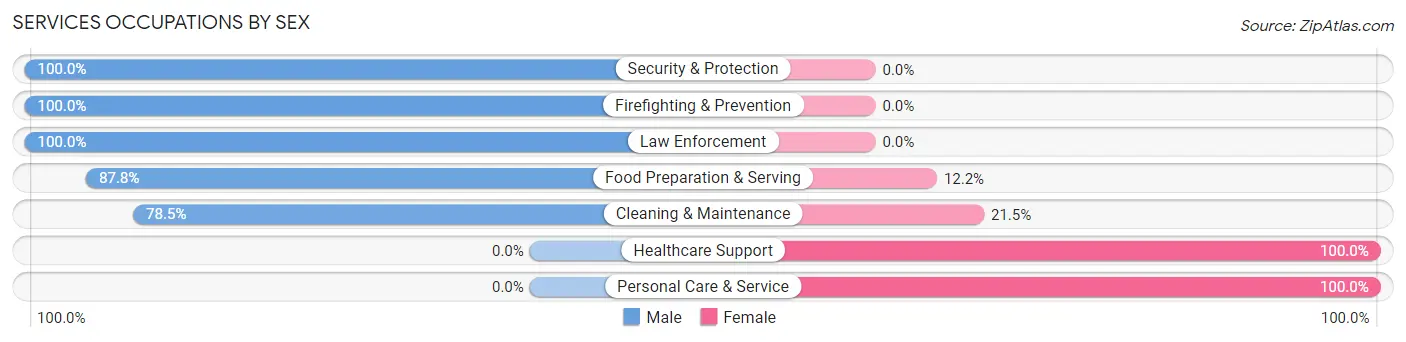
Services Occupations by Sex
Within the Services occupations in Page, the most male-oriented occupations are Security & Protection (100.0%), Firefighting & Prevention (100.0%), and Law Enforcement (100.0%), while the most female-oriented occupations are Healthcare Support (100.0%), Personal Care & Service (100.0%), and Cleaning & Maintenance (21.5%).
| Occupation | Male | Female |
| Healthcare Support | 0 (0.0%) | 36 (100.0%) |
| Security & Protection | 59 (100.0%) | 0 (0.0%) |
| Firefighting & Prevention | 23 (100.0%) | 0 (0.0%) |
| Law Enforcement | 36 (100.0%) | 0 (0.0%) |
| Food Preparation & Serving | 419 (87.8%) | 58 (12.2%) |
| Cleaning & Maintenance | 369 (78.5%) | 101 (21.5%) |
| Personal Care & Service | 0 (0.0%) | 28 (100.0%) |
| Total (Category) | 847 (79.2%) | 223 (20.8%) |
| Total (Overall) | 1,603 (49.9%) | 1,610 (50.1%) |
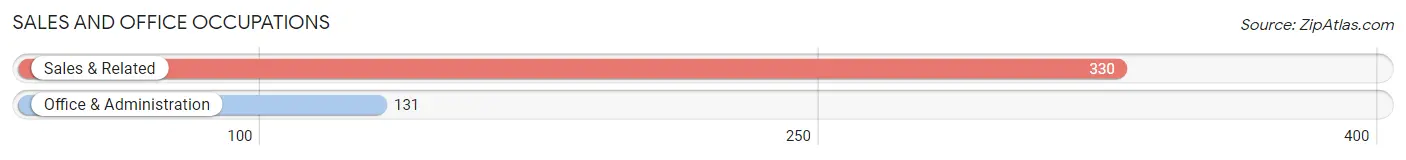
Sales and Office Occupations
The most common Sales and Office occupations in Page are Sales & Related (330 | 10.3%), and Office & Administration (131 | 4.1%).
Sales and Office Occupations by Sex
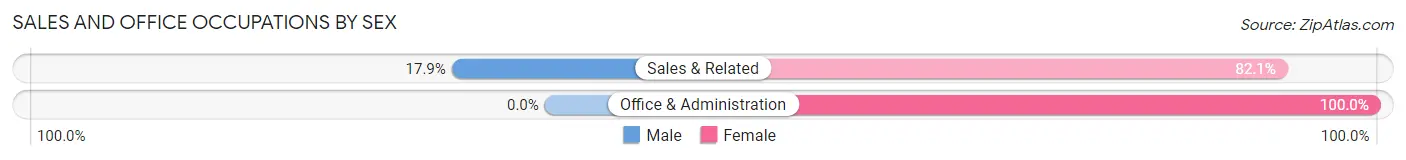
| Occupation | Male | Female |
| Sales & Related | 59 (17.9%) | 271 (82.1%) |
| Office & Administration | 0 (0.0%) | 131 (100.0%) |
| Total (Category) | 59 (12.8%) | 402 (87.2%) |
| Total (Overall) | 1,603 (49.9%) | 1,610 (50.1%) |
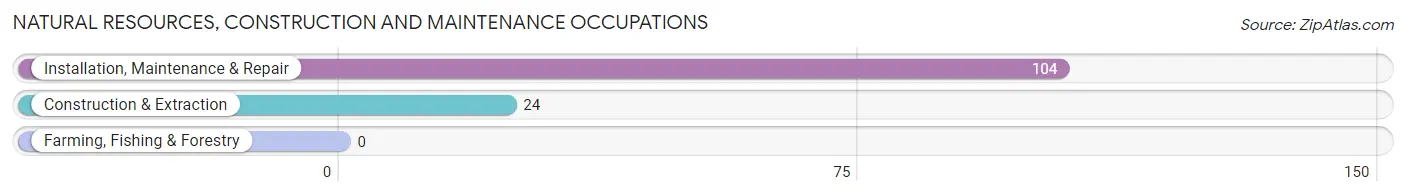
Natural Resources, Construction and Maintenance Occupations
The most common Natural Resources, Construction and Maintenance occupations in Page are Installation, Maintenance & Repair (104 | 3.2%), and Construction & Extraction (24 | 0.7%).
Natural Resources, Construction and Maintenance Occupations by Sex
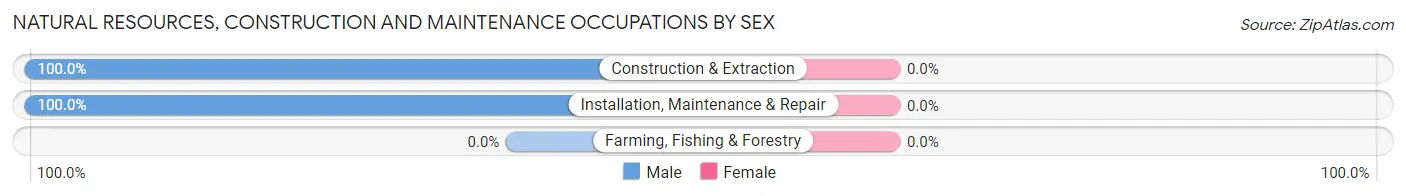
| Occupation | Male | Female |
| Farming, Fishing & Forestry | 0 (0.0%) | 0 (0.0%) |
| Construction & Extraction | 24 (100.0%) | 0 (0.0%) |
| Installation, Maintenance & Repair | 104 (100.0%) | 0 (0.0%) |
| Total (Category) | 128 (100.0%) | 0 (0.0%) |
| Total (Overall) | 1,603 (49.9%) | 1,610 (50.1%) |
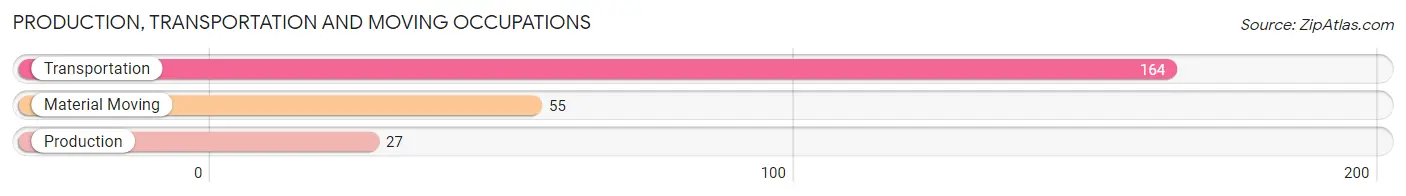
Production, Transportation and Moving Occupations
The most common Production, Transportation and Moving occupations in Page are Transportation (164 | 5.1%), Material Moving (55 | 1.7%), and Production (27 | 0.8%).
Production, Transportation and Moving Occupations by Sex
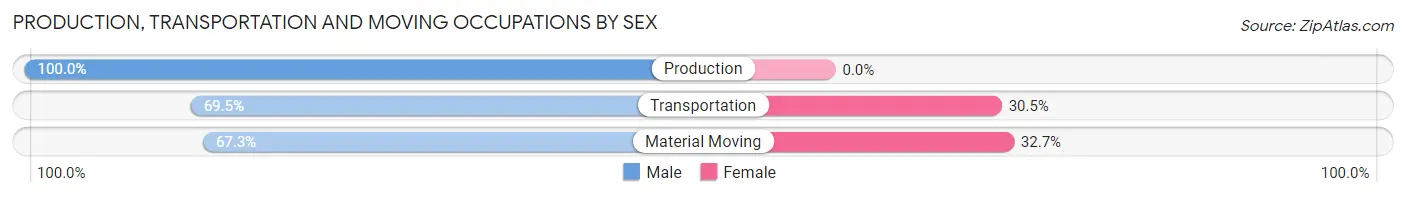
| Occupation | Male | Female |
| Production | 27 (100.0%) | 0 (0.0%) |
| Transportation | 114 (69.5%) | 50 (30.5%) |
| Material Moving | 37 (67.3%) | 18 (32.7%) |
| Total (Category) | 178 (72.4%) | 68 (27.6%) |
| Total (Overall) | 1,603 (49.9%) | 1,610 (50.1%) |
Employment Industries by Sex in Page
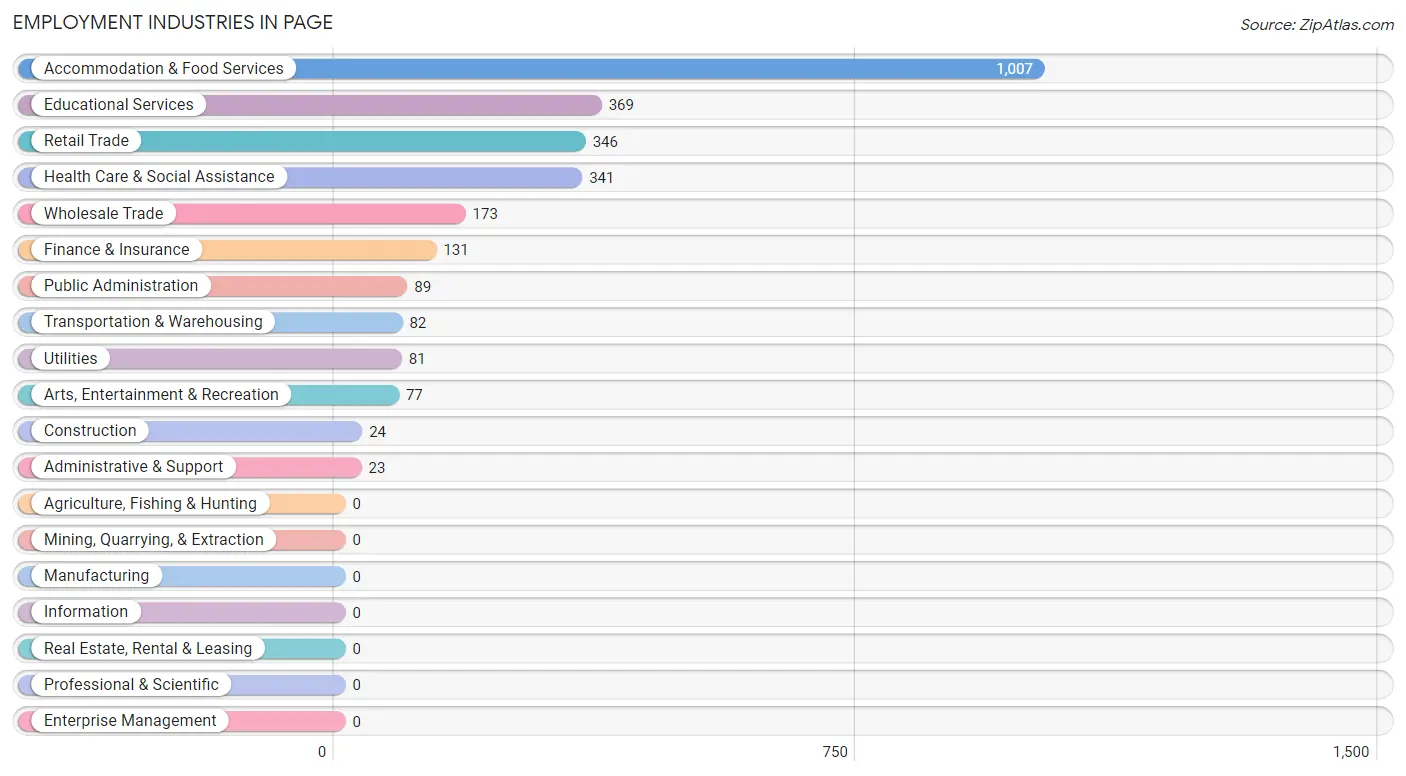
Employment Industries in Page
The major employment industries in Page include Accommodation & Food Services (1,007 | 31.3%), Educational Services (369 | 11.5%), Retail Trade (346 | 10.8%), Health Care & Social Assistance (341 | 10.6%), and Wholesale Trade (173 | 5.4%).
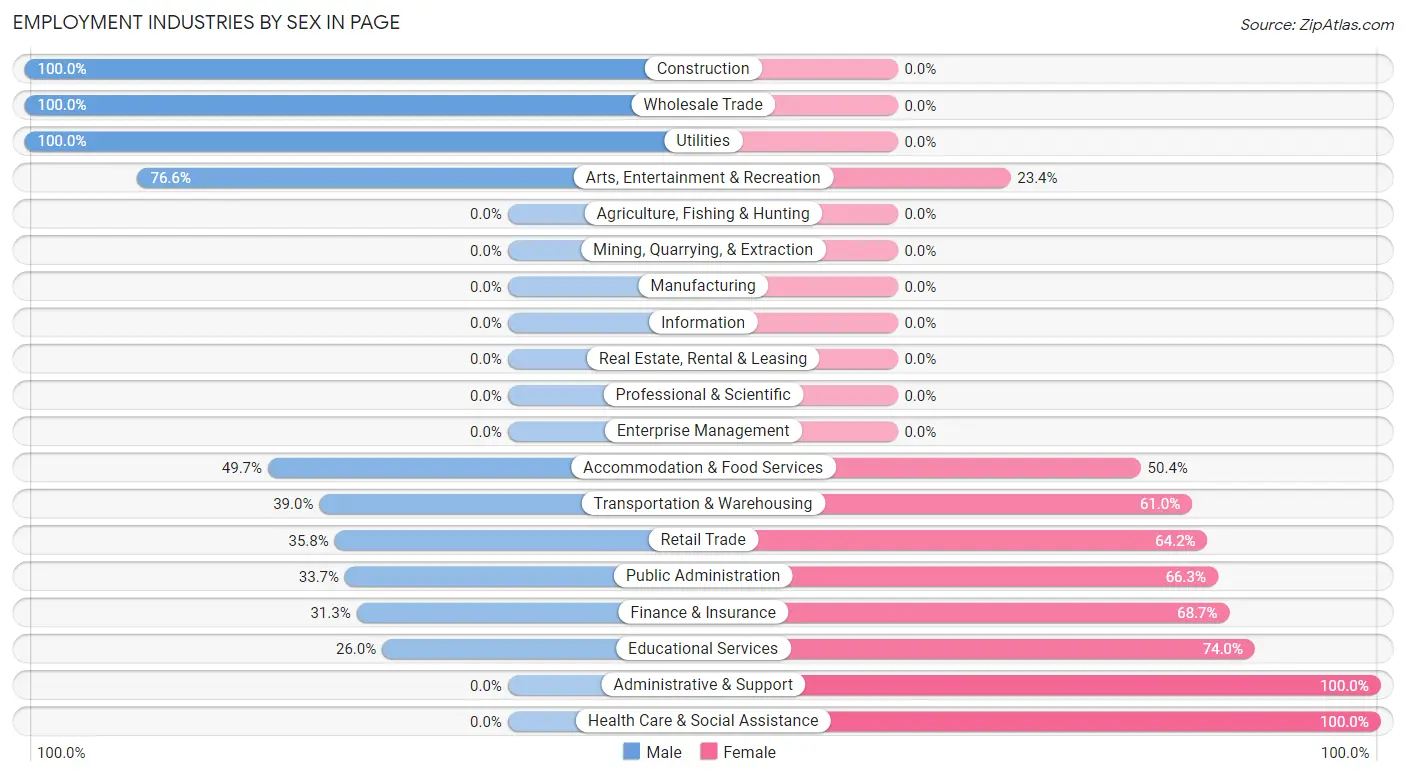
Employment Industries by Sex in Page
The Page industries that see more men than women are Construction (100.0%), Wholesale Trade (100.0%), and Utilities (100.0%), whereas the industries that tend to have a higher number of women are Administrative & Support (100.0%), Health Care & Social Assistance (100.0%), and Educational Services (74.0%).
| Industry | Male | Female |
| Agriculture, Fishing & Hunting | 0 (0.0%) | 0 (0.0%) |
| Mining, Quarrying, & Extraction | 0 (0.0%) | 0 (0.0%) |
| Construction | 24 (100.0%) | 0 (0.0%) |
| Manufacturing | 0 (0.0%) | 0 (0.0%) |
| Wholesale Trade | 173 (100.0%) | 0 (0.0%) |
| Retail Trade | 124 (35.8%) | 222 (64.2%) |
| Transportation & Warehousing | 32 (39.0%) | 50 (61.0%) |
| Utilities | 81 (100.0%) | 0 (0.0%) |
| Information | 0 (0.0%) | 0 (0.0%) |
| Finance & Insurance | 41 (31.3%) | 90 (68.7%) |
| Real Estate, Rental & Leasing | 0 (0.0%) | 0 (0.0%) |
| Professional & Scientific | 0 (0.0%) | 0 (0.0%) |
| Enterprise Management | 0 (0.0%) | 0 (0.0%) |
| Administrative & Support | 0 (0.0%) | 23 (100.0%) |
| Educational Services | 96 (26.0%) | 273 (74.0%) |
| Health Care & Social Assistance | 0 (0.0%) | 341 (100.0%) |
| Arts, Entertainment & Recreation | 59 (76.6%) | 18 (23.4%) |
| Accommodation & Food Services | 500 (49.6%) | 507 (50.3%) |
| Public Administration | 30 (33.7%) | 59 (66.3%) |
| Total | 1,603 (49.9%) | 1,610 (50.1%) |
Education in Page
School Enrollment in Page
The most common levels of schooling among the 1,883 students in Page are elementary school (773 | 41.0%), high school (445 | 23.6%), and middle school (290 | 15.4%).
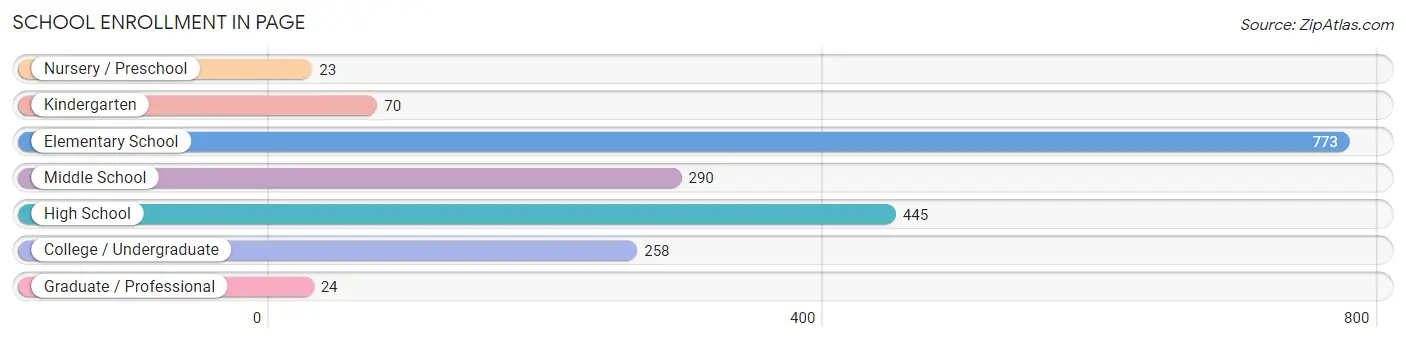
| School Level | # Students | % Students |
| Nursery / Preschool | 23 | 1.2% |
| Kindergarten | 70 | 3.7% |
| Elementary School | 773 | 41.0% |
| Middle School | 290 | 15.4% |
| High School | 445 | 23.6% |
| College / Undergraduate | 258 | 13.7% |
| Graduate / Professional | 24 | 1.3% |
| Total | 1,883 | 100.0% |
School Enrollment by Age by Funding Source in Page
Out of a total of 1,883 students who are enrolled in schools in Page, 505 (26.8%) attend a private institution, while the remaining 1,378 (73.2%) are enrolled in public schools. The age group of 35 years and over has the highest likelihood of being enrolled in private schools, with 60 (100.0% in the age bracket) enrolled. Conversely, the age group of 3 to 4 year olds has the lowest likelihood of being enrolled in a private school, with 23 (100.0% in the age bracket) attending a public institution.
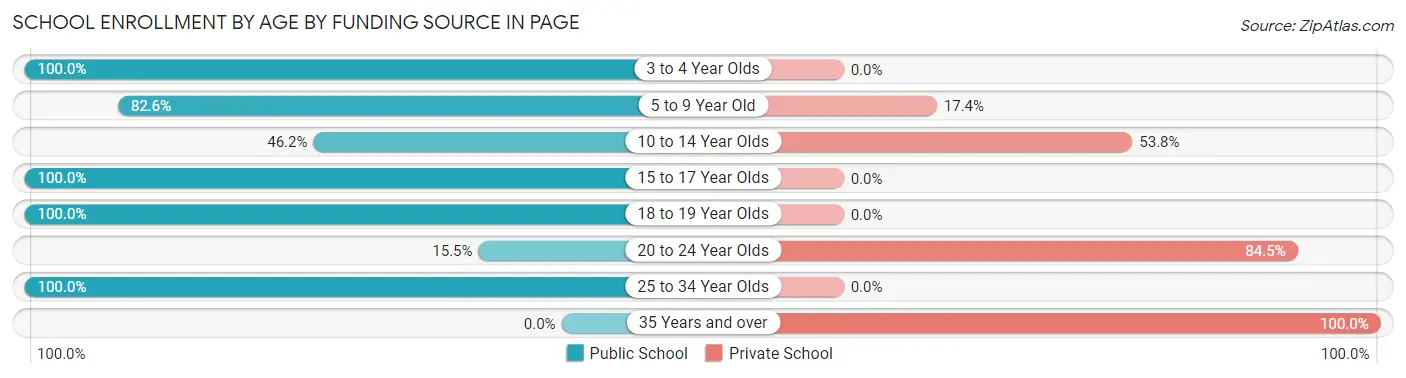
| Age Bracket | Public School | Private School |
| 3 to 4 Year Olds | 23 (100.0%) | 0 (0.0%) |
| 5 to 9 Year Old | 695 (82.6%) | 146 (17.4%) |
| 10 to 14 Year Olds | 135 (46.2%) | 157 (53.8%) |
| 15 to 17 Year Olds | 445 (100.0%) | 0 (0.0%) |
| 18 to 19 Year Olds | 30 (100.0%) | 0 (0.0%) |
| 20 to 24 Year Olds | 26 (15.5%) | 142 (84.5%) |
| 25 to 34 Year Olds | 24 (100.0%) | 0 (0.0%) |
| 35 Years and over | 0 (0.0%) | 60 (100.0%) |
| Total | 1,378 (73.2%) | 505 (26.8%) |
Educational Attainment by Field of Study in Page
Social sciences (232 | 25.4%), education (169 | 18.5%), business (121 | 13.3%), physical & health sciences (96 | 10.5%), and science & technology (94 | 10.3%) are the most common fields of study among 912 individuals in Page who have obtained a bachelor's degree or higher.
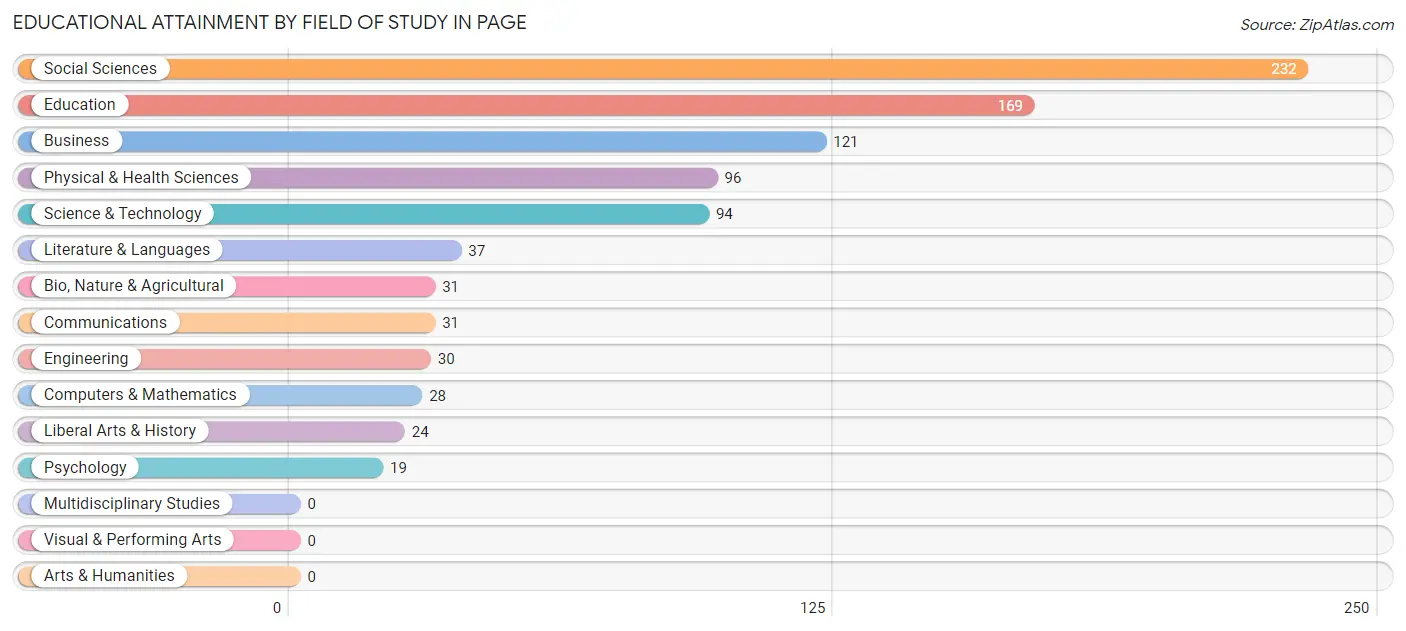
| Field of Study | # Graduates | % Graduates |
| Computers & Mathematics | 28 | 3.1% |
| Bio, Nature & Agricultural | 31 | 3.4% |
| Physical & Health Sciences | 96 | 10.5% |
| Psychology | 19 | 2.1% |
| Social Sciences | 232 | 25.4% |
| Engineering | 30 | 3.3% |
| Multidisciplinary Studies | 0 | 0.0% |
| Science & Technology | 94 | 10.3% |
| Business | 121 | 13.3% |
| Education | 169 | 18.5% |
| Literature & Languages | 37 | 4.1% |
| Liberal Arts & History | 24 | 2.6% |
| Visual & Performing Arts | 0 | 0.0% |
| Communications | 31 | 3.4% |
| Arts & Humanities | 0 | 0.0% |
| Total | 912 | 100.0% |
Transportation & Commute in Page
Vehicle Availability by Sex in Page
The most prevalent vehicle ownership categories in Page are males with 1 vehicle (846, accounting for 52.8%) and females with 1 vehicle (325, making up 52.6%).
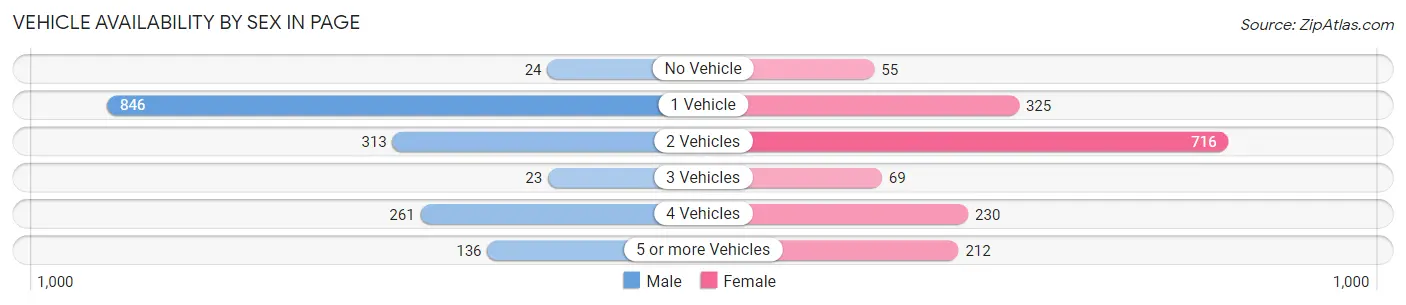
| Vehicles Available | Male | Female |
| No Vehicle | 24 (1.5%) | 55 (3.4%) |
| 1 Vehicle | 846 (52.8%) | 325 (20.2%) |
| 2 Vehicles | 313 (19.5%) | 716 (44.6%) |
| 3 Vehicles | 23 (1.4%) | 69 (4.3%) |
| 4 Vehicles | 261 (16.3%) | 230 (14.3%) |
| 5 or more Vehicles | 136 (8.5%) | 212 (13.2%) |
| Total | 1,603 (100.0%) | 1,607 (100.0%) |
Commute Time in Page
The most frequently occuring commute durations in Page are less than 5 minutes (769 commuters, 25.6%), 15 to 19 minutes (623 commuters, 20.8%), and 5 to 9 minutes (511 commuters, 17.0%).
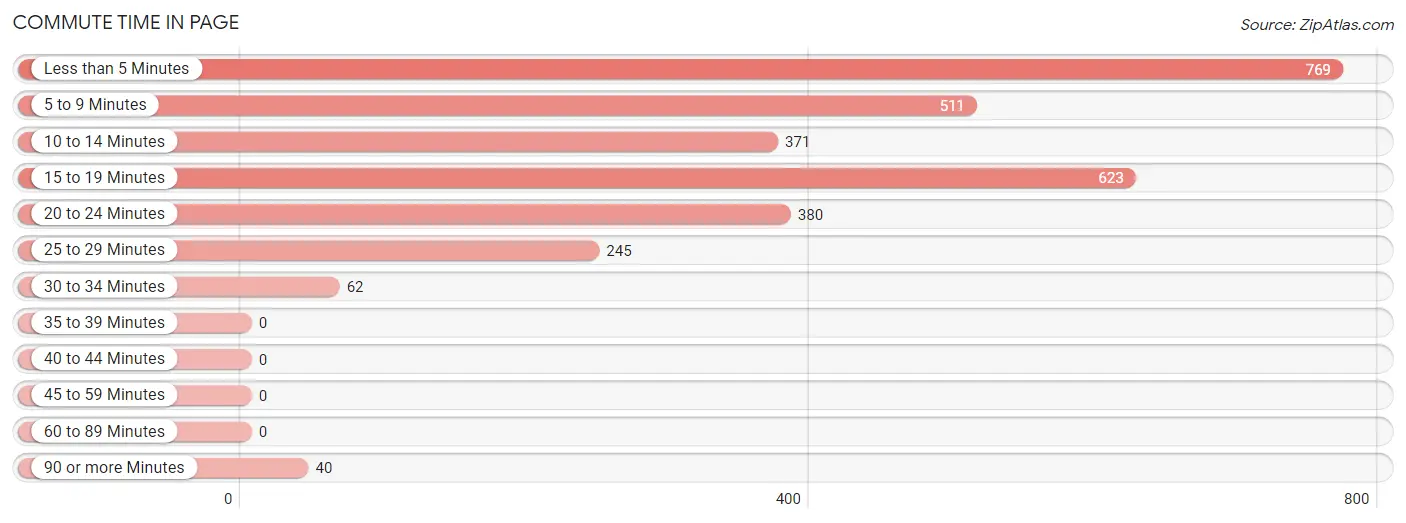
| Commute Time | # Commuters | % Commuters |
| Less than 5 Minutes | 769 | 25.6% |
| 5 to 9 Minutes | 511 | 17.0% |
| 10 to 14 Minutes | 371 | 12.4% |
| 15 to 19 Minutes | 623 | 20.8% |
| 20 to 24 Minutes | 380 | 12.7% |
| 25 to 29 Minutes | 245 | 8.2% |
| 30 to 34 Minutes | 62 | 2.1% |
| 35 to 39 Minutes | 0 | 0.0% |
| 40 to 44 Minutes | 0 | 0.0% |
| 45 to 59 Minutes | 0 | 0.0% |
| 60 to 89 Minutes | 0 | 0.0% |
| 90 or more Minutes | 40 | 1.3% |
Commute Time by Sex in Page
The most common commute times in Page are 15 to 19 minutes (394 commuters, 25.9%) for males and less than 5 minutes (446 commuters, 30.2%) for females.
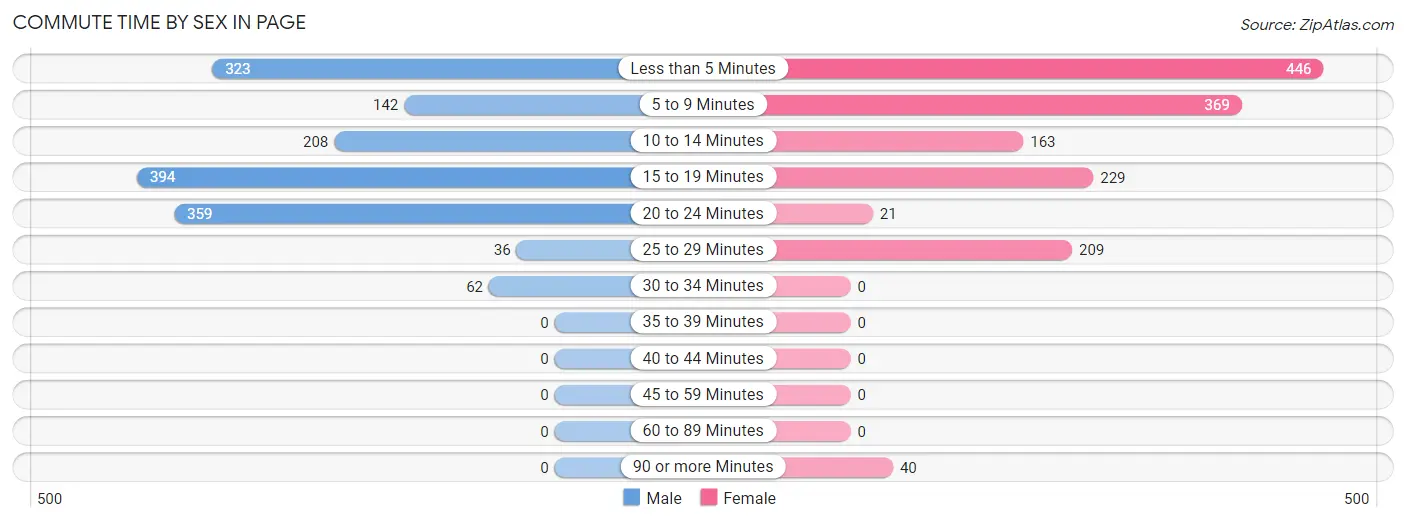
| Commute Time | Male | Female |
| Less than 5 Minutes | 323 (21.2%) | 446 (30.2%) |
| 5 to 9 Minutes | 142 (9.3%) | 369 (25.0%) |
| 10 to 14 Minutes | 208 (13.7%) | 163 (11.0%) |
| 15 to 19 Minutes | 394 (25.9%) | 229 (15.5%) |
| 20 to 24 Minutes | 359 (23.6%) | 21 (1.4%) |
| 25 to 29 Minutes | 36 (2.4%) | 209 (14.1%) |
| 30 to 34 Minutes | 62 (4.1%) | 0 (0.0%) |
| 35 to 39 Minutes | 0 (0.0%) | 0 (0.0%) |
| 40 to 44 Minutes | 0 (0.0%) | 0 (0.0%) |
| 45 to 59 Minutes | 0 (0.0%) | 0 (0.0%) |
| 60 to 89 Minutes | 0 (0.0%) | 0 (0.0%) |
| 90 or more Minutes | 0 (0.0%) | 40 (2.7%) |
Time of Departure to Work by Sex in Page
The most frequent times of departure to work in Page are 5:00 AM to 5:29 AM (520, 34.1%) for males and 7:30 AM to 7:59 AM (614, 41.6%) for females.
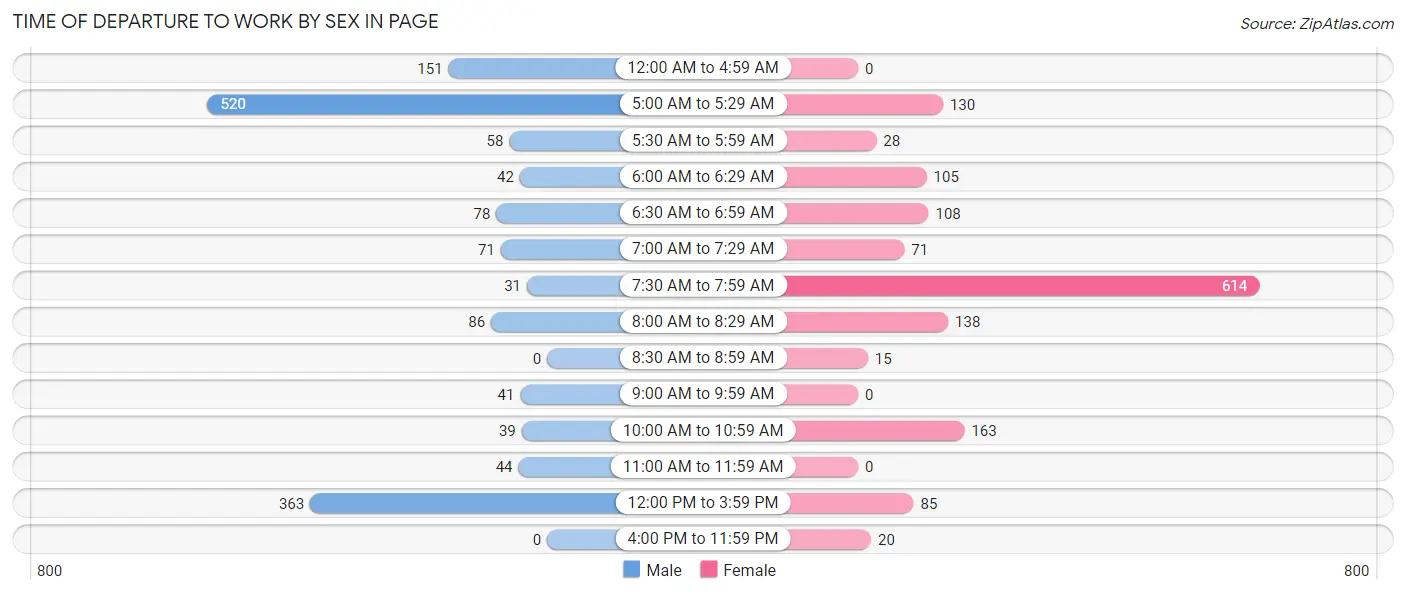
| Time of Departure | Male | Female |
| 12:00 AM to 4:59 AM | 151 (9.9%) | 0 (0.0%) |
| 5:00 AM to 5:29 AM | 520 (34.1%) | 130 (8.8%) |
| 5:30 AM to 5:59 AM | 58 (3.8%) | 28 (1.9%) |
| 6:00 AM to 6:29 AM | 42 (2.8%) | 105 (7.1%) |
| 6:30 AM to 6:59 AM | 78 (5.1%) | 108 (7.3%) |
| 7:00 AM to 7:29 AM | 71 (4.7%) | 71 (4.8%) |
| 7:30 AM to 7:59 AM | 31 (2.0%) | 614 (41.6%) |
| 8:00 AM to 8:29 AM | 86 (5.6%) | 138 (9.3%) |
| 8:30 AM to 8:59 AM | 0 (0.0%) | 15 (1.0%) |
| 9:00 AM to 9:59 AM | 41 (2.7%) | 0 (0.0%) |
| 10:00 AM to 10:59 AM | 39 (2.6%) | 163 (11.0%) |
| 11:00 AM to 11:59 AM | 44 (2.9%) | 0 (0.0%) |
| 12:00 PM to 3:59 PM | 363 (23.8%) | 85 (5.8%) |
| 4:00 PM to 11:59 PM | 0 (0.0%) | 20 (1.3%) |
| Total | 1,524 (100.0%) | 1,477 (100.0%) |
Housing Occupancy in Page
Occupancy by Ownership in Page
Of the total 2,854 dwellings in Page, owner-occupied units account for 1,696 (59.4%), while renter-occupied units make up 1,158 (40.6%).
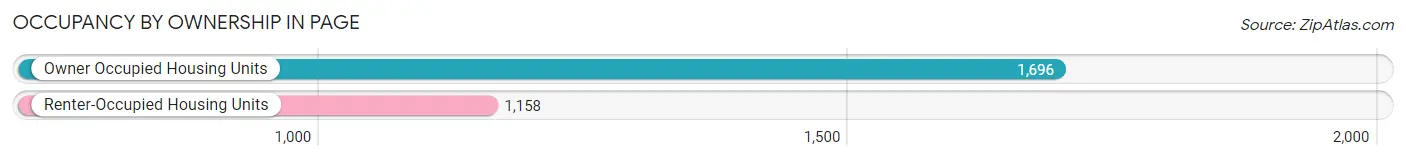
| Occupancy | # Housing Units | % Housing Units |
| Owner Occupied Housing Units | 1,696 | 59.4% |
| Renter-Occupied Housing Units | 1,158 | 40.6% |
| Total Occupied Housing Units | 2,854 | 100.0% |
Occupancy by Household Size in Page
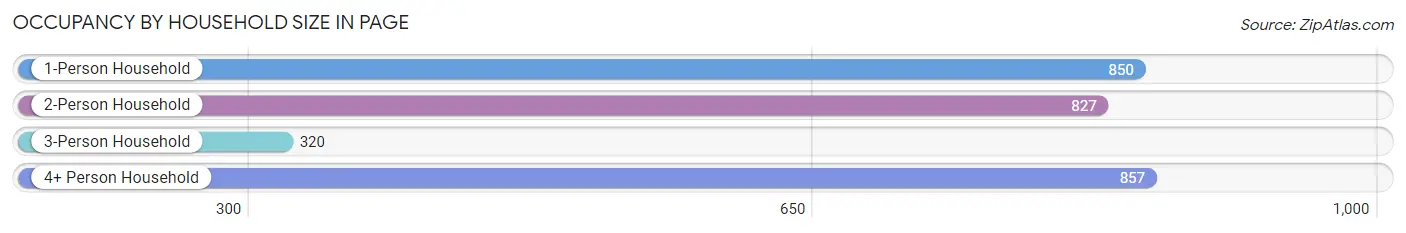
| Household Size | # Housing Units | % Housing Units |
| 1-Person Household | 850 | 29.8% |
| 2-Person Household | 827 | 29.0% |
| 3-Person Household | 320 | 11.2% |
| 4+ Person Household | 857 | 30.0% |
| Total Housing Units | 2,854 | 100.0% |
Occupancy by Ownership by Household Size in Page
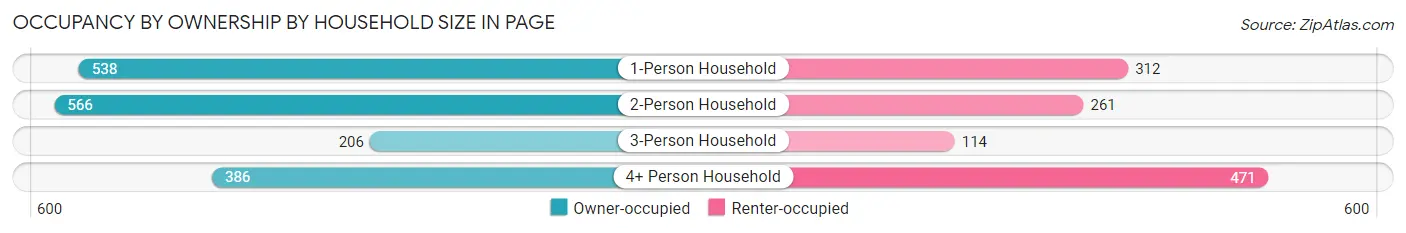
| Household Size | Owner-occupied | Renter-occupied |
| 1-Person Household | 538 (63.3%) | 312 (36.7%) |
| 2-Person Household | 566 (68.4%) | 261 (31.6%) |
| 3-Person Household | 206 (64.4%) | 114 (35.6%) |
| 4+ Person Household | 386 (45.0%) | 471 (55.0%) |
| Total Housing Units | 1,696 (59.4%) | 1,158 (40.6%) |
Occupancy by Educational Attainment in Page
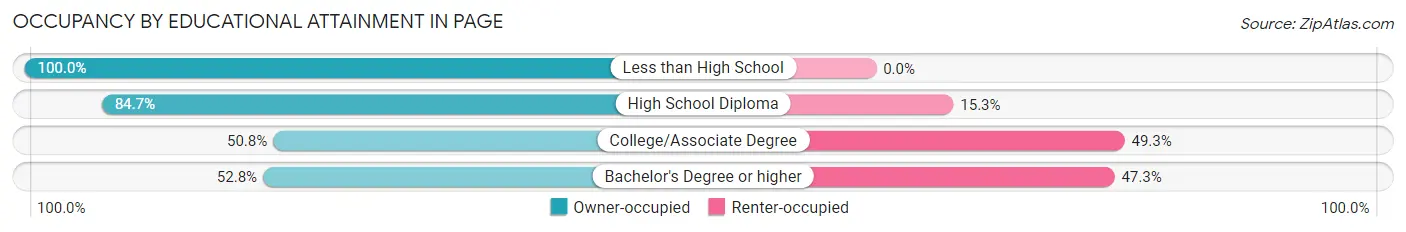
| Household Size | Owner-occupied | Renter-occupied |
| Less than High School | 157 (100.0%) | 0 (0.0%) |
| High School Diploma | 393 (84.7%) | 71 (15.3%) |
| College/Associate Degree | 810 (50.7%) | 786 (49.2%) |
| Bachelor's Degree or higher | 336 (52.7%) | 301 (47.2%) |
Occupancy by Age of Householder in Page
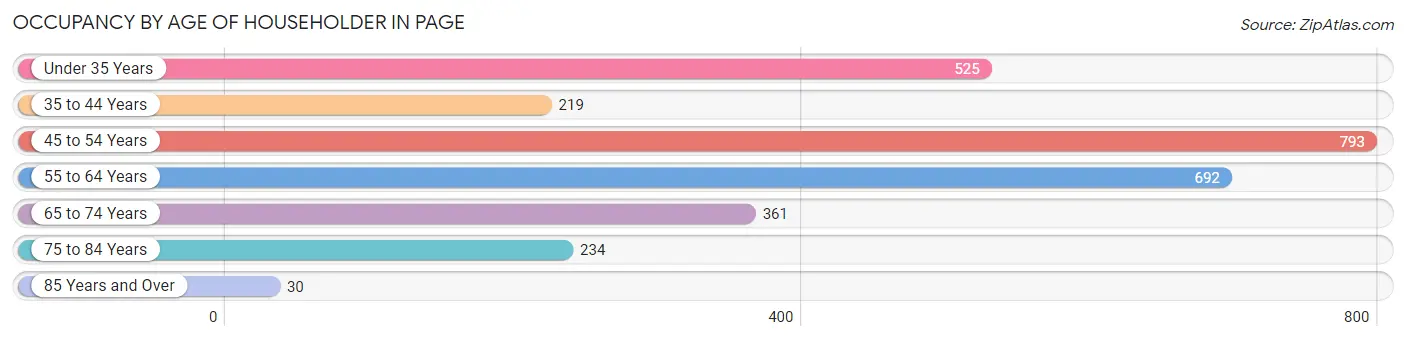
| Age Bracket | # Households | % Households |
| Under 35 Years | 525 | 18.4% |
| 35 to 44 Years | 219 | 7.7% |
| 45 to 54 Years | 793 | 27.8% |
| 55 to 64 Years | 692 | 24.2% |
| 65 to 74 Years | 361 | 12.7% |
| 75 to 84 Years | 234 | 8.2% |
| 85 Years and Over | 30 | 1.1% |
| Total | 2,854 | 100.0% |
Housing Finances in Page
Median Income by Occupancy in Page
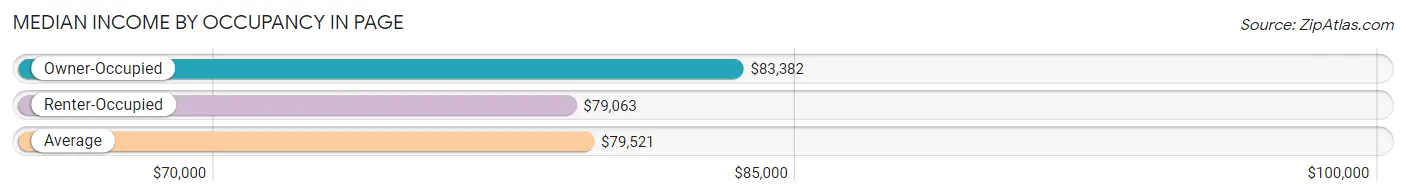
| Occupancy Type | # Households | Median Income |
| Owner-Occupied | 1,696 (59.4%) | $83,382 |
| Renter-Occupied | 1,158 (40.6%) | $79,063 |
| Average | 2,854 (100.0%) | $79,521 |
Occupancy by Householder Income Bracket in Page
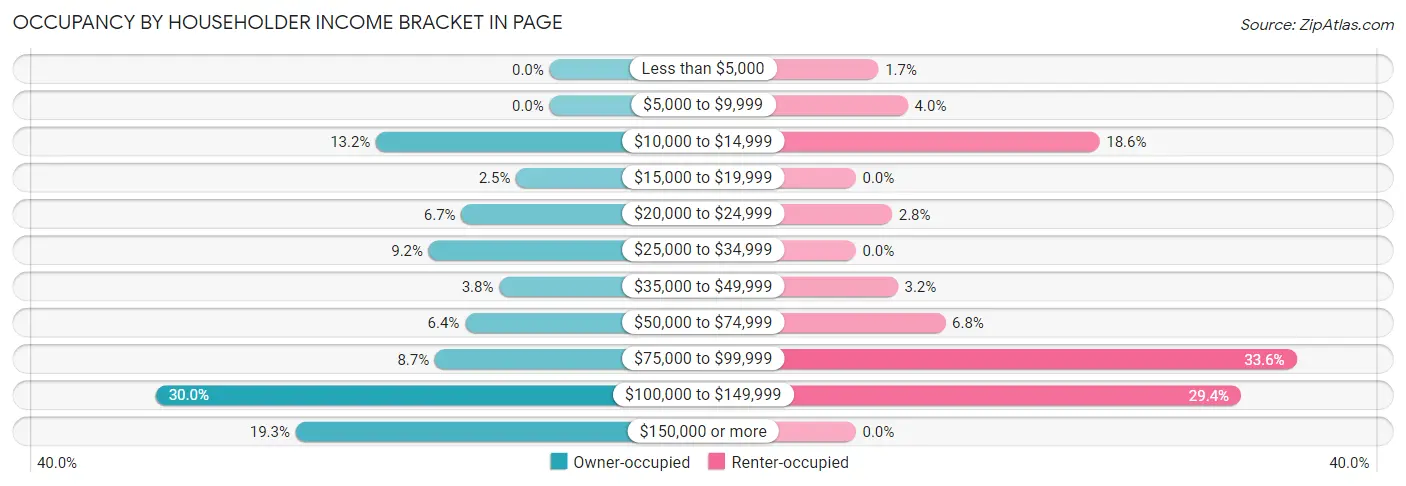
| Income Bracket | Owner-occupied | Renter-occupied |
| Less than $5,000 | 0 (0.0%) | 20 (1.7%) |
| $5,000 to $9,999 | 0 (0.0%) | 46 (4.0%) |
| $10,000 to $14,999 | 224 (13.2%) | 215 (18.6%) |
| $15,000 to $19,999 | 43 (2.5%) | 0 (0.0%) |
| $20,000 to $24,999 | 114 (6.7%) | 32 (2.8%) |
| $25,000 to $34,999 | 156 (9.2%) | 0 (0.0%) |
| $35,000 to $49,999 | 65 (3.8%) | 37 (3.2%) |
| $50,000 to $74,999 | 109 (6.4%) | 79 (6.8%) |
| $75,000 to $99,999 | 148 (8.7%) | 389 (33.6%) |
| $100,000 to $149,999 | 509 (30.0%) | 340 (29.4%) |
| $150,000 or more | 328 (19.3%) | 0 (0.0%) |
| Total | 1,696 (100.0%) | 1,158 (100.0%) |
Monthly Housing Cost Tiers in Page
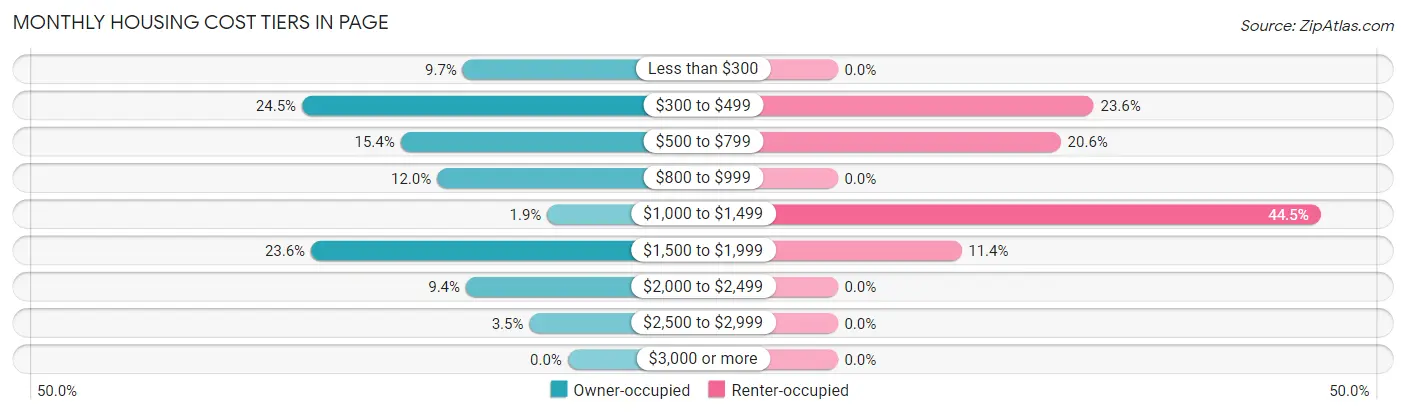
| Monthly Cost | Owner-occupied | Renter-occupied |
| Less than $300 | 164 (9.7%) | 0 (0.0%) |
| $300 to $499 | 415 (24.5%) | 273 (23.6%) |
| $500 to $799 | 261 (15.4%) | 238 (20.5%) |
| $800 to $999 | 204 (12.0%) | 0 (0.0%) |
| $1,000 to $1,499 | 32 (1.9%) | 515 (44.5%) |
| $1,500 to $1,999 | 401 (23.6%) | 132 (11.4%) |
| $2,000 to $2,499 | 159 (9.4%) | 0 (0.0%) |
| $2,500 to $2,999 | 60 (3.5%) | 0 (0.0%) |
| $3,000 or more | 0 (0.0%) | 0 (0.0%) |
| Total | 1,696 (100.0%) | 1,158 (100.0%) |
Physical Housing Characteristics in Page
Housing Structures in Page
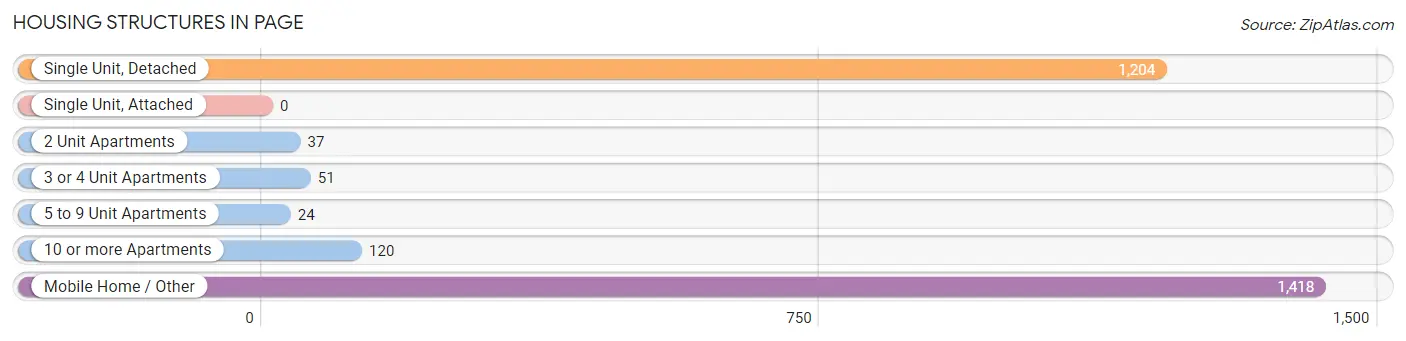
| Structure Type | # Housing Units | % Housing Units |
| Single Unit, Detached | 1,204 | 42.2% |
| Single Unit, Attached | 0 | 0.0% |
| 2 Unit Apartments | 37 | 1.3% |
| 3 or 4 Unit Apartments | 51 | 1.8% |
| 5 to 9 Unit Apartments | 24 | 0.8% |
| 10 or more Apartments | 120 | 4.2% |
| Mobile Home / Other | 1,418 | 49.7% |
| Total | 2,854 | 100.0% |
Housing Structures by Occupancy in Page
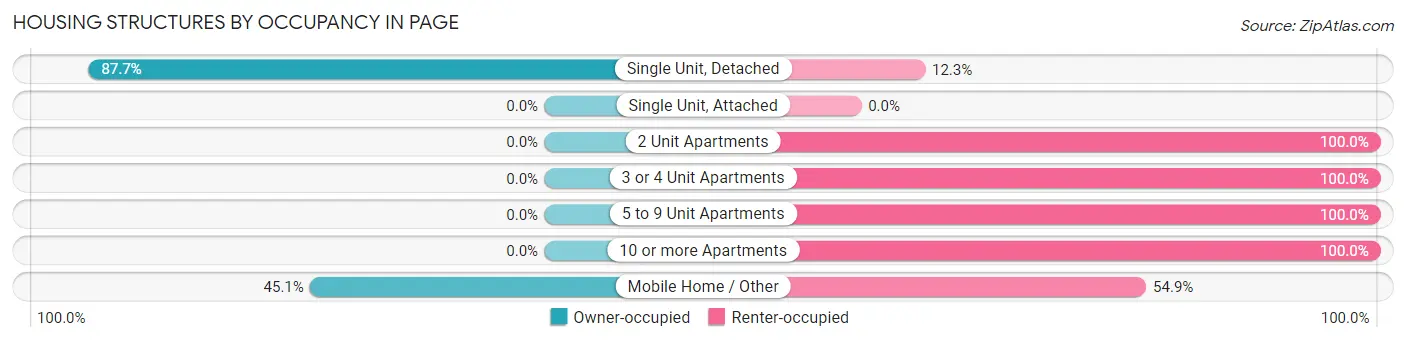
| Structure Type | Owner-occupied | Renter-occupied |
| Single Unit, Detached | 1,056 (87.7%) | 148 (12.3%) |
| Single Unit, Attached | 0 (0.0%) | 0 (0.0%) |
| 2 Unit Apartments | 0 (0.0%) | 37 (100.0%) |
| 3 or 4 Unit Apartments | 0 (0.0%) | 51 (100.0%) |
| 5 to 9 Unit Apartments | 0 (0.0%) | 24 (100.0%) |
| 10 or more Apartments | 0 (0.0%) | 120 (100.0%) |
| Mobile Home / Other | 640 (45.1%) | 778 (54.9%) |
| Total | 1,696 (59.4%) | 1,158 (40.6%) |
Housing Structures by Number of Rooms in Page
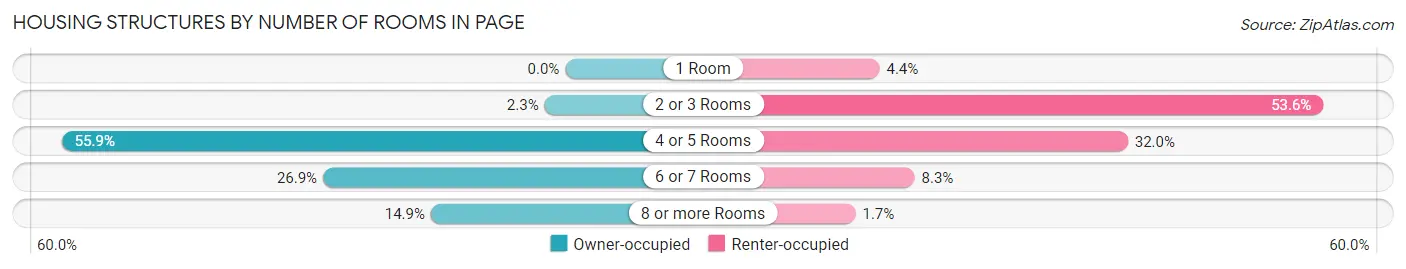
| Number of Rooms | Owner-occupied | Renter-occupied |
| 1 Room | 0 (0.0%) | 51 (4.4%) |
| 2 or 3 Rooms | 39 (2.3%) | 621 (53.6%) |
| 4 or 5 Rooms | 948 (55.9%) | 370 (32.0%) |
| 6 or 7 Rooms | 456 (26.9%) | 96 (8.3%) |
| 8 or more Rooms | 253 (14.9%) | 20 (1.7%) |
| Total | 1,696 (100.0%) | 1,158 (100.0%) |
Housing Structure by Heating Type in Page
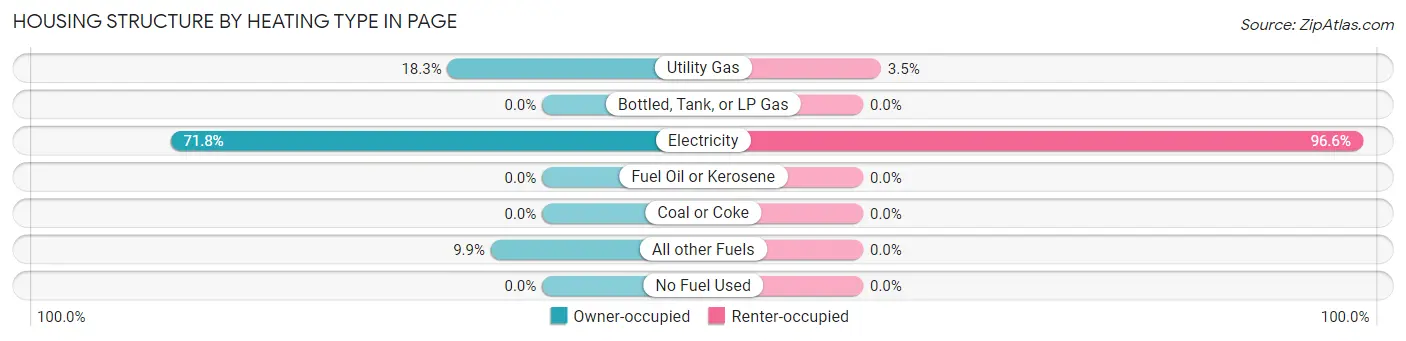
| Heating Type | Owner-occupied | Renter-occupied |
| Utility Gas | 310 (18.3%) | 40 (3.5%) |
| Bottled, Tank, or LP Gas | 0 (0.0%) | 0 (0.0%) |
| Electricity | 1,218 (71.8%) | 1,118 (96.6%) |
| Fuel Oil or Kerosene | 0 (0.0%) | 0 (0.0%) |
| Coal or Coke | 0 (0.0%) | 0 (0.0%) |
| All other Fuels | 168 (9.9%) | 0 (0.0%) |
| No Fuel Used | 0 (0.0%) | 0 (0.0%) |
| Total | 1,696 (100.0%) | 1,158 (100.0%) |
Household Vehicle Usage in Page
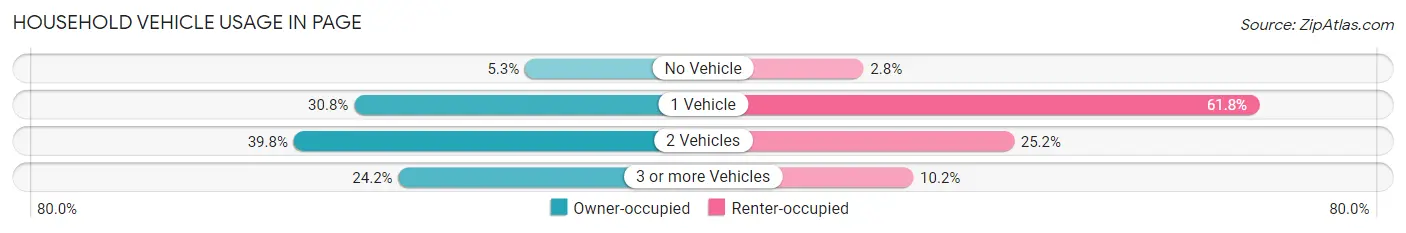
| Vehicles per Household | Owner-occupied | Renter-occupied |
| No Vehicle | 89 (5.2%) | 32 (2.8%) |
| 1 Vehicle | 522 (30.8%) | 716 (61.8%) |
| 2 Vehicles | 675 (39.8%) | 292 (25.2%) |
| 3 or more Vehicles | 410 (24.2%) | 118 (10.2%) |
| Total | 1,696 (100.0%) | 1,158 (100.0%) |
Real Estate & Mortgages in Page
Real Estate and Mortgage Overview in Page
| Characteristic | Without Mortgage | With Mortgage |
| Housing Units | 974 | 722 |
| Median Property Value | $89,600 | $287,900 |
| Median Household Income | - | - |
| Monthly Housing Costs | $388 | $0 |
| Real Estate Taxes | $516 | $23 |
Property Value by Mortgage Status in Page
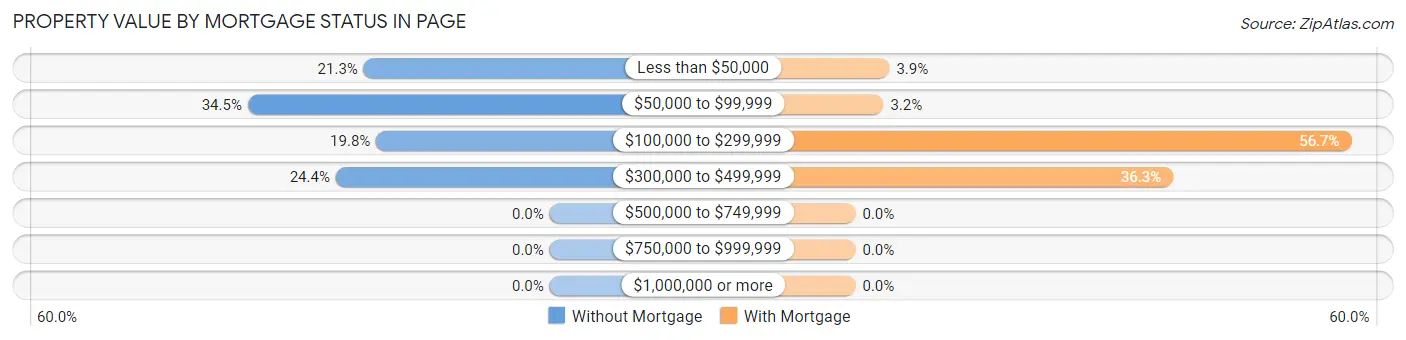
| Property Value | Without Mortgage | With Mortgage |
| Less than $50,000 | 207 (21.2%) | 28 (3.9%) |
| $50,000 to $99,999 | 336 (34.5%) | 23 (3.2%) |
| $100,000 to $299,999 | 193 (19.8%) | 409 (56.7%) |
| $300,000 to $499,999 | 238 (24.4%) | 262 (36.3%) |
| $500,000 to $749,999 | 0 (0.0%) | 0 (0.0%) |
| $750,000 to $999,999 | 0 (0.0%) | 0 (0.0%) |
| $1,000,000 or more | 0 (0.0%) | 0 (0.0%) |
| Total | 974 (100.0%) | 722 (100.0%) |
Household Income by Mortgage Status in Page
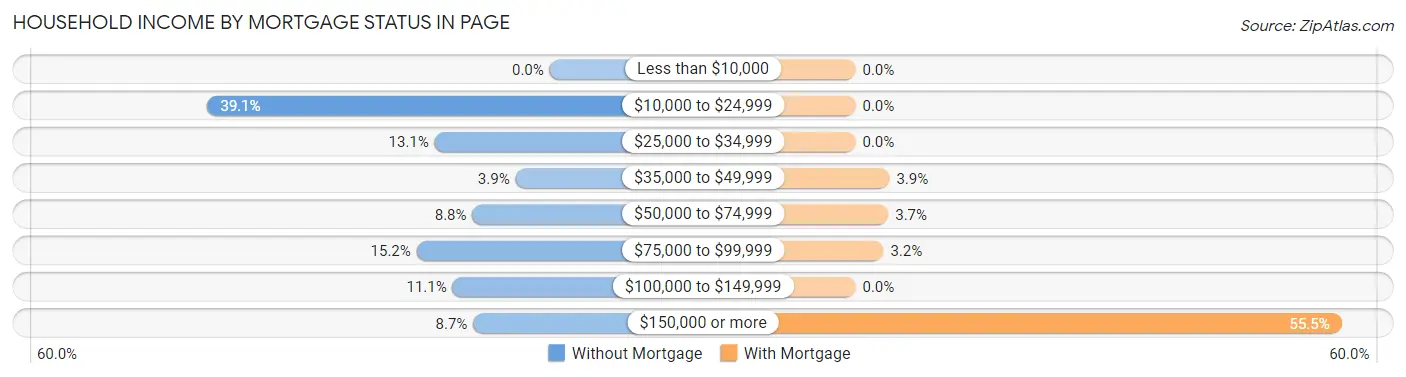
| Household Income | Without Mortgage | With Mortgage |
| Less than $10,000 | 0 (0.0%) | 0 (0.0%) |
| $10,000 to $24,999 | 381 (39.1%) | 0 (0.0%) |
| $25,000 to $34,999 | 128 (13.1%) | 0 (0.0%) |
| $35,000 to $49,999 | 38 (3.9%) | 28 (3.9%) |
| $50,000 to $74,999 | 86 (8.8%) | 27 (3.7%) |
| $75,000 to $99,999 | 148 (15.2%) | 23 (3.2%) |
| $100,000 to $149,999 | 108 (11.1%) | 0 (0.0%) |
| $150,000 or more | 85 (8.7%) | 401 (55.5%) |
| Total | 974 (100.0%) | 722 (100.0%) |
Property Value to Household Income Ratio in Page
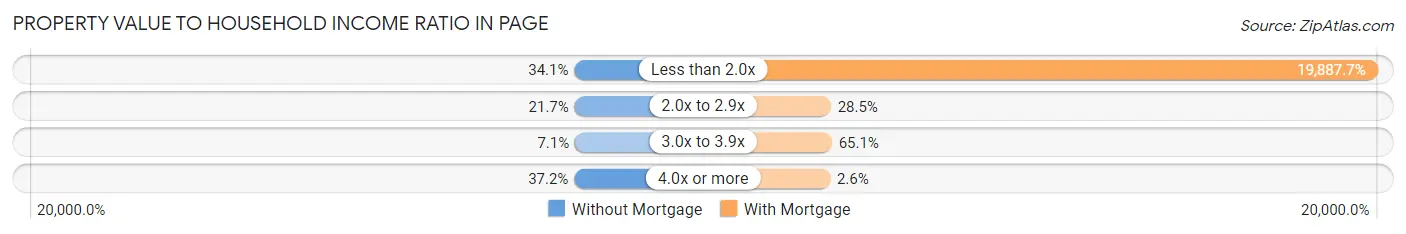
| Value-to-Income Ratio | Without Mortgage | With Mortgage |
| Less than 2.0x | 332 (34.1%) | 143,589 (19,887.7%) |
| 2.0x to 2.9x | 211 (21.7%) | 206 (28.5%) |
| 3.0x to 3.9x | 69 (7.1%) | 470 (65.1%) |
| 4.0x or more | 362 (37.2%) | 19 (2.6%) |
| Total | 974 (100.0%) | 722 (100.0%) |
Real Estate Taxes by Mortgage Status in Page
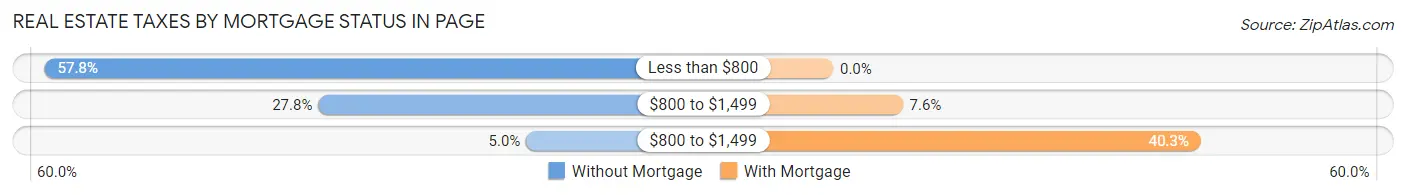
| Property Taxes | Without Mortgage | With Mortgage |
| Less than $800 | 563 (57.8%) | 0 (0.0%) |
| $800 to $1,499 | 271 (27.8%) | 55 (7.6%) |
| $800 to $1,499 | 49 (5.0%) | 291 (40.3%) |
| Total | 974 (100.0%) | 722 (100.0%) |
Health & Disability in Page
Health Insurance Coverage by Age in Page
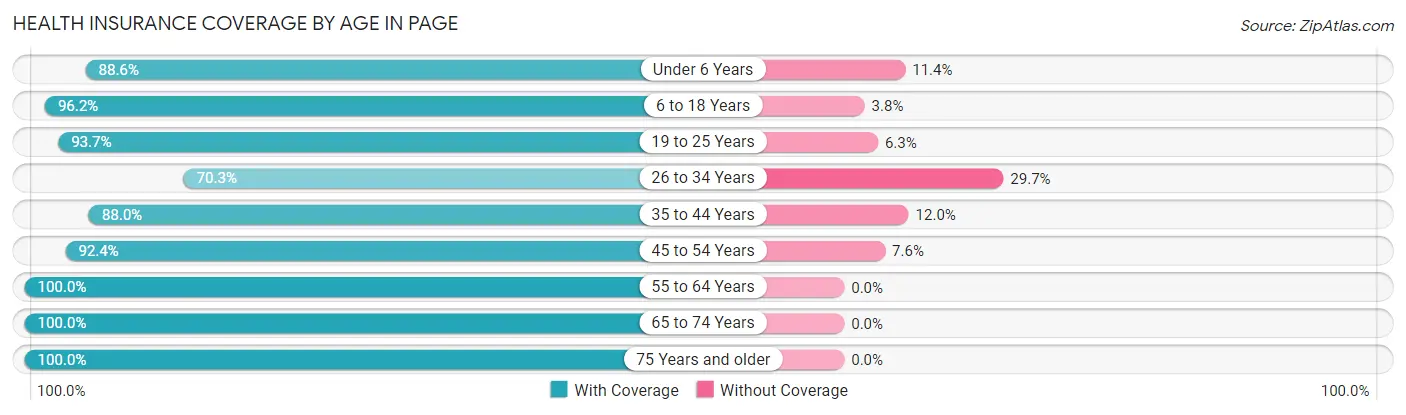
| Age Bracket | With Coverage | Without Coverage |
| Under 6 Years | 631 (88.6%) | 81 (11.4%) |
| 6 to 18 Years | 1,467 (96.2%) | 58 (3.8%) |
| 19 to 25 Years | 627 (93.7%) | 42 (6.3%) |
| 26 to 34 Years | 692 (70.3%) | 292 (29.7%) |
| 35 to 44 Years | 374 (88.0%) | 51 (12.0%) |
| 45 to 54 Years | 1,224 (92.4%) | 101 (7.6%) |
| 55 to 64 Years | 952 (100.0%) | 0 (0.0%) |
| 65 to 74 Years | 530 (100.0%) | 0 (0.0%) |
| 75 Years and older | 322 (100.0%) | 0 (0.0%) |
| Total | 6,819 (91.6%) | 625 (8.4%) |
Health Insurance Coverage by Citizenship Status in Page
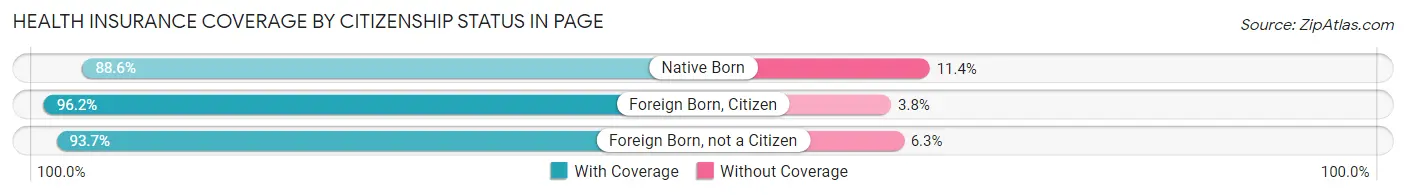
| Citizenship Status | With Coverage | Without Coverage |
| Native Born | 631 (88.6%) | 81 (11.4%) |
| Foreign Born, Citizen | 1,467 (96.2%) | 58 (3.8%) |
| Foreign Born, not a Citizen | 627 (93.7%) | 42 (6.3%) |
Health Insurance Coverage by Household Income in Page
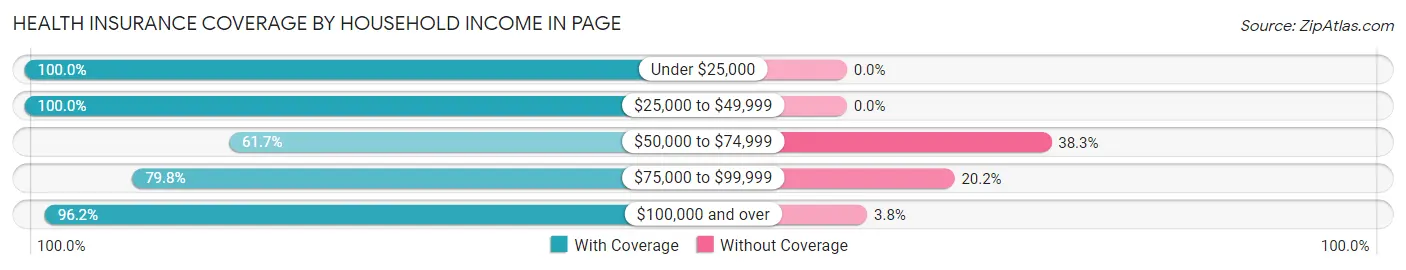
| Household Income | With Coverage | Without Coverage |
| Under $25,000 | 831 (100.0%) | 0 (0.0%) |
| $25,000 to $49,999 | 408 (100.0%) | 0 (0.0%) |
| $50,000 to $74,999 | 322 (61.7%) | 200 (38.3%) |
| $75,000 to $99,999 | 1,025 (79.8%) | 259 (20.2%) |
| $100,000 and over | 4,201 (96.2%) | 166 (3.8%) |
Public vs Private Health Insurance Coverage by Age in Page
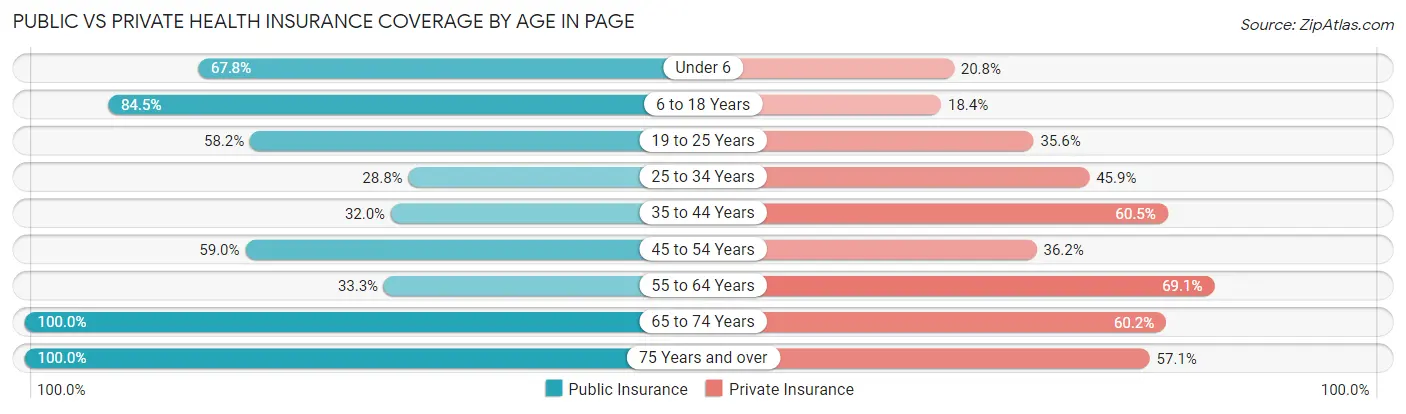
| Age Bracket | Public Insurance | Private Insurance |
| Under 6 | 483 (67.8%) | 148 (20.8%) |
| 6 to 18 Years | 1,289 (84.5%) | 281 (18.4%) |
| 19 to 25 Years | 389 (58.2%) | 238 (35.6%) |
| 25 to 34 Years | 283 (28.8%) | 452 (45.9%) |
| 35 to 44 Years | 136 (32.0%) | 257 (60.5%) |
| 45 to 54 Years | 782 (59.0%) | 479 (36.1%) |
| 55 to 64 Years | 317 (33.3%) | 658 (69.1%) |
| 65 to 74 Years | 530 (100.0%) | 319 (60.2%) |
| 75 Years and over | 322 (100.0%) | 184 (57.1%) |
| Total | 4,531 (60.9%) | 3,016 (40.5%) |
Disability Status by Sex by Age in Page
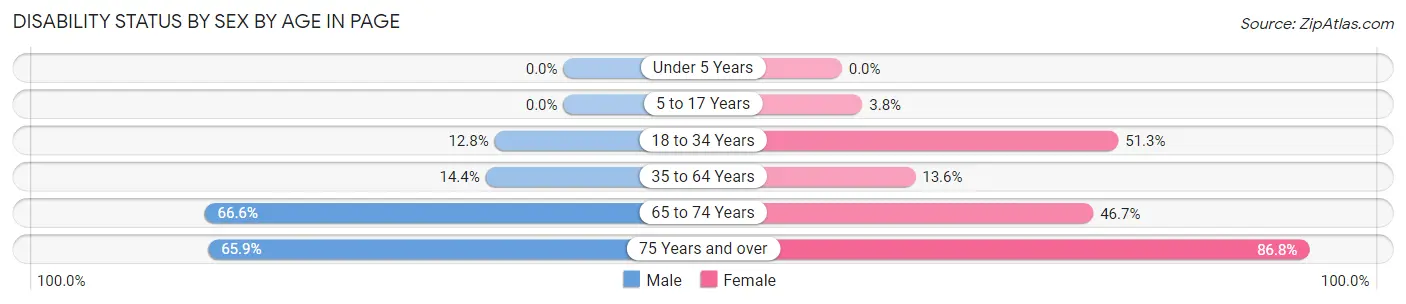
| Age Bracket | Male | Female |
| Under 5 Years | 0 (0.0%) | 0 (0.0%) |
| 5 to 17 Years | 0 (0.0%) | 33 (3.8%) |
| 18 to 34 Years | 127 (12.8%) | 347 (51.3%) |
| 35 to 64 Years | 169 (14.4%) | 209 (13.6%) |
| 65 to 74 Years | 243 (66.6%) | 77 (46.7%) |
| 75 Years and over | 58 (65.9%) | 203 (86.8%) |
Disability Class by Sex by Age in Page
Disability Class: Hearing Difficulty
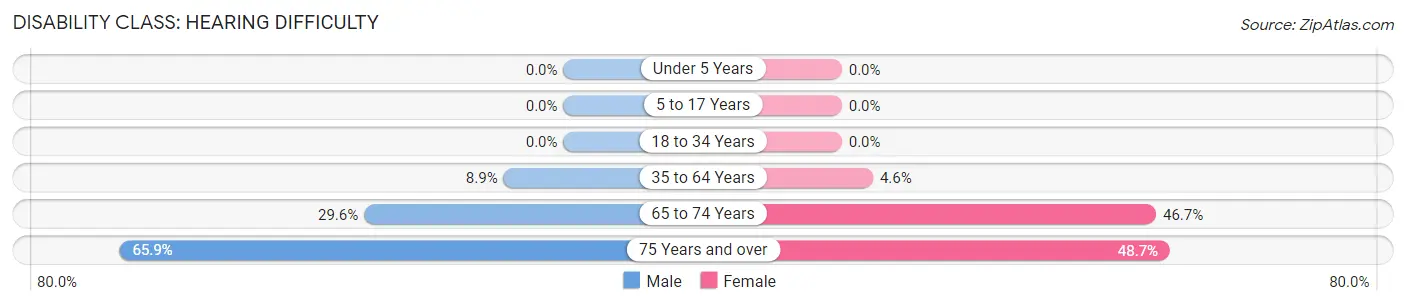
| Age Bracket | Male | Female |
| Under 5 Years | 0 (0.0%) | 0 (0.0%) |
| 5 to 17 Years | 0 (0.0%) | 0 (0.0%) |
| 18 to 34 Years | 0 (0.0%) | 0 (0.0%) |
| 35 to 64 Years | 104 (8.9%) | 71 (4.6%) |
| 65 to 74 Years | 108 (29.6%) | 77 (46.7%) |
| 75 Years and over | 58 (65.9%) | 114 (48.7%) |
Disability Class: Vision Difficulty
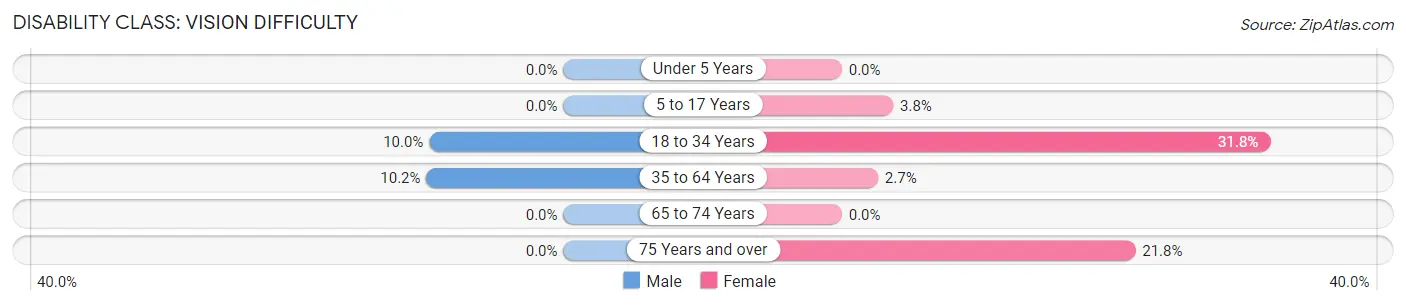
| Age Bracket | Male | Female |
| Under 5 Years | 0 (0.0%) | 0 (0.0%) |
| 5 to 17 Years | 0 (0.0%) | 33 (3.8%) |
| 18 to 34 Years | 99 (10.0%) | 215 (31.8%) |
| 35 to 64 Years | 119 (10.2%) | 41 (2.7%) |
| 65 to 74 Years | 0 (0.0%) | 0 (0.0%) |
| 75 Years and over | 0 (0.0%) | 51 (21.8%) |
Disability Class: Cognitive Difficulty
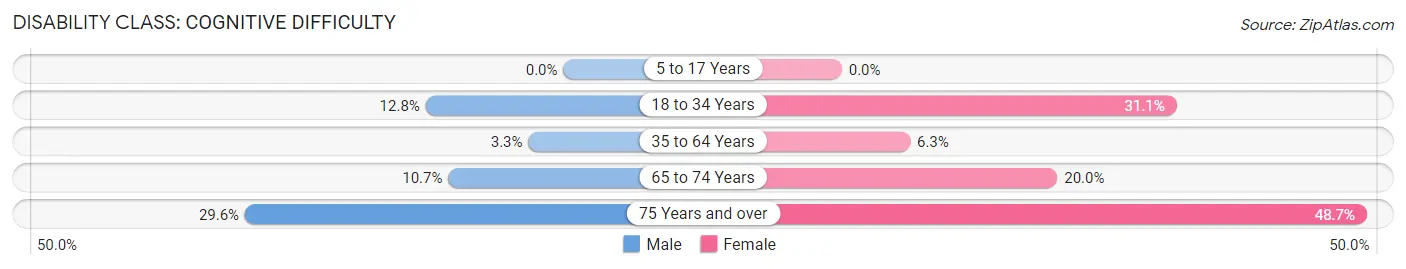
| Age Bracket | Male | Female |
| 5 to 17 Years | 0 (0.0%) | 0 (0.0%) |
| 18 to 34 Years | 127 (12.8%) | 210 (31.1%) |
| 35 to 64 Years | 38 (3.3%) | 97 (6.3%) |
| 65 to 74 Years | 39 (10.7%) | 33 (20.0%) |
| 75 Years and over | 26 (29.5%) | 114 (48.7%) |
Disability Class: Ambulatory Difficulty
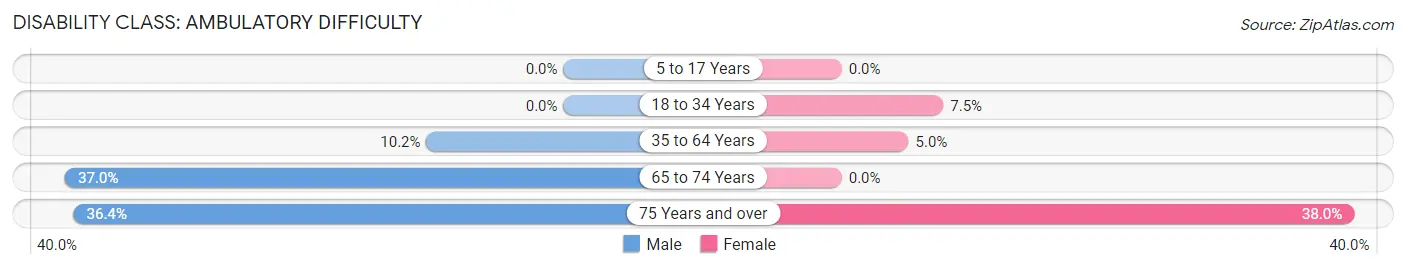
| Age Bracket | Male | Female |
| 5 to 17 Years | 0 (0.0%) | 0 (0.0%) |
| 18 to 34 Years | 0 (0.0%) | 51 (7.5%) |
| 35 to 64 Years | 119 (10.2%) | 76 (5.0%) |
| 65 to 74 Years | 135 (37.0%) | 0 (0.0%) |
| 75 Years and over | 32 (36.4%) | 89 (38.0%) |
Disability Class: Self-Care Difficulty
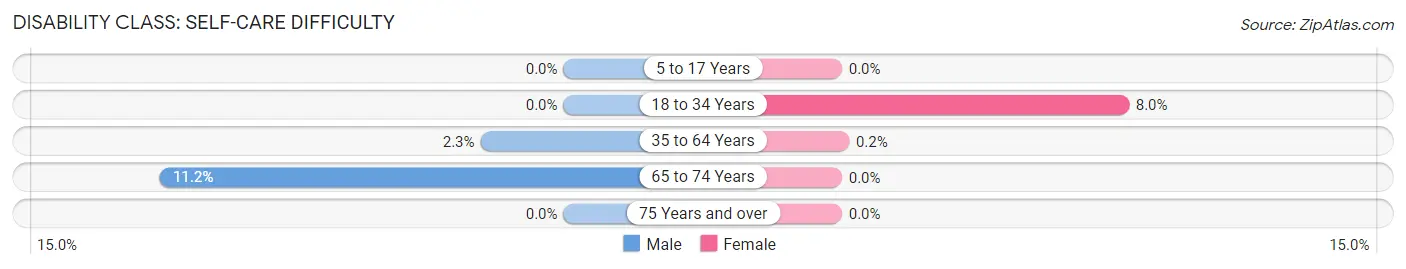
| Age Bracket | Male | Female |
| 5 to 17 Years | 0 (0.0%) | 0 (0.0%) |
| 18 to 34 Years | 0 (0.0%) | 54 (8.0%) |
| 35 to 64 Years | 27 (2.3%) | 3 (0.2%) |
| 65 to 74 Years | 41 (11.2%) | 0 (0.0%) |
| 75 Years and over | 0 (0.0%) | 0 (0.0%) |
Technology Access in Page
Computing Device Access in Page
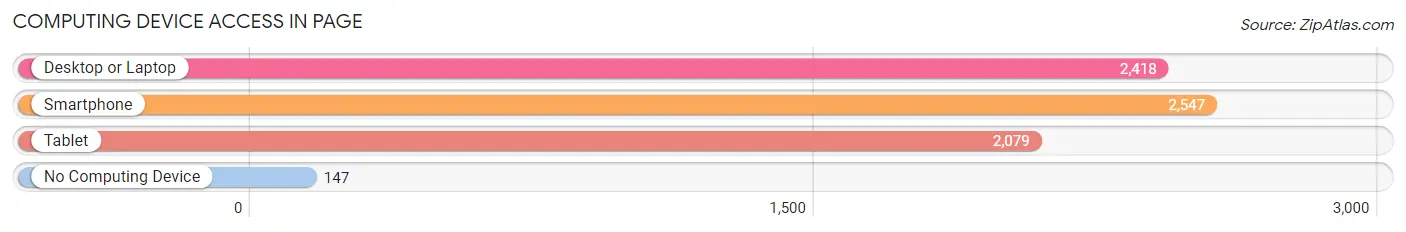
| Device Type | # Households | % Households |
| Desktop or Laptop | 2,418 | 84.7% |
| Smartphone | 2,547 | 89.2% |
| Tablet | 2,079 | 72.9% |
| No Computing Device | 147 | 5.1% |
| Total | 2,854 | 100.0% |
Internet Access in Page
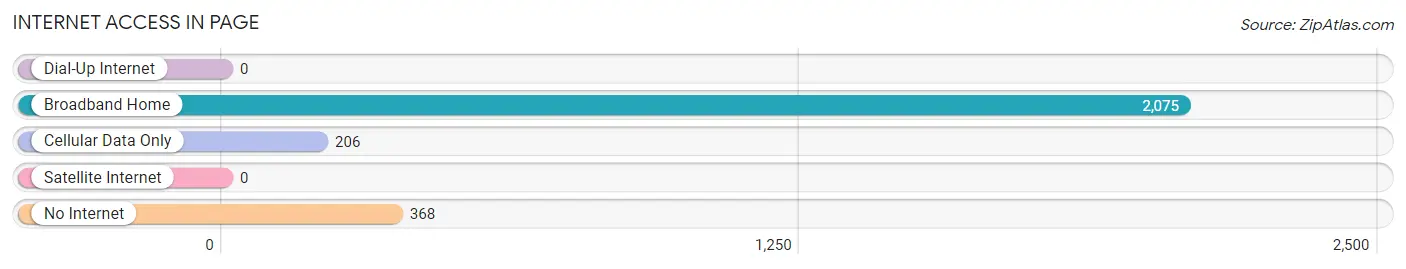
| Internet Type | # Households | % Households |
| Dial-Up Internet | 0 | 0.0% |
| Broadband Home | 2,075 | 72.7% |
| Cellular Data Only | 206 | 7.2% |
| Satellite Internet | 0 | 0.0% |
| No Internet | 368 | 12.9% |
| Total | 2,854 | 100.0% |
Page Summary
Arizona is a state located in the southwestern region of the United States. It is bordered by California, Nevada, Utah, New Mexico, and Mexico. Arizona is the sixth largest state in the United States, with an area of 113,990 square miles. It is the 14th most populous state, with a population of 7,278,717 as of 2020.
History
Arizona has a long and varied history. The area was first inhabited by Native American tribes, including the Hohokam, the Pima, the Tohono O'odham, the Apache, and the Navajo. The first Europeans to explore the area were Spanish explorers in the 16th century. In 1853, the United States acquired the area as part of the Gadsden Purchase. Arizona became a U.S. territory in 1863 and was admitted to the Union as the 48th state in 1912.
Geography
Arizona is located in the southwestern region of the United States. It is bordered by California, Nevada, Utah, New Mexico, and Mexico. Arizona is the sixth largest state in the United States, with an area of 113,990 square miles. It is the 14th most populous state, with a population of 7,278,717 as of 2020.
Arizona is divided into two distinct regions: the Colorado Plateau and the Basin and Range Province. The Colorado Plateau is a high-altitude desert region that covers the northern part of the state. It is characterized by its high elevation, deep canyons, and mesas. The Basin and Range Province is a region of low-lying mountains and valleys that covers the southern part of the state.
Economy
Arizona’s economy is largely driven by its tourism industry. The state is home to numerous national parks, monuments, and other attractions, such as the Grand Canyon, Monument Valley, and Saguaro National Park. Tourism is the state’s largest industry, accounting for more than $20 billion in economic activity in 2019.
In addition to tourism, Arizona’s economy is also driven by its manufacturing, technology, and agriculture industries. The state is home to numerous manufacturing companies, such as Intel, Boeing, and Honeywell. Arizona is also a leader in the technology industry, with companies such as GoDaddy, Infusionsoft, and WebPT based in the state. The state’s agricultural industry is also a major contributor to the economy, with crops such as cotton, lettuce, and hay being grown in the state.
Demographics
As of 2020, Arizona has a population of 7,278,717. The state is home to a diverse population, with the largest ethnic groups being White (60.2%), Hispanic or Latino (30.2%), and Native American (5.3%). The state’s largest cities are Phoenix (1,680,992), Tucson (1,025,000), Mesa (541,000), and Glendale (250,000).
Arizona is also home to a large number of immigrants. As of 2018, the state had an estimated 1.2 million immigrants, making up 16.3% of the state’s population. The largest immigrant groups in the state are from Mexico (47.2%), India (7.2%), and China (4.7%).
Conclusion
Arizona is a state located in the southwestern region of the United States. It is bordered by California, Nevada, Utah, New Mexico, and Mexico. Arizona is the sixth largest state in the United States, with an area of 113,990 square miles. It is the 14th most populous state, with a population of 7,278,717 as of 2020. Arizona has a long and varied history, and its economy is largely driven by its tourism industry. The state is home to a diverse population, with the largest ethnic groups being White (60.2%), Hispanic or Latino (30.2%), and Native American (5.3%). Arizona is also home to a large number of immigrants, with the largest immigrant groups being from Mexico (47.2%), India (7.2%), and China (4.7%).
Common Questions
What is Per Capita Income in Page?
Per Capita income in Page is $31,581.
What is the Median Family Income in Page?
Median Family Income in Page is $122,789.
What is the Median Household income in Page?
Median Household Income in Page is $79,521.
What is Income or Wage Gap in Page?
Income or Wage Gap in Page is 38.7%.
Women in Page earn 61.3 cents for every dollar earned by a man.
What is Inequality or Gini Index in Page?
Inequality or Gini Index in Page is 0.42.
What is the Total Population of Page?
Total Population of Page is 7,444.
What is the Total Male Population of Page?
Total Male Population of Page is 3,922.
What is the Total Female Population of Page?
Total Female Population of Page is 3,522.
What is the Ratio of Males per 100 Females in Page?
There are 111.36 Males per 100 Females in Page.
What is the Ratio of Females per 100 Males in Page?
There are 89.80 Females per 100 Males in Page.
What is the Median Population Age in Page?
Median Population Age in Page is 32.1 Years.
What is the Average Family Size in Page
Average Family Size in Page is 3.4 People.
What is the Average Household Size in Page
Average Household Size in Page is 2.6 People.
How Large is the Labor Force in Page?
There are 3,675 People in the Labor Forcein in Page.
What is the Percentage of People in the Labor Force in Page?
65.5% of People are in the Labor Force in Page.
What is the Unemployment Rate in Page?
Unemployment Rate in Page is 12.5%.