Nazlini, AZ Map & Demographics
Nazlini Map
Nazlini Overview
$11,198
PER CAPITA INCOME
$29,896
AVG FAMILY INCOME
$30,357
AVG HOUSEHOLD INCOME
41.0%
WAGE / INCOME GAP [ % ]
59.0¢/ $1
WAGE / INCOME GAP [ $ ]
0.51
INEQUALITY / GINI INDEX
468
TOTAL POPULATION
207
MALE POPULATION
261
FEMALE POPULATION
79.31
MALES / 100 FEMALES
126.09
FEMALES / 100 MALES
18.3
MEDIAN AGE
5.6
AVG FAMILY SIZE
4.5
AVG HOUSEHOLD SIZE
103
LABOR FORCE [ PEOPLE ]
39.6%
PERCENT IN LABOR FORCE
9.7%
UNEMPLOYMENT RATE
Nazlini Zip Codes
Nazlini Area Codes
Income in Nazlini
Income Overview in Nazlini
Per Capita Income in Nazlini is $11,198, while median incomes of families and households are $29,896 and $30,357 respectively.
| Characteristic | Number | Measure |
| Per Capita Income | 468 | $11,198 |
| Median Family Income | 73 | $29,896 |
| Mean Family Income | 73 | $38,740 |
| Median Household Income | 104 | $30,357 |
| Mean Household Income | 104 | $44,393 |
| Income Deficit | 73 | $0 |
| Wage / Income Gap (%) | 468 | 40.95% |
| Wage / Income Gap ($) | 468 | 59.05¢ per $1 |
| Gini / Inequality Index | 468 | 0.51 |
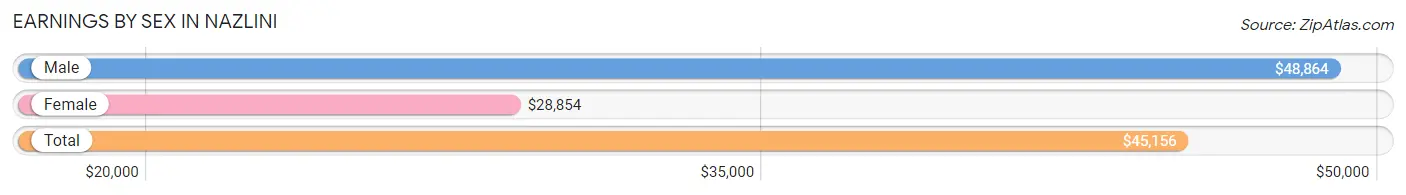
Earnings by Sex in Nazlini
Average Earnings in Nazlini are $45,156, $48,864 for men and $28,854 for women, a difference of 40.9%.
| Sex | Number | Average Earnings |
| Male | 42 (43.3%) | $48,864 |
| Female | 55 (56.7%) | $28,854 |
| Total | 97 (100.0%) | $45,156 |
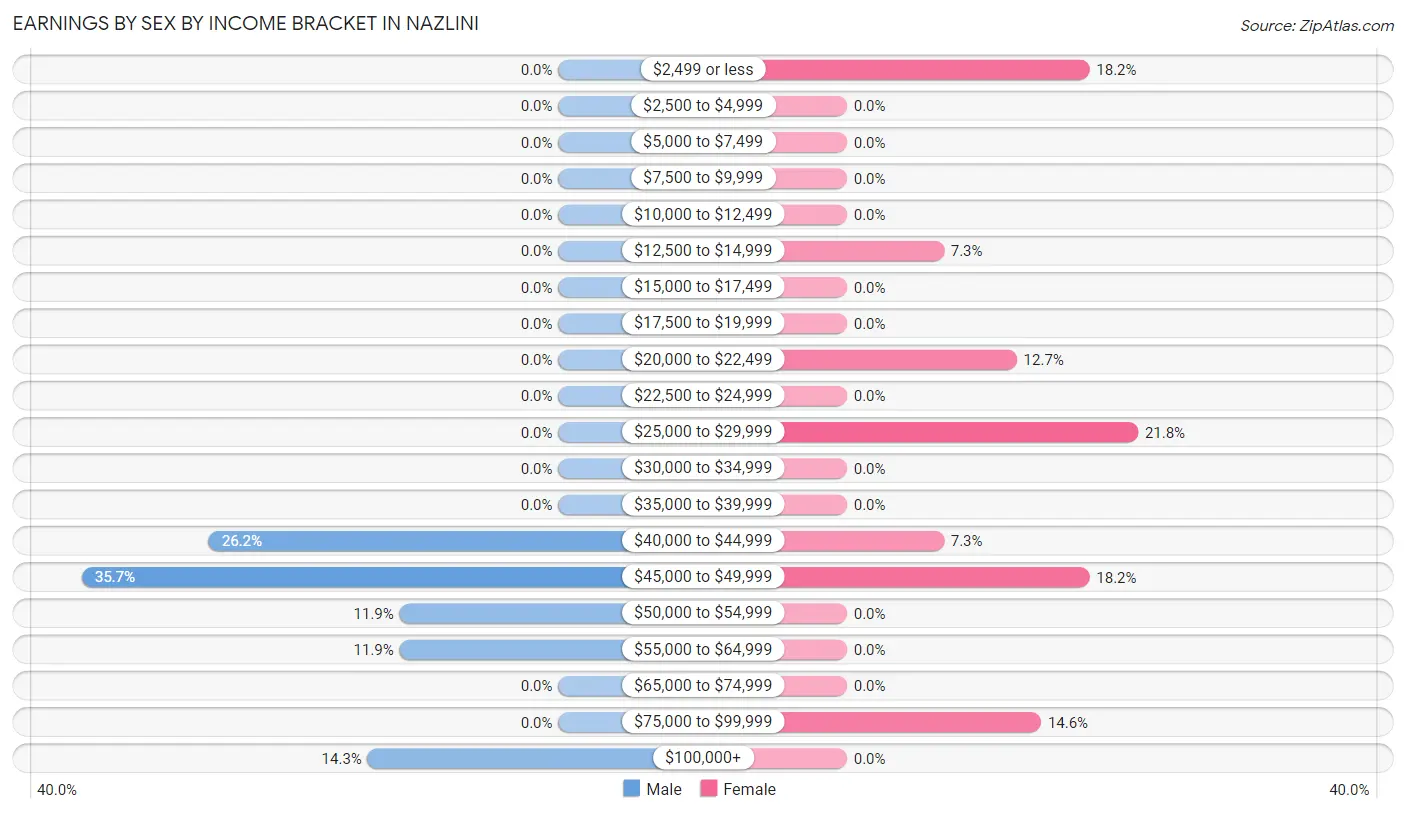
Earnings by Sex by Income Bracket in Nazlini
The most common earnings brackets in Nazlini are $45,000 to $49,999 for men (15 | 35.7%) and $25,000 to $29,999 for women (12 | 21.8%).
| Income | Male | Female |
| $2,499 or less | 0 (0.0%) | 10 (18.2%) |
| $2,500 to $4,999 | 0 (0.0%) | 0 (0.0%) |
| $5,000 to $7,499 | 0 (0.0%) | 0 (0.0%) |
| $7,500 to $9,999 | 0 (0.0%) | 0 (0.0%) |
| $10,000 to $12,499 | 0 (0.0%) | 0 (0.0%) |
| $12,500 to $14,999 | 0 (0.0%) | 4 (7.3%) |
| $15,000 to $17,499 | 0 (0.0%) | 0 (0.0%) |
| $17,500 to $19,999 | 0 (0.0%) | 0 (0.0%) |
| $20,000 to $22,499 | 0 (0.0%) | 7 (12.7%) |
| $22,500 to $24,999 | 0 (0.0%) | 0 (0.0%) |
| $25,000 to $29,999 | 0 (0.0%) | 12 (21.8%) |
| $30,000 to $34,999 | 0 (0.0%) | 0 (0.0%) |
| $35,000 to $39,999 | 0 (0.0%) | 0 (0.0%) |
| $40,000 to $44,999 | 11 (26.2%) | 4 (7.3%) |
| $45,000 to $49,999 | 15 (35.7%) | 10 (18.2%) |
| $50,000 to $54,999 | 5 (11.9%) | 0 (0.0%) |
| $55,000 to $64,999 | 5 (11.9%) | 0 (0.0%) |
| $65,000 to $74,999 | 0 (0.0%) | 0 (0.0%) |
| $75,000 to $99,999 | 0 (0.0%) | 8 (14.5%) |
| $100,000+ | 6 (14.3%) | 0 (0.0%) |
| Total | 42 (100.0%) | 55 (100.0%) |
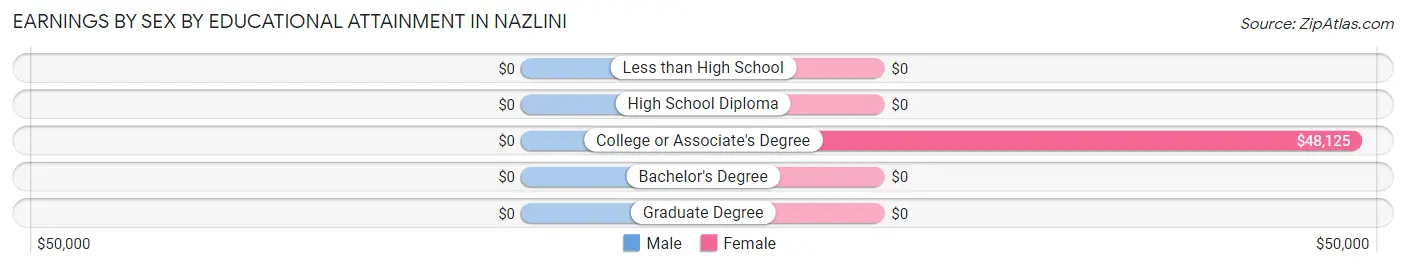
Earnings by Sex by Educational Attainment in Nazlini
| Educational Attainment | Male Income | Female Income |
| Less than High School | - | - |
| High School Diploma | - | - |
| College or Associate's Degree | - | - |
| Bachelor's Degree | - | - |
| Graduate Degree | - | - |
| Total | $48,864 | $28,929 |
Family Income in Nazlini
Family Income Brackets in Nazlini
According to the Nazlini family income data, there are 19 families falling into the $25,000 to $34,999 income range, which is the most common income bracket and makes up 26.0% of all families.
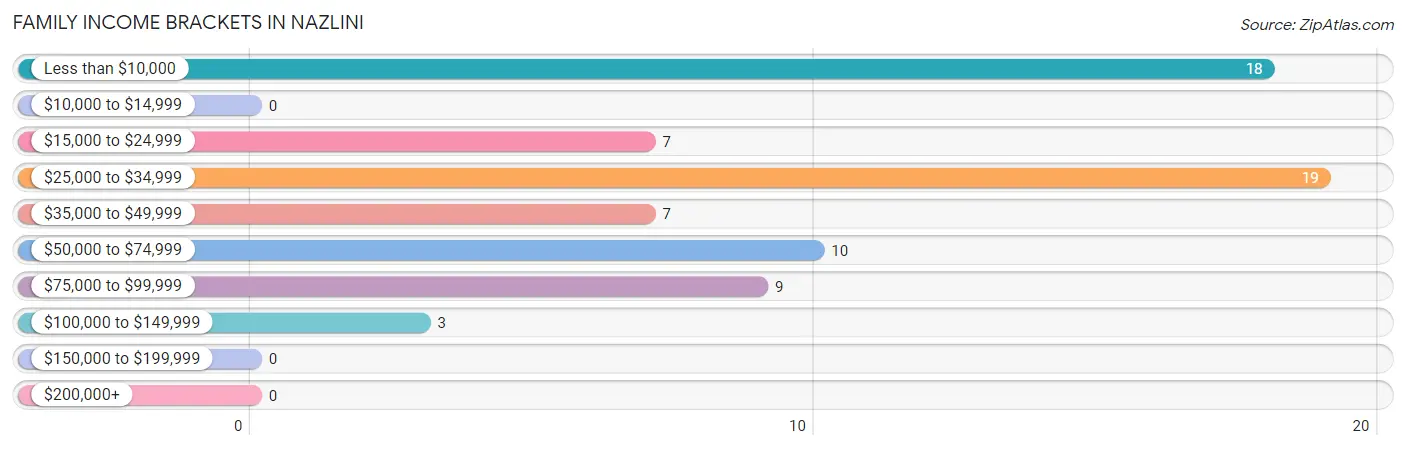
| Income Bracket | # Families | % Families |
| Less than $10,000 | 18 | 24.7% |
| $10,000 to $14,999 | 0 | 0.0% |
| $15,000 to $24,999 | 7 | 9.6% |
| $25,000 to $34,999 | 19 | 26.0% |
| $35,000 to $49,999 | 7 | 9.6% |
| $50,000 to $74,999 | 10 | 13.7% |
| $75,000 to $99,999 | 9 | 12.3% |
| $100,000 to $149,999 | 3 | 4.1% |
| $150,000 to $199,999 | 0 | 0.0% |
| $200,000+ | 0 | 0.0% |
Family Income by Famaliy Size in Nazlini
4-person families (13 | 17.8%) account for the highest median family income in Nazlini with $28,750 per family, while 4-person families (13 | 17.8%) have the highest median income of $7,188 per family member.
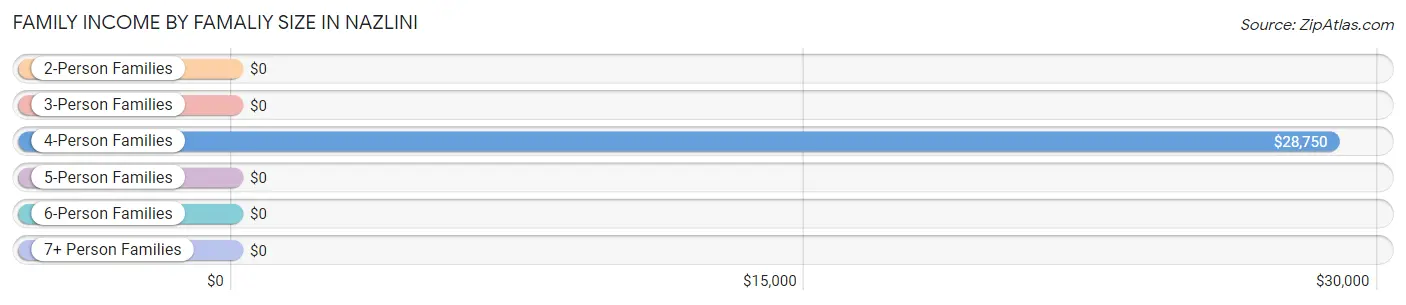
| Income Bracket | # Families | Median Income |
| 2-Person Families | 25 (34.3%) | $0 |
| 3-Person Families | 15 (20.5%) | $0 |
| 4-Person Families | 13 (17.8%) | $28,750 |
| 5-Person Families | 0 (0.0%) | $0 |
| 6-Person Families | 12 (16.4%) | $0 |
| 7+ Person Families | 8 (11.0%) | $0 |
| Total | 73 (100.0%) | $29,896 |
Family Income by Number of Earners in Nazlini

| Number of Earners | # Families | Median Income |
| No Earners | 15 (20.5%) | $0 |
| 1 Earner | 51 (69.9%) | $29,271 |
| 2 Earners | 7 (9.6%) | $0 |
| 3+ Earners | 0 (0.0%) | $0 |
| Total | 73 (100.0%) | $29,896 |
Household Income in Nazlini
Household Income Brackets in Nazlini
With 27 households falling in the category, the less than $10,000 income range is the most frequent in Nazlini, accounting for 26.0% of all households.
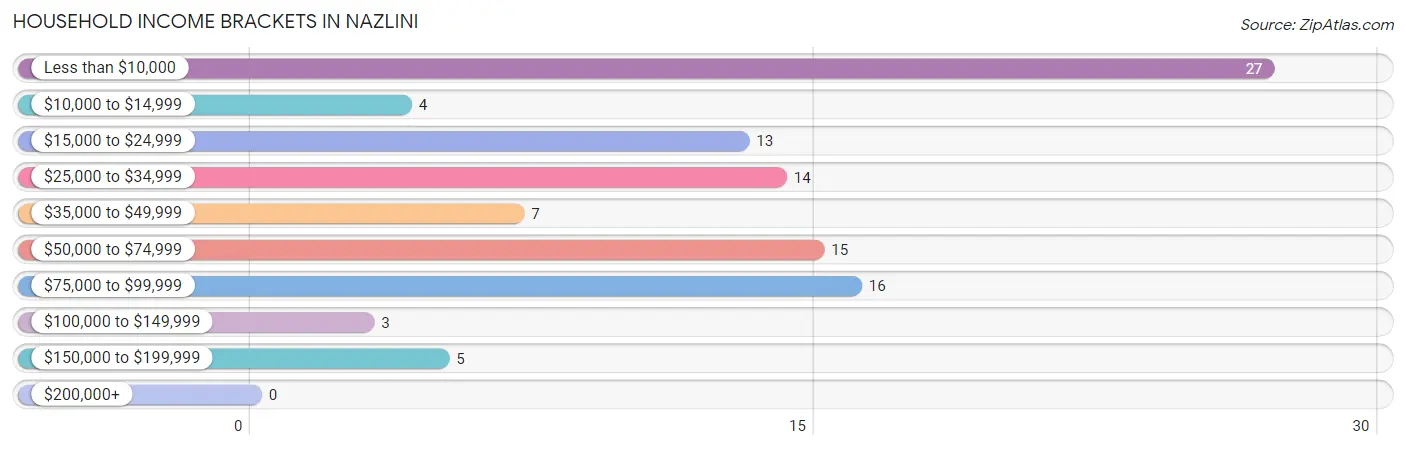
| Income Bracket | # Households | % Households |
| Less than $10,000 | 27 | 26.0% |
| $10,000 to $14,999 | 4 | 3.8% |
| $15,000 to $24,999 | 13 | 12.5% |
| $25,000 to $34,999 | 14 | 13.5% |
| $35,000 to $49,999 | 7 | 6.7% |
| $50,000 to $74,999 | 15 | 14.4% |
| $75,000 to $99,999 | 16 | 15.4% |
| $100,000 to $149,999 | 3 | 2.9% |
| $150,000 to $199,999 | 5 | 4.8% |
| $200,000+ | 0 | 0.0% |
Household Income by Householder Age in Nazlini
The median household income in Nazlini is $30,357, with the highest median household income of $30,893 found in the 65+ years age bracket for the primary householder. A total of 31 households (29.8%) fall into this category. Meanwhile, the 15 to 24 years age bracket for the primary householder has the lowest median household income of $0, with 5 households (4.8%) in this group.
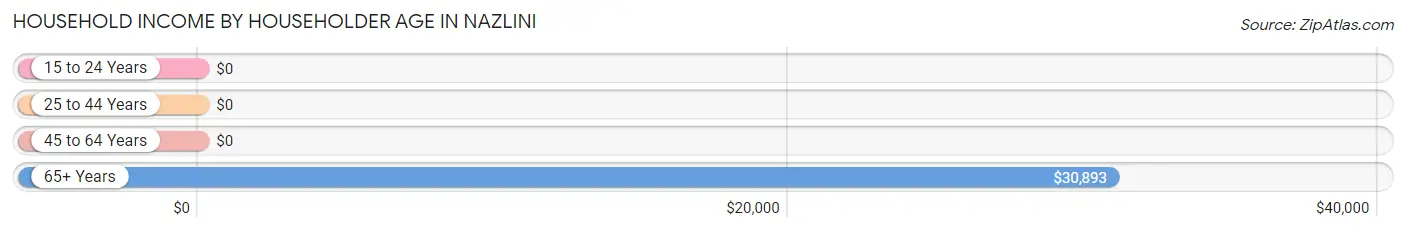
| Income Bracket | # Households | Median Income |
| 15 to 24 Years | 5 (4.8%) | $0 |
| 25 to 44 Years | 35 (33.7%) | $0 |
| 45 to 64 Years | 33 (31.7%) | $0 |
| 65+ Years | 31 (29.8%) | $30,893 |
| Total | 104 (100.0%) | $30,357 |
Poverty in Nazlini
Income Below Poverty by Sex and Age in Nazlini
With 39.8% poverty level for males and 48.8% for females among the residents of Nazlini, 5 year old males and 12 to 14 year old females are the most vulnerable to poverty, with 10 males (100.0%) and 8 females (100.0%) in their respective age groups living below the poverty level.
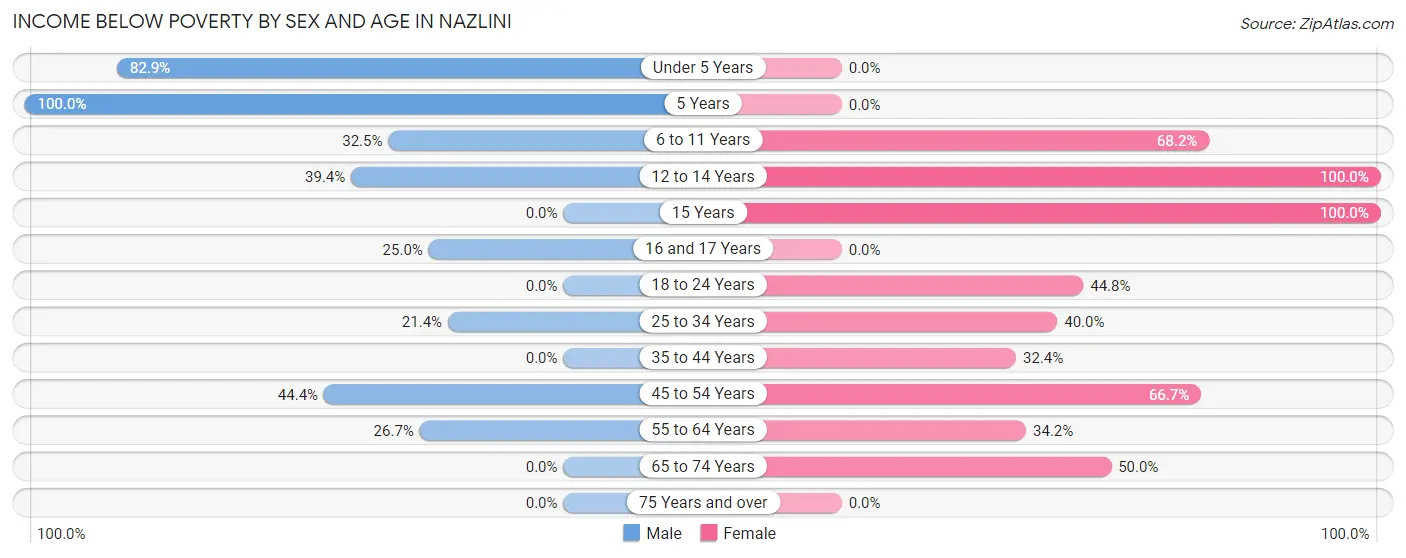
| Age Bracket | Male | Female |
| Under 5 Years | 29 (82.9%) | 0 (0.0%) |
| 5 Years | 10 (100.0%) | 0 (0.0%) |
| 6 to 11 Years | 13 (32.5%) | 45 (68.2%) |
| 12 to 14 Years | 13 (39.4%) | 8 (100.0%) |
| 15 Years | 0 (0.0%) | 5 (100.0%) |
| 16 and 17 Years | 4 (25.0%) | 0 (0.0%) |
| 18 to 24 Years | 0 (0.0%) | 26 (44.8%) |
| 25 to 34 Years | 3 (21.4%) | 4 (40.0%) |
| 35 to 44 Years | 0 (0.0%) | 11 (32.4%) |
| 45 to 54 Years | 4 (44.4%) | 10 (66.7%) |
| 55 to 64 Years | 4 (26.7%) | 13 (34.2%) |
| 65 to 74 Years | 0 (0.0%) | 3 (50.0%) |
| 75 Years and over | 0 (0.0%) | 0 (0.0%) |
| Total | 80 (39.8%) | 125 (48.8%) |
Income Above Poverty by Sex and Age in Nazlini
According to the poverty statistics in Nazlini, males aged 35 to 44 years and females aged 75 years and over are the age groups that are most secure financially, with 100.0% of males and 100.0% of females in these age groups living above the poverty line.
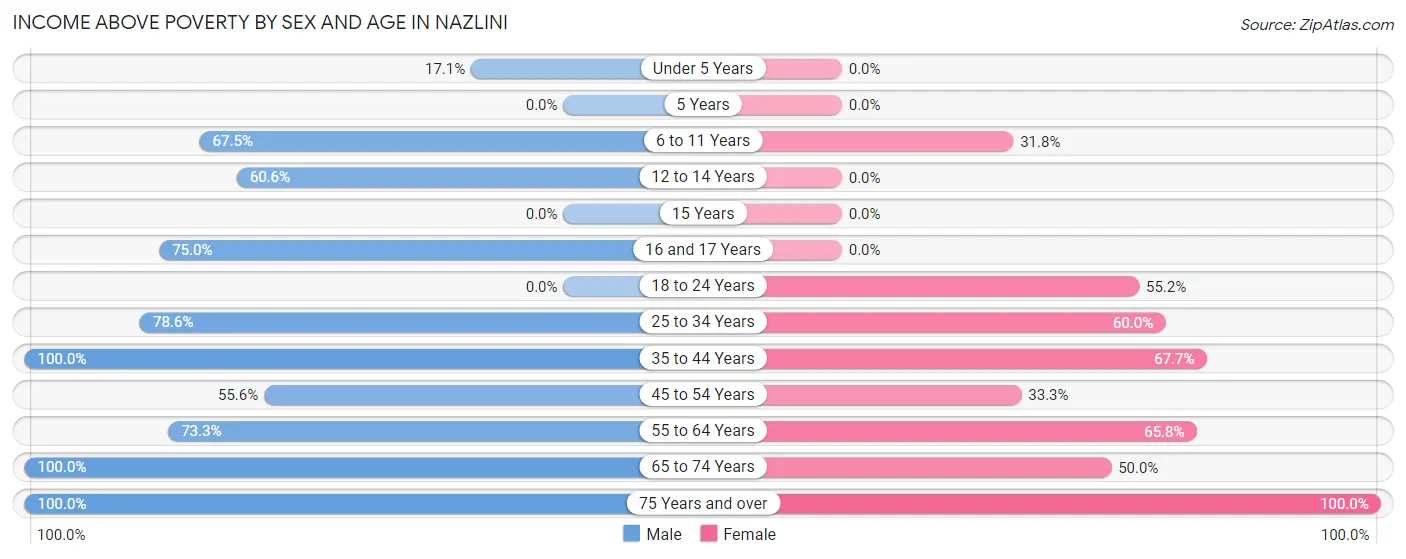
| Age Bracket | Male | Female |
| Under 5 Years | 6 (17.1%) | 0 (0.0%) |
| 5 Years | 0 (0.0%) | 0 (0.0%) |
| 6 to 11 Years | 27 (67.5%) | 21 (31.8%) |
| 12 to 14 Years | 20 (60.6%) | 0 (0.0%) |
| 15 Years | 0 (0.0%) | 0 (0.0%) |
| 16 and 17 Years | 12 (75.0%) | 0 (0.0%) |
| 18 to 24 Years | 0 (0.0%) | 32 (55.2%) |
| 25 to 34 Years | 11 (78.6%) | 6 (60.0%) |
| 35 to 44 Years | 17 (100.0%) | 23 (67.6%) |
| 45 to 54 Years | 5 (55.6%) | 5 (33.3%) |
| 55 to 64 Years | 11 (73.3%) | 25 (65.8%) |
| 65 to 74 Years | 6 (100.0%) | 3 (50.0%) |
| 75 Years and over | 6 (100.0%) | 16 (100.0%) |
| Total | 121 (60.2%) | 131 (51.2%) |
Income Below Poverty Among Married-Couple Families in Nazlini
The poverty statistics for married-couple families in Nazlini show that 34.8% or 8 of the total 23 families live below the poverty line. Families with 1 or 2 children have the highest poverty rate of 100.0%, comprising of 4 families. On the other hand, families with no children have the lowest poverty rate of 0.0%, which includes 0 families.
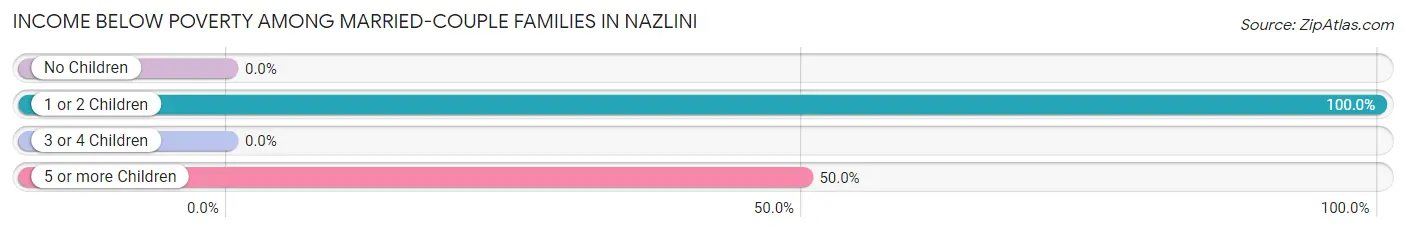
| Children | Above Poverty | Below Poverty |
| No Children | 6 (100.0%) | 0 (0.0%) |
| 1 or 2 Children | 0 (0.0%) | 4 (100.0%) |
| 3 or 4 Children | 5 (100.0%) | 0 (0.0%) |
| 5 or more Children | 4 (50.0%) | 4 (50.0%) |
| Total | 15 (65.2%) | 8 (34.8%) |
Income Below Poverty Among Single-Parent Households in Nazlini
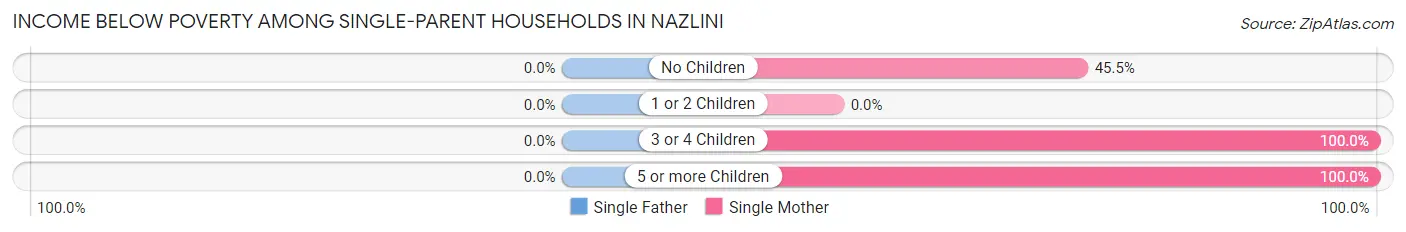
| Children | Single Father | Single Mother |
| No Children | 0 (0.0%) | 10 (45.5%) |
| 1 or 2 Children | 0 (0.0%) | 0 (0.0%) |
| 3 or 4 Children | 0 (0.0%) | 5 (100.0%) |
| 5 or more Children | 0 (0.0%) | 7 (100.0%) |
| Total | 0 (0.0%) | 22 (44.0%) |
Income Below Poverty Among Married-Couple vs Single-Parent Households in Nazlini
The poverty data for Nazlini shows that 8 of the married-couple family households (34.8%) and 22 of the single-parent households (44.0%) are living below the poverty level. Within the married-couple family households, those with 1 or 2 children have the highest poverty rate, with 4 households (100.0%) falling below the poverty line. Among the single-parent households, those with 3 or 4 children have the highest poverty rate, with 5 household (100.0%) living below poverty.
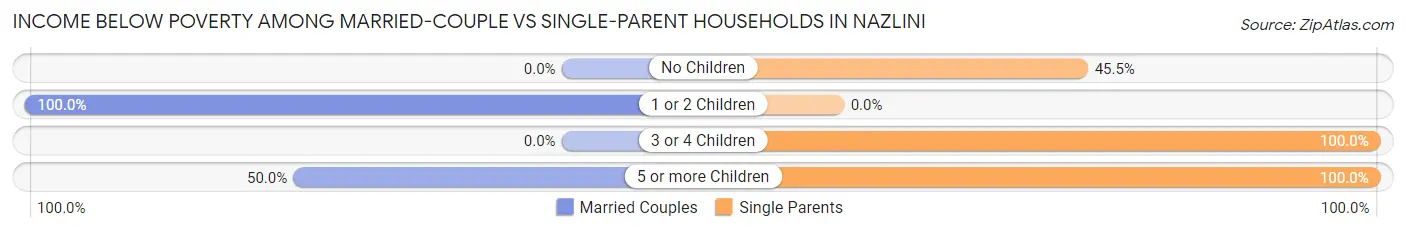
| Children | Married-Couple Families | Single-Parent Households |
| No Children | 0 (0.0%) | 10 (45.5%) |
| 1 or 2 Children | 4 (100.0%) | 0 (0.0%) |
| 3 or 4 Children | 0 (0.0%) | 5 (100.0%) |
| 5 or more Children | 4 (50.0%) | 7 (100.0%) |
| Total | 8 (34.8%) | 22 (44.0%) |
Race in Nazlini
The most populous races in Nazlini are , and Native / Alaskan (468 | 100.0%).
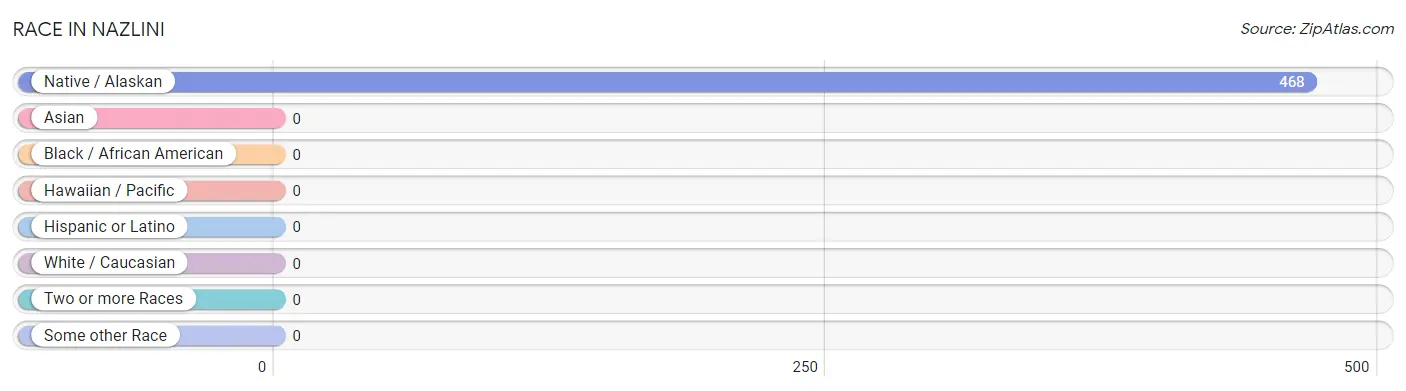
| Race | # Population | % Population |
| Asian | 0 | 0.0% |
| Black / African American | 0 | 0.0% |
| Hawaiian / Pacific | 0 | 0.0% |
| Hispanic or Latino | 0 | 0.0% |
| Native / Alaskan | 468 | 100.0% |
| White / Caucasian | 0 | 0.0% |
| Two or more Races | 0 | 0.0% |
| Some other Race | 0 | 0.0% |
| Total | 468 | 100.0% |
Ancestry in Nazlini
The most populous ancestries reported in Nazlini are , and Navajo (446 | 95.3%), together accounting for 95.3% of all Nazlini residents.

| Ancestry | # Population | % Population |
| Navajo | 446 | 95.3% | View All 1 Rows |
Immigrants in Nazlini

| Immigration Origin | # Population | % Population | View All 0 Rows |
Sex and Age in Nazlini
Sex and Age in Nazlini
The most populous age groups in Nazlini are 10 to 14 Years (59 | 28.5%) for men and 5 to 9 Years (66 | 25.3%) for women.
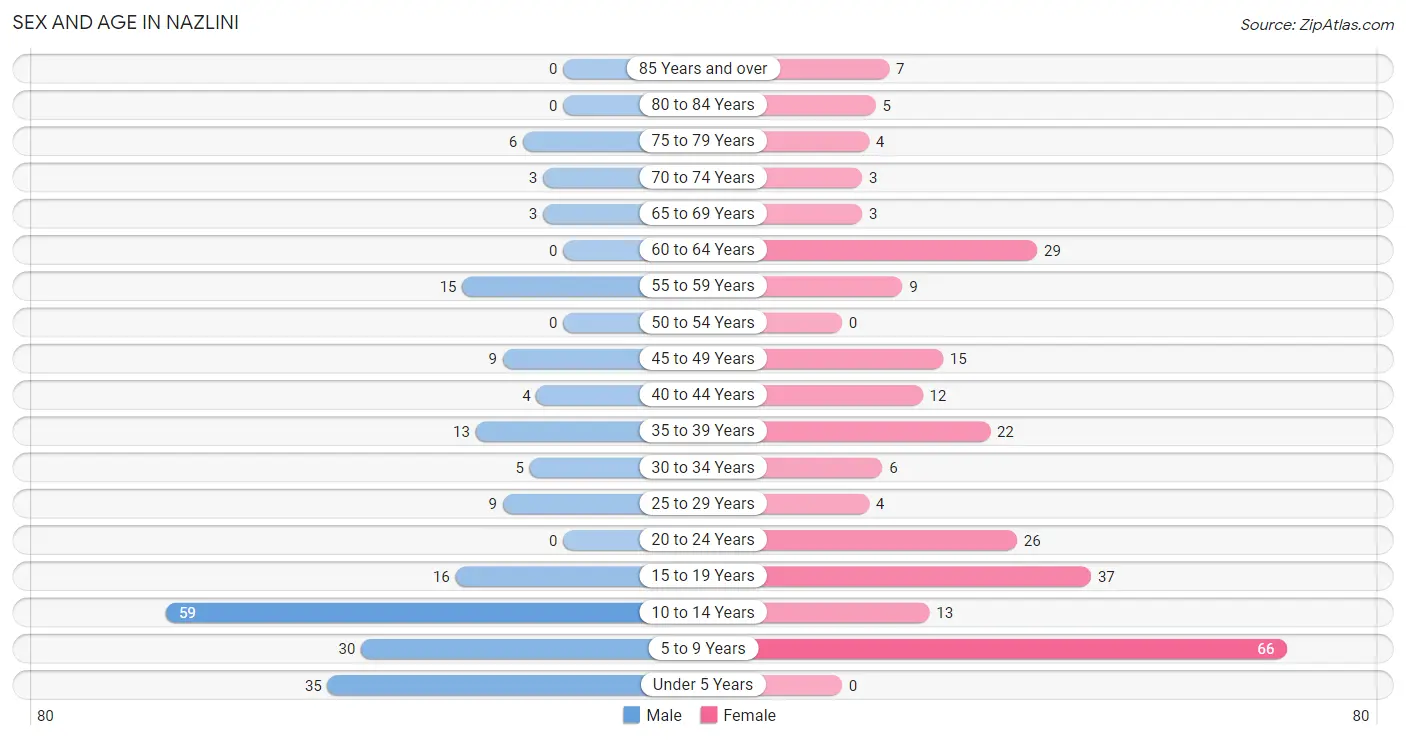
| Age Bracket | Male | Female |
| Under 5 Years | 35 (16.9%) | 0 (0.0%) |
| 5 to 9 Years | 30 (14.5%) | 66 (25.3%) |
| 10 to 14 Years | 59 (28.5%) | 13 (5.0%) |
| 15 to 19 Years | 16 (7.7%) | 37 (14.2%) |
| 20 to 24 Years | 0 (0.0%) | 26 (10.0%) |
| 25 to 29 Years | 9 (4.3%) | 4 (1.5%) |
| 30 to 34 Years | 5 (2.4%) | 6 (2.3%) |
| 35 to 39 Years | 13 (6.3%) | 22 (8.4%) |
| 40 to 44 Years | 4 (1.9%) | 12 (4.6%) |
| 45 to 49 Years | 9 (4.3%) | 15 (5.8%) |
| 50 to 54 Years | 0 (0.0%) | 0 (0.0%) |
| 55 to 59 Years | 15 (7.2%) | 9 (3.5%) |
| 60 to 64 Years | 0 (0.0%) | 29 (11.1%) |
| 65 to 69 Years | 3 (1.5%) | 3 (1.1%) |
| 70 to 74 Years | 3 (1.5%) | 3 (1.1%) |
| 75 to 79 Years | 6 (2.9%) | 4 (1.5%) |
| 80 to 84 Years | 0 (0.0%) | 5 (1.9%) |
| 85 Years and over | 0 (0.0%) | 7 (2.7%) |
| Total | 207 (100.0%) | 261 (100.0%) |
Families and Households in Nazlini
Median Family Size in Nazlini
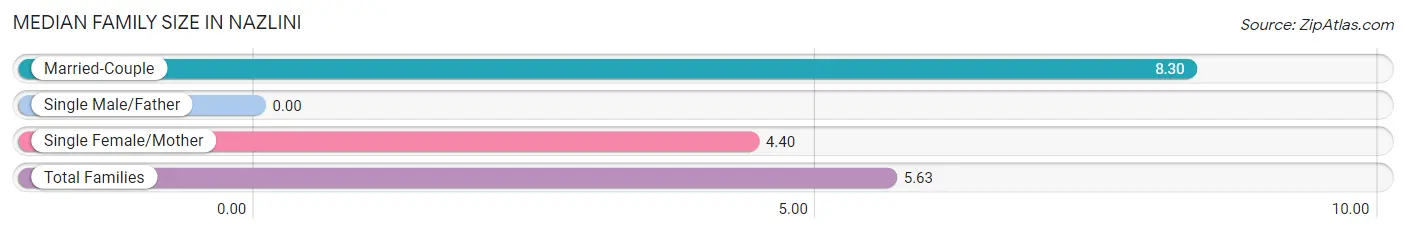
| Family Type | # Families | Family Size |
| Married-Couple | 23 (31.5%) | 8.30 |
| Single Male/Father | 0 (0.0%) | - |
| Single Female/Mother | 50 (68.5%) | 4.40 |
| Total Families | 73 (100.0%) | 5.63 |
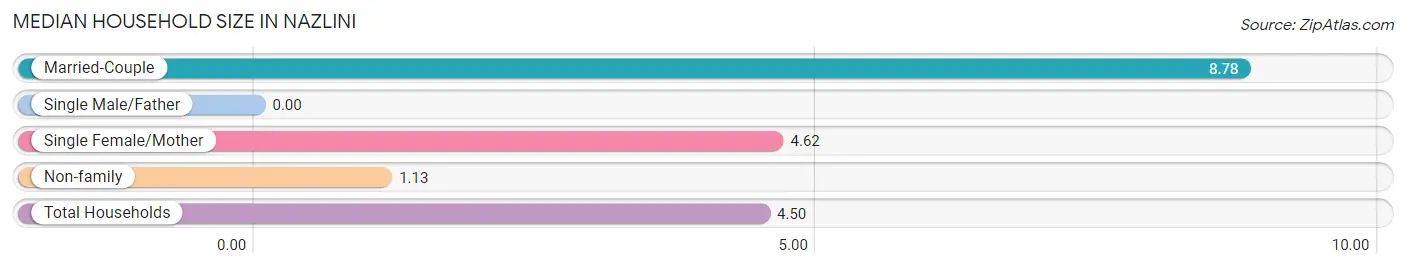
Median Household Size in Nazlini
| Household Type | # Households | Household Size |
| Married-Couple | 23 (22.1%) | 8.78 |
| Single Male/Father | 0 (0.0%) | - |
| Single Female/Mother | 50 (48.1%) | 4.62 |
| Non-family | 31 (29.8%) | 1.13 |
| Total Households | 104 (100.0%) | 4.50 |
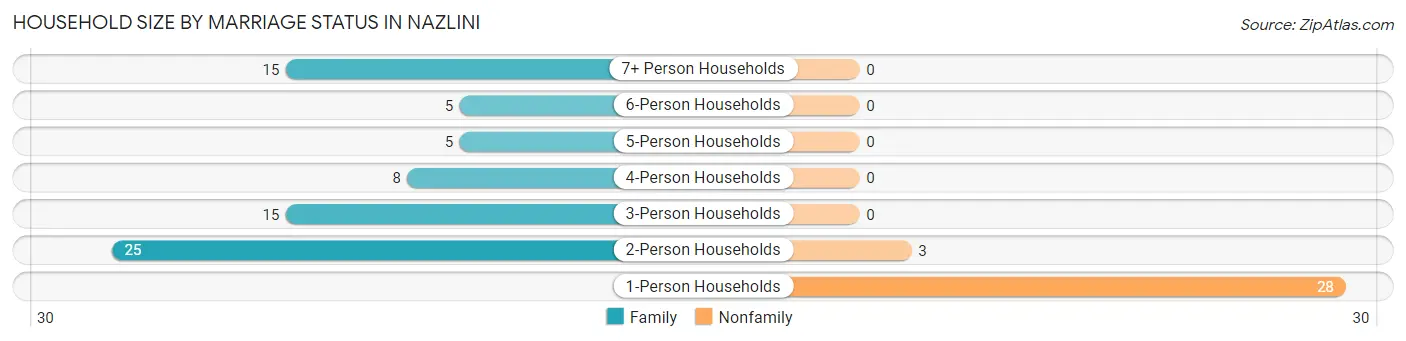
Household Size by Marriage Status in Nazlini
Out of a total of 104 households in Nazlini, 73 (70.2%) are family households, while 31 (29.8%) are nonfamily households. The most numerous type of family households are 2-person households, comprising 25, and the most common type of nonfamily households are 1-person households, comprising 28.
| Household Size | Family Households | Nonfamily Households |
| 1-Person Households | - | 28 (26.9%) |
| 2-Person Households | 25 (24.0%) | 3 (2.9%) |
| 3-Person Households | 15 (14.4%) | 0 (0.0%) |
| 4-Person Households | 8 (7.7%) | 0 (0.0%) |
| 5-Person Households | 5 (4.8%) | 0 (0.0%) |
| 6-Person Households | 5 (4.8%) | 0 (0.0%) |
| 7+ Person Households | 15 (14.4%) | 0 (0.0%) |
| Total | 73 (70.2%) | 31 (29.8%) |
Female Fertility in Nazlini
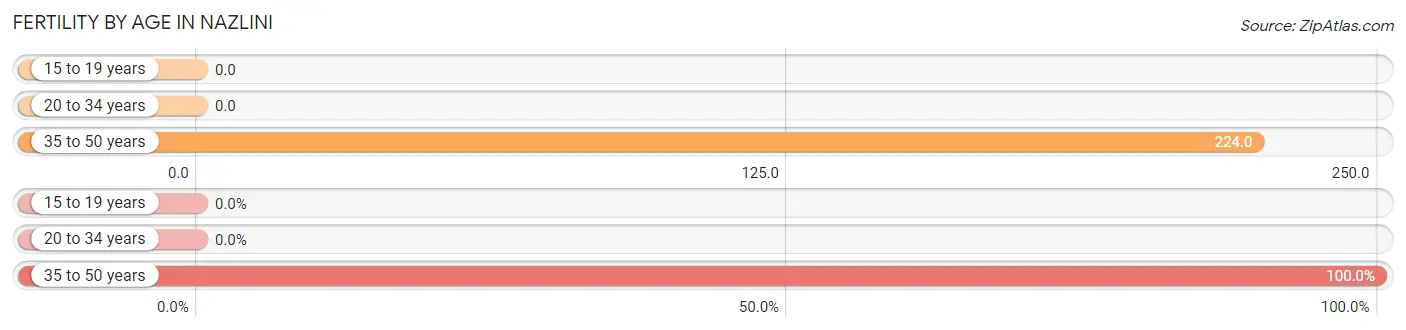
Fertility by Age in Nazlini
Average fertility rate in Nazlini is 90.0 births per 1,000 women. Women in the age bracket of 35 to 50 years have the highest fertility rate with 224.0 births per 1,000 women. Women in the age bracket of 35 to 50 years acount for 100.0% of all women with births.
| Age Bracket | Women with Births | Births / 1,000 Women |
| 15 to 19 years | 0 (0.0%) | 0.0 |
| 20 to 34 years | 0 (0.0%) | 0.0 |
| 35 to 50 years | 11 (100.0%) | 224.0 |
| Total | 11 (100.0%) | 90.0 |
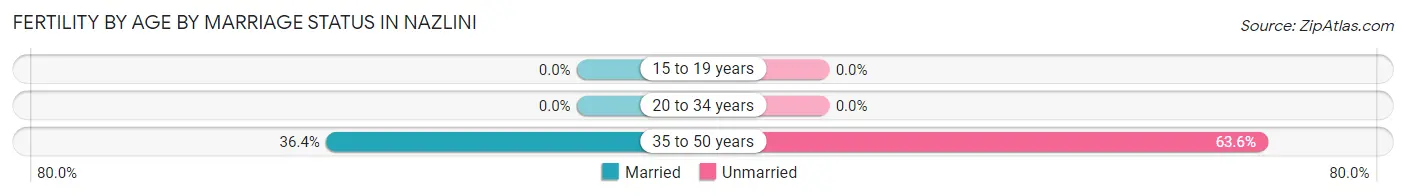
Fertility by Age by Marriage Status in Nazlini
36.4% of women with births (11) in Nazlini are married. The highest percentage of unmarried women with births falls into 35 to 50 years age bracket with 63.6% of them unmarried at the time of birth, while the lowest percentage of unmarried women with births belong to 35 to 50 years age bracket with 63.6% of them unmarried.
| Age Bracket | Married | Unmarried |
| 15 to 19 years | 0 (0.0%) | 0 (0.0%) |
| 20 to 34 years | 0 (0.0%) | 0 (0.0%) |
| 35 to 50 years | 4 (36.4%) | 7 (63.6%) |
| Total | 4 (36.4%) | 7 (63.6%) |
Fertility by Education in Nazlini
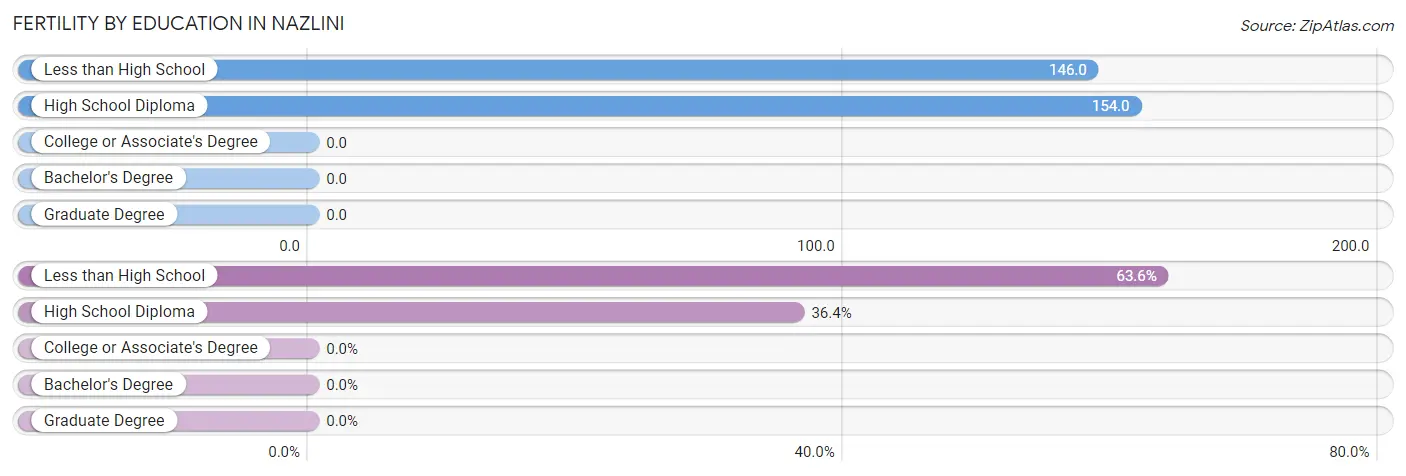
| Educational Attainment | Women with Births | Births / 1,000 Women |
| Less than High School | 7 (63.6%) | 146.0 |
| High School Diploma | 4 (36.4%) | 154.0 |
| College or Associate's Degree | 0 (0.0%) | 0.0 |
| Bachelor's Degree | 0 (0.0%) | 0.0 |
| Graduate Degree | 0 (0.0%) | 0.0 |
| Total | 11 (100.0%) | 90.0 |
Fertility by Education by Marriage Status in Nazlini
63.6% of women with births in Nazlini are unmarried. Women with the educational attainment of high school diploma are most likely to be married with 100.0% of them married at childbirth, while women with the educational attainment of less than high school are least likely to be married with 100.0% of them unmarried at childbirth.
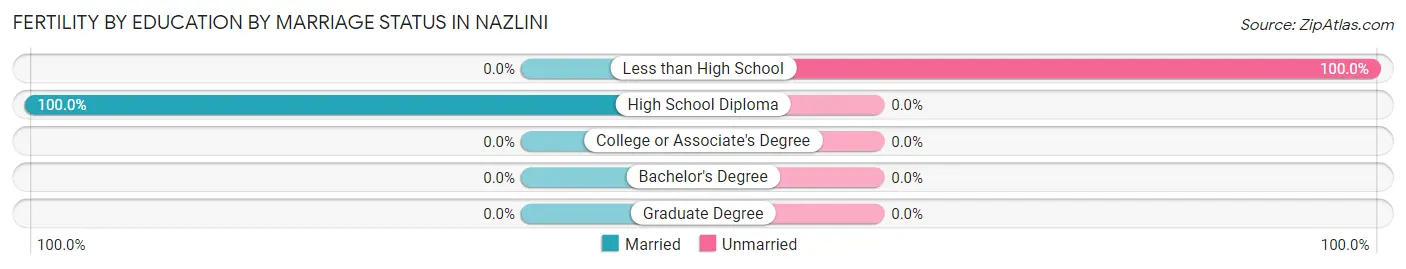
| Educational Attainment | Married | Unmarried |
| Less than High School | 0 (0.0%) | 7 (100.0%) |
| High School Diploma | 4 (100.0%) | 0 (0.0%) |
| College or Associate's Degree | 0 (0.0%) | 0 (0.0%) |
| Bachelor's Degree | 0 (0.0%) | 0 (0.0%) |
| Graduate Degree | 0 (0.0%) | 0 (0.0%) |
| Total | 4 (36.4%) | 7 (63.6%) |
Employment Characteristics in Nazlini
Employment by Class of Employer in Nazlini
Among the 93 employed individuals in Nazlini, private company employees (36 | 38.7%), state government employees (16 | 17.2%), and federal government employees (16 | 17.2%) make up the most common classes of employment.
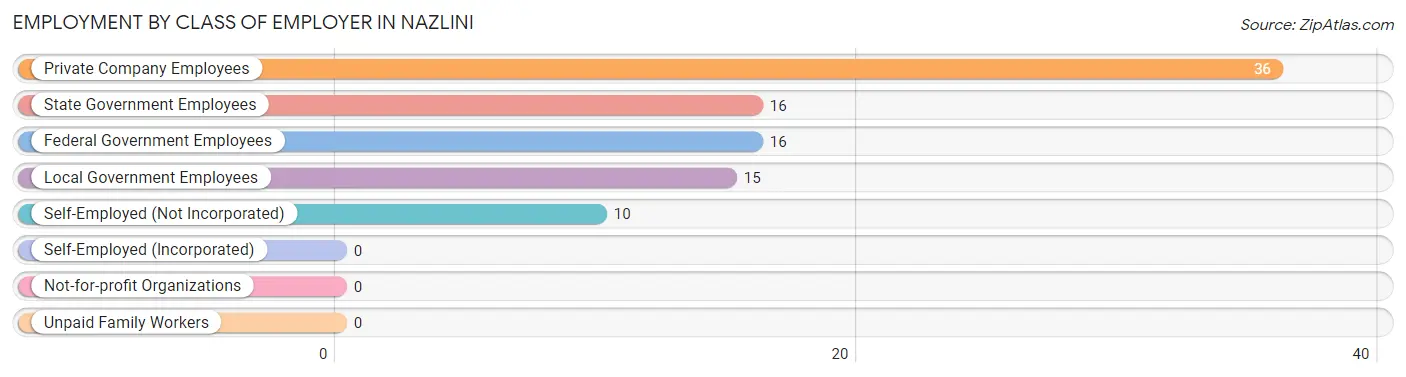
| Employer Class | # Employees | % Employees |
| Private Company Employees | 36 | 38.7% |
| Self-Employed (Incorporated) | 0 | 0.0% |
| Self-Employed (Not Incorporated) | 10 | 10.7% |
| Not-for-profit Organizations | 0 | 0.0% |
| Local Government Employees | 15 | 16.1% |
| State Government Employees | 16 | 17.2% |
| Federal Government Employees | 16 | 17.2% |
| Unpaid Family Workers | 0 | 0.0% |
| Total | 93 | 100.0% |
Employment Status by Age in Nazlini
According to the labor force statistics for Nazlini, out of the total population over 16 years of age (260), 39.6% or 103 individuals are in the labor force, with 9.7% or 10 of them unemployed. The age group with the highest labor force participation rate is 25 to 29 years, with 100.0% or 13 individuals in the labor force. Within the labor force, the 25 to 29 years age range has the highest percentage of unemployed individuals, with 53.8% or 7 of them being unemployed.
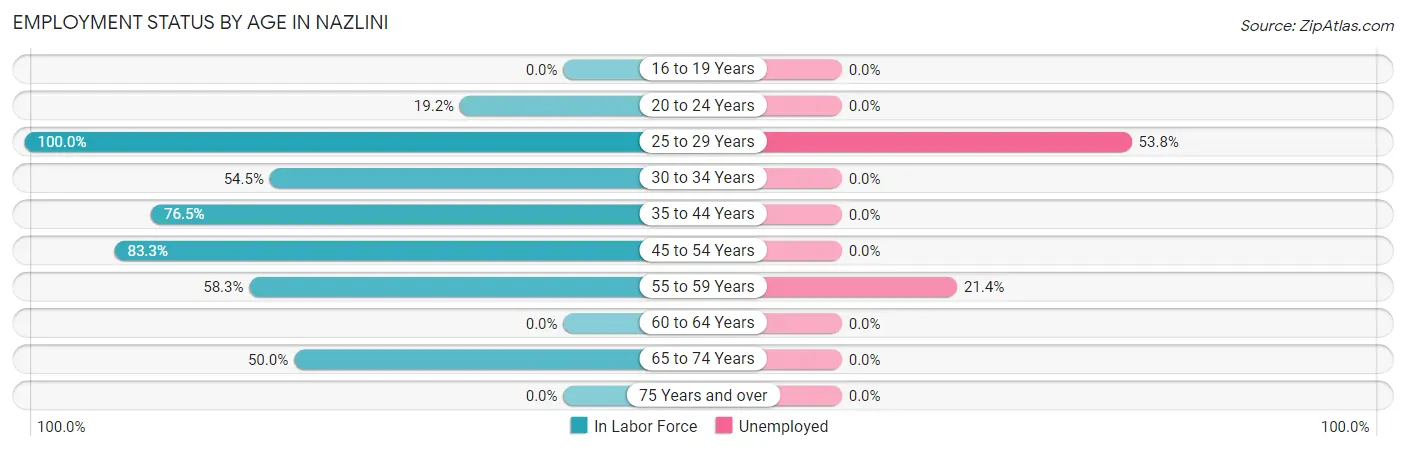
| Age Bracket | In Labor Force | Unemployed |
| 16 to 19 Years | 0 (0.0%) | 0 (0.0%) |
| 20 to 24 Years | 5 (19.2%) | 0 (0.0%) |
| 25 to 29 Years | 13 (100.0%) | 7 (53.8%) |
| 30 to 34 Years | 6 (54.5%) | 0 (0.0%) |
| 35 to 44 Years | 39 (76.5%) | 0 (0.0%) |
| 45 to 54 Years | 20 (83.3%) | 0 (0.0%) |
| 55 to 59 Years | 14 (58.3%) | 3 (21.4%) |
| 60 to 64 Years | 0 (0.0%) | 0 (0.0%) |
| 65 to 74 Years | 6 (50.0%) | 0 (0.0%) |
| 75 Years and over | 0 (0.0%) | 0 (0.0%) |
| Total | 103 (39.6%) | 10 (9.7%) |
Employment Status by Educational Attainment in Nazlini
According to labor force statistics for Nazlini, 60.5% of individuals (92) out of the total population between 25 and 64 years of age (152) are in the labor force, with 10.9% or 10 of them being unemployed. The group with the highest labor force participation rate are those with the educational attainment of less than high school, with 100.0% or 20 individuals in the labor force. Within the labor force, individuals with high school diploma education have the highest percentage of unemployment, with 24.1% or 7 of them being unemployed.
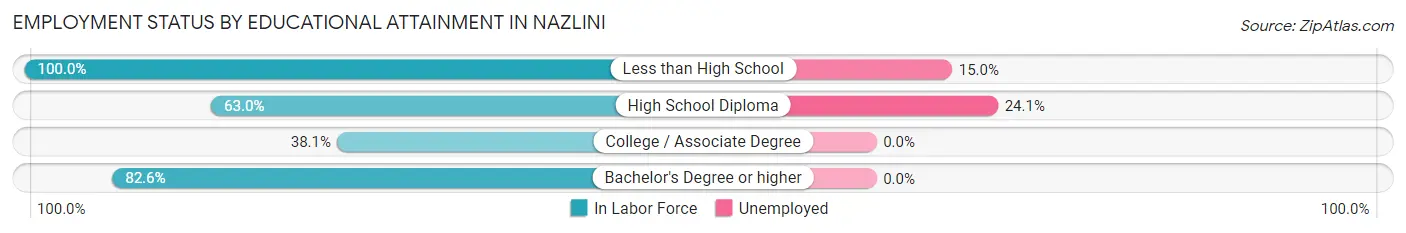
| Educational Attainment | In Labor Force | Unemployed |
| Less than High School | 20 (100.0%) | 3 (15.0%) |
| High School Diploma | 29 (63.0%) | 11 (24.1%) |
| College / Associate Degree | 24 (38.1%) | 0 (0.0%) |
| Bachelor's Degree or higher | 19 (82.6%) | 0 (0.0%) |
| Total | 92 (60.5%) | 17 (10.9%) |
Employment Occupations by Sex in Nazlini
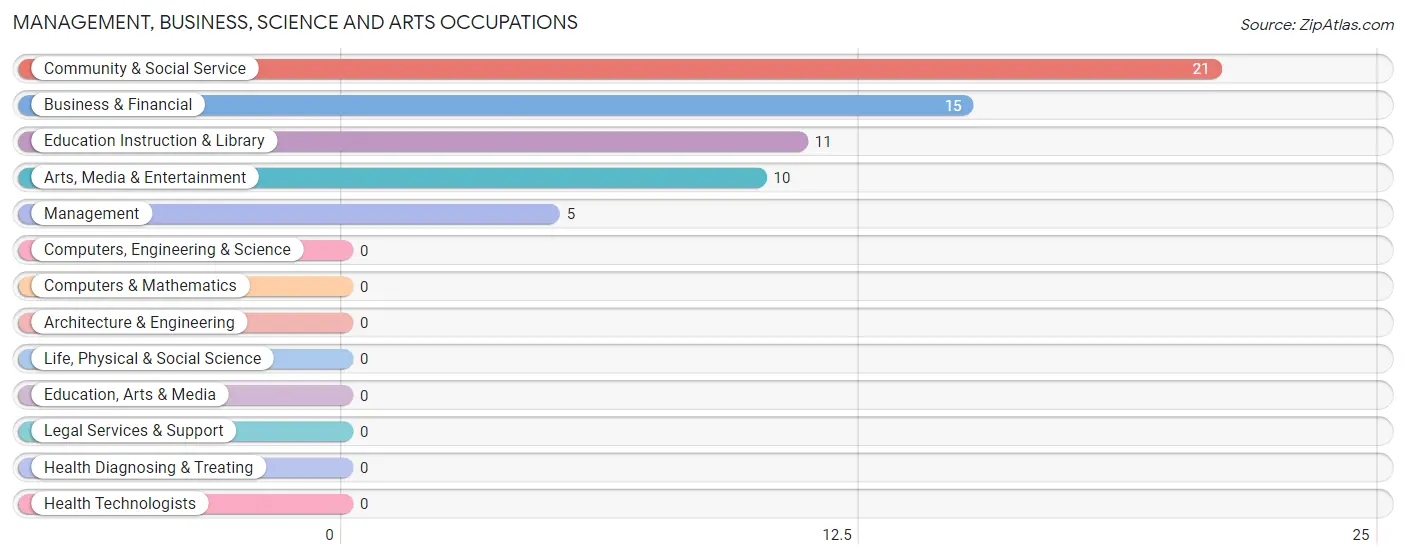
Management, Business, Science and Arts Occupations
The most common Management, Business, Science and Arts occupations in Nazlini are Community & Social Service (21 | 22.6%), Business & Financial (15 | 16.1%), Education Instruction & Library (11 | 11.8%), Arts, Media & Entertainment (10 | 10.7%), and Management (5 | 5.4%).
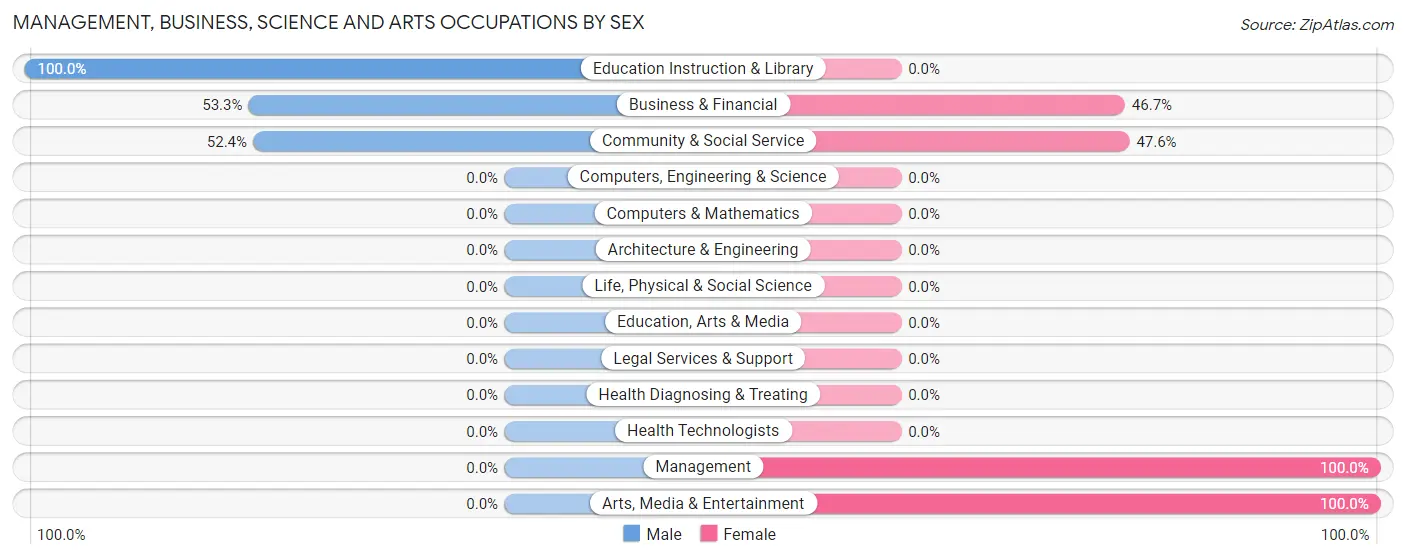
Management, Business, Science and Arts Occupations by Sex
Within the Management, Business, Science and Arts occupations in Nazlini, the most male-oriented occupations are Education Instruction & Library (100.0%), Business & Financial (53.3%), and Community & Social Service (52.4%), while the most female-oriented occupations are Management (100.0%), Arts, Media & Entertainment (100.0%), and Community & Social Service (47.6%).
| Occupation | Male | Female |
| Management | 0 (0.0%) | 5 (100.0%) |
| Business & Financial | 8 (53.3%) | 7 (46.7%) |
| Computers, Engineering & Science | 0 (0.0%) | 0 (0.0%) |
| Computers & Mathematics | 0 (0.0%) | 0 (0.0%) |
| Architecture & Engineering | 0 (0.0%) | 0 (0.0%) |
| Life, Physical & Social Science | 0 (0.0%) | 0 (0.0%) |
| Community & Social Service | 11 (52.4%) | 10 (47.6%) |
| Education, Arts & Media | 0 (0.0%) | 0 (0.0%) |
| Legal Services & Support | 0 (0.0%) | 0 (0.0%) |
| Education Instruction & Library | 11 (100.0%) | 0 (0.0%) |
| Arts, Media & Entertainment | 0 (0.0%) | 10 (100.0%) |
| Health Diagnosing & Treating | 0 (0.0%) | 0 (0.0%) |
| Health Technologists | 0 (0.0%) | 0 (0.0%) |
| Total (Category) | 19 (46.3%) | 22 (53.7%) |
| Total (Overall) | 42 (45.2%) | 51 (54.8%) |
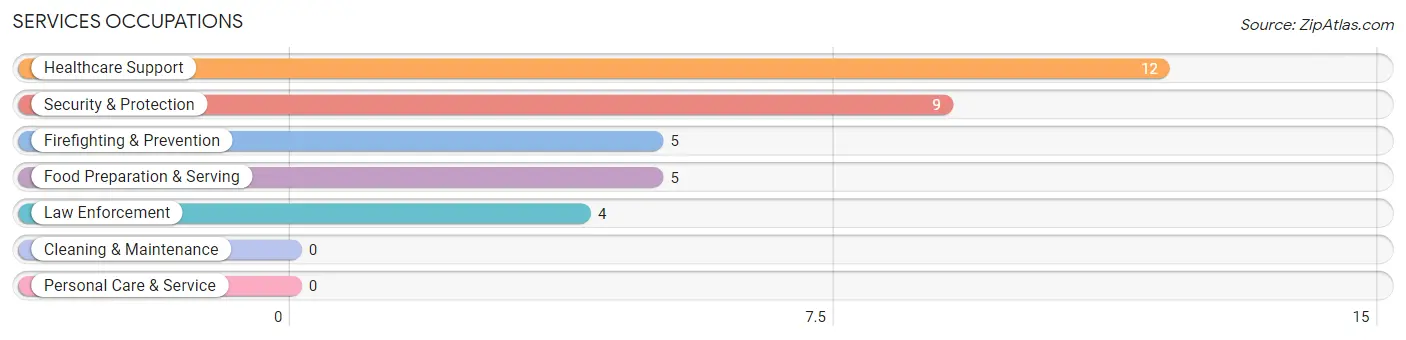
Services Occupations
The most common Services occupations in Nazlini are Healthcare Support (12 | 12.9%), Security & Protection (9 | 9.7%), Firefighting & Prevention (5 | 5.4%), Food Preparation & Serving (5 | 5.4%), and Law Enforcement (4 | 4.3%).
Services Occupations by Sex
Within the Services occupations in Nazlini, the most male-oriented occupations are Firefighting & Prevention (100.0%), Food Preparation & Serving (100.0%), and Security & Protection (55.6%), while the most female-oriented occupations are Healthcare Support (100.0%), Law Enforcement (100.0%), and Security & Protection (44.4%).
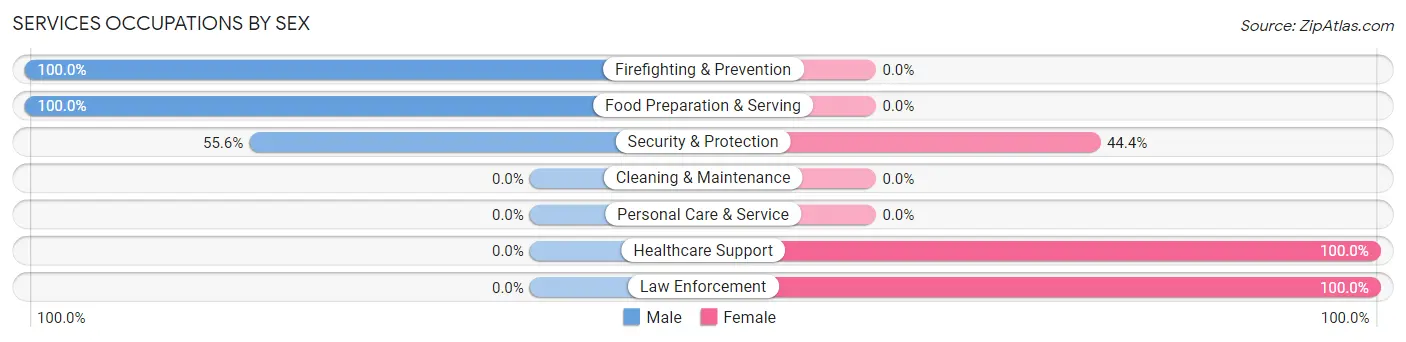
| Occupation | Male | Female |
| Healthcare Support | 0 (0.0%) | 12 (100.0%) |
| Security & Protection | 5 (55.6%) | 4 (44.4%) |
| Firefighting & Prevention | 5 (100.0%) | 0 (0.0%) |
| Law Enforcement | 0 (0.0%) | 4 (100.0%) |
| Food Preparation & Serving | 5 (100.0%) | 0 (0.0%) |
| Cleaning & Maintenance | 0 (0.0%) | 0 (0.0%) |
| Personal Care & Service | 0 (0.0%) | 0 (0.0%) |
| Total (Category) | 10 (38.5%) | 16 (61.5%) |
| Total (Overall) | 42 (45.2%) | 51 (54.8%) |
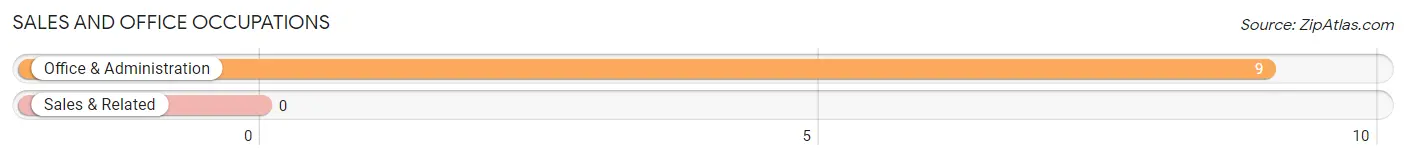
Sales and Office Occupations
The most common Sales and Office occupations in Nazlini are , and Office & Administration (9 | 9.7%).
Sales and Office Occupations by Sex
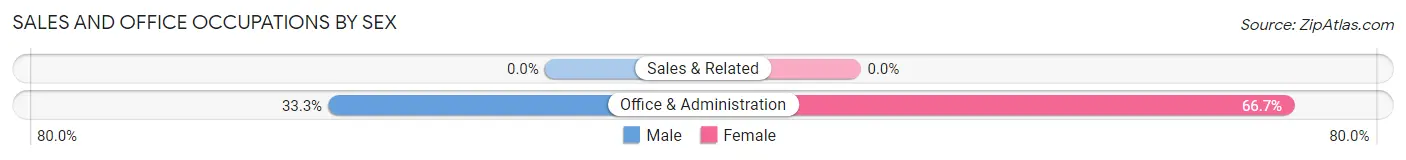
| Occupation | Male | Female |
| Sales & Related | 0 (0.0%) | 0 (0.0%) |
| Office & Administration | 3 (33.3%) | 6 (66.7%) |
| Total (Category) | 3 (33.3%) | 6 (66.7%) |
| Total (Overall) | 42 (45.2%) | 51 (54.8%) |
Natural Resources, Construction and Maintenance Occupations
The most common Natural Resources, Construction and Maintenance occupations in Nazlini are Construction & Extraction (6 | 6.5%), and Installation, Maintenance & Repair (4 | 4.3%).
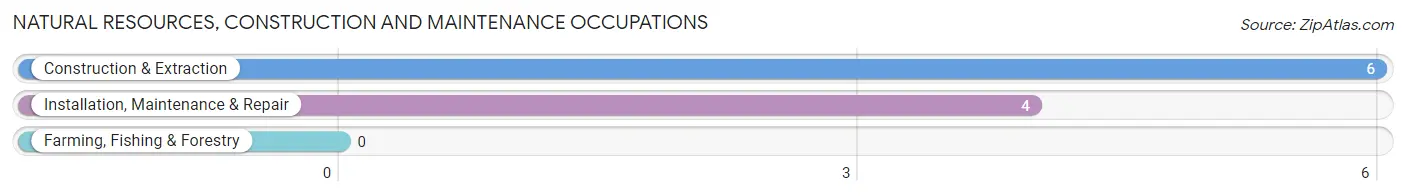
Natural Resources, Construction and Maintenance Occupations by Sex
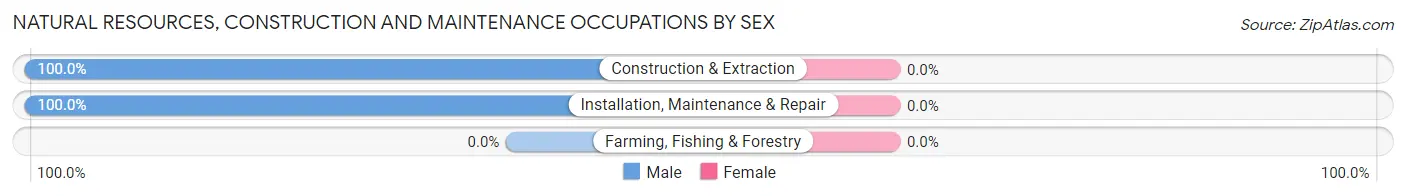
| Occupation | Male | Female |
| Farming, Fishing & Forestry | 0 (0.0%) | 0 (0.0%) |
| Construction & Extraction | 6 (100.0%) | 0 (0.0%) |
| Installation, Maintenance & Repair | 4 (100.0%) | 0 (0.0%) |
| Total (Category) | 10 (100.0%) | 0 (0.0%) |
| Total (Overall) | 42 (45.2%) | 51 (54.8%) |
Production, Transportation and Moving Occupations
The most common Production, Transportation and Moving occupations in Nazlini are , and Transportation (7 | 7.5%).
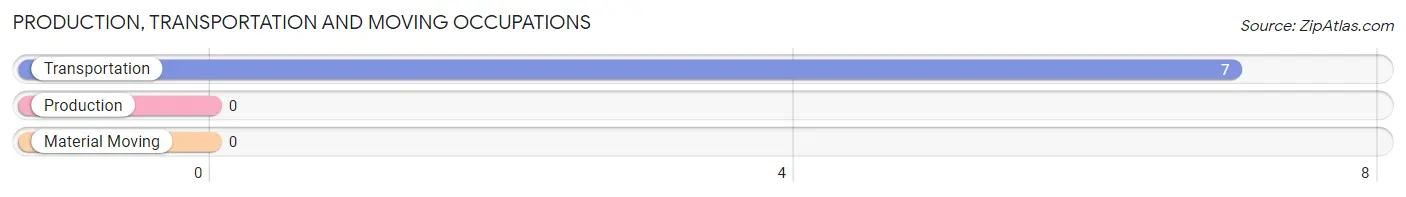
Production, Transportation and Moving Occupations by Sex
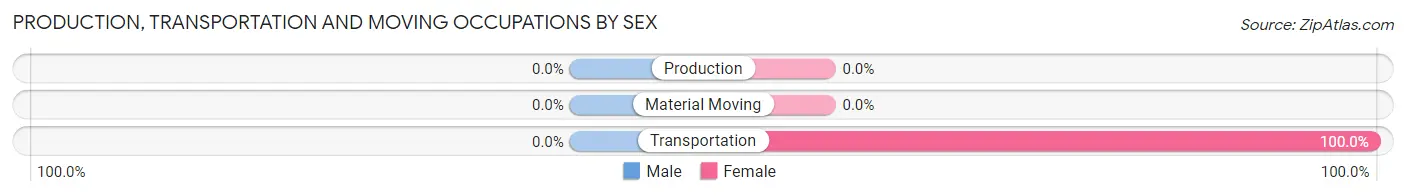
| Occupation | Male | Female |
| Production | 0 (0.0%) | 0 (0.0%) |
| Transportation | 0 (0.0%) | 7 (100.0%) |
| Material Moving | 0 (0.0%) | 0 (0.0%) |
| Total (Category) | 0 (0.0%) | 7 (100.0%) |
| Total (Overall) | 42 (45.2%) | 51 (54.8%) |
Employment Industries by Sex in Nazlini
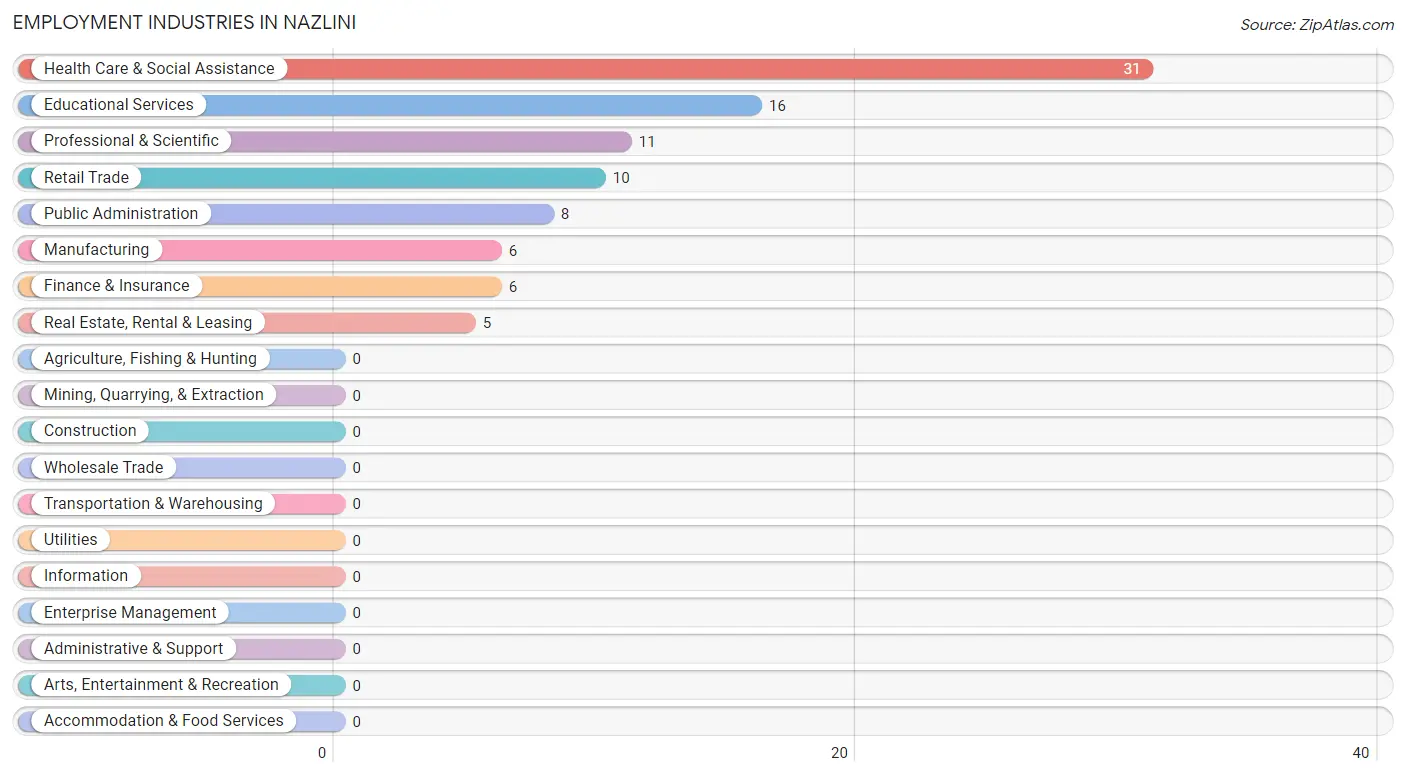
Employment Industries in Nazlini
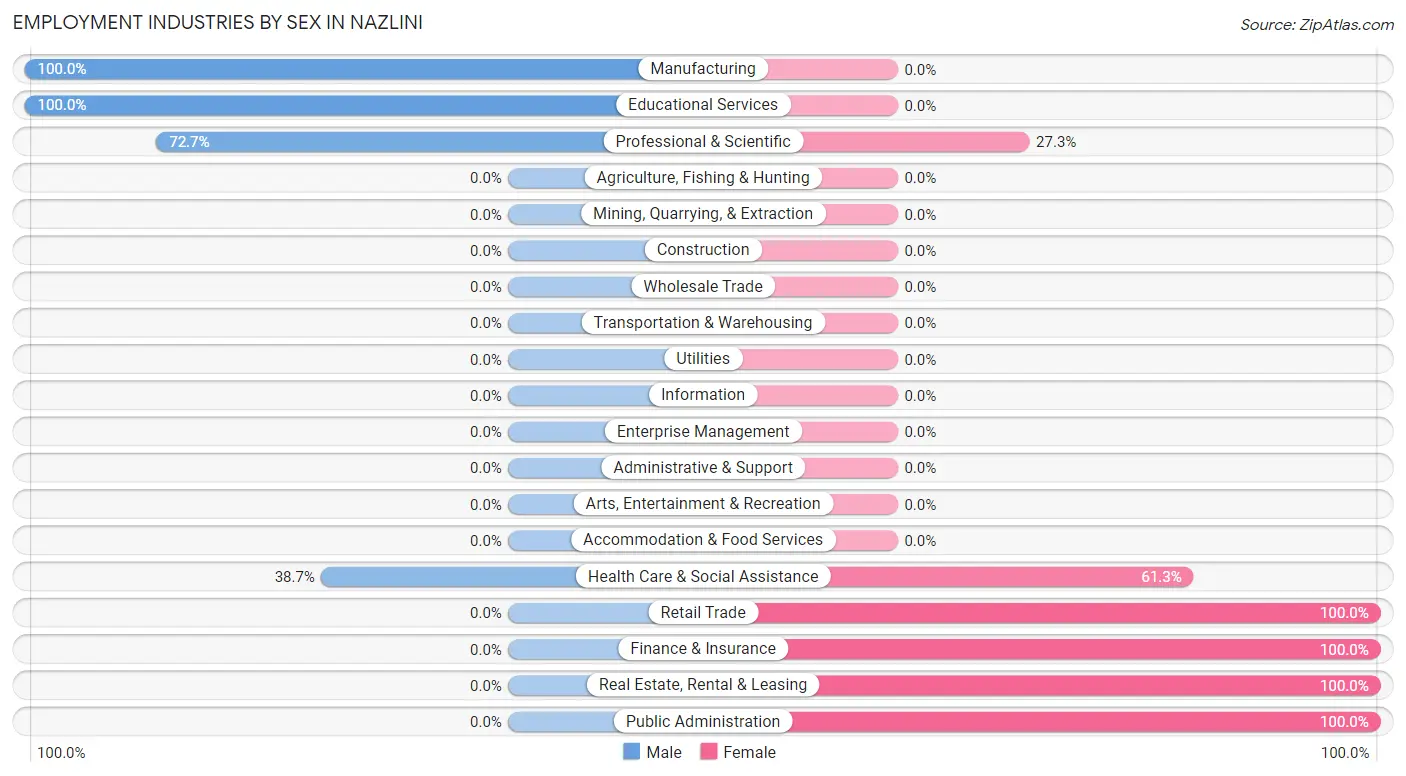
The major employment industries in Nazlini include Health Care & Social Assistance (31 | 33.3%), Educational Services (16 | 17.2%), Professional & Scientific (11 | 11.8%), Retail Trade (10 | 10.7%), and Public Administration (8 | 8.6%).
Employment Industries by Sex in Nazlini
The Nazlini industries that see more men than women are Manufacturing (100.0%), Educational Services (100.0%), and Professional & Scientific (72.7%), whereas the industries that tend to have a higher number of women are Retail Trade (100.0%), Finance & Insurance (100.0%), and Real Estate, Rental & Leasing (100.0%).
| Industry | Male | Female |
| Agriculture, Fishing & Hunting | 0 (0.0%) | 0 (0.0%) |
| Mining, Quarrying, & Extraction | 0 (0.0%) | 0 (0.0%) |
| Construction | 0 (0.0%) | 0 (0.0%) |
| Manufacturing | 6 (100.0%) | 0 (0.0%) |
| Wholesale Trade | 0 (0.0%) | 0 (0.0%) |
| Retail Trade | 0 (0.0%) | 10 (100.0%) |
| Transportation & Warehousing | 0 (0.0%) | 0 (0.0%) |
| Utilities | 0 (0.0%) | 0 (0.0%) |
| Information | 0 (0.0%) | 0 (0.0%) |
| Finance & Insurance | 0 (0.0%) | 6 (100.0%) |
| Real Estate, Rental & Leasing | 0 (0.0%) | 5 (100.0%) |
| Professional & Scientific | 8 (72.7%) | 3 (27.3%) |
| Enterprise Management | 0 (0.0%) | 0 (0.0%) |
| Administrative & Support | 0 (0.0%) | 0 (0.0%) |
| Educational Services | 16 (100.0%) | 0 (0.0%) |
| Health Care & Social Assistance | 12 (38.7%) | 19 (61.3%) |
| Arts, Entertainment & Recreation | 0 (0.0%) | 0 (0.0%) |
| Accommodation & Food Services | 0 (0.0%) | 0 (0.0%) |
| Public Administration | 0 (0.0%) | 8 (100.0%) |
| Total | 42 (45.2%) | 51 (54.8%) |
Education in Nazlini
School Enrollment in Nazlini
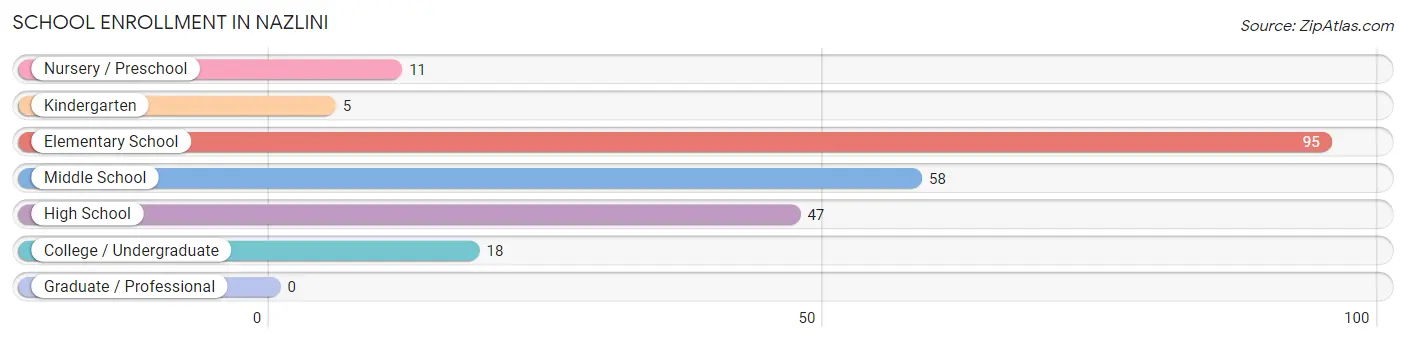
The most common levels of schooling among the 234 students in Nazlini are elementary school (95 | 40.6%), middle school (58 | 24.8%), and high school (47 | 20.1%).
| School Level | # Students | % Students |
| Nursery / Preschool | 11 | 4.7% |
| Kindergarten | 5 | 2.1% |
| Elementary School | 95 | 40.6% |
| Middle School | 58 | 24.8% |
| High School | 47 | 20.1% |
| College / Undergraduate | 18 | 7.7% |
| Graduate / Professional | 0 | 0.0% |
| Total | 234 | 100.0% |
School Enrollment by Age by Funding Source in Nazlini
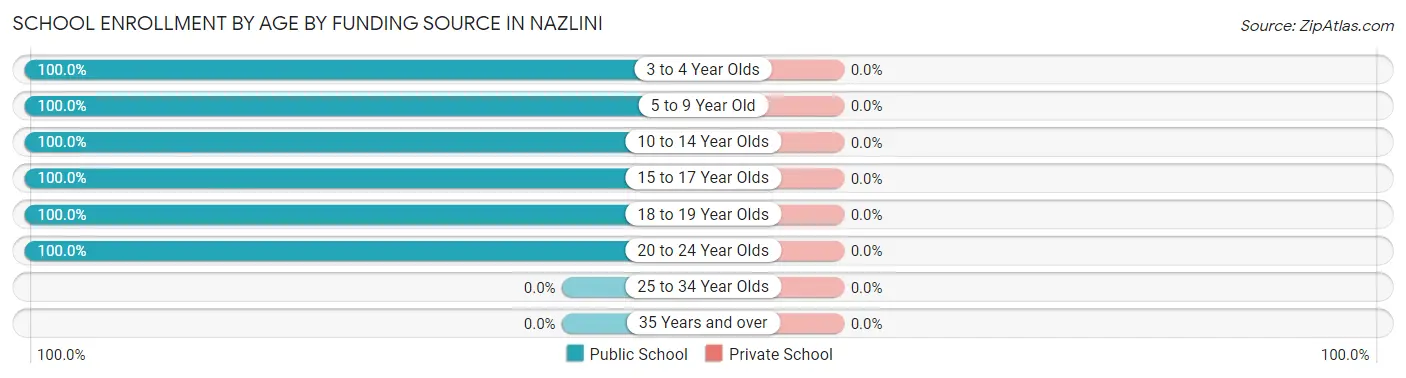
| Age Bracket | Public School | Private School |
| 3 to 4 Year Olds | 6 (100.0%) | 0 (0.0%) |
| 5 to 9 Year Old | 96 (100.0%) | 0 (0.0%) |
| 10 to 14 Year Olds | 72 (100.0%) | 0 (0.0%) |
| 15 to 17 Year Olds | 21 (100.0%) | 0 (0.0%) |
| 18 to 19 Year Olds | 32 (100.0%) | 0 (0.0%) |
| 20 to 24 Year Olds | 7 (100.0%) | 0 (0.0%) |
| 25 to 34 Year Olds | 0 (0.0%) | 0 (0.0%) |
| 35 Years and over | 0 (0.0%) | 0 (0.0%) |
| Total | 234 (100.0%) | 0 (0.0%) |
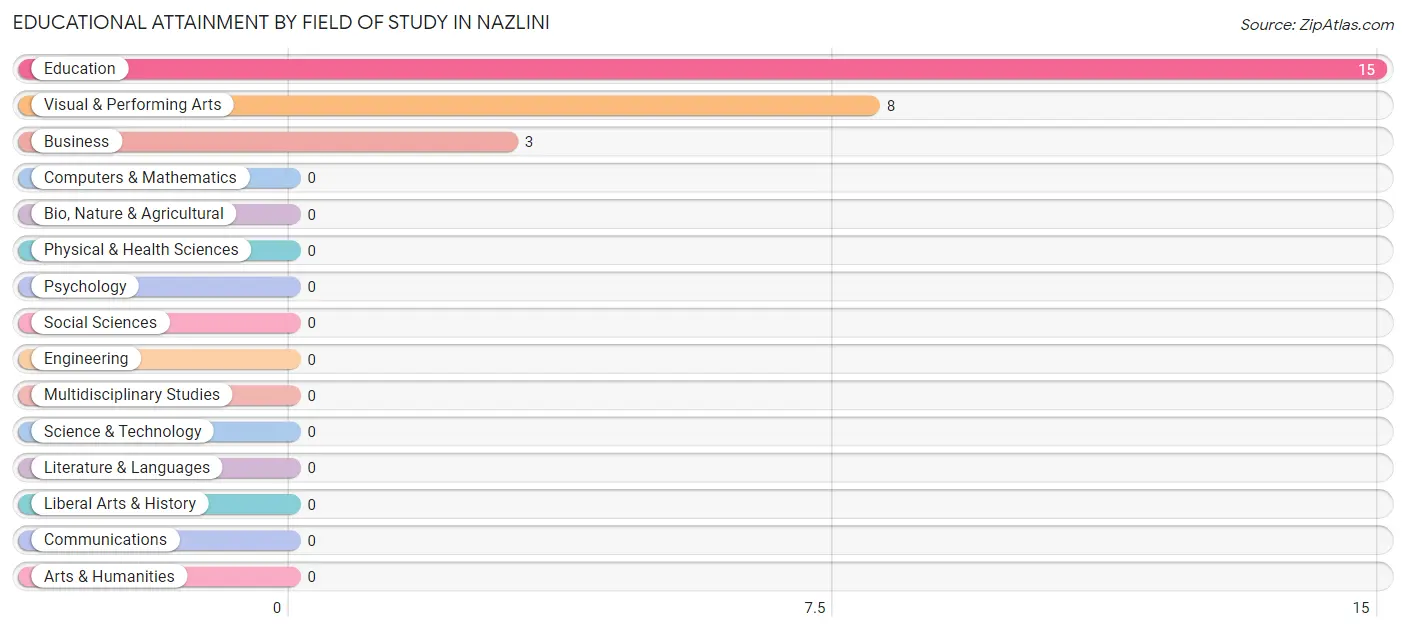
Educational Attainment by Field of Study in Nazlini
Education (15 | 57.7%), visual & performing arts (8 | 30.8%), and business (3 | 11.5%) are the most common fields of study among 26 individuals in Nazlini who have obtained a bachelor's degree or higher.
| Field of Study | # Graduates | % Graduates |
| Computers & Mathematics | 0 | 0.0% |
| Bio, Nature & Agricultural | 0 | 0.0% |
| Physical & Health Sciences | 0 | 0.0% |
| Psychology | 0 | 0.0% |
| Social Sciences | 0 | 0.0% |
| Engineering | 0 | 0.0% |
| Multidisciplinary Studies | 0 | 0.0% |
| Science & Technology | 0 | 0.0% |
| Business | 3 | 11.5% |
| Education | 15 | 57.7% |
| Literature & Languages | 0 | 0.0% |
| Liberal Arts & History | 0 | 0.0% |
| Visual & Performing Arts | 8 | 30.8% |
| Communications | 0 | 0.0% |
| Arts & Humanities | 0 | 0.0% |
| Total | 26 | 100.0% |
Transportation & Commute in Nazlini
Vehicle Availability by Sex in Nazlini
The most prevalent vehicle ownership categories in Nazlini are males with 4 vehicles (14, accounting for 33.3%) and females with 4 vehicles (8, making up 27.5%).
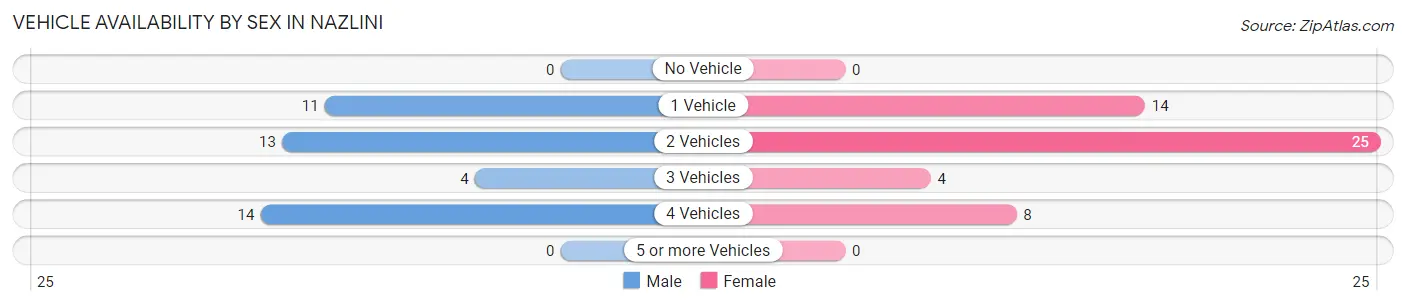
| Vehicles Available | Male | Female |
| No Vehicle | 0 (0.0%) | 0 (0.0%) |
| 1 Vehicle | 11 (26.2%) | 14 (27.5%) |
| 2 Vehicles | 13 (30.9%) | 25 (49.0%) |
| 3 Vehicles | 4 (9.5%) | 4 (7.8%) |
| 4 Vehicles | 14 (33.3%) | 8 (15.7%) |
| 5 or more Vehicles | 0 (0.0%) | 0 (0.0%) |
| Total | 42 (100.0%) | 51 (100.0%) |
Commute Time in Nazlini
The most frequently occuring commute durations in Nazlini are 30 to 34 minutes (25 commuters, 36.2%), 5 to 9 minutes (16 commuters, 23.2%), and 60 to 89 minutes (9 commuters, 13.0%).
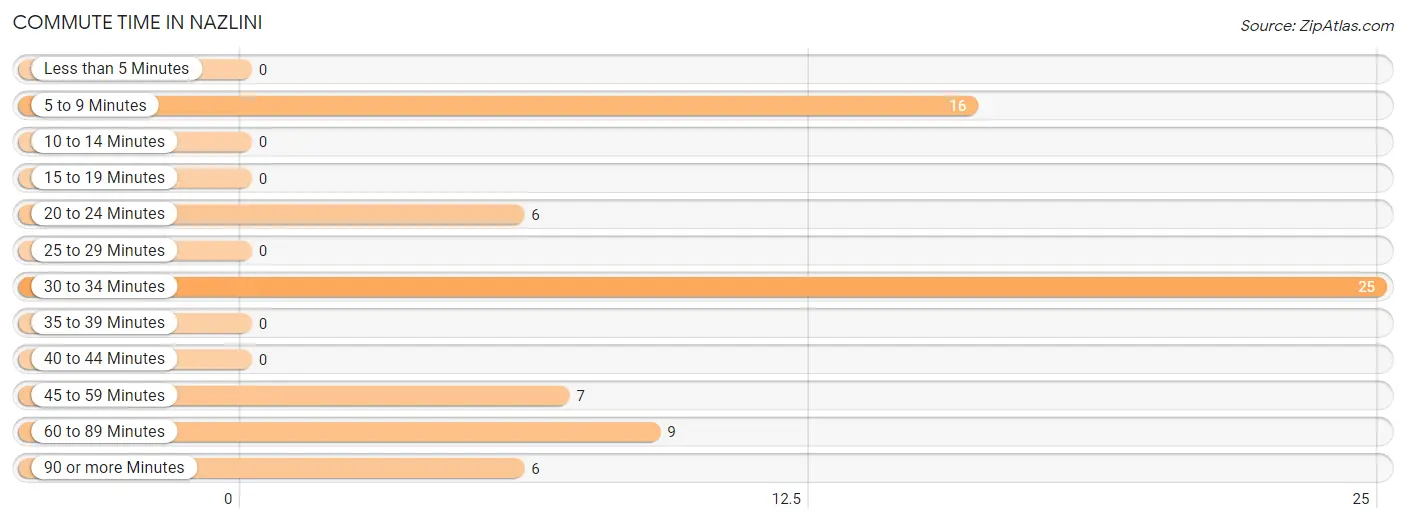
| Commute Time | # Commuters | % Commuters |
| Less than 5 Minutes | 0 | 0.0% |
| 5 to 9 Minutes | 16 | 23.2% |
| 10 to 14 Minutes | 0 | 0.0% |
| 15 to 19 Minutes | 0 | 0.0% |
| 20 to 24 Minutes | 6 | 8.7% |
| 25 to 29 Minutes | 0 | 0.0% |
| 30 to 34 Minutes | 25 | 36.2% |
| 35 to 39 Minutes | 0 | 0.0% |
| 40 to 44 Minutes | 0 | 0.0% |
| 45 to 59 Minutes | 7 | 10.1% |
| 60 to 89 Minutes | 9 | 13.0% |
| 90 or more Minutes | 6 | 8.7% |
Commute Time by Sex in Nazlini
The most common commute times in Nazlini are 30 to 34 minutes (17 commuters, 40.5%) for males and 30 to 34 minutes (8 commuters, 29.6%) for females.
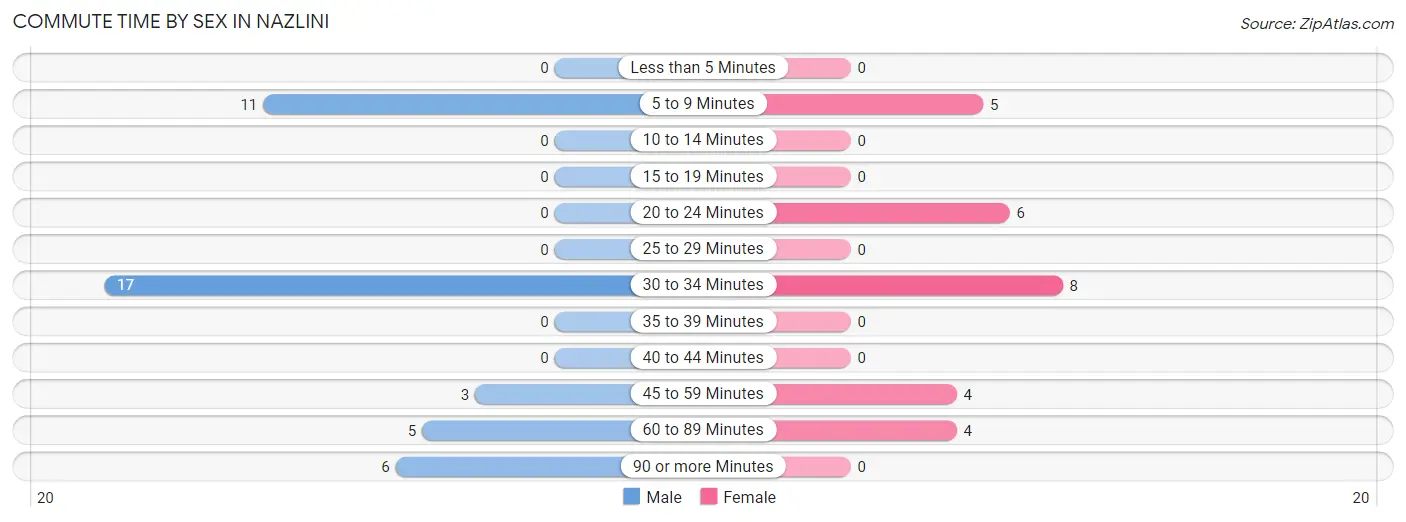
| Commute Time | Male | Female |
| Less than 5 Minutes | 0 (0.0%) | 0 (0.0%) |
| 5 to 9 Minutes | 11 (26.2%) | 5 (18.5%) |
| 10 to 14 Minutes | 0 (0.0%) | 0 (0.0%) |
| 15 to 19 Minutes | 0 (0.0%) | 0 (0.0%) |
| 20 to 24 Minutes | 0 (0.0%) | 6 (22.2%) |
| 25 to 29 Minutes | 0 (0.0%) | 0 (0.0%) |
| 30 to 34 Minutes | 17 (40.5%) | 8 (29.6%) |
| 35 to 39 Minutes | 0 (0.0%) | 0 (0.0%) |
| 40 to 44 Minutes | 0 (0.0%) | 0 (0.0%) |
| 45 to 59 Minutes | 3 (7.1%) | 4 (14.8%) |
| 60 to 89 Minutes | 5 (11.9%) | 4 (14.8%) |
| 90 or more Minutes | 6 (14.3%) | 0 (0.0%) |
Time of Departure to Work by Sex in Nazlini
The most frequent times of departure to work in Nazlini are 7:00 AM to 7:29 AM (19, 45.2%) for males and 7:00 AM to 7:29 AM (24, 88.9%) for females.
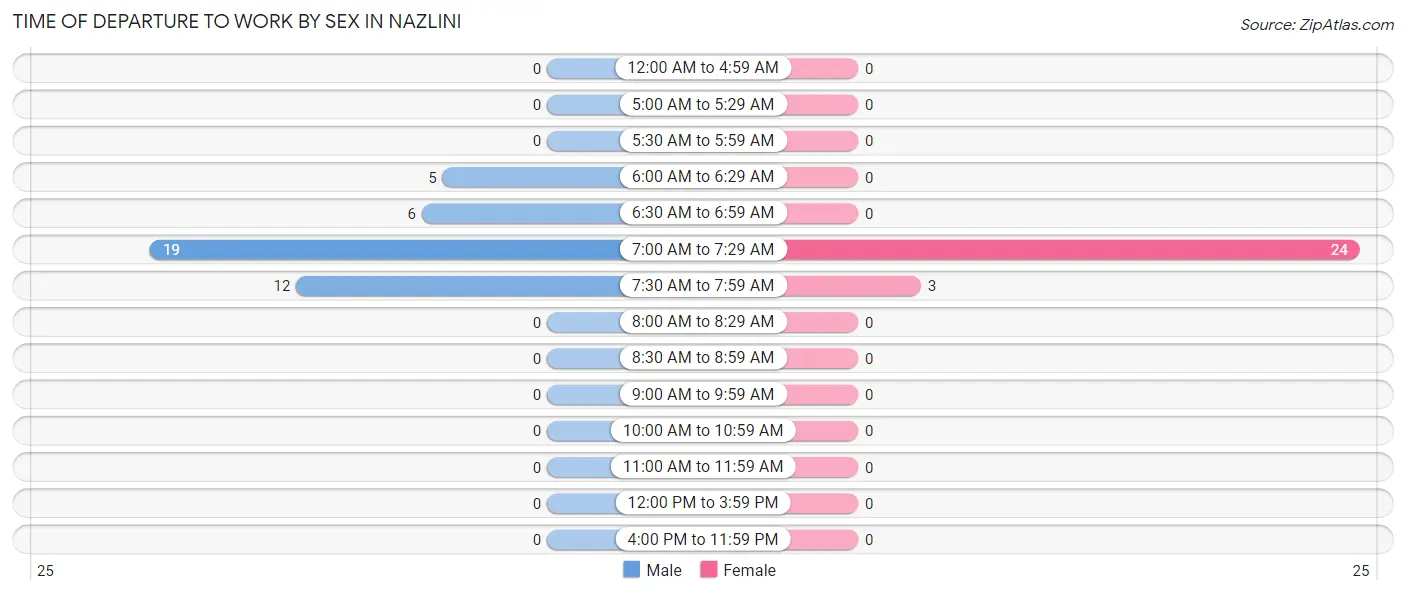
| Time of Departure | Male | Female |
| 12:00 AM to 4:59 AM | 0 (0.0%) | 0 (0.0%) |
| 5:00 AM to 5:29 AM | 0 (0.0%) | 0 (0.0%) |
| 5:30 AM to 5:59 AM | 0 (0.0%) | 0 (0.0%) |
| 6:00 AM to 6:29 AM | 5 (11.9%) | 0 (0.0%) |
| 6:30 AM to 6:59 AM | 6 (14.3%) | 0 (0.0%) |
| 7:00 AM to 7:29 AM | 19 (45.2%) | 24 (88.9%) |
| 7:30 AM to 7:59 AM | 12 (28.6%) | 3 (11.1%) |
| 8:00 AM to 8:29 AM | 0 (0.0%) | 0 (0.0%) |
| 8:30 AM to 8:59 AM | 0 (0.0%) | 0 (0.0%) |
| 9:00 AM to 9:59 AM | 0 (0.0%) | 0 (0.0%) |
| 10:00 AM to 10:59 AM | 0 (0.0%) | 0 (0.0%) |
| 11:00 AM to 11:59 AM | 0 (0.0%) | 0 (0.0%) |
| 12:00 PM to 3:59 PM | 0 (0.0%) | 0 (0.0%) |
| 4:00 PM to 11:59 PM | 0 (0.0%) | 0 (0.0%) |
| Total | 42 (100.0%) | 27 (100.0%) |
Housing Occupancy in Nazlini
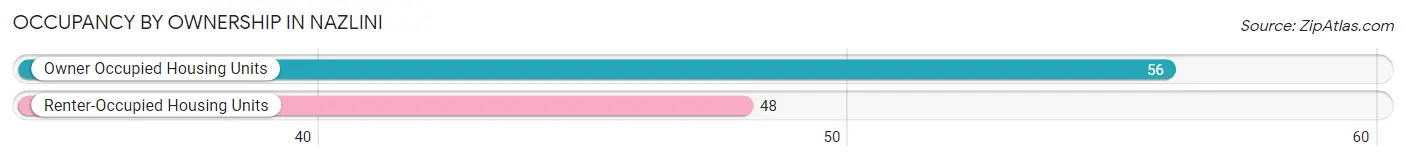
Occupancy by Ownership in Nazlini
Of the total 104 dwellings in Nazlini, owner-occupied units account for 56 (53.8%), while renter-occupied units make up 48 (46.2%).
| Occupancy | # Housing Units | % Housing Units |
| Owner Occupied Housing Units | 56 | 53.8% |
| Renter-Occupied Housing Units | 48 | 46.2% |
| Total Occupied Housing Units | 104 | 100.0% |
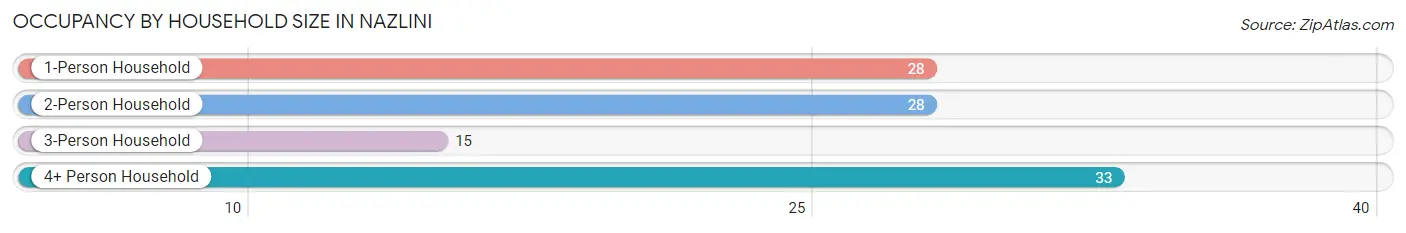
Occupancy by Household Size in Nazlini
| Household Size | # Housing Units | % Housing Units |
| 1-Person Household | 28 | 26.9% |
| 2-Person Household | 28 | 26.9% |
| 3-Person Household | 15 | 14.4% |
| 4+ Person Household | 33 | 31.7% |
| Total Housing Units | 104 | 100.0% |
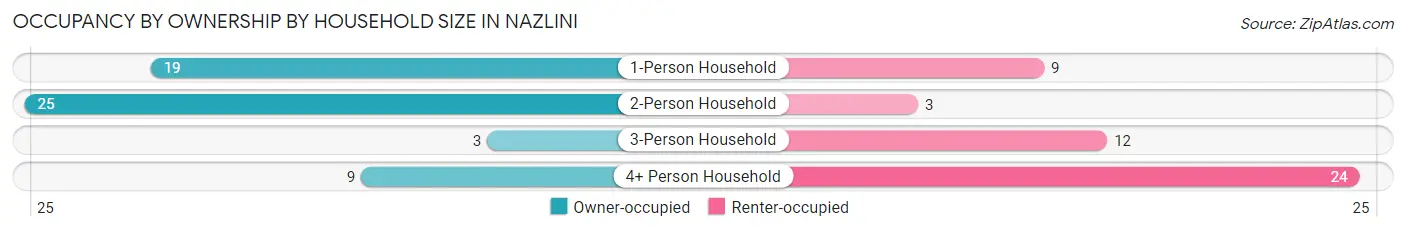
Occupancy by Ownership by Household Size in Nazlini
| Household Size | Owner-occupied | Renter-occupied |
| 1-Person Household | 19 (67.9%) | 9 (32.1%) |
| 2-Person Household | 25 (89.3%) | 3 (10.7%) |
| 3-Person Household | 3 (20.0%) | 12 (80.0%) |
| 4+ Person Household | 9 (27.3%) | 24 (72.7%) |
| Total Housing Units | 56 (53.8%) | 48 (46.2%) |
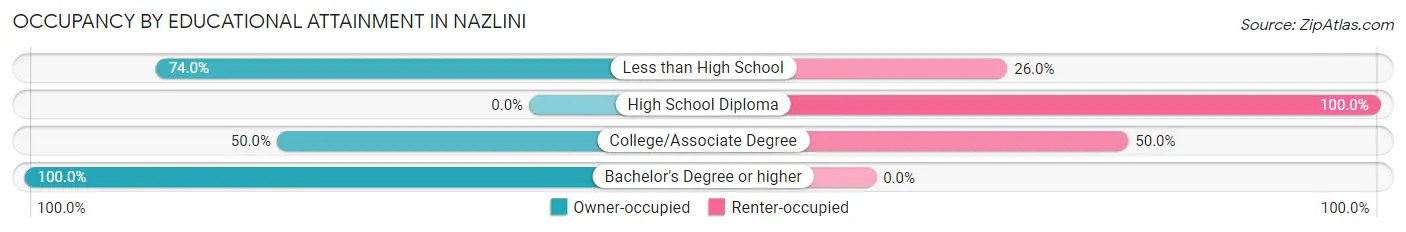
Occupancy by Educational Attainment in Nazlini
| Household Size | Owner-occupied | Renter-occupied |
| Less than High School | 37 (74.0%) | 13 (26.0%) |
| High School Diploma | 0 (0.0%) | 20 (100.0%) |
| College/Associate Degree | 15 (50.0%) | 15 (50.0%) |
| Bachelor's Degree or higher | 4 (100.0%) | 0 (0.0%) |
Occupancy by Age of Householder in Nazlini
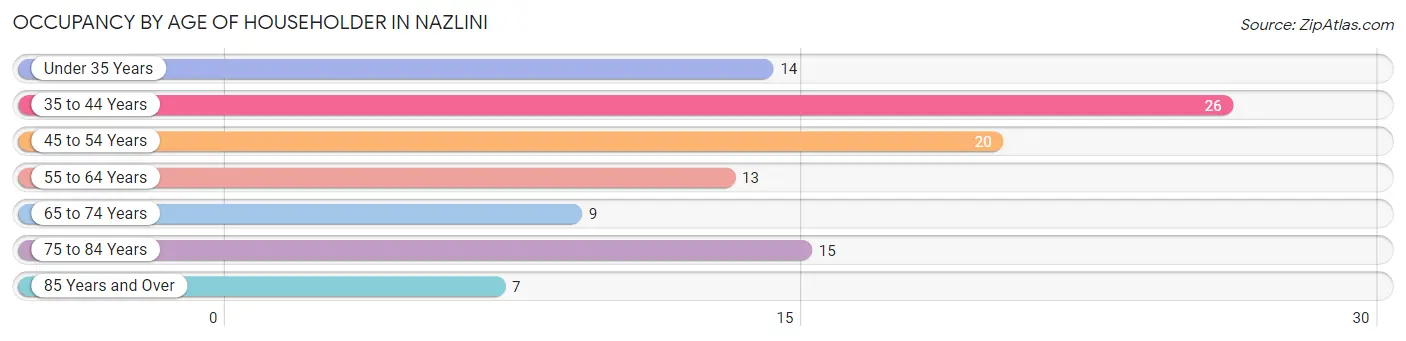
| Age Bracket | # Households | % Households |
| Under 35 Years | 14 | 13.5% |
| 35 to 44 Years | 26 | 25.0% |
| 45 to 54 Years | 20 | 19.2% |
| 55 to 64 Years | 13 | 12.5% |
| 65 to 74 Years | 9 | 8.6% |
| 75 to 84 Years | 15 | 14.4% |
| 85 Years and Over | 7 | 6.7% |
| Total | 104 | 100.0% |
Housing Finances in Nazlini
Median Income by Occupancy in Nazlini
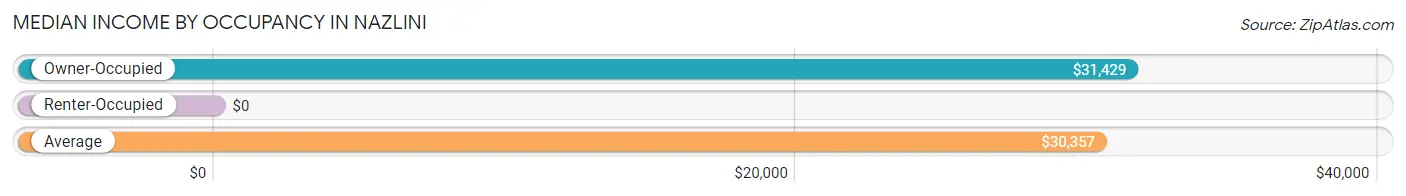
| Occupancy Type | # Households | Median Income |
| Owner-Occupied | 56 (53.8%) | $31,429 |
| Renter-Occupied | 48 (46.2%) | $0 |
| Average | 104 (100.0%) | $30,357 |
Occupancy by Householder Income Bracket in Nazlini
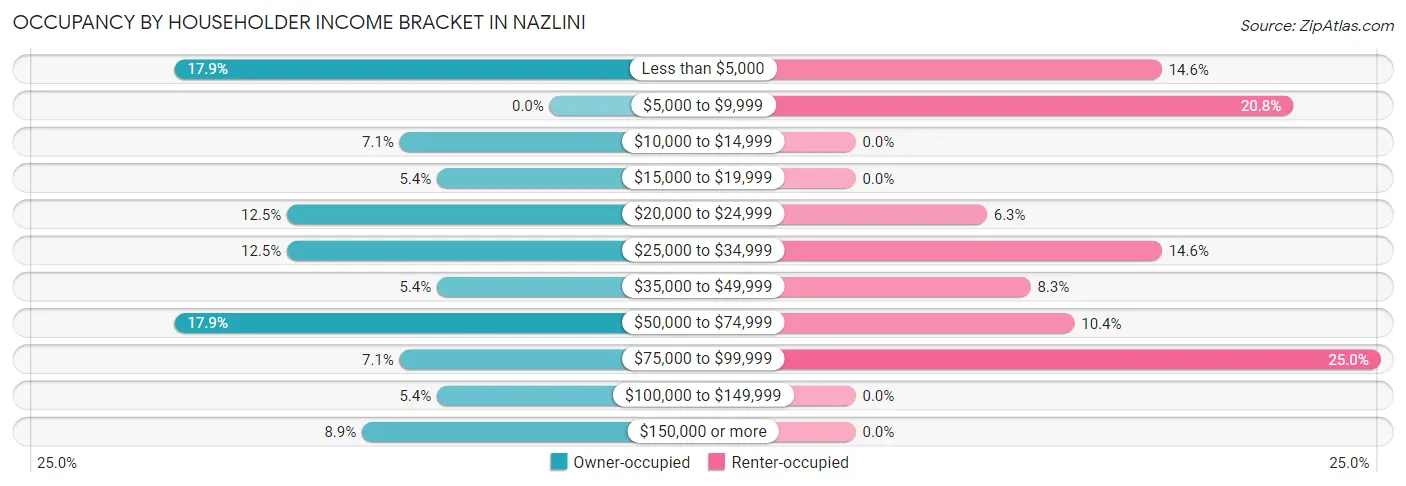
| Income Bracket | Owner-occupied | Renter-occupied |
| Less than $5,000 | 10 (17.9%) | 7 (14.6%) |
| $5,000 to $9,999 | 0 (0.0%) | 10 (20.8%) |
| $10,000 to $14,999 | 4 (7.1%) | 0 (0.0%) |
| $15,000 to $19,999 | 3 (5.4%) | 0 (0.0%) |
| $20,000 to $24,999 | 7 (12.5%) | 3 (6.2%) |
| $25,000 to $34,999 | 7 (12.5%) | 7 (14.6%) |
| $35,000 to $49,999 | 3 (5.4%) | 4 (8.3%) |
| $50,000 to $74,999 | 10 (17.9%) | 5 (10.4%) |
| $75,000 to $99,999 | 4 (7.1%) | 12 (25.0%) |
| $100,000 to $149,999 | 3 (5.4%) | 0 (0.0%) |
| $150,000 or more | 5 (8.9%) | 0 (0.0%) |
| Total | 56 (100.0%) | 48 (100.0%) |
Monthly Housing Cost Tiers in Nazlini
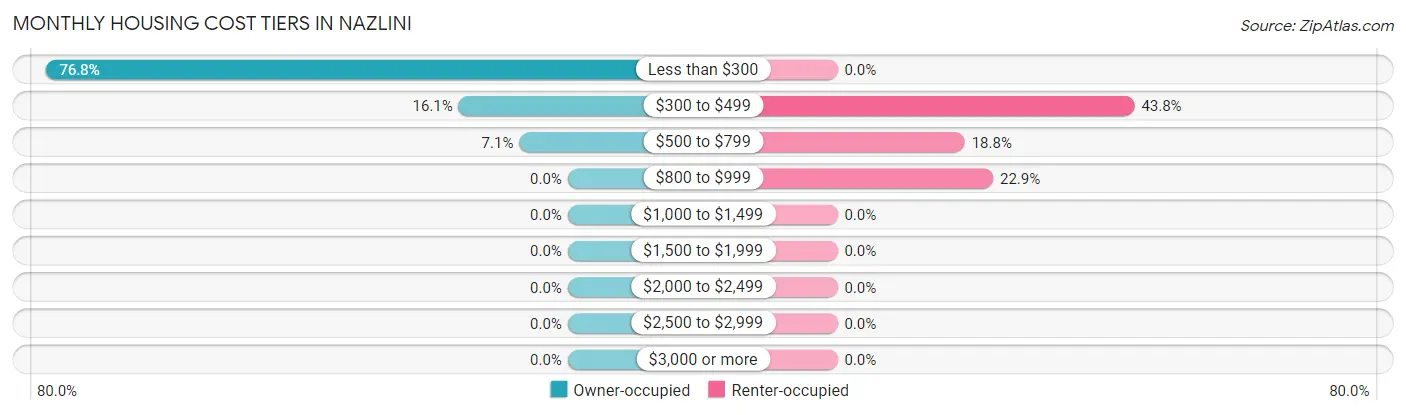
| Monthly Cost | Owner-occupied | Renter-occupied |
| Less than $300 | 43 (76.8%) | 0 (0.0%) |
| $300 to $499 | 9 (16.1%) | 21 (43.8%) |
| $500 to $799 | 4 (7.1%) | 9 (18.8%) |
| $800 to $999 | 0 (0.0%) | 11 (22.9%) |
| $1,000 to $1,499 | 0 (0.0%) | 0 (0.0%) |
| $1,500 to $1,999 | 0 (0.0%) | 0 (0.0%) |
| $2,000 to $2,499 | 0 (0.0%) | 0 (0.0%) |
| $2,500 to $2,999 | 0 (0.0%) | 0 (0.0%) |
| $3,000 or more | 0 (0.0%) | 0 (0.0%) |
| Total | 56 (100.0%) | 48 (100.0%) |
Physical Housing Characteristics in Nazlini
Housing Structures in Nazlini
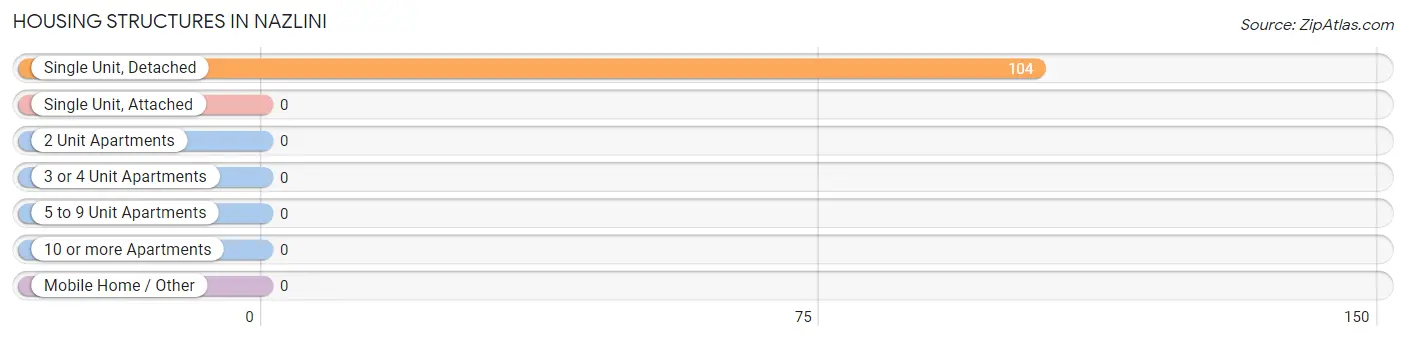
| Structure Type | # Housing Units | % Housing Units |
| Single Unit, Detached | 104 | 100.0% |
| Single Unit, Attached | 0 | 0.0% |
| 2 Unit Apartments | 0 | 0.0% |
| 3 or 4 Unit Apartments | 0 | 0.0% |
| 5 to 9 Unit Apartments | 0 | 0.0% |
| 10 or more Apartments | 0 | 0.0% |
| Mobile Home / Other | 0 | 0.0% |
| Total | 104 | 100.0% |
Housing Structures by Occupancy in Nazlini
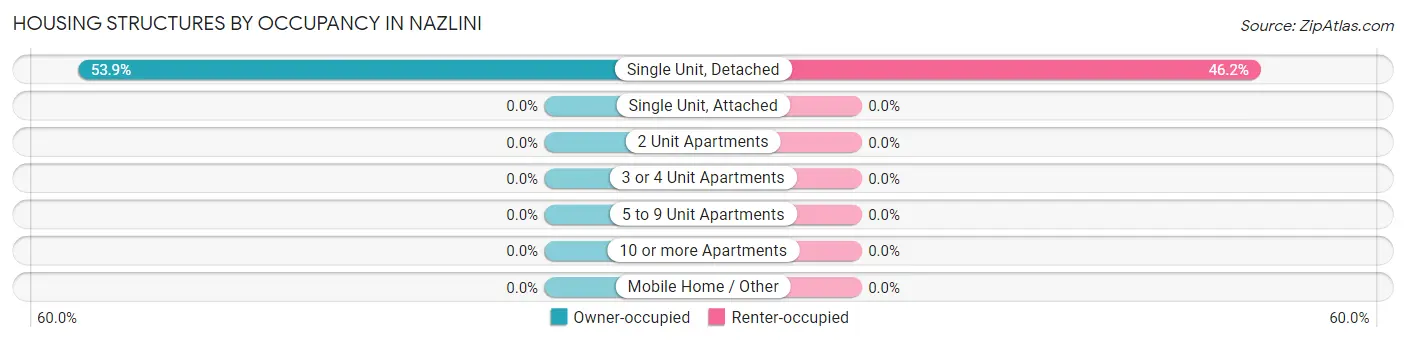
| Structure Type | Owner-occupied | Renter-occupied |
| Single Unit, Detached | 56 (53.8%) | 48 (46.2%) |
| Single Unit, Attached | 0 (0.0%) | 0 (0.0%) |
| 2 Unit Apartments | 0 (0.0%) | 0 (0.0%) |
| 3 or 4 Unit Apartments | 0 (0.0%) | 0 (0.0%) |
| 5 to 9 Unit Apartments | 0 (0.0%) | 0 (0.0%) |
| 10 or more Apartments | 0 (0.0%) | 0 (0.0%) |
| Mobile Home / Other | 0 (0.0%) | 0 (0.0%) |
| Total | 56 (53.8%) | 48 (46.2%) |
Housing Structures by Number of Rooms in Nazlini
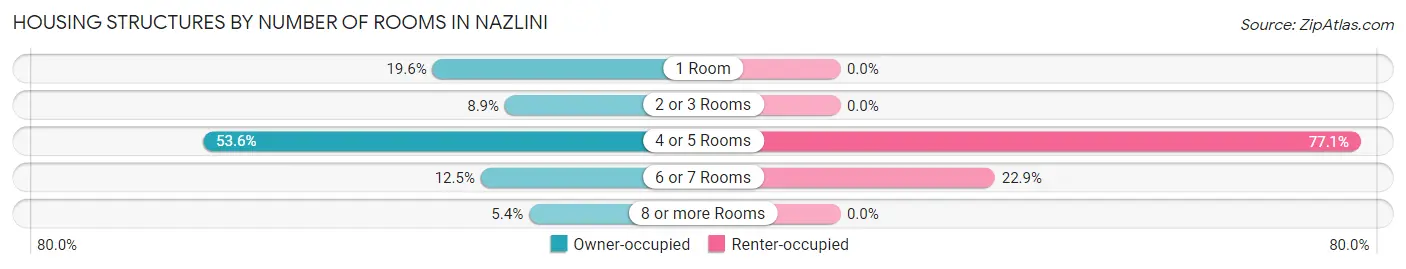
| Number of Rooms | Owner-occupied | Renter-occupied |
| 1 Room | 11 (19.6%) | 0 (0.0%) |
| 2 or 3 Rooms | 5 (8.9%) | 0 (0.0%) |
| 4 or 5 Rooms | 30 (53.6%) | 37 (77.1%) |
| 6 or 7 Rooms | 7 (12.5%) | 11 (22.9%) |
| 8 or more Rooms | 3 (5.4%) | 0 (0.0%) |
| Total | 56 (100.0%) | 48 (100.0%) |
Housing Structure by Heating Type in Nazlini
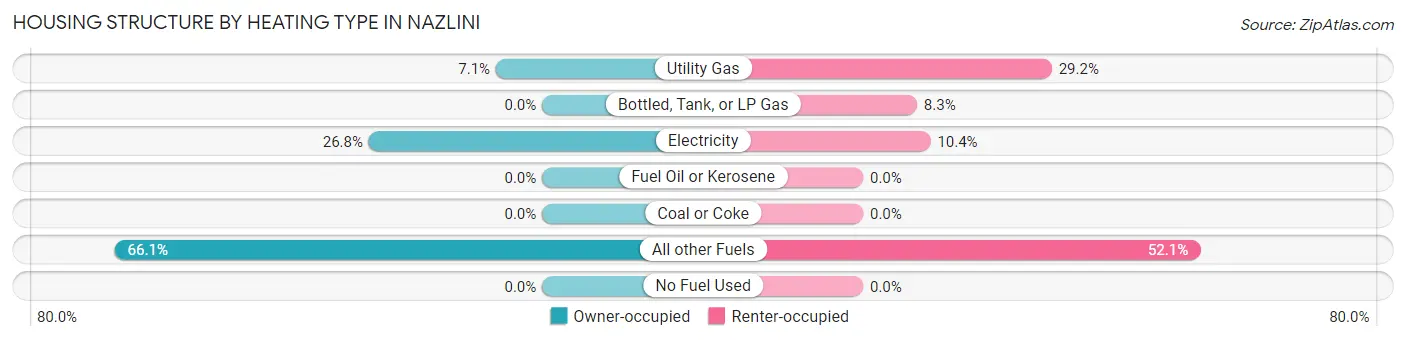
| Heating Type | Owner-occupied | Renter-occupied |
| Utility Gas | 4 (7.1%) | 14 (29.2%) |
| Bottled, Tank, or LP Gas | 0 (0.0%) | 4 (8.3%) |
| Electricity | 15 (26.8%) | 5 (10.4%) |
| Fuel Oil or Kerosene | 0 (0.0%) | 0 (0.0%) |
| Coal or Coke | 0 (0.0%) | 0 (0.0%) |
| All other Fuels | 37 (66.1%) | 25 (52.1%) |
| No Fuel Used | 0 (0.0%) | 0 (0.0%) |
| Total | 56 (100.0%) | 48 (100.0%) |
Household Vehicle Usage in Nazlini
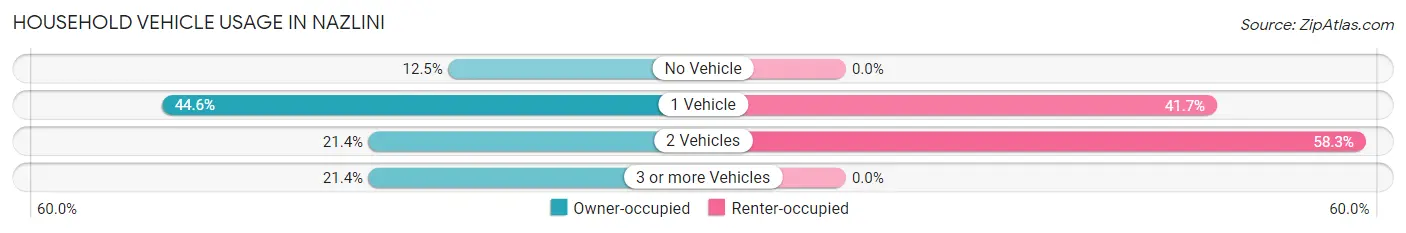
| Vehicles per Household | Owner-occupied | Renter-occupied |
| No Vehicle | 7 (12.5%) | 0 (0.0%) |
| 1 Vehicle | 25 (44.6%) | 20 (41.7%) |
| 2 Vehicles | 12 (21.4%) | 28 (58.3%) |
| 3 or more Vehicles | 12 (21.4%) | 0 (0.0%) |
| Total | 56 (100.0%) | 48 (100.0%) |
Real Estate & Mortgages in Nazlini
Real Estate and Mortgage Overview in Nazlini
| Characteristic | Without Mortgage | With Mortgage |
| Housing Units | 56 | 0 |
| Median Property Value | - | - |
| Median Household Income | $31,429 | $0 |
| Monthly Housing Costs | $205 | $0 |
| Real Estate Taxes | - | - |
Property Value by Mortgage Status in Nazlini
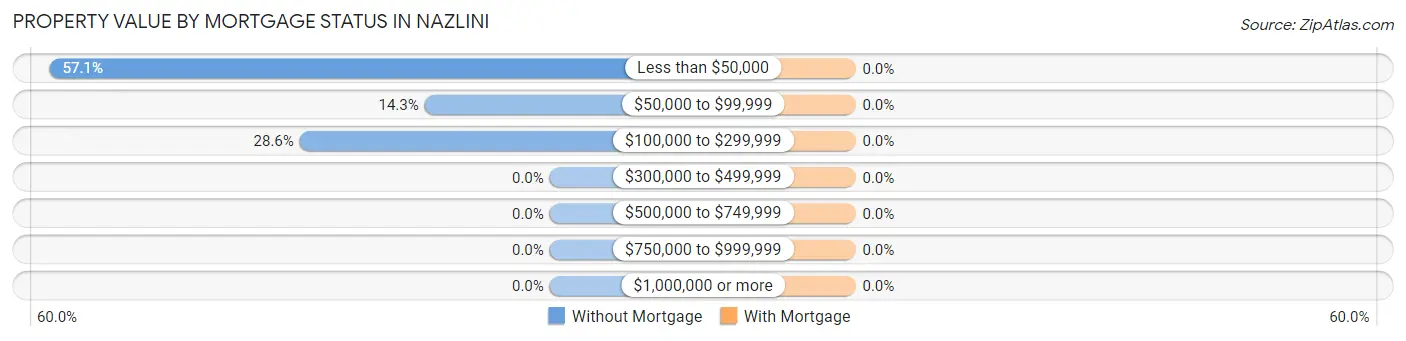
| Property Value | Without Mortgage | With Mortgage |
| Less than $50,000 | 32 (57.1%) | 0 (0.0%) |
| $50,000 to $99,999 | 8 (14.3%) | 0 (0.0%) |
| $100,000 to $299,999 | 16 (28.6%) | 0 (0.0%) |
| $300,000 to $499,999 | 0 (0.0%) | 0 (0.0%) |
| $500,000 to $749,999 | 0 (0.0%) | 0 (0.0%) |
| $750,000 to $999,999 | 0 (0.0%) | 0 (0.0%) |
| $1,000,000 or more | 0 (0.0%) | 0 (0.0%) |
| Total | 56 (100.0%) | 0 (0.0%) |
Household Income by Mortgage Status in Nazlini
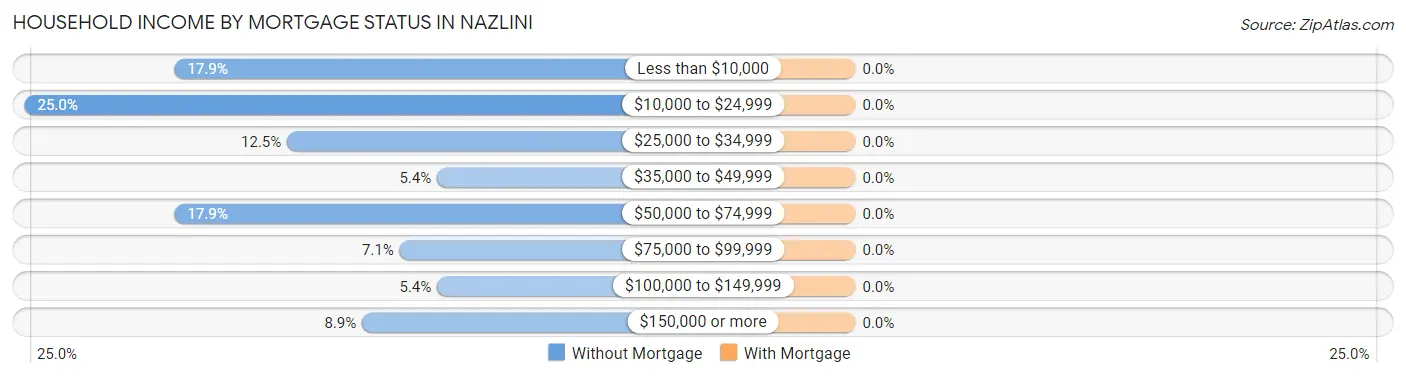
| Household Income | Without Mortgage | With Mortgage |
| Less than $10,000 | 10 (17.9%) | 0 (0.0%) |
| $10,000 to $24,999 | 14 (25.0%) | 0 (0.0%) |
| $25,000 to $34,999 | 7 (12.5%) | 0 (0.0%) |
| $35,000 to $49,999 | 3 (5.4%) | 0 (0.0%) |
| $50,000 to $74,999 | 10 (17.9%) | 0 (0.0%) |
| $75,000 to $99,999 | 4 (7.1%) | 0 (0.0%) |
| $100,000 to $149,999 | 3 (5.4%) | 0 (0.0%) |
| $150,000 or more | 5 (8.9%) | 0 (0.0%) |
| Total | 56 (100.0%) | 0 (0.0%) |
Property Value to Household Income Ratio in Nazlini
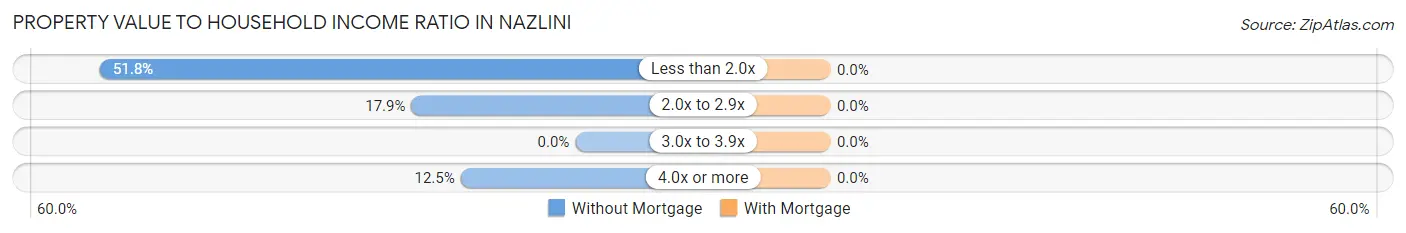
| Value-to-Income Ratio | Without Mortgage | With Mortgage |
| Less than 2.0x | 29 (51.8%) | 0 (0.0%) |
| 2.0x to 2.9x | 10 (17.9%) | 0 (0.0%) |
| 3.0x to 3.9x | 0 (0.0%) | 0 (0.0%) |
| 4.0x or more | 7 (12.5%) | 0 (0.0%) |
| Total | 56 (100.0%) | 0 (0.0%) |
Real Estate Taxes by Mortgage Status in Nazlini
| Property Taxes | Without Mortgage | With Mortgage |
| Less than $800 | 0 (0.0%) | 0 (0.0%) |
| $800 to $1,499 | 0 (0.0%) | 0 (0.0%) |
| $800 to $1,499 | 0 (0.0%) | 0 (0.0%) |
| Total | 56 (100.0%) | 0 (0.0%) |
Health & Disability in Nazlini
Health Insurance Coverage by Age in Nazlini
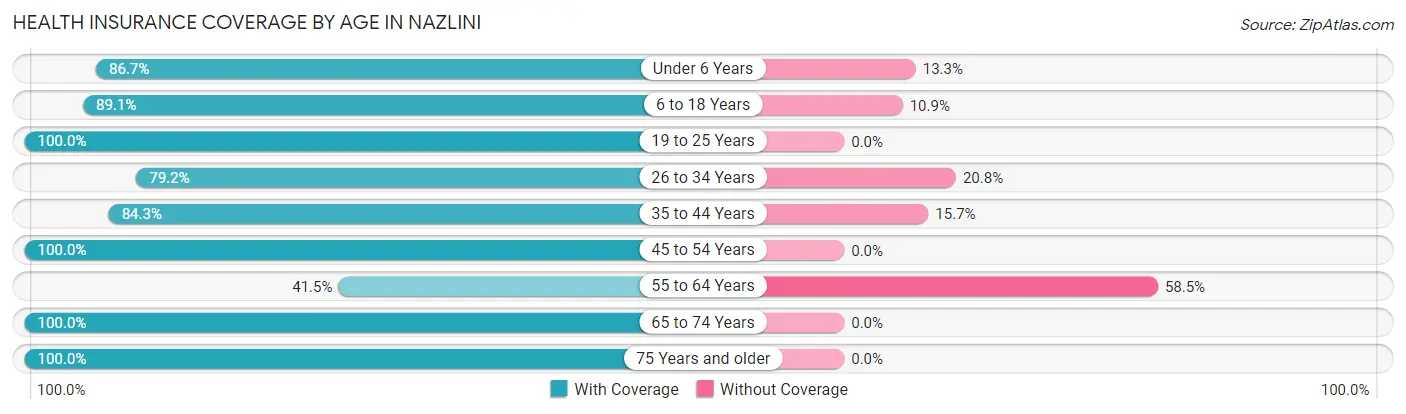
| Age Bracket | With Coverage | Without Coverage |
| Under 6 Years | 39 (86.7%) | 6 (13.3%) |
| 6 to 18 Years | 188 (89.1%) | 23 (10.9%) |
| 19 to 25 Years | 26 (100.0%) | 0 (0.0%) |
| 26 to 34 Years | 19 (79.2%) | 5 (20.8%) |
| 35 to 44 Years | 43 (84.3%) | 8 (15.7%) |
| 45 to 54 Years | 24 (100.0%) | 0 (0.0%) |
| 55 to 64 Years | 22 (41.5%) | 31 (58.5%) |
| 65 to 74 Years | 12 (100.0%) | 0 (0.0%) |
| 75 Years and older | 22 (100.0%) | 0 (0.0%) |
| Total | 395 (84.4%) | 73 (15.6%) |
Health Insurance Coverage by Citizenship Status in Nazlini
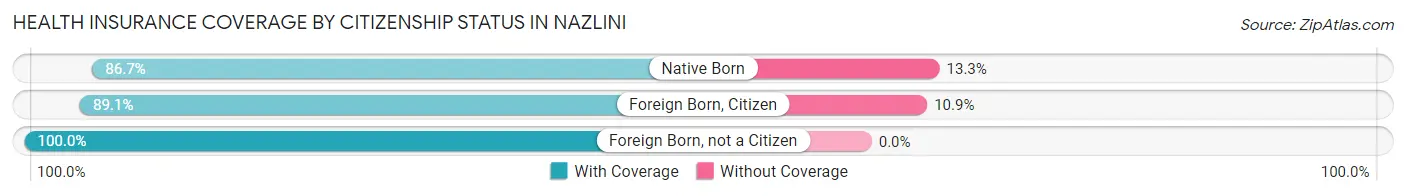
| Citizenship Status | With Coverage | Without Coverage |
| Native Born | 39 (86.7%) | 6 (13.3%) |
| Foreign Born, Citizen | 188 (89.1%) | 23 (10.9%) |
| Foreign Born, not a Citizen | 26 (100.0%) | 0 (0.0%) |
Health Insurance Coverage by Household Income in Nazlini
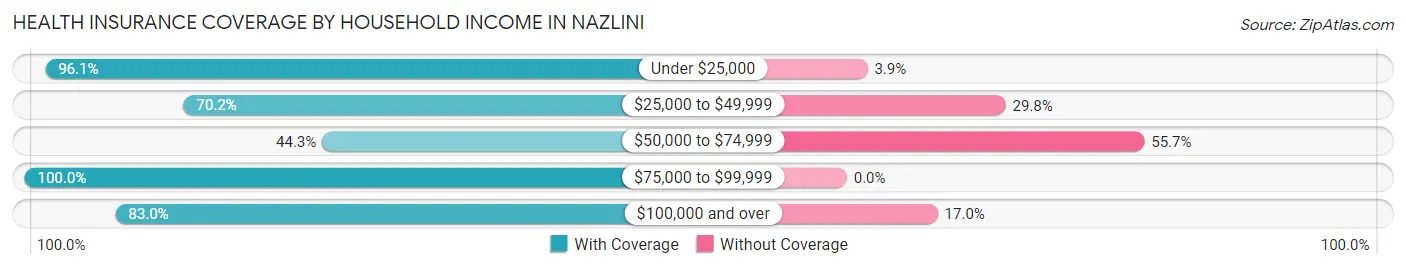
| Household Income | With Coverage | Without Coverage |
| Under $25,000 | 149 (96.1%) | 6 (3.9%) |
| $25,000 to $49,999 | 59 (70.2%) | 25 (29.8%) |
| $50,000 to $74,999 | 27 (44.3%) | 34 (55.7%) |
| $75,000 to $99,999 | 121 (100.0%) | 0 (0.0%) |
| $100,000 and over | 39 (83.0%) | 8 (17.0%) |
Public vs Private Health Insurance Coverage by Age in Nazlini
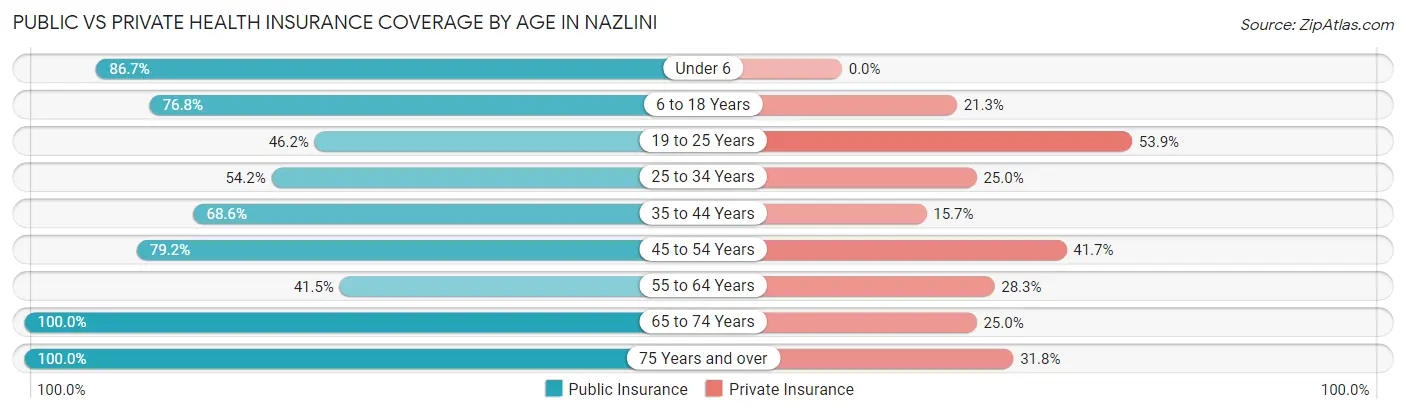
| Age Bracket | Public Insurance | Private Insurance |
| Under 6 | 39 (86.7%) | 0 (0.0%) |
| 6 to 18 Years | 162 (76.8%) | 45 (21.3%) |
| 19 to 25 Years | 12 (46.2%) | 14 (53.8%) |
| 25 to 34 Years | 13 (54.2%) | 6 (25.0%) |
| 35 to 44 Years | 35 (68.6%) | 8 (15.7%) |
| 45 to 54 Years | 19 (79.2%) | 10 (41.7%) |
| 55 to 64 Years | 22 (41.5%) | 15 (28.3%) |
| 65 to 74 Years | 12 (100.0%) | 3 (25.0%) |
| 75 Years and over | 22 (100.0%) | 7 (31.8%) |
| Total | 336 (71.8%) | 108 (23.1%) |
Disability Status by Sex by Age in Nazlini
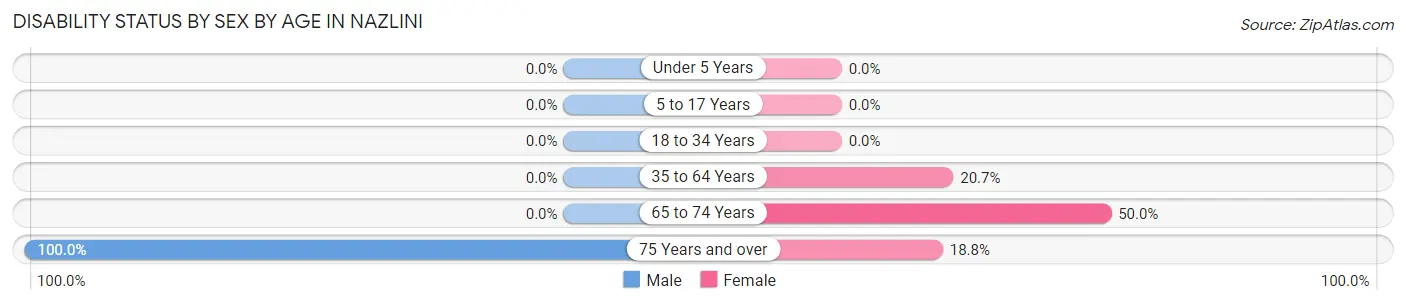
| Age Bracket | Male | Female |
| Under 5 Years | 0 (0.0%) | 0 (0.0%) |
| 5 to 17 Years | 0 (0.0%) | 0 (0.0%) |
| 18 to 34 Years | 0 (0.0%) | 0 (0.0%) |
| 35 to 64 Years | 0 (0.0%) | 18 (20.7%) |
| 65 to 74 Years | 0 (0.0%) | 3 (50.0%) |
| 75 Years and over | 6 (100.0%) | 3 (18.8%) |
Disability Class by Sex by Age in Nazlini
Disability Class: Hearing Difficulty
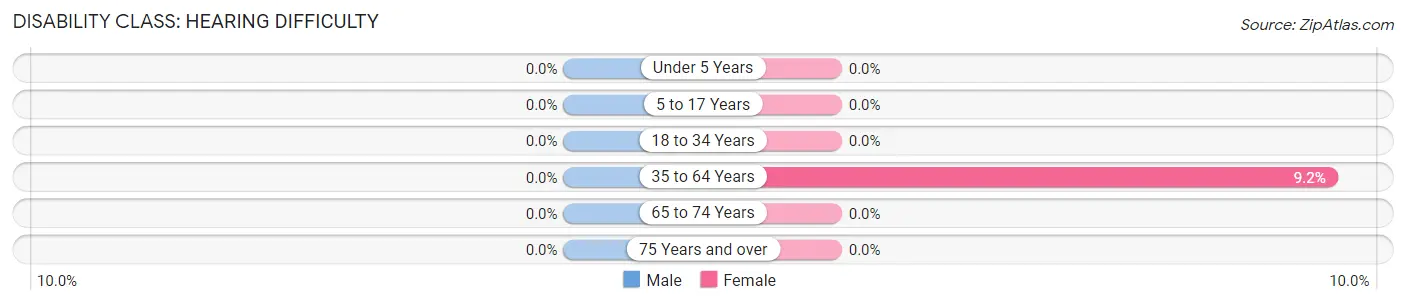
| Age Bracket | Male | Female |
| Under 5 Years | 0 (0.0%) | 0 (0.0%) |
| 5 to 17 Years | 0 (0.0%) | 0 (0.0%) |
| 18 to 34 Years | 0 (0.0%) | 0 (0.0%) |
| 35 to 64 Years | 0 (0.0%) | 8 (9.2%) |
| 65 to 74 Years | 0 (0.0%) | 0 (0.0%) |
| 75 Years and over | 0 (0.0%) | 0 (0.0%) |
Disability Class: Vision Difficulty
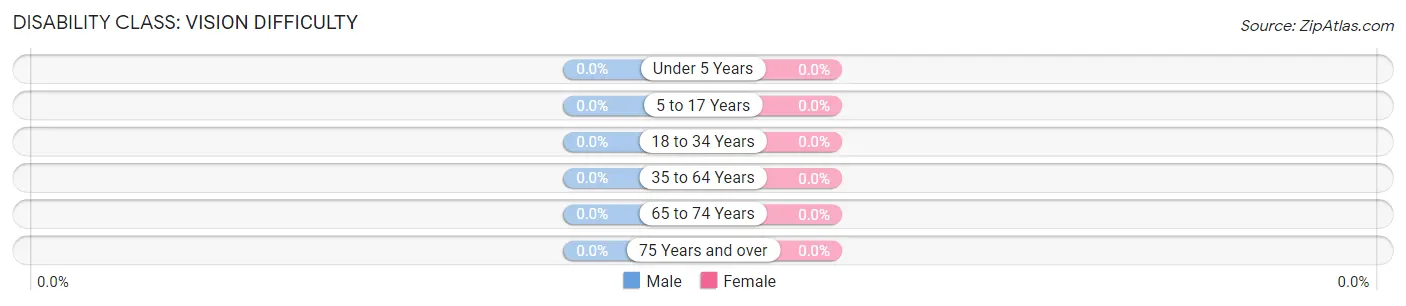
| Age Bracket | Male | Female |
| Under 5 Years | 0 (0.0%) | 0 (0.0%) |
| 5 to 17 Years | 0 (0.0%) | 0 (0.0%) |
| 18 to 34 Years | 0 (0.0%) | 0 (0.0%) |
| 35 to 64 Years | 0 (0.0%) | 0 (0.0%) |
| 65 to 74 Years | 0 (0.0%) | 0 (0.0%) |
| 75 Years and over | 0 (0.0%) | 0 (0.0%) |
Disability Class: Cognitive Difficulty
| Age Bracket | Male | Female |
| 5 to 17 Years | 0 (0.0%) | 0 (0.0%) |
| 18 to 34 Years | 0 (0.0%) | 0 (0.0%) |
| 35 to 64 Years | 0 (0.0%) | 0 (0.0%) |
| 65 to 74 Years | 0 (0.0%) | 0 (0.0%) |
| 75 Years and over | 0 (0.0%) | 0 (0.0%) |
Disability Class: Ambulatory Difficulty
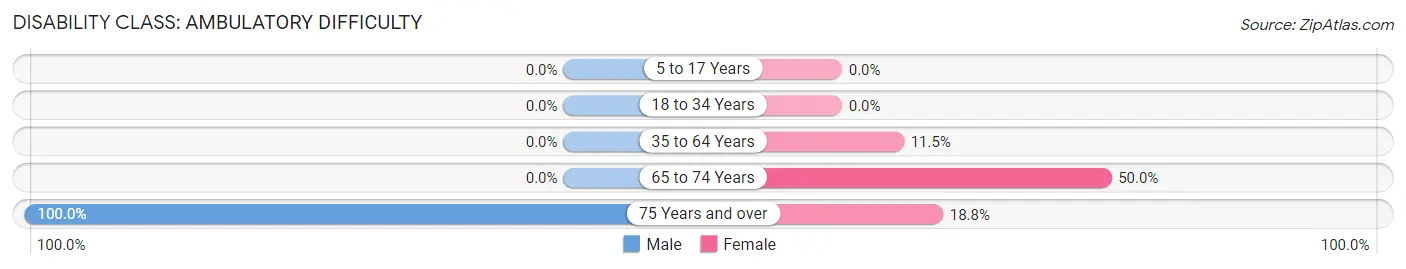
| Age Bracket | Male | Female |
| 5 to 17 Years | 0 (0.0%) | 0 (0.0%) |
| 18 to 34 Years | 0 (0.0%) | 0 (0.0%) |
| 35 to 64 Years | 0 (0.0%) | 10 (11.5%) |
| 65 to 74 Years | 0 (0.0%) | 3 (50.0%) |
| 75 Years and over | 6 (100.0%) | 3 (18.8%) |
Disability Class: Self-Care Difficulty
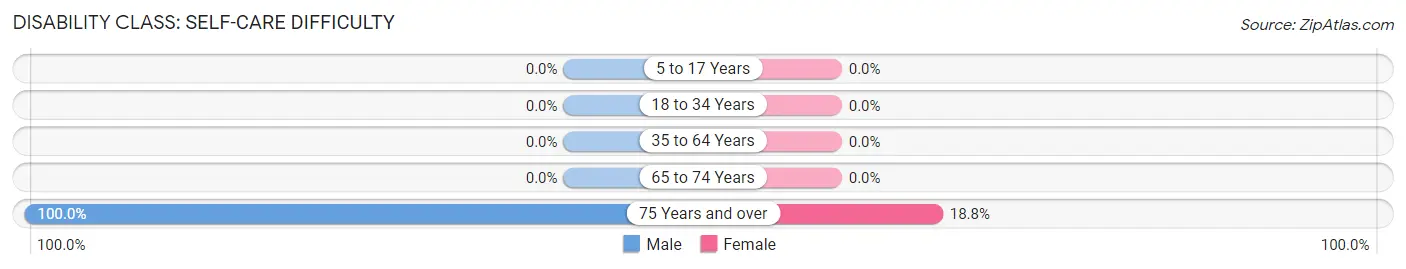
| Age Bracket | Male | Female |
| 5 to 17 Years | 0 (0.0%) | 0 (0.0%) |
| 18 to 34 Years | 0 (0.0%) | 0 (0.0%) |
| 35 to 64 Years | 0 (0.0%) | 0 (0.0%) |
| 65 to 74 Years | 0 (0.0%) | 0 (0.0%) |
| 75 Years and over | 6 (100.0%) | 3 (18.8%) |
Technology Access in Nazlini
Computing Device Access in Nazlini
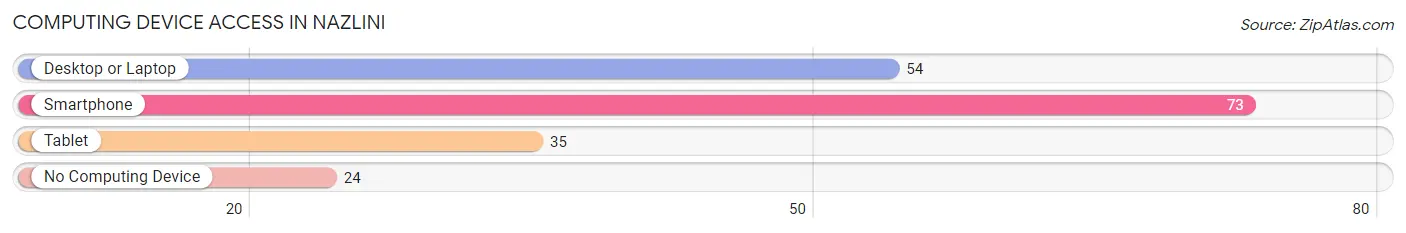
| Device Type | # Households | % Households |
| Desktop or Laptop | 54 | 51.9% |
| Smartphone | 73 | 70.2% |
| Tablet | 35 | 33.7% |
| No Computing Device | 24 | 23.1% |
| Total | 104 | 100.0% |
Internet Access in Nazlini
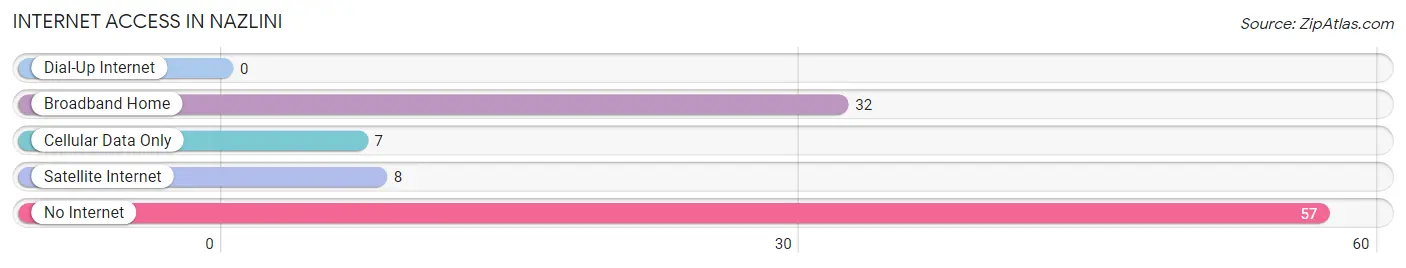
| Internet Type | # Households | % Households |
| Dial-Up Internet | 0 | 0.0% |
| Broadband Home | 32 | 30.8% |
| Cellular Data Only | 7 | 6.7% |
| Satellite Internet | 8 | 7.7% |
| No Internet | 57 | 54.8% |
| Total | 104 | 100.0% |
Nazlini Summary
The small town of Nazlini, Arizona is located in the northeastern corner of the state, in Apache County. It is situated in the Chuska Mountains, near the Four Corners region, and is home to a population of just over 200 people. The town is known for its rich cultural heritage, its stunning natural beauty, and its unique economic opportunities.
Geography
Nazlini is located in the Chuska Mountains, which are part of the Colorado Plateau. The town is situated at an elevation of 5,890 feet, and is surrounded by rolling hills and lush vegetation. The area is known for its mild climate, with temperatures ranging from the mid-50s in the winter to the mid-80s in the summer. The town is located near the Four Corners region, which is the only place in the United States where four states meet.
History
The area around Nazlini has been inhabited for centuries by the Navajo people. The town was founded in the late 1800s by a group of Navajo families who were looking for a place to settle. The town was originally called “Naslini,” which means “place of the sun” in Navajo. The town was renamed “Nazlini” in the early 1900s.
The town has a long history of ranching and farming, and the local economy has been largely based on these activities. In the early 1900s, the town was home to a number of small businesses, including a general store, a post office, and a blacksmith shop. The town also had a school, which was built in the 1930s.
Economy
The economy of Nazlini is largely based on ranching and farming. The town is home to a number of small businesses, including a general store, a post office, and a blacksmith shop. The town also has a small tourism industry, with visitors coming to the area to enjoy the stunning natural beauty and to explore the local culture.
The town is also home to a number of small manufacturing businesses, including a furniture factory and a woodworking shop. The town is also home to a number of small service businesses, including a gas station, a restaurant, and a bar.
Demographics
As of the 2010 census, the population of Nazlini was 214. The town is predominantly Native American, with the majority of the population being Navajo. The median age of the population is 33.7 years, and the median household income is $25,000.
Conclusion
Nazlini, Arizona is a small town located in the northeastern corner of the state. The town is known for its rich cultural heritage, its stunning natural beauty, and its unique economic opportunities. The town is predominantly Native American, with the majority of the population being Navajo. The local economy is largely based on ranching and farming, and the town is also home to a number of small businesses and manufacturing businesses.
Common Questions
What is Per Capita Income in Nazlini?
Per Capita income in Nazlini is $11,198.
What is the Median Family Income in Nazlini?
Median Family Income in Nazlini is $29,896.
What is the Median Household income in Nazlini?
Median Household Income in Nazlini is $30,357.
What is Income or Wage Gap in Nazlini?
Income or Wage Gap in Nazlini is 41.0%.
Women in Nazlini earn 59.0 cents for every dollar earned by a man.
What is Inequality or Gini Index in Nazlini?
Inequality or Gini Index in Nazlini is 0.51.
What is the Total Population of Nazlini?
Total Population of Nazlini is 468.
What is the Total Male Population of Nazlini?
Total Male Population of Nazlini is 207.
What is the Total Female Population of Nazlini?
Total Female Population of Nazlini is 261.
What is the Ratio of Males per 100 Females in Nazlini?
There are 79.31 Males per 100 Females in Nazlini.
What is the Ratio of Females per 100 Males in Nazlini?
There are 126.09 Females per 100 Males in Nazlini.
What is the Median Population Age in Nazlini?
Median Population Age in Nazlini is 18.3 Years.
What is the Average Family Size in Nazlini
Average Family Size in Nazlini is 5.6 People.
What is the Average Household Size in Nazlini
Average Household Size in Nazlini is 4.5 People.
How Large is the Labor Force in Nazlini?
There are 103 People in the Labor Forcein in Nazlini.
What is the Percentage of People in the Labor Force in Nazlini?
39.6% of People are in the Labor Force in Nazlini.
What is the Unemployment Rate in Nazlini?
Unemployment Rate in Nazlini is 9.7%.