Munds Park, AZ Map & Demographics
Munds Park Map
Munds Park Overview
$61,213
PER CAPITA INCOME
$110,203
AVG FAMILY INCOME
$80,152
AVG HOUSEHOLD INCOME
0.50
INEQUALITY / GINI INDEX
950
TOTAL POPULATION
524
MALE POPULATION
426
FEMALE POPULATION
123.00
MALES / 100 FEMALES
81.30
FEMALES / 100 MALES
66.4
MEDIAN AGE
2.2
AVG FAMILY SIZE
1.7
AVG HOUSEHOLD SIZE
337
LABOR FORCE [ PEOPLE ]
37.7%
PERCENT IN LABOR FORCE
12.5%
UNEMPLOYMENT RATE
Munds Park Zip Codes
Munds Park Area Codes
Income in Munds Park
Income Overview in Munds Park
Per Capita Income in Munds Park is $61,213, while median incomes of families and households are $110,203 and $80,152 respectively.
| Characteristic | Number | Measure |
| Per Capita Income | 950 | $61,213 |
| Median Family Income | 251 | $110,203 |
| Mean Family Income | 251 | $151,869 |
| Median Household Income | 554 | $80,152 |
| Mean Household Income | 554 | $105,460 |
| Income Deficit | 251 | $0 |
| Wage / Income Gap (%) | 950 | 0.00% |
| Wage / Income Gap ($) | 950 | 100.00¢ per $1 |
| Gini / Inequality Index | 950 | 0.50 |
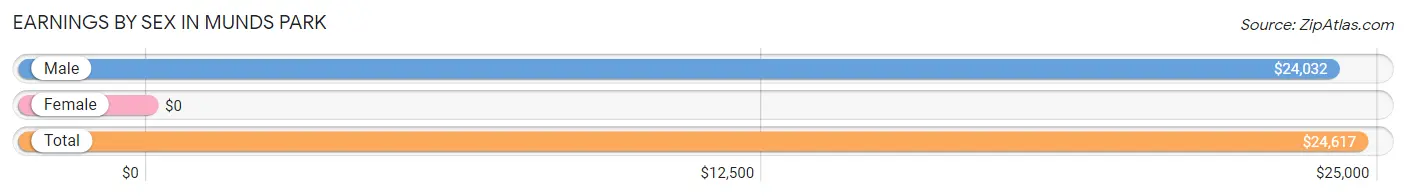
Earnings by Sex in Munds Park
| Sex | Number | Average Earnings |
| Male | 232 (58.2%) | $24,032 |
| Female | 167 (41.8%) | $0 |
| Total | 399 (100.0%) | $24,617 |
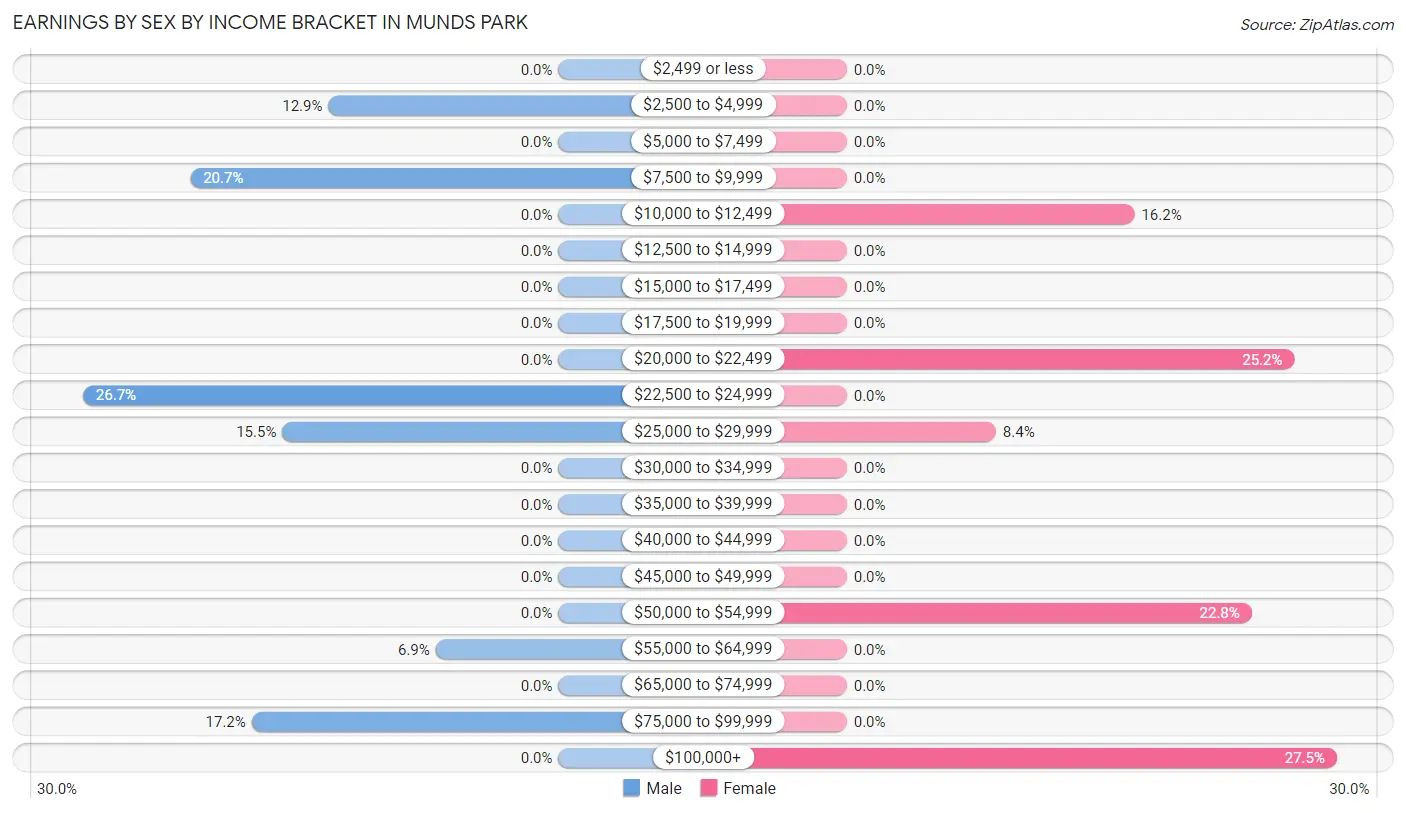
Earnings by Sex by Income Bracket in Munds Park
The most common earnings brackets in Munds Park are $22,500 to $24,999 for men (62 | 26.7%) and $100,000+ for women (46 | 27.5%).
| Income | Male | Female |
| $2,499 or less | 0 (0.0%) | 0 (0.0%) |
| $2,500 to $4,999 | 30 (12.9%) | 0 (0.0%) |
| $5,000 to $7,499 | 0 (0.0%) | 0 (0.0%) |
| $7,500 to $9,999 | 48 (20.7%) | 0 (0.0%) |
| $10,000 to $12,499 | 0 (0.0%) | 27 (16.2%) |
| $12,500 to $14,999 | 0 (0.0%) | 0 (0.0%) |
| $15,000 to $17,499 | 0 (0.0%) | 0 (0.0%) |
| $17,500 to $19,999 | 0 (0.0%) | 0 (0.0%) |
| $20,000 to $22,499 | 0 (0.0%) | 42 (25.2%) |
| $22,500 to $24,999 | 62 (26.7%) | 0 (0.0%) |
| $25,000 to $29,999 | 36 (15.5%) | 14 (8.4%) |
| $30,000 to $34,999 | 0 (0.0%) | 0 (0.0%) |
| $35,000 to $39,999 | 0 (0.0%) | 0 (0.0%) |
| $40,000 to $44,999 | 0 (0.0%) | 0 (0.0%) |
| $45,000 to $49,999 | 0 (0.0%) | 0 (0.0%) |
| $50,000 to $54,999 | 0 (0.0%) | 38 (22.8%) |
| $55,000 to $64,999 | 16 (6.9%) | 0 (0.0%) |
| $65,000 to $74,999 | 0 (0.0%) | 0 (0.0%) |
| $75,000 to $99,999 | 40 (17.2%) | 0 (0.0%) |
| $100,000+ | 0 (0.0%) | 46 (27.5%) |
| Total | 232 (100.0%) | 167 (100.0%) |
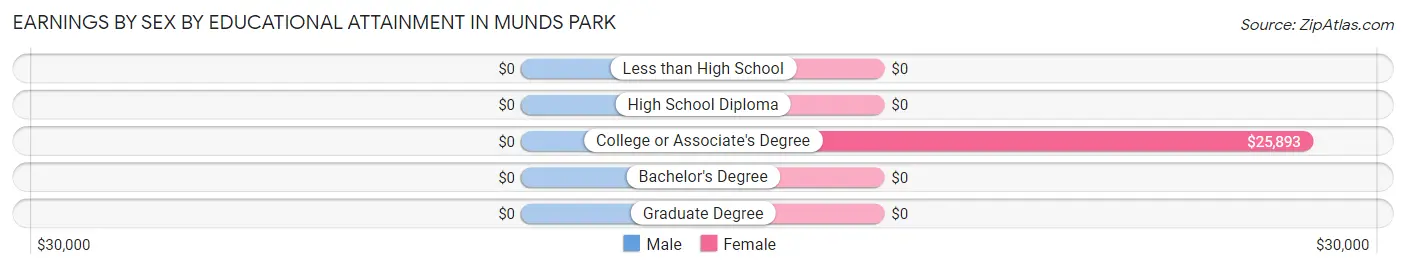
Earnings by Sex by Educational Attainment in Munds Park
| Educational Attainment | Male Income | Female Income |
| Less than High School | - | - |
| High School Diploma | - | - |
| College or Associate's Degree | - | - |
| Bachelor's Degree | - | - |
| Graduate Degree | - | - |
| Total | $59,063 | $0 |
Family Income in Munds Park
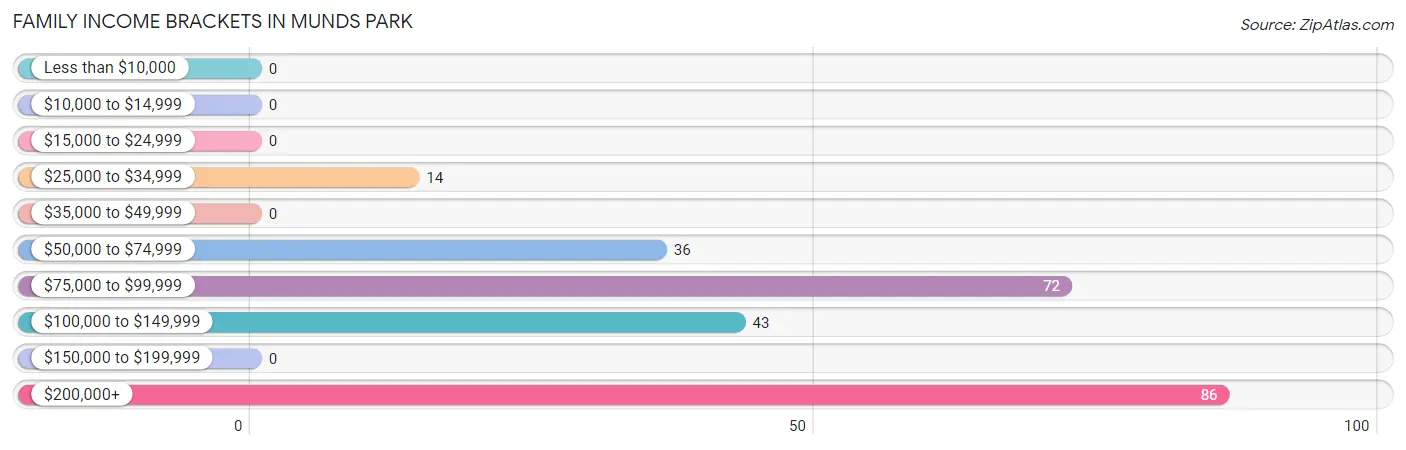
Family Income Brackets in Munds Park
According to the Munds Park family income data, there are 86 families falling into the $200,000+ income range, which is the most common income bracket and makes up 34.3% of all families.
| Income Bracket | # Families | % Families |
| Less than $10,000 | 0 | 0.0% |
| $10,000 to $14,999 | 0 | 0.0% |
| $15,000 to $24,999 | 0 | 0.0% |
| $25,000 to $34,999 | 14 | 5.6% |
| $35,000 to $49,999 | 0 | 0.0% |
| $50,000 to $74,999 | 36 | 14.3% |
| $75,000 to $99,999 | 72 | 28.7% |
| $100,000 to $149,999 | 43 | 17.1% |
| $150,000 to $199,999 | 0 | 0.0% |
| $200,000+ | 86 | 34.3% |
Family Income by Famaliy Size in Munds Park
| Income Bracket | # Families | Median Income |
| 2-Person Families | 211 (84.1%) | $0 |
| 3-Person Families | 40 (15.9%) | $0 |
| 4-Person Families | 0 (0.0%) | $0 |
| 5-Person Families | 0 (0.0%) | $0 |
| 6-Person Families | 0 (0.0%) | $0 |
| 7+ Person Families | 0 (0.0%) | $0 |
| Total | 251 (100.0%) | $110,203 |
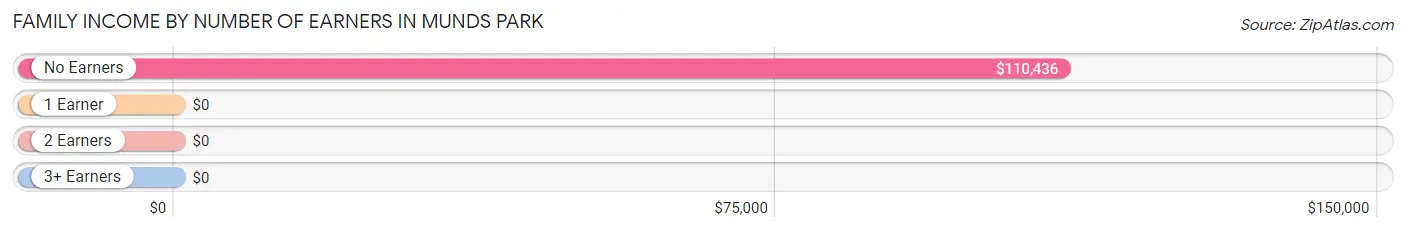
Family Income by Number of Earners in Munds Park
| Number of Earners | # Families | Median Income |
| No Earners | 151 (60.2%) | $110,436 |
| 1 Earner | 60 (23.9%) | $0 |
| 2 Earners | 40 (15.9%) | $0 |
| 3+ Earners | 0 (0.0%) | $0 |
| Total | 251 (100.0%) | $110,203 |
Household Income in Munds Park
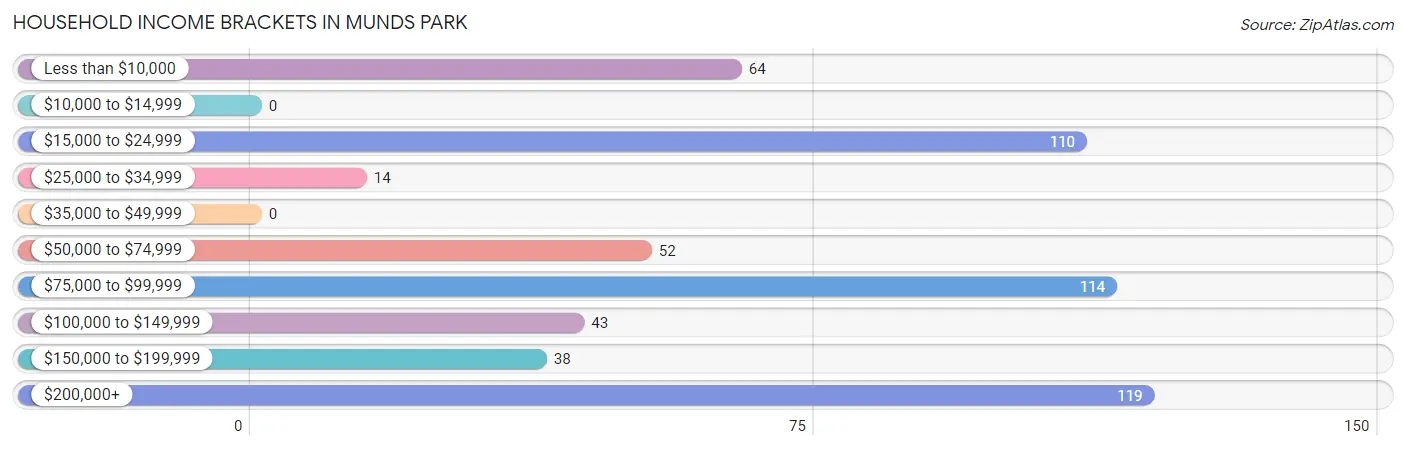
Household Income Brackets in Munds Park
With 119 households falling in the category, the $200,000+ income range is the most frequent in Munds Park, accounting for 21.5% of all households.
| Income Bracket | # Households | % Households |
| Less than $10,000 | 64 | 11.6% |
| $10,000 to $14,999 | 0 | 0.0% |
| $15,000 to $24,999 | 110 | 19.9% |
| $25,000 to $34,999 | 14 | 2.5% |
| $35,000 to $49,999 | 0 | 0.0% |
| $50,000 to $74,999 | 52 | 9.4% |
| $75,000 to $99,999 | 114 | 20.6% |
| $100,000 to $149,999 | 43 | 7.8% |
| $150,000 to $199,999 | 38 | 6.9% |
| $200,000+ | 119 | 21.5% |
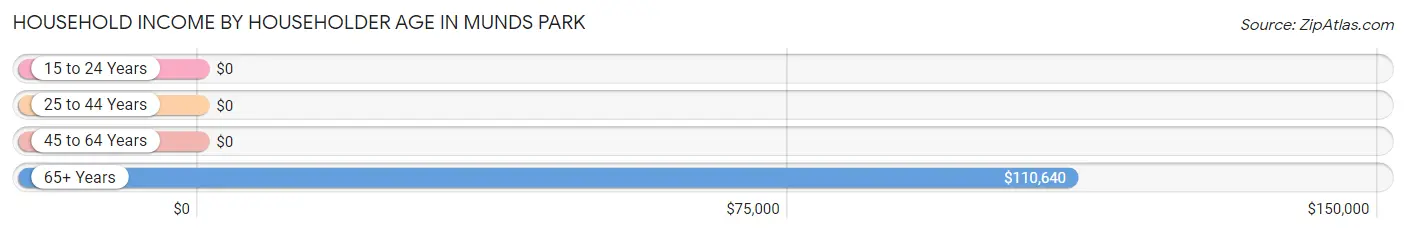
Household Income by Householder Age in Munds Park
The median household income in Munds Park is $80,152, with the highest median household income of $110,640 found in the 65+ years age bracket for the primary householder. A total of 286 households (51.6%) fall into this category. Meanwhile, the 15 to 24 years age bracket for the primary householder has the lowest median household income of $0, with 110 households (19.9%) in this group.
| Income Bracket | # Households | Median Income |
| 15 to 24 Years | 110 (19.9%) | $0 |
| 25 to 44 Years | 0 (0.0%) | $0 |
| 45 to 64 Years | 158 (28.5%) | $0 |
| 65+ Years | 286 (51.6%) | $110,640 |
| Total | 554 (100.0%) | $80,152 |
Poverty in Munds Park
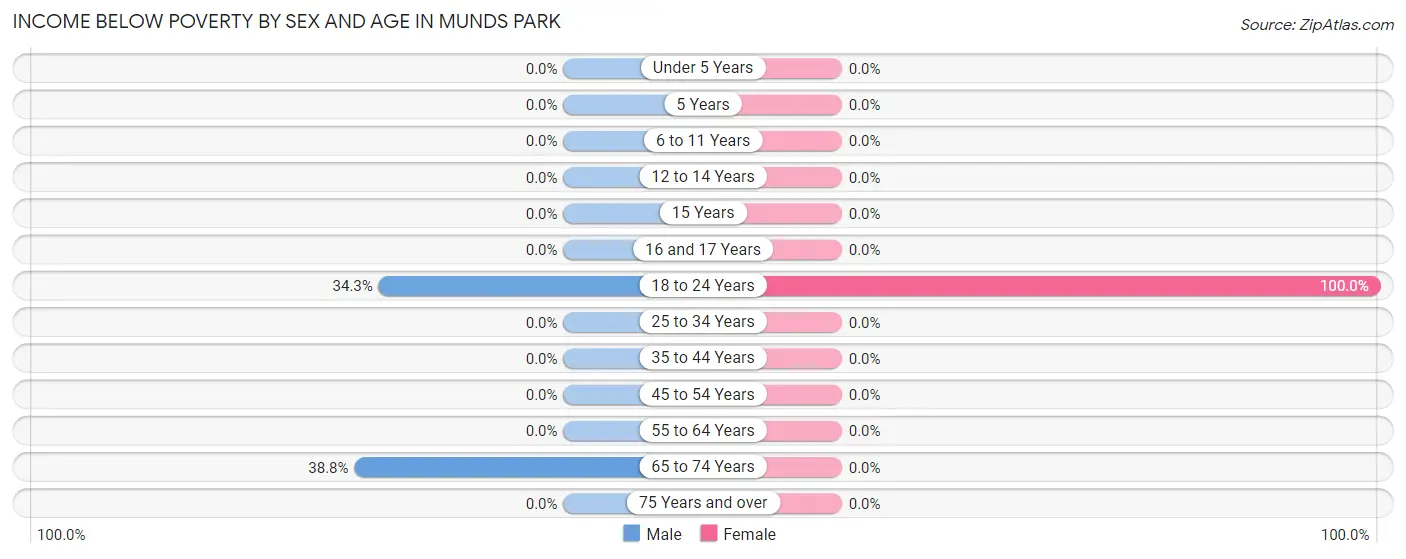
Income Below Poverty by Sex and Age in Munds Park
With 21.4% poverty level for males and 6.3% for females among the residents of Munds Park, 65 to 74 year old males and 18 to 24 year old females are the most vulnerable to poverty, with 64 males (38.8%) and 27 females (100.0%) in their respective age groups living below the poverty level.
| Age Bracket | Male | Female |
| Under 5 Years | 0 (0.0%) | 0 (0.0%) |
| 5 Years | 0 (0.0%) | 0 (0.0%) |
| 6 to 11 Years | 0 (0.0%) | 0 (0.0%) |
| 12 to 14 Years | 0 (0.0%) | 0 (0.0%) |
| 15 Years | 0 (0.0%) | 0 (0.0%) |
| 16 and 17 Years | 0 (0.0%) | 0 (0.0%) |
| 18 to 24 Years | 48 (34.3%) | 27 (100.0%) |
| 25 to 34 Years | 0 (0.0%) | 0 (0.0%) |
| 35 to 44 Years | 0 (0.0%) | 0 (0.0%) |
| 45 to 54 Years | 0 (0.0%) | 0 (0.0%) |
| 55 to 64 Years | 0 (0.0%) | 0 (0.0%) |
| 65 to 74 Years | 64 (38.8%) | 0 (0.0%) |
| 75 Years and over | 0 (0.0%) | 0 (0.0%) |
| Total | 112 (21.4%) | 27 (6.3%) |
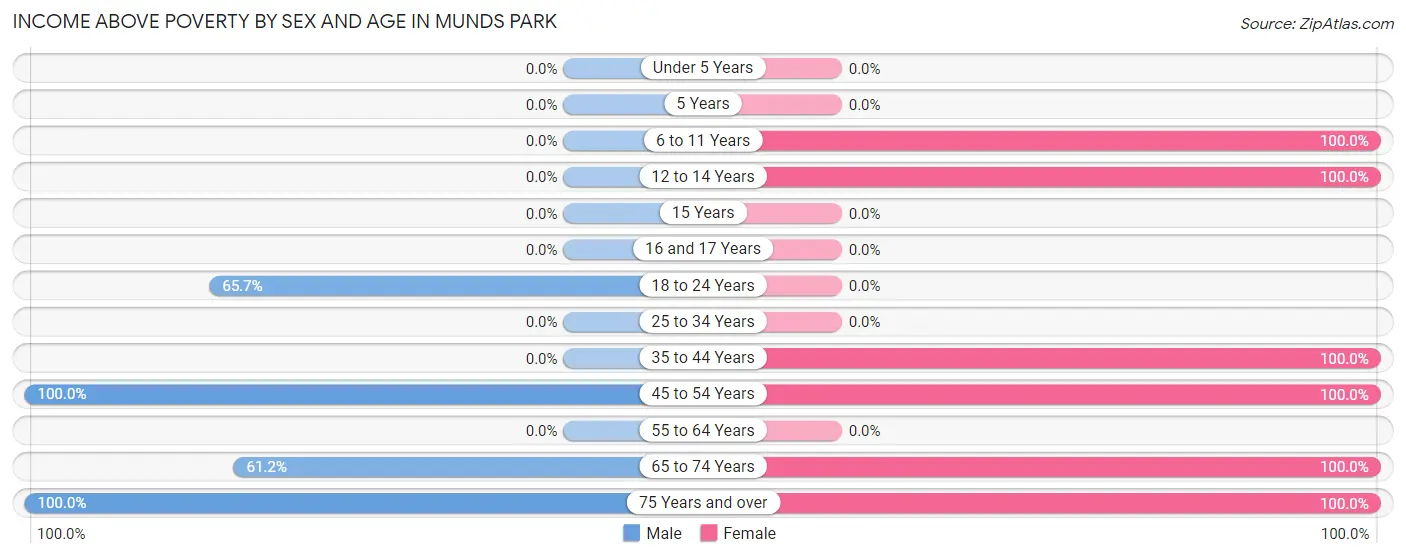
Income Above Poverty by Sex and Age in Munds Park
According to the poverty statistics in Munds Park, males aged 45 to 54 years and females aged 6 to 11 years are the age groups that are most secure financially, with 100.0% of males and 100.0% of females in these age groups living above the poverty line.
| Age Bracket | Male | Female |
| Under 5 Years | 0 (0.0%) | 0 (0.0%) |
| 5 Years | 0 (0.0%) | 0 (0.0%) |
| 6 to 11 Years | 0 (0.0%) | 12 (100.0%) |
| 12 to 14 Years | 0 (0.0%) | 44 (100.0%) |
| 15 Years | 0 (0.0%) | 0 (0.0%) |
| 16 and 17 Years | 0 (0.0%) | 0 (0.0%) |
| 18 to 24 Years | 92 (65.7%) | 0 (0.0%) |
| 25 to 34 Years | 0 (0.0%) | 0 (0.0%) |
| 35 to 44 Years | 0 (0.0%) | 38 (100.0%) |
| 45 to 54 Years | 100 (100.0%) | 102 (100.0%) |
| 55 to 64 Years | 0 (0.0%) | 0 (0.0%) |
| 65 to 74 Years | 101 (61.2%) | 106 (100.0%) |
| 75 Years and over | 119 (100.0%) | 97 (100.0%) |
| Total | 412 (78.6%) | 399 (93.7%) |
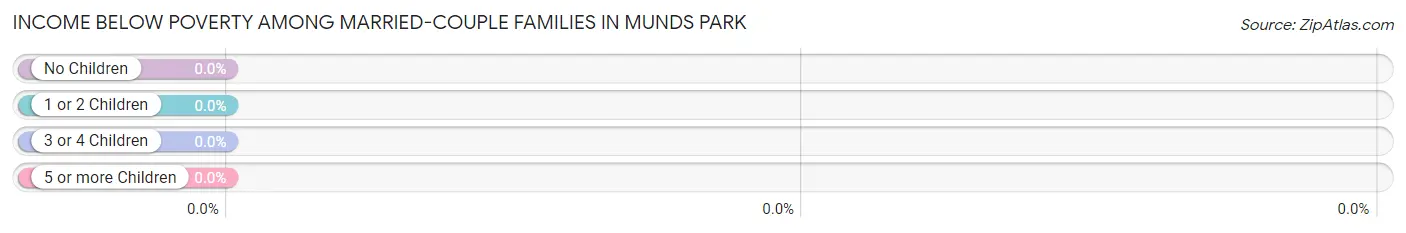
Income Below Poverty Among Married-Couple Families in Munds Park
| Children | Above Poverty | Below Poverty |
| No Children | 197 (100.0%) | 0 (0.0%) |
| 1 or 2 Children | 0 (0.0%) | 0 (0.0%) |
| 3 or 4 Children | 0 (0.0%) | 0 (0.0%) |
| 5 or more Children | 0 (0.0%) | 0 (0.0%) |
| Total | 197 (100.0%) | 0 (0.0%) |
Income Below Poverty Among Single-Parent Households in Munds Park
| Children | Single Father | Single Mother |
| No Children | 0 (0.0%) | 0 (0.0%) |
| 1 or 2 Children | 0 (0.0%) | 0 (0.0%) |
| 3 or 4 Children | 0 (0.0%) | 0 (0.0%) |
| 5 or more Children | 0 (0.0%) | 0 (0.0%) |
| Total | 0 (0.0%) | 0 (0.0%) |
Income Below Poverty Among Married-Couple vs Single-Parent Households in Munds Park
| Children | Married-Couple Families | Single-Parent Households |
| No Children | 0 (0.0%) | 0 (0.0%) |
| 1 or 2 Children | 0 (0.0%) | 0 (0.0%) |
| 3 or 4 Children | 0 (0.0%) | 0 (0.0%) |
| 5 or more Children | 0 (0.0%) | 0 (0.0%) |
| Total | 0 (0.0%) | 0 (0.0%) |
Race in Munds Park
The most populous races in Munds Park are White / Caucasian (902 | 95.0%), Hispanic or Latino (75 | 7.9%), and Black / African American (48 | 5.1%).
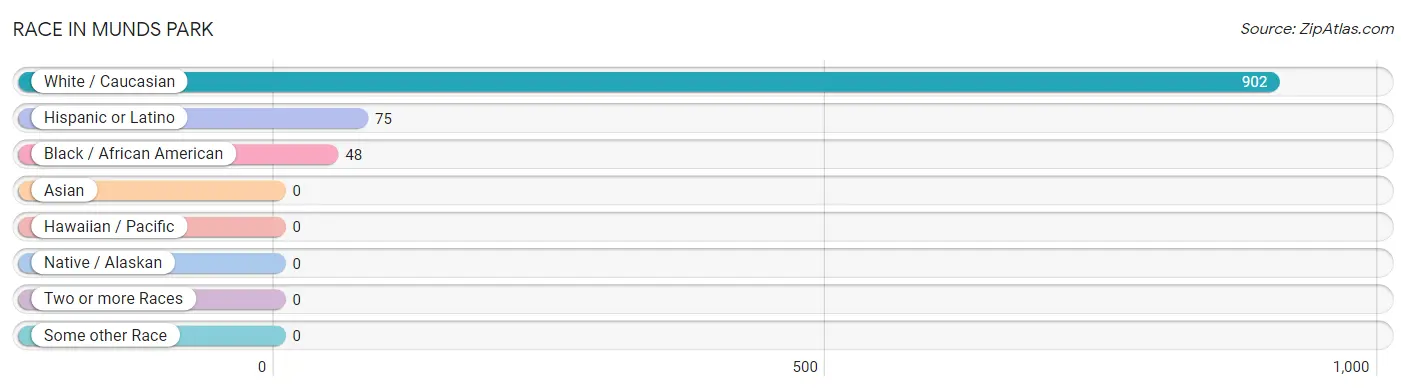
| Race | # Population | % Population |
| Asian | 0 | 0.0% |
| Black / African American | 48 | 5.1% |
| Hawaiian / Pacific | 0 | 0.0% |
| Hispanic or Latino | 75 | 7.9% |
| Native / Alaskan | 0 | 0.0% |
| White / Caucasian | 902 | 95.0% |
| Two or more Races | 0 | 0.0% |
| Some other Race | 0 | 0.0% |
| Total | 950 | 100.0% |
Ancestry in Munds Park
The most populous ancestries reported in Munds Park are German (220 | 23.2%), English (123 | 13.0%), American (116 | 12.2%), Scotch-Irish (78 | 8.2%), and Scandinavian (62 | 6.5%), together accounting for 63.1% of all Munds Park residents.
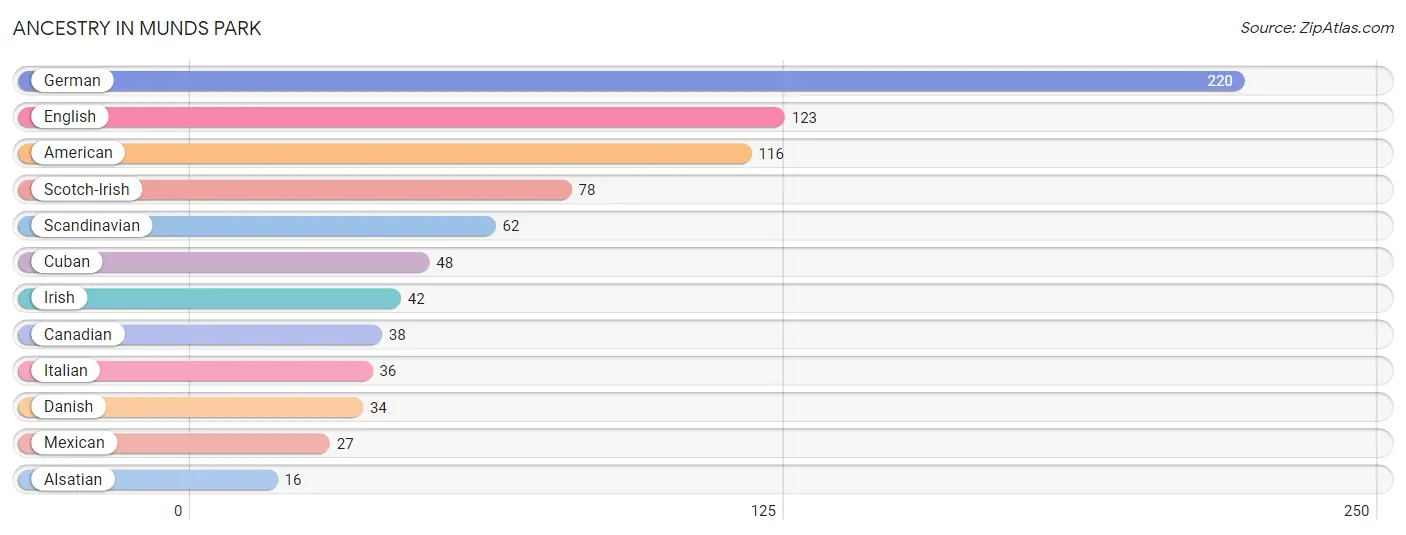
| Ancestry | # Population | % Population |
| Alsatian | 16 | 1.7% |
| American | 116 | 12.2% |
| Canadian | 38 | 4.0% |
| Cuban | 48 | 5.1% |
| Danish | 34 | 3.6% |
| English | 123 | 13.0% |
| German | 220 | 23.2% |
| Irish | 42 | 4.4% |
| Italian | 36 | 3.8% |
| Mexican | 27 | 2.8% |
| Scandinavian | 62 | 6.5% |
| Scotch-Irish | 78 | 8.2% | View All 12 Rows |
Immigrants in Munds Park
The most numerous immigrant groups reported in Munds Park came from Europe (44 | 4.6%), Germany (44 | 4.6%), Western Europe (44 | 4.6%), and Canada (38 | 4.0%), together accounting for 17.9% of all Munds Park residents.
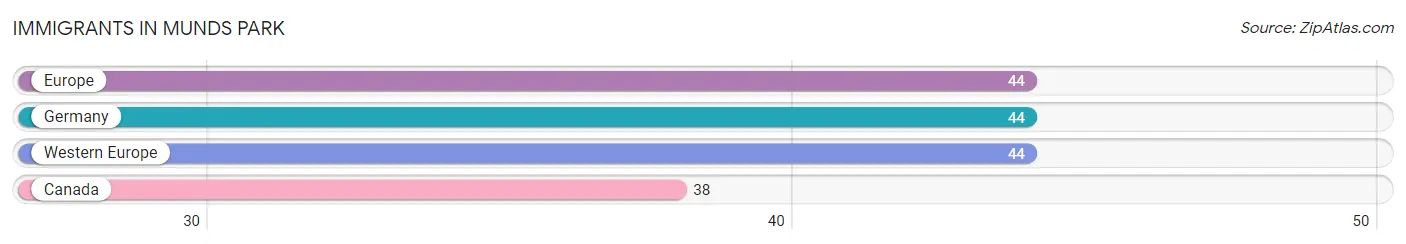
| Immigration Origin | # Population | % Population |
| Canada | 38 | 4.0% |
| Europe | 44 | 4.6% |
| Germany | 44 | 4.6% |
| Western Europe | 44 | 4.6% | View All 4 Rows |
Sex and Age in Munds Park
Sex and Age in Munds Park
The most populous age groups in Munds Park are 20 to 24 Years (110 | 21.0%) for men and 75 to 79 Years (97 | 22.8%) for women.
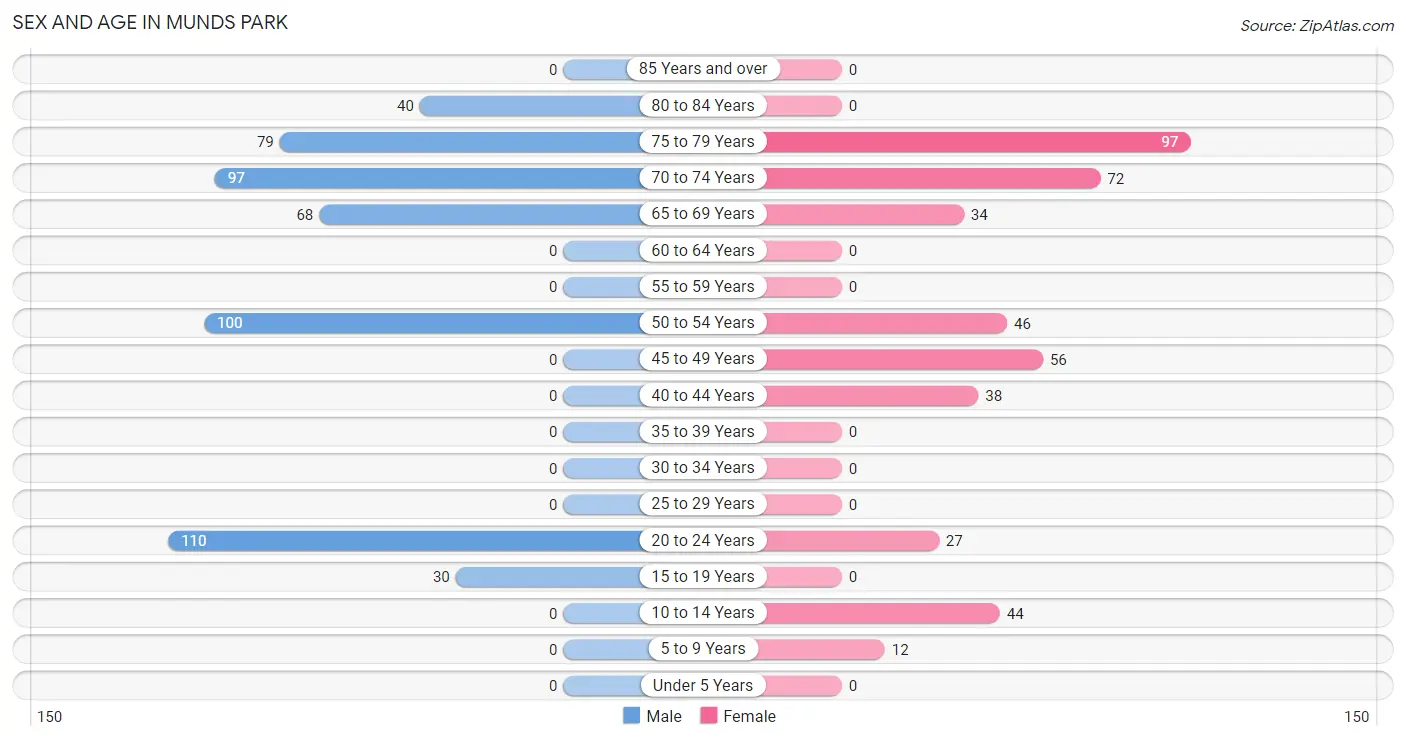
| Age Bracket | Male | Female |
| Under 5 Years | 0 (0.0%) | 0 (0.0%) |
| 5 to 9 Years | 0 (0.0%) | 12 (2.8%) |
| 10 to 14 Years | 0 (0.0%) | 44 (10.3%) |
| 15 to 19 Years | 30 (5.7%) | 0 (0.0%) |
| 20 to 24 Years | 110 (21.0%) | 27 (6.3%) |
| 25 to 29 Years | 0 (0.0%) | 0 (0.0%) |
| 30 to 34 Years | 0 (0.0%) | 0 (0.0%) |
| 35 to 39 Years | 0 (0.0%) | 0 (0.0%) |
| 40 to 44 Years | 0 (0.0%) | 38 (8.9%) |
| 45 to 49 Years | 0 (0.0%) | 56 (13.2%) |
| 50 to 54 Years | 100 (19.1%) | 46 (10.8%) |
| 55 to 59 Years | 0 (0.0%) | 0 (0.0%) |
| 60 to 64 Years | 0 (0.0%) | 0 (0.0%) |
| 65 to 69 Years | 68 (13.0%) | 34 (8.0%) |
| 70 to 74 Years | 97 (18.5%) | 72 (16.9%) |
| 75 to 79 Years | 79 (15.1%) | 97 (22.8%) |
| 80 to 84 Years | 40 (7.6%) | 0 (0.0%) |
| 85 Years and over | 0 (0.0%) | 0 (0.0%) |
| Total | 524 (100.0%) | 426 (100.0%) |
Families and Households in Munds Park
Median Family Size in Munds Park
The median family size in Munds Park is 2.18 persons per family, with single male/father families (40 | 15.9%) accounting for the largest median family size of 2.85 persons per family. On the other hand, single female/mother families (14 | 5.6%) represent the smallest median family size with 1.86 persons per family.
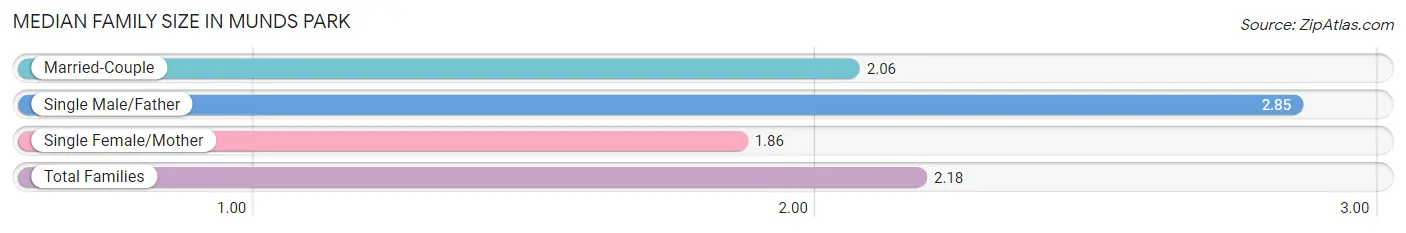
| Family Type | # Families | Family Size |
| Married-Couple | 197 (78.5%) | 2.06 |
| Single Male/Father | 40 (15.9%) | 2.85 |
| Single Female/Mother | 14 (5.6%) | 1.86 |
| Total Families | 251 (100.0%) | 2.18 |
Median Household Size in Munds Park
The median household size in Munds Park is 1.71 persons per household, with single male/father households (40 | 7.2%) accounting for the largest median household size of 2.85 persons per household. non-family households (303 | 54.7%) represent the smallest median household size with 1.33 persons per household.
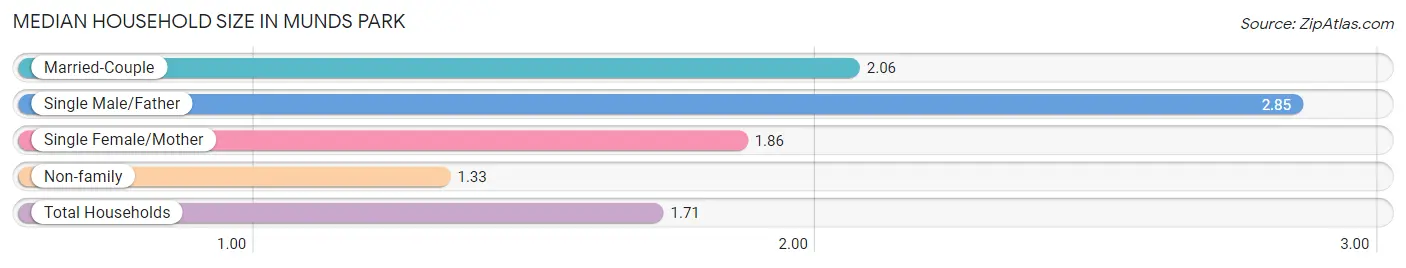
| Household Type | # Households | Household Size |
| Married-Couple | 197 (35.6%) | 2.06 |
| Single Male/Father | 40 (7.2%) | 2.85 |
| Single Female/Mother | 14 (2.5%) | 1.86 |
| Non-family | 303 (54.7%) | 1.33 |
| Total Households | 554 (100.0%) | 1.71 |
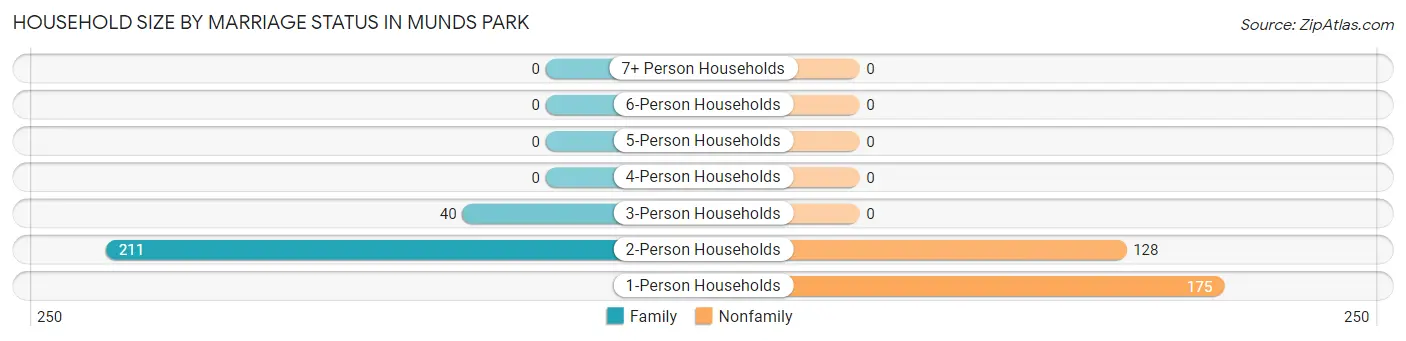
Household Size by Marriage Status in Munds Park
Out of a total of 554 households in Munds Park, 251 (45.3%) are family households, while 303 (54.7%) are nonfamily households. The most numerous type of family households are 2-person households, comprising 211, and the most common type of nonfamily households are 1-person households, comprising 175.
| Household Size | Family Households | Nonfamily Households |
| 1-Person Households | - | 175 (31.6%) |
| 2-Person Households | 211 (38.1%) | 128 (23.1%) |
| 3-Person Households | 40 (7.2%) | 0 (0.0%) |
| 4-Person Households | 0 (0.0%) | 0 (0.0%) |
| 5-Person Households | 0 (0.0%) | 0 (0.0%) |
| 6-Person Households | 0 (0.0%) | 0 (0.0%) |
| 7+ Person Households | 0 (0.0%) | 0 (0.0%) |
| Total | 251 (45.3%) | 303 (54.7%) |
Female Fertility in Munds Park
Fertility by Age in Munds Park
| Age Bracket | Women with Births | Births / 1,000 Women |
| 15 to 19 years | 0 (0.0%) | 0.0 |
| 20 to 34 years | 0 (0.0%) | 0.0 |
| 35 to 50 years | 0 (0.0%) | 0.0 |
| Total | 0 (0.0%) | 0.0 |
Fertility by Age by Marriage Status in Munds Park
| Age Bracket | Married | Unmarried |
| 15 to 19 years | 0 (0.0%) | 0 (0.0%) |
| 20 to 34 years | 0 (0.0%) | 0 (0.0%) |
| 35 to 50 years | 0 (0.0%) | 0 (0.0%) |
| Total | 0 (0.0%) | 0 (0.0%) |
Fertility by Education in Munds Park
| Educational Attainment | Women with Births | Births / 1,000 Women |
| Less than High School | 0 (0.0%) | 0.0 |
| High School Diploma | 0 (0.0%) | 0.0 |
| College or Associate's Degree | 0 (0.0%) | 0.0 |
| Bachelor's Degree | 0 (0.0%) | 0.0 |
| Graduate Degree | 0 (0.0%) | 0.0 |
| Total | 0 (0.0%) | 0.0 |
Fertility by Education by Marriage Status in Munds Park
| Educational Attainment | Married | Unmarried |
| Less than High School | 0 (0.0%) | 0 (0.0%) |
| High School Diploma | 0 (0.0%) | 0 (0.0%) |
| College or Associate's Degree | 0 (0.0%) | 0 (0.0%) |
| Bachelor's Degree | 0 (0.0%) | 0 (0.0%) |
| Graduate Degree | 0 (0.0%) | 0 (0.0%) |
| Total | 0 (0.0%) | 0 (0.0%) |
Employment Characteristics in Munds Park
Employment by Class of Employer in Munds Park
Among the 295 employed individuals in Munds Park, private company employees (279 | 94.6%), and state government employees (16 | 5.4%) make up the most common classes of employment.
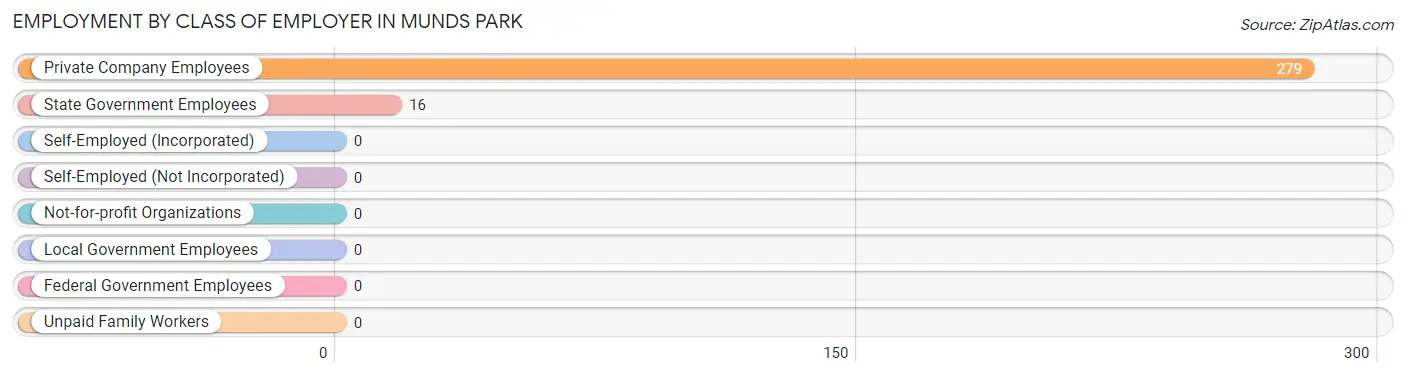
| Employer Class | # Employees | % Employees |
| Private Company Employees | 279 | 94.6% |
| Self-Employed (Incorporated) | 0 | 0.0% |
| Self-Employed (Not Incorporated) | 0 | 0.0% |
| Not-for-profit Organizations | 0 | 0.0% |
| Local Government Employees | 0 | 0.0% |
| State Government Employees | 16 | 5.4% |
| Federal Government Employees | 0 | 0.0% |
| Unpaid Family Workers | 0 | 0.0% |
| Total | 295 | 100.0% |
Employment Status by Age in Munds Park
According to the labor force statistics for Munds Park, out of the total population over 16 years of age (894), 37.7% or 337 individuals are in the labor force, with 12.5% or 42 of them unemployed. The age group with the highest labor force participation rate is 16 to 19 years, with 100.0% or 30 individuals in the labor force. Within the labor force, the 45 to 54 years age range has the highest percentage of unemployed individuals, with 26.6% or 42 of them being unemployed.
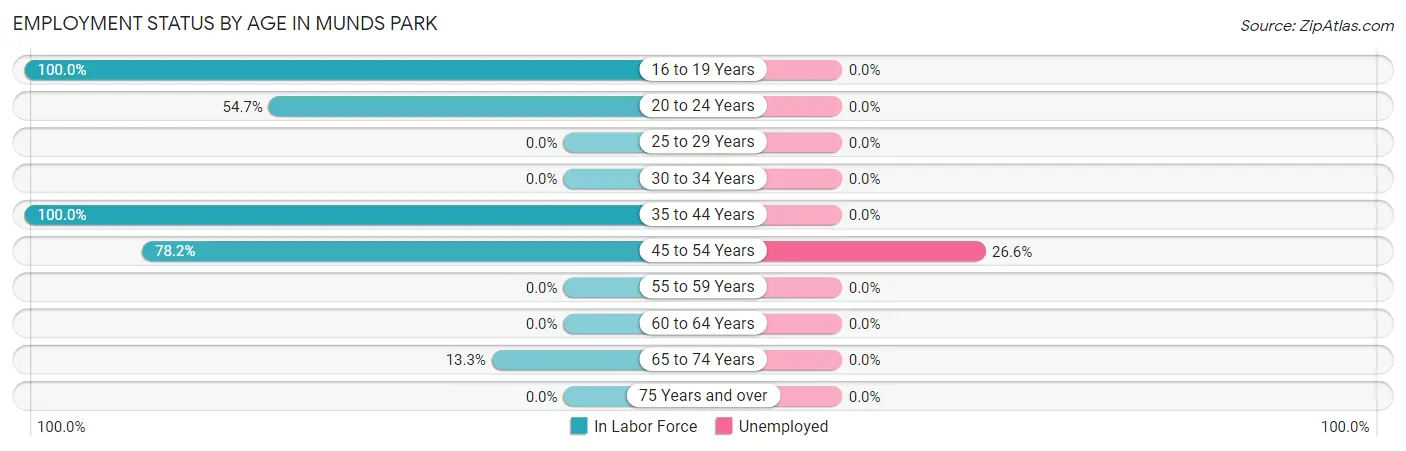
| Age Bracket | In Labor Force | Unemployed |
| 16 to 19 Years | 30 (100.0%) | 0 (0.0%) |
| 20 to 24 Years | 75 (54.7%) | 0 (0.0%) |
| 25 to 29 Years | 0 (0.0%) | 0 (0.0%) |
| 30 to 34 Years | 0 (0.0%) | 0 (0.0%) |
| 35 to 44 Years | 38 (100.0%) | 0 (0.0%) |
| 45 to 54 Years | 158 (78.2%) | 42 (26.6%) |
| 55 to 59 Years | 0 (0.0%) | 0 (0.0%) |
| 60 to 64 Years | 0 (0.0%) | 0 (0.0%) |
| 65 to 74 Years | 36 (13.3%) | 0 (0.0%) |
| 75 Years and over | 0 (0.0%) | 0 (0.0%) |
| Total | 337 (37.7%) | 42 (12.5%) |
Employment Status by Educational Attainment in Munds Park
According to labor force statistics for Munds Park, 81.7% of individuals (196) out of the total population between 25 and 64 years of age (240) are in the labor force, with 21.4% or 42 of them being unemployed. The group with the highest labor force participation rate are those with the educational attainment of college / associate degree, with 100.0% or 94 individuals in the labor force. Within the labor force, individuals with college / associate degree education have the highest percentage of unemployment, with 44.7% or 42 of them being unemployed.
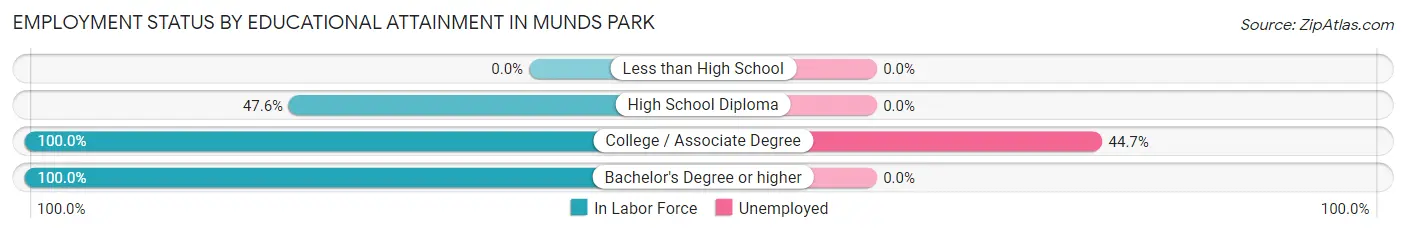
| Educational Attainment | In Labor Force | Unemployed |
| Less than High School | 0 (0.0%) | 0 (0.0%) |
| High School Diploma | 40 (47.6%) | 0 (0.0%) |
| College / Associate Degree | 94 (100.0%) | 42 (44.7%) |
| Bachelor's Degree or higher | 62 (100.0%) | 0 (0.0%) |
| Total | 196 (81.7%) | 51 (21.4%) |
Employment Occupations by Sex in Munds Park
Management, Business, Science and Arts Occupations
The most common Management, Business, Science and Arts occupations in Munds Park are Business & Financial (46 | 15.6%), Management (40 | 13.6%), and Health Diagnosing & Treating (14 | 4.8%).
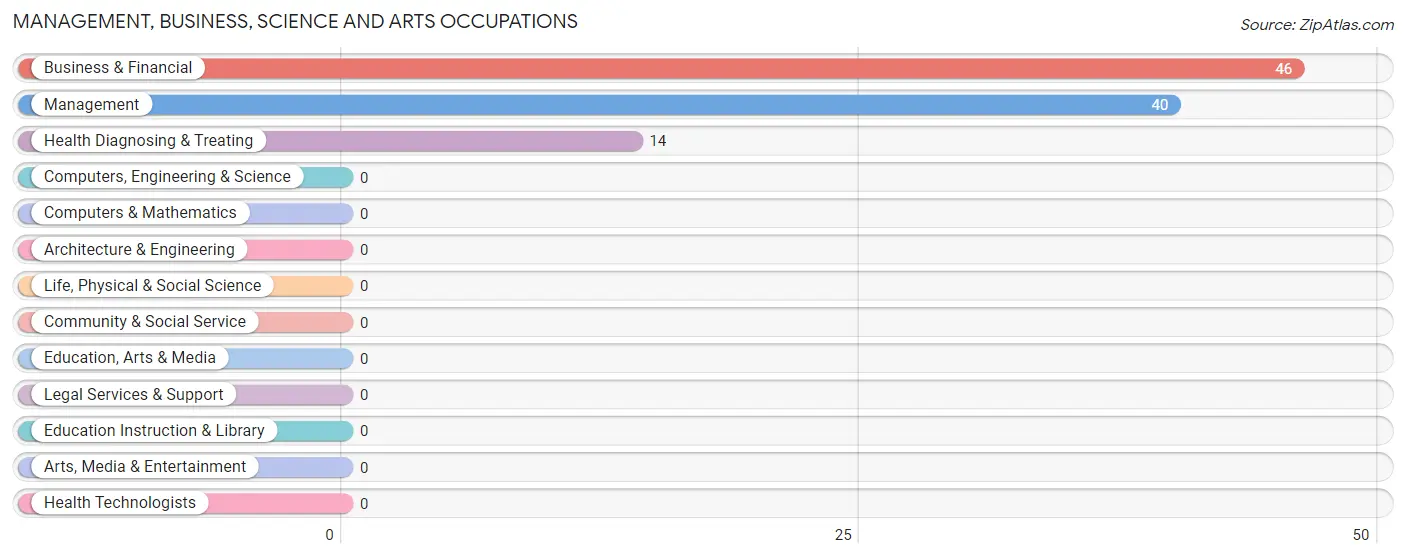
Management, Business, Science and Arts Occupations by Sex
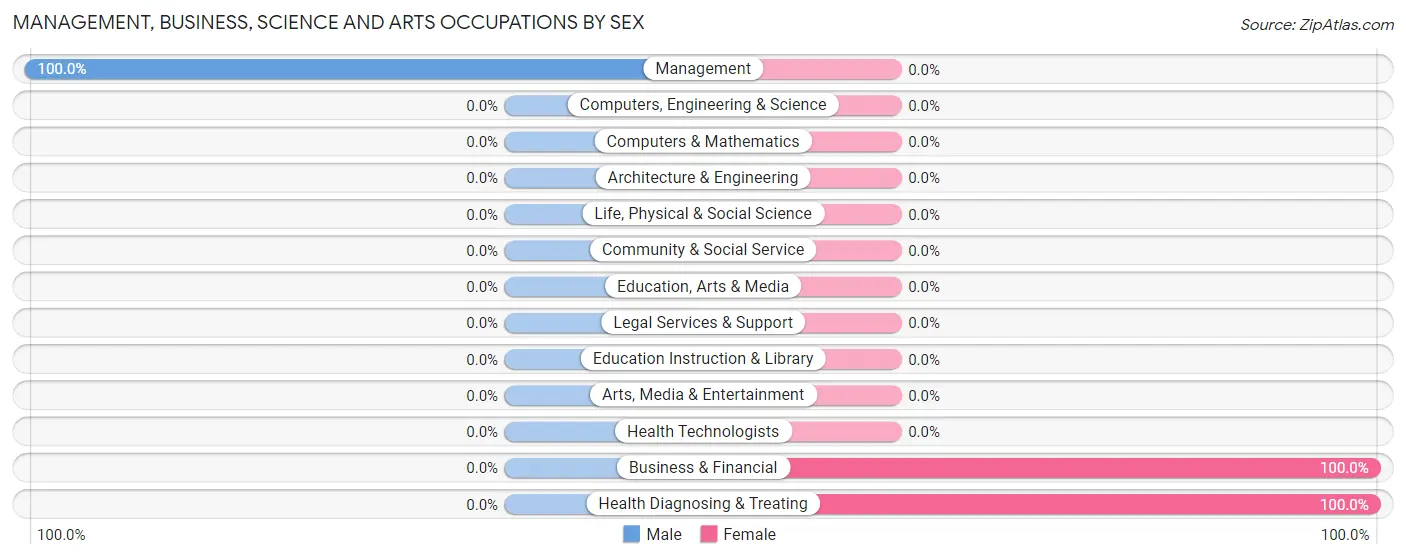
| Occupation | Male | Female |
| Management | 40 (100.0%) | 0 (0.0%) |
| Business & Financial | 0 (0.0%) | 46 (100.0%) |
| Computers, Engineering & Science | 0 (0.0%) | 0 (0.0%) |
| Computers & Mathematics | 0 (0.0%) | 0 (0.0%) |
| Architecture & Engineering | 0 (0.0%) | 0 (0.0%) |
| Life, Physical & Social Science | 0 (0.0%) | 0 (0.0%) |
| Community & Social Service | 0 (0.0%) | 0 (0.0%) |
| Education, Arts & Media | 0 (0.0%) | 0 (0.0%) |
| Legal Services & Support | 0 (0.0%) | 0 (0.0%) |
| Education Instruction & Library | 0 (0.0%) | 0 (0.0%) |
| Arts, Media & Entertainment | 0 (0.0%) | 0 (0.0%) |
| Health Diagnosing & Treating | 0 (0.0%) | 14 (100.0%) |
| Health Technologists | 0 (0.0%) | 0 (0.0%) |
| Total (Category) | 40 (40.0%) | 60 (60.0%) |
| Total (Overall) | 170 (57.6%) | 125 (42.4%) |
Services Occupations
The most common Services occupations in Munds Park are Cleaning & Maintenance (65 | 22.0%), and Food Preparation & Serving (48 | 16.3%).
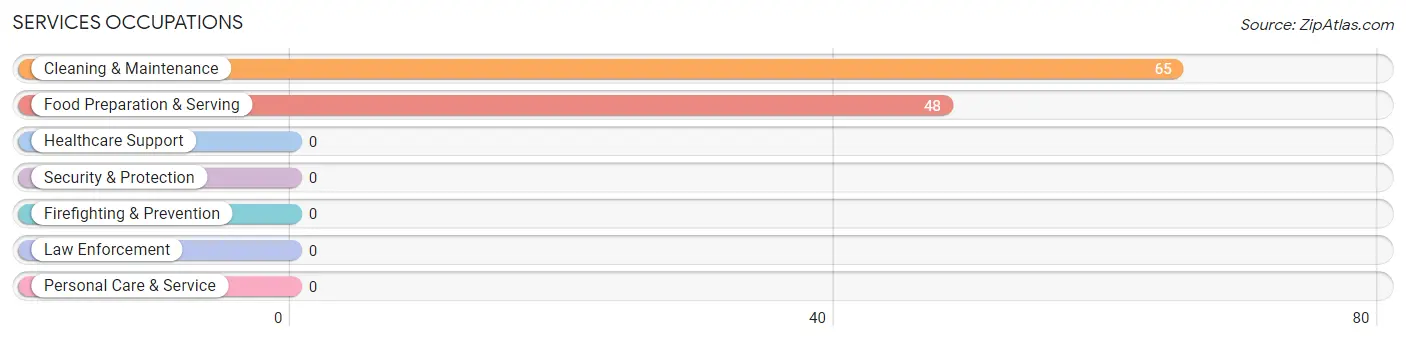
Services Occupations by Sex
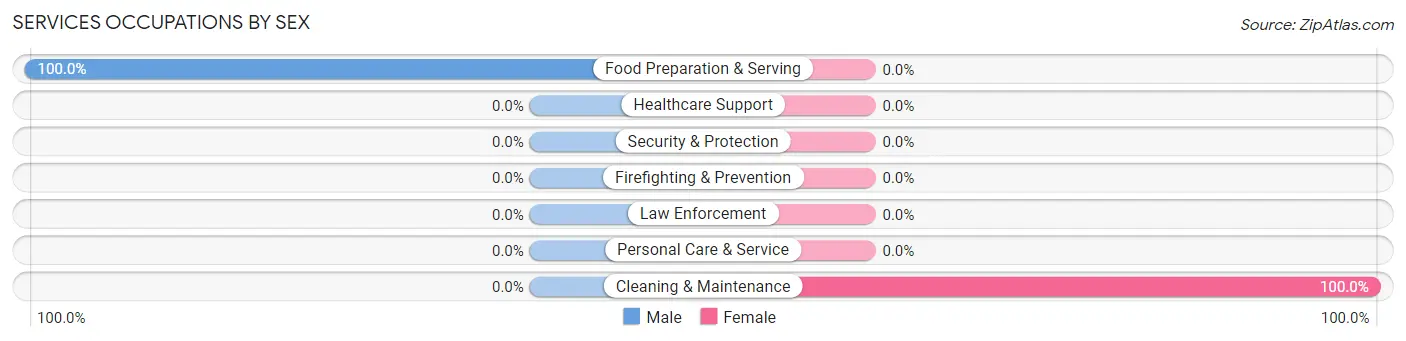
| Occupation | Male | Female |
| Healthcare Support | 0 (0.0%) | 0 (0.0%) |
| Security & Protection | 0 (0.0%) | 0 (0.0%) |
| Firefighting & Prevention | 0 (0.0%) | 0 (0.0%) |
| Law Enforcement | 0 (0.0%) | 0 (0.0%) |
| Food Preparation & Serving | 48 (100.0%) | 0 (0.0%) |
| Cleaning & Maintenance | 0 (0.0%) | 65 (100.0%) |
| Personal Care & Service | 0 (0.0%) | 0 (0.0%) |
| Total (Category) | 48 (42.5%) | 65 (57.5%) |
| Total (Overall) | 170 (57.6%) | 125 (42.4%) |
Sales and Office Occupations
Sales and Office Occupations by Sex
| Occupation | Male | Female |
| Sales & Related | 0 (0.0%) | 0 (0.0%) |
| Office & Administration | 0 (0.0%) | 0 (0.0%) |
| Total (Category) | 0 (0.0%) | 0 (0.0%) |
| Total (Overall) | 170 (57.6%) | 125 (42.4%) |
Natural Resources, Construction and Maintenance Occupations
The most common Natural Resources, Construction and Maintenance occupations in Munds Park are , and Construction & Extraction (16 | 5.4%).
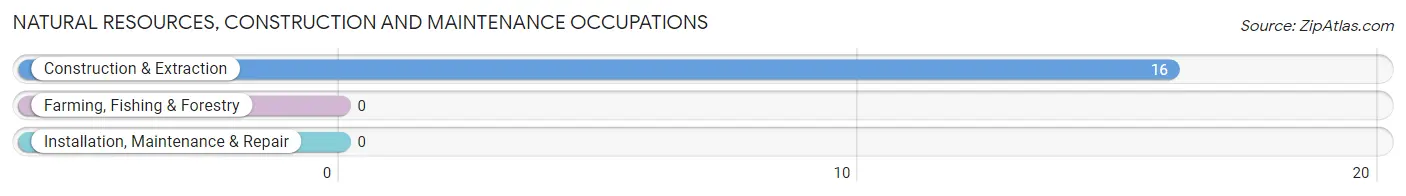
Natural Resources, Construction and Maintenance Occupations by Sex
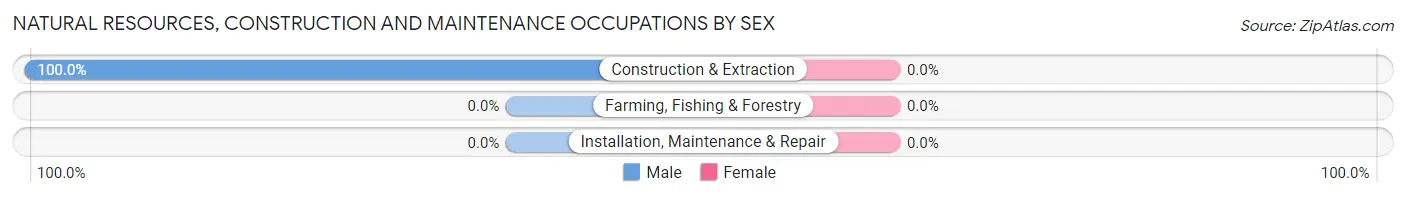
| Occupation | Male | Female |
| Farming, Fishing & Forestry | 0 (0.0%) | 0 (0.0%) |
| Construction & Extraction | 16 (100.0%) | 0 (0.0%) |
| Installation, Maintenance & Repair | 0 (0.0%) | 0 (0.0%) |
| Total (Category) | 16 (100.0%) | 0 (0.0%) |
| Total (Overall) | 170 (57.6%) | 125 (42.4%) |
Production, Transportation and Moving Occupations
The most common Production, Transportation and Moving occupations in Munds Park are , and Material Moving (66 | 22.4%).
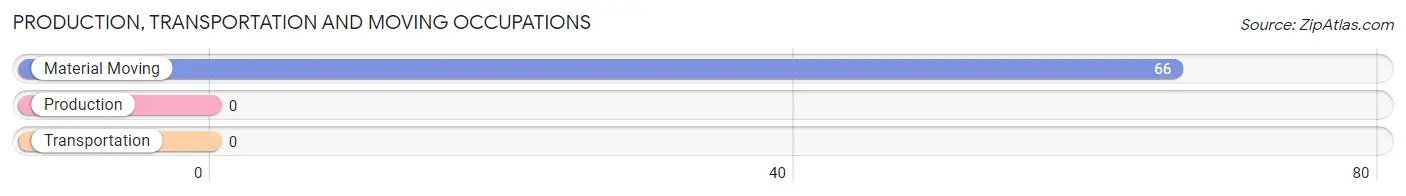
Production, Transportation and Moving Occupations by Sex
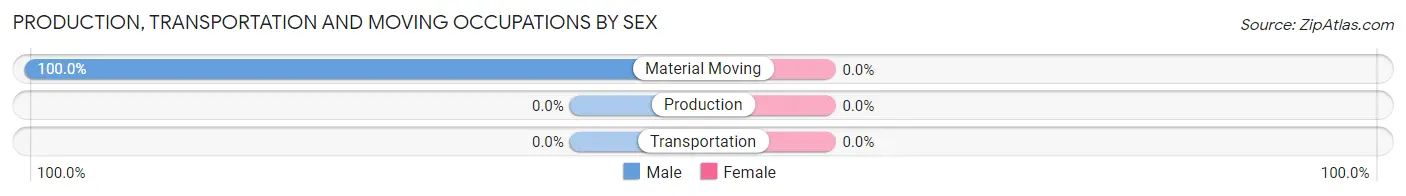
| Occupation | Male | Female |
| Production | 0 (0.0%) | 0 (0.0%) |
| Transportation | 0 (0.0%) | 0 (0.0%) |
| Material Moving | 66 (100.0%) | 0 (0.0%) |
| Total (Category) | 66 (100.0%) | 0 (0.0%) |
| Total (Overall) | 170 (57.6%) | 125 (42.4%) |
Employment Industries by Sex in Munds Park
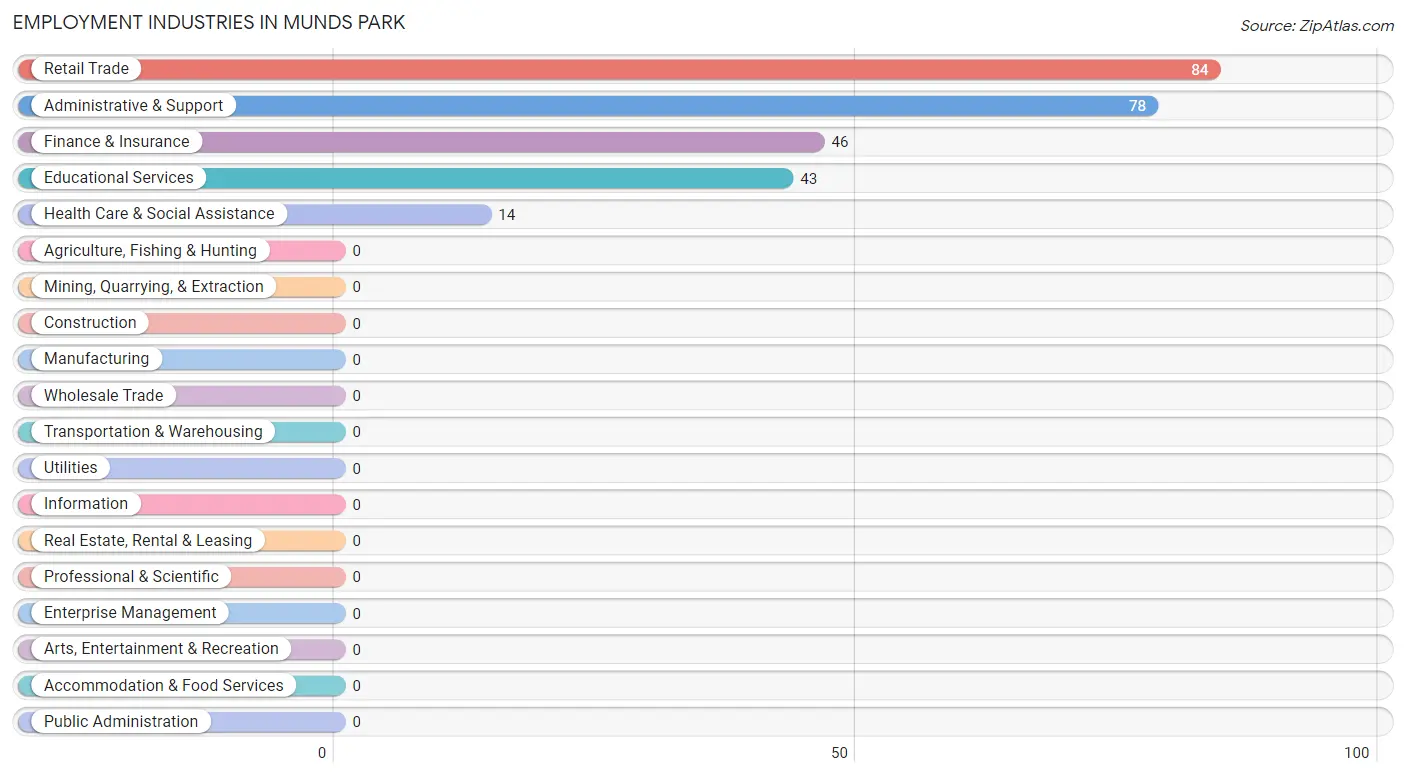
Employment Industries in Munds Park
The major employment industries in Munds Park include Retail Trade (84 | 28.5%), Administrative & Support (78 | 26.4%), Finance & Insurance (46 | 15.6%), Educational Services (43 | 14.6%), and Health Care & Social Assistance (14 | 4.8%).
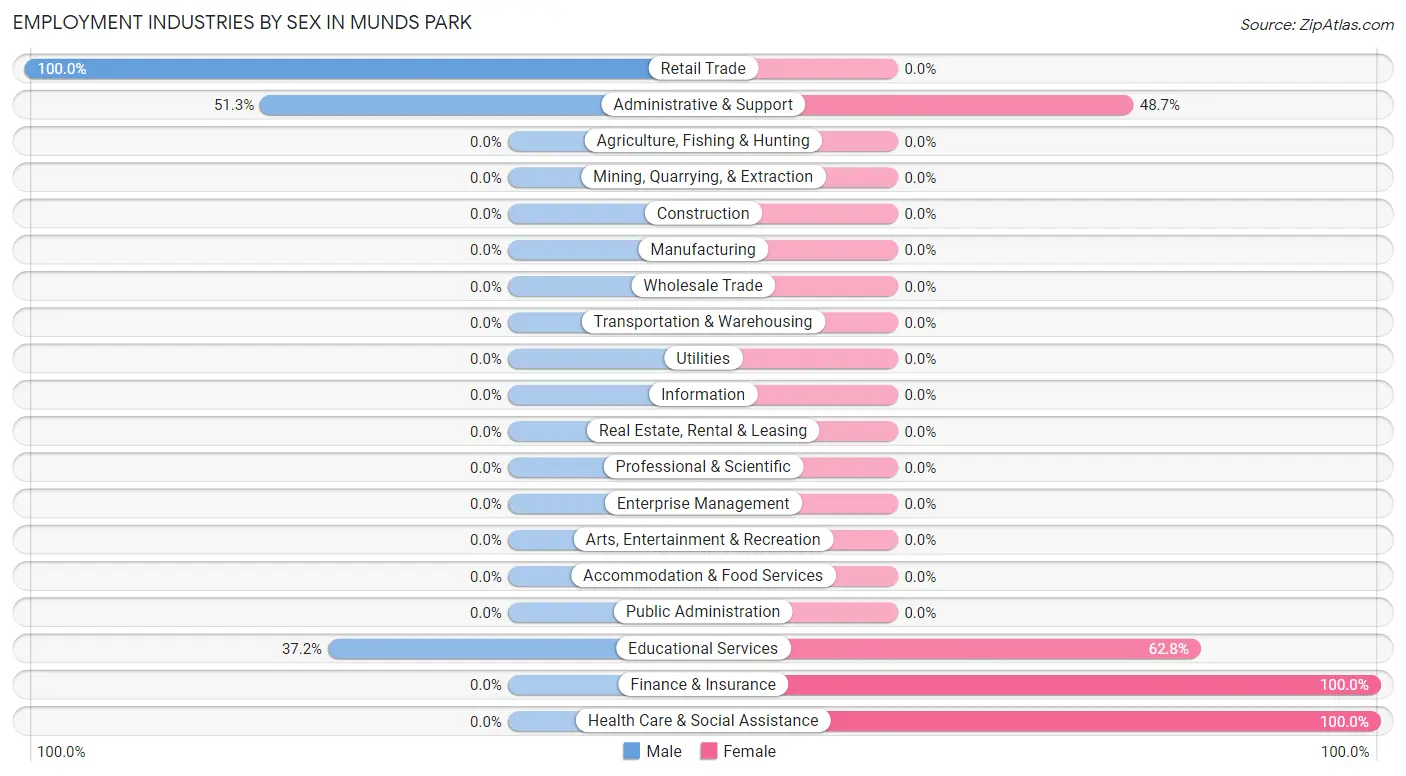
Employment Industries by Sex in Munds Park
The Munds Park industries that see more men than women are Retail Trade (100.0%), Administrative & Support (51.3%), and Educational Services (37.2%), whereas the industries that tend to have a higher number of women are Finance & Insurance (100.0%), Health Care & Social Assistance (100.0%), and Educational Services (62.8%).
| Industry | Male | Female |
| Agriculture, Fishing & Hunting | 0 (0.0%) | 0 (0.0%) |
| Mining, Quarrying, & Extraction | 0 (0.0%) | 0 (0.0%) |
| Construction | 0 (0.0%) | 0 (0.0%) |
| Manufacturing | 0 (0.0%) | 0 (0.0%) |
| Wholesale Trade | 0 (0.0%) | 0 (0.0%) |
| Retail Trade | 84 (100.0%) | 0 (0.0%) |
| Transportation & Warehousing | 0 (0.0%) | 0 (0.0%) |
| Utilities | 0 (0.0%) | 0 (0.0%) |
| Information | 0 (0.0%) | 0 (0.0%) |
| Finance & Insurance | 0 (0.0%) | 46 (100.0%) |
| Real Estate, Rental & Leasing | 0 (0.0%) | 0 (0.0%) |
| Professional & Scientific | 0 (0.0%) | 0 (0.0%) |
| Enterprise Management | 0 (0.0%) | 0 (0.0%) |
| Administrative & Support | 40 (51.3%) | 38 (48.7%) |
| Educational Services | 16 (37.2%) | 27 (62.8%) |
| Health Care & Social Assistance | 0 (0.0%) | 14 (100.0%) |
| Arts, Entertainment & Recreation | 0 (0.0%) | 0 (0.0%) |
| Accommodation & Food Services | 0 (0.0%) | 0 (0.0%) |
| Public Administration | 0 (0.0%) | 0 (0.0%) |
| Total | 170 (57.6%) | 125 (42.4%) |
Education in Munds Park
School Enrollment in Munds Park
The most common levels of schooling among the 145 students in Munds Park are college / undergraduate (89 | 61.4%), middle school (44 | 30.3%), and elementary school (12 | 8.3%).
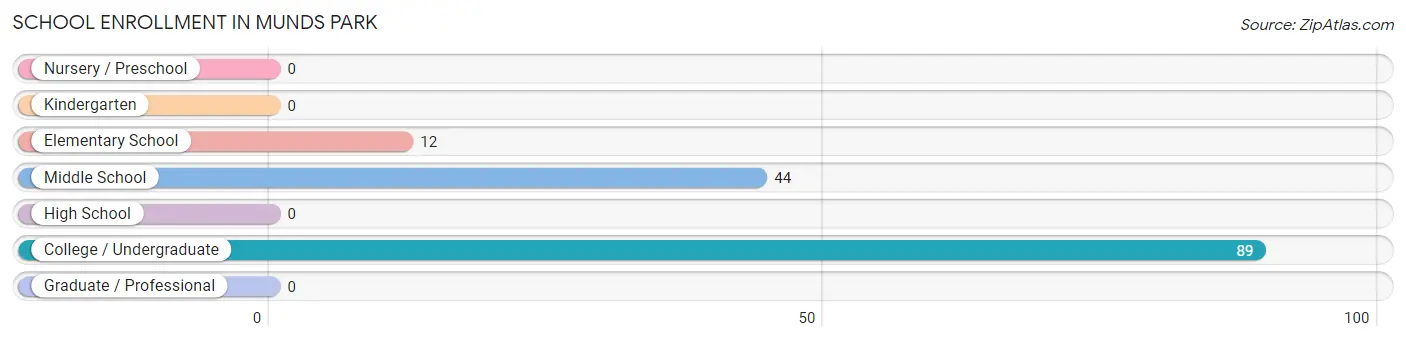
| School Level | # Students | % Students |
| Nursery / Preschool | 0 | 0.0% |
| Kindergarten | 0 | 0.0% |
| Elementary School | 12 | 8.3% |
| Middle School | 44 | 30.3% |
| High School | 0 | 0.0% |
| College / Undergraduate | 89 | 61.4% |
| Graduate / Professional | 0 | 0.0% |
| Total | 145 | 100.0% |
School Enrollment by Age by Funding Source in Munds Park
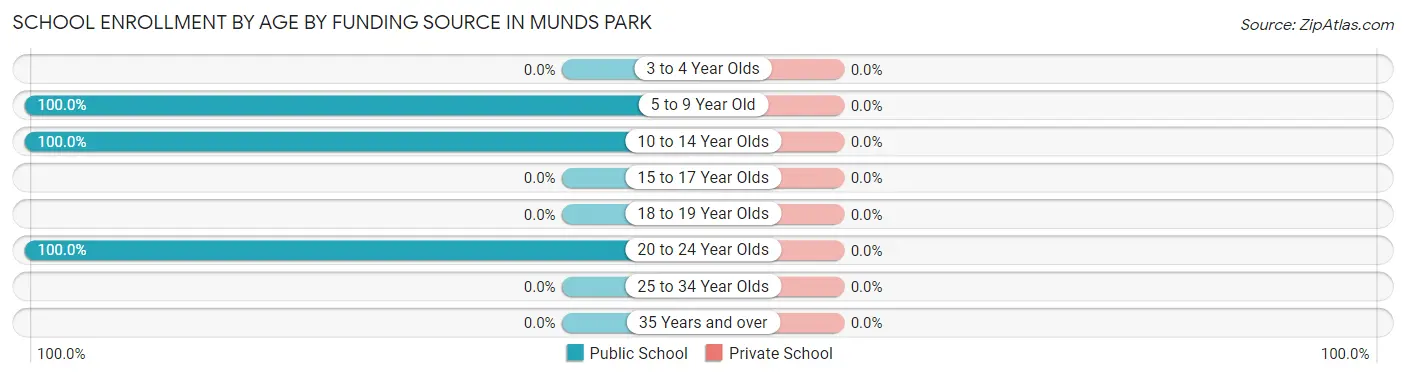
| Age Bracket | Public School | Private School |
| 3 to 4 Year Olds | 0 (0.0%) | 0 (0.0%) |
| 5 to 9 Year Old | 12 (100.0%) | 0 (0.0%) |
| 10 to 14 Year Olds | 44 (100.0%) | 0 (0.0%) |
| 15 to 17 Year Olds | 0 (0.0%) | 0 (0.0%) |
| 18 to 19 Year Olds | 0 (0.0%) | 0 (0.0%) |
| 20 to 24 Year Olds | 89 (100.0%) | 0 (0.0%) |
| 25 to 34 Year Olds | 0 (0.0%) | 0 (0.0%) |
| 35 Years and over | 0 (0.0%) | 0 (0.0%) |
| Total | 145 (100.0%) | 0 (0.0%) |
Educational Attainment by Field of Study in Munds Park
Business (248 | 48.2%), education (100 | 19.4%), social sciences (47 | 9.1%), literature & languages (46 | 8.9%), and liberal arts & history (40 | 7.8%) are the most common fields of study among 515 individuals in Munds Park who have obtained a bachelor's degree or higher.
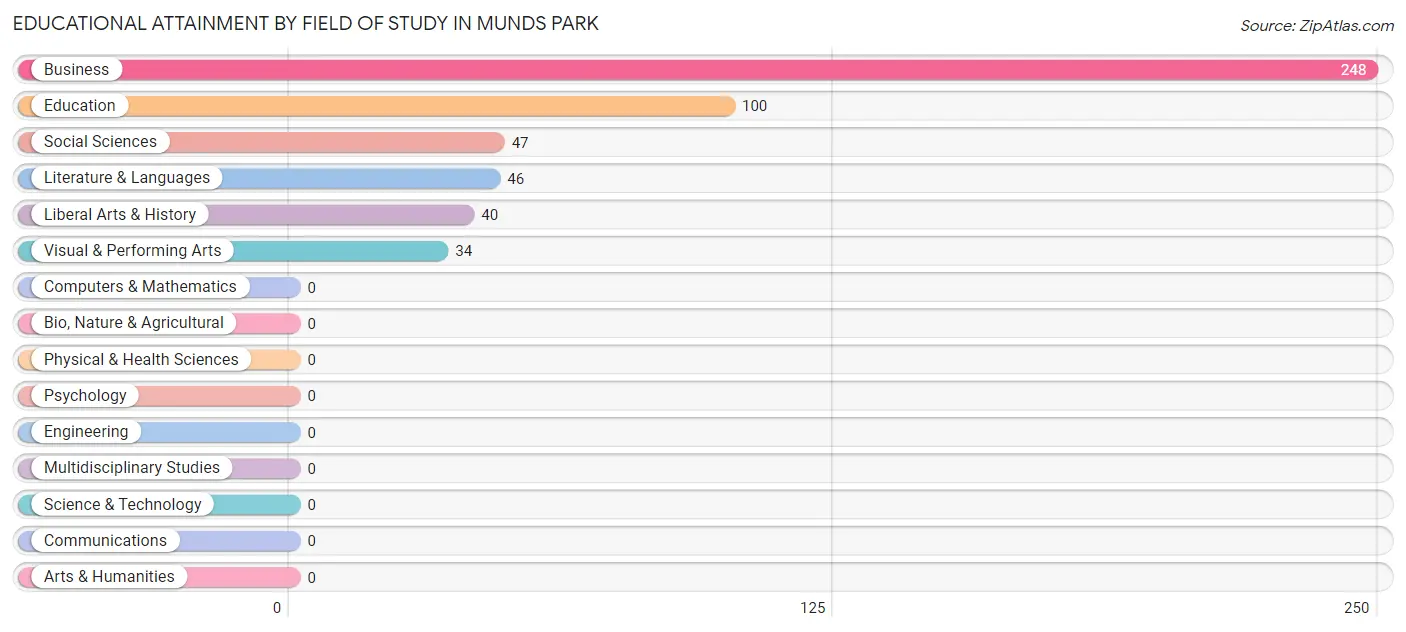
| Field of Study | # Graduates | % Graduates |
| Computers & Mathematics | 0 | 0.0% |
| Bio, Nature & Agricultural | 0 | 0.0% |
| Physical & Health Sciences | 0 | 0.0% |
| Psychology | 0 | 0.0% |
| Social Sciences | 47 | 9.1% |
| Engineering | 0 | 0.0% |
| Multidisciplinary Studies | 0 | 0.0% |
| Science & Technology | 0 | 0.0% |
| Business | 248 | 48.2% |
| Education | 100 | 19.4% |
| Literature & Languages | 46 | 8.9% |
| Liberal Arts & History | 40 | 7.8% |
| Visual & Performing Arts | 34 | 6.6% |
| Communications | 0 | 0.0% |
| Arts & Humanities | 0 | 0.0% |
| Total | 515 | 100.0% |
Transportation & Commute in Munds Park
Vehicle Availability by Sex in Munds Park
The most prevalent vehicle ownership categories in Munds Park are males with 1 vehicle (86, accounting for 50.6%) and females with 1 vehicle (14, making up 68.8%).
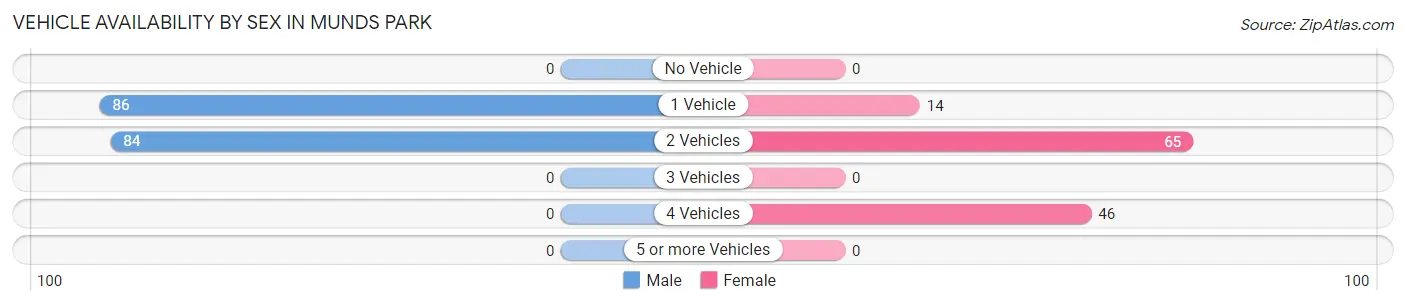
| Vehicles Available | Male | Female |
| No Vehicle | 0 (0.0%) | 0 (0.0%) |
| 1 Vehicle | 86 (50.6%) | 14 (11.2%) |
| 2 Vehicles | 84 (49.4%) | 65 (52.0%) |
| 3 Vehicles | 0 (0.0%) | 0 (0.0%) |
| 4 Vehicles | 0 (0.0%) | 46 (36.8%) |
| 5 or more Vehicles | 0 (0.0%) | 0 (0.0%) |
| Total | 170 (100.0%) | 125 (100.0%) |
Commute Time in Munds Park
The most frequently occuring commute durations in Munds Park are 15 to 19 minutes (111 commuters, 37.6%), 25 to 29 minutes (92 commuters, 31.2%), and less than 5 minutes (40 commuters, 13.6%).
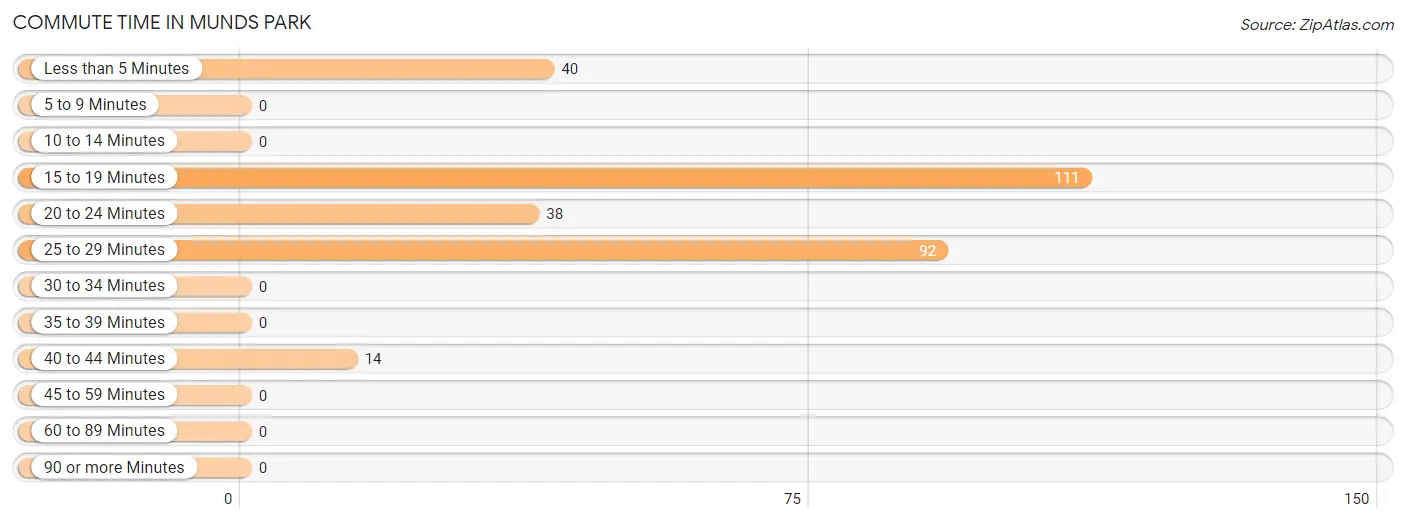
| Commute Time | # Commuters | % Commuters |
| Less than 5 Minutes | 40 | 13.6% |
| 5 to 9 Minutes | 0 | 0.0% |
| 10 to 14 Minutes | 0 | 0.0% |
| 15 to 19 Minutes | 111 | 37.6% |
| 20 to 24 Minutes | 38 | 12.9% |
| 25 to 29 Minutes | 92 | 31.2% |
| 30 to 34 Minutes | 0 | 0.0% |
| 35 to 39 Minutes | 0 | 0.0% |
| 40 to 44 Minutes | 14 | 4.8% |
| 45 to 59 Minutes | 0 | 0.0% |
| 60 to 89 Minutes | 0 | 0.0% |
| 90 or more Minutes | 0 | 0.0% |
Commute Time by Sex in Munds Park
The most common commute times in Munds Park are 15 to 19 minutes (84 commuters, 49.4%) for males and 25 to 29 minutes (46 commuters, 36.8%) for females.
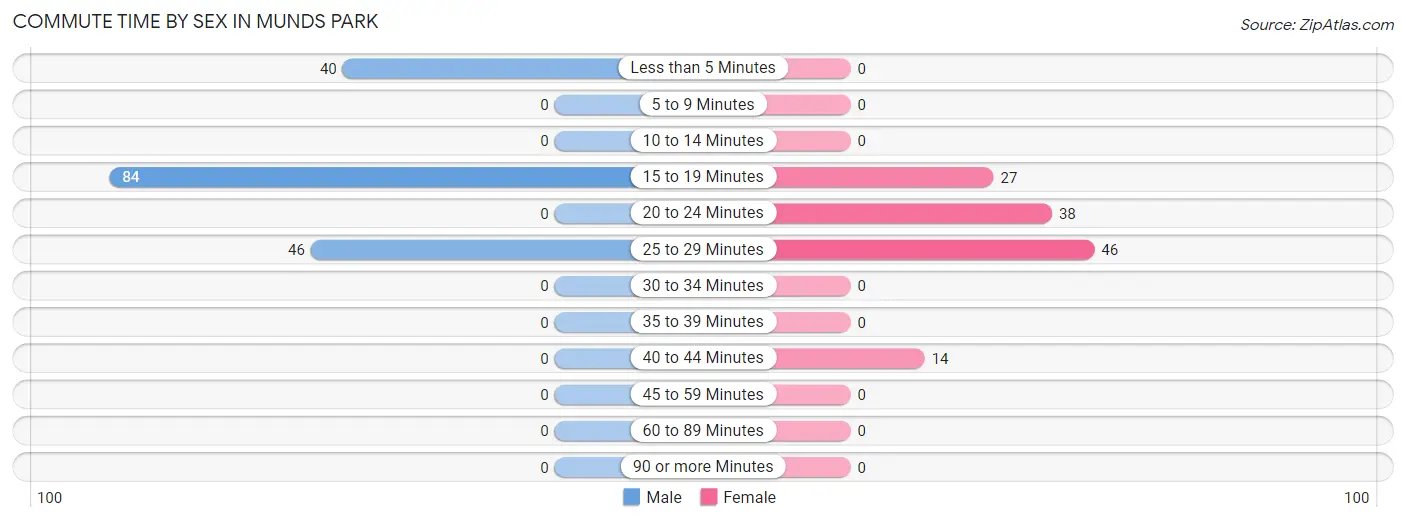
| Commute Time | Male | Female |
| Less than 5 Minutes | 40 (23.5%) | 0 (0.0%) |
| 5 to 9 Minutes | 0 (0.0%) | 0 (0.0%) |
| 10 to 14 Minutes | 0 (0.0%) | 0 (0.0%) |
| 15 to 19 Minutes | 84 (49.4%) | 27 (21.6%) |
| 20 to 24 Minutes | 0 (0.0%) | 38 (30.4%) |
| 25 to 29 Minutes | 46 (27.1%) | 46 (36.8%) |
| 30 to 34 Minutes | 0 (0.0%) | 0 (0.0%) |
| 35 to 39 Minutes | 0 (0.0%) | 0 (0.0%) |
| 40 to 44 Minutes | 0 (0.0%) | 14 (11.2%) |
| 45 to 59 Minutes | 0 (0.0%) | 0 (0.0%) |
| 60 to 89 Minutes | 0 (0.0%) | 0 (0.0%) |
| 90 or more Minutes | 0 (0.0%) | 0 (0.0%) |
Time of Departure to Work by Sex in Munds Park
The most frequent times of departure to work in Munds Park are 12:00 AM to 4:59 AM (48, 28.2%) for males and 9:00 AM to 9:59 AM (46, 36.8%) for females.
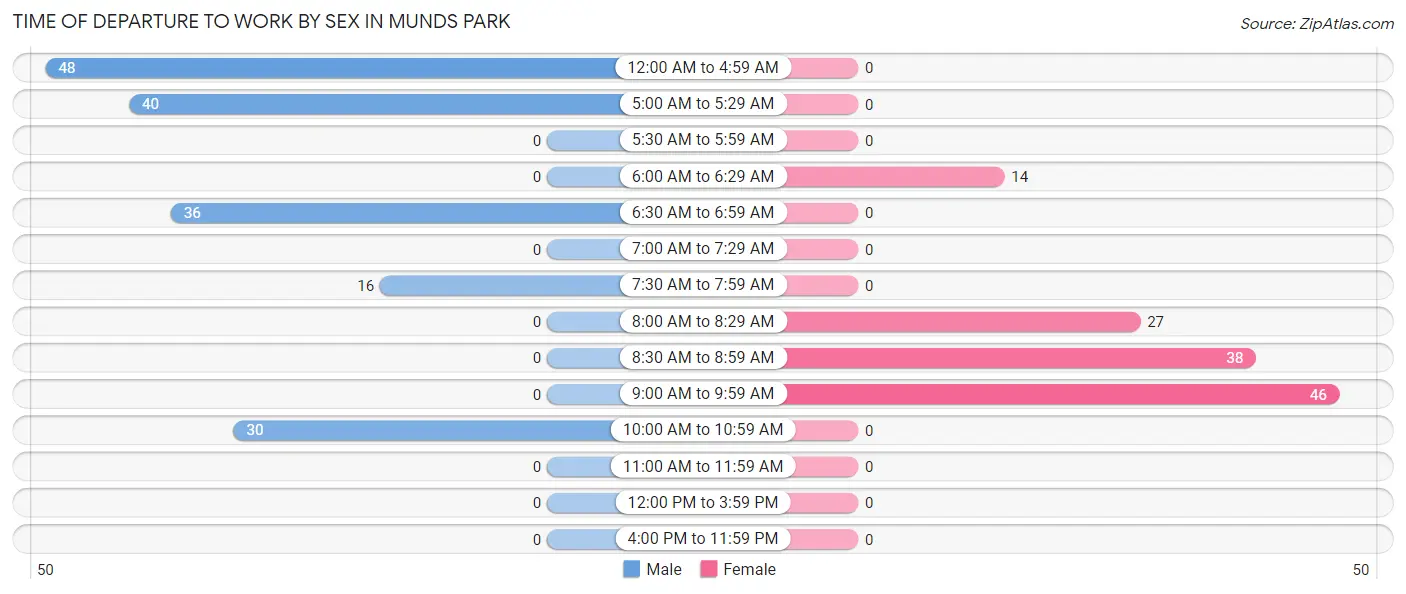
| Time of Departure | Male | Female |
| 12:00 AM to 4:59 AM | 48 (28.2%) | 0 (0.0%) |
| 5:00 AM to 5:29 AM | 40 (23.5%) | 0 (0.0%) |
| 5:30 AM to 5:59 AM | 0 (0.0%) | 0 (0.0%) |
| 6:00 AM to 6:29 AM | 0 (0.0%) | 14 (11.2%) |
| 6:30 AM to 6:59 AM | 36 (21.2%) | 0 (0.0%) |
| 7:00 AM to 7:29 AM | 0 (0.0%) | 0 (0.0%) |
| 7:30 AM to 7:59 AM | 16 (9.4%) | 0 (0.0%) |
| 8:00 AM to 8:29 AM | 0 (0.0%) | 27 (21.6%) |
| 8:30 AM to 8:59 AM | 0 (0.0%) | 38 (30.4%) |
| 9:00 AM to 9:59 AM | 0 (0.0%) | 46 (36.8%) |
| 10:00 AM to 10:59 AM | 30 (17.6%) | 0 (0.0%) |
| 11:00 AM to 11:59 AM | 0 (0.0%) | 0 (0.0%) |
| 12:00 PM to 3:59 PM | 0 (0.0%) | 0 (0.0%) |
| 4:00 PM to 11:59 PM | 0 (0.0%) | 0 (0.0%) |
| Total | 170 (100.0%) | 125 (100.0%) |
Housing Occupancy in Munds Park
Occupancy by Ownership in Munds Park
Of the total 554 dwellings in Munds Park, owner-occupied units account for 498 (89.9%), while renter-occupied units make up 56 (10.1%).
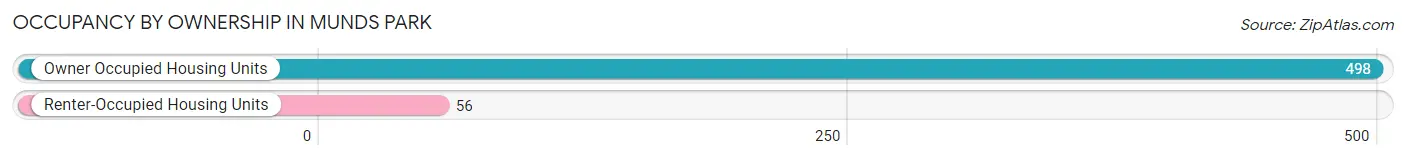
| Occupancy | # Housing Units | % Housing Units |
| Owner Occupied Housing Units | 498 | 89.9% |
| Renter-Occupied Housing Units | 56 | 10.1% |
| Total Occupied Housing Units | 554 | 100.0% |
Occupancy by Household Size in Munds Park
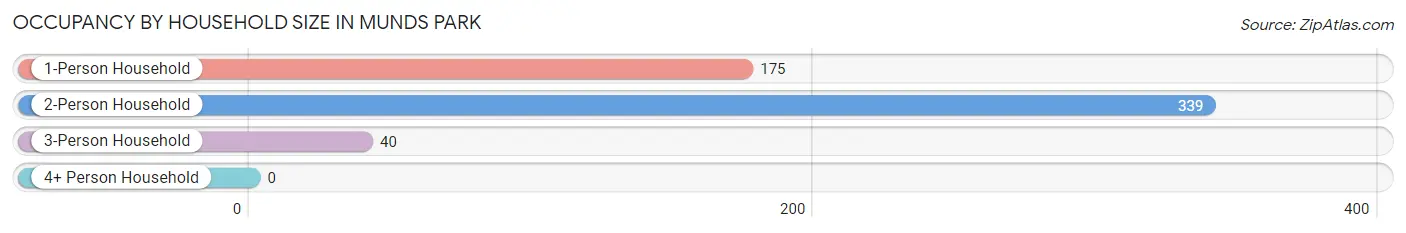
| Household Size | # Housing Units | % Housing Units |
| 1-Person Household | 175 | 31.6% |
| 2-Person Household | 339 | 61.2% |
| 3-Person Household | 40 | 7.2% |
| 4+ Person Household | 0 | 0.0% |
| Total Housing Units | 554 | 100.0% |
Occupancy by Ownership by Household Size in Munds Park
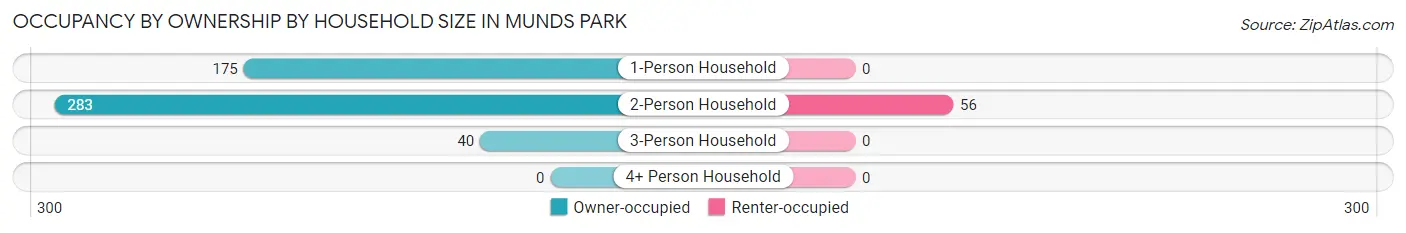
| Household Size | Owner-occupied | Renter-occupied |
| 1-Person Household | 175 (100.0%) | 0 (0.0%) |
| 2-Person Household | 283 (83.5%) | 56 (16.5%) |
| 3-Person Household | 40 (100.0%) | 0 (0.0%) |
| 4+ Person Household | 0 (0.0%) | 0 (0.0%) |
| Total Housing Units | 498 (89.9%) | 56 (10.1%) |
Occupancy by Educational Attainment in Munds Park
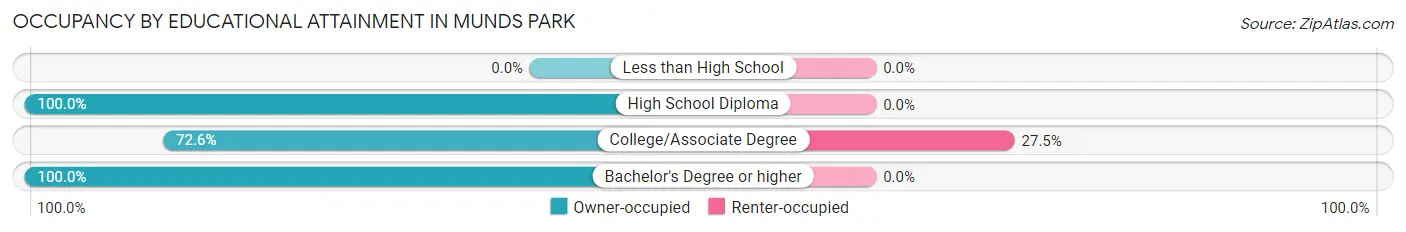
| Household Size | Owner-occupied | Renter-occupied |
| Less than High School | 0 (0.0%) | 0 (0.0%) |
| High School Diploma | 40 (100.0%) | 0 (0.0%) |
| College/Associate Degree | 148 (72.6%) | 56 (27.5%) |
| Bachelor's Degree or higher | 310 (100.0%) | 0 (0.0%) |
Occupancy by Age of Householder in Munds Park
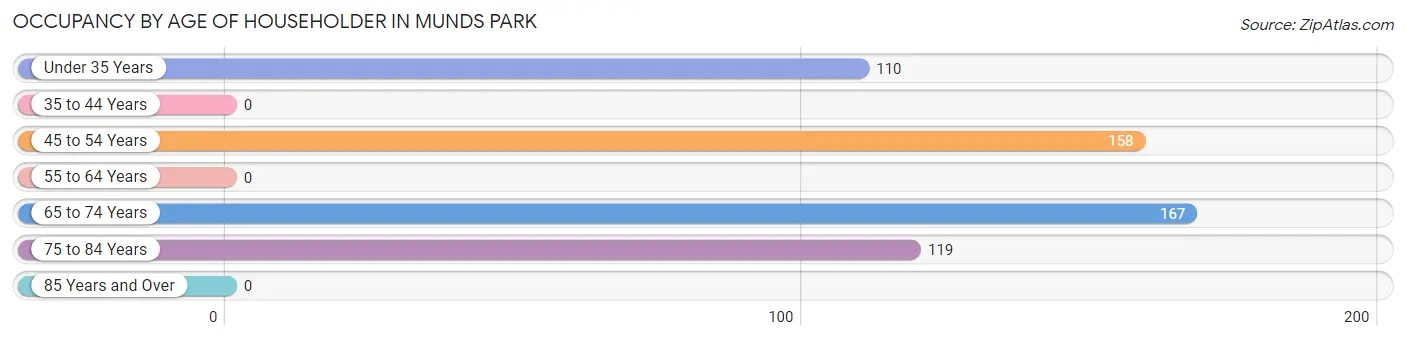
| Age Bracket | # Households | % Households |
| Under 35 Years | 110 | 19.9% |
| 35 to 44 Years | 0 | 0.0% |
| 45 to 54 Years | 158 | 28.5% |
| 55 to 64 Years | 0 | 0.0% |
| 65 to 74 Years | 167 | 30.1% |
| 75 to 84 Years | 119 | 21.5% |
| 85 Years and Over | 0 | 0.0% |
| Total | 554 | 100.0% |
Housing Finances in Munds Park
Median Income by Occupancy in Munds Park
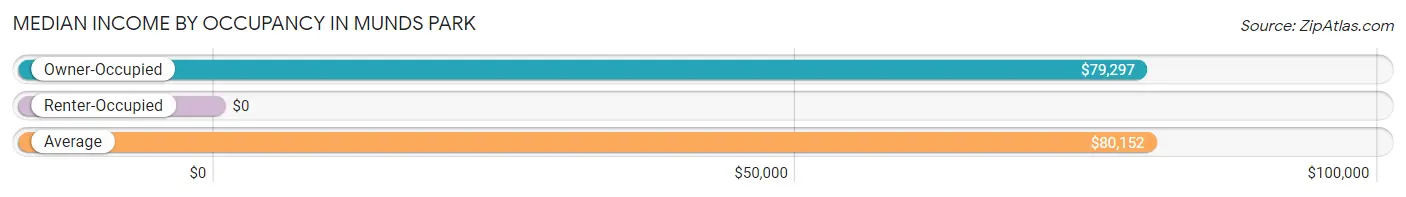
| Occupancy Type | # Households | Median Income |
| Owner-Occupied | 498 (89.9%) | $79,297 |
| Renter-Occupied | 56 (10.1%) | $0 |
| Average | 554 (100.0%) | $80,152 |
Occupancy by Householder Income Bracket in Munds Park
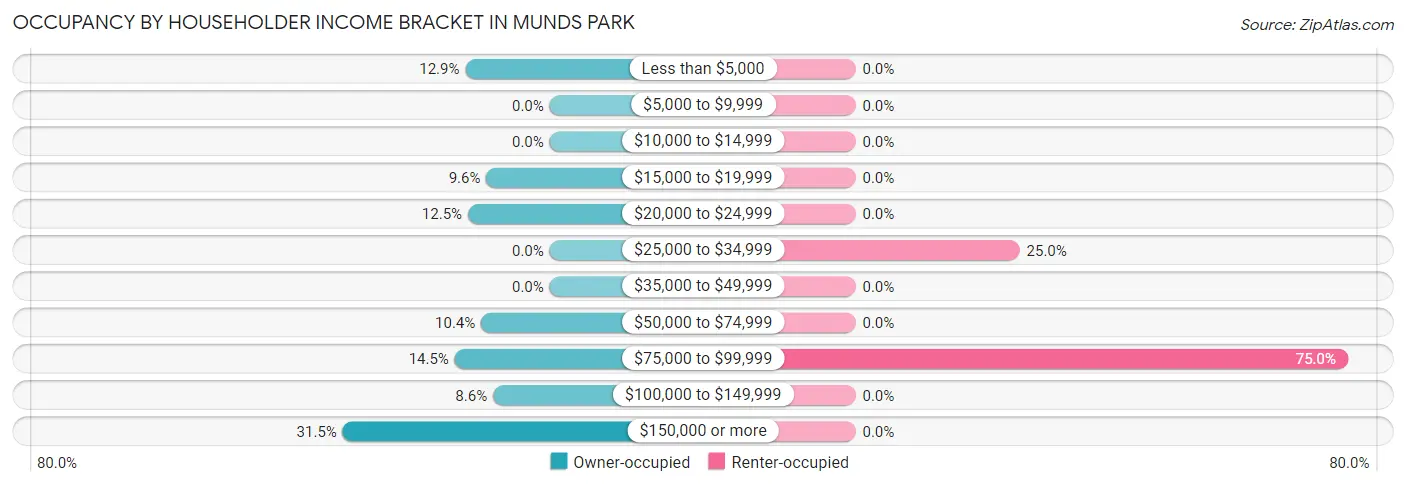
| Income Bracket | Owner-occupied | Renter-occupied |
| Less than $5,000 | 64 (12.9%) | 0 (0.0%) |
| $5,000 to $9,999 | 0 (0.0%) | 0 (0.0%) |
| $10,000 to $14,999 | 0 (0.0%) | 0 (0.0%) |
| $15,000 to $19,999 | 48 (9.6%) | 0 (0.0%) |
| $20,000 to $24,999 | 62 (12.4%) | 0 (0.0%) |
| $25,000 to $34,999 | 0 (0.0%) | 14 (25.0%) |
| $35,000 to $49,999 | 0 (0.0%) | 0 (0.0%) |
| $50,000 to $74,999 | 52 (10.4%) | 0 (0.0%) |
| $75,000 to $99,999 | 72 (14.5%) | 42 (75.0%) |
| $100,000 to $149,999 | 43 (8.6%) | 0 (0.0%) |
| $150,000 or more | 157 (31.5%) | 0 (0.0%) |
| Total | 498 (100.0%) | 56 (100.0%) |
Monthly Housing Cost Tiers in Munds Park
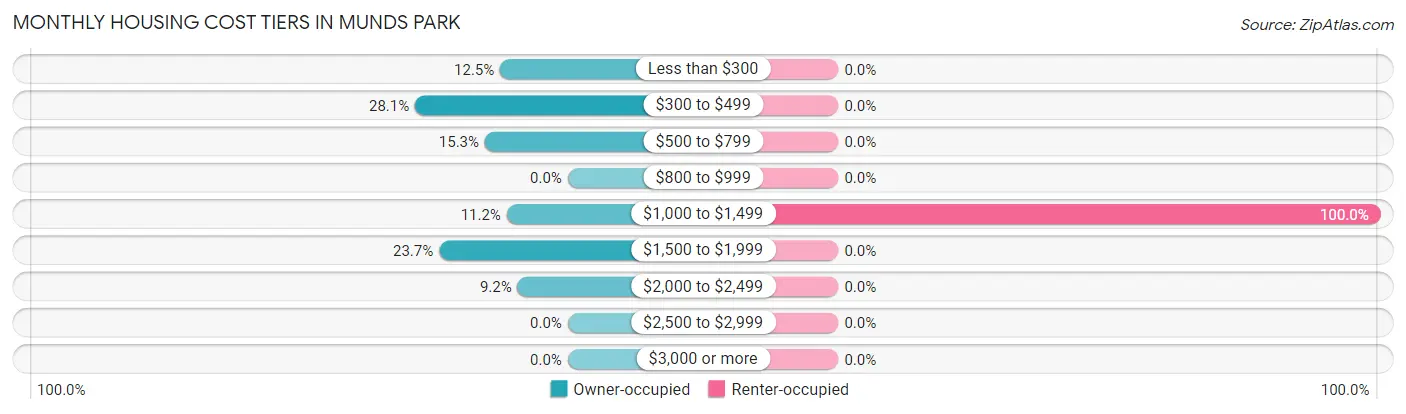
| Monthly Cost | Owner-occupied | Renter-occupied |
| Less than $300 | 62 (12.4%) | 0 (0.0%) |
| $300 to $499 | 140 (28.1%) | 0 (0.0%) |
| $500 to $799 | 76 (15.3%) | 0 (0.0%) |
| $800 to $999 | 0 (0.0%) | 0 (0.0%) |
| $1,000 to $1,499 | 56 (11.2%) | 56 (100.0%) |
| $1,500 to $1,999 | 118 (23.7%) | 0 (0.0%) |
| $2,000 to $2,499 | 46 (9.2%) | 0 (0.0%) |
| $2,500 to $2,999 | 0 (0.0%) | 0 (0.0%) |
| $3,000 or more | 0 (0.0%) | 0 (0.0%) |
| Total | 498 (100.0%) | 56 (100.0%) |
Physical Housing Characteristics in Munds Park
Housing Structures in Munds Park
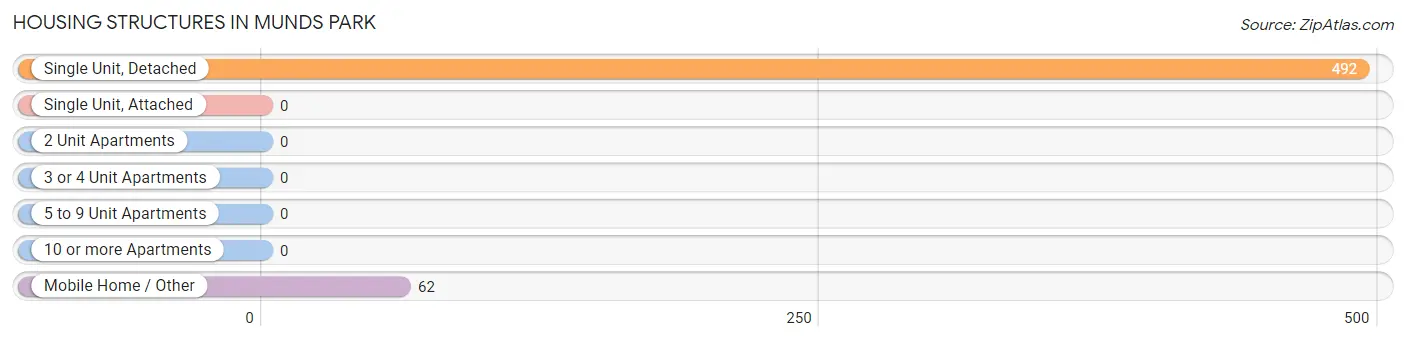
| Structure Type | # Housing Units | % Housing Units |
| Single Unit, Detached | 492 | 88.8% |
| Single Unit, Attached | 0 | 0.0% |
| 2 Unit Apartments | 0 | 0.0% |
| 3 or 4 Unit Apartments | 0 | 0.0% |
| 5 to 9 Unit Apartments | 0 | 0.0% |
| 10 or more Apartments | 0 | 0.0% |
| Mobile Home / Other | 62 | 11.2% |
| Total | 554 | 100.0% |
Housing Structures by Occupancy in Munds Park
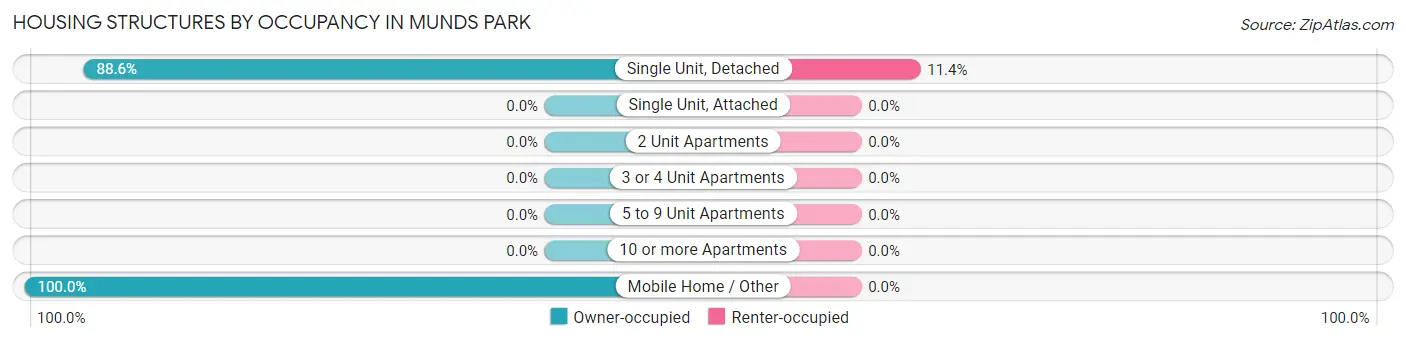
| Structure Type | Owner-occupied | Renter-occupied |
| Single Unit, Detached | 436 (88.6%) | 56 (11.4%) |
| Single Unit, Attached | 0 (0.0%) | 0 (0.0%) |
| 2 Unit Apartments | 0 (0.0%) | 0 (0.0%) |
| 3 or 4 Unit Apartments | 0 (0.0%) | 0 (0.0%) |
| 5 to 9 Unit Apartments | 0 (0.0%) | 0 (0.0%) |
| 10 or more Apartments | 0 (0.0%) | 0 (0.0%) |
| Mobile Home / Other | 62 (100.0%) | 0 (0.0%) |
| Total | 498 (89.9%) | 56 (10.1%) |
Housing Structures by Number of Rooms in Munds Park
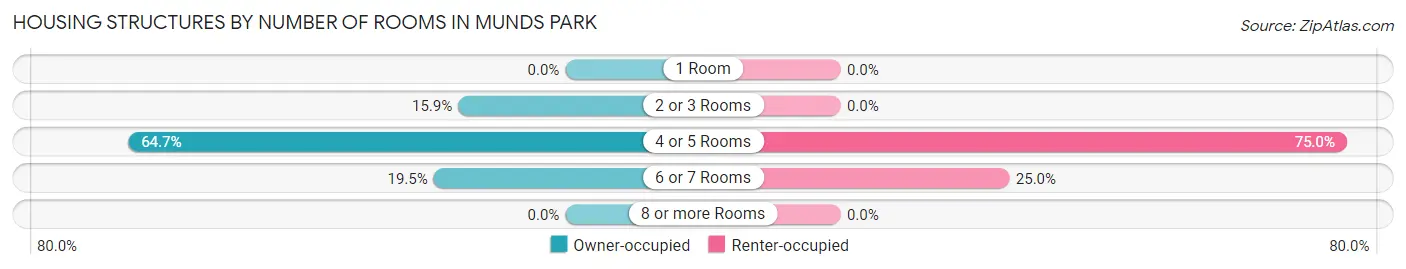
| Number of Rooms | Owner-occupied | Renter-occupied |
| 1 Room | 0 (0.0%) | 0 (0.0%) |
| 2 or 3 Rooms | 79 (15.9%) | 0 (0.0%) |
| 4 or 5 Rooms | 322 (64.7%) | 42 (75.0%) |
| 6 or 7 Rooms | 97 (19.5%) | 14 (25.0%) |
| 8 or more Rooms | 0 (0.0%) | 0 (0.0%) |
| Total | 498 (100.0%) | 56 (100.0%) |
Housing Structure by Heating Type in Munds Park
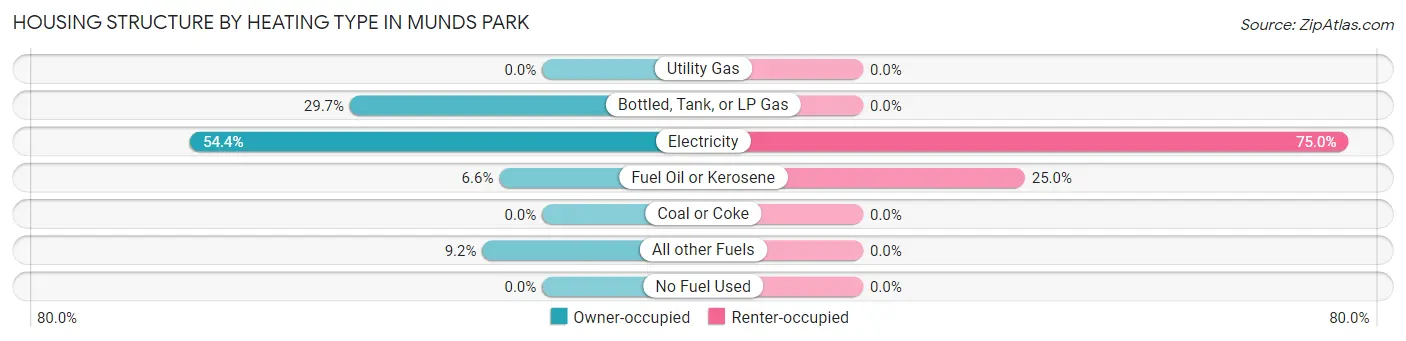
| Heating Type | Owner-occupied | Renter-occupied |
| Utility Gas | 0 (0.0%) | 0 (0.0%) |
| Bottled, Tank, or LP Gas | 148 (29.7%) | 0 (0.0%) |
| Electricity | 271 (54.4%) | 42 (75.0%) |
| Fuel Oil or Kerosene | 33 (6.6%) | 14 (25.0%) |
| Coal or Coke | 0 (0.0%) | 0 (0.0%) |
| All other Fuels | 46 (9.2%) | 0 (0.0%) |
| No Fuel Used | 0 (0.0%) | 0 (0.0%) |
| Total | 498 (100.0%) | 56 (100.0%) |
Household Vehicle Usage in Munds Park
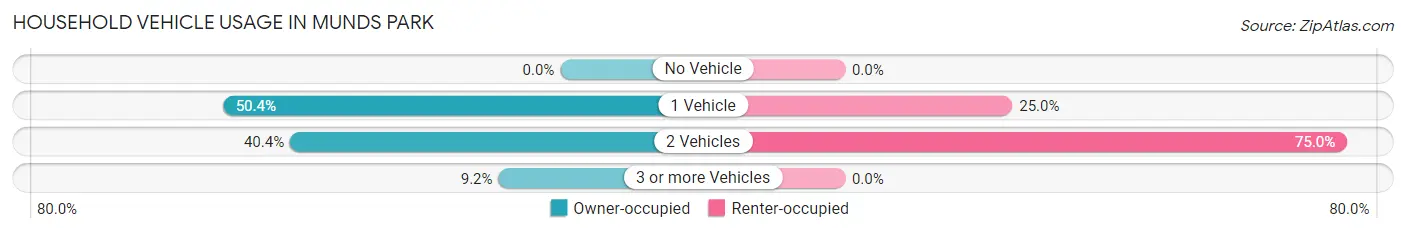
| Vehicles per Household | Owner-occupied | Renter-occupied |
| No Vehicle | 0 (0.0%) | 0 (0.0%) |
| 1 Vehicle | 251 (50.4%) | 14 (25.0%) |
| 2 Vehicles | 201 (40.4%) | 42 (75.0%) |
| 3 or more Vehicles | 46 (9.2%) | 0 (0.0%) |
| Total | 498 (100.0%) | 56 (100.0%) |
Real Estate & Mortgages in Munds Park
Real Estate and Mortgage Overview in Munds Park
| Characteristic | Without Mortgage | With Mortgage |
| Housing Units | 278 | 220 |
| Median Property Value | $392,800 | $325,600 |
| Median Household Income | - | - |
| Monthly Housing Costs | $437 | $0 |
| Real Estate Taxes | $2,009 | $0 |
Property Value by Mortgage Status in Munds Park
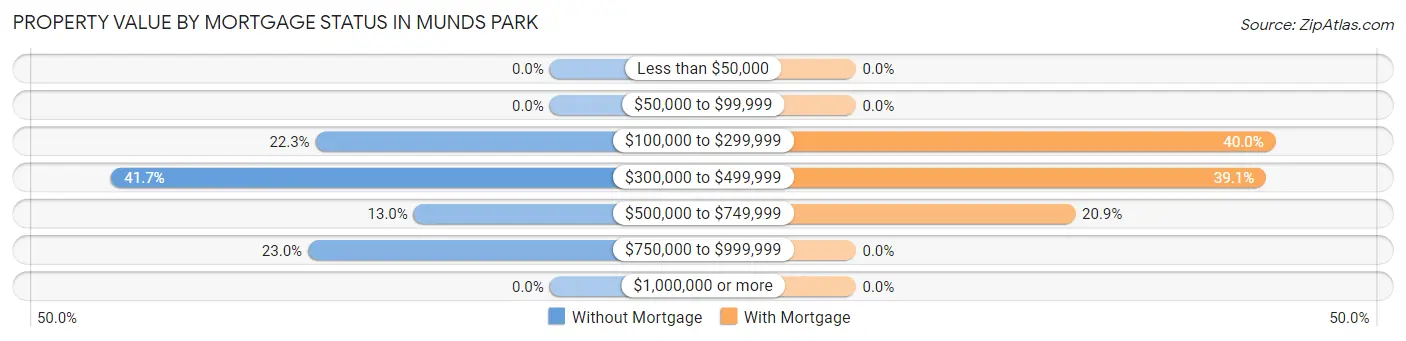
| Property Value | Without Mortgage | With Mortgage |
| Less than $50,000 | 0 (0.0%) | 0 (0.0%) |
| $50,000 to $99,999 | 0 (0.0%) | 0 (0.0%) |
| $100,000 to $299,999 | 62 (22.3%) | 88 (40.0%) |
| $300,000 to $499,999 | 116 (41.7%) | 86 (39.1%) |
| $500,000 to $749,999 | 36 (13.0%) | 46 (20.9%) |
| $750,000 to $999,999 | 64 (23.0%) | 0 (0.0%) |
| $1,000,000 or more | 0 (0.0%) | 0 (0.0%) |
| Total | 278 (100.0%) | 220 (100.0%) |
Household Income by Mortgage Status in Munds Park
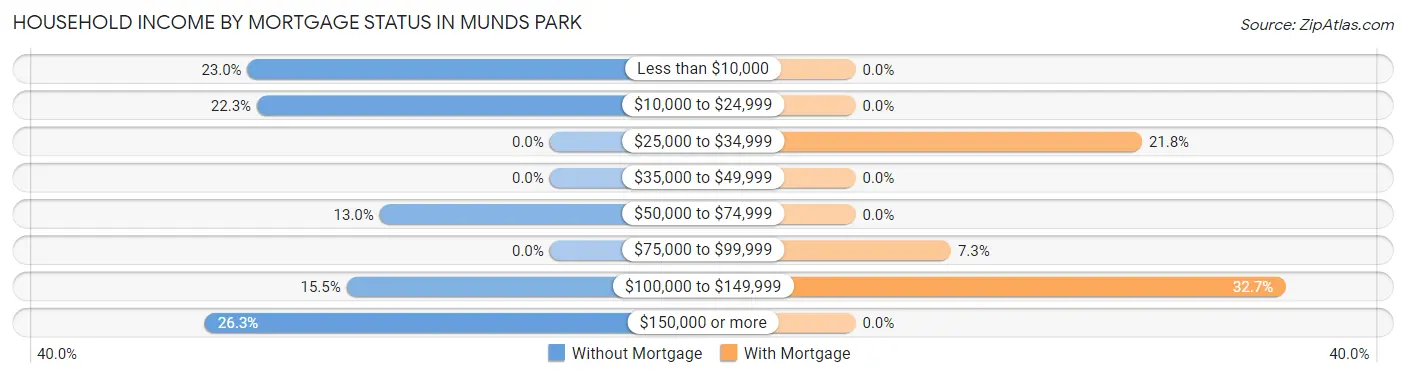
| Household Income | Without Mortgage | With Mortgage |
| Less than $10,000 | 64 (23.0%) | 0 (0.0%) |
| $10,000 to $24,999 | 62 (22.3%) | 0 (0.0%) |
| $25,000 to $34,999 | 0 (0.0%) | 48 (21.8%) |
| $35,000 to $49,999 | 0 (0.0%) | 0 (0.0%) |
| $50,000 to $74,999 | 36 (13.0%) | 0 (0.0%) |
| $75,000 to $99,999 | 0 (0.0%) | 16 (7.3%) |
| $100,000 to $149,999 | 43 (15.5%) | 72 (32.7%) |
| $150,000 or more | 73 (26.3%) | 0 (0.0%) |
| Total | 278 (100.0%) | 220 (100.0%) |
Property Value to Household Income Ratio in Munds Park
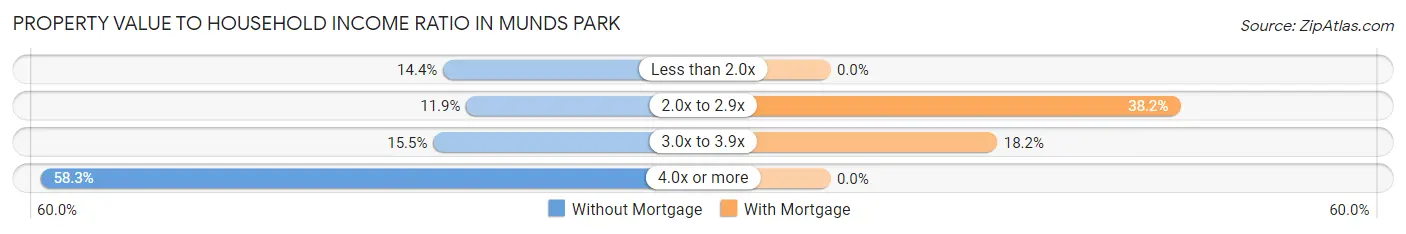
| Value-to-Income Ratio | Without Mortgage | With Mortgage |
| Less than 2.0x | 40 (14.4%) | 0 (0.0%) |
| 2.0x to 2.9x | 33 (11.9%) | 84 (38.2%) |
| 3.0x to 3.9x | 43 (15.5%) | 40 (18.2%) |
| 4.0x or more | 162 (58.3%) | 0 (0.0%) |
| Total | 278 (100.0%) | 220 (100.0%) |
Real Estate Taxes by Mortgage Status in Munds Park
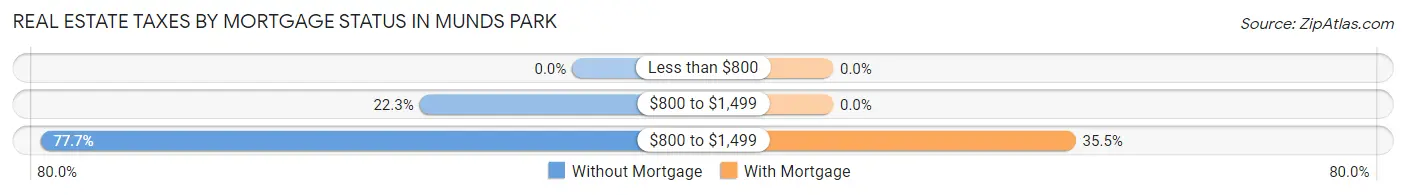
| Property Taxes | Without Mortgage | With Mortgage |
| Less than $800 | 0 (0.0%) | 0 (0.0%) |
| $800 to $1,499 | 62 (22.3%) | 0 (0.0%) |
| $800 to $1,499 | 216 (77.7%) | 78 (35.4%) |
| Total | 278 (100.0%) | 220 (100.0%) |
Health & Disability in Munds Park
Health Insurance Coverage by Age in Munds Park
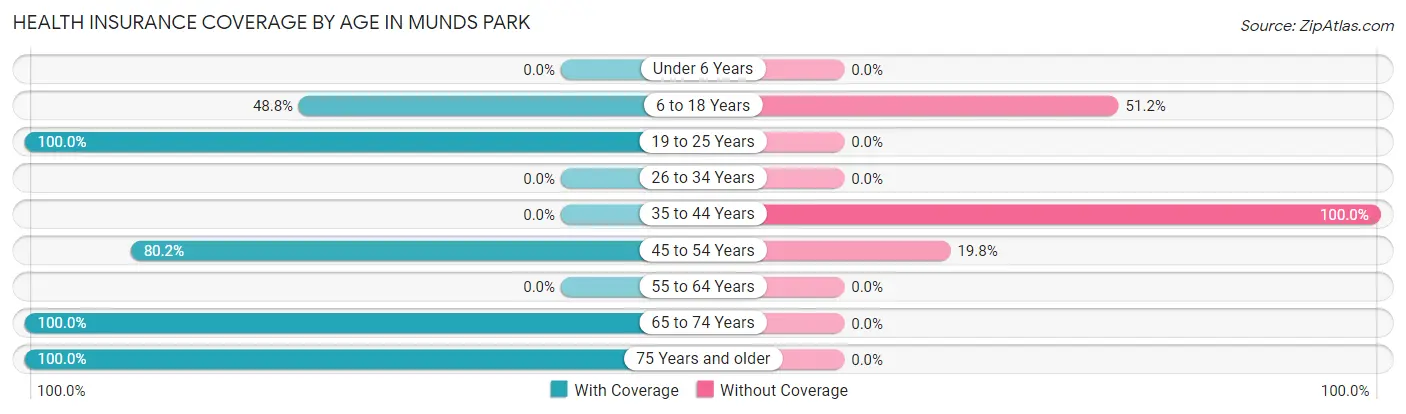
| Age Bracket | With Coverage | Without Coverage |
| Under 6 Years | 0 (0.0%) | 0 (0.0%) |
| 6 to 18 Years | 42 (48.8%) | 44 (51.2%) |
| 19 to 25 Years | 137 (100.0%) | 0 (0.0%) |
| 26 to 34 Years | 0 (0.0%) | 0 (0.0%) |
| 35 to 44 Years | 0 (0.0%) | 38 (100.0%) |
| 45 to 54 Years | 162 (80.2%) | 40 (19.8%) |
| 55 to 64 Years | 0 (0.0%) | 0 (0.0%) |
| 65 to 74 Years | 271 (100.0%) | 0 (0.0%) |
| 75 Years and older | 216 (100.0%) | 0 (0.0%) |
| Total | 828 (87.2%) | 122 (12.8%) |
Health Insurance Coverage by Citizenship Status in Munds Park
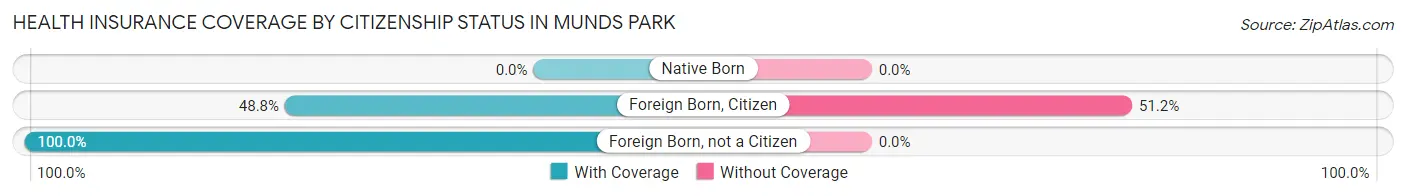
| Citizenship Status | With Coverage | Without Coverage |
| Native Born | 0 (0.0%) | 0 (0.0%) |
| Foreign Born, Citizen | 42 (48.8%) | 44 (51.2%) |
| Foreign Born, not a Citizen | 137 (100.0%) | 0 (0.0%) |
Health Insurance Coverage by Household Income in Munds Park
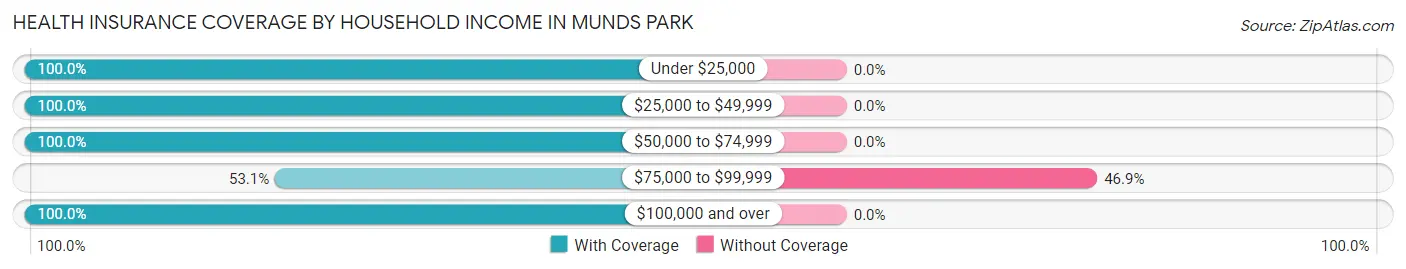
| Household Income | With Coverage | Without Coverage |
| Under $25,000 | 201 (100.0%) | 0 (0.0%) |
| $25,000 to $49,999 | 26 (100.0%) | 0 (0.0%) |
| $50,000 to $74,999 | 86 (100.0%) | 0 (0.0%) |
| $75,000 to $99,999 | 138 (53.1%) | 122 (46.9%) |
| $100,000 and over | 377 (100.0%) | 0 (0.0%) |
Public vs Private Health Insurance Coverage by Age in Munds Park
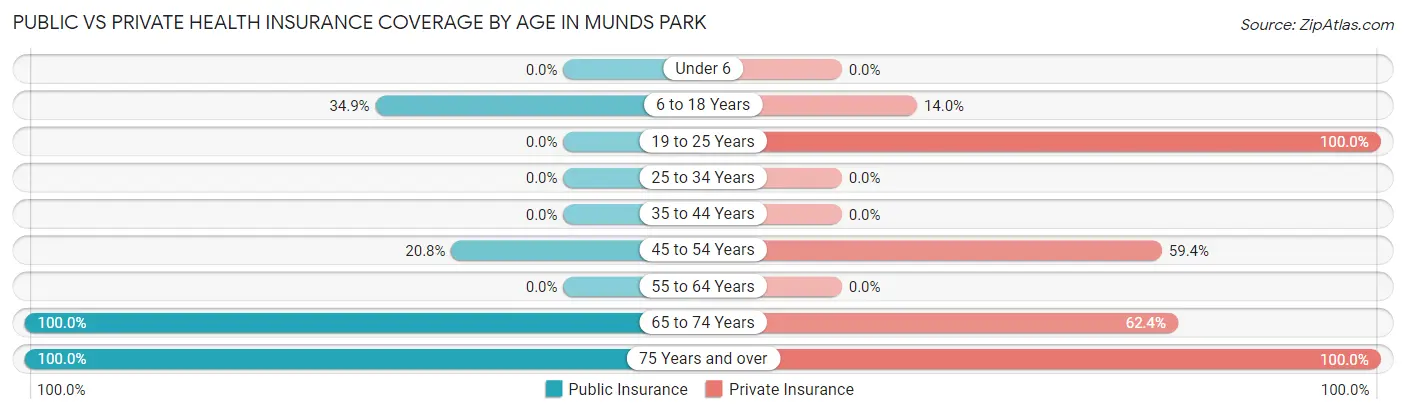
| Age Bracket | Public Insurance | Private Insurance |
| Under 6 | 0 (0.0%) | 0 (0.0%) |
| 6 to 18 Years | 30 (34.9%) | 12 (14.0%) |
| 19 to 25 Years | 0 (0.0%) | 137 (100.0%) |
| 25 to 34 Years | 0 (0.0%) | 0 (0.0%) |
| 35 to 44 Years | 0 (0.0%) | 0 (0.0%) |
| 45 to 54 Years | 42 (20.8%) | 120 (59.4%) |
| 55 to 64 Years | 0 (0.0%) | 0 (0.0%) |
| 65 to 74 Years | 271 (100.0%) | 169 (62.4%) |
| 75 Years and over | 216 (100.0%) | 216 (100.0%) |
| Total | 559 (58.8%) | 654 (68.8%) |
Disability Status by Sex by Age in Munds Park
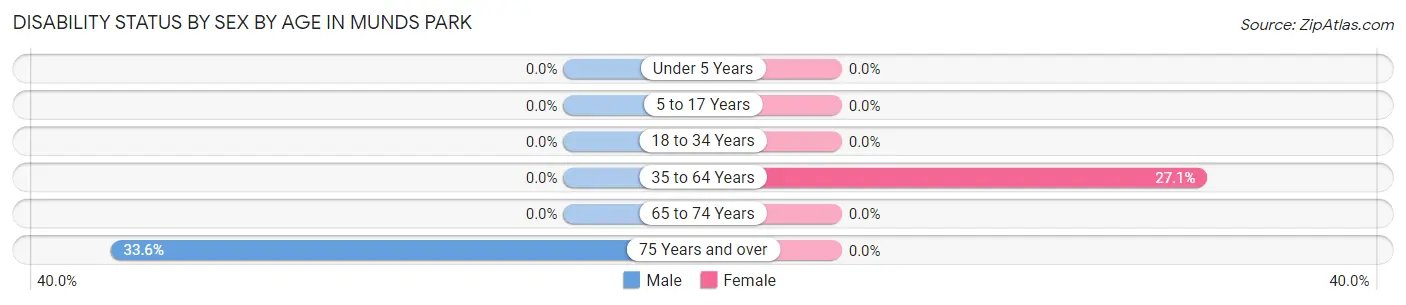
| Age Bracket | Male | Female |
| Under 5 Years | 0 (0.0%) | 0 (0.0%) |
| 5 to 17 Years | 0 (0.0%) | 0 (0.0%) |
| 18 to 34 Years | 0 (0.0%) | 0 (0.0%) |
| 35 to 64 Years | 0 (0.0%) | 38 (27.1%) |
| 65 to 74 Years | 0 (0.0%) | 0 (0.0%) |
| 75 Years and over | 40 (33.6%) | 0 (0.0%) |
Disability Class by Sex by Age in Munds Park
Disability Class: Hearing Difficulty
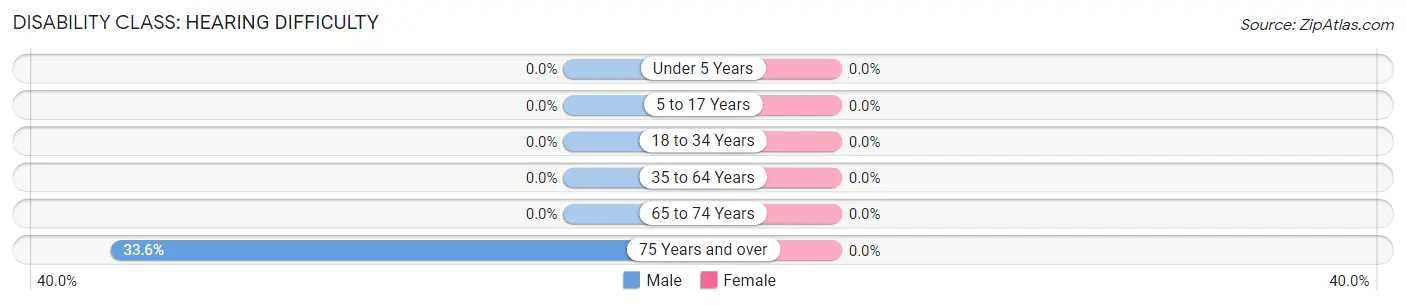
| Age Bracket | Male | Female |
| Under 5 Years | 0 (0.0%) | 0 (0.0%) |
| 5 to 17 Years | 0 (0.0%) | 0 (0.0%) |
| 18 to 34 Years | 0 (0.0%) | 0 (0.0%) |
| 35 to 64 Years | 0 (0.0%) | 0 (0.0%) |
| 65 to 74 Years | 0 (0.0%) | 0 (0.0%) |
| 75 Years and over | 40 (33.6%) | 0 (0.0%) |
Disability Class: Vision Difficulty
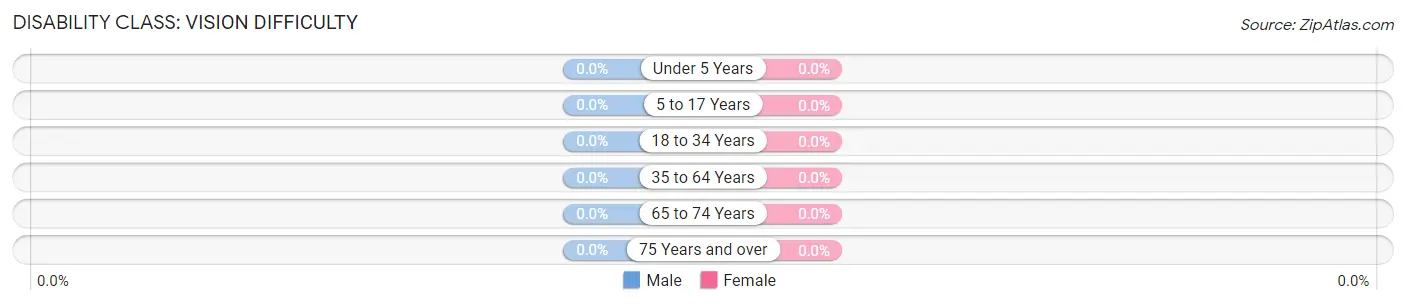
| Age Bracket | Male | Female |
| Under 5 Years | 0 (0.0%) | 0 (0.0%) |
| 5 to 17 Years | 0 (0.0%) | 0 (0.0%) |
| 18 to 34 Years | 0 (0.0%) | 0 (0.0%) |
| 35 to 64 Years | 0 (0.0%) | 0 (0.0%) |
| 65 to 74 Years | 0 (0.0%) | 0 (0.0%) |
| 75 Years and over | 0 (0.0%) | 0 (0.0%) |
Disability Class: Cognitive Difficulty
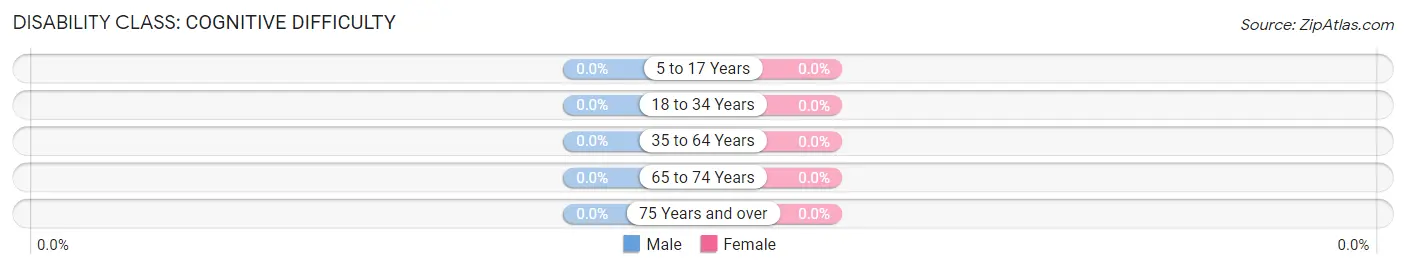
| Age Bracket | Male | Female |
| 5 to 17 Years | 0 (0.0%) | 0 (0.0%) |
| 18 to 34 Years | 0 (0.0%) | 0 (0.0%) |
| 35 to 64 Years | 0 (0.0%) | 0 (0.0%) |
| 65 to 74 Years | 0 (0.0%) | 0 (0.0%) |
| 75 Years and over | 0 (0.0%) | 0 (0.0%) |
Disability Class: Ambulatory Difficulty
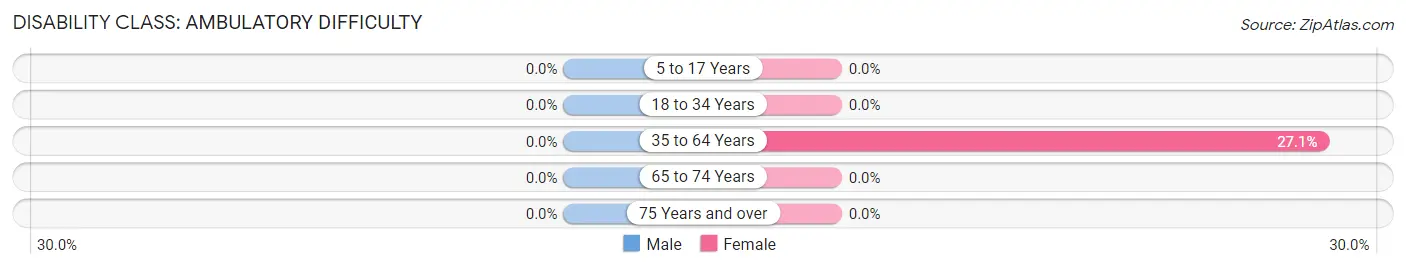
| Age Bracket | Male | Female |
| 5 to 17 Years | 0 (0.0%) | 0 (0.0%) |
| 18 to 34 Years | 0 (0.0%) | 0 (0.0%) |
| 35 to 64 Years | 0 (0.0%) | 38 (27.1%) |
| 65 to 74 Years | 0 (0.0%) | 0 (0.0%) |
| 75 Years and over | 0 (0.0%) | 0 (0.0%) |
Disability Class: Self-Care Difficulty
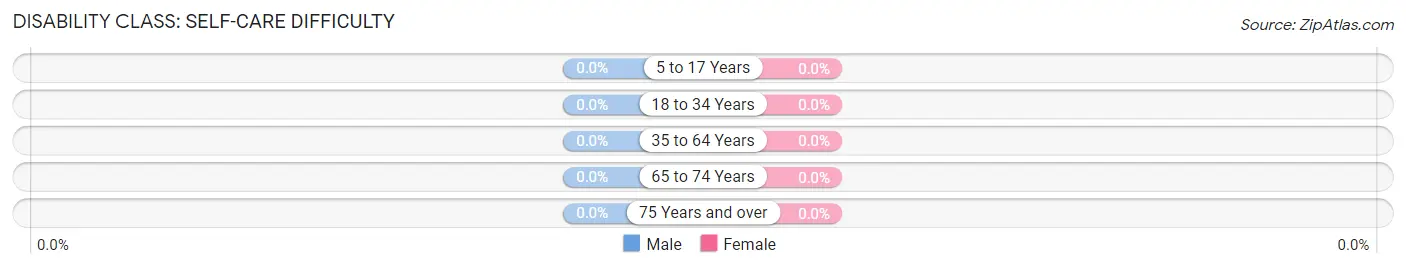
| Age Bracket | Male | Female |
| 5 to 17 Years | 0 (0.0%) | 0 (0.0%) |
| 18 to 34 Years | 0 (0.0%) | 0 (0.0%) |
| 35 to 64 Years | 0 (0.0%) | 0 (0.0%) |
| 65 to 74 Years | 0 (0.0%) | 0 (0.0%) |
| 75 Years and over | 0 (0.0%) | 0 (0.0%) |
Technology Access in Munds Park
Computing Device Access in Munds Park
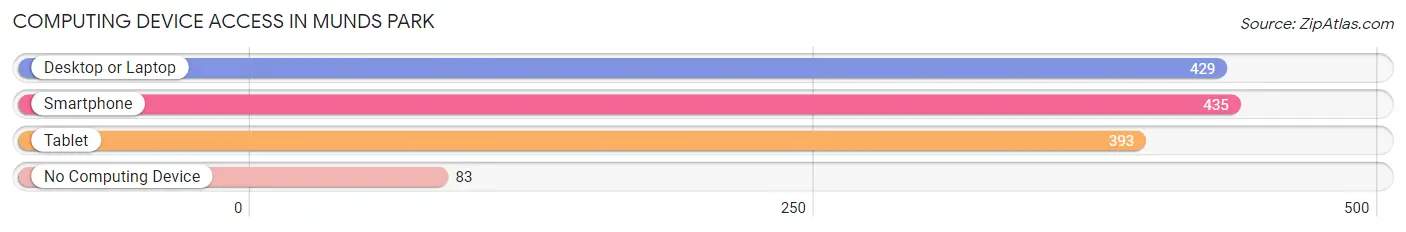
| Device Type | # Households | % Households |
| Desktop or Laptop | 429 | 77.4% |
| Smartphone | 435 | 78.5% |
| Tablet | 393 | 70.9% |
| No Computing Device | 83 | 15.0% |
| Total | 554 | 100.0% |
Internet Access in Munds Park
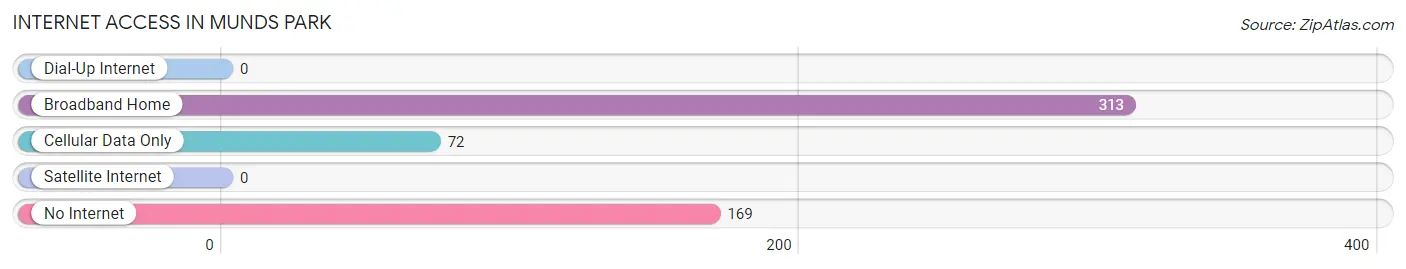
| Internet Type | # Households | % Households |
| Dial-Up Internet | 0 | 0.0% |
| Broadband Home | 313 | 56.5% |
| Cellular Data Only | 72 | 13.0% |
| Satellite Internet | 0 | 0.0% |
| No Internet | 169 | 30.5% |
| Total | 554 | 100.0% |
Munds Park Summary
Munds Park is a small unincorporated community located in Coconino County, Arizona. It is situated in the Coconino National Forest, approximately 25 miles south of Flagstaff. The community is located along Interstate 17, and is a popular destination for outdoor recreation.
History
Munds Park was established in the early 1900s as a logging camp. The area was originally inhabited by the Sinagua people, who left behind numerous archaeological sites. The first settlers in the area were ranchers, who established homesteads in the area. In the 1920s, the area was developed as a resort community, and the first cabins were built in the area. The community was named after the Munds family, who owned a large ranch in the area.
In the 1950s, the area was developed as a residential community, and the first homes were built in the area. The community was incorporated in 1960, and the first mayor was elected in 1961. The community has remained a popular destination for outdoor recreation, and is home to numerous campgrounds, hiking trails, and other recreational activities.
Geography
Munds Park is located in the Coconino National Forest, approximately 25 miles south of Flagstaff. The community is situated along Interstate 17, and is surrounded by the Coconino Plateau. The area is characterized by rolling hills, and is home to numerous species of wildlife. The climate in the area is semi-arid, with hot summers and mild winters.
Economy
Munds Park is primarily a residential community, and the majority of the population is employed in the service sector. The community is home to numerous small businesses, including restaurants, retail stores, and other services. The community is also home to numerous campgrounds, and is a popular destination for outdoor recreation.
Demographics
As of the 2010 census, the population of Munds Park was 1,845. The racial makeup of the community was 94.3% White, 0.7% Native American, 0.3% Asian, 0.2% African American, and 4.5% from other races. The median household income in the community was $45,000, and the median age was 44.
Munds Park is a small, rural community that is home to a diverse population. The community is a popular destination for outdoor recreation, and is home to numerous campgrounds and hiking trails. The community is also home to numerous small businesses, and is a popular destination for tourists.
Common Questions
What is Per Capita Income in Munds Park?
Per Capita income in Munds Park is $61,213.
What is the Median Family Income in Munds Park?
Median Family Income in Munds Park is $110,203.
What is the Median Household income in Munds Park?
Median Household Income in Munds Park is $80,152.
What is Inequality or Gini Index in Munds Park?
Inequality or Gini Index in Munds Park is 0.50.
What is the Total Population of Munds Park?
Total Population of Munds Park is 950.
What is the Total Male Population of Munds Park?
Total Male Population of Munds Park is 524.
What is the Total Female Population of Munds Park?
Total Female Population of Munds Park is 426.
What is the Ratio of Males per 100 Females in Munds Park?
There are 123.00 Males per 100 Females in Munds Park.
What is the Ratio of Females per 100 Males in Munds Park?
There are 81.30 Females per 100 Males in Munds Park.
What is the Median Population Age in Munds Park?
Median Population Age in Munds Park is 66.4 Years.
What is the Average Family Size in Munds Park
Average Family Size in Munds Park is 2.2 People.
What is the Average Household Size in Munds Park
Average Household Size in Munds Park is 1.7 People.
How Large is the Labor Force in Munds Park?
There are 337 People in the Labor Forcein in Munds Park.
What is the Percentage of People in the Labor Force in Munds Park?
37.7% of People are in the Labor Force in Munds Park.
What is the Unemployment Rate in Munds Park?
Unemployment Rate in Munds Park is 12.5%.