Morristown, AZ Map & Demographics
Morristown Map
Morristown Overview
$42,650
PER CAPITA INCOME
$78,500
AVG FAMILY INCOME
$68,611
AVG HOUSEHOLD INCOME
0.30
INEQUALITY / GINI INDEX
238
TOTAL POPULATION
129
MALE POPULATION
109
FEMALE POPULATION
118.35
MALES / 100 FEMALES
84.50
FEMALES / 100 MALES
58.4
MEDIAN AGE
2.7
AVG FAMILY SIZE
1.8
AVG HOUSEHOLD SIZE
97
LABOR FORCE [ PEOPLE ]
44.1%
PERCENT IN LABOR FORCE
16.5%
UNEMPLOYMENT RATE
Morristown Zip Codes
Morristown Area Codes
Income in Morristown
Income Overview in Morristown
Per Capita Income in Morristown is $42,650, while median incomes of families and households are $78,500 and $68,611 respectively.
| Characteristic | Number | Measure |
| Per Capita Income | 238 | $42,650 |
| Median Family Income | 62 | $78,500 |
| Mean Family Income | 62 | $94,060 |
| Median Household Income | 134 | $68,611 |
| Mean Household Income | 134 | $75,995 |
| Income Deficit | 62 | $0 |
| Wage / Income Gap (%) | 238 | 0.00% |
| Wage / Income Gap ($) | 238 | 100.00¢ per $1 |
| Gini / Inequality Index | 238 | 0.30 |
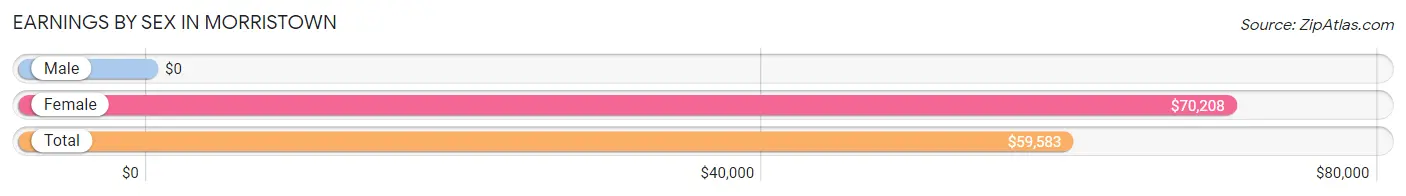
Earnings by Sex in Morristown
| Sex | Number | Average Earnings |
| Male | 72 (71.3%) | $0 |
| Female | 29 (28.7%) | $70,208 |
| Total | 101 (100.0%) | $59,583 |
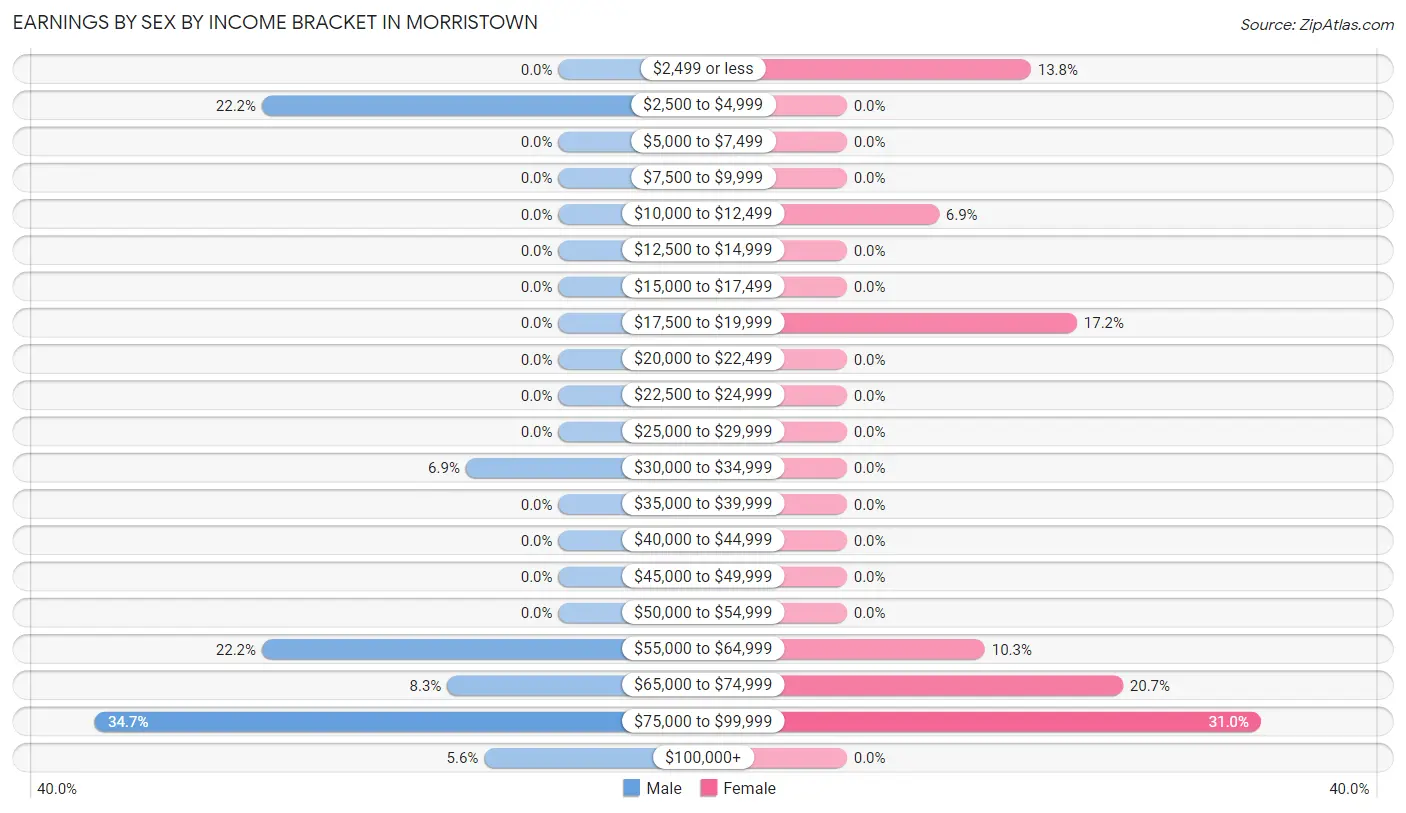
Earnings by Sex by Income Bracket in Morristown
The most common earnings brackets in Morristown are $75,000 to $99,999 for men (25 | 34.7%) and $75,000 to $99,999 for women (9 | 31.0%).
| Income | Male | Female |
| $2,499 or less | 0 (0.0%) | 4 (13.8%) |
| $2,500 to $4,999 | 16 (22.2%) | 0 (0.0%) |
| $5,000 to $7,499 | 0 (0.0%) | 0 (0.0%) |
| $7,500 to $9,999 | 0 (0.0%) | 0 (0.0%) |
| $10,000 to $12,499 | 0 (0.0%) | 2 (6.9%) |
| $12,500 to $14,999 | 0 (0.0%) | 0 (0.0%) |
| $15,000 to $17,499 | 0 (0.0%) | 0 (0.0%) |
| $17,500 to $19,999 | 0 (0.0%) | 5 (17.2%) |
| $20,000 to $22,499 | 0 (0.0%) | 0 (0.0%) |
| $22,500 to $24,999 | 0 (0.0%) | 0 (0.0%) |
| $25,000 to $29,999 | 0 (0.0%) | 0 (0.0%) |
| $30,000 to $34,999 | 5 (6.9%) | 0 (0.0%) |
| $35,000 to $39,999 | 0 (0.0%) | 0 (0.0%) |
| $40,000 to $44,999 | 0 (0.0%) | 0 (0.0%) |
| $45,000 to $49,999 | 0 (0.0%) | 0 (0.0%) |
| $50,000 to $54,999 | 0 (0.0%) | 0 (0.0%) |
| $55,000 to $64,999 | 16 (22.2%) | 3 (10.3%) |
| $65,000 to $74,999 | 6 (8.3%) | 6 (20.7%) |
| $75,000 to $99,999 | 25 (34.7%) | 9 (31.0%) |
| $100,000+ | 4 (5.6%) | 0 (0.0%) |
| Total | 72 (100.0%) | 29 (100.0%) |
Earnings by Sex by Educational Attainment in Morristown
| Educational Attainment | Male Income | Female Income |
| Less than High School | - | - |
| High School Diploma | - | - |
| College or Associate's Degree | - | - |
| Bachelor's Degree | - | - |
| Graduate Degree | - | - |
| Total | - | - |
Family Income in Morristown
Family Income Brackets in Morristown
According to the Morristown family income data, there are 24 families falling into the $50,000 to $74,999 income range, which is the most common income bracket and makes up 38.7% of all families.
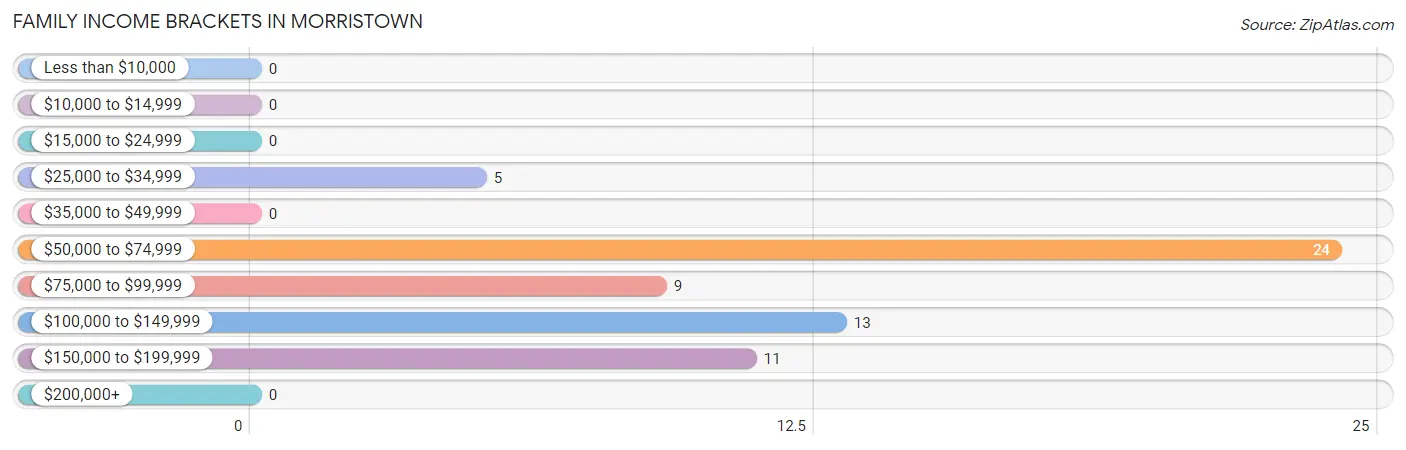
| Income Bracket | # Families | % Families |
| Less than $10,000 | 0 | 0.0% |
| $10,000 to $14,999 | 0 | 0.0% |
| $15,000 to $24,999 | 0 | 0.0% |
| $25,000 to $34,999 | 5 | 8.1% |
| $35,000 to $49,999 | 0 | 0.0% |
| $50,000 to $74,999 | 24 | 38.7% |
| $75,000 to $99,999 | 9 | 14.5% |
| $100,000 to $149,999 | 13 | 21.0% |
| $150,000 to $199,999 | 11 | 17.7% |
| $200,000+ | 0 | 0.0% |
Family Income by Famaliy Size in Morristown
3-person families (25 | 40.3%) account for the highest median family income in Morristown with $126,750 per family, while 3-person families (25 | 40.3%) have the highest median income of $42,250 per family member.
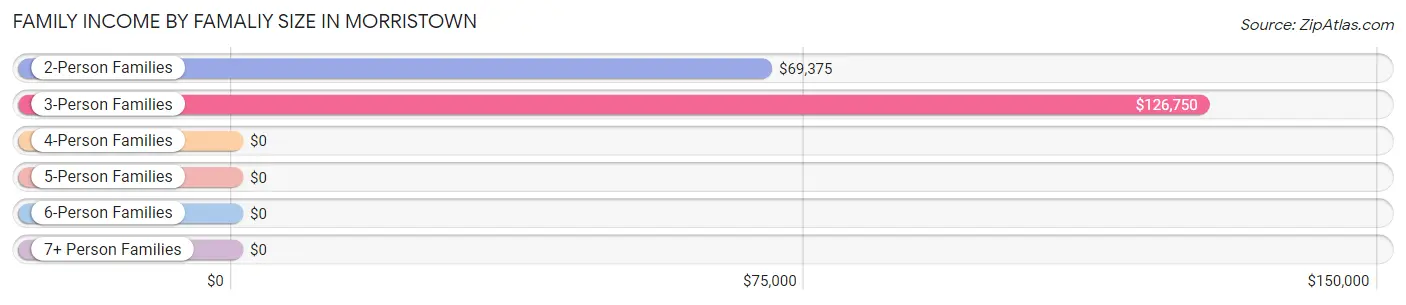
| Income Bracket | # Families | Median Income |
| 2-Person Families | 31 (50.0%) | $69,375 |
| 3-Person Families | 25 (40.3%) | $126,750 |
| 4-Person Families | 3 (4.8%) | $0 |
| 5-Person Families | 3 (4.8%) | $0 |
| 6-Person Families | 0 (0.0%) | $0 |
| 7+ Person Families | 0 (0.0%) | $0 |
| Total | 62 (100.0%) | $78,500 |
Family Income by Number of Earners in Morristown
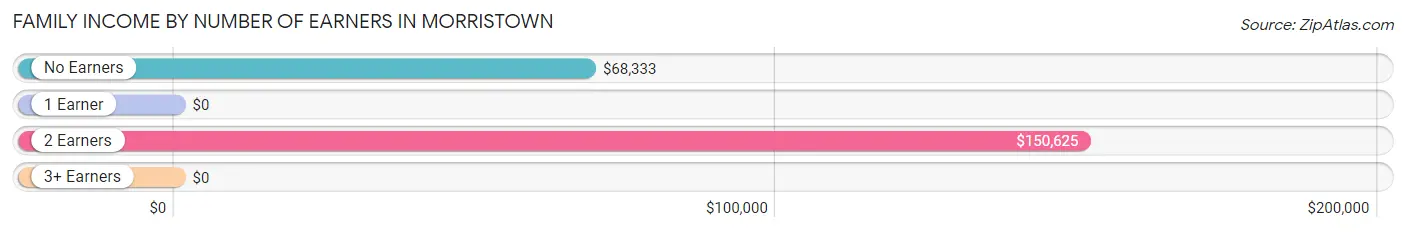
| Number of Earners | # Families | Median Income |
| No Earners | 36 (58.1%) | $68,333 |
| 1 Earner | 7 (11.3%) | $0 |
| 2 Earners | 19 (30.6%) | $150,625 |
| 3+ Earners | 0 (0.0%) | $0 |
| Total | 62 (100.0%) | $78,500 |
Household Income in Morristown
Household Income Brackets in Morristown
With 54 households falling in the category, the $50,000 to $74,999 income range is the most frequent in Morristown, accounting for 40.3% of all households.
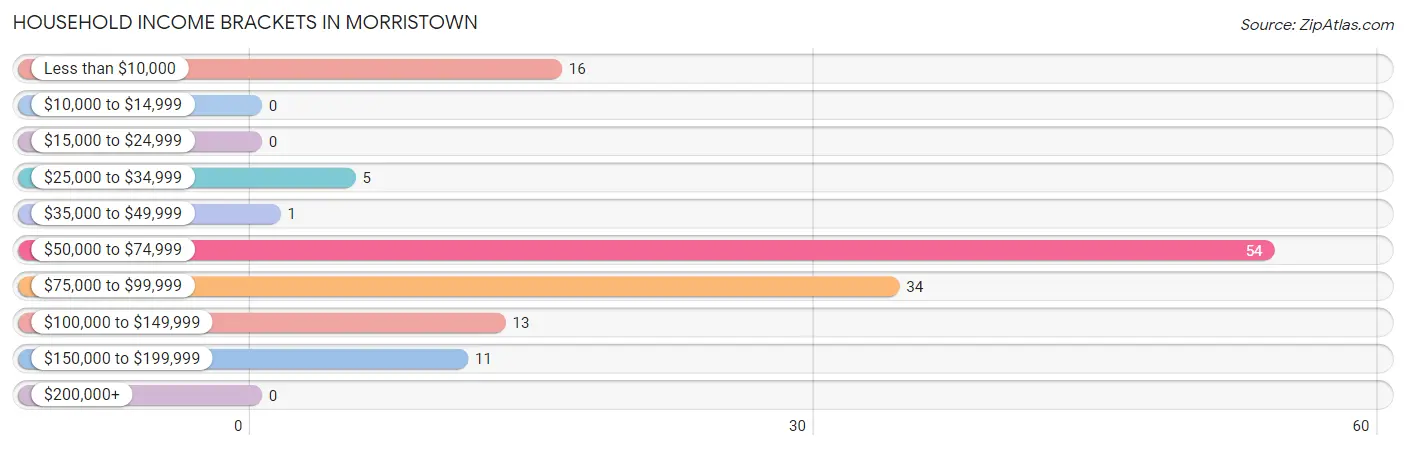
| Income Bracket | # Households | % Households |
| Less than $10,000 | 16 | 11.9% |
| $10,000 to $14,999 | 0 | 0.0% |
| $15,000 to $24,999 | 0 | 0.0% |
| $25,000 to $34,999 | 5 | 3.7% |
| $35,000 to $49,999 | 1 | 0.7% |
| $50,000 to $74,999 | 54 | 40.3% |
| $75,000 to $99,999 | 34 | 25.4% |
| $100,000 to $149,999 | 13 | 9.7% |
| $150,000 to $199,999 | 11 | 8.2% |
| $200,000+ | 0 | 0.0% |
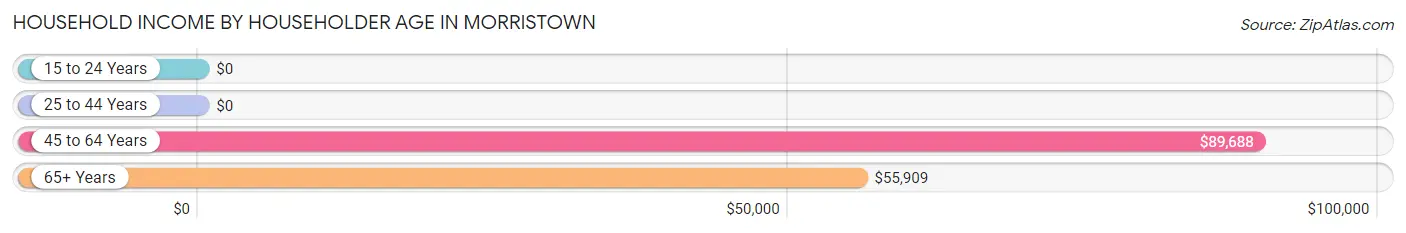
Household Income by Householder Age in Morristown
The median household income in Morristown is $68,611, with the highest median household income of $89,688 found in the 45 to 64 years age bracket for the primary householder. A total of 83 households (61.9%) fall into this category.
| Income Bracket | # Households | Median Income |
| 15 to 24 Years | 0 (0.0%) | $0 |
| 25 to 44 Years | 3 (2.2%) | $0 |
| 45 to 64 Years | 83 (61.9%) | $89,688 |
| 65+ Years | 48 (35.8%) | $55,909 |
| Total | 134 (100.0%) | $68,611 |
Poverty in Morristown
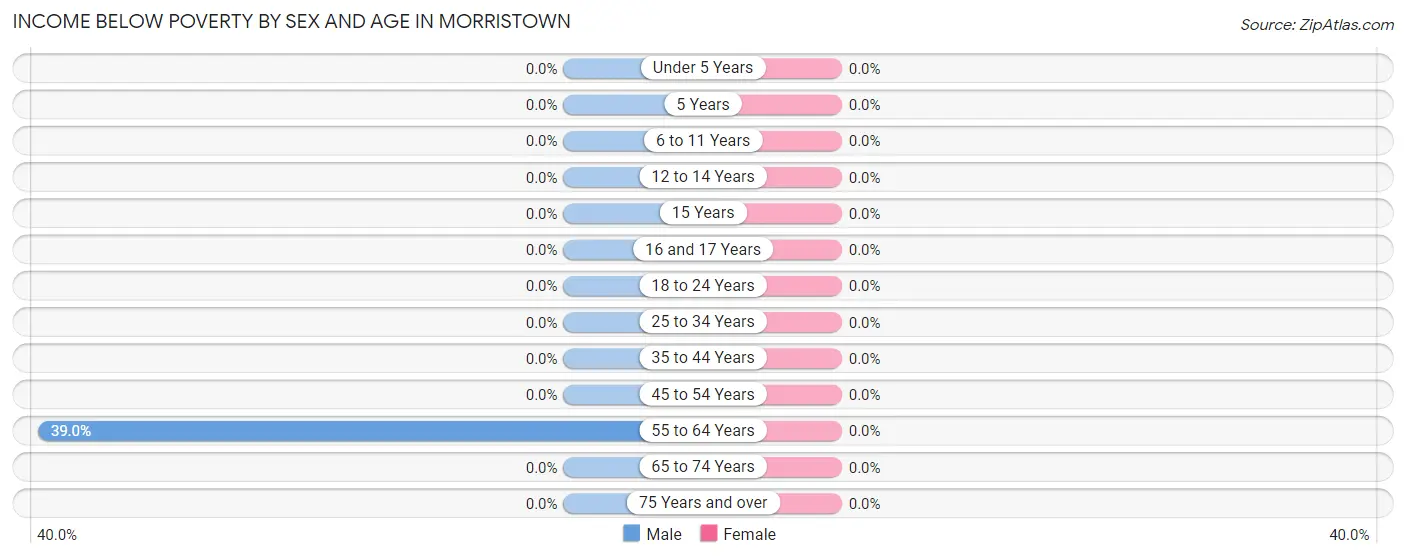
Income Below Poverty by Sex and Age in Morristown
| Age Bracket | Male | Female |
| Under 5 Years | 0 (0.0%) | 0 (0.0%) |
| 5 Years | 0 (0.0%) | 0 (0.0%) |
| 6 to 11 Years | 0 (0.0%) | 0 (0.0%) |
| 12 to 14 Years | 0 (0.0%) | 0 (0.0%) |
| 15 Years | 0 (0.0%) | 0 (0.0%) |
| 16 and 17 Years | 0 (0.0%) | 0 (0.0%) |
| 18 to 24 Years | 0 (0.0%) | 0 (0.0%) |
| 25 to 34 Years | 0 (0.0%) | 0 (0.0%) |
| 35 to 44 Years | 0 (0.0%) | 0 (0.0%) |
| 45 to 54 Years | 0 (0.0%) | 0 (0.0%) |
| 55 to 64 Years | 16 (39.0%) | 0 (0.0%) |
| 65 to 74 Years | 0 (0.0%) | 0 (0.0%) |
| 75 Years and over | 0 (0.0%) | 0 (0.0%) |
| Total | 16 (12.4%) | 0 (0.0%) |
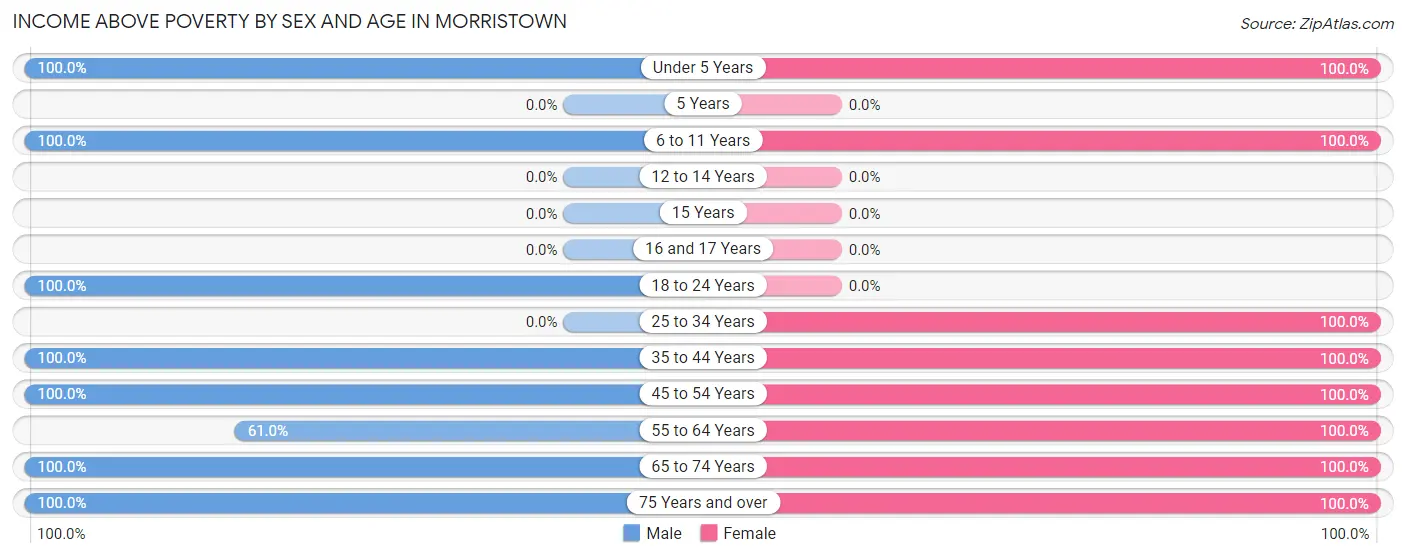
Income Above Poverty by Sex and Age in Morristown
According to the poverty statistics in Morristown, males aged under 5 years and females aged under 5 years are the age groups that are most secure financially, with 100.0% of males and 100.0% of females in these age groups living above the poverty line.
| Age Bracket | Male | Female |
| Under 5 Years | 4 (100.0%) | 2 (100.0%) |
| 5 Years | 0 (0.0%) | 0 (0.0%) |
| 6 to 11 Years | 7 (100.0%) | 5 (100.0%) |
| 12 to 14 Years | 0 (0.0%) | 0 (0.0%) |
| 15 Years | 0 (0.0%) | 0 (0.0%) |
| 16 and 17 Years | 0 (0.0%) | 0 (0.0%) |
| 18 to 24 Years | 5 (100.0%) | 0 (0.0%) |
| 25 to 34 Years | 0 (0.0%) | 10 (100.0%) |
| 35 to 44 Years | 3 (100.0%) | 4 (100.0%) |
| 45 to 54 Years | 41 (100.0%) | 18 (100.0%) |
| 55 to 64 Years | 25 (61.0%) | 27 (100.0%) |
| 65 to 74 Years | 23 (100.0%) | 38 (100.0%) |
| 75 Years and over | 5 (100.0%) | 5 (100.0%) |
| Total | 113 (87.6%) | 109 (100.0%) |
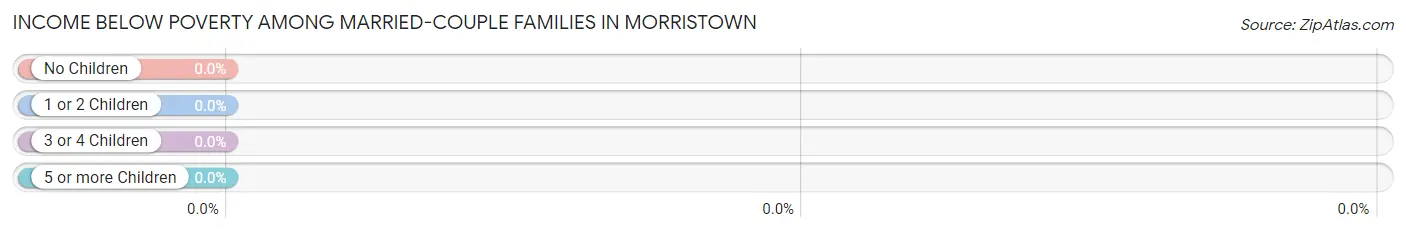
Income Below Poverty Among Married-Couple Families in Morristown
| Children | Above Poverty | Below Poverty |
| No Children | 42 (100.0%) | 0 (0.0%) |
| 1 or 2 Children | 15 (100.0%) | 0 (0.0%) |
| 3 or 4 Children | 0 (0.0%) | 0 (0.0%) |
| 5 or more Children | 0 (0.0%) | 0 (0.0%) |
| Total | 57 (100.0%) | 0 (0.0%) |
Income Below Poverty Among Single-Parent Households in Morristown
| Children | Single Father | Single Mother |
| No Children | 0 (0.0%) | 0 (0.0%) |
| 1 or 2 Children | 0 (0.0%) | 0 (0.0%) |
| 3 or 4 Children | 0 (0.0%) | 0 (0.0%) |
| 5 or more Children | 0 (0.0%) | 0 (0.0%) |
| Total | 0 (0.0%) | 0 (0.0%) |
Income Below Poverty Among Married-Couple vs Single-Parent Households in Morristown
| Children | Married-Couple Families | Single-Parent Households |
| No Children | 0 (0.0%) | 0 (0.0%) |
| 1 or 2 Children | 0 (0.0%) | 0 (0.0%) |
| 3 or 4 Children | 0 (0.0%) | 0 (0.0%) |
| 5 or more Children | 0 (0.0%) | 0 (0.0%) |
| Total | 0 (0.0%) | 0 (0.0%) |
Race in Morristown
The most populous races in Morristown are White / Caucasian (193 | 81.1%), Black / African American (25 | 10.5%), and Two or more Races (20 | 8.4%).
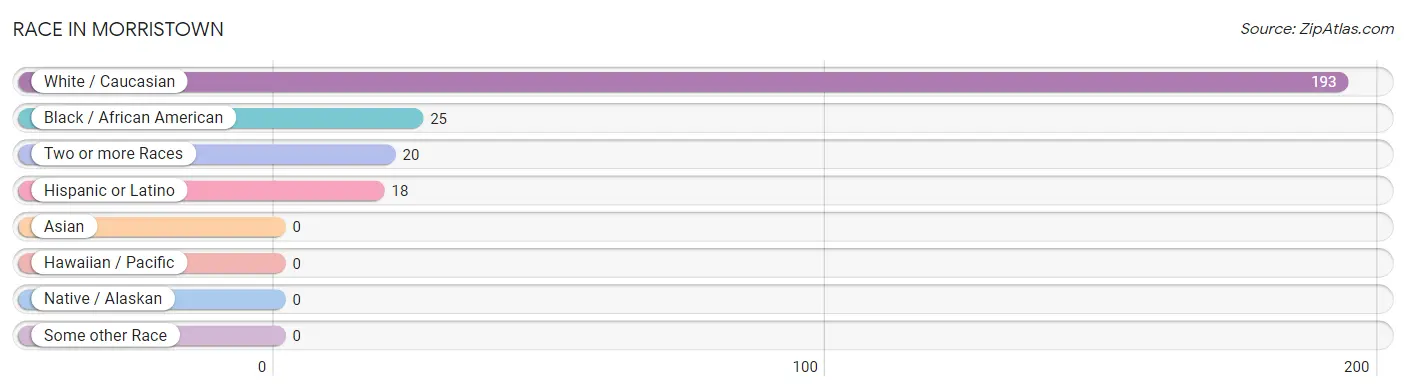
| Race | # Population | % Population |
| Asian | 0 | 0.0% |
| Black / African American | 25 | 10.5% |
| Hawaiian / Pacific | 0 | 0.0% |
| Hispanic or Latino | 18 | 7.6% |
| Native / Alaskan | 0 | 0.0% |
| White / Caucasian | 193 | 81.1% |
| Two or more Races | 20 | 8.4% |
| Some other Race | 0 | 0.0% |
| Total | 238 | 100.0% |
Ancestry in Morristown
The most populous ancestries reported in Morristown are Irish (47 | 19.8%), German (31 | 13.0%), English (19 | 8.0%), Mexican (18 | 7.6%), and Danish (13 | 5.5%), together accounting for 53.8% of all Morristown residents.
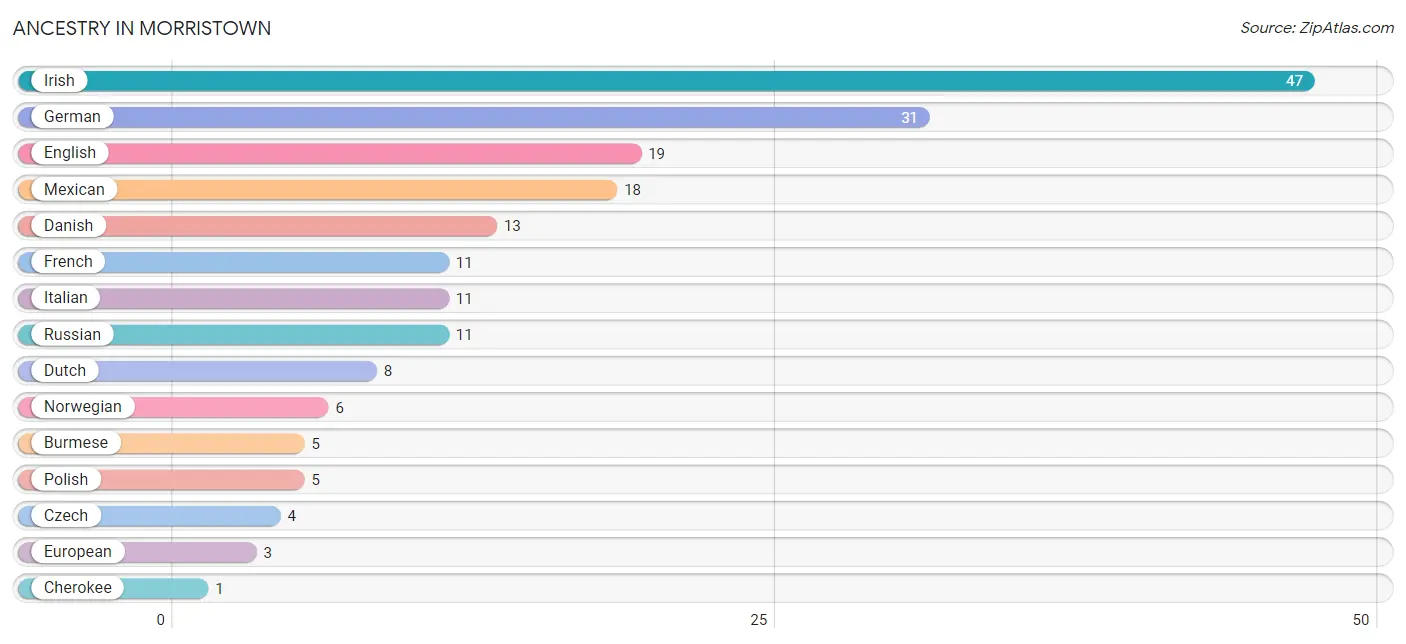
| Ancestry | # Population | % Population |
| Burmese | 5 | 2.1% |
| Cherokee | 1 | 0.4% |
| Czech | 4 | 1.7% |
| Danish | 13 | 5.5% |
| Dutch | 8 | 3.4% |
| English | 19 | 8.0% |
| European | 3 | 1.3% |
| French | 11 | 4.6% |
| German | 31 | 13.0% |
| Irish | 47 | 19.8% |
| Italian | 11 | 4.6% |
| Mexican | 18 | 7.6% |
| Norwegian | 6 | 2.5% |
| Polish | 5 | 2.1% |
| Russian | 11 | 4.6% | View All 15 Rows |
Immigrants in Morristown

| Immigration Origin | # Population | % Population | View All 0 Rows |
Sex and Age in Morristown
Sex and Age in Morristown
The most populous age groups in Morristown are 50 to 54 Years (41 | 31.8%) for men and 70 to 74 Years (35 | 32.1%) for women.
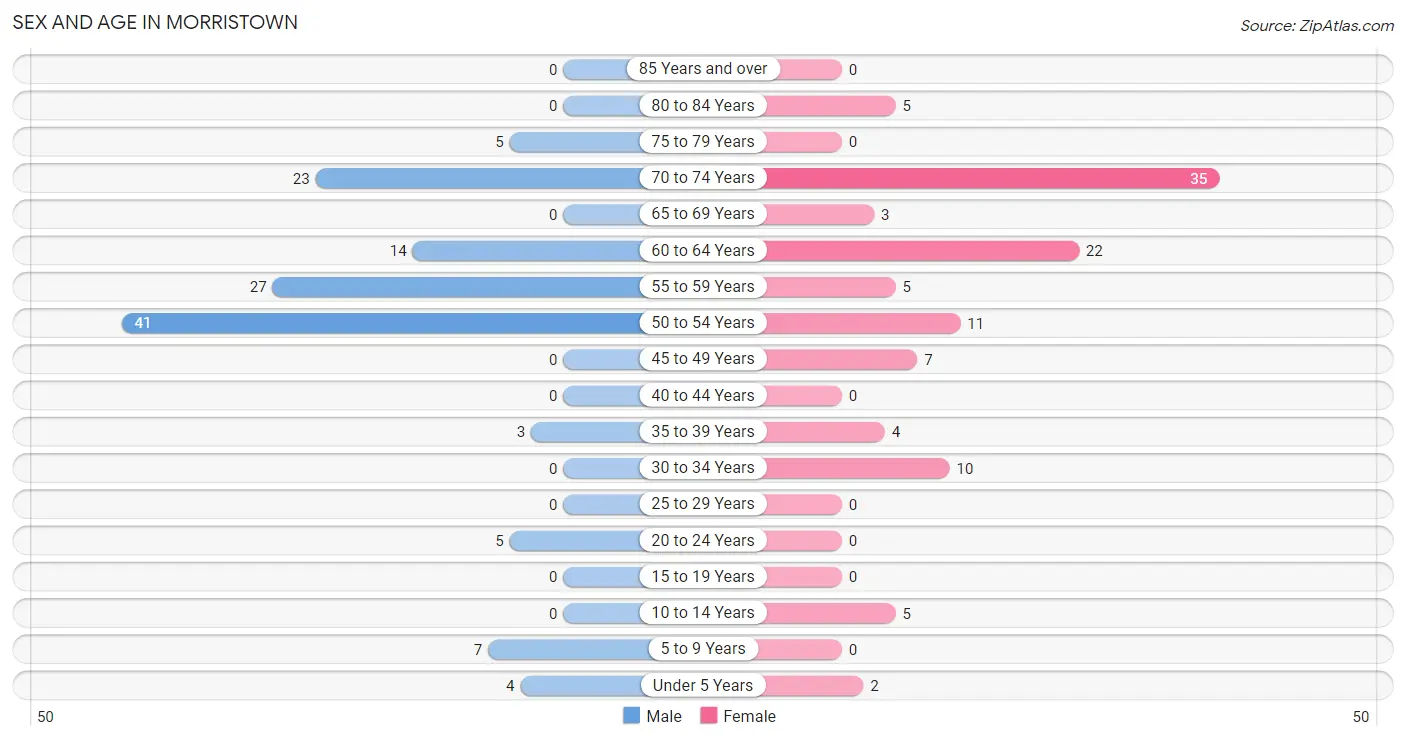
| Age Bracket | Male | Female |
| Under 5 Years | 4 (3.1%) | 2 (1.8%) |
| 5 to 9 Years | 7 (5.4%) | 0 (0.0%) |
| 10 to 14 Years | 0 (0.0%) | 5 (4.6%) |
| 15 to 19 Years | 0 (0.0%) | 0 (0.0%) |
| 20 to 24 Years | 5 (3.9%) | 0 (0.0%) |
| 25 to 29 Years | 0 (0.0%) | 0 (0.0%) |
| 30 to 34 Years | 0 (0.0%) | 10 (9.2%) |
| 35 to 39 Years | 3 (2.3%) | 4 (3.7%) |
| 40 to 44 Years | 0 (0.0%) | 0 (0.0%) |
| 45 to 49 Years | 0 (0.0%) | 7 (6.4%) |
| 50 to 54 Years | 41 (31.8%) | 11 (10.1%) |
| 55 to 59 Years | 27 (20.9%) | 5 (4.6%) |
| 60 to 64 Years | 14 (10.8%) | 22 (20.2%) |
| 65 to 69 Years | 0 (0.0%) | 3 (2.8%) |
| 70 to 74 Years | 23 (17.8%) | 35 (32.1%) |
| 75 to 79 Years | 5 (3.9%) | 0 (0.0%) |
| 80 to 84 Years | 0 (0.0%) | 5 (4.6%) |
| 85 Years and over | 0 (0.0%) | 0 (0.0%) |
| Total | 129 (100.0%) | 109 (100.0%) |
Families and Households in Morristown
Median Family Size in Morristown
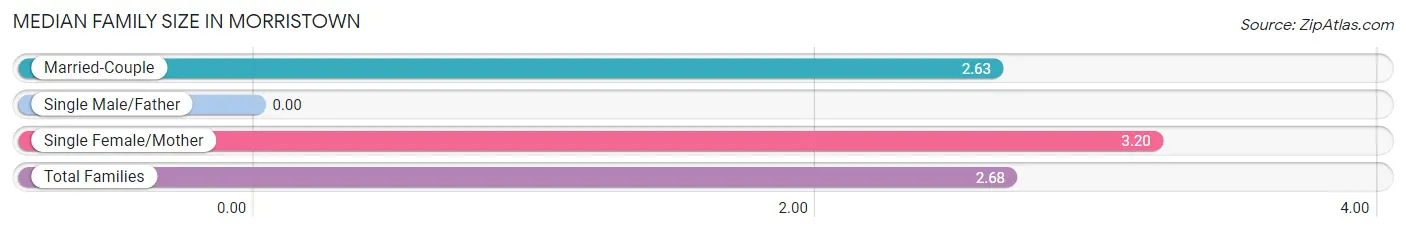
| Family Type | # Families | Family Size |
| Married-Couple | 57 (91.9%) | 2.63 |
| Single Male/Father | 0 (0.0%) | - |
| Single Female/Mother | 5 (8.1%) | 3.20 |
| Total Families | 62 (100.0%) | 2.68 |
Median Household Size in Morristown
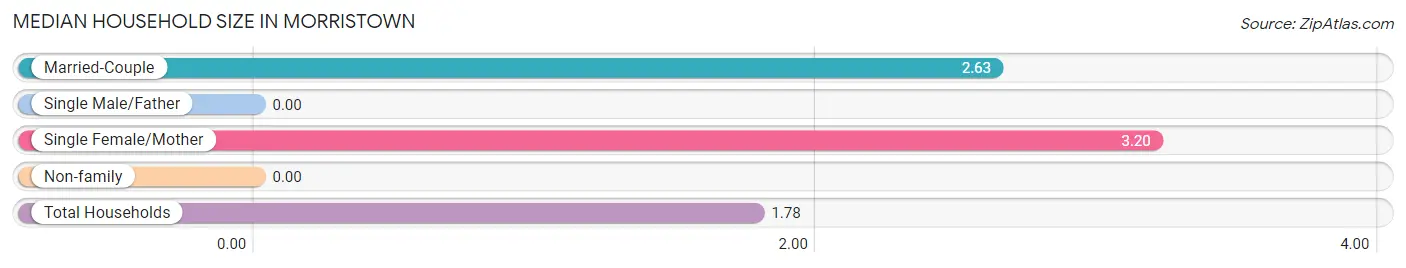
| Household Type | # Households | Household Size |
| Married-Couple | 57 (42.5%) | 2.63 |
| Single Male/Father | 0 (0.0%) | - |
| Single Female/Mother | 5 (3.7%) | 3.20 |
| Non-family | 72 (53.7%) | - |
| Total Households | 134 (100.0%) | 1.78 |
Household Size by Marriage Status in Morristown
Out of a total of 134 households in Morristown, 62 (46.3%) are family households, while 72 (53.7%) are nonfamily households. The most numerous type of family households are 2-person households, comprising 31, and the most common type of nonfamily households are 1-person households, comprising 72.
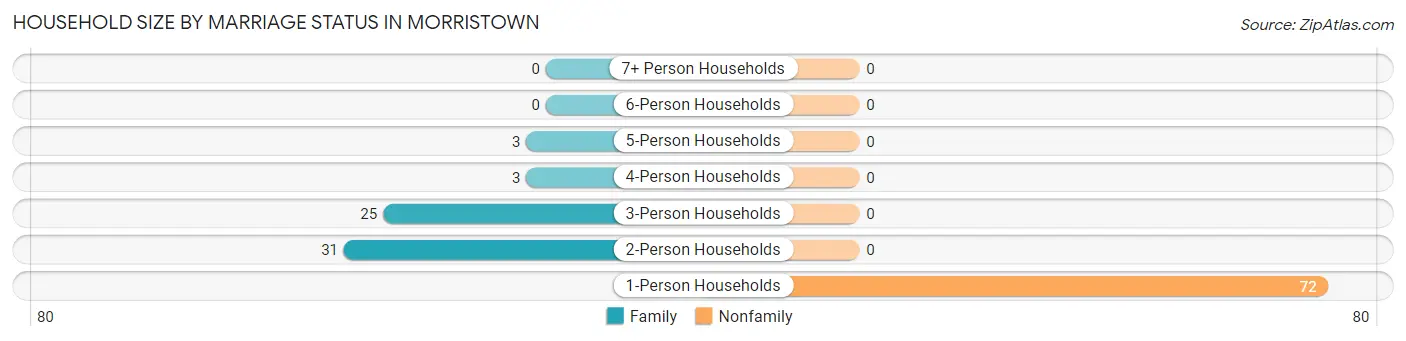
| Household Size | Family Households | Nonfamily Households |
| 1-Person Households | - | 72 (53.7%) |
| 2-Person Households | 31 (23.1%) | 0 (0.0%) |
| 3-Person Households | 25 (18.7%) | 0 (0.0%) |
| 4-Person Households | 3 (2.2%) | 0 (0.0%) |
| 5-Person Households | 3 (2.2%) | 0 (0.0%) |
| 6-Person Households | 0 (0.0%) | 0 (0.0%) |
| 7+ Person Households | 0 (0.0%) | 0 (0.0%) |
| Total | 62 (46.3%) | 72 (53.7%) |
Female Fertility in Morristown
Fertility by Age in Morristown
| Age Bracket | Women with Births | Births / 1,000 Women |
| 15 to 19 years | 0 (0.0%) | 0.0 |
| 20 to 34 years | 0 (0.0%) | 0.0 |
| 35 to 50 years | 0 (0.0%) | 0.0 |
| Total | 0 (0.0%) | 0.0 |
Fertility by Age by Marriage Status in Morristown
| Age Bracket | Married | Unmarried |
| 15 to 19 years | 0 (0.0%) | 0 (0.0%) |
| 20 to 34 years | 0 (0.0%) | 0 (0.0%) |
| 35 to 50 years | 0 (0.0%) | 0 (0.0%) |
| Total | 0 (0.0%) | 0 (0.0%) |
Fertility by Education in Morristown
| Educational Attainment | Women with Births | Births / 1,000 Women |
| Less than High School | 0 (0.0%) | 0.0 |
| High School Diploma | 0 (0.0%) | 0.0 |
| College or Associate's Degree | 0 (0.0%) | 0.0 |
| Bachelor's Degree | 0 (0.0%) | 0.0 |
| Graduate Degree | 0 (0.0%) | 0.0 |
| Total | 0 (0.0%) | 0.0 |
Fertility by Education by Marriage Status in Morristown
| Educational Attainment | Married | Unmarried |
| Less than High School | 0 (0.0%) | 0 (0.0%) |
| High School Diploma | 0 (0.0%) | 0 (0.0%) |
| College or Associate's Degree | 0 (0.0%) | 0 (0.0%) |
| Bachelor's Degree | 0 (0.0%) | 0 (0.0%) |
| Graduate Degree | 0 (0.0%) | 0 (0.0%) |
| Total | 0 (0.0%) | 0 (0.0%) |
Employment Characteristics in Morristown
Employment by Class of Employer in Morristown
Among the 65 employed individuals in Morristown, not-for-profit organizations (25 | 38.5%), private company employees (23 | 35.4%), and self-employed (incorporated) (17 | 26.2%) make up the most common classes of employment.
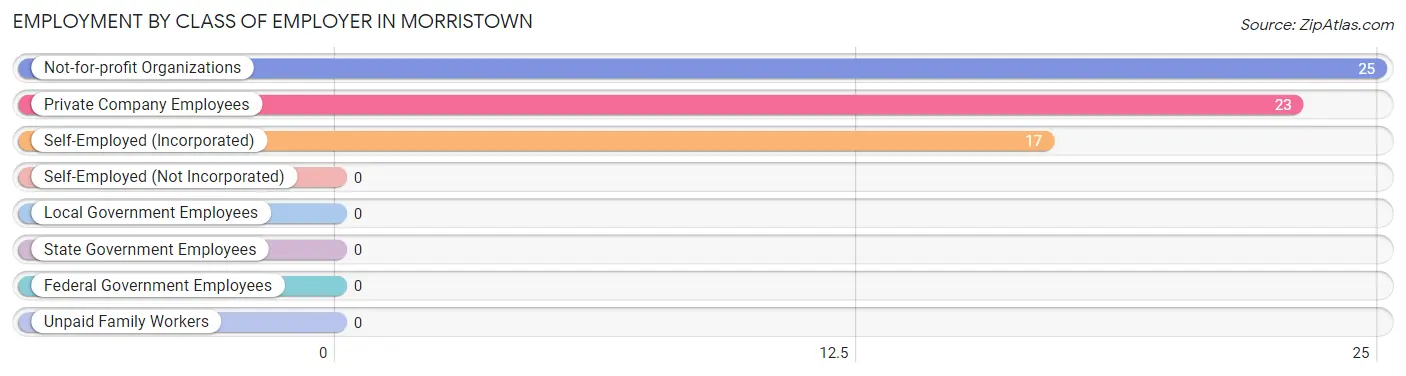
| Employer Class | # Employees | % Employees |
| Private Company Employees | 23 | 35.4% |
| Self-Employed (Incorporated) | 17 | 26.2% |
| Self-Employed (Not Incorporated) | 0 | 0.0% |
| Not-for-profit Organizations | 25 | 38.5% |
| Local Government Employees | 0 | 0.0% |
| State Government Employees | 0 | 0.0% |
| Federal Government Employees | 0 | 0.0% |
| Unpaid Family Workers | 0 | 0.0% |
| Total | 65 | 100.0% |
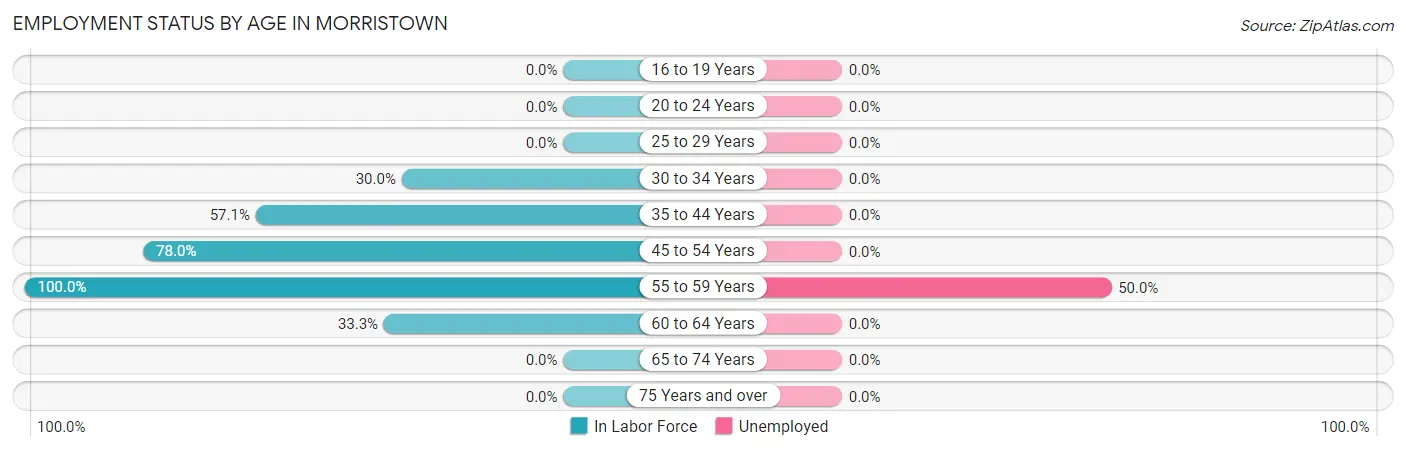
Employment Status by Age in Morristown
According to the labor force statistics for Morristown, out of the total population over 16 years of age (220), 44.1% or 97 individuals are in the labor force, with 16.5% or 16 of them unemployed. The age group with the highest labor force participation rate is 55 to 59 years, with 100.0% or 32 individuals in the labor force. Within the labor force, the 55 to 59 years age range has the highest percentage of unemployed individuals, with 50.0% or 16 of them being unemployed.
| Age Bracket | In Labor Force | Unemployed |
| 16 to 19 Years | 0 (0.0%) | 0 (0.0%) |
| 20 to 24 Years | 0 (0.0%) | 0 (0.0%) |
| 25 to 29 Years | 0 (0.0%) | 0 (0.0%) |
| 30 to 34 Years | 3 (30.0%) | 0 (0.0%) |
| 35 to 44 Years | 4 (57.1%) | 0 (0.0%) |
| 45 to 54 Years | 46 (78.0%) | 0 (0.0%) |
| 55 to 59 Years | 32 (100.0%) | 16 (50.0%) |
| 60 to 64 Years | 12 (33.3%) | 0 (0.0%) |
| 65 to 74 Years | 0 (0.0%) | 0 (0.0%) |
| 75 Years and over | 0 (0.0%) | 0 (0.0%) |
| Total | 97 (44.1%) | 16 (16.5%) |
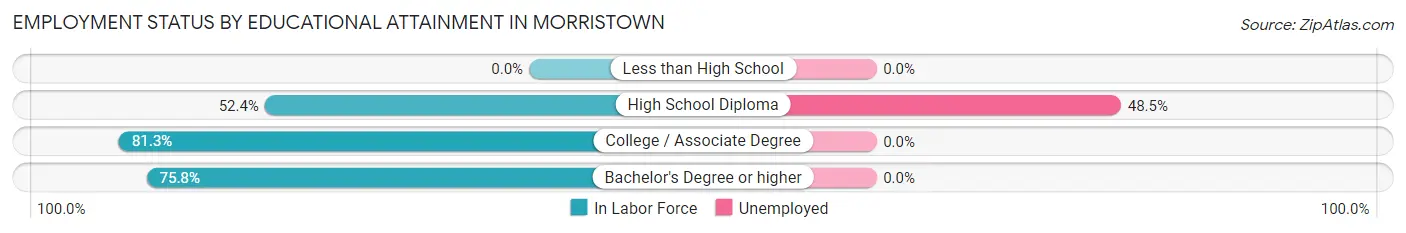
Employment Status by Educational Attainment in Morristown
According to labor force statistics for Morristown, 67.4% of individuals (97) out of the total population between 25 and 64 years of age (144) are in the labor force, with 16.5% or 16 of them being unemployed. The group with the highest labor force participation rate are those with the educational attainment of college / associate degree, with 81.3% or 39 individuals in the labor force. Within the labor force, individuals with high school diploma education have the highest percentage of unemployment, with 48.5% or 16 of them being unemployed.
| Educational Attainment | In Labor Force | Unemployed |
| Less than High School | 0 (0.0%) | 0 (0.0%) |
| High School Diploma | 33 (52.4%) | 31 (48.5%) |
| College / Associate Degree | 39 (81.3%) | 0 (0.0%) |
| Bachelor's Degree or higher | 25 (75.8%) | 0 (0.0%) |
| Total | 97 (67.4%) | 24 (16.5%) |
Employment Occupations by Sex in Morristown
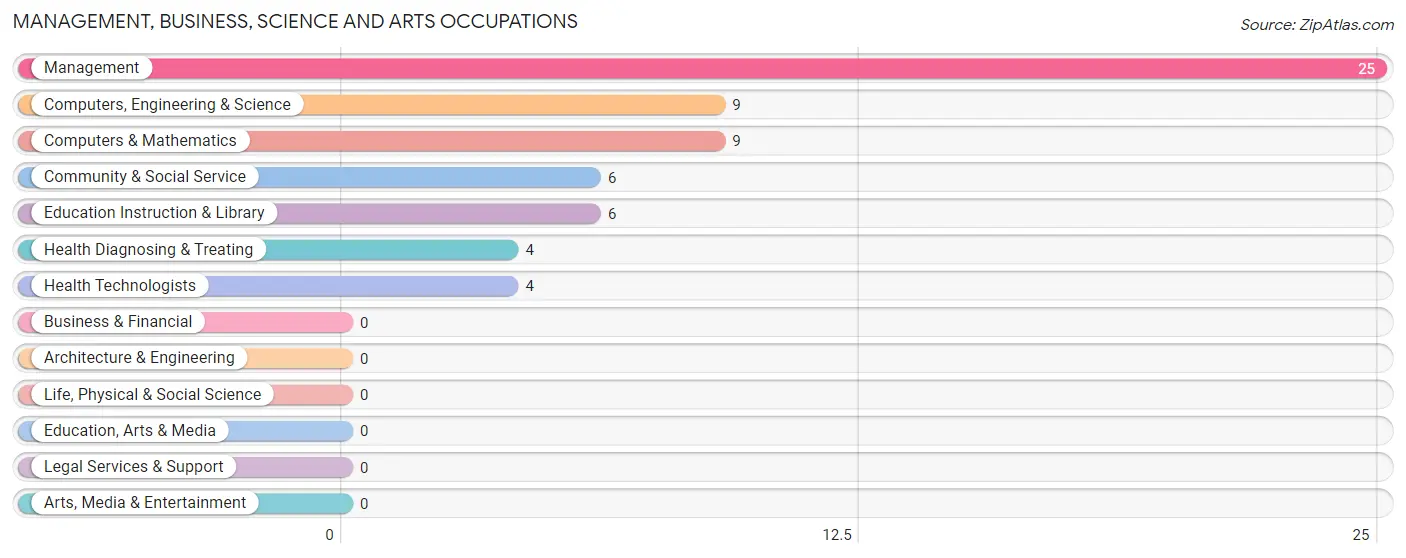
Management, Business, Science and Arts Occupations
The most common Management, Business, Science and Arts occupations in Morristown are Management (25 | 30.9%), Computers, Engineering & Science (9 | 11.1%), Computers & Mathematics (9 | 11.1%), Community & Social Service (6 | 7.4%), and Education Instruction & Library (6 | 7.4%).
Management, Business, Science and Arts Occupations by Sex
Within the Management, Business, Science and Arts occupations in Morristown, the most male-oriented occupations are Management (100.0%), Computers, Engineering & Science (44.4%), and Computers & Mathematics (44.4%), while the most female-oriented occupations are Community & Social Service (100.0%), Education Instruction & Library (100.0%), and Health Diagnosing & Treating (100.0%).
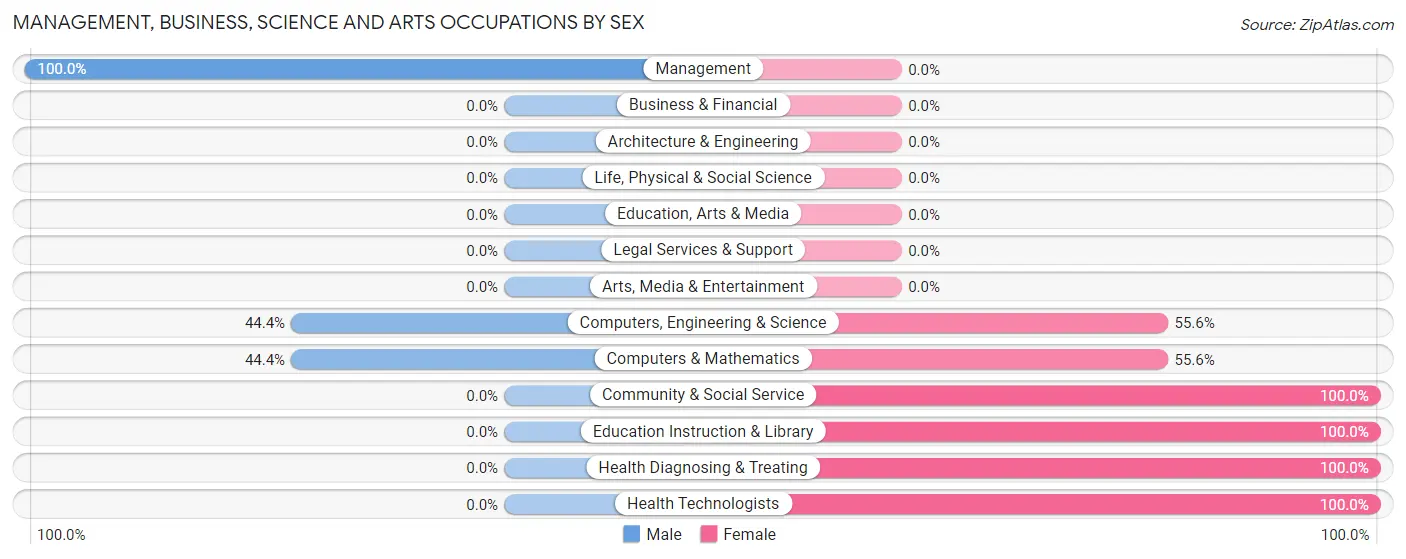
| Occupation | Male | Female |
| Management | 25 (100.0%) | 0 (0.0%) |
| Business & Financial | 0 (0.0%) | 0 (0.0%) |
| Computers, Engineering & Science | 4 (44.4%) | 5 (55.6%) |
| Computers & Mathematics | 4 (44.4%) | 5 (55.6%) |
| Architecture & Engineering | 0 (0.0%) | 0 (0.0%) |
| Life, Physical & Social Science | 0 (0.0%) | 0 (0.0%) |
| Community & Social Service | 0 (0.0%) | 6 (100.0%) |
| Education, Arts & Media | 0 (0.0%) | 0 (0.0%) |
| Legal Services & Support | 0 (0.0%) | 0 (0.0%) |
| Education Instruction & Library | 0 (0.0%) | 6 (100.0%) |
| Arts, Media & Entertainment | 0 (0.0%) | 0 (0.0%) |
| Health Diagnosing & Treating | 0 (0.0%) | 4 (100.0%) |
| Health Technologists | 0 (0.0%) | 4 (100.0%) |
| Total (Category) | 29 (65.9%) | 15 (34.1%) |
| Total (Overall) | 56 (69.1%) | 25 (30.9%) |
Services Occupations
Services Occupations by Sex
| Occupation | Male | Female |
| Healthcare Support | 0 (0.0%) | 0 (0.0%) |
| Security & Protection | 0 (0.0%) | 0 (0.0%) |
| Firefighting & Prevention | 0 (0.0%) | 0 (0.0%) |
| Law Enforcement | 0 (0.0%) | 0 (0.0%) |
| Food Preparation & Serving | 0 (0.0%) | 0 (0.0%) |
| Cleaning & Maintenance | 0 (0.0%) | 0 (0.0%) |
| Personal Care & Service | 0 (0.0%) | 0 (0.0%) |
| Total (Category) | 0 (0.0%) | 0 (0.0%) |
| Total (Overall) | 56 (69.1%) | 25 (30.9%) |
Sales and Office Occupations
The most common Sales and Office occupations in Morristown are , and Sales & Related (10 | 12.3%).
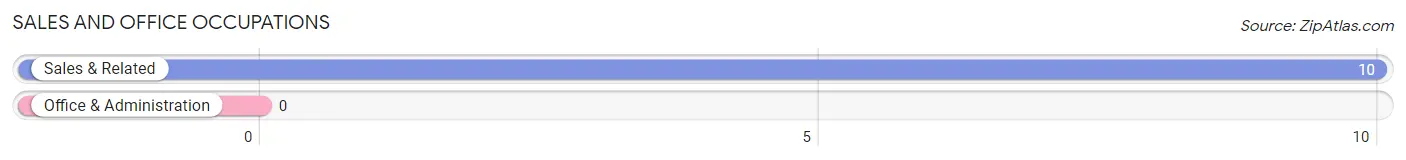
Sales and Office Occupations by Sex
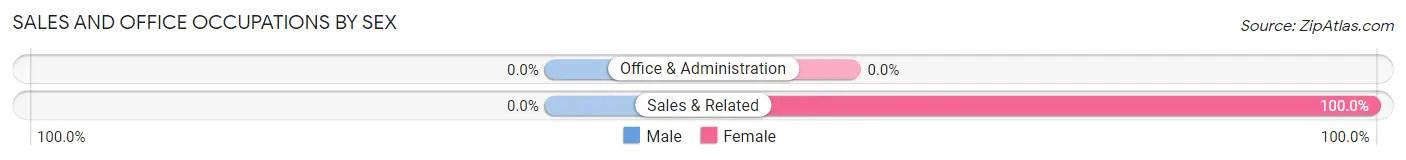
| Occupation | Male | Female |
| Sales & Related | 0 (0.0%) | 10 (100.0%) |
| Office & Administration | 0 (0.0%) | 0 (0.0%) |
| Total (Category) | 0 (0.0%) | 10 (100.0%) |
| Total (Overall) | 56 (69.1%) | 25 (30.9%) |
Natural Resources, Construction and Maintenance Occupations
The most common Natural Resources, Construction and Maintenance occupations in Morristown are , and Construction & Extraction (11 | 13.6%).
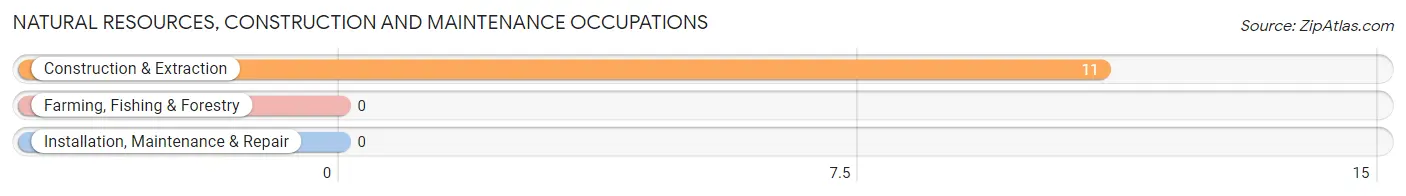
Natural Resources, Construction and Maintenance Occupations by Sex
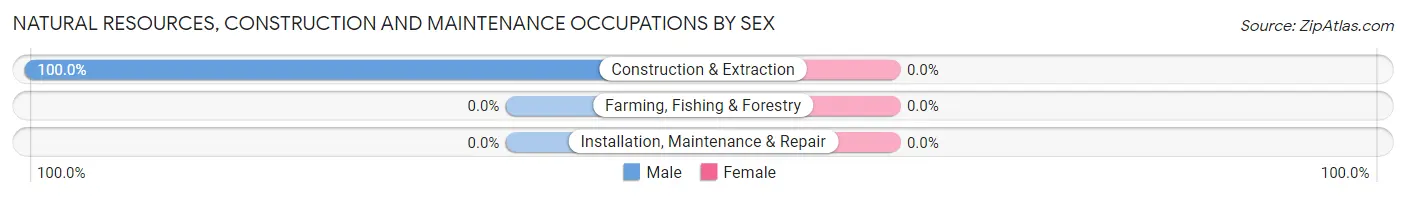
| Occupation | Male | Female |
| Farming, Fishing & Forestry | 0 (0.0%) | 0 (0.0%) |
| Construction & Extraction | 11 (100.0%) | 0 (0.0%) |
| Installation, Maintenance & Repair | 0 (0.0%) | 0 (0.0%) |
| Total (Category) | 11 (100.0%) | 0 (0.0%) |
| Total (Overall) | 56 (69.1%) | 25 (30.9%) |
Production, Transportation and Moving Occupations
The most common Production, Transportation and Moving occupations in Morristown are , and Transportation (16 | 19.8%).
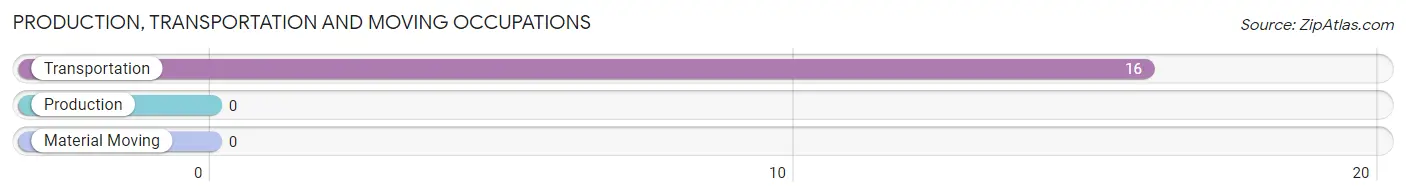
Production, Transportation and Moving Occupations by Sex
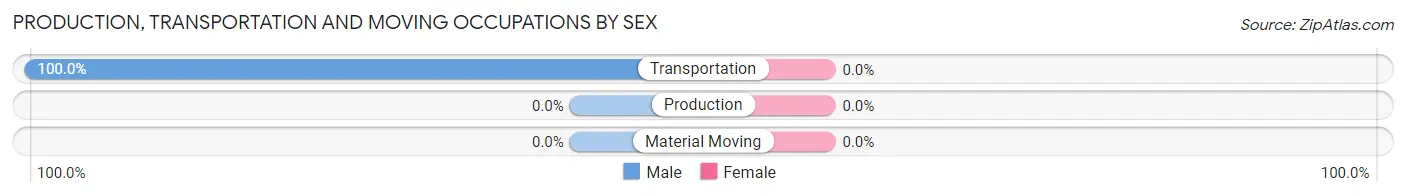
| Occupation | Male | Female |
| Production | 0 (0.0%) | 0 (0.0%) |
| Transportation | 16 (100.0%) | 0 (0.0%) |
| Material Moving | 0 (0.0%) | 0 (0.0%) |
| Total (Category) | 16 (100.0%) | 0 (0.0%) |
| Total (Overall) | 56 (69.1%) | 25 (30.9%) |
Employment Industries by Sex in Morristown
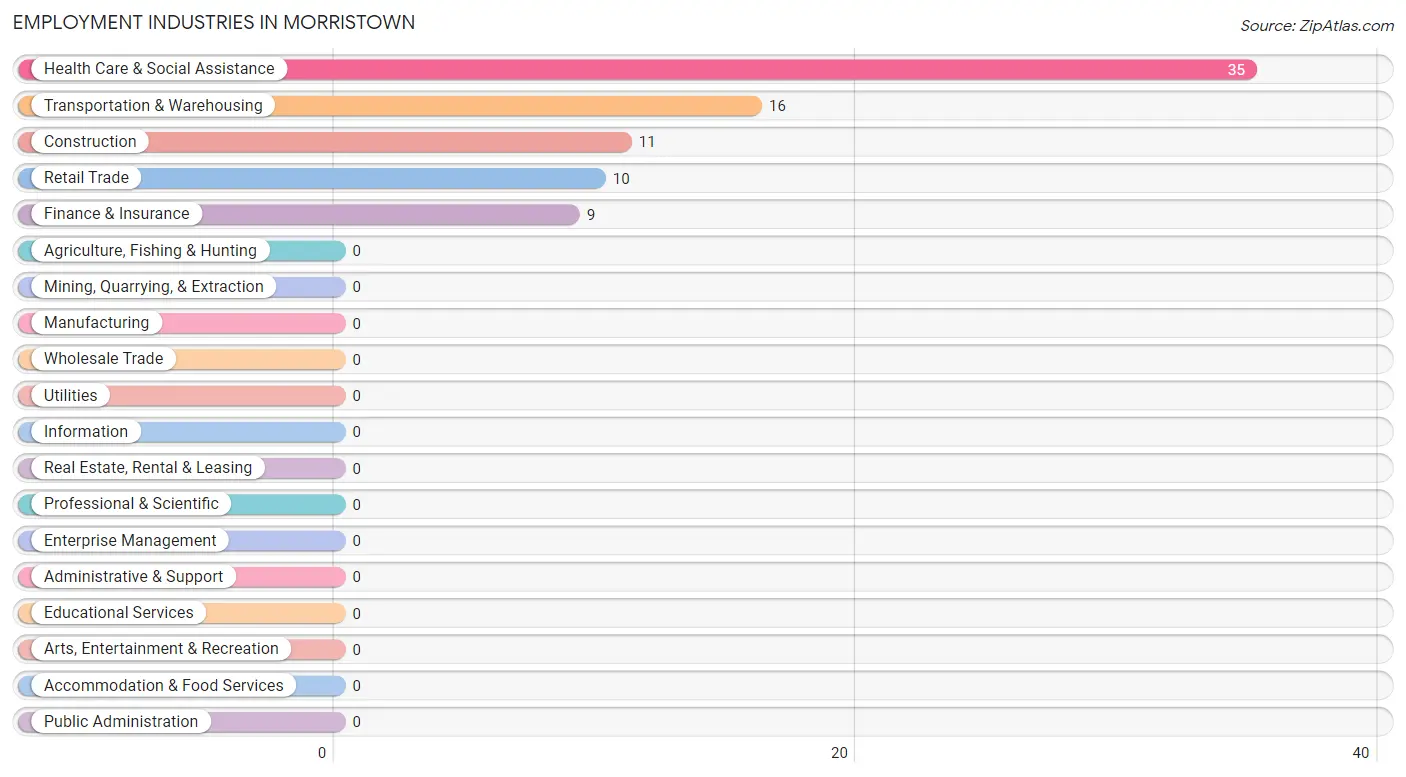
Employment Industries in Morristown
The major employment industries in Morristown include Health Care & Social Assistance (35 | 43.2%), Transportation & Warehousing (16 | 19.8%), Construction (11 | 13.6%), Retail Trade (10 | 12.3%), and Finance & Insurance (9 | 11.1%).
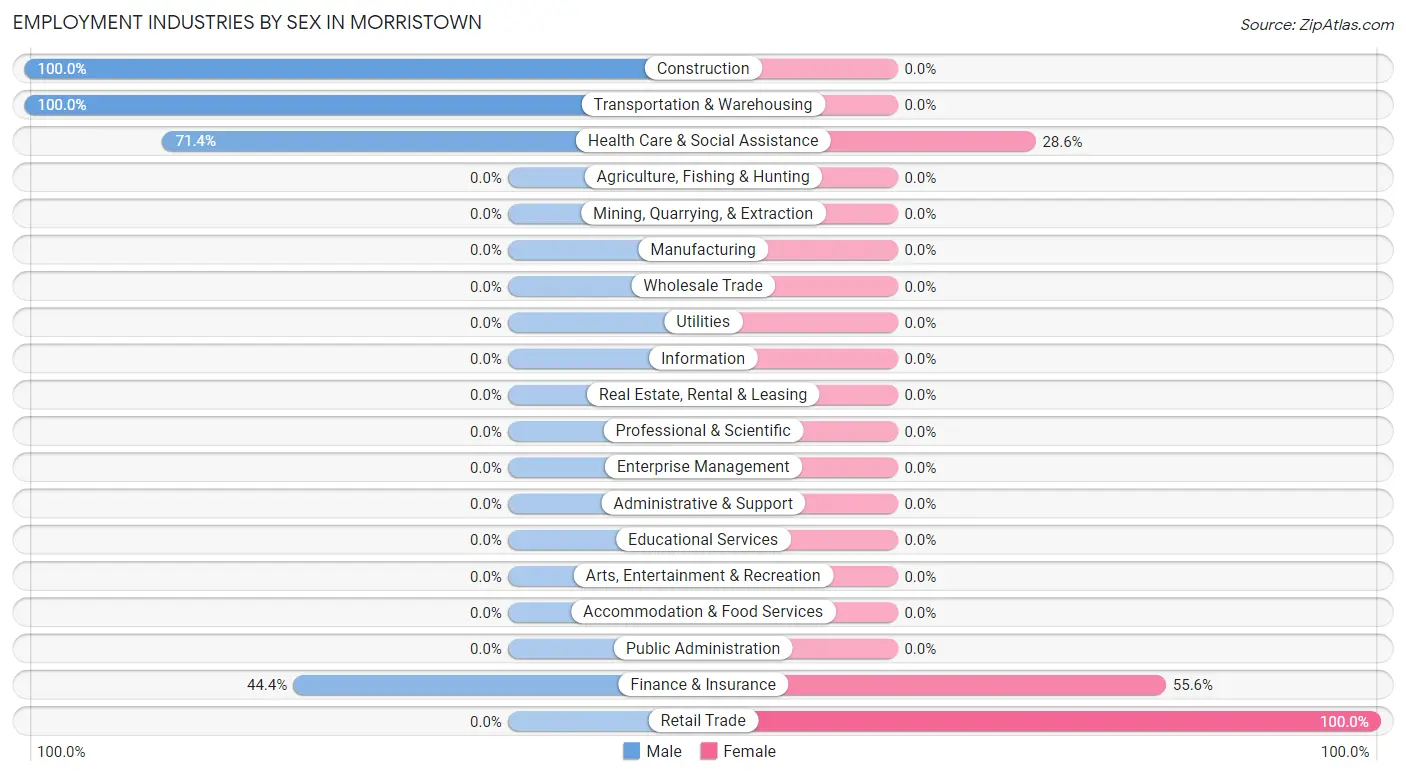
Employment Industries by Sex in Morristown
The Morristown industries that see more men than women are Construction (100.0%), Transportation & Warehousing (100.0%), and Health Care & Social Assistance (71.4%), whereas the industries that tend to have a higher number of women are Retail Trade (100.0%), Finance & Insurance (55.6%), and Health Care & Social Assistance (28.6%).
| Industry | Male | Female |
| Agriculture, Fishing & Hunting | 0 (0.0%) | 0 (0.0%) |
| Mining, Quarrying, & Extraction | 0 (0.0%) | 0 (0.0%) |
| Construction | 11 (100.0%) | 0 (0.0%) |
| Manufacturing | 0 (0.0%) | 0 (0.0%) |
| Wholesale Trade | 0 (0.0%) | 0 (0.0%) |
| Retail Trade | 0 (0.0%) | 10 (100.0%) |
| Transportation & Warehousing | 16 (100.0%) | 0 (0.0%) |
| Utilities | 0 (0.0%) | 0 (0.0%) |
| Information | 0 (0.0%) | 0 (0.0%) |
| Finance & Insurance | 4 (44.4%) | 5 (55.6%) |
| Real Estate, Rental & Leasing | 0 (0.0%) | 0 (0.0%) |
| Professional & Scientific | 0 (0.0%) | 0 (0.0%) |
| Enterprise Management | 0 (0.0%) | 0 (0.0%) |
| Administrative & Support | 0 (0.0%) | 0 (0.0%) |
| Educational Services | 0 (0.0%) | 0 (0.0%) |
| Health Care & Social Assistance | 25 (71.4%) | 10 (28.6%) |
| Arts, Entertainment & Recreation | 0 (0.0%) | 0 (0.0%) |
| Accommodation & Food Services | 0 (0.0%) | 0 (0.0%) |
| Public Administration | 0 (0.0%) | 0 (0.0%) |
| Total | 56 (69.1%) | 25 (30.9%) |
Education in Morristown
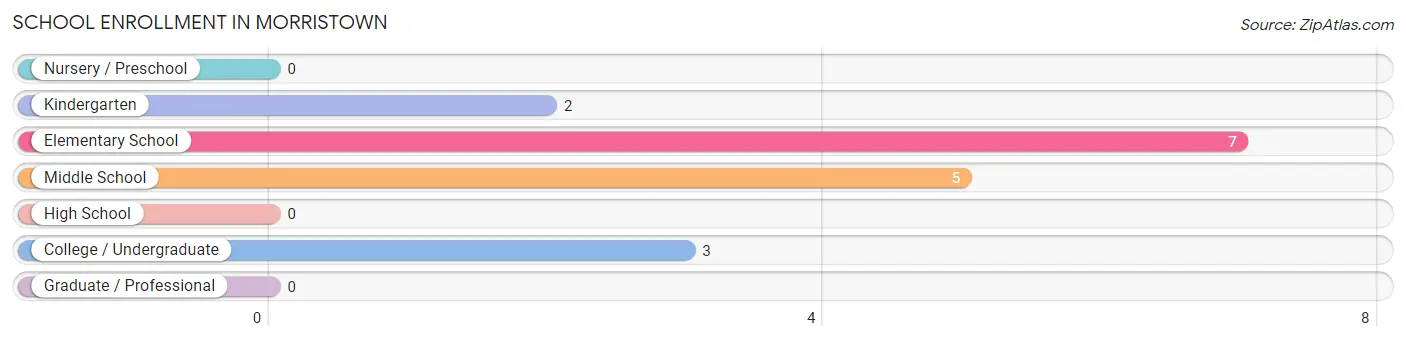
School Enrollment in Morristown
The most common levels of schooling among the 17 students in Morristown are elementary school (7 | 41.2%), middle school (5 | 29.4%), and college / undergraduate (3 | 17.6%).
| School Level | # Students | % Students |
| Nursery / Preschool | 0 | 0.0% |
| Kindergarten | 2 | 11.8% |
| Elementary School | 7 | 41.2% |
| Middle School | 5 | 29.4% |
| High School | 0 | 0.0% |
| College / Undergraduate | 3 | 17.6% |
| Graduate / Professional | 0 | 0.0% |
| Total | 17 | 100.0% |
School Enrollment by Age by Funding Source in Morristown
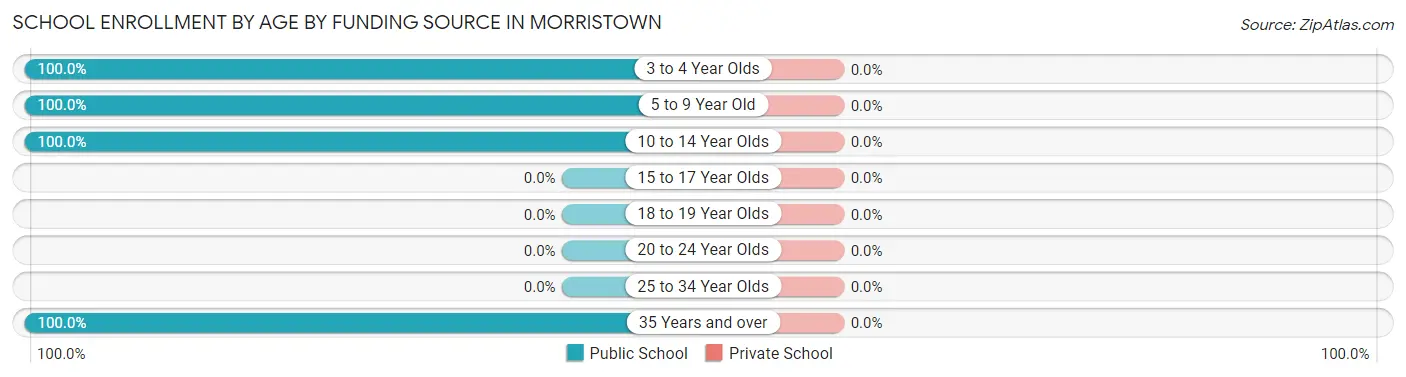
| Age Bracket | Public School | Private School |
| 3 to 4 Year Olds | 2 (100.0%) | 0 (0.0%) |
| 5 to 9 Year Old | 7 (100.0%) | 0 (0.0%) |
| 10 to 14 Year Olds | 5 (100.0%) | 0 (0.0%) |
| 15 to 17 Year Olds | 0 (0.0%) | 0 (0.0%) |
| 18 to 19 Year Olds | 0 (0.0%) | 0 (0.0%) |
| 20 to 24 Year Olds | 0 (0.0%) | 0 (0.0%) |
| 25 to 34 Year Olds | 0 (0.0%) | 0 (0.0%) |
| 35 Years and over | 3 (100.0%) | 0 (0.0%) |
| Total | 17 (100.0%) | 0 (0.0%) |
Educational Attainment by Field of Study in Morristown
Psychology (21 | 36.8%), literature & languages (16 | 28.1%), education (8 | 14.0%), computers & mathematics (4 | 7.0%), and science & technology (4 | 7.0%) are the most common fields of study among 57 individuals in Morristown who have obtained a bachelor's degree or higher.
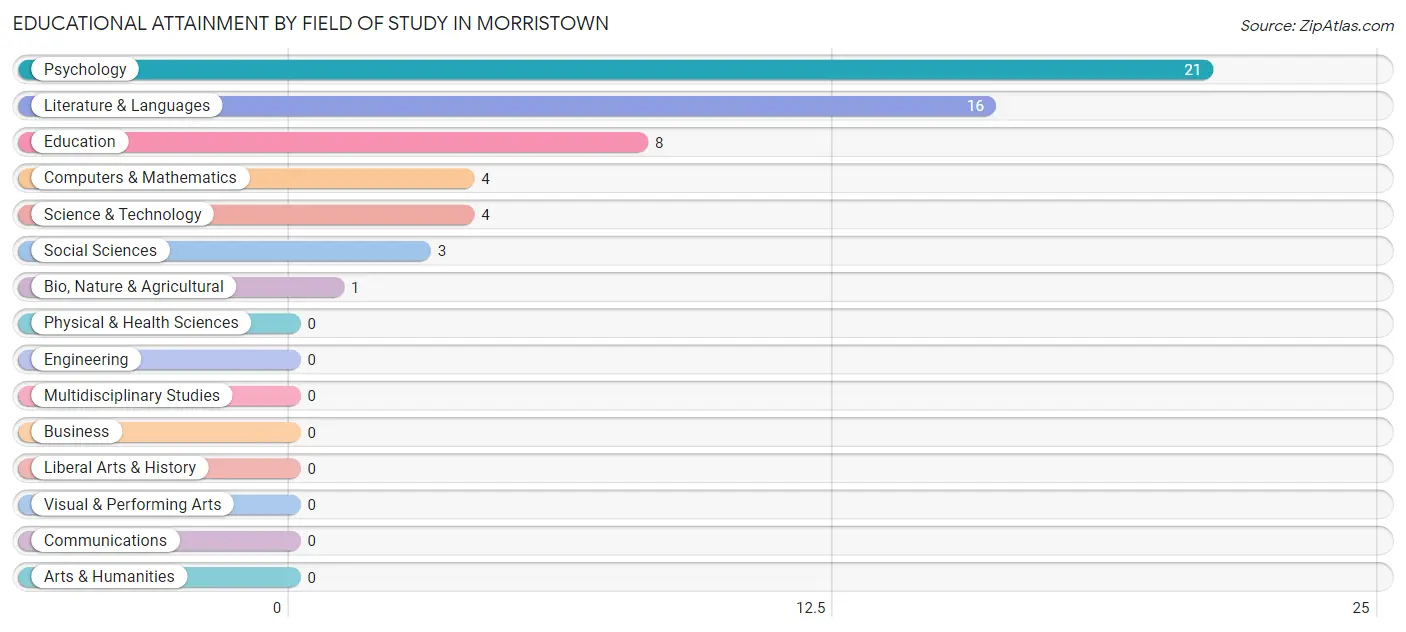
| Field of Study | # Graduates | % Graduates |
| Computers & Mathematics | 4 | 7.0% |
| Bio, Nature & Agricultural | 1 | 1.8% |
| Physical & Health Sciences | 0 | 0.0% |
| Psychology | 21 | 36.8% |
| Social Sciences | 3 | 5.3% |
| Engineering | 0 | 0.0% |
| Multidisciplinary Studies | 0 | 0.0% |
| Science & Technology | 4 | 7.0% |
| Business | 0 | 0.0% |
| Education | 8 | 14.0% |
| Literature & Languages | 16 | 28.1% |
| Liberal Arts & History | 0 | 0.0% |
| Visual & Performing Arts | 0 | 0.0% |
| Communications | 0 | 0.0% |
| Arts & Humanities | 0 | 0.0% |
| Total | 57 | 100.0% |
Transportation & Commute in Morristown
Vehicle Availability by Sex in Morristown
The most prevalent vehicle ownership categories in Morristown are males with no vehicle (25, accounting for 62.5%) and females with no vehicle (0, making up 100.0%).
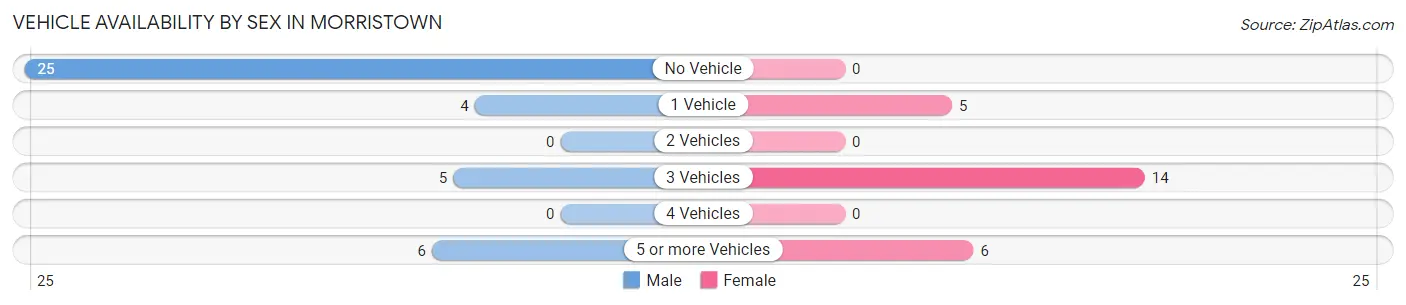
| Vehicles Available | Male | Female |
| No Vehicle | 25 (62.5%) | 0 (0.0%) |
| 1 Vehicle | 4 (10.0%) | 5 (20.0%) |
| 2 Vehicles | 0 (0.0%) | 0 (0.0%) |
| 3 Vehicles | 5 (12.5%) | 14 (56.0%) |
| 4 Vehicles | 0 (0.0%) | 0 (0.0%) |
| 5 or more Vehicles | 6 (15.0%) | 6 (24.0%) |
| Total | 40 (100.0%) | 25 (100.0%) |
Commute Time in Morristown
The most frequently occuring commute durations in Morristown are 15 to 19 minutes (14 commuters, 40.0%), 60 to 89 minutes (9 commuters, 25.7%), and 45 to 59 minutes (7 commuters, 20.0%).
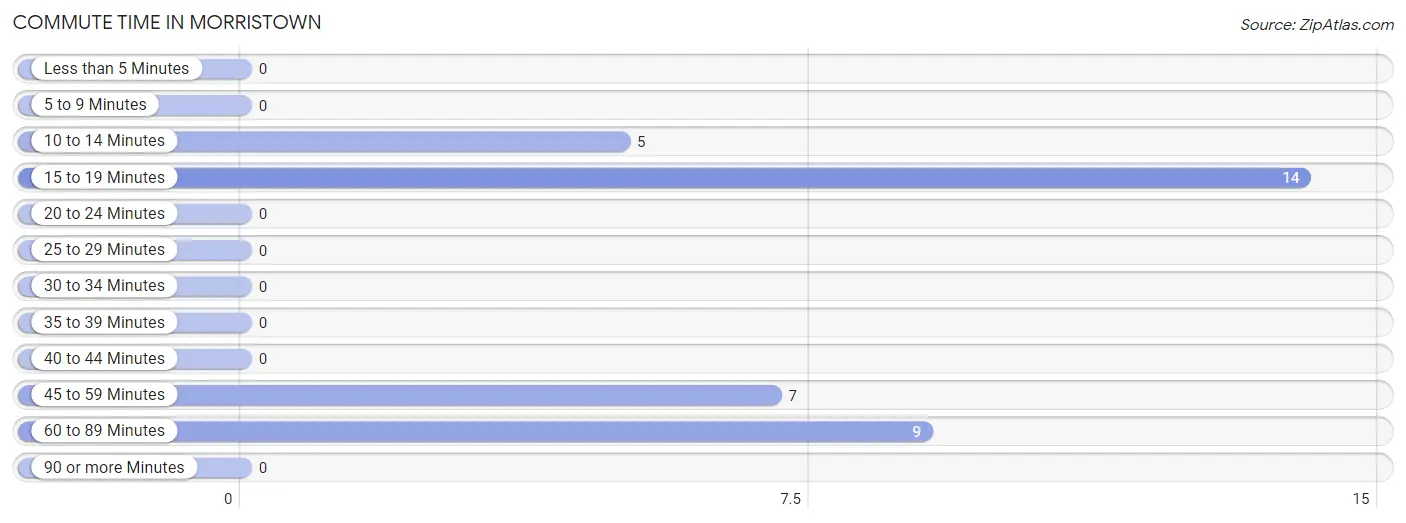
| Commute Time | # Commuters | % Commuters |
| Less than 5 Minutes | 0 | 0.0% |
| 5 to 9 Minutes | 0 | 0.0% |
| 10 to 14 Minutes | 5 | 14.3% |
| 15 to 19 Minutes | 14 | 40.0% |
| 20 to 24 Minutes | 0 | 0.0% |
| 25 to 29 Minutes | 0 | 0.0% |
| 30 to 34 Minutes | 0 | 0.0% |
| 35 to 39 Minutes | 0 | 0.0% |
| 40 to 44 Minutes | 0 | 0.0% |
| 45 to 59 Minutes | 7 | 20.0% |
| 60 to 89 Minutes | 9 | 25.7% |
| 90 or more Minutes | 0 | 0.0% |
Commute Time by Sex in Morristown
The most common commute times in Morristown are 60 to 89 minutes (9 commuters, 60.0%) for males and 15 to 19 minutes (8 commuters, 40.0%) for females.
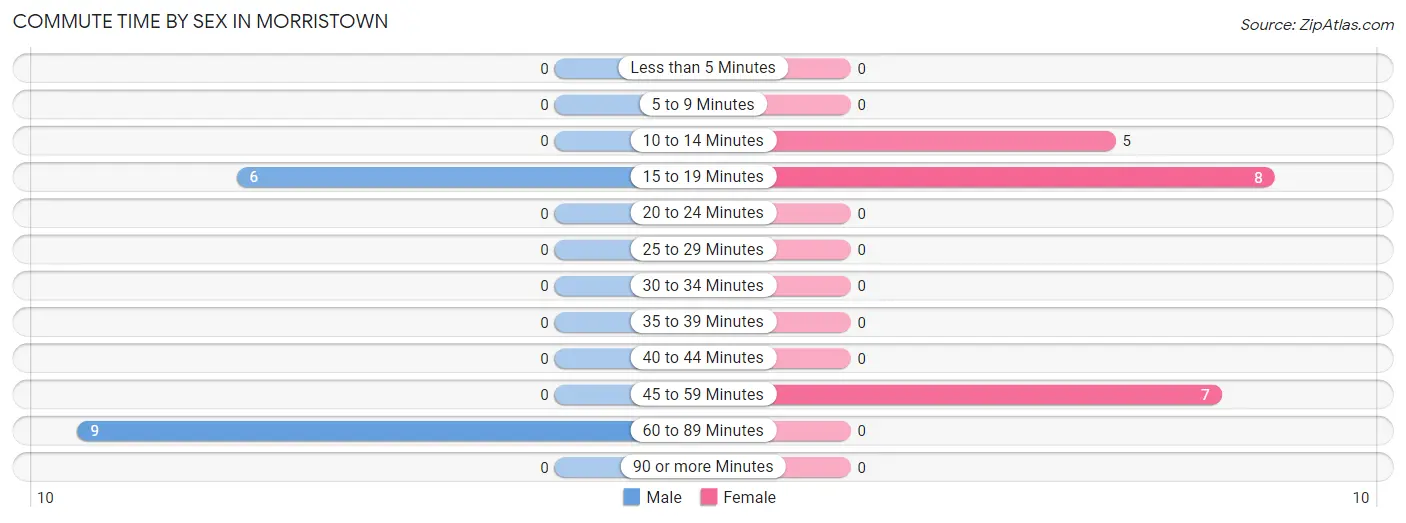
| Commute Time | Male | Female |
| Less than 5 Minutes | 0 (0.0%) | 0 (0.0%) |
| 5 to 9 Minutes | 0 (0.0%) | 0 (0.0%) |
| 10 to 14 Minutes | 0 (0.0%) | 5 (25.0%) |
| 15 to 19 Minutes | 6 (40.0%) | 8 (40.0%) |
| 20 to 24 Minutes | 0 (0.0%) | 0 (0.0%) |
| 25 to 29 Minutes | 0 (0.0%) | 0 (0.0%) |
| 30 to 34 Minutes | 0 (0.0%) | 0 (0.0%) |
| 35 to 39 Minutes | 0 (0.0%) | 0 (0.0%) |
| 40 to 44 Minutes | 0 (0.0%) | 0 (0.0%) |
| 45 to 59 Minutes | 0 (0.0%) | 7 (35.0%) |
| 60 to 89 Minutes | 9 (60.0%) | 0 (0.0%) |
| 90 or more Minutes | 0 (0.0%) | 0 (0.0%) |
Time of Departure to Work by Sex in Morristown
The most frequent times of departure to work in Morristown are 5:30 AM to 5:59 AM (6, 40.0%) for males and 6:00 AM to 6:29 AM (7, 35.0%) for females.
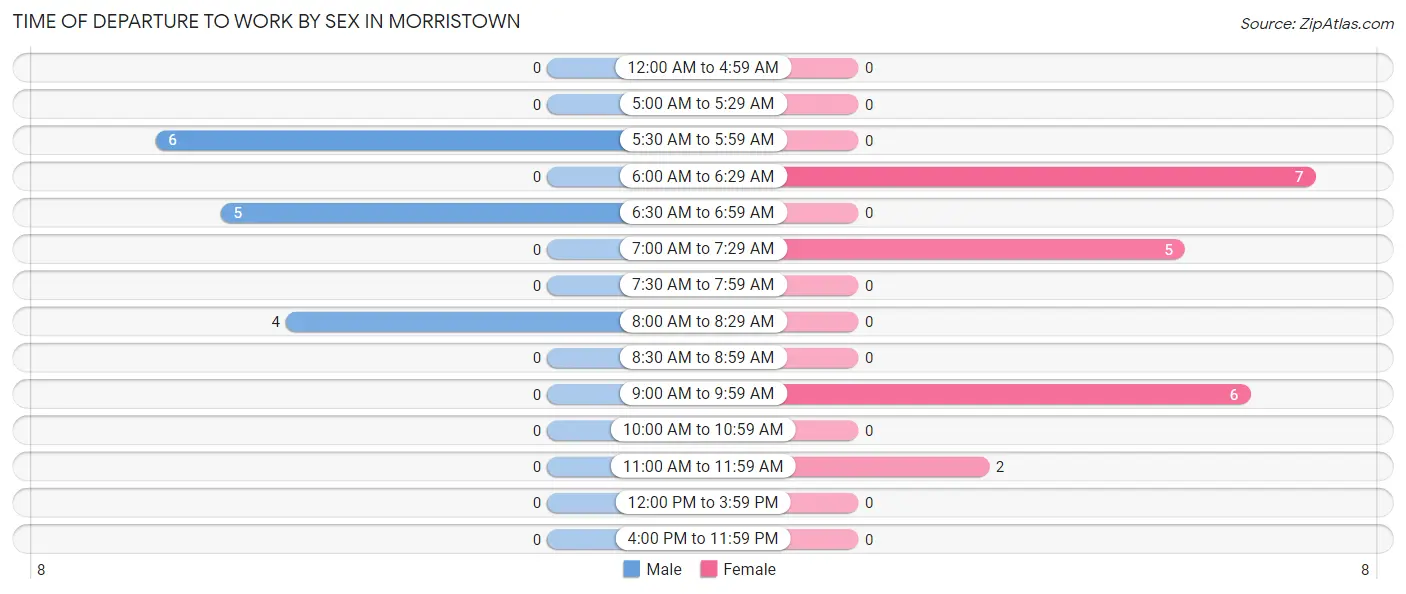
| Time of Departure | Male | Female |
| 12:00 AM to 4:59 AM | 0 (0.0%) | 0 (0.0%) |
| 5:00 AM to 5:29 AM | 0 (0.0%) | 0 (0.0%) |
| 5:30 AM to 5:59 AM | 6 (40.0%) | 0 (0.0%) |
| 6:00 AM to 6:29 AM | 0 (0.0%) | 7 (35.0%) |
| 6:30 AM to 6:59 AM | 5 (33.3%) | 0 (0.0%) |
| 7:00 AM to 7:29 AM | 0 (0.0%) | 5 (25.0%) |
| 7:30 AM to 7:59 AM | 0 (0.0%) | 0 (0.0%) |
| 8:00 AM to 8:29 AM | 4 (26.7%) | 0 (0.0%) |
| 8:30 AM to 8:59 AM | 0 (0.0%) | 0 (0.0%) |
| 9:00 AM to 9:59 AM | 0 (0.0%) | 6 (30.0%) |
| 10:00 AM to 10:59 AM | 0 (0.0%) | 0 (0.0%) |
| 11:00 AM to 11:59 AM | 0 (0.0%) | 2 (10.0%) |
| 12:00 PM to 3:59 PM | 0 (0.0%) | 0 (0.0%) |
| 4:00 PM to 11:59 PM | 0 (0.0%) | 0 (0.0%) |
| Total | 15 (100.0%) | 20 (100.0%) |
Housing Occupancy in Morristown
Occupancy by Ownership in Morristown
Of the total 134 dwellings in Morristown, owner-occupied units account for 99 (73.9%), while renter-occupied units make up 35 (26.1%).
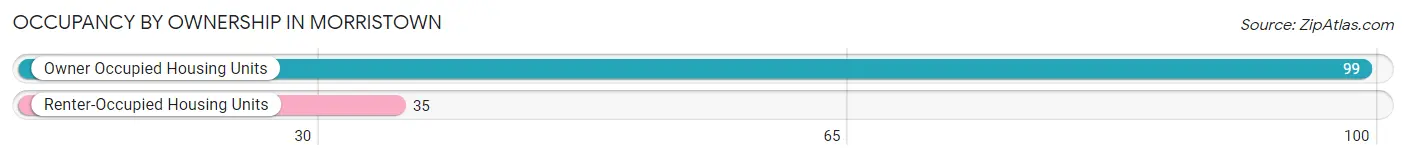
| Occupancy | # Housing Units | % Housing Units |
| Owner Occupied Housing Units | 99 | 73.9% |
| Renter-Occupied Housing Units | 35 | 26.1% |
| Total Occupied Housing Units | 134 | 100.0% |
Occupancy by Household Size in Morristown
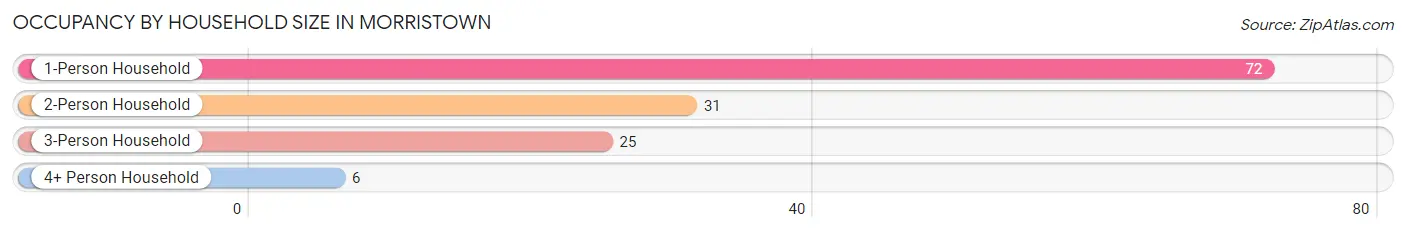
| Household Size | # Housing Units | % Housing Units |
| 1-Person Household | 72 | 53.7% |
| 2-Person Household | 31 | 23.1% |
| 3-Person Household | 25 | 18.7% |
| 4+ Person Household | 6 | 4.5% |
| Total Housing Units | 134 | 100.0% |
Occupancy by Ownership by Household Size in Morristown
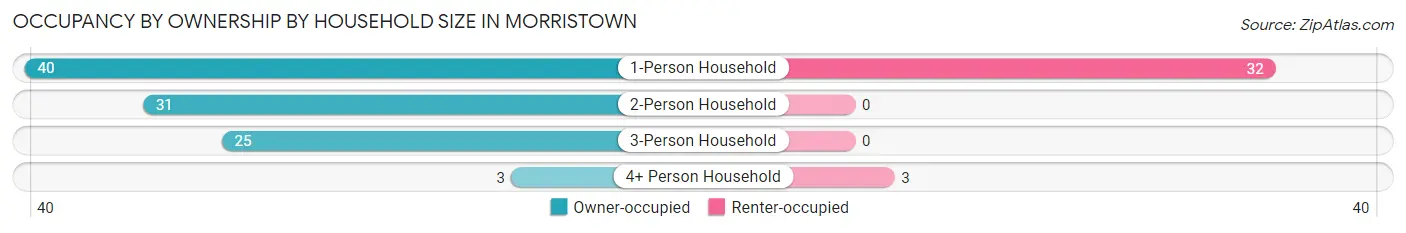
| Household Size | Owner-occupied | Renter-occupied |
| 1-Person Household | 40 (55.6%) | 32 (44.4%) |
| 2-Person Household | 31 (100.0%) | 0 (0.0%) |
| 3-Person Household | 25 (100.0%) | 0 (0.0%) |
| 4+ Person Household | 3 (50.0%) | 3 (50.0%) |
| Total Housing Units | 99 (73.9%) | 35 (26.1%) |
Occupancy by Educational Attainment in Morristown
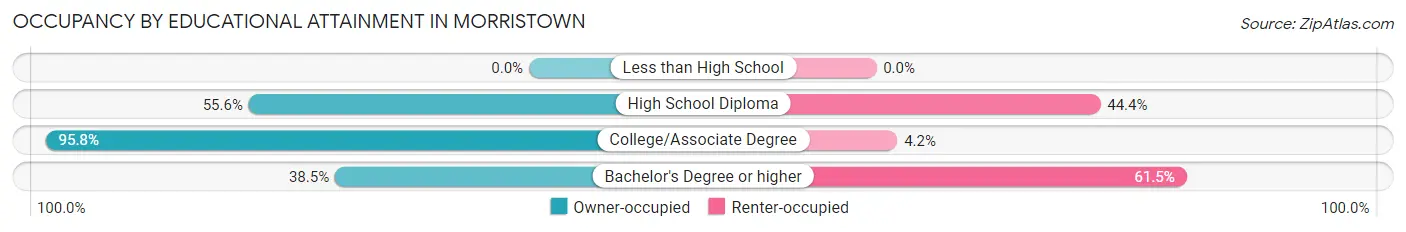
| Household Size | Owner-occupied | Renter-occupied |
| Less than High School | 0 (0.0%) | 0 (0.0%) |
| High School Diploma | 20 (55.6%) | 16 (44.4%) |
| College/Associate Degree | 69 (95.8%) | 3 (4.2%) |
| Bachelor's Degree or higher | 10 (38.5%) | 16 (61.5%) |
Occupancy by Age of Householder in Morristown
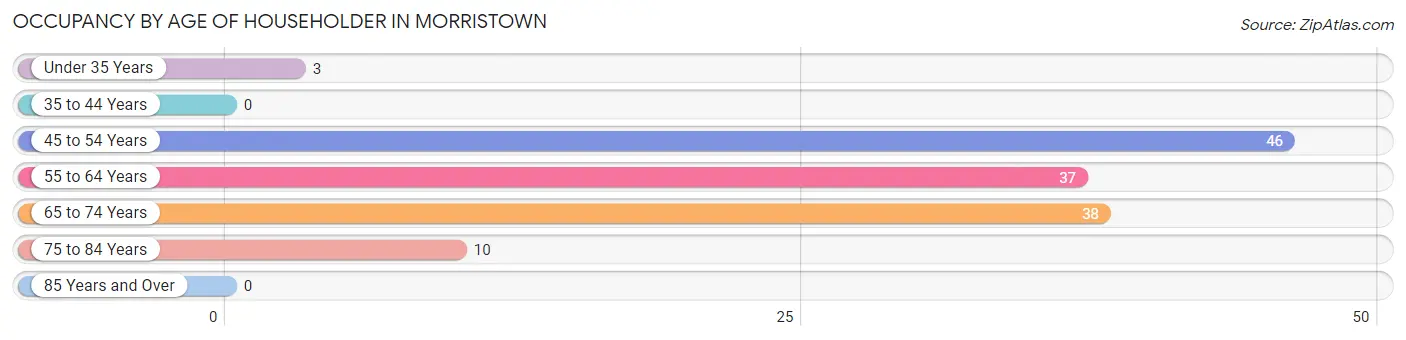
| Age Bracket | # Households | % Households |
| Under 35 Years | 3 | 2.2% |
| 35 to 44 Years | 0 | 0.0% |
| 45 to 54 Years | 46 | 34.3% |
| 55 to 64 Years | 37 | 27.6% |
| 65 to 74 Years | 38 | 28.4% |
| 75 to 84 Years | 10 | 7.5% |
| 85 Years and Over | 0 | 0.0% |
| Total | 134 | 100.0% |
Housing Finances in Morristown
Median Income by Occupancy in Morristown
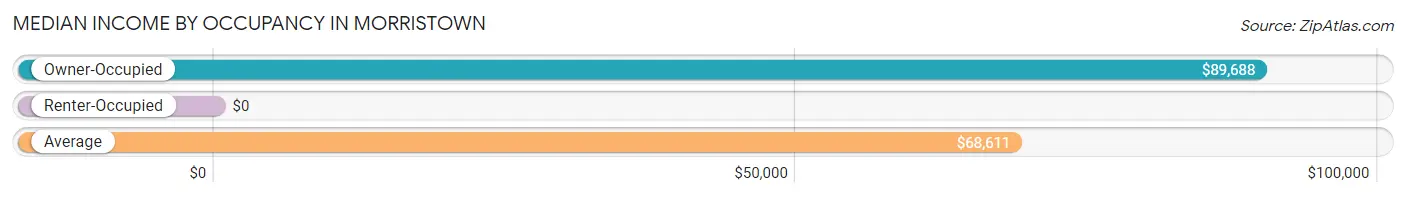
| Occupancy Type | # Households | Median Income |
| Owner-Occupied | 99 (73.9%) | $89,688 |
| Renter-Occupied | 35 (26.1%) | $0 |
| Average | 134 (100.0%) | $68,611 |
Occupancy by Householder Income Bracket in Morristown
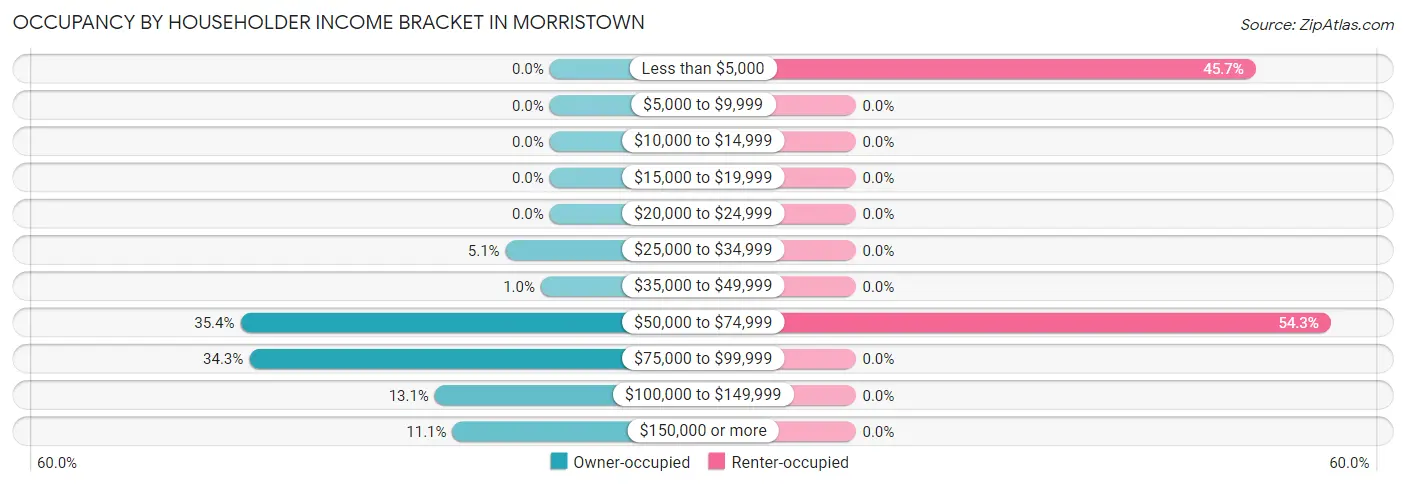
| Income Bracket | Owner-occupied | Renter-occupied |
| Less than $5,000 | 0 (0.0%) | 16 (45.7%) |
| $5,000 to $9,999 | 0 (0.0%) | 0 (0.0%) |
| $10,000 to $14,999 | 0 (0.0%) | 0 (0.0%) |
| $15,000 to $19,999 | 0 (0.0%) | 0 (0.0%) |
| $20,000 to $24,999 | 0 (0.0%) | 0 (0.0%) |
| $25,000 to $34,999 | 5 (5.1%) | 0 (0.0%) |
| $35,000 to $49,999 | 1 (1.0%) | 0 (0.0%) |
| $50,000 to $74,999 | 35 (35.3%) | 19 (54.3%) |
| $75,000 to $99,999 | 34 (34.3%) | 0 (0.0%) |
| $100,000 to $149,999 | 13 (13.1%) | 0 (0.0%) |
| $150,000 or more | 11 (11.1%) | 0 (0.0%) |
| Total | 99 (100.0%) | 35 (100.0%) |
Monthly Housing Cost Tiers in Morristown
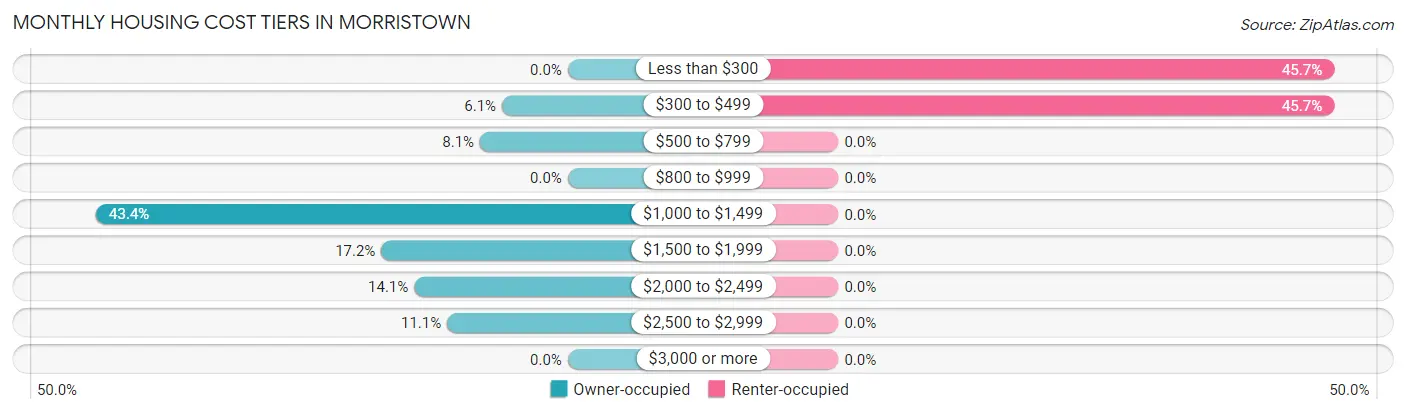
| Monthly Cost | Owner-occupied | Renter-occupied |
| Less than $300 | 0 (0.0%) | 16 (45.7%) |
| $300 to $499 | 6 (6.1%) | 16 (45.7%) |
| $500 to $799 | 8 (8.1%) | 0 (0.0%) |
| $800 to $999 | 0 (0.0%) | 0 (0.0%) |
| $1,000 to $1,499 | 43 (43.4%) | 0 (0.0%) |
| $1,500 to $1,999 | 17 (17.2%) | 0 (0.0%) |
| $2,000 to $2,499 | 14 (14.1%) | 0 (0.0%) |
| $2,500 to $2,999 | 11 (11.1%) | 0 (0.0%) |
| $3,000 or more | 0 (0.0%) | 0 (0.0%) |
| Total | 99 (100.0%) | 35 (100.0%) |
Physical Housing Characteristics in Morristown
Housing Structures in Morristown
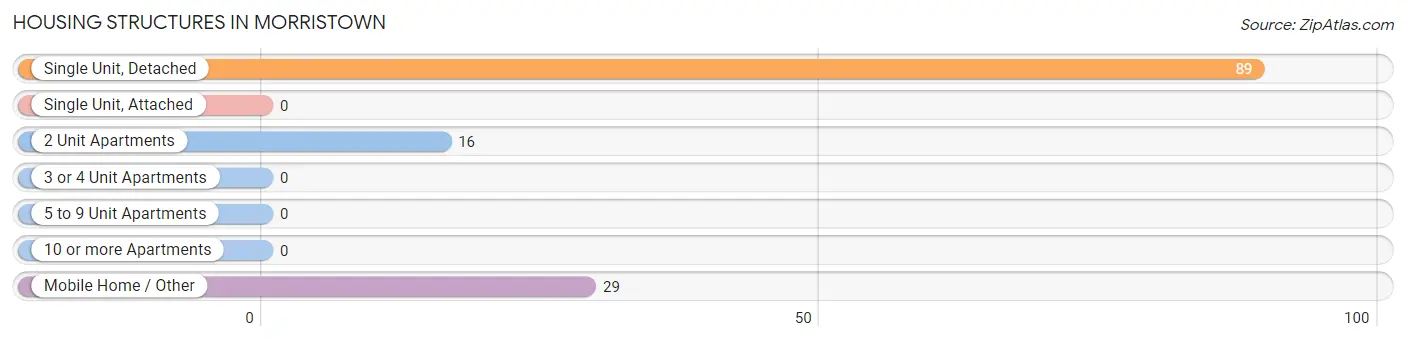
| Structure Type | # Housing Units | % Housing Units |
| Single Unit, Detached | 89 | 66.4% |
| Single Unit, Attached | 0 | 0.0% |
| 2 Unit Apartments | 16 | 11.9% |
| 3 or 4 Unit Apartments | 0 | 0.0% |
| 5 to 9 Unit Apartments | 0 | 0.0% |
| 10 or more Apartments | 0 | 0.0% |
| Mobile Home / Other | 29 | 21.6% |
| Total | 134 | 100.0% |
Housing Structures by Occupancy in Morristown
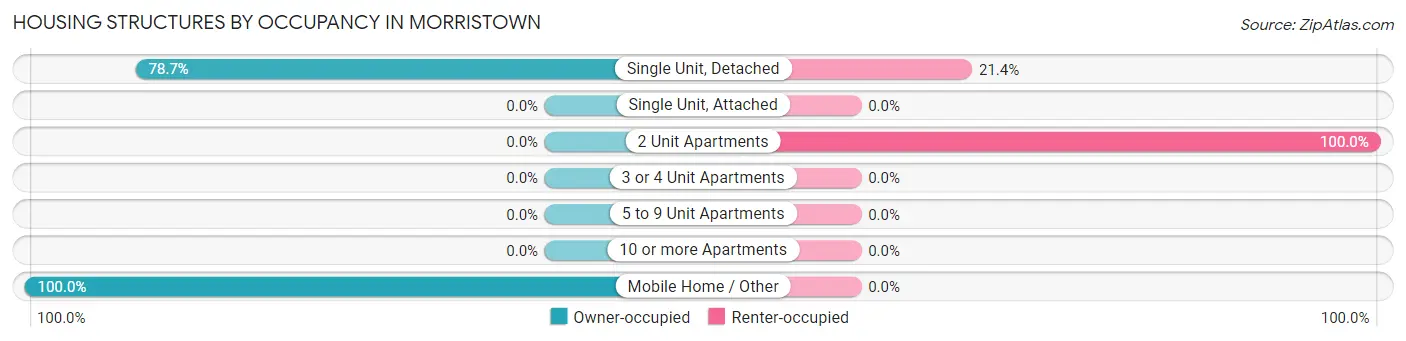
| Structure Type | Owner-occupied | Renter-occupied |
| Single Unit, Detached | 70 (78.6%) | 19 (21.3%) |
| Single Unit, Attached | 0 (0.0%) | 0 (0.0%) |
| 2 Unit Apartments | 0 (0.0%) | 16 (100.0%) |
| 3 or 4 Unit Apartments | 0 (0.0%) | 0 (0.0%) |
| 5 to 9 Unit Apartments | 0 (0.0%) | 0 (0.0%) |
| 10 or more Apartments | 0 (0.0%) | 0 (0.0%) |
| Mobile Home / Other | 29 (100.0%) | 0 (0.0%) |
| Total | 99 (73.9%) | 35 (26.1%) |
Housing Structures by Number of Rooms in Morristown
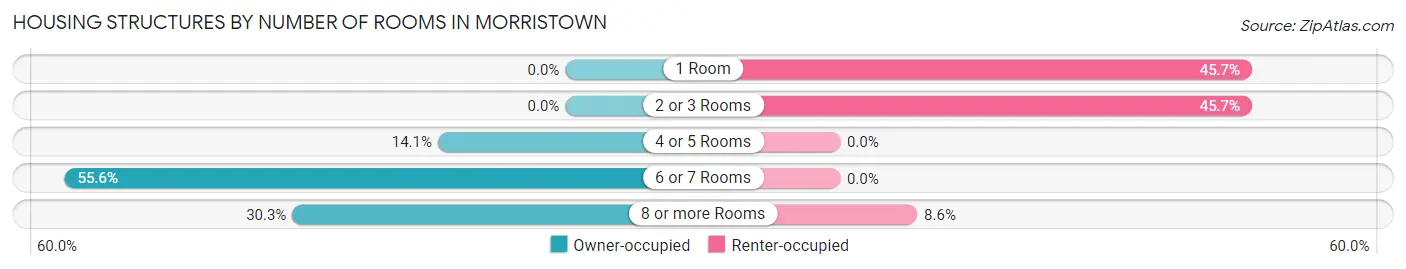
| Number of Rooms | Owner-occupied | Renter-occupied |
| 1 Room | 0 (0.0%) | 16 (45.7%) |
| 2 or 3 Rooms | 0 (0.0%) | 16 (45.7%) |
| 4 or 5 Rooms | 14 (14.1%) | 0 (0.0%) |
| 6 or 7 Rooms | 55 (55.6%) | 0 (0.0%) |
| 8 or more Rooms | 30 (30.3%) | 3 (8.6%) |
| Total | 99 (100.0%) | 35 (100.0%) |
Housing Structure by Heating Type in Morristown
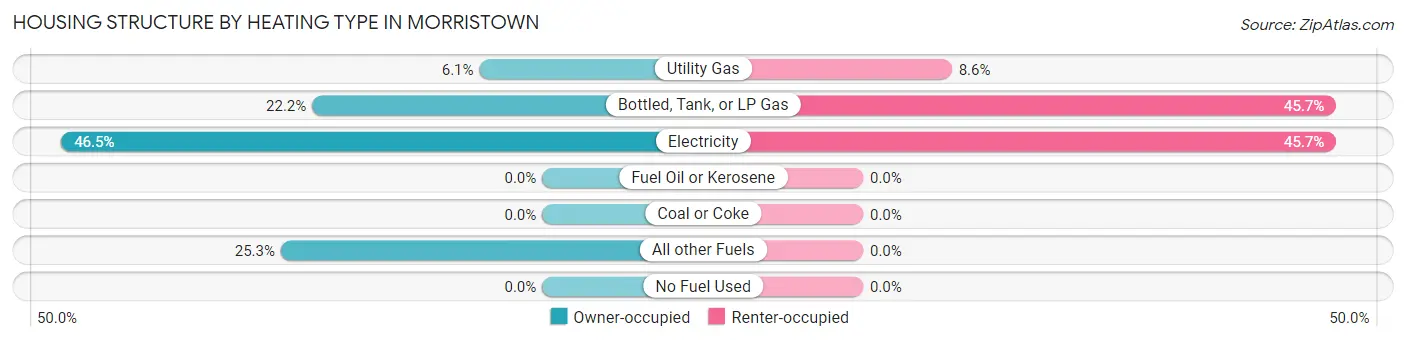
| Heating Type | Owner-occupied | Renter-occupied |
| Utility Gas | 6 (6.1%) | 3 (8.6%) |
| Bottled, Tank, or LP Gas | 22 (22.2%) | 16 (45.7%) |
| Electricity | 46 (46.5%) | 16 (45.7%) |
| Fuel Oil or Kerosene | 0 (0.0%) | 0 (0.0%) |
| Coal or Coke | 0 (0.0%) | 0 (0.0%) |
| All other Fuels | 25 (25.3%) | 0 (0.0%) |
| No Fuel Used | 0 (0.0%) | 0 (0.0%) |
| Total | 99 (100.0%) | 35 (100.0%) |
Household Vehicle Usage in Morristown
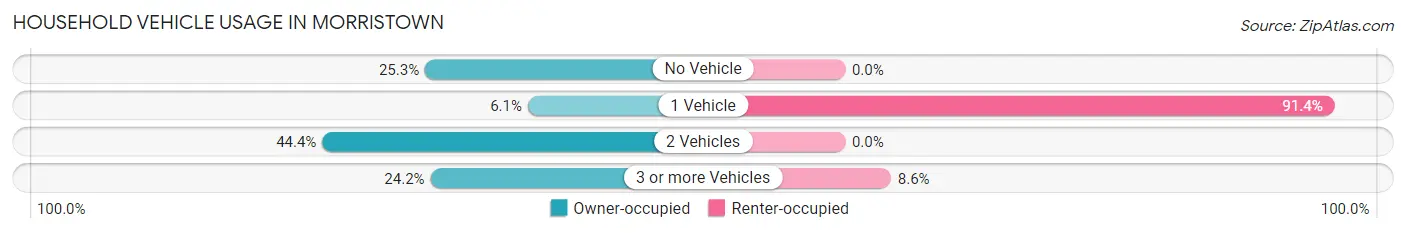
| Vehicles per Household | Owner-occupied | Renter-occupied |
| No Vehicle | 25 (25.3%) | 0 (0.0%) |
| 1 Vehicle | 6 (6.1%) | 32 (91.4%) |
| 2 Vehicles | 44 (44.4%) | 0 (0.0%) |
| 3 or more Vehicles | 24 (24.2%) | 3 (8.6%) |
| Total | 99 (100.0%) | 35 (100.0%) |
Real Estate & Mortgages in Morristown
Real Estate and Mortgage Overview in Morristown
| Characteristic | Without Mortgage | With Mortgage |
| Housing Units | 14 | 85 |
| Median Property Value | $283,300 | $261,700 |
| Median Household Income | $110,833 | $11 |
| Monthly Housing Costs | $533 | $0 |
| Real Estate Taxes | $1,563 | $0 |
Property Value by Mortgage Status in Morristown
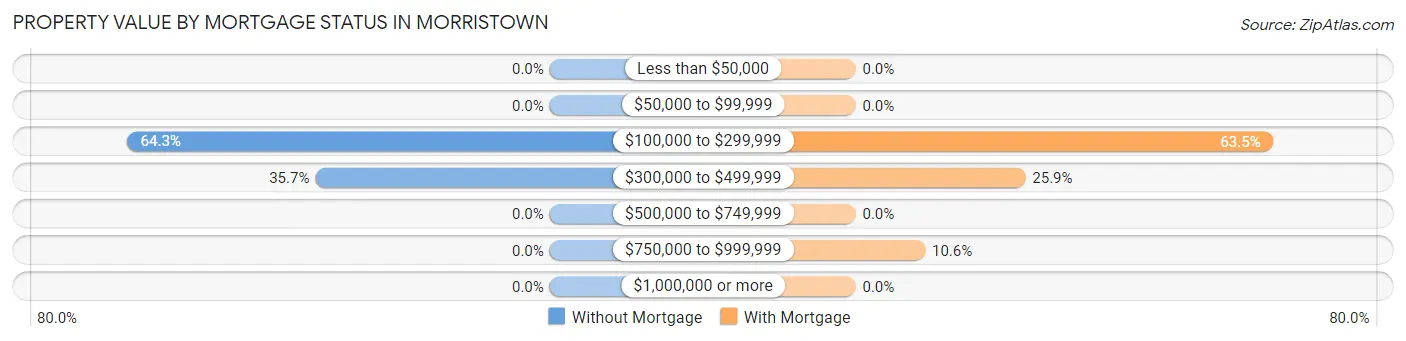
| Property Value | Without Mortgage | With Mortgage |
| Less than $50,000 | 0 (0.0%) | 0 (0.0%) |
| $50,000 to $99,999 | 0 (0.0%) | 0 (0.0%) |
| $100,000 to $299,999 | 9 (64.3%) | 54 (63.5%) |
| $300,000 to $499,999 | 5 (35.7%) | 22 (25.9%) |
| $500,000 to $749,999 | 0 (0.0%) | 0 (0.0%) |
| $750,000 to $999,999 | 0 (0.0%) | 9 (10.6%) |
| $1,000,000 or more | 0 (0.0%) | 0 (0.0%) |
| Total | 14 (100.0%) | 85 (100.0%) |
Household Income by Mortgage Status in Morristown
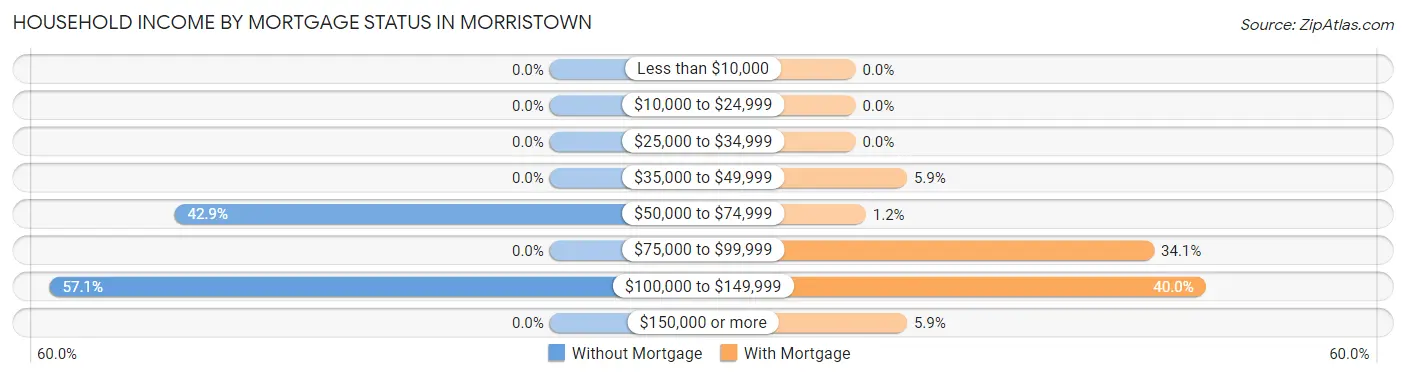
| Household Income | Without Mortgage | With Mortgage |
| Less than $10,000 | 0 (0.0%) | 0 (0.0%) |
| $10,000 to $24,999 | 0 (0.0%) | 0 (0.0%) |
| $25,000 to $34,999 | 0 (0.0%) | 0 (0.0%) |
| $35,000 to $49,999 | 0 (0.0%) | 5 (5.9%) |
| $50,000 to $74,999 | 6 (42.9%) | 1 (1.2%) |
| $75,000 to $99,999 | 0 (0.0%) | 29 (34.1%) |
| $100,000 to $149,999 | 8 (57.1%) | 34 (40.0%) |
| $150,000 or more | 0 (0.0%) | 5 (5.9%) |
| Total | 14 (100.0%) | 85 (100.0%) |
Property Value to Household Income Ratio in Morristown
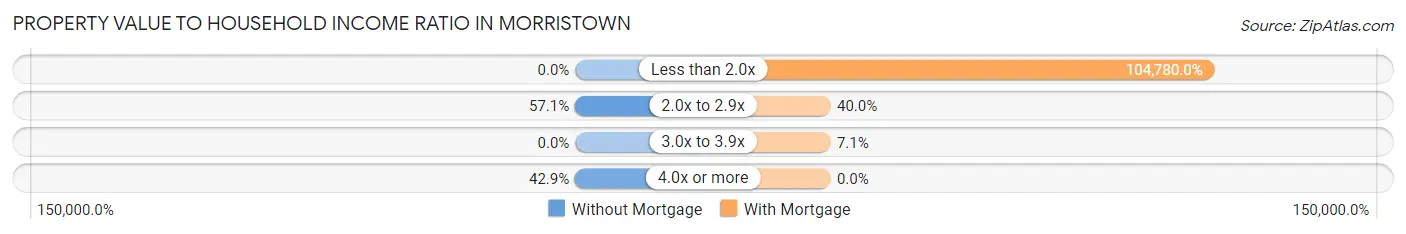
| Value-to-Income Ratio | Without Mortgage | With Mortgage |
| Less than 2.0x | 0 (0.0%) | 89,063 (104,780.0%) |
| 2.0x to 2.9x | 8 (57.1%) | 34 (40.0%) |
| 3.0x to 3.9x | 0 (0.0%) | 6 (7.1%) |
| 4.0x or more | 6 (42.9%) | 0 (0.0%) |
| Total | 14 (100.0%) | 85 (100.0%) |
Real Estate Taxes by Mortgage Status in Morristown
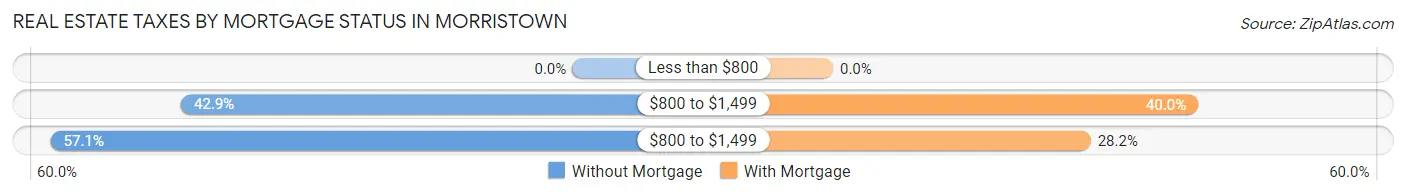
| Property Taxes | Without Mortgage | With Mortgage |
| Less than $800 | 0 (0.0%) | 0 (0.0%) |
| $800 to $1,499 | 6 (42.9%) | 34 (40.0%) |
| $800 to $1,499 | 8 (57.1%) | 24 (28.2%) |
| Total | 14 (100.0%) | 85 (100.0%) |
Health & Disability in Morristown
Health Insurance Coverage by Age in Morristown
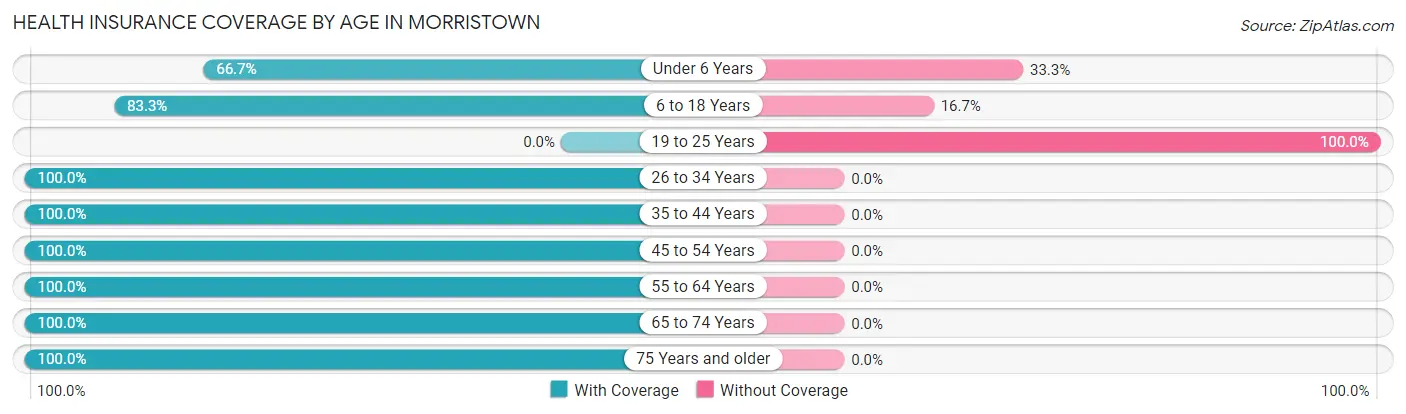
| Age Bracket | With Coverage | Without Coverage |
| Under 6 Years | 4 (66.7%) | 2 (33.3%) |
| 6 to 18 Years | 10 (83.3%) | 2 (16.7%) |
| 19 to 25 Years | 0 (0.0%) | 5 (100.0%) |
| 26 to 34 Years | 10 (100.0%) | 0 (0.0%) |
| 35 to 44 Years | 7 (100.0%) | 0 (0.0%) |
| 45 to 54 Years | 59 (100.0%) | 0 (0.0%) |
| 55 to 64 Years | 68 (100.0%) | 0 (0.0%) |
| 65 to 74 Years | 61 (100.0%) | 0 (0.0%) |
| 75 Years and older | 10 (100.0%) | 0 (0.0%) |
| Total | 229 (96.2%) | 9 (3.8%) |
Health Insurance Coverage by Citizenship Status in Morristown
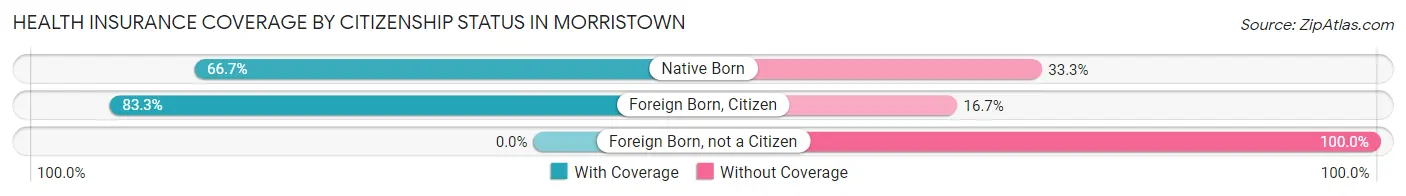
| Citizenship Status | With Coverage | Without Coverage |
| Native Born | 4 (66.7%) | 2 (33.3%) |
| Foreign Born, Citizen | 10 (83.3%) | 2 (16.7%) |
| Foreign Born, not a Citizen | 0 (0.0%) | 5 (100.0%) |
Health Insurance Coverage by Household Income in Morristown
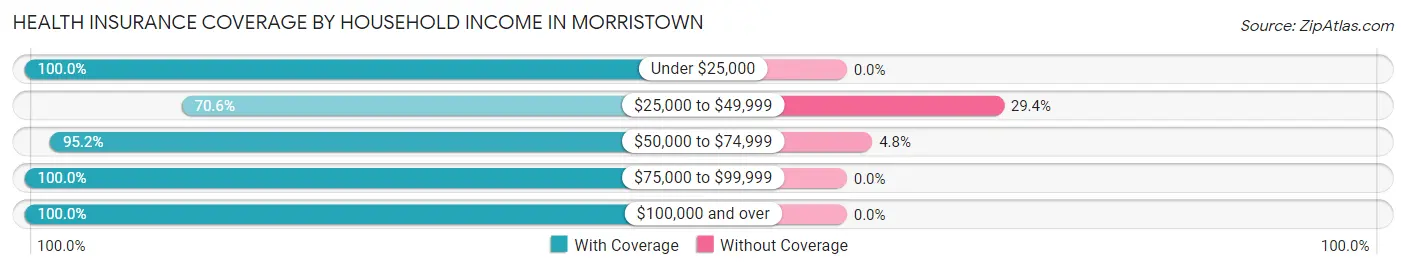
| Household Income | With Coverage | Without Coverage |
| Under $25,000 | 16 (100.0%) | 0 (0.0%) |
| $25,000 to $49,999 | 12 (70.6%) | 5 (29.4%) |
| $50,000 to $74,999 | 80 (95.2%) | 4 (4.8%) |
| $75,000 to $99,999 | 47 (100.0%) | 0 (0.0%) |
| $100,000 and over | 74 (100.0%) | 0 (0.0%) |
Public vs Private Health Insurance Coverage by Age in Morristown
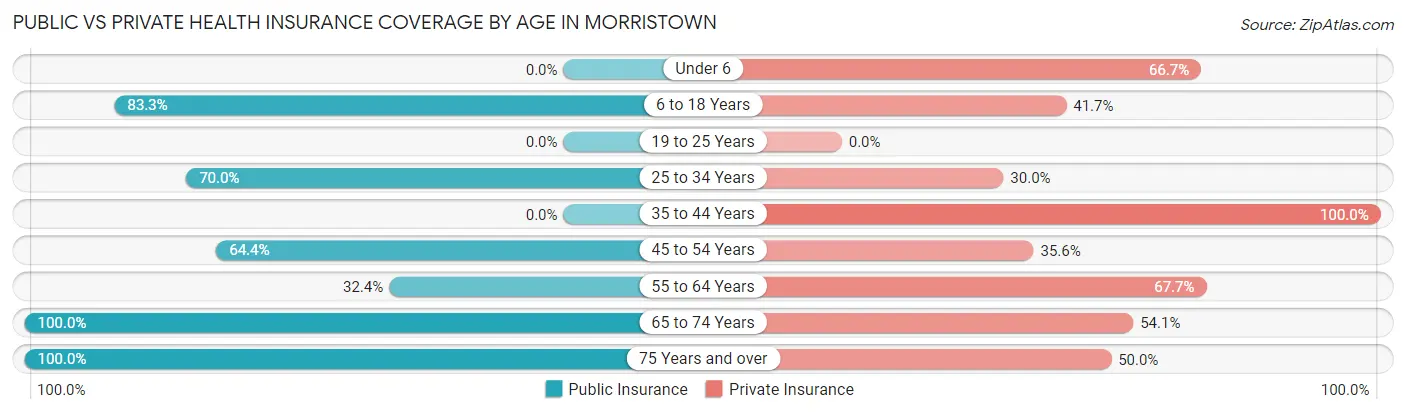
| Age Bracket | Public Insurance | Private Insurance |
| Under 6 | 0 (0.0%) | 4 (66.7%) |
| 6 to 18 Years | 10 (83.3%) | 5 (41.7%) |
| 19 to 25 Years | 0 (0.0%) | 0 (0.0%) |
| 25 to 34 Years | 7 (70.0%) | 3 (30.0%) |
| 35 to 44 Years | 0 (0.0%) | 7 (100.0%) |
| 45 to 54 Years | 38 (64.4%) | 21 (35.6%) |
| 55 to 64 Years | 22 (32.4%) | 46 (67.6%) |
| 65 to 74 Years | 61 (100.0%) | 33 (54.1%) |
| 75 Years and over | 10 (100.0%) | 5 (50.0%) |
| Total | 148 (62.2%) | 124 (52.1%) |
Disability Status by Sex by Age in Morristown
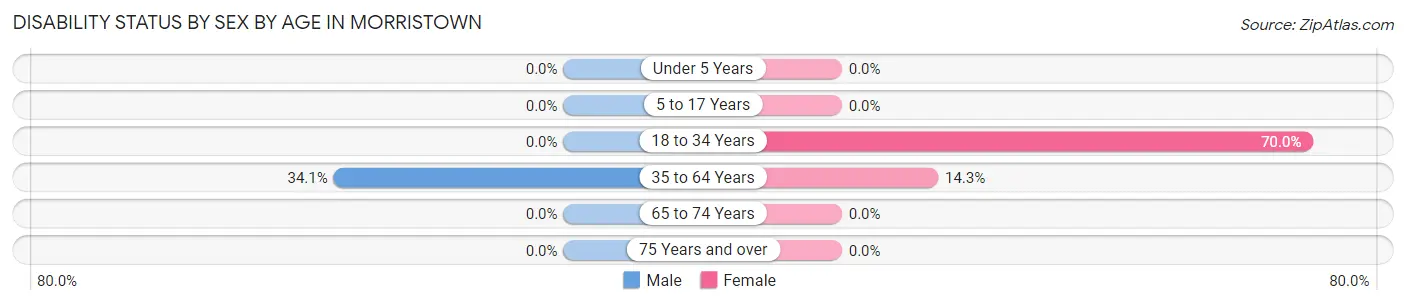
| Age Bracket | Male | Female |
| Under 5 Years | 0 (0.0%) | 0 (0.0%) |
| 5 to 17 Years | 0 (0.0%) | 0 (0.0%) |
| 18 to 34 Years | 0 (0.0%) | 7 (70.0%) |
| 35 to 64 Years | 29 (34.1%) | 7 (14.3%) |
| 65 to 74 Years | 0 (0.0%) | 0 (0.0%) |
| 75 Years and over | 0 (0.0%) | 0 (0.0%) |
Disability Class by Sex by Age in Morristown
Disability Class: Hearing Difficulty
| Age Bracket | Male | Female |
| Under 5 Years | 0 (0.0%) | 0 (0.0%) |
| 5 to 17 Years | 0 (0.0%) | 0 (0.0%) |
| 18 to 34 Years | 0 (0.0%) | 0 (0.0%) |
| 35 to 64 Years | 0 (0.0%) | 0 (0.0%) |
| 65 to 74 Years | 0 (0.0%) | 0 (0.0%) |
| 75 Years and over | 0 (0.0%) | 0 (0.0%) |
Disability Class: Vision Difficulty
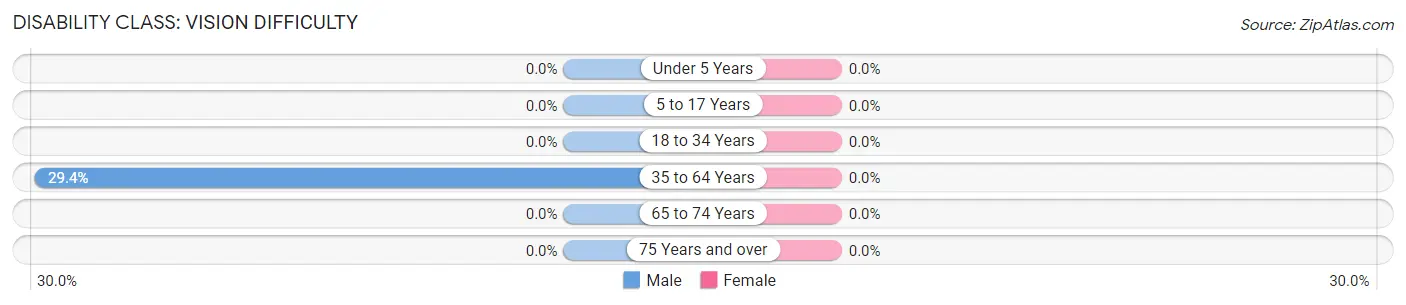
| Age Bracket | Male | Female |
| Under 5 Years | 0 (0.0%) | 0 (0.0%) |
| 5 to 17 Years | 0 (0.0%) | 0 (0.0%) |
| 18 to 34 Years | 0 (0.0%) | 0 (0.0%) |
| 35 to 64 Years | 25 (29.4%) | 0 (0.0%) |
| 65 to 74 Years | 0 (0.0%) | 0 (0.0%) |
| 75 Years and over | 0 (0.0%) | 0 (0.0%) |
Disability Class: Cognitive Difficulty
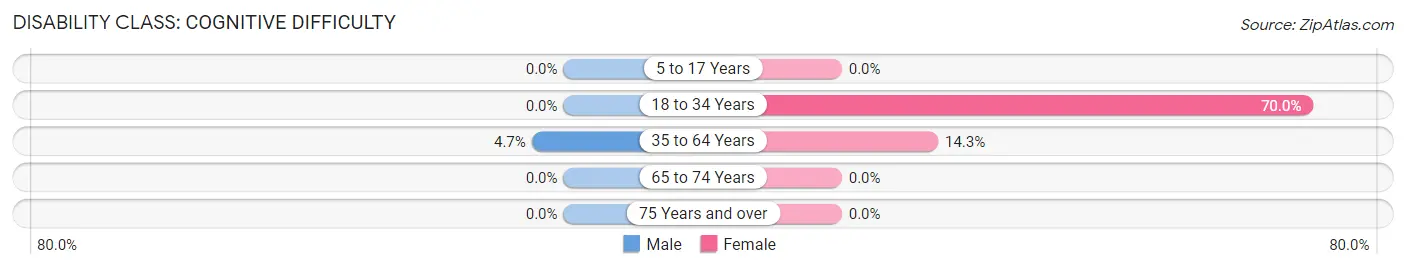
| Age Bracket | Male | Female |
| 5 to 17 Years | 0 (0.0%) | 0 (0.0%) |
| 18 to 34 Years | 0 (0.0%) | 7 (70.0%) |
| 35 to 64 Years | 4 (4.7%) | 7 (14.3%) |
| 65 to 74 Years | 0 (0.0%) | 0 (0.0%) |
| 75 Years and over | 0 (0.0%) | 0 (0.0%) |
Disability Class: Ambulatory Difficulty
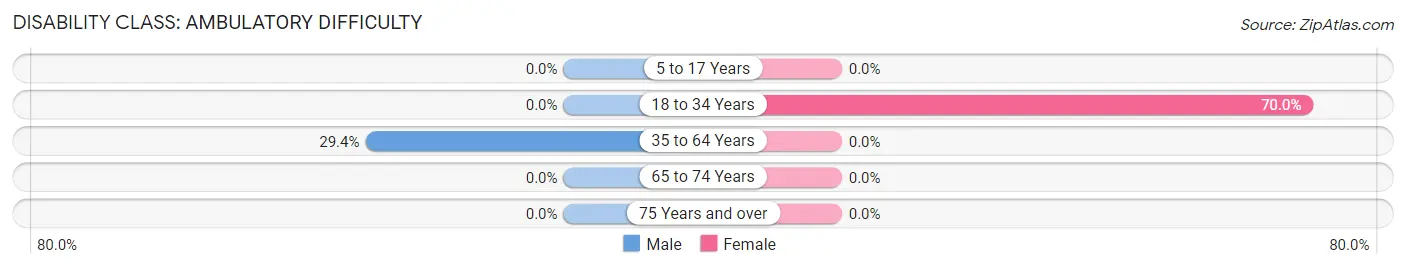
| Age Bracket | Male | Female |
| 5 to 17 Years | 0 (0.0%) | 0 (0.0%) |
| 18 to 34 Years | 0 (0.0%) | 7 (70.0%) |
| 35 to 64 Years | 25 (29.4%) | 0 (0.0%) |
| 65 to 74 Years | 0 (0.0%) | 0 (0.0%) |
| 75 Years and over | 0 (0.0%) | 0 (0.0%) |
Disability Class: Self-Care Difficulty
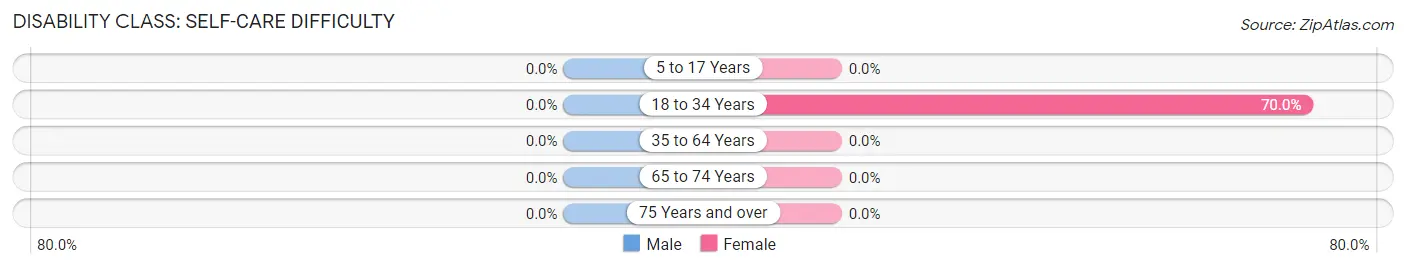
| Age Bracket | Male | Female |
| 5 to 17 Years | 0 (0.0%) | 0 (0.0%) |
| 18 to 34 Years | 0 (0.0%) | 7 (70.0%) |
| 35 to 64 Years | 0 (0.0%) | 0 (0.0%) |
| 65 to 74 Years | 0 (0.0%) | 0 (0.0%) |
| 75 Years and over | 0 (0.0%) | 0 (0.0%) |
Technology Access in Morristown
Computing Device Access in Morristown
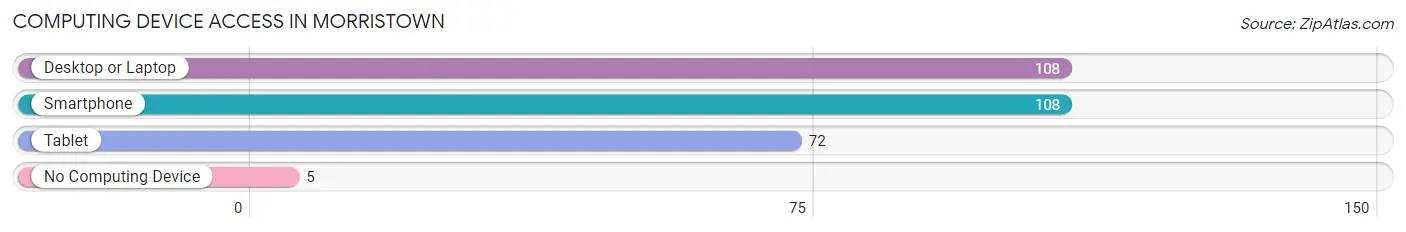
| Device Type | # Households | % Households |
| Desktop or Laptop | 108 | 80.6% |
| Smartphone | 108 | 80.6% |
| Tablet | 72 | 53.7% |
| No Computing Device | 5 | 3.7% |
| Total | 134 | 100.0% |
Internet Access in Morristown
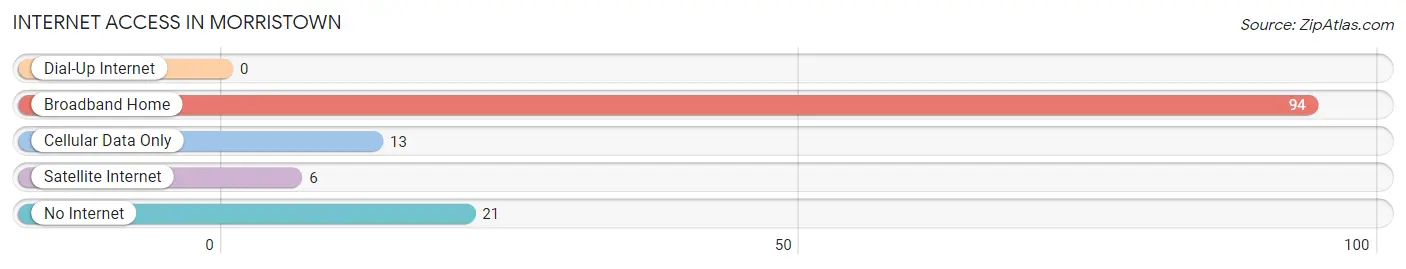
| Internet Type | # Households | % Households |
| Dial-Up Internet | 0 | 0.0% |
| Broadband Home | 94 | 70.2% |
| Cellular Data Only | 13 | 9.7% |
| Satellite Internet | 6 | 4.5% |
| No Internet | 21 | 15.7% |
| Total | 134 | 100.0% |
Morristown Summary
Morristown, Arizona is a small unincorporated community located in Maricopa County, Arizona. It is situated in the Sonoran Desert, approximately 40 miles northwest of Phoenix. The town is located in the foothills of the White Tank Mountains, and is surrounded by the towns of Wickenburg, Wittmann, and Surprise. The population of Morristown was estimated to be 1,845 in 2019.
History
Morristown was founded in 1878 by a group of Mormon settlers led by William Morris. The settlers were sent to the area by the Church of Jesus Christ of Latter-day Saints to establish a farming community. The town was named after Morris, and the settlers built a small fort to protect themselves from Native American attacks. The fort was later abandoned, and the town grew slowly over the years.
In the early 1900s, the town began to grow as a result of the construction of the Arizona and California Railroad. The railroad brought new settlers to the area, and the town began to develop. The town was incorporated in 1912, and the population grew to over 500 by 1920.
Geography
Morristown is located in the Sonoran Desert, approximately 40 miles northwest of Phoenix. The town is situated in the foothills of the White Tank Mountains, and is surrounded by the towns of Wickenburg, Wittmann, and Surprise. The town is located at an elevation of 1,845 feet above sea level.
The climate in Morristown is hot and dry, with temperatures ranging from the mid-90s in the summer to the mid-50s in the winter. The town receives an average of 8 inches of rain per year.
Economy
The economy of Morristown is largely based on agriculture. The town is home to several farms, which produce a variety of crops, including cotton, alfalfa, and hay. The town is also home to several small businesses, including a grocery store, a hardware store, and a restaurant.
Demographics
As of 2019, the population of Morristown was estimated to be 1,845. The town is predominantly white, with a small Hispanic population. The median household income in Morristown is $45,000, and the median home value is $150,000. The town has a high rate of poverty, with nearly 25% of the population living below the poverty line.
Conclusion
Morristown, Arizona is a small unincorporated community located in Maricopa County, Arizona. It is situated in the Sonoran Desert, approximately 40 miles northwest of Phoenix. The town was founded in 1878 by a group of Mormon settlers, and has since grown to a population of 1,845. The economy of Morristown is largely based on agriculture, and the town is predominantly white, with a small Hispanic population. The median household income in Morristown is $45,000, and the median home value is $150,000. The town has a high rate of poverty, with nearly 25% of the population living below the poverty line.
Common Questions
What is Per Capita Income in Morristown?
Per Capita income in Morristown is $42,650.
What is the Median Family Income in Morristown?
Median Family Income in Morristown is $78,500.
What is the Median Household income in Morristown?
Median Household Income in Morristown is $68,611.
What is Inequality or Gini Index in Morristown?
Inequality or Gini Index in Morristown is 0.30.
What is the Total Population of Morristown?
Total Population of Morristown is 238.
What is the Total Male Population of Morristown?
Total Male Population of Morristown is 129.
What is the Total Female Population of Morristown?
Total Female Population of Morristown is 109.
What is the Ratio of Males per 100 Females in Morristown?
There are 118.35 Males per 100 Females in Morristown.
What is the Ratio of Females per 100 Males in Morristown?
There are 84.50 Females per 100 Males in Morristown.
What is the Median Population Age in Morristown?
Median Population Age in Morristown is 58.4 Years.
What is the Average Family Size in Morristown
Average Family Size in Morristown is 2.7 People.
What is the Average Household Size in Morristown
Average Household Size in Morristown is 1.8 People.
How Large is the Labor Force in Morristown?
There are 97 People in the Labor Forcein in Morristown.
What is the Percentage of People in the Labor Force in Morristown?
44.1% of People are in the Labor Force in Morristown.
What is the Unemployment Rate in Morristown?
Unemployment Rate in Morristown is 16.5%.