Mesa del Caballo, AZ Map & Demographics
Mesa del Caballo Map
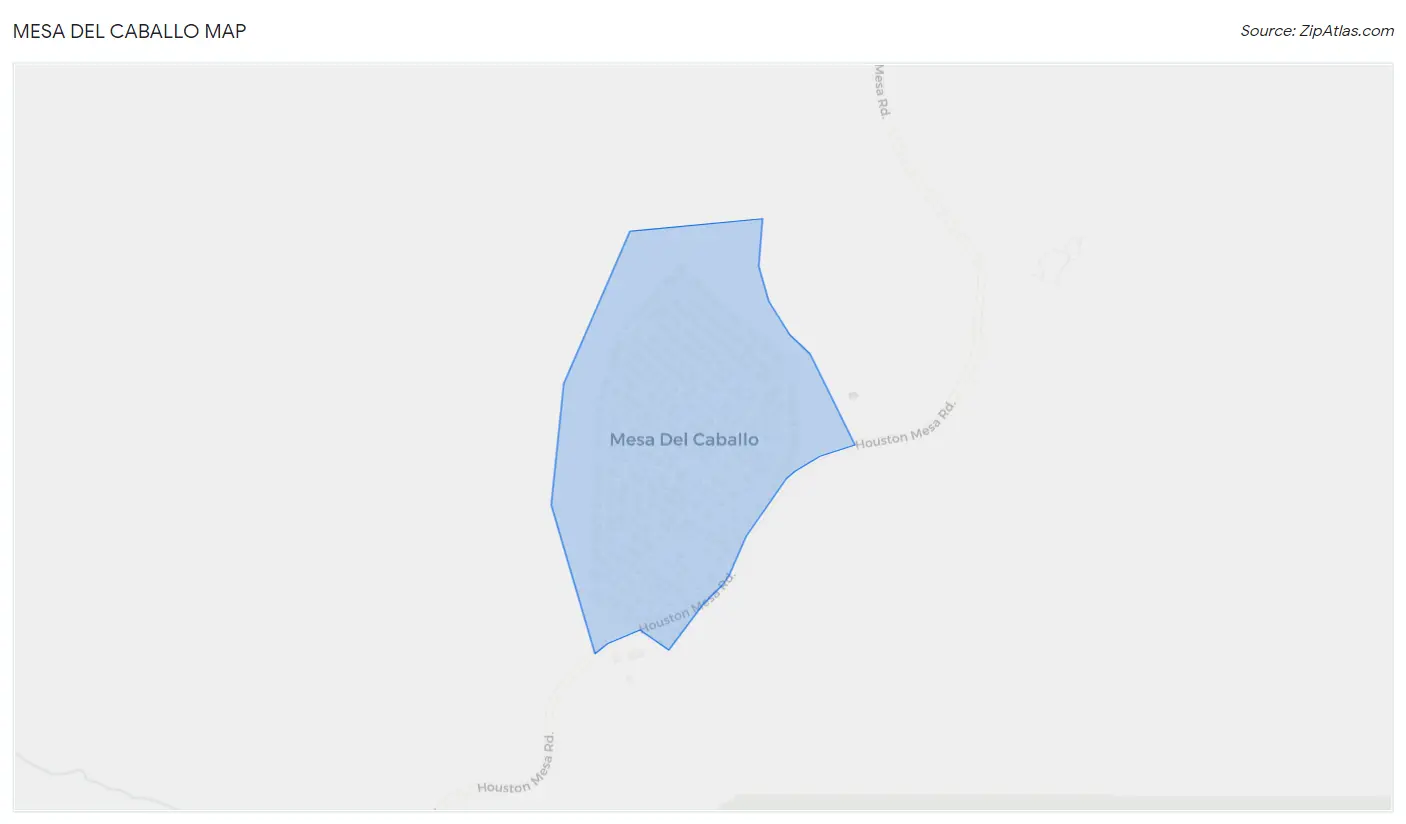
Mesa del Caballo Overview
$25,646
PER CAPITA INCOME
$55,313
AVG FAMILY INCOME
$65,313
AVG HOUSEHOLD INCOME
12.7%
WAGE / INCOME GAP [ % ]
87.3¢/ $1
WAGE / INCOME GAP [ $ ]
0.32
INEQUALITY / GINI INDEX
1,194
TOTAL POPULATION
556
MALE POPULATION
638
FEMALE POPULATION
87.15
MALES / 100 FEMALES
114.75
FEMALES / 100 MALES
29.6
MEDIAN AGE
3.1
AVG FAMILY SIZE
2.8
AVG HOUSEHOLD SIZE
532
LABOR FORCE [ PEOPLE ]
69.5%
PERCENT IN LABOR FORCE
4.9%
UNEMPLOYMENT RATE
Income in Mesa del Caballo
Income Overview in Mesa del Caballo
Per Capita Income in Mesa del Caballo is $25,646, while median incomes of families and households are $55,313 and $65,313 respectively.
| Characteristic | Number | Measure |
| Per Capita Income | 1,194 | $25,646 |
| Median Family Income | 291 | $55,313 |
| Mean Family Income | 291 | $71,310 |
| Median Household Income | 427 | $65,313 |
| Mean Household Income | 427 | $68,612 |
| Income Deficit | 291 | $0 |
| Wage / Income Gap (%) | 1,194 | 12.71% |
| Wage / Income Gap ($) | 1,194 | 87.29¢ per $1 |
| Gini / Inequality Index | 1,194 | 0.32 |
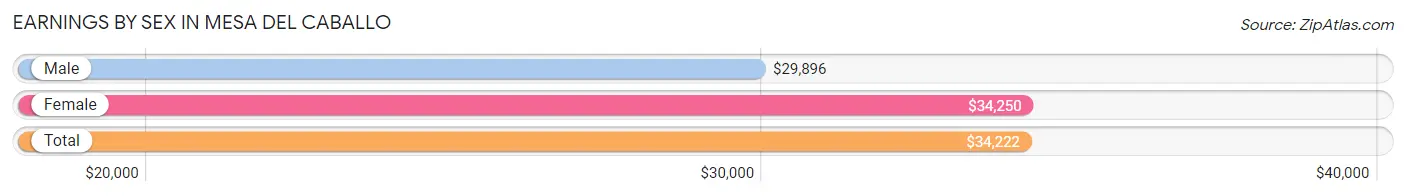
Earnings by Sex in Mesa del Caballo
Average Earnings in Mesa del Caballo are $34,222, $29,896 for men and $34,250 for women, a difference of 12.7%.
| Sex | Number | Average Earnings |
| Male | 263 (47.6%) | $29,896 |
| Female | 289 (52.4%) | $34,250 |
| Total | 552 (100.0%) | $34,222 |
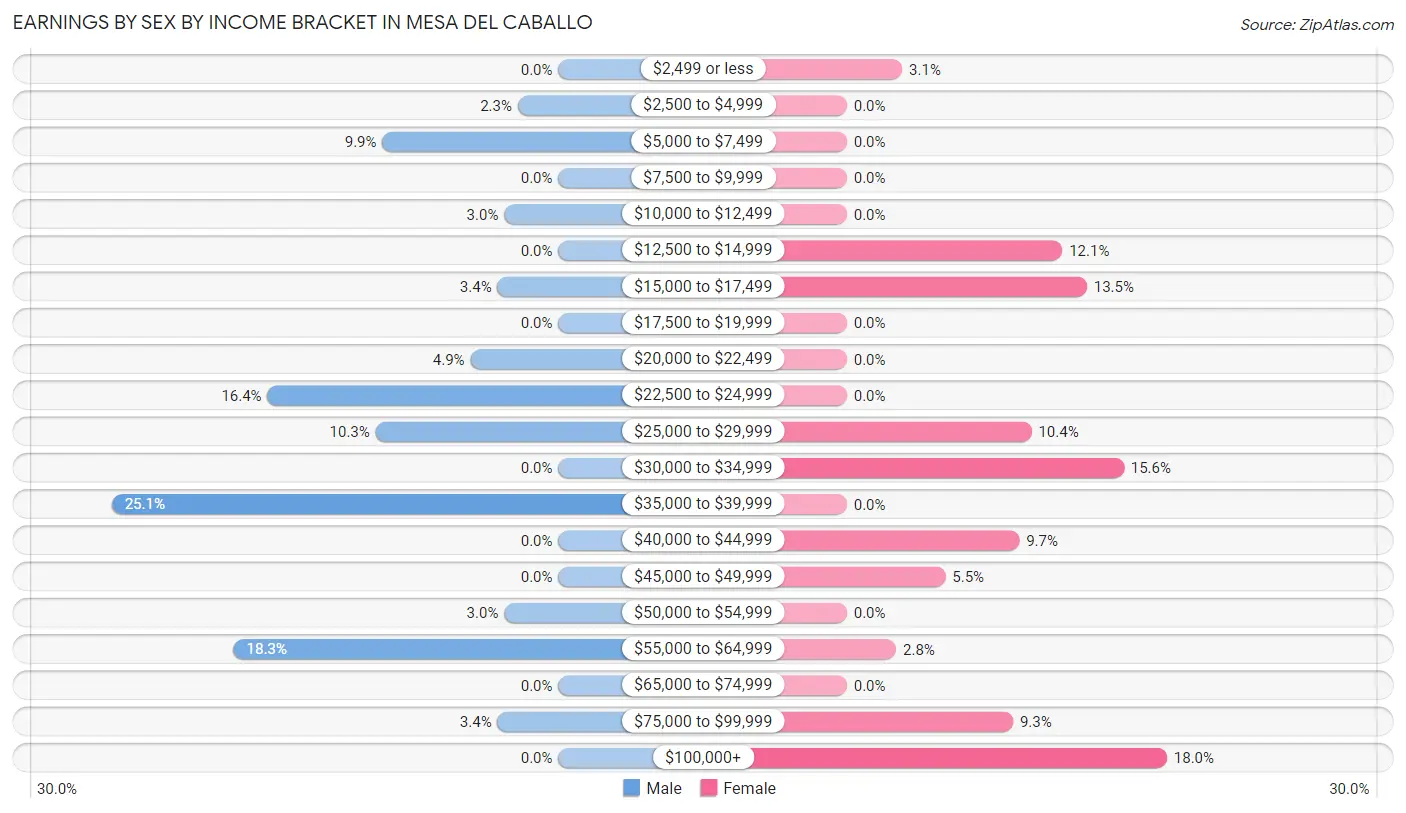
Earnings by Sex by Income Bracket in Mesa del Caballo
The most common earnings brackets in Mesa del Caballo are $35,000 to $39,999 for men (66 | 25.1%) and $100,000+ for women (52 | 18.0%).
| Income | Male | Female |
| $2,499 or less | 0 (0.0%) | 9 (3.1%) |
| $2,500 to $4,999 | 6 (2.3%) | 0 (0.0%) |
| $5,000 to $7,499 | 26 (9.9%) | 0 (0.0%) |
| $7,500 to $9,999 | 0 (0.0%) | 0 (0.0%) |
| $10,000 to $12,499 | 8 (3.0%) | 0 (0.0%) |
| $12,500 to $14,999 | 0 (0.0%) | 35 (12.1%) |
| $15,000 to $17,499 | 9 (3.4%) | 39 (13.5%) |
| $17,500 to $19,999 | 0 (0.0%) | 0 (0.0%) |
| $20,000 to $22,499 | 13 (4.9%) | 0 (0.0%) |
| $22,500 to $24,999 | 43 (16.4%) | 0 (0.0%) |
| $25,000 to $29,999 | 27 (10.3%) | 30 (10.4%) |
| $30,000 to $34,999 | 0 (0.0%) | 45 (15.6%) |
| $35,000 to $39,999 | 66 (25.1%) | 0 (0.0%) |
| $40,000 to $44,999 | 0 (0.0%) | 28 (9.7%) |
| $45,000 to $49,999 | 0 (0.0%) | 16 (5.5%) |
| $50,000 to $54,999 | 8 (3.0%) | 0 (0.0%) |
| $55,000 to $64,999 | 48 (18.2%) | 8 (2.8%) |
| $65,000 to $74,999 | 0 (0.0%) | 0 (0.0%) |
| $75,000 to $99,999 | 9 (3.4%) | 27 (9.3%) |
| $100,000+ | 0 (0.0%) | 52 (18.0%) |
| Total | 263 (100.0%) | 289 (100.0%) |
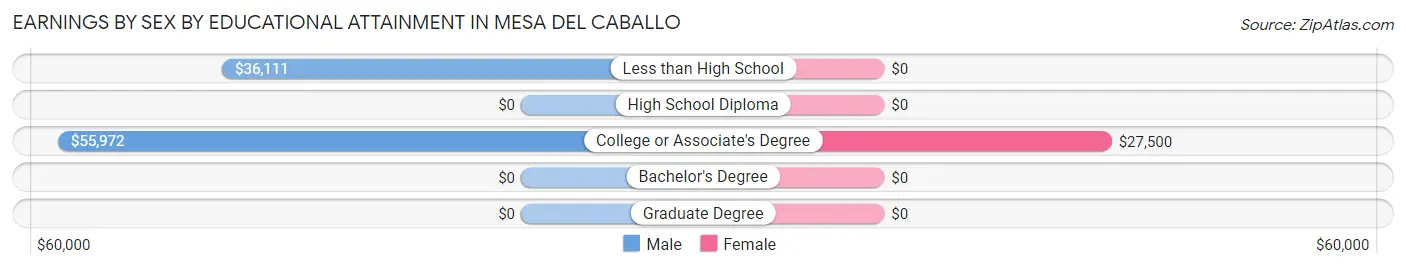
Earnings by Sex by Educational Attainment in Mesa del Caballo
Average earnings in Mesa del Caballo are $36,290 for men and $34,444 for women, a difference of 5.1%. Men with an educational attainment of college or associate's degree enjoy the highest average annual earnings of $55,972, while those with less than high school education earn the least with $36,111. Women with an educational attainment of college or associate's degree earn the most with the average annual earnings of $27,500, while those with college or associate's degree education have the smallest earnings of $27,500.
| Educational Attainment | Male Income | Female Income |
| Less than High School | $36,111 | $0 |
| High School Diploma | - | - |
| College or Associate's Degree | $55,972 | $27,500 |
| Bachelor's Degree | - | - |
| Graduate Degree | - | - |
| Total | $36,290 | $34,444 |
Family Income in Mesa del Caballo
Family Income Brackets in Mesa del Caballo
According to the Mesa del Caballo family income data, there are 93 families falling into the $35,000 to $49,999 income range, which is the most common income bracket and makes up 32.0% of all families.
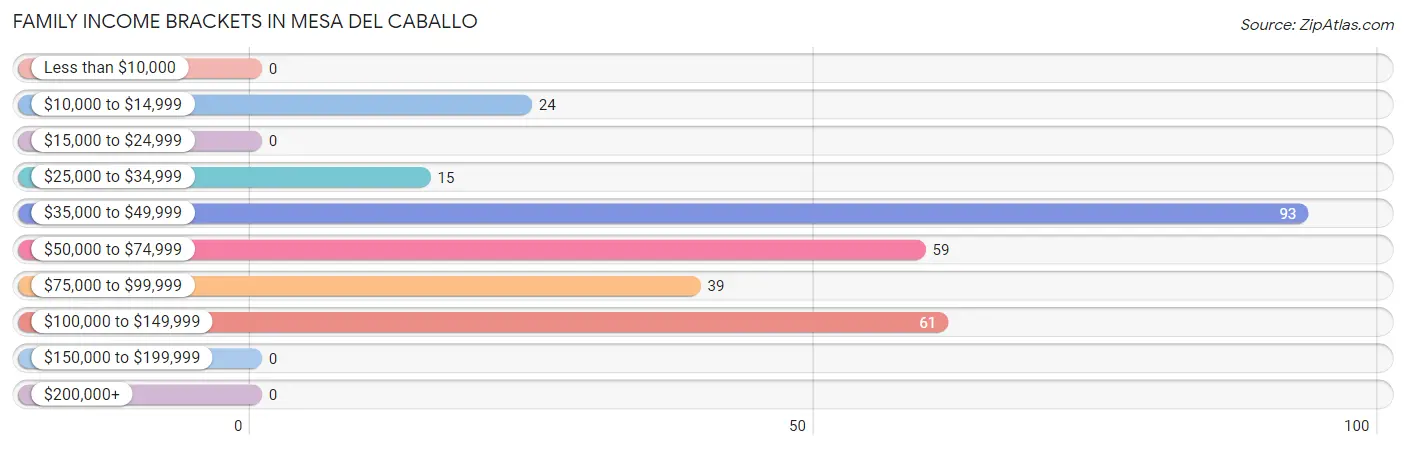
| Income Bracket | # Families | % Families |
| Less than $10,000 | 0 | 0.0% |
| $10,000 to $14,999 | 24 | 8.2% |
| $15,000 to $24,999 | 0 | 0.0% |
| $25,000 to $34,999 | 15 | 5.2% |
| $35,000 to $49,999 | 93 | 32.0% |
| $50,000 to $74,999 | 59 | 20.3% |
| $75,000 to $99,999 | 39 | 13.4% |
| $100,000 to $149,999 | 61 | 21.0% |
| $150,000 to $199,999 | 0 | 0.0% |
| $200,000+ | 0 | 0.0% |
Family Income by Famaliy Size in Mesa del Caballo
3-person families (96 | 33.0%) account for the highest median family income in Mesa del Caballo with $140,192 per family, while 3-person families (96 | 33.0%) have the highest median income of $46,731 per family member.
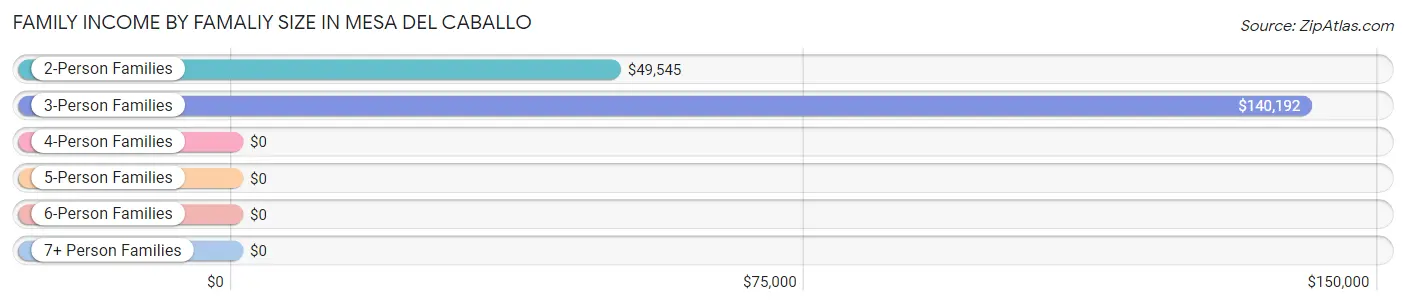
| Income Bracket | # Families | Median Income |
| 2-Person Families | 130 (44.7%) | $49,545 |
| 3-Person Families | 96 (33.0%) | $140,192 |
| 4-Person Families | 24 (8.3%) | $0 |
| 5-Person Families | 0 (0.0%) | $0 |
| 6-Person Families | 41 (14.1%) | $0 |
| 7+ Person Families | 0 (0.0%) | $0 |
| Total | 291 (100.0%) | $55,313 |
Family Income by Number of Earners in Mesa del Caballo
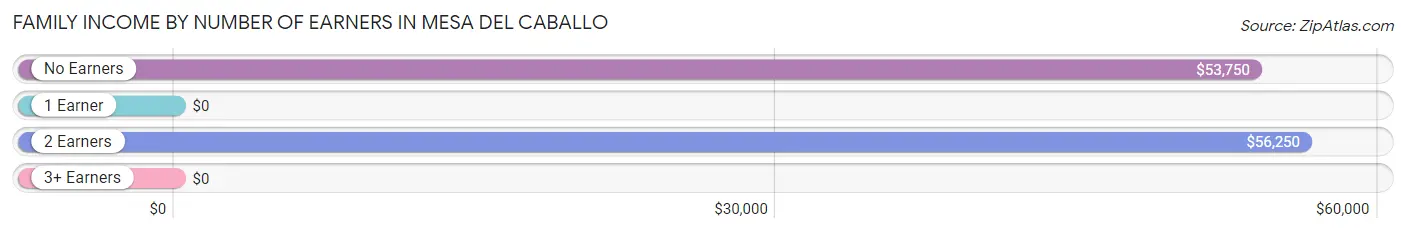
| Number of Earners | # Families | Median Income |
| No Earners | 20 (6.9%) | $53,750 |
| 1 Earner | 206 (70.8%) | $0 |
| 2 Earners | 56 (19.2%) | $56,250 |
| 3+ Earners | 9 (3.1%) | $0 |
| Total | 291 (100.0%) | $55,313 |
Household Income in Mesa del Caballo
Household Income Brackets in Mesa del Caballo
With 137 households falling in the category, the $50,000 to $74,999 income range is the most frequent in Mesa del Caballo, accounting for 32.1% of all households.
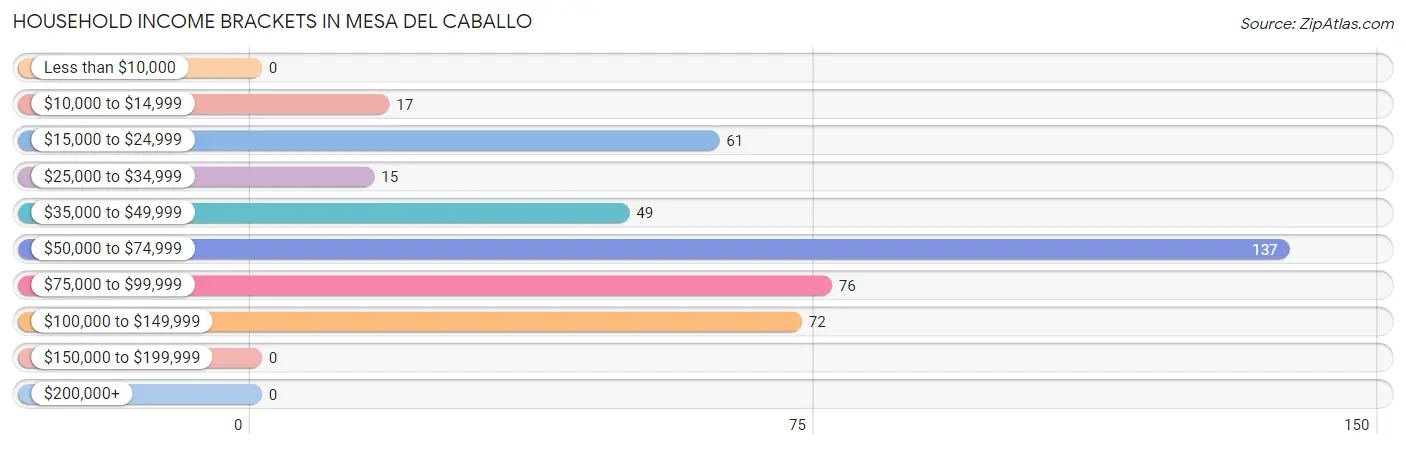
| Income Bracket | # Households | % Households |
| Less than $10,000 | 0 | 0.0% |
| $10,000 to $14,999 | 17 | 4.0% |
| $15,000 to $24,999 | 61 | 14.3% |
| $25,000 to $34,999 | 15 | 3.5% |
| $35,000 to $49,999 | 49 | 11.5% |
| $50,000 to $74,999 | 137 | 32.1% |
| $75,000 to $99,999 | 76 | 17.8% |
| $100,000 to $149,999 | 72 | 16.9% |
| $150,000 to $199,999 | 0 | 0.0% |
| $200,000+ | 0 | 0.0% |
Household Income by Householder Age in Mesa del Caballo
The median household income in Mesa del Caballo is $65,313, with the highest median household income of $69,542 found in the 45 to 64 years age bracket for the primary householder. A total of 83 households (19.4%) fall into this category. Meanwhile, the 15 to 24 years age bracket for the primary householder has the lowest median household income of $0, with 6 households (1.4%) in this group.
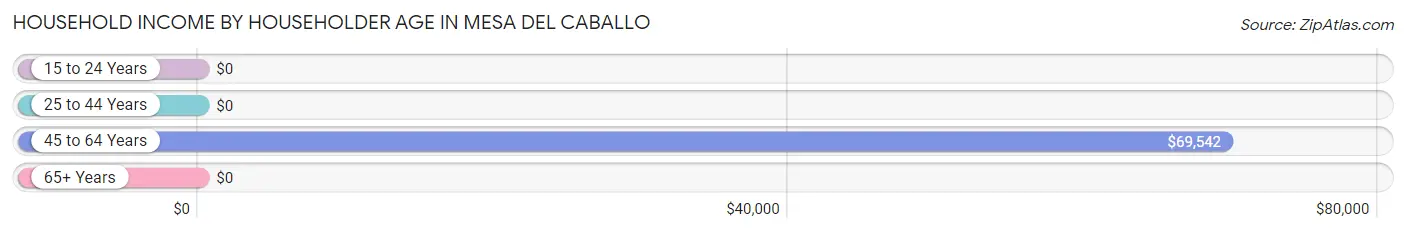
| Income Bracket | # Households | Median Income |
| 15 to 24 Years | 6 (1.4%) | $0 |
| 25 to 44 Years | 208 (48.7%) | $0 |
| 45 to 64 Years | 83 (19.4%) | $69,542 |
| 65+ Years | 130 (30.4%) | $0 |
| Total | 427 (100.0%) | $65,313 |
Poverty in Mesa del Caballo
Income Below Poverty by Sex and Age in Mesa del Caballo
With 4.7% poverty level for males and 18.8% for females among the residents of Mesa del Caballo, 25 to 34 year old males and under 5 year old females are the most vulnerable to poverty, with 26 males (25.0%) and 53 females (100.0%) in their respective age groups living below the poverty level.
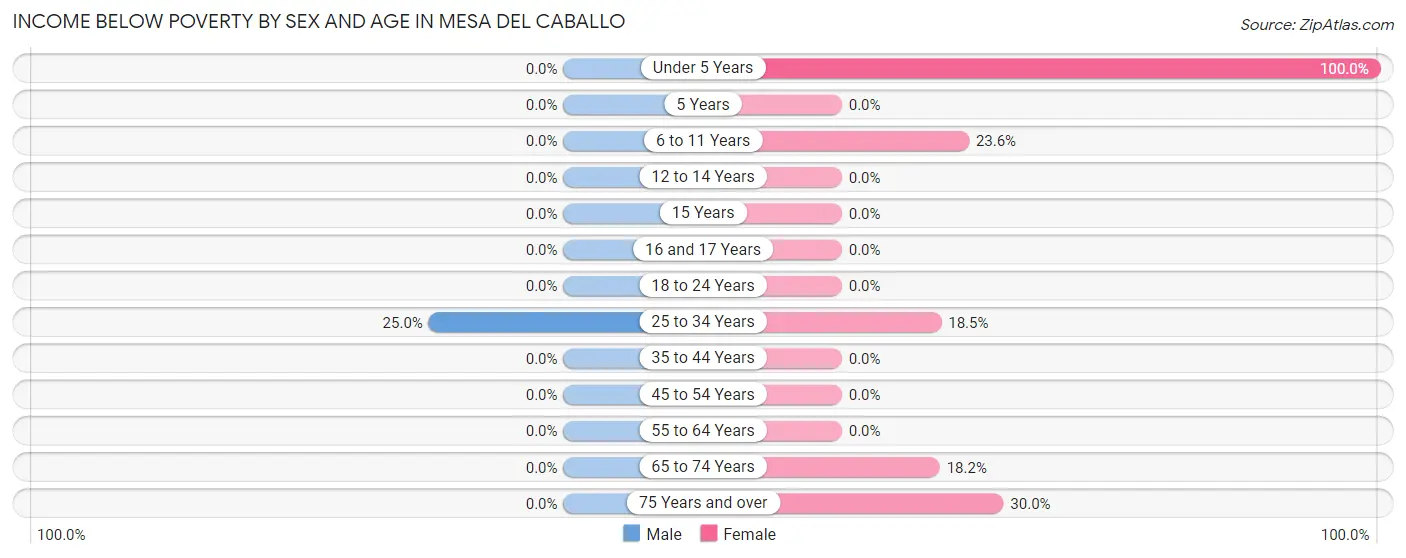
| Age Bracket | Male | Female |
| Under 5 Years | 0 (0.0%) | 53 (100.0%) |
| 5 Years | 0 (0.0%) | 0 (0.0%) |
| 6 to 11 Years | 0 (0.0%) | 21 (23.6%) |
| 12 to 14 Years | 0 (0.0%) | 0 (0.0%) |
| 15 Years | 0 (0.0%) | 0 (0.0%) |
| 16 and 17 Years | 0 (0.0%) | 0 (0.0%) |
| 18 to 24 Years | 0 (0.0%) | 0 (0.0%) |
| 25 to 34 Years | 26 (25.0%) | 24 (18.5%) |
| 35 to 44 Years | 0 (0.0%) | 0 (0.0%) |
| 45 to 54 Years | 0 (0.0%) | 0 (0.0%) |
| 55 to 64 Years | 0 (0.0%) | 0 (0.0%) |
| 65 to 74 Years | 0 (0.0%) | 8 (18.2%) |
| 75 Years and over | 0 (0.0%) | 9 (30.0%) |
| Total | 26 (4.7%) | 115 (18.8%) |
Income Above Poverty by Sex and Age in Mesa del Caballo
According to the poverty statistics in Mesa del Caballo, males aged under 5 years and females aged 12 to 14 years are the age groups that are most secure financially, with 100.0% of males and 100.0% of females in these age groups living above the poverty line.
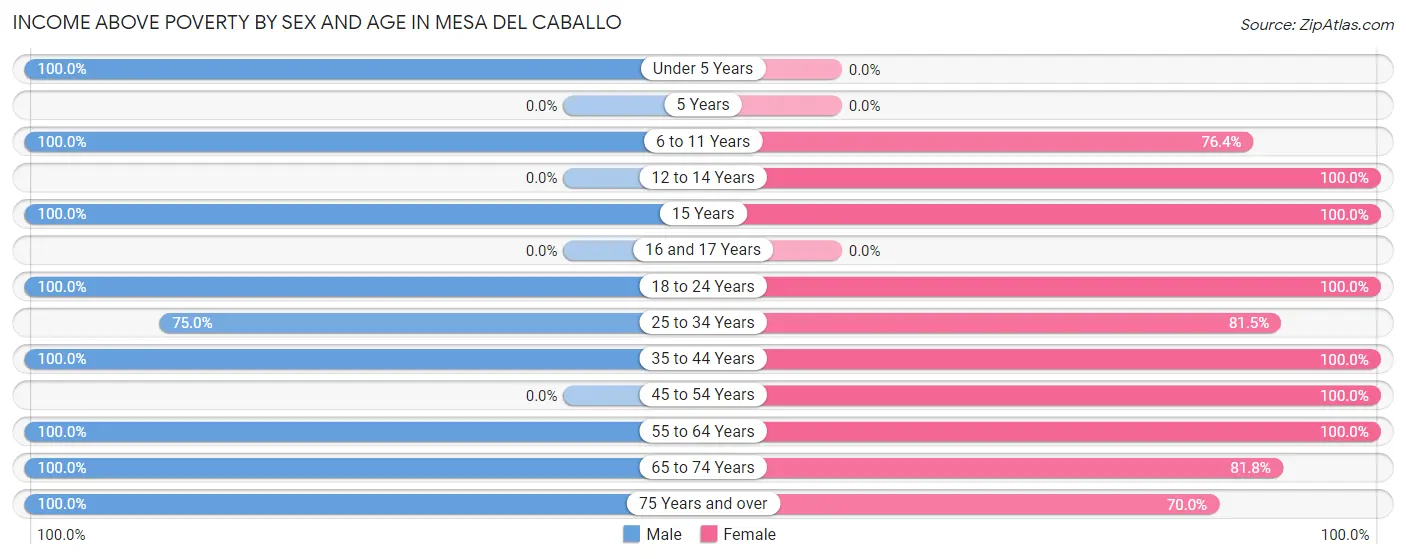
| Age Bracket | Male | Female |
| Under 5 Years | 59 (100.0%) | 0 (0.0%) |
| 5 Years | 0 (0.0%) | 0 (0.0%) |
| 6 to 11 Years | 123 (100.0%) | 68 (76.4%) |
| 12 to 14 Years | 0 (0.0%) | 65 (100.0%) |
| 15 Years | 8 (100.0%) | 6 (100.0%) |
| 16 and 17 Years | 0 (0.0%) | 0 (0.0%) |
| 18 to 24 Years | 66 (100.0%) | 7 (100.0%) |
| 25 to 34 Years | 78 (75.0%) | 106 (81.5%) |
| 35 to 44 Years | 60 (100.0%) | 103 (100.0%) |
| 45 to 54 Years | 0 (0.0%) | 43 (100.0%) |
| 55 to 64 Years | 40 (100.0%) | 42 (100.0%) |
| 65 to 74 Years | 37 (100.0%) | 36 (81.8%) |
| 75 Years and over | 59 (100.0%) | 21 (70.0%) |
| Total | 530 (95.3%) | 497 (81.2%) |
Income Below Poverty Among Married-Couple Families in Mesa del Caballo
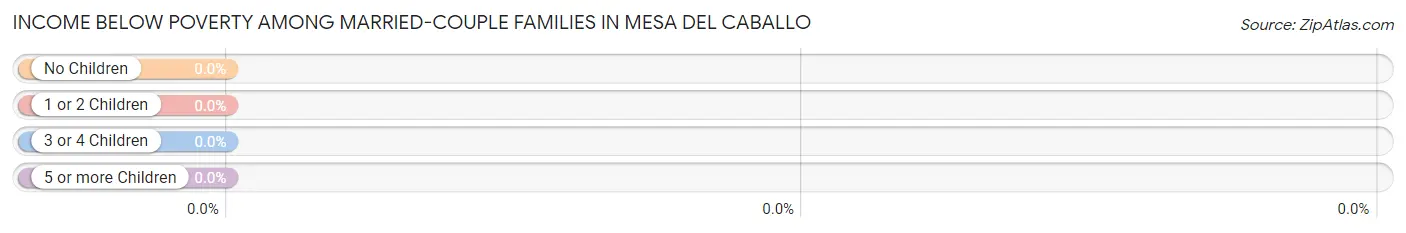
| Children | Above Poverty | Below Poverty |
| No Children | 75 (100.0%) | 0 (0.0%) |
| 1 or 2 Children | 0 (0.0%) | 0 (0.0%) |
| 3 or 4 Children | 41 (100.0%) | 0 (0.0%) |
| 5 or more Children | 0 (0.0%) | 0 (0.0%) |
| Total | 116 (100.0%) | 0 (0.0%) |
Income Below Poverty Among Single-Parent Households in Mesa del Caballo
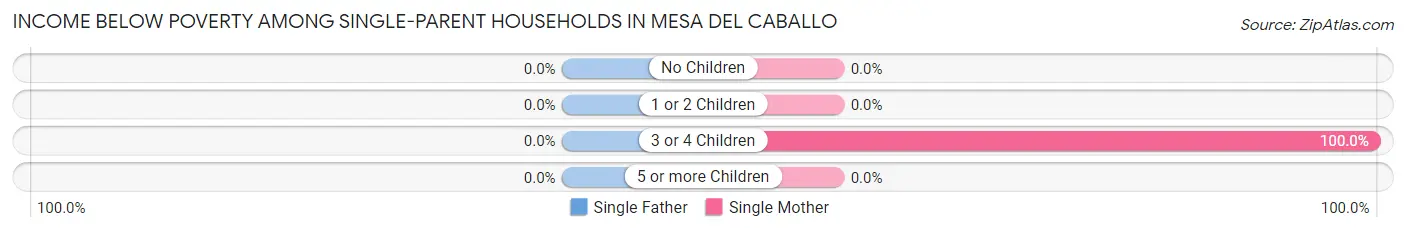
| Children | Single Father | Single Mother |
| No Children | 0 (0.0%) | 0 (0.0%) |
| 1 or 2 Children | 0 (0.0%) | 0 (0.0%) |
| 3 or 4 Children | 0 (0.0%) | 24 (100.0%) |
| 5 or more Children | 0 (0.0%) | 0 (0.0%) |
| Total | 0 (0.0%) | 24 (14.7%) |
Income Below Poverty Among Married-Couple vs Single-Parent Households in Mesa del Caballo
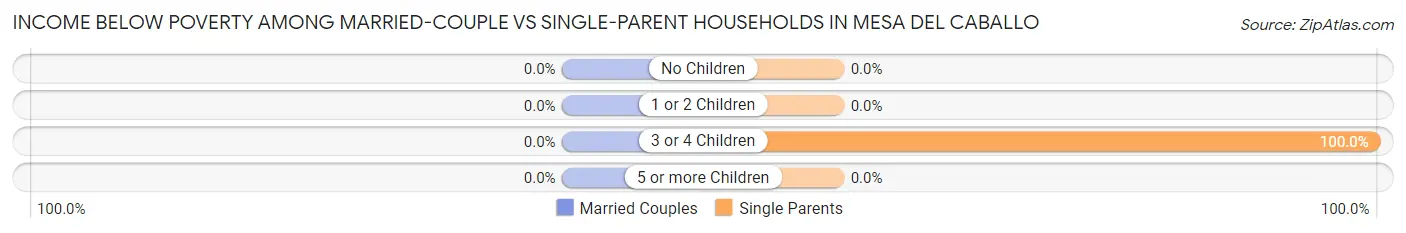
| Children | Married-Couple Families | Single-Parent Households |
| No Children | 0 (0.0%) | 0 (0.0%) |
| 1 or 2 Children | 0 (0.0%) | 0 (0.0%) |
| 3 or 4 Children | 0 (0.0%) | 24 (100.0%) |
| 5 or more Children | 0 (0.0%) | 0 (0.0%) |
| Total | 0 (0.0%) | 24 (13.7%) |
Race in Mesa del Caballo
The most populous races in Mesa del Caballo are White / Caucasian (1,084 | 90.8%), Two or more Races (95 | 8.0%), and Hispanic or Latino (79 | 6.6%).
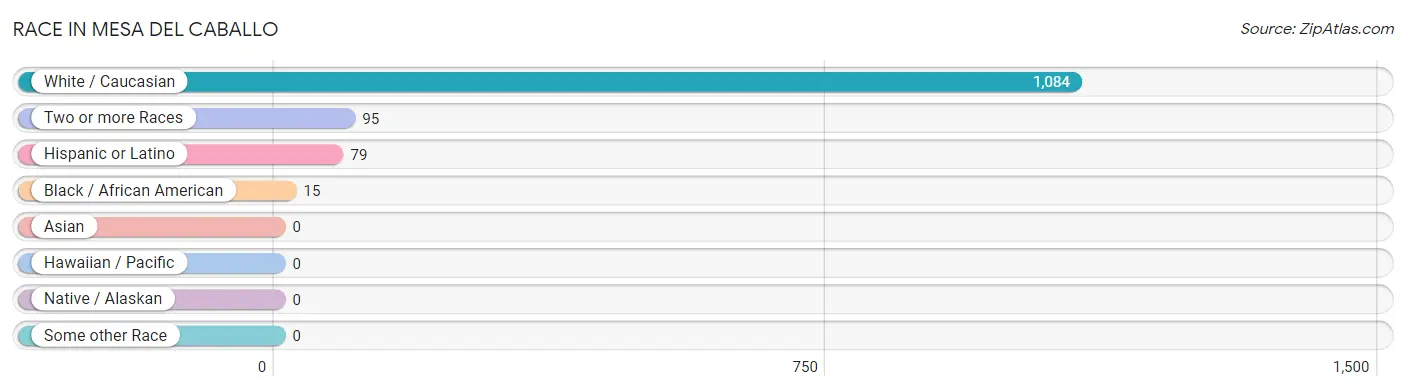
| Race | # Population | % Population |
| Asian | 0 | 0.0% |
| Black / African American | 15 | 1.3% |
| Hawaiian / Pacific | 0 | 0.0% |
| Hispanic or Latino | 79 | 6.6% |
| Native / Alaskan | 0 | 0.0% |
| White / Caucasian | 1,084 | 90.8% |
| Two or more Races | 95 | 8.0% |
| Some other Race | 0 | 0.0% |
| Total | 1,194 | 100.0% |
Ancestry in Mesa del Caballo
The most populous ancestries reported in Mesa del Caballo are German (521 | 43.6%), Irish (253 | 21.2%), Norwegian (78 | 6.5%), Italian (53 | 4.4%), and Spanish (48 | 4.0%), together accounting for 79.8% of all Mesa del Caballo residents.
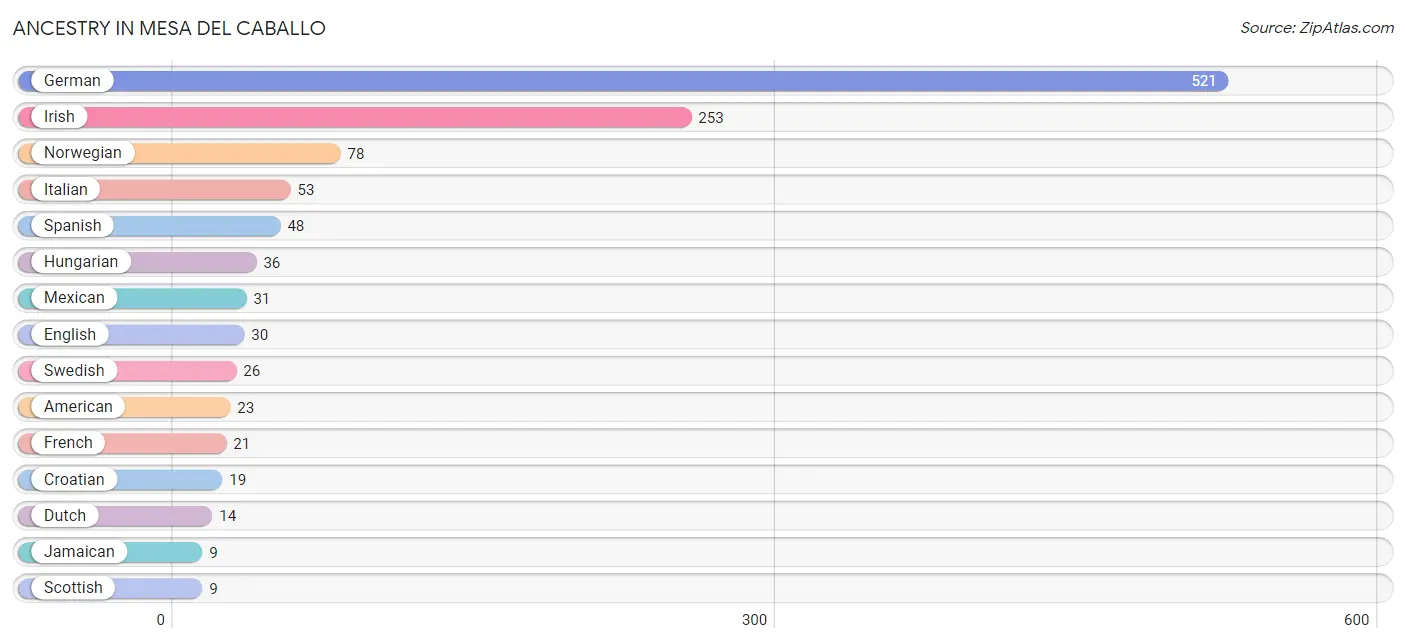
| Ancestry | # Population | % Population |
| American | 23 | 1.9% |
| Croatian | 19 | 1.6% |
| Dutch | 14 | 1.2% |
| English | 30 | 2.5% |
| French | 21 | 1.8% |
| German | 521 | 43.6% |
| Hungarian | 36 | 3.0% |
| Irish | 253 | 21.2% |
| Italian | 53 | 4.4% |
| Jamaican | 9 | 0.7% |
| Mexican | 31 | 2.6% |
| Norwegian | 78 | 6.5% |
| Scottish | 9 | 0.7% |
| Spanish | 48 | 4.0% |
| Swedish | 26 | 2.2% |
| Swiss | 5 | 0.4% | View All 16 Rows |
Immigrants in Mesa del Caballo
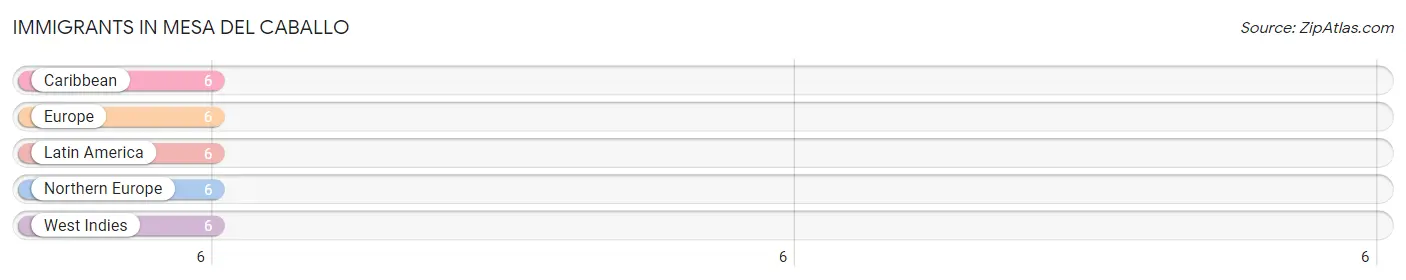
The most numerous immigrant groups reported in Mesa del Caballo came from Caribbean (6 | 0.5%), Europe (6 | 0.5%), Latin America (6 | 0.5%), Northern Europe (6 | 0.5%), and West Indies (6 | 0.5%), together accounting for 2.5% of all Mesa del Caballo residents.
| Immigration Origin | # Population | % Population |
| Caribbean | 6 | 0.5% |
| Europe | 6 | 0.5% |
| Latin America | 6 | 0.5% |
| Northern Europe | 6 | 0.5% |
| West Indies | 6 | 0.5% | View All 5 Rows |
Sex and Age in Mesa del Caballo
Sex and Age in Mesa del Caballo
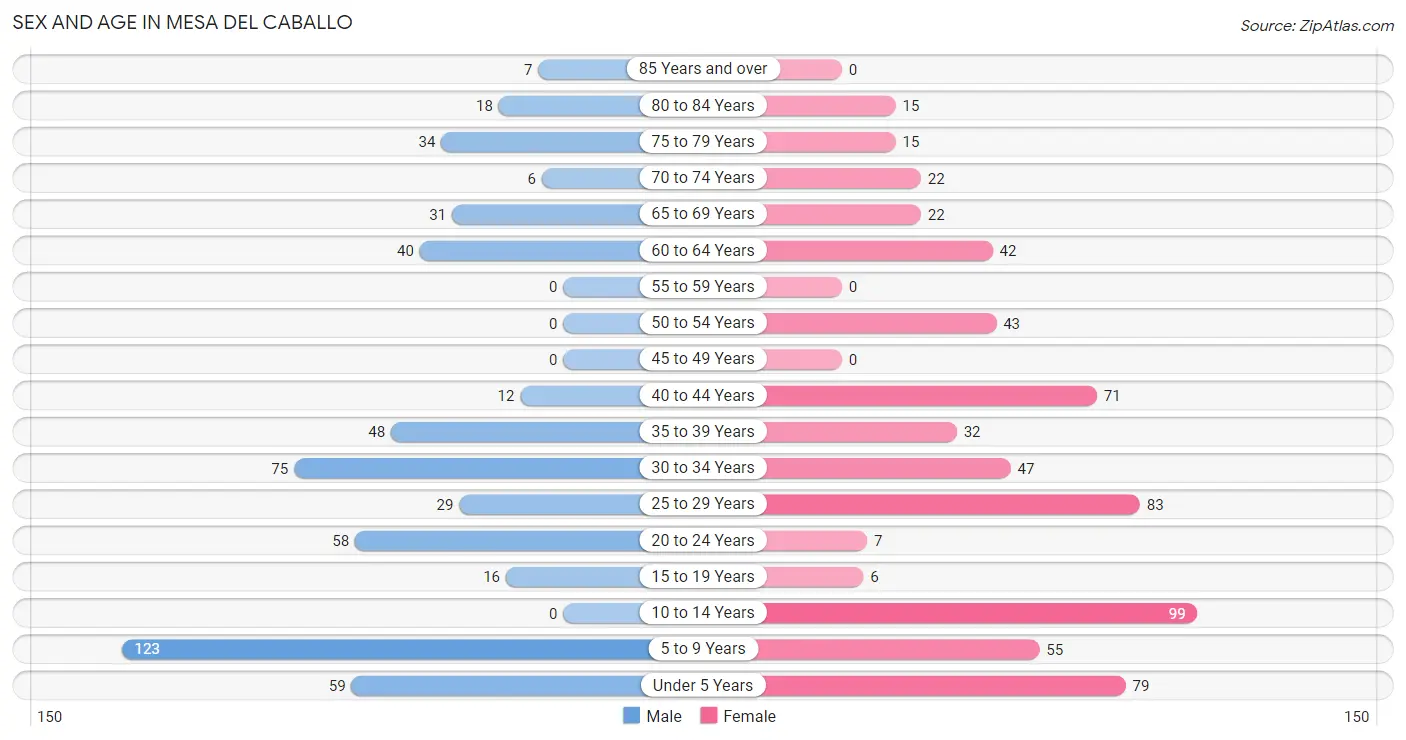
The most populous age groups in Mesa del Caballo are 5 to 9 Years (123 | 22.1%) for men and 10 to 14 Years (99 | 15.5%) for women.
| Age Bracket | Male | Female |
| Under 5 Years | 59 (10.6%) | 79 (12.4%) |
| 5 to 9 Years | 123 (22.1%) | 55 (8.6%) |
| 10 to 14 Years | 0 (0.0%) | 99 (15.5%) |
| 15 to 19 Years | 16 (2.9%) | 6 (0.9%) |
| 20 to 24 Years | 58 (10.4%) | 7 (1.1%) |
| 25 to 29 Years | 29 (5.2%) | 83 (13.0%) |
| 30 to 34 Years | 75 (13.5%) | 47 (7.4%) |
| 35 to 39 Years | 48 (8.6%) | 32 (5.0%) |
| 40 to 44 Years | 12 (2.2%) | 71 (11.1%) |
| 45 to 49 Years | 0 (0.0%) | 0 (0.0%) |
| 50 to 54 Years | 0 (0.0%) | 43 (6.7%) |
| 55 to 59 Years | 0 (0.0%) | 0 (0.0%) |
| 60 to 64 Years | 40 (7.2%) | 42 (6.6%) |
| 65 to 69 Years | 31 (5.6%) | 22 (3.5%) |
| 70 to 74 Years | 6 (1.1%) | 22 (3.5%) |
| 75 to 79 Years | 34 (6.1%) | 15 (2.4%) |
| 80 to 84 Years | 18 (3.2%) | 15 (2.4%) |
| 85 Years and over | 7 (1.3%) | 0 (0.0%) |
| Total | 556 (100.0%) | 638 (100.0%) |
Families and Households in Mesa del Caballo
Median Family Size in Mesa del Caballo
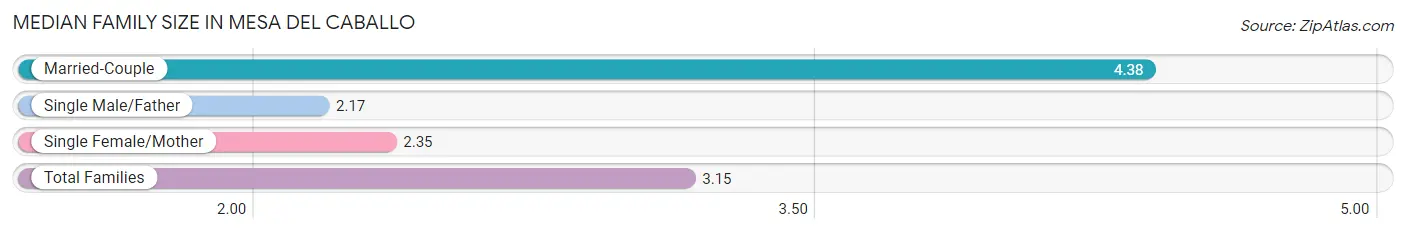
The median family size in Mesa del Caballo is 3.15 persons per family, with married-couple families (116 | 39.9%) accounting for the largest median family size of 4.38 persons per family. On the other hand, single male/father families (12 | 4.1%) represent the smallest median family size with 2.17 persons per family.
| Family Type | # Families | Family Size |
| Married-Couple | 116 (39.9%) | 4.38 |
| Single Male/Father | 12 (4.1%) | 2.17 |
| Single Female/Mother | 163 (56.0%) | 2.35 |
| Total Families | 291 (100.0%) | 3.15 |
Median Household Size in Mesa del Caballo
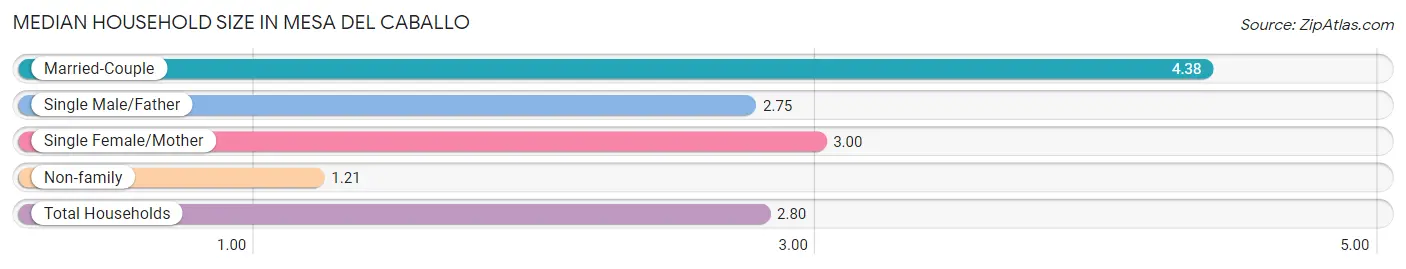
The median household size in Mesa del Caballo is 2.80 persons per household, with married-couple households (116 | 27.2%) accounting for the largest median household size of 4.38 persons per household. non-family households (136 | 31.9%) represent the smallest median household size with 1.21 persons per household.
| Household Type | # Households | Household Size |
| Married-Couple | 116 (27.2%) | 4.38 |
| Single Male/Father | 12 (2.8%) | 2.75 |
| Single Female/Mother | 163 (38.2%) | 3.00 |
| Non-family | 136 (31.9%) | 1.21 |
| Total Households | 427 (100.0%) | 2.80 |
Household Size by Marriage Status in Mesa del Caballo
Out of a total of 427 households in Mesa del Caballo, 291 (68.1%) are family households, while 136 (31.9%) are nonfamily households. The most numerous type of family households are 3-person households, comprising 136, and the most common type of nonfamily households are 1-person households, comprising 106.
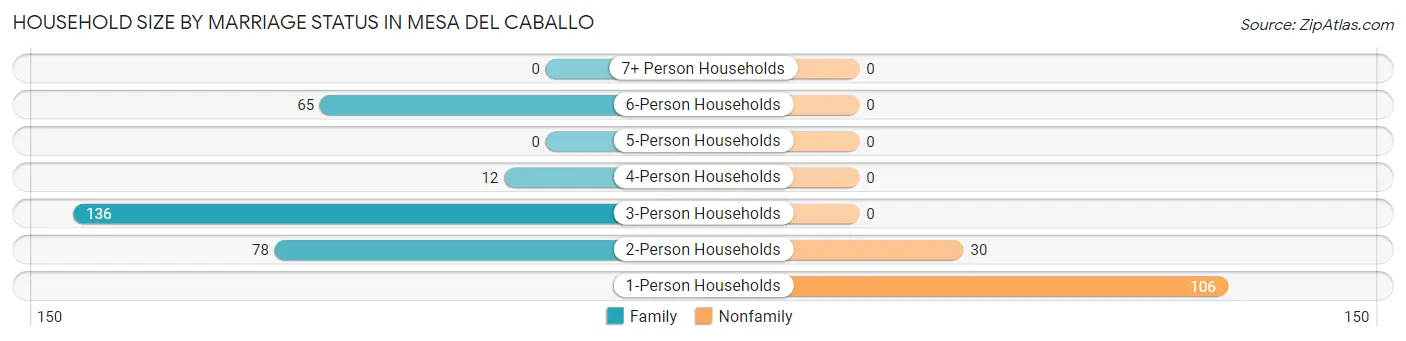
| Household Size | Family Households | Nonfamily Households |
| 1-Person Households | - | 106 (24.8%) |
| 2-Person Households | 78 (18.3%) | 30 (7.0%) |
| 3-Person Households | 136 (31.9%) | 0 (0.0%) |
| 4-Person Households | 12 (2.8%) | 0 (0.0%) |
| 5-Person Households | 0 (0.0%) | 0 (0.0%) |
| 6-Person Households | 65 (15.2%) | 0 (0.0%) |
| 7+ Person Households | 0 (0.0%) | 0 (0.0%) |
| Total | 291 (68.1%) | 136 (31.9%) |
Female Fertility in Mesa del Caballo
Fertility by Age in Mesa del Caballo
Average fertility rate in Mesa del Caballo is 88.0 births per 1,000 women. Women in the age bracket of 20 to 34 years have the highest fertility rate with 175.0 births per 1,000 women. Women in the age bracket of 20 to 34 years acount for 100.0% of all women with births.
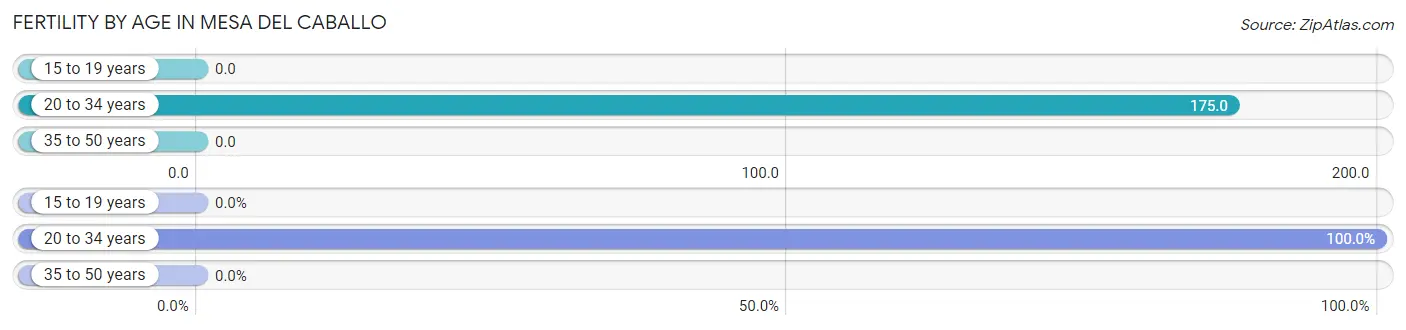
| Age Bracket | Women with Births | Births / 1,000 Women |
| 15 to 19 years | 0 (0.0%) | 0.0 |
| 20 to 34 years | 24 (100.0%) | 175.0 |
| 35 to 50 years | 0 (0.0%) | 0.0 |
| Total | 24 (100.0%) | 88.0 |
Fertility by Age by Marriage Status in Mesa del Caballo
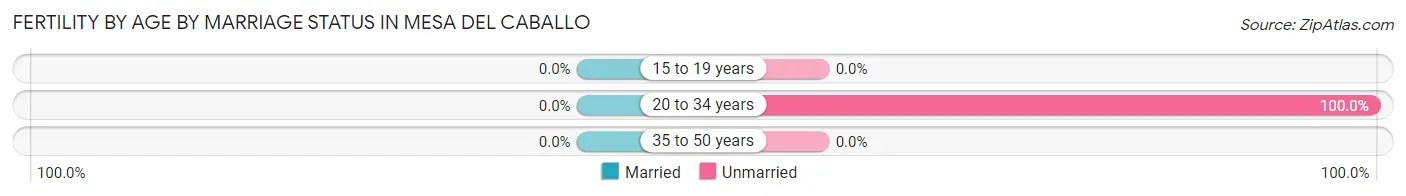
| Age Bracket | Married | Unmarried |
| 15 to 19 years | 0 (0.0%) | 0 (0.0%) |
| 20 to 34 years | 0 (0.0%) | 24 (100.0%) |
| 35 to 50 years | 0 (0.0%) | 0 (0.0%) |
| Total | 0 (0.0%) | 24 (100.0%) |
Fertility by Education in Mesa del Caballo
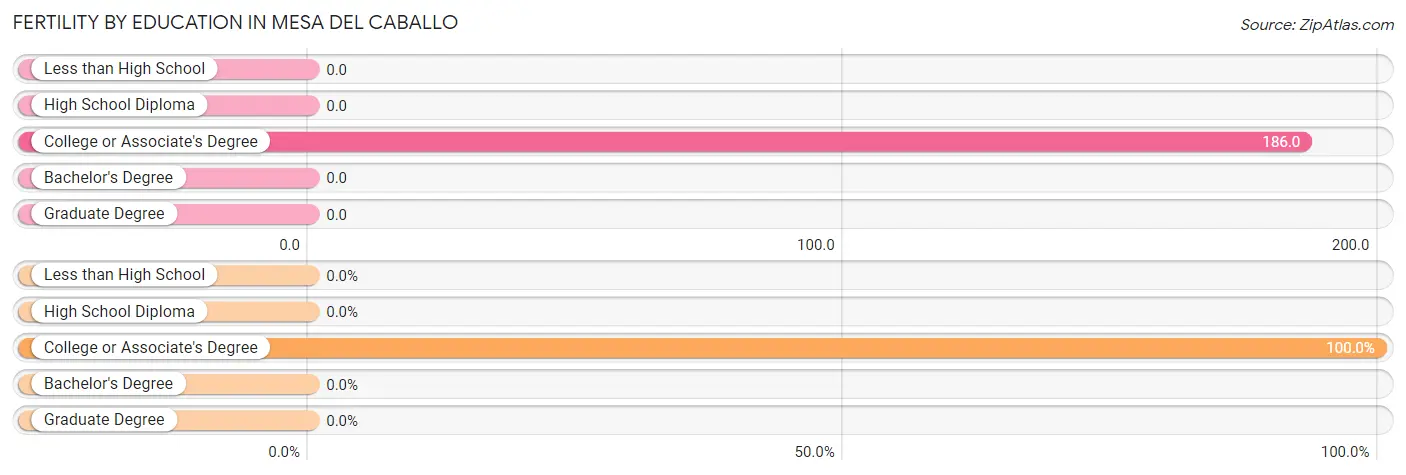
| Educational Attainment | Women with Births | Births / 1,000 Women |
| Less than High School | 0 (0.0%) | 0.0 |
| High School Diploma | 0 (0.0%) | 0.0 |
| College or Associate's Degree | 24 (100.0%) | 186.0 |
| Bachelor's Degree | 0 (0.0%) | 0.0 |
| Graduate Degree | 0 (0.0%) | 0.0 |
| Total | 24 (100.0%) | 88.0 |
Fertility by Education by Marriage Status in Mesa del Caballo
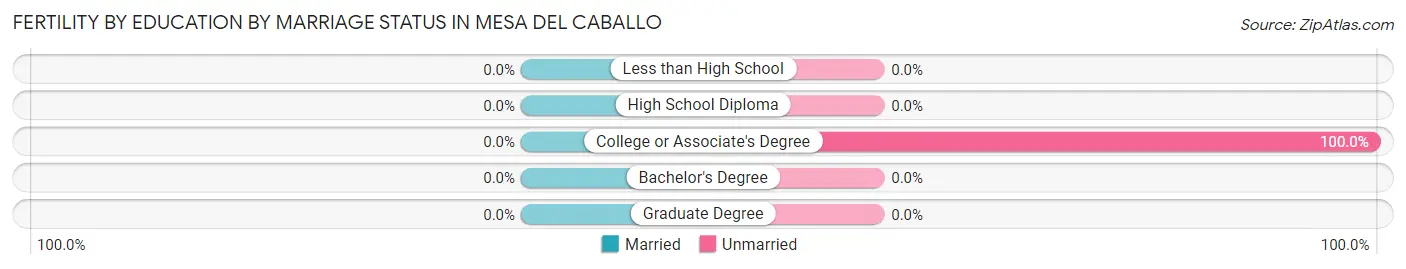
| Educational Attainment | Married | Unmarried |
| Less than High School | 0 (0.0%) | 0 (0.0%) |
| High School Diploma | 0 (0.0%) | 0 (0.0%) |
| College or Associate's Degree | 0 (0.0%) | 24 (100.0%) |
| Bachelor's Degree | 0 (0.0%) | 0 (0.0%) |
| Graduate Degree | 0 (0.0%) | 0 (0.0%) |
| Total | 0 (0.0%) | 24 (100.0%) |
Employment Characteristics in Mesa del Caballo
Employment by Class of Employer in Mesa del Caballo
Among the 506 employed individuals in Mesa del Caballo, private company employees (264 | 52.2%), state government employees (69 | 13.6%), and self-employed (not incorporated) (63 | 12.4%) make up the most common classes of employment.
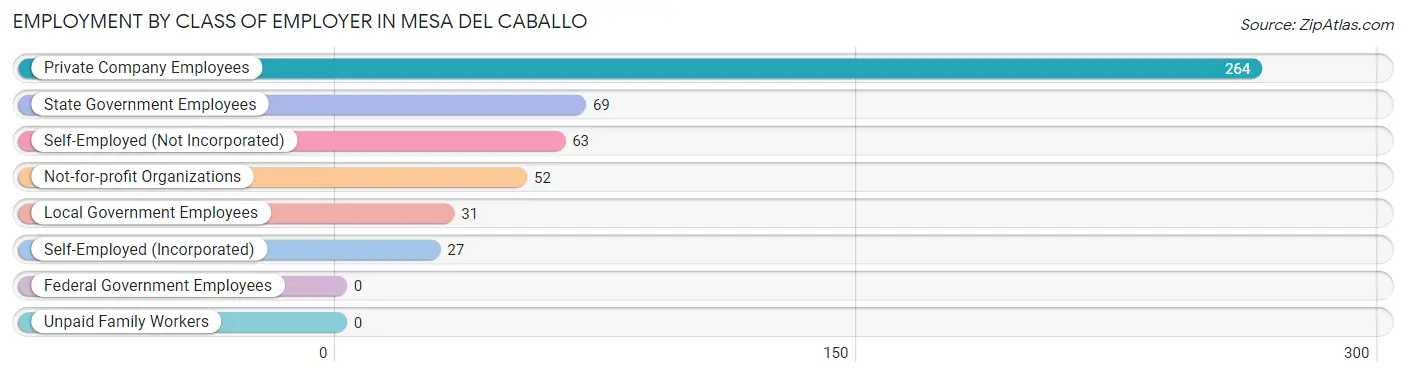
| Employer Class | # Employees | % Employees |
| Private Company Employees | 264 | 52.2% |
| Self-Employed (Incorporated) | 27 | 5.3% |
| Self-Employed (Not Incorporated) | 63 | 12.4% |
| Not-for-profit Organizations | 52 | 10.3% |
| Local Government Employees | 31 | 6.1% |
| State Government Employees | 69 | 13.6% |
| Federal Government Employees | 0 | 0.0% |
| Unpaid Family Workers | 0 | 0.0% |
| Total | 506 | 100.0% |
Employment Status by Age in Mesa del Caballo
According to the labor force statistics for Mesa del Caballo, out of the total population over 16 years of age (765), 69.5% or 532 individuals are in the labor force, with 4.9% or 26 of them unemployed. The age group with the highest labor force participation rate is 16 to 19 years, with 100.0% or 8 individuals in the labor force. Within the labor force, the 25 to 29 years age range has the highest percentage of unemployed individuals, with 36.6% or 26 of them being unemployed.
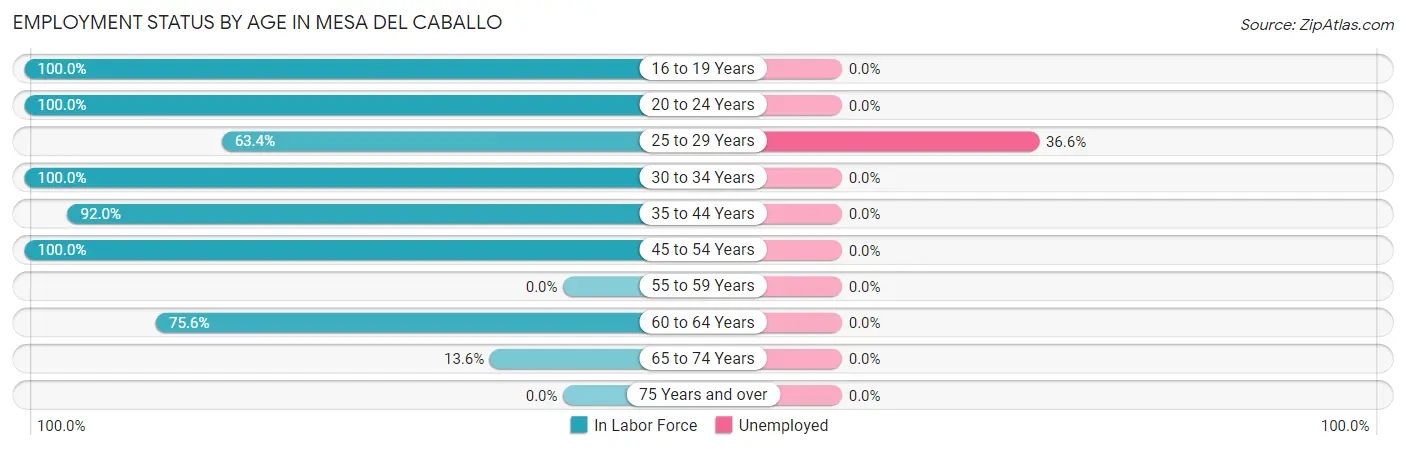
| Age Bracket | In Labor Force | Unemployed |
| 16 to 19 Years | 8 (100.0%) | 0 (0.0%) |
| 20 to 24 Years | 65 (100.0%) | 0 (0.0%) |
| 25 to 29 Years | 71 (63.4%) | 26 (36.6%) |
| 30 to 34 Years | 122 (100.0%) | 0 (0.0%) |
| 35 to 44 Years | 150 (92.0%) | 0 (0.0%) |
| 45 to 54 Years | 43 (100.0%) | 0 (0.0%) |
| 55 to 59 Years | 0 (0.0%) | 0 (0.0%) |
| 60 to 64 Years | 62 (75.6%) | 0 (0.0%) |
| 65 to 74 Years | 11 (13.6%) | 0 (0.0%) |
| 75 Years and over | 0 (0.0%) | 0 (0.0%) |
| Total | 532 (69.5%) | 26 (4.9%) |
Employment Status by Educational Attainment in Mesa del Caballo
According to labor force statistics for Mesa del Caballo, 85.8% of individuals (448) out of the total population between 25 and 64 years of age (522) are in the labor force, with 5.8% or 26 of them being unemployed. The group with the highest labor force participation rate are those with the educational attainment of less than high school, with 100.0% or 88 individuals in the labor force. Within the labor force, individuals with high school diploma education have the highest percentage of unemployment, with 23.9% or 26 of them being unemployed.
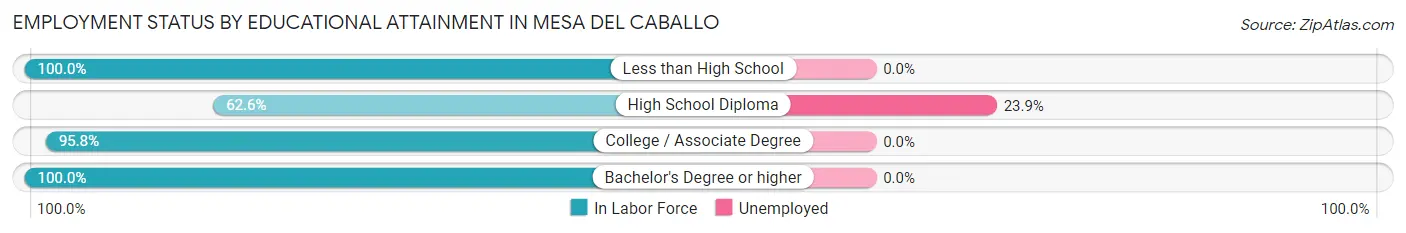
| Educational Attainment | In Labor Force | Unemployed |
| Less than High School | 88 (100.0%) | 0 (0.0%) |
| High School Diploma | 109 (62.6%) | 42 (23.9%) |
| College / Associate Degree | 204 (95.8%) | 0 (0.0%) |
| Bachelor's Degree or higher | 47 (100.0%) | 0 (0.0%) |
| Total | 448 (85.8%) | 30 (5.8%) |
Employment Occupations by Sex in Mesa del Caballo
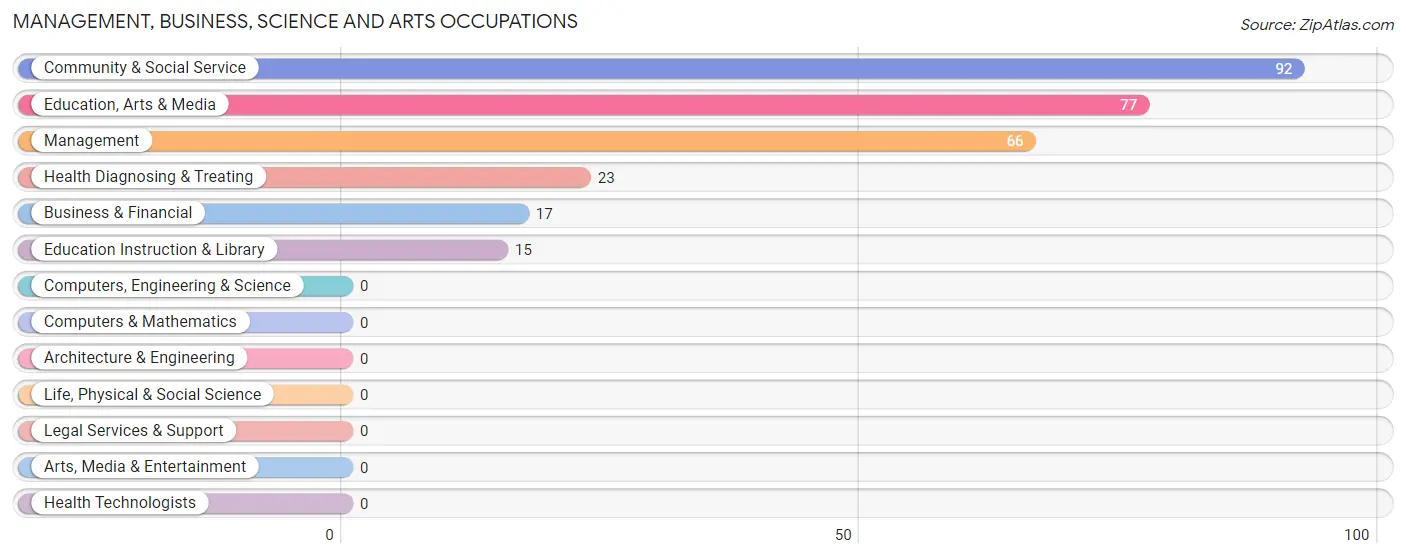
Management, Business, Science and Arts Occupations
The most common Management, Business, Science and Arts occupations in Mesa del Caballo are Community & Social Service (92 | 18.2%), Education, Arts & Media (77 | 15.2%), Management (66 | 13.0%), Health Diagnosing & Treating (23 | 4.5%), and Business & Financial (17 | 3.4%).
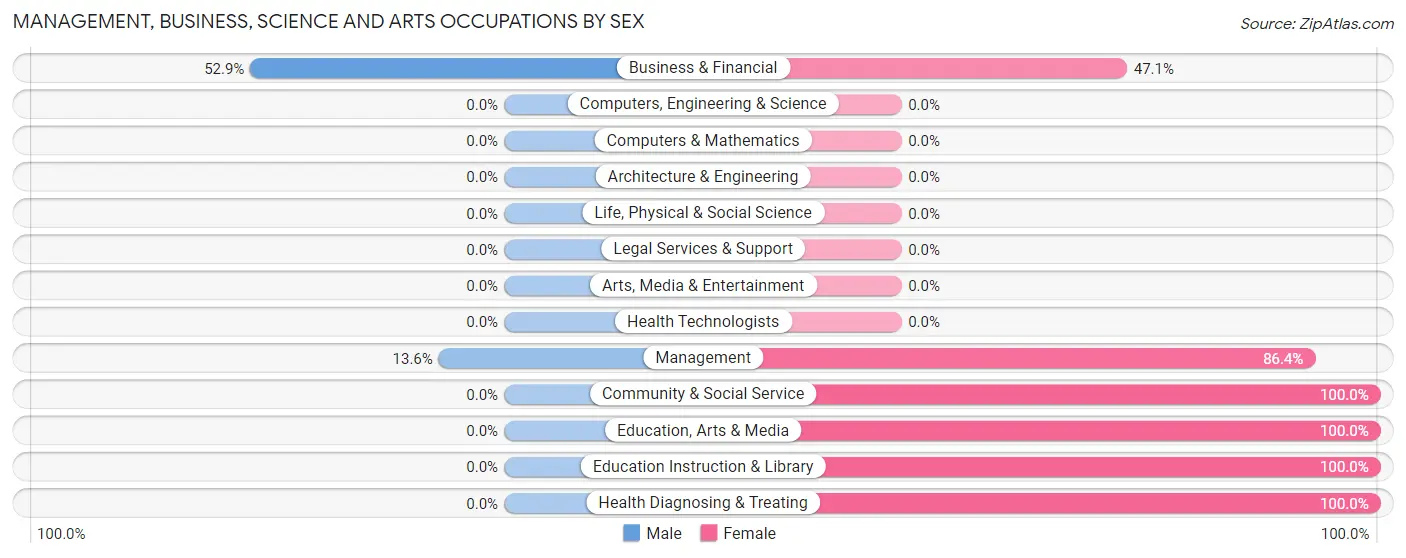
Management, Business, Science and Arts Occupations by Sex
Within the Management, Business, Science and Arts occupations in Mesa del Caballo, the most male-oriented occupations are Business & Financial (52.9%), and Management (13.6%), while the most female-oriented occupations are Community & Social Service (100.0%), Education, Arts & Media (100.0%), and Education Instruction & Library (100.0%).
| Occupation | Male | Female |
| Management | 9 (13.6%) | 57 (86.4%) |
| Business & Financial | 9 (52.9%) | 8 (47.1%) |
| Computers, Engineering & Science | 0 (0.0%) | 0 (0.0%) |
| Computers & Mathematics | 0 (0.0%) | 0 (0.0%) |
| Architecture & Engineering | 0 (0.0%) | 0 (0.0%) |
| Life, Physical & Social Science | 0 (0.0%) | 0 (0.0%) |
| Community & Social Service | 0 (0.0%) | 92 (100.0%) |
| Education, Arts & Media | 0 (0.0%) | 77 (100.0%) |
| Legal Services & Support | 0 (0.0%) | 0 (0.0%) |
| Education Instruction & Library | 0 (0.0%) | 15 (100.0%) |
| Arts, Media & Entertainment | 0 (0.0%) | 0 (0.0%) |
| Health Diagnosing & Treating | 0 (0.0%) | 23 (100.0%) |
| Health Technologists | 0 (0.0%) | 0 (0.0%) |
| Total (Category) | 18 (9.1%) | 180 (90.9%) |
| Total (Overall) | 237 (46.8%) | 269 (53.2%) |
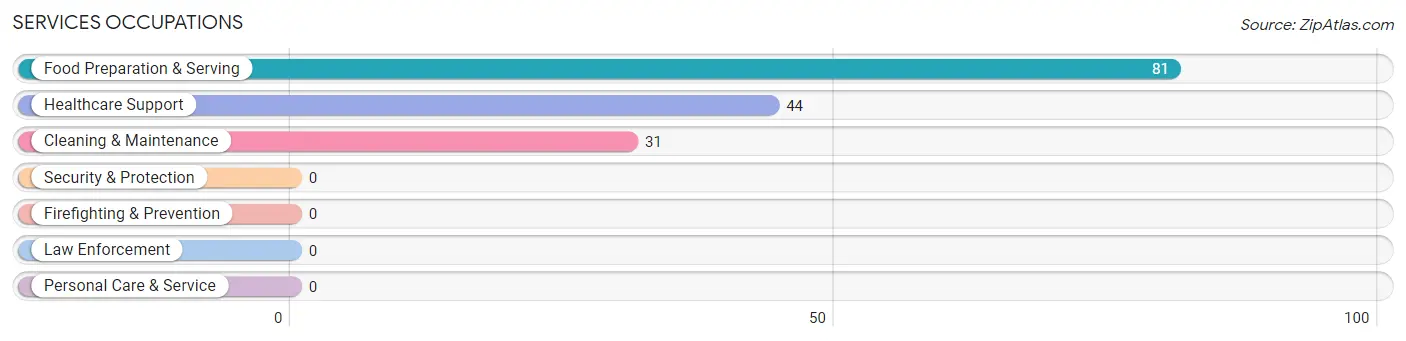
Services Occupations
The most common Services occupations in Mesa del Caballo are Food Preparation & Serving (81 | 16.0%), Healthcare Support (44 | 8.7%), and Cleaning & Maintenance (31 | 6.1%).
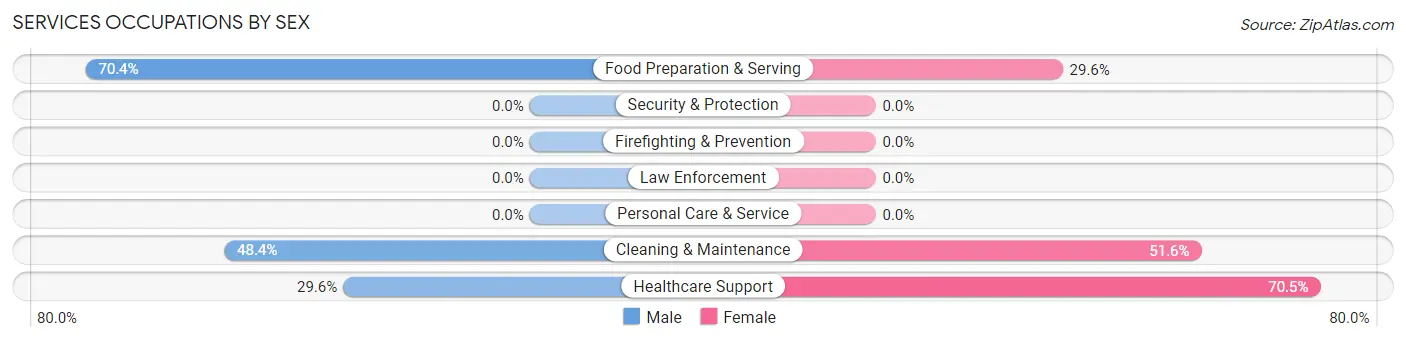
Services Occupations by Sex
Within the Services occupations in Mesa del Caballo, the most male-oriented occupations are Food Preparation & Serving (70.4%), Cleaning & Maintenance (48.4%), and Healthcare Support (29.5%), while the most female-oriented occupations are Healthcare Support (70.5%), Cleaning & Maintenance (51.6%), and Food Preparation & Serving (29.6%).
| Occupation | Male | Female |
| Healthcare Support | 13 (29.5%) | 31 (70.5%) |
| Security & Protection | 0 (0.0%) | 0 (0.0%) |
| Firefighting & Prevention | 0 (0.0%) | 0 (0.0%) |
| Law Enforcement | 0 (0.0%) | 0 (0.0%) |
| Food Preparation & Serving | 57 (70.4%) | 24 (29.6%) |
| Cleaning & Maintenance | 15 (48.4%) | 16 (51.6%) |
| Personal Care & Service | 0 (0.0%) | 0 (0.0%) |
| Total (Category) | 85 (54.5%) | 71 (45.5%) |
| Total (Overall) | 237 (46.8%) | 269 (53.2%) |
Sales and Office Occupations
The most common Sales and Office occupations in Mesa del Caballo are Office & Administration (21 | 4.2%), and Sales & Related (20 | 4.0%).
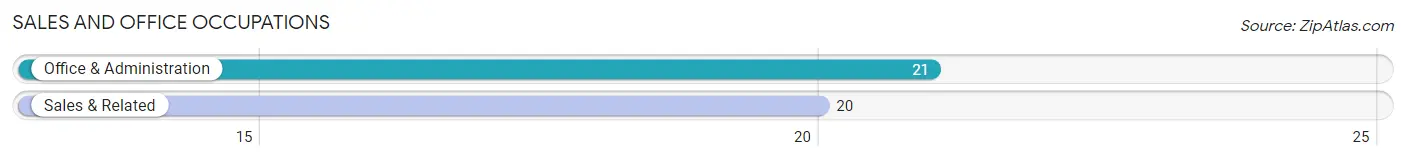
Sales and Office Occupations by Sex
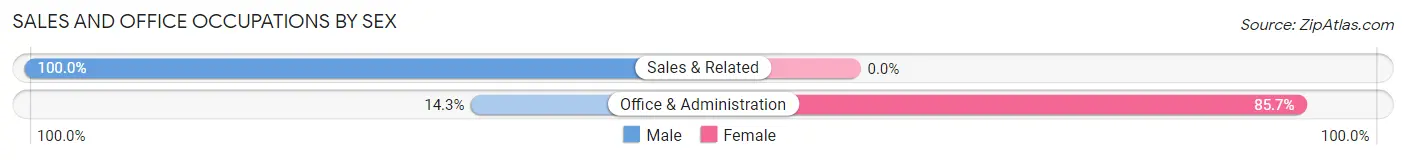
| Occupation | Male | Female |
| Sales & Related | 20 (100.0%) | 0 (0.0%) |
| Office & Administration | 3 (14.3%) | 18 (85.7%) |
| Total (Category) | 23 (56.1%) | 18 (43.9%) |
| Total (Overall) | 237 (46.8%) | 269 (53.2%) |
Natural Resources, Construction and Maintenance Occupations
The most common Natural Resources, Construction and Maintenance occupations in Mesa del Caballo are , and Construction & Extraction (90 | 17.8%).
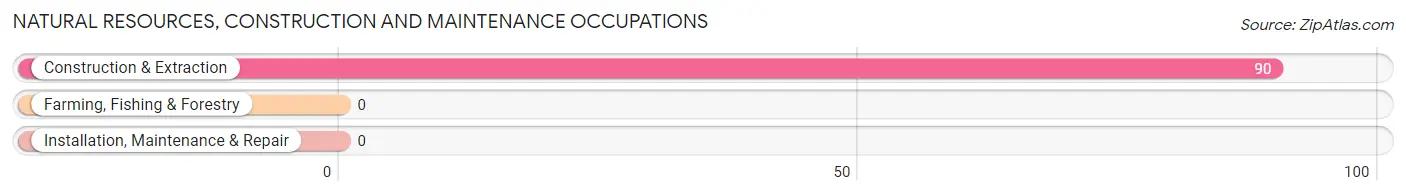
Natural Resources, Construction and Maintenance Occupations by Sex
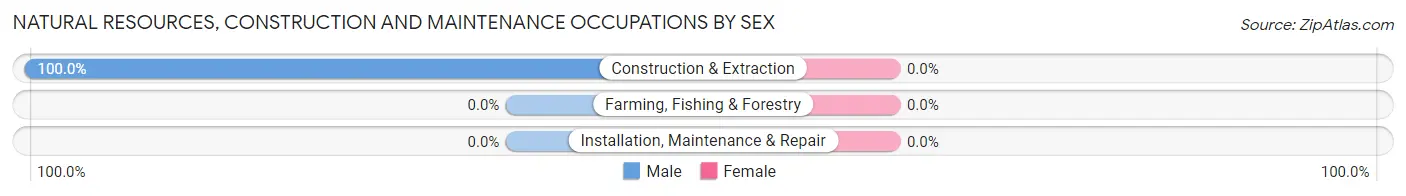
| Occupation | Male | Female |
| Farming, Fishing & Forestry | 0 (0.0%) | 0 (0.0%) |
| Construction & Extraction | 90 (100.0%) | 0 (0.0%) |
| Installation, Maintenance & Repair | 0 (0.0%) | 0 (0.0%) |
| Total (Category) | 90 (100.0%) | 0 (0.0%) |
| Total (Overall) | 237 (46.8%) | 269 (53.2%) |
Production, Transportation and Moving Occupations
The most common Production, Transportation and Moving occupations in Mesa del Caballo are Transportation (15 | 3.0%), and Material Moving (6 | 1.2%).
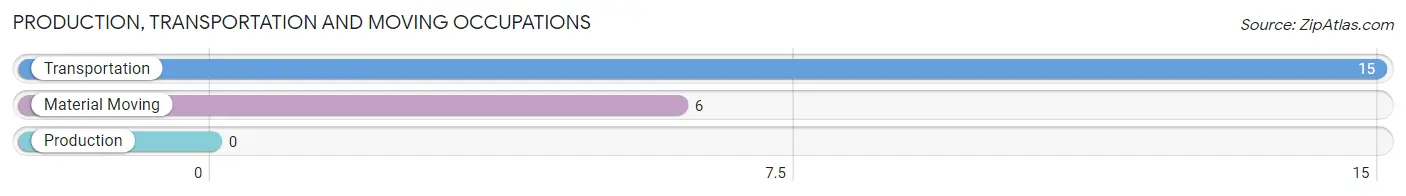
Production, Transportation and Moving Occupations by Sex
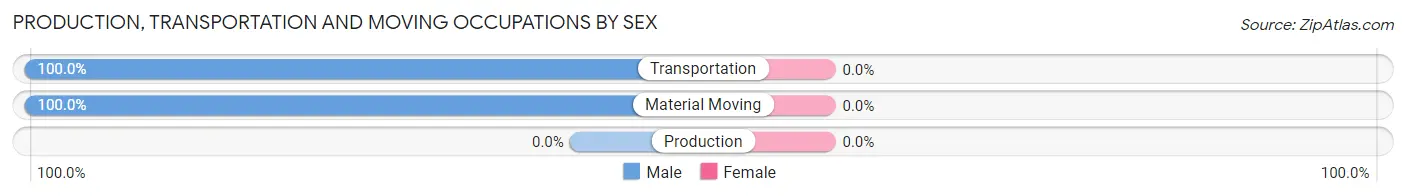
| Occupation | Male | Female |
| Production | 0 (0.0%) | 0 (0.0%) |
| Transportation | 15 (100.0%) | 0 (0.0%) |
| Material Moving | 6 (100.0%) | 0 (0.0%) |
| Total (Category) | 21 (100.0%) | 0 (0.0%) |
| Total (Overall) | 237 (46.8%) | 269 (53.2%) |
Employment Industries by Sex in Mesa del Caballo
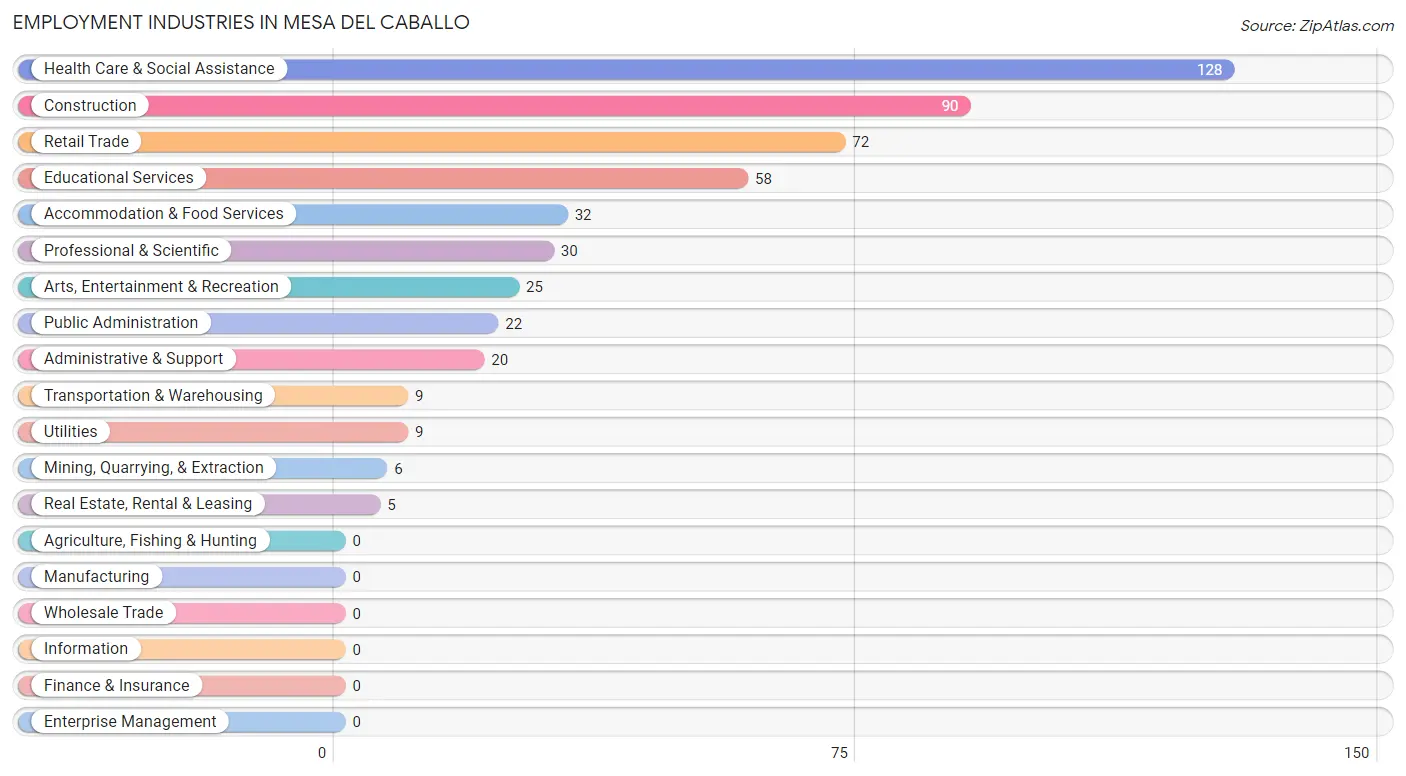
Employment Industries in Mesa del Caballo
The major employment industries in Mesa del Caballo include Health Care & Social Assistance (128 | 25.3%), Construction (90 | 17.8%), Retail Trade (72 | 14.2%), Educational Services (58 | 11.5%), and Accommodation & Food Services (32 | 6.3%).
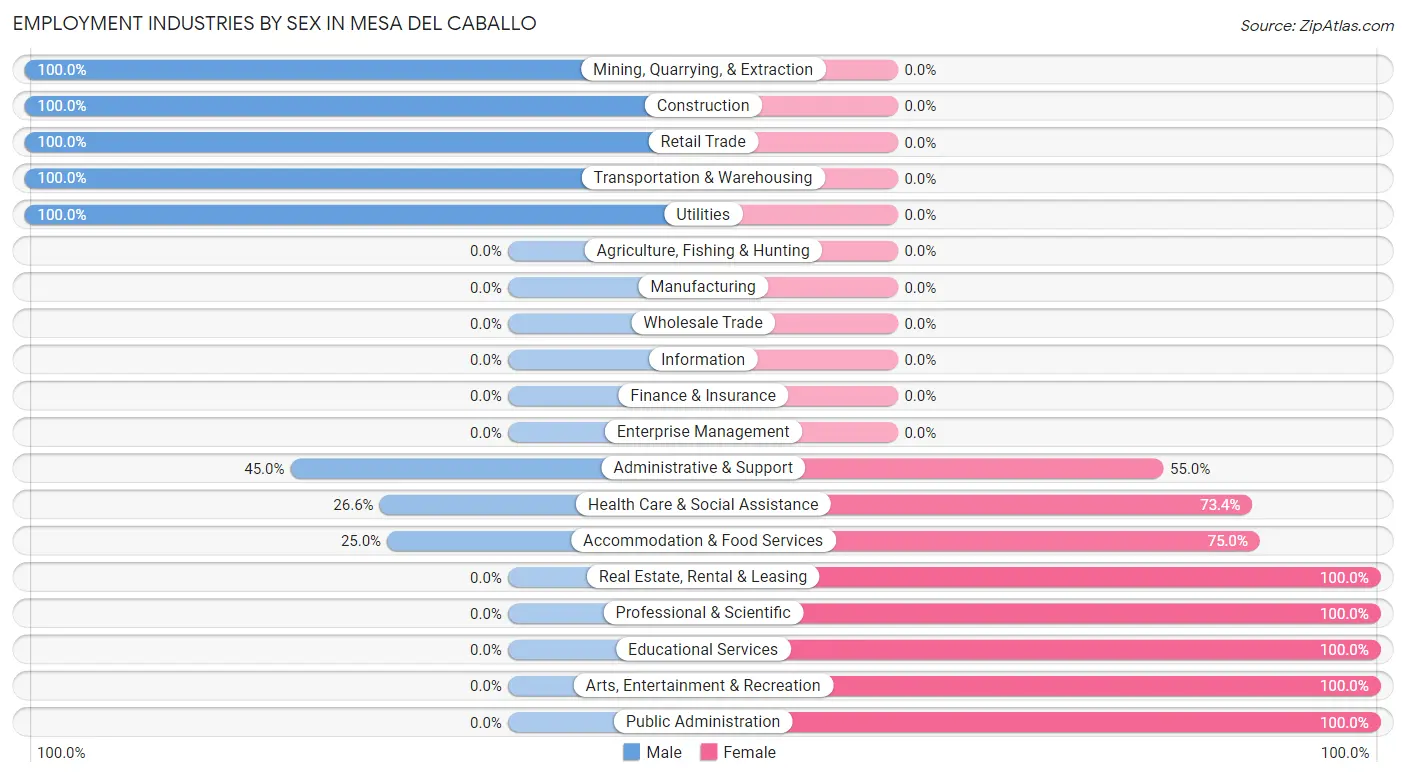
Employment Industries by Sex in Mesa del Caballo
The Mesa del Caballo industries that see more men than women are Mining, Quarrying, & Extraction (100.0%), Construction (100.0%), and Retail Trade (100.0%), whereas the industries that tend to have a higher number of women are Real Estate, Rental & Leasing (100.0%), Professional & Scientific (100.0%), and Educational Services (100.0%).
| Industry | Male | Female |
| Agriculture, Fishing & Hunting | 0 (0.0%) | 0 (0.0%) |
| Mining, Quarrying, & Extraction | 6 (100.0%) | 0 (0.0%) |
| Construction | 90 (100.0%) | 0 (0.0%) |
| Manufacturing | 0 (0.0%) | 0 (0.0%) |
| Wholesale Trade | 0 (0.0%) | 0 (0.0%) |
| Retail Trade | 72 (100.0%) | 0 (0.0%) |
| Transportation & Warehousing | 9 (100.0%) | 0 (0.0%) |
| Utilities | 9 (100.0%) | 0 (0.0%) |
| Information | 0 (0.0%) | 0 (0.0%) |
| Finance & Insurance | 0 (0.0%) | 0 (0.0%) |
| Real Estate, Rental & Leasing | 0 (0.0%) | 5 (100.0%) |
| Professional & Scientific | 0 (0.0%) | 30 (100.0%) |
| Enterprise Management | 0 (0.0%) | 0 (0.0%) |
| Administrative & Support | 9 (45.0%) | 11 (55.0%) |
| Educational Services | 0 (0.0%) | 58 (100.0%) |
| Health Care & Social Assistance | 34 (26.6%) | 94 (73.4%) |
| Arts, Entertainment & Recreation | 0 (0.0%) | 25 (100.0%) |
| Accommodation & Food Services | 8 (25.0%) | 24 (75.0%) |
| Public Administration | 0 (0.0%) | 22 (100.0%) |
| Total | 237 (46.8%) | 269 (53.2%) |
Education in Mesa del Caballo
School Enrollment in Mesa del Caballo
The most common levels of schooling among the 336 students in Mesa del Caballo are elementary school (157 | 46.7%), middle school (81 | 24.1%), and nursery / preschool (27 | 8.0%).
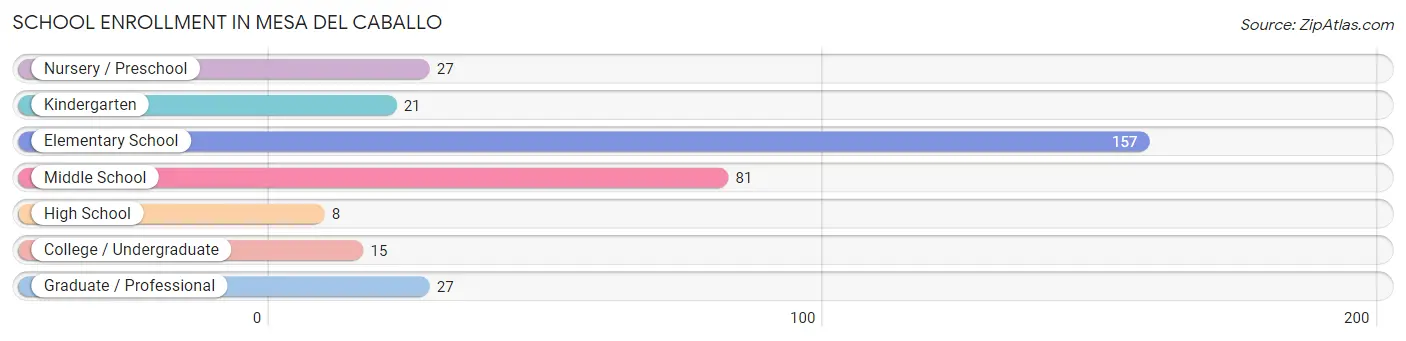
| School Level | # Students | % Students |
| Nursery / Preschool | 27 | 8.0% |
| Kindergarten | 21 | 6.2% |
| Elementary School | 157 | 46.7% |
| Middle School | 81 | 24.1% |
| High School | 8 | 2.4% |
| College / Undergraduate | 15 | 4.5% |
| Graduate / Professional | 27 | 8.0% |
| Total | 336 | 100.0% |
School Enrollment by Age by Funding Source in Mesa del Caballo
Out of a total of 336 students who are enrolled in schools in Mesa del Caballo, 42 (12.5%) attend a private institution, while the remaining 294 (87.5%) are enrolled in public schools. The age group of 25 to 34 year olds has the highest likelihood of being enrolled in private schools, with 15 (100.0% in the age bracket) enrolled. Conversely, the age group of 3 to 4 year olds has the lowest likelihood of being enrolled in a private school, with 27 (100.0% in the age bracket) attending a public institution.
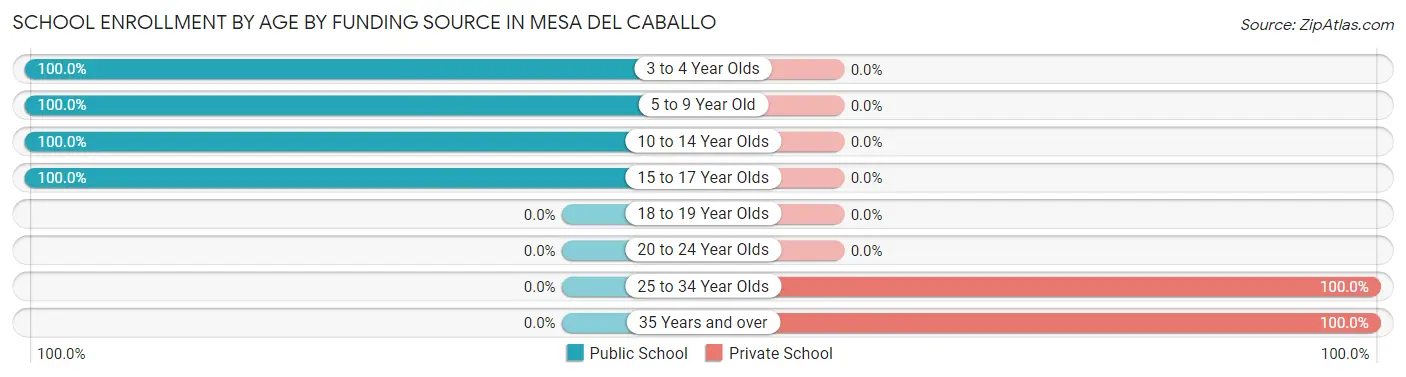
| Age Bracket | Public School | Private School |
| 3 to 4 Year Olds | 27 (100.0%) | 0 (0.0%) |
| 5 to 9 Year Old | 178 (100.0%) | 0 (0.0%) |
| 10 to 14 Year Olds | 75 (100.0%) | 0 (0.0%) |
| 15 to 17 Year Olds | 14 (100.0%) | 0 (0.0%) |
| 18 to 19 Year Olds | 0 (0.0%) | 0 (0.0%) |
| 20 to 24 Year Olds | 0 (0.0%) | 0 (0.0%) |
| 25 to 34 Year Olds | 0 (0.0%) | 15 (100.0%) |
| 35 Years and over | 0 (0.0%) | 27 (100.0%) |
| Total | 294 (87.5%) | 42 (12.5%) |
Educational Attainment by Field of Study in Mesa del Caballo
Psychology (28 | 26.7%), business (27 | 25.7%), education (14 | 13.3%), social sciences (11 | 10.5%), and literature & languages (11 | 10.5%) are the most common fields of study among 105 individuals in Mesa del Caballo who have obtained a bachelor's degree or higher.
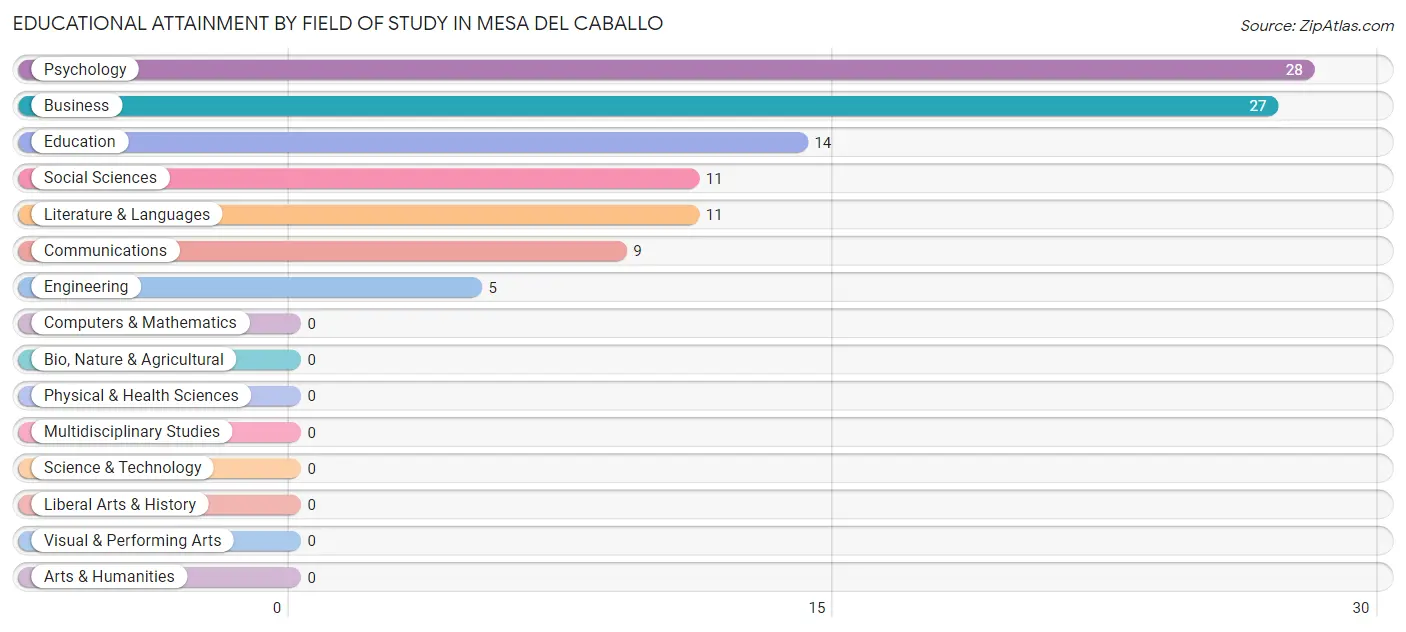
| Field of Study | # Graduates | % Graduates |
| Computers & Mathematics | 0 | 0.0% |
| Bio, Nature & Agricultural | 0 | 0.0% |
| Physical & Health Sciences | 0 | 0.0% |
| Psychology | 28 | 26.7% |
| Social Sciences | 11 | 10.5% |
| Engineering | 5 | 4.8% |
| Multidisciplinary Studies | 0 | 0.0% |
| Science & Technology | 0 | 0.0% |
| Business | 27 | 25.7% |
| Education | 14 | 13.3% |
| Literature & Languages | 11 | 10.5% |
| Liberal Arts & History | 0 | 0.0% |
| Visual & Performing Arts | 0 | 0.0% |
| Communications | 9 | 8.6% |
| Arts & Humanities | 0 | 0.0% |
| Total | 105 | 100.0% |
Transportation & Commute in Mesa del Caballo
Vehicle Availability by Sex in Mesa del Caballo
The most prevalent vehicle ownership categories in Mesa del Caballo are males with 2 vehicles (146, accounting for 61.6%) and females with 2 vehicles (92, making up 54.3%).
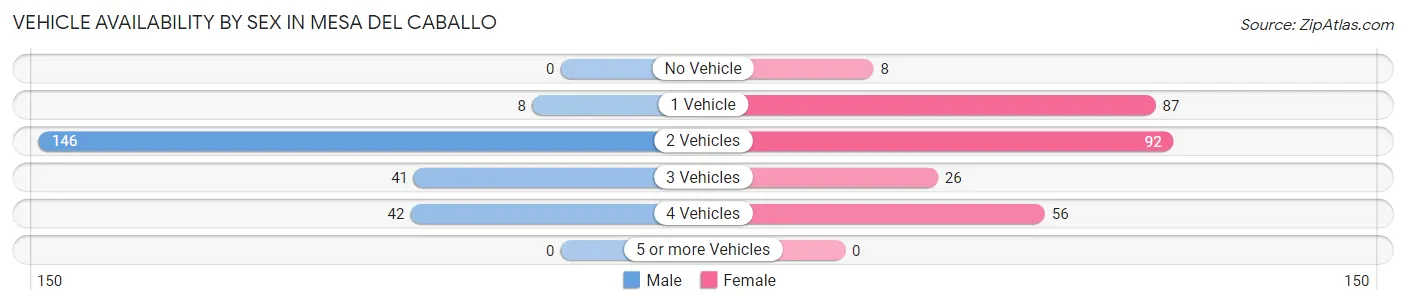
| Vehicles Available | Male | Female |
| No Vehicle | 0 (0.0%) | 8 (3.0%) |
| 1 Vehicle | 8 (3.4%) | 87 (32.3%) |
| 2 Vehicles | 146 (61.6%) | 92 (34.2%) |
| 3 Vehicles | 41 (17.3%) | 26 (9.7%) |
| 4 Vehicles | 42 (17.7%) | 56 (20.8%) |
| 5 or more Vehicles | 0 (0.0%) | 0 (0.0%) |
| Total | 237 (100.0%) | 269 (100.0%) |
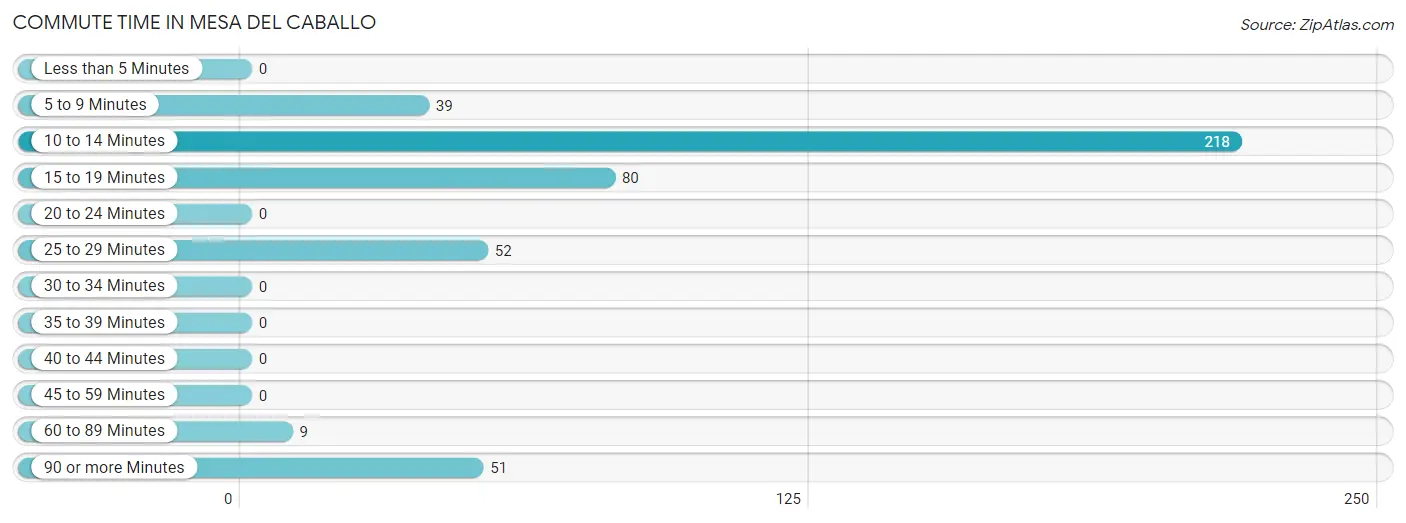
Commute Time in Mesa del Caballo
The most frequently occuring commute durations in Mesa del Caballo are 10 to 14 minutes (218 commuters, 48.5%), 15 to 19 minutes (80 commuters, 17.8%), and 25 to 29 minutes (52 commuters, 11.6%).
| Commute Time | # Commuters | % Commuters |
| Less than 5 Minutes | 0 | 0.0% |
| 5 to 9 Minutes | 39 | 8.7% |
| 10 to 14 Minutes | 218 | 48.5% |
| 15 to 19 Minutes | 80 | 17.8% |
| 20 to 24 Minutes | 0 | 0.0% |
| 25 to 29 Minutes | 52 | 11.6% |
| 30 to 34 Minutes | 0 | 0.0% |
| 35 to 39 Minutes | 0 | 0.0% |
| 40 to 44 Minutes | 0 | 0.0% |
| 45 to 59 Minutes | 0 | 0.0% |
| 60 to 89 Minutes | 9 | 2.0% |
| 90 or more Minutes | 51 | 11.4% |
Commute Time by Sex in Mesa del Caballo
The most common commute times in Mesa del Caballo are 10 to 14 minutes (123 commuters, 57.2%) for males and 10 to 14 minutes (95 commuters, 40.6%) for females.
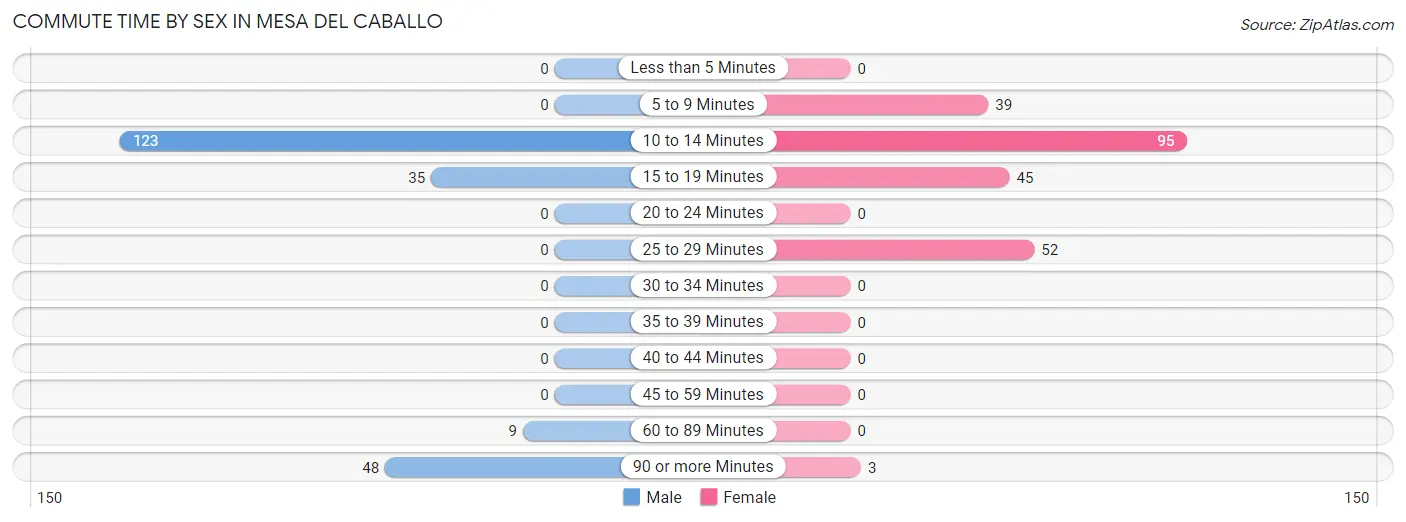
| Commute Time | Male | Female |
| Less than 5 Minutes | 0 (0.0%) | 0 (0.0%) |
| 5 to 9 Minutes | 0 (0.0%) | 39 (16.7%) |
| 10 to 14 Minutes | 123 (57.2%) | 95 (40.6%) |
| 15 to 19 Minutes | 35 (16.3%) | 45 (19.2%) |
| 20 to 24 Minutes | 0 (0.0%) | 0 (0.0%) |
| 25 to 29 Minutes | 0 (0.0%) | 52 (22.2%) |
| 30 to 34 Minutes | 0 (0.0%) | 0 (0.0%) |
| 35 to 39 Minutes | 0 (0.0%) | 0 (0.0%) |
| 40 to 44 Minutes | 0 (0.0%) | 0 (0.0%) |
| 45 to 59 Minutes | 0 (0.0%) | 0 (0.0%) |
| 60 to 89 Minutes | 9 (4.2%) | 0 (0.0%) |
| 90 or more Minutes | 48 (22.3%) | 3 (1.3%) |
Time of Departure to Work by Sex in Mesa del Caballo
The most frequent times of departure to work in Mesa del Caballo are 7:30 AM to 7:59 AM (99, 46.1%) for males and 7:30 AM to 7:59 AM (73, 31.2%) for females.
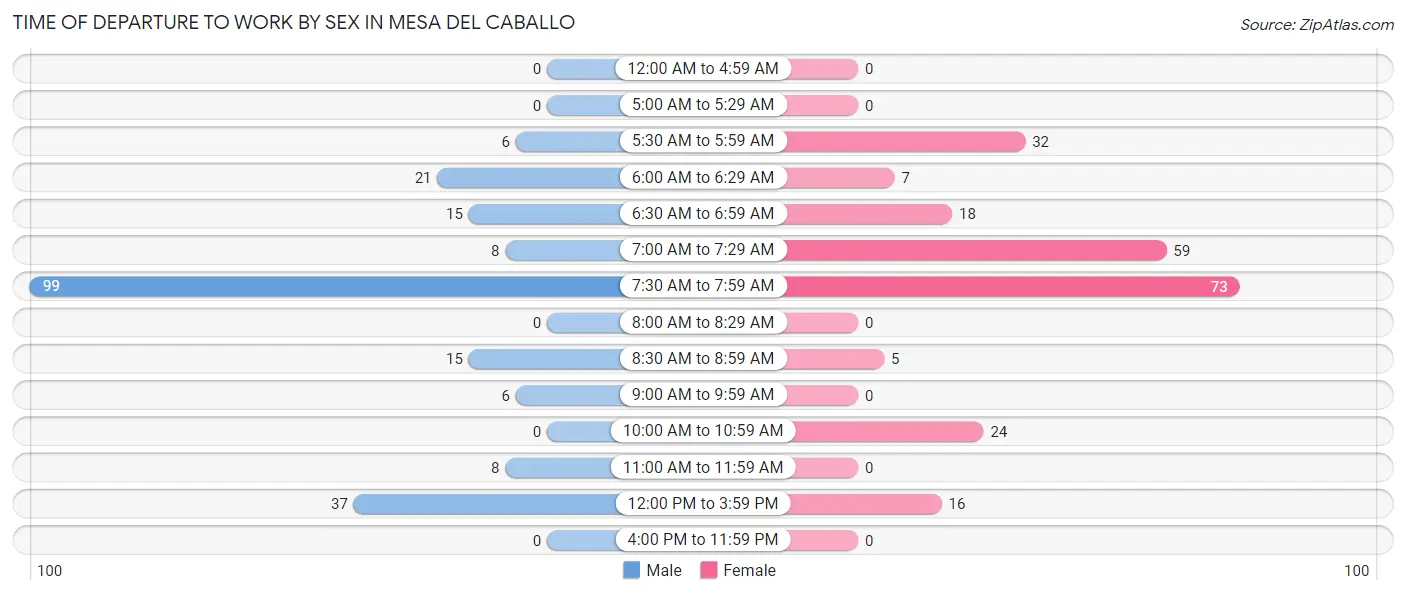
| Time of Departure | Male | Female |
| 12:00 AM to 4:59 AM | 0 (0.0%) | 0 (0.0%) |
| 5:00 AM to 5:29 AM | 0 (0.0%) | 0 (0.0%) |
| 5:30 AM to 5:59 AM | 6 (2.8%) | 32 (13.7%) |
| 6:00 AM to 6:29 AM | 21 (9.8%) | 7 (3.0%) |
| 6:30 AM to 6:59 AM | 15 (7.0%) | 18 (7.7%) |
| 7:00 AM to 7:29 AM | 8 (3.7%) | 59 (25.2%) |
| 7:30 AM to 7:59 AM | 99 (46.1%) | 73 (31.2%) |
| 8:00 AM to 8:29 AM | 0 (0.0%) | 0 (0.0%) |
| 8:30 AM to 8:59 AM | 15 (7.0%) | 5 (2.1%) |
| 9:00 AM to 9:59 AM | 6 (2.8%) | 0 (0.0%) |
| 10:00 AM to 10:59 AM | 0 (0.0%) | 24 (10.3%) |
| 11:00 AM to 11:59 AM | 8 (3.7%) | 0 (0.0%) |
| 12:00 PM to 3:59 PM | 37 (17.2%) | 16 (6.8%) |
| 4:00 PM to 11:59 PM | 0 (0.0%) | 0 (0.0%) |
| Total | 215 (100.0%) | 234 (100.0%) |
Housing Occupancy in Mesa del Caballo
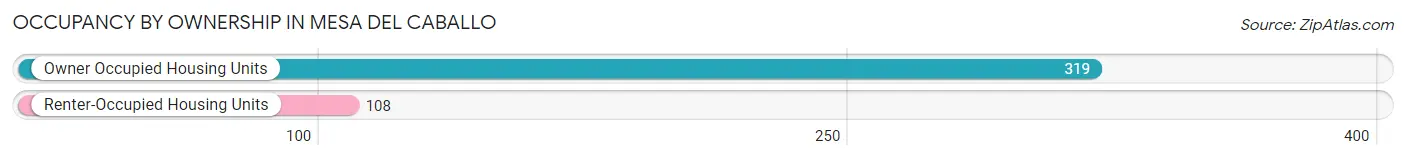
Occupancy by Ownership in Mesa del Caballo
Of the total 427 dwellings in Mesa del Caballo, owner-occupied units account for 319 (74.7%), while renter-occupied units make up 108 (25.3%).
| Occupancy | # Housing Units | % Housing Units |
| Owner Occupied Housing Units | 319 | 74.7% |
| Renter-Occupied Housing Units | 108 | 25.3% |
| Total Occupied Housing Units | 427 | 100.0% |
Occupancy by Household Size in Mesa del Caballo
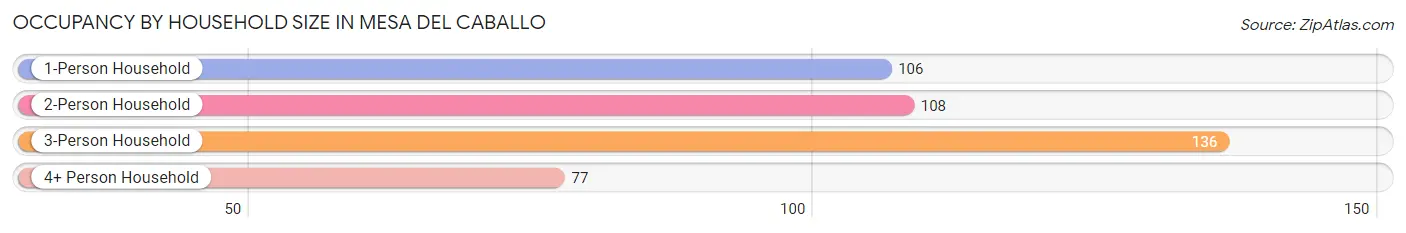
| Household Size | # Housing Units | % Housing Units |
| 1-Person Household | 106 | 24.8% |
| 2-Person Household | 108 | 25.3% |
| 3-Person Household | 136 | 31.9% |
| 4+ Person Household | 77 | 18.0% |
| Total Housing Units | 427 | 100.0% |
Occupancy by Ownership by Household Size in Mesa del Caballo
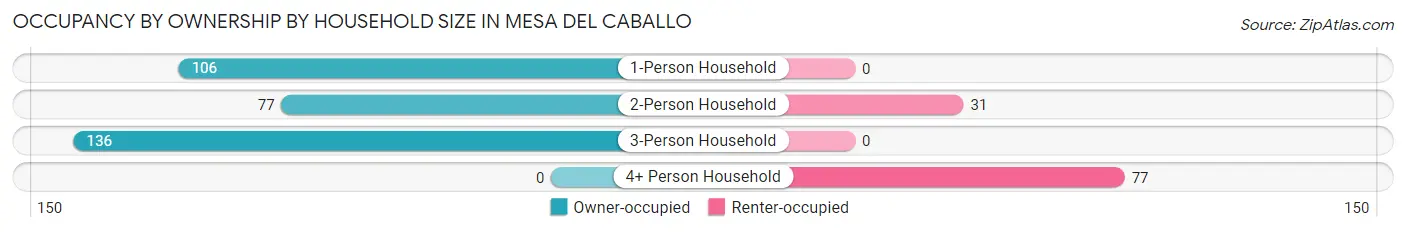
| Household Size | Owner-occupied | Renter-occupied |
| 1-Person Household | 106 (100.0%) | 0 (0.0%) |
| 2-Person Household | 77 (71.3%) | 31 (28.7%) |
| 3-Person Household | 136 (100.0%) | 0 (0.0%) |
| 4+ Person Household | 0 (0.0%) | 77 (100.0%) |
| Total Housing Units | 319 (74.7%) | 108 (25.3%) |
Occupancy by Educational Attainment in Mesa del Caballo
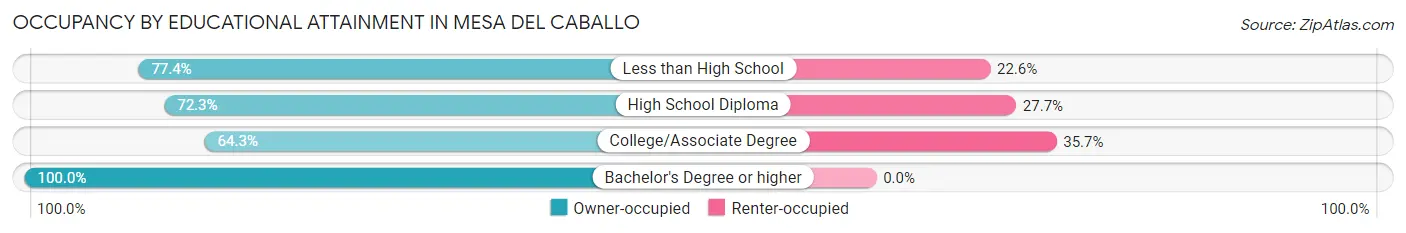
| Household Size | Owner-occupied | Renter-occupied |
| Less than High School | 24 (77.4%) | 7 (22.6%) |
| High School Diploma | 107 (72.3%) | 41 (27.7%) |
| College/Associate Degree | 108 (64.3%) | 60 (35.7%) |
| Bachelor's Degree or higher | 80 (100.0%) | 0 (0.0%) |
Occupancy by Age of Householder in Mesa del Caballo
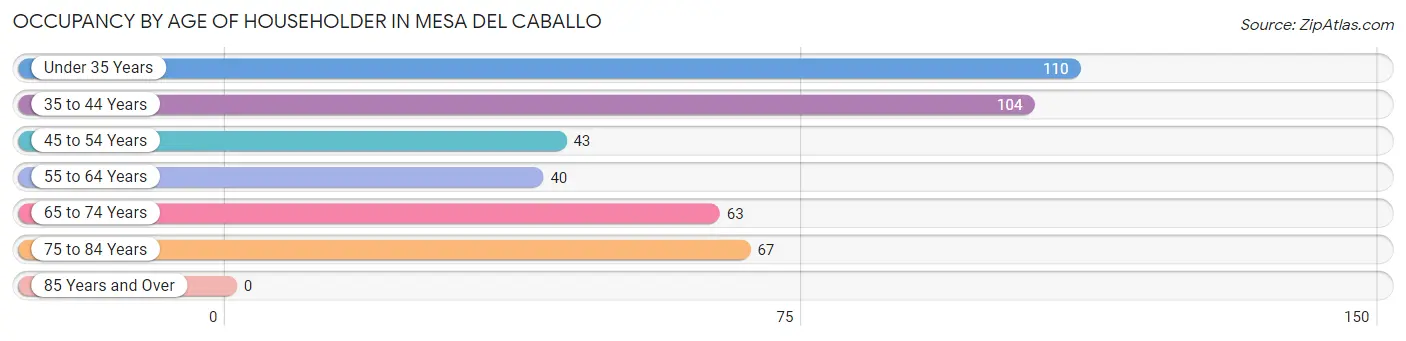
| Age Bracket | # Households | % Households |
| Under 35 Years | 110 | 25.8% |
| 35 to 44 Years | 104 | 24.4% |
| 45 to 54 Years | 43 | 10.1% |
| 55 to 64 Years | 40 | 9.4% |
| 65 to 74 Years | 63 | 14.7% |
| 75 to 84 Years | 67 | 15.7% |
| 85 Years and Over | 0 | 0.0% |
| Total | 427 | 100.0% |
Housing Finances in Mesa del Caballo
Median Income by Occupancy in Mesa del Caballo
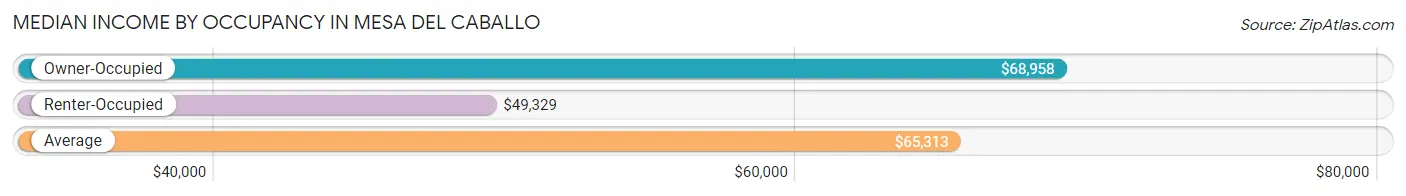
| Occupancy Type | # Households | Median Income |
| Owner-Occupied | 319 (74.7%) | $68,958 |
| Renter-Occupied | 108 (25.3%) | $49,329 |
| Average | 427 (100.0%) | $65,313 |
Occupancy by Householder Income Bracket in Mesa del Caballo
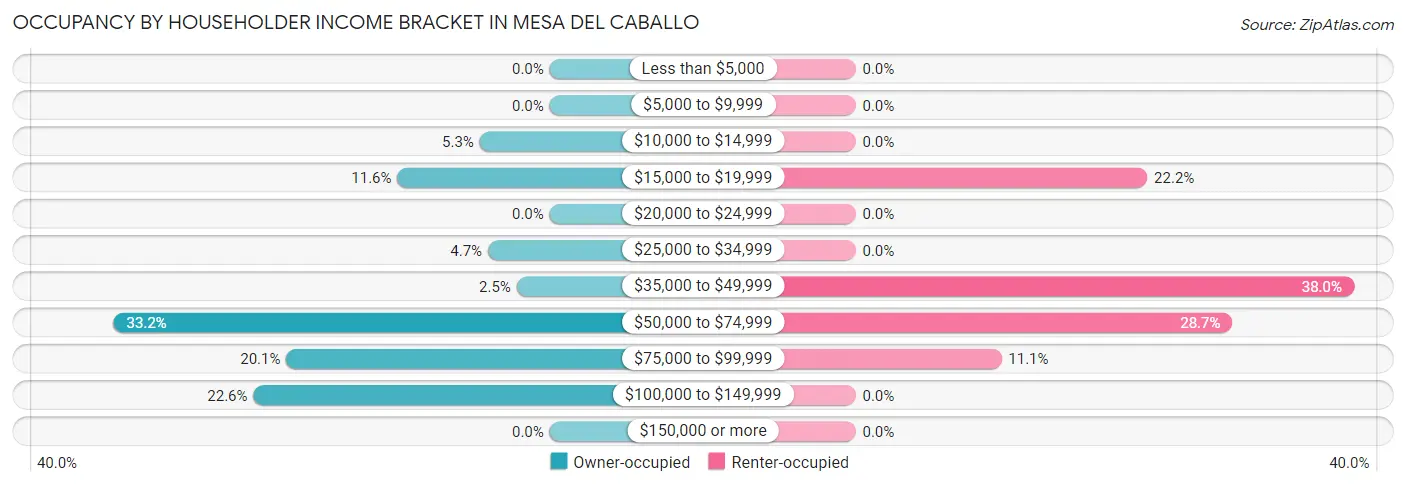
| Income Bracket | Owner-occupied | Renter-occupied |
| Less than $5,000 | 0 (0.0%) | 0 (0.0%) |
| $5,000 to $9,999 | 0 (0.0%) | 0 (0.0%) |
| $10,000 to $14,999 | 17 (5.3%) | 0 (0.0%) |
| $15,000 to $19,999 | 37 (11.6%) | 24 (22.2%) |
| $20,000 to $24,999 | 0 (0.0%) | 0 (0.0%) |
| $25,000 to $34,999 | 15 (4.7%) | 0 (0.0%) |
| $35,000 to $49,999 | 8 (2.5%) | 41 (38.0%) |
| $50,000 to $74,999 | 106 (33.2%) | 31 (28.7%) |
| $75,000 to $99,999 | 64 (20.1%) | 12 (11.1%) |
| $100,000 to $149,999 | 72 (22.6%) | 0 (0.0%) |
| $150,000 or more | 0 (0.0%) | 0 (0.0%) |
| Total | 319 (100.0%) | 108 (100.0%) |
Monthly Housing Cost Tiers in Mesa del Caballo
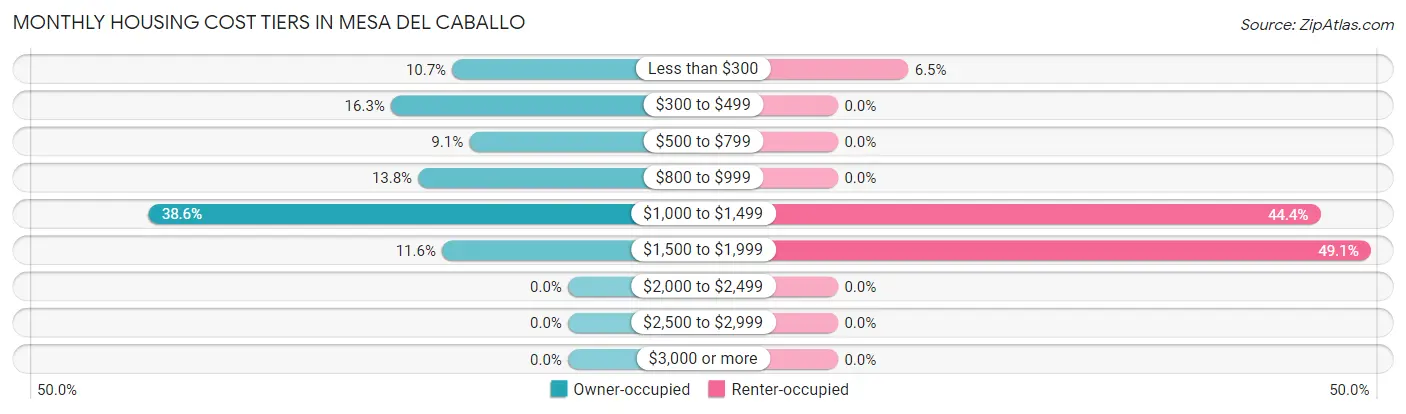
| Monthly Cost | Owner-occupied | Renter-occupied |
| Less than $300 | 34 (10.7%) | 7 (6.5%) |
| $300 to $499 | 52 (16.3%) | 0 (0.0%) |
| $500 to $799 | 29 (9.1%) | 0 (0.0%) |
| $800 to $999 | 44 (13.8%) | 0 (0.0%) |
| $1,000 to $1,499 | 123 (38.6%) | 48 (44.4%) |
| $1,500 to $1,999 | 37 (11.6%) | 53 (49.1%) |
| $2,000 to $2,499 | 0 (0.0%) | 0 (0.0%) |
| $2,500 to $2,999 | 0 (0.0%) | 0 (0.0%) |
| $3,000 or more | 0 (0.0%) | 0 (0.0%) |
| Total | 319 (100.0%) | 108 (100.0%) |
Physical Housing Characteristics in Mesa del Caballo
Housing Structures in Mesa del Caballo
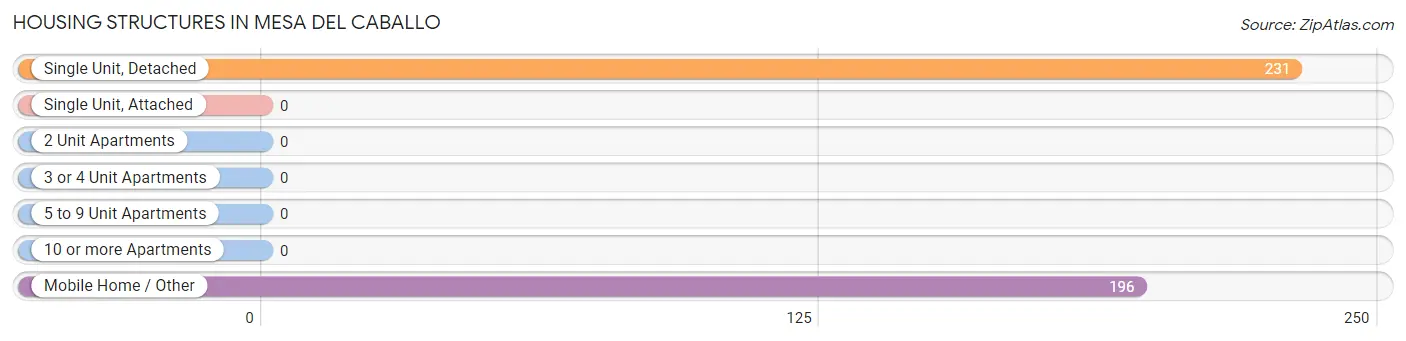
| Structure Type | # Housing Units | % Housing Units |
| Single Unit, Detached | 231 | 54.1% |
| Single Unit, Attached | 0 | 0.0% |
| 2 Unit Apartments | 0 | 0.0% |
| 3 or 4 Unit Apartments | 0 | 0.0% |
| 5 to 9 Unit Apartments | 0 | 0.0% |
| 10 or more Apartments | 0 | 0.0% |
| Mobile Home / Other | 196 | 45.9% |
| Total | 427 | 100.0% |
Housing Structures by Occupancy in Mesa del Caballo
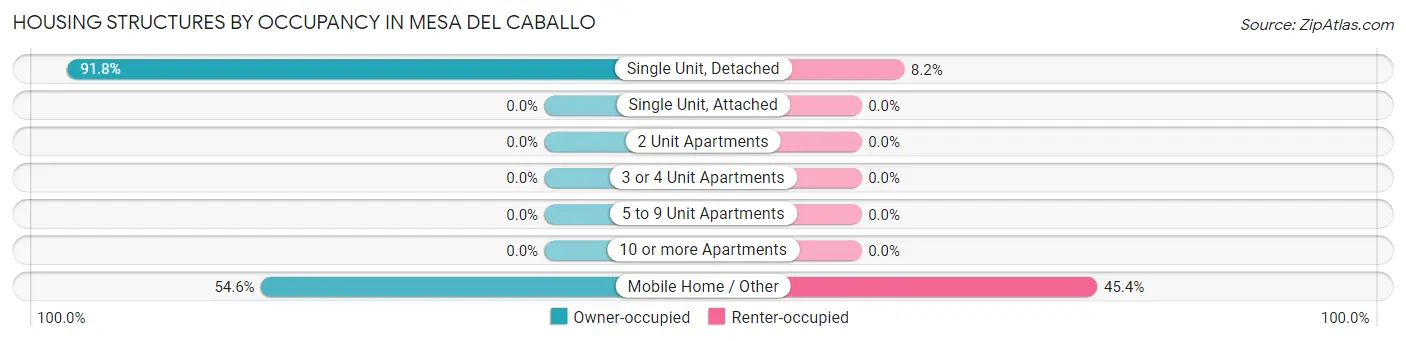
| Structure Type | Owner-occupied | Renter-occupied |
| Single Unit, Detached | 212 (91.8%) | 19 (8.2%) |
| Single Unit, Attached | 0 (0.0%) | 0 (0.0%) |
| 2 Unit Apartments | 0 (0.0%) | 0 (0.0%) |
| 3 or 4 Unit Apartments | 0 (0.0%) | 0 (0.0%) |
| 5 to 9 Unit Apartments | 0 (0.0%) | 0 (0.0%) |
| 10 or more Apartments | 0 (0.0%) | 0 (0.0%) |
| Mobile Home / Other | 107 (54.6%) | 89 (45.4%) |
| Total | 319 (74.7%) | 108 (25.3%) |
Housing Structures by Number of Rooms in Mesa del Caballo
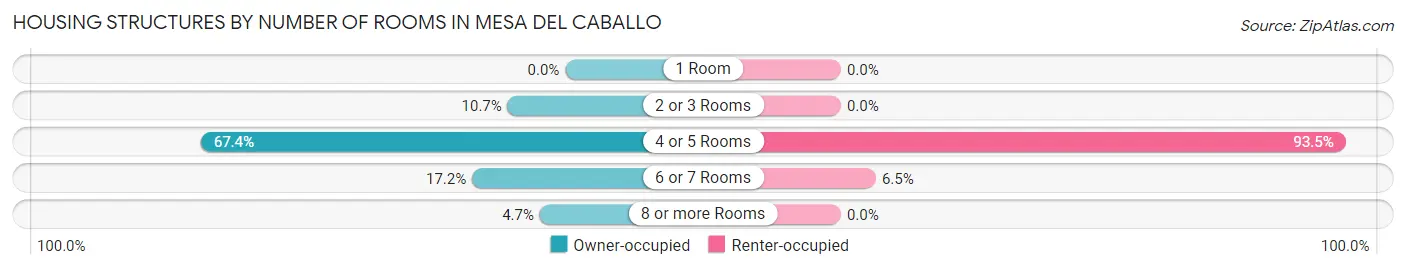
| Number of Rooms | Owner-occupied | Renter-occupied |
| 1 Room | 0 (0.0%) | 0 (0.0%) |
| 2 or 3 Rooms | 34 (10.7%) | 0 (0.0%) |
| 4 or 5 Rooms | 215 (67.4%) | 101 (93.5%) |
| 6 or 7 Rooms | 55 (17.2%) | 7 (6.5%) |
| 8 or more Rooms | 15 (4.7%) | 0 (0.0%) |
| Total | 319 (100.0%) | 108 (100.0%) |
Housing Structure by Heating Type in Mesa del Caballo
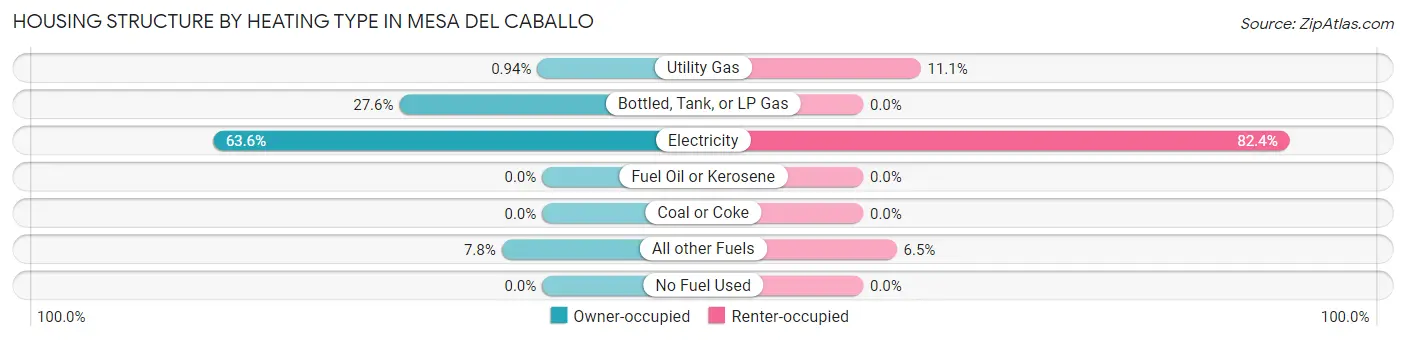
| Heating Type | Owner-occupied | Renter-occupied |
| Utility Gas | 3 (0.9%) | 12 (11.1%) |
| Bottled, Tank, or LP Gas | 88 (27.6%) | 0 (0.0%) |
| Electricity | 203 (63.6%) | 89 (82.4%) |
| Fuel Oil or Kerosene | 0 (0.0%) | 0 (0.0%) |
| Coal or Coke | 0 (0.0%) | 0 (0.0%) |
| All other Fuels | 25 (7.8%) | 7 (6.5%) |
| No Fuel Used | 0 (0.0%) | 0 (0.0%) |
| Total | 319 (100.0%) | 108 (100.0%) |
Household Vehicle Usage in Mesa del Caballo
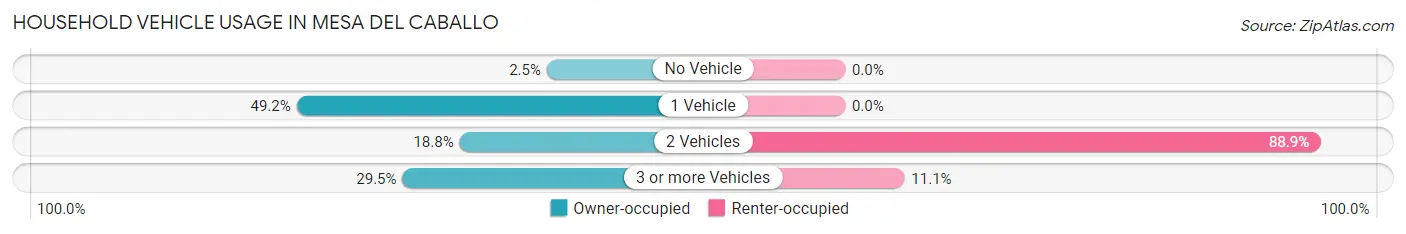
| Vehicles per Household | Owner-occupied | Renter-occupied |
| No Vehicle | 8 (2.5%) | 0 (0.0%) |
| 1 Vehicle | 157 (49.2%) | 0 (0.0%) |
| 2 Vehicles | 60 (18.8%) | 96 (88.9%) |
| 3 or more Vehicles | 94 (29.5%) | 12 (11.1%) |
| Total | 319 (100.0%) | 108 (100.0%) |
Real Estate & Mortgages in Mesa del Caballo
Real Estate and Mortgage Overview in Mesa del Caballo
| Characteristic | Without Mortgage | With Mortgage |
| Housing Units | 115 | 204 |
| Median Property Value | $179,600 | $230,600 |
| Median Household Income | - | - |
| Monthly Housing Costs | $396 | $0 |
| Real Estate Taxes | $793 | $9 |
Property Value by Mortgage Status in Mesa del Caballo
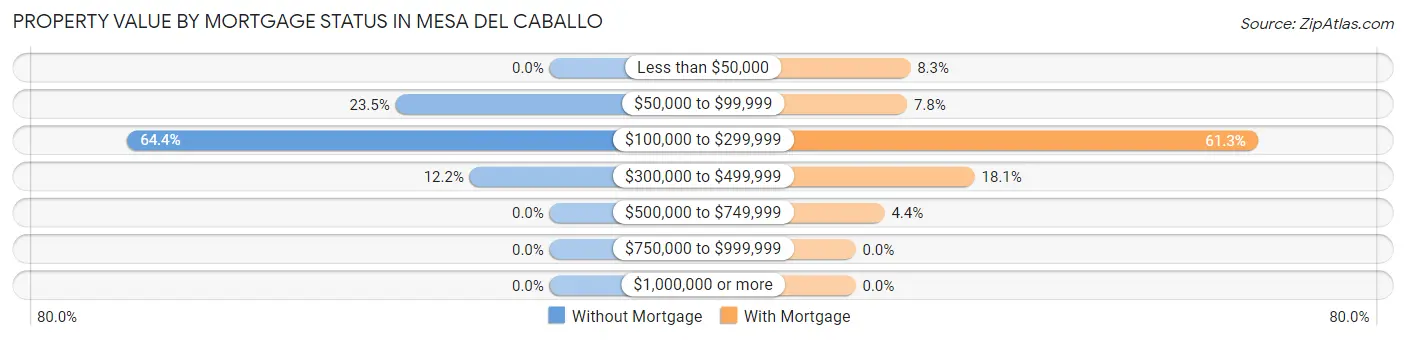
| Property Value | Without Mortgage | With Mortgage |
| Less than $50,000 | 0 (0.0%) | 17 (8.3%) |
| $50,000 to $99,999 | 27 (23.5%) | 16 (7.8%) |
| $100,000 to $299,999 | 74 (64.3%) | 125 (61.3%) |
| $300,000 to $499,999 | 14 (12.2%) | 37 (18.1%) |
| $500,000 to $749,999 | 0 (0.0%) | 9 (4.4%) |
| $750,000 to $999,999 | 0 (0.0%) | 0 (0.0%) |
| $1,000,000 or more | 0 (0.0%) | 0 (0.0%) |
| Total | 115 (100.0%) | 204 (100.0%) |
Household Income by Mortgage Status in Mesa del Caballo
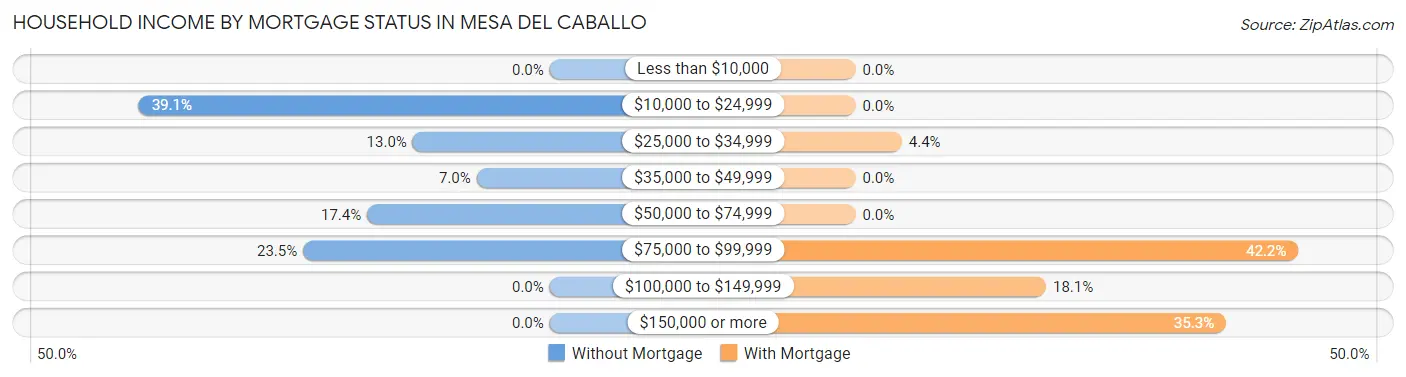
| Household Income | Without Mortgage | With Mortgage |
| Less than $10,000 | 0 (0.0%) | 0 (0.0%) |
| $10,000 to $24,999 | 45 (39.1%) | 0 (0.0%) |
| $25,000 to $34,999 | 15 (13.0%) | 9 (4.4%) |
| $35,000 to $49,999 | 8 (7.0%) | 0 (0.0%) |
| $50,000 to $74,999 | 20 (17.4%) | 0 (0.0%) |
| $75,000 to $99,999 | 27 (23.5%) | 86 (42.2%) |
| $100,000 to $149,999 | 0 (0.0%) | 37 (18.1%) |
| $150,000 or more | 0 (0.0%) | 72 (35.3%) |
| Total | 115 (100.0%) | 204 (100.0%) |
Property Value to Household Income Ratio in Mesa del Caballo
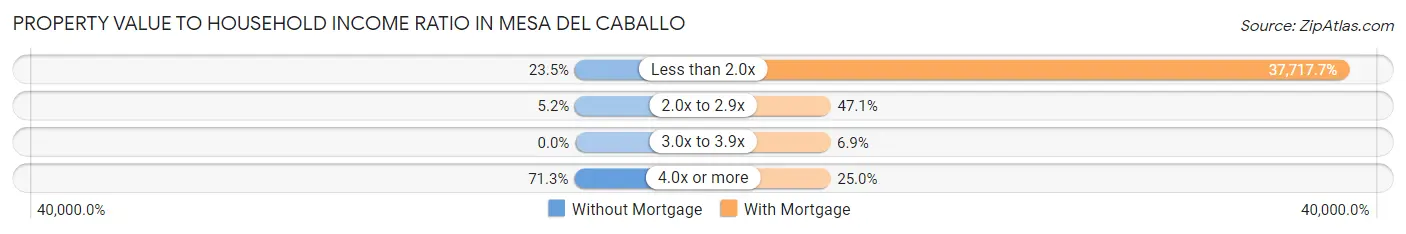
| Value-to-Income Ratio | Without Mortgage | With Mortgage |
| Less than 2.0x | 27 (23.5%) | 76,944 (37,717.6%) |
| 2.0x to 2.9x | 6 (5.2%) | 96 (47.1%) |
| 3.0x to 3.9x | 0 (0.0%) | 14 (6.9%) |
| 4.0x or more | 82 (71.3%) | 51 (25.0%) |
| Total | 115 (100.0%) | 204 (100.0%) |
Real Estate Taxes by Mortgage Status in Mesa del Caballo
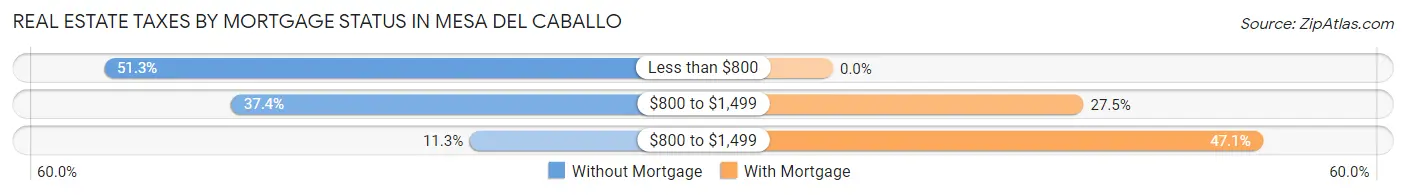
| Property Taxes | Without Mortgage | With Mortgage |
| Less than $800 | 59 (51.3%) | 0 (0.0%) |
| $800 to $1,499 | 43 (37.4%) | 56 (27.5%) |
| $800 to $1,499 | 13 (11.3%) | 96 (47.1%) |
| Total | 115 (100.0%) | 204 (100.0%) |
Health & Disability in Mesa del Caballo
Health Insurance Coverage by Age in Mesa del Caballo
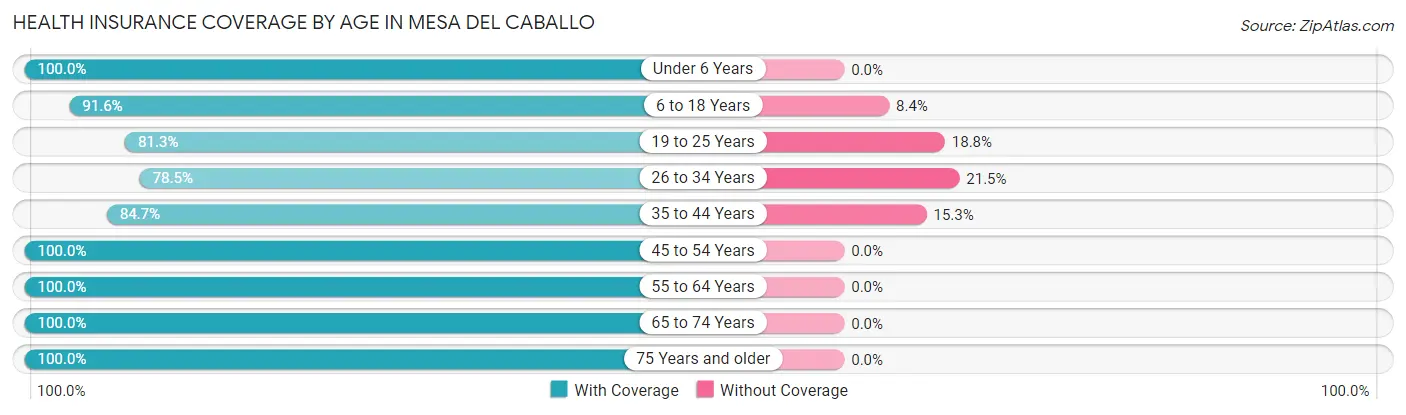
| Age Bracket | With Coverage | Without Coverage |
| Under 6 Years | 138 (100.0%) | 0 (0.0%) |
| 6 to 18 Years | 274 (91.6%) | 25 (8.4%) |
| 19 to 25 Years | 65 (81.2%) | 15 (18.8%) |
| 26 to 34 Years | 172 (78.5%) | 47 (21.5%) |
| 35 to 44 Years | 138 (84.7%) | 25 (15.3%) |
| 45 to 54 Years | 43 (100.0%) | 0 (0.0%) |
| 55 to 64 Years | 82 (100.0%) | 0 (0.0%) |
| 65 to 74 Years | 81 (100.0%) | 0 (0.0%) |
| 75 Years and older | 89 (100.0%) | 0 (0.0%) |
| Total | 1,082 (90.6%) | 112 (9.4%) |
Health Insurance Coverage by Citizenship Status in Mesa del Caballo
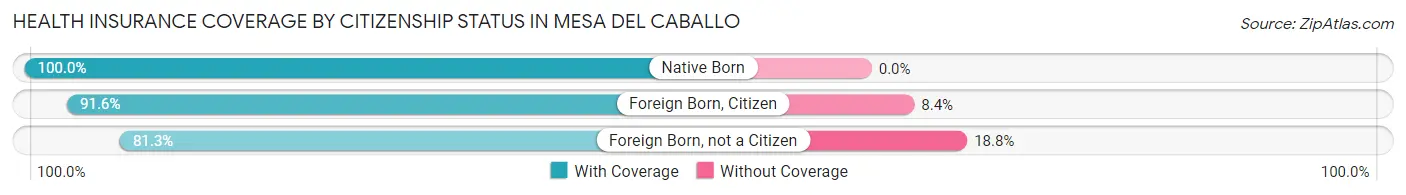
| Citizenship Status | With Coverage | Without Coverage |
| Native Born | 138 (100.0%) | 0 (0.0%) |
| Foreign Born, Citizen | 274 (91.6%) | 25 (8.4%) |
| Foreign Born, not a Citizen | 65 (81.2%) | 15 (18.8%) |
Health Insurance Coverage by Household Income in Mesa del Caballo
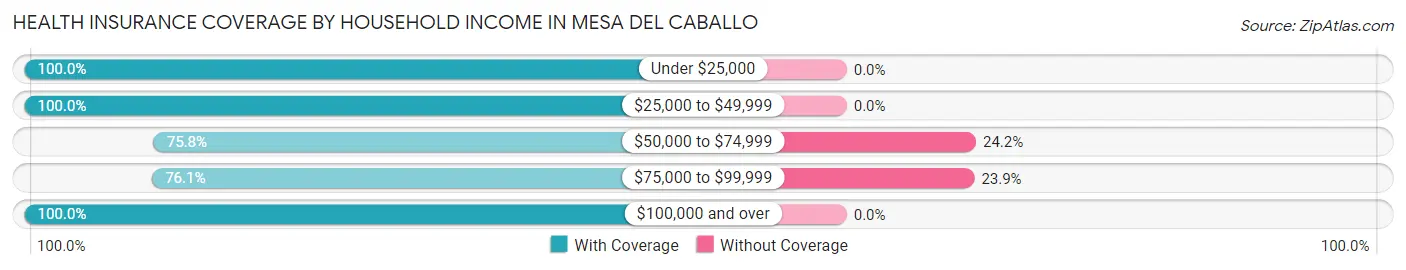
| Household Income | With Coverage | Without Coverage |
| Under $25,000 | 204 (100.0%) | 0 (0.0%) |
| $25,000 to $49,999 | 333 (100.0%) | 0 (0.0%) |
| $50,000 to $74,999 | 194 (75.8%) | 62 (24.2%) |
| $75,000 to $99,999 | 159 (76.1%) | 50 (23.9%) |
| $100,000 and over | 192 (100.0%) | 0 (0.0%) |
Public vs Private Health Insurance Coverage by Age in Mesa del Caballo
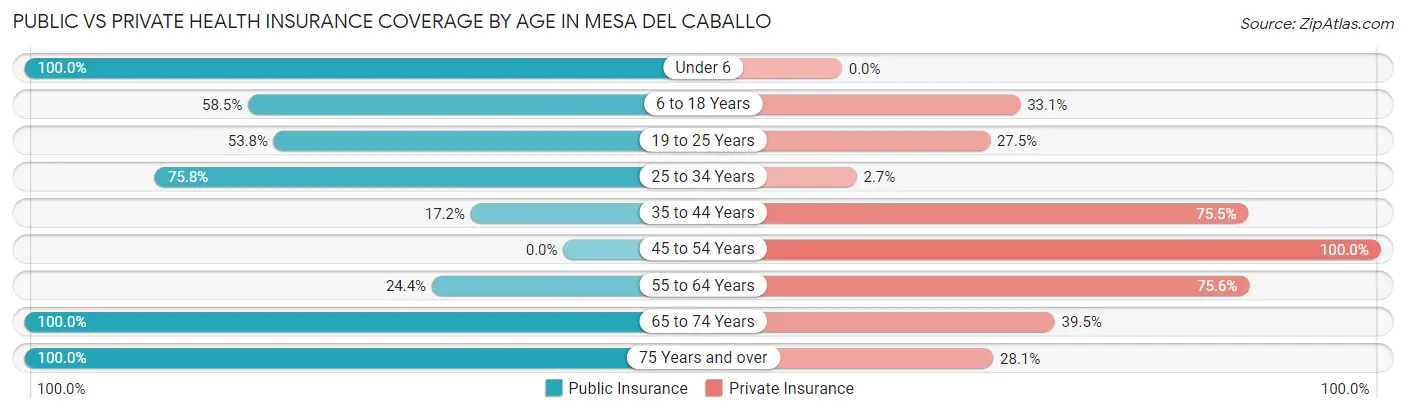
| Age Bracket | Public Insurance | Private Insurance |
| Under 6 | 138 (100.0%) | 0 (0.0%) |
| 6 to 18 Years | 175 (58.5%) | 99 (33.1%) |
| 19 to 25 Years | 43 (53.7%) | 22 (27.5%) |
| 25 to 34 Years | 166 (75.8%) | 6 (2.7%) |
| 35 to 44 Years | 28 (17.2%) | 123 (75.5%) |
| 45 to 54 Years | 0 (0.0%) | 43 (100.0%) |
| 55 to 64 Years | 20 (24.4%) | 62 (75.6%) |
| 65 to 74 Years | 81 (100.0%) | 32 (39.5%) |
| 75 Years and over | 89 (100.0%) | 25 (28.1%) |
| Total | 740 (62.0%) | 412 (34.5%) |
Disability Status by Sex by Age in Mesa del Caballo
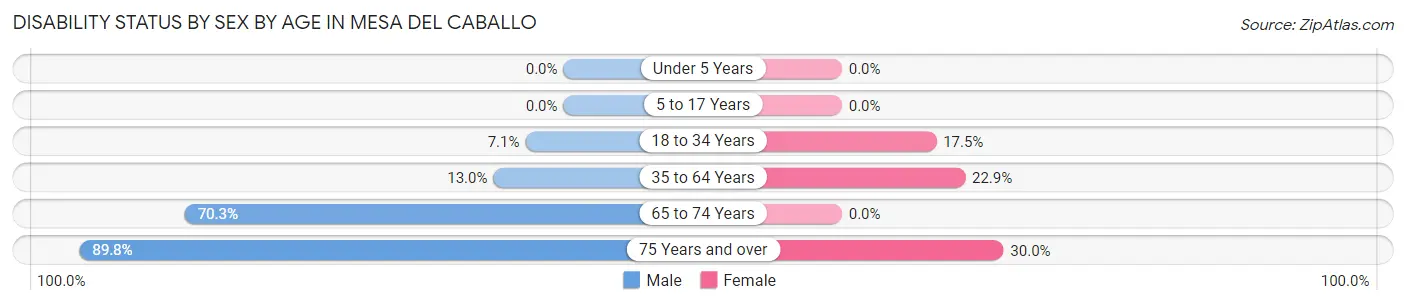
| Age Bracket | Male | Female |
| Under 5 Years | 0 (0.0%) | 0 (0.0%) |
| 5 to 17 Years | 0 (0.0%) | 0 (0.0%) |
| 18 to 34 Years | 12 (7.1%) | 24 (17.5%) |
| 35 to 64 Years | 13 (13.0%) | 43 (22.9%) |
| 65 to 74 Years | 26 (70.3%) | 0 (0.0%) |
| 75 Years and over | 53 (89.8%) | 9 (30.0%) |
Disability Class by Sex by Age in Mesa del Caballo
Disability Class: Hearing Difficulty
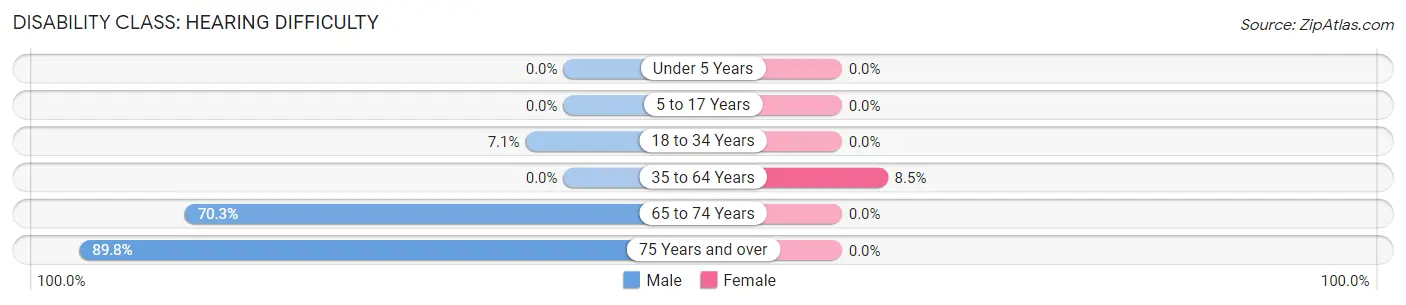
| Age Bracket | Male | Female |
| Under 5 Years | 0 (0.0%) | 0 (0.0%) |
| 5 to 17 Years | 0 (0.0%) | 0 (0.0%) |
| 18 to 34 Years | 12 (7.1%) | 0 (0.0%) |
| 35 to 64 Years | 0 (0.0%) | 16 (8.5%) |
| 65 to 74 Years | 26 (70.3%) | 0 (0.0%) |
| 75 Years and over | 53 (89.8%) | 0 (0.0%) |
Disability Class: Vision Difficulty
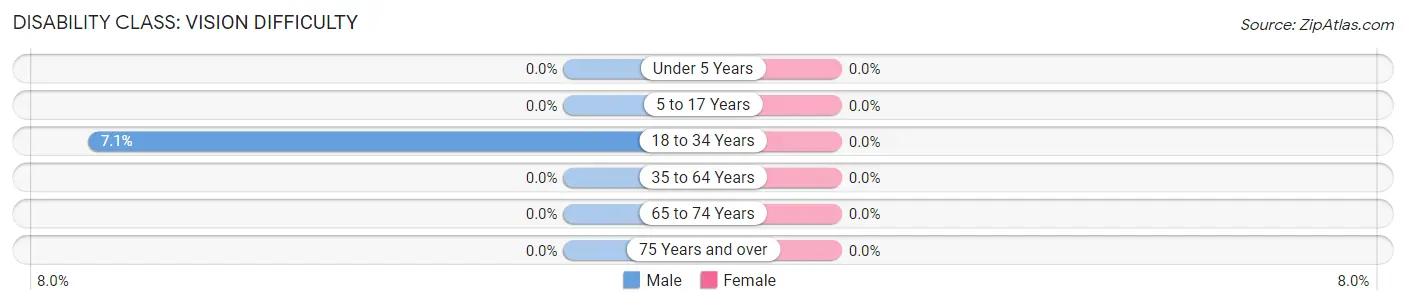
| Age Bracket | Male | Female |
| Under 5 Years | 0 (0.0%) | 0 (0.0%) |
| 5 to 17 Years | 0 (0.0%) | 0 (0.0%) |
| 18 to 34 Years | 12 (7.1%) | 0 (0.0%) |
| 35 to 64 Years | 0 (0.0%) | 0 (0.0%) |
| 65 to 74 Years | 0 (0.0%) | 0 (0.0%) |
| 75 Years and over | 0 (0.0%) | 0 (0.0%) |
Disability Class: Cognitive Difficulty
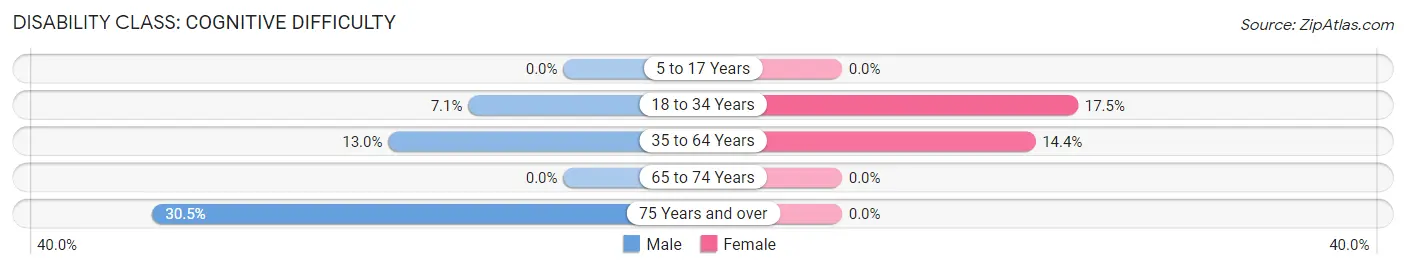
| Age Bracket | Male | Female |
| 5 to 17 Years | 0 (0.0%) | 0 (0.0%) |
| 18 to 34 Years | 12 (7.1%) | 24 (17.5%) |
| 35 to 64 Years | 13 (13.0%) | 27 (14.4%) |
| 65 to 74 Years | 0 (0.0%) | 0 (0.0%) |
| 75 Years and over | 18 (30.5%) | 0 (0.0%) |
Disability Class: Ambulatory Difficulty
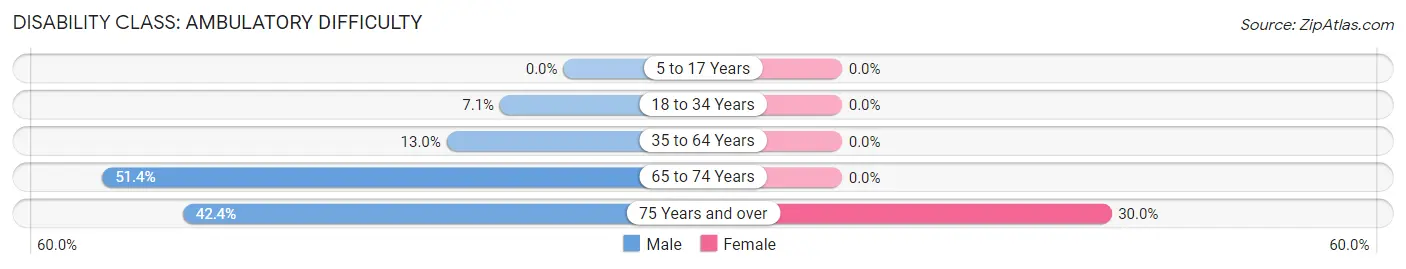
| Age Bracket | Male | Female |
| 5 to 17 Years | 0 (0.0%) | 0 (0.0%) |
| 18 to 34 Years | 12 (7.1%) | 0 (0.0%) |
| 35 to 64 Years | 13 (13.0%) | 0 (0.0%) |
| 65 to 74 Years | 19 (51.3%) | 0 (0.0%) |
| 75 Years and over | 25 (42.4%) | 9 (30.0%) |
Disability Class: Self-Care Difficulty
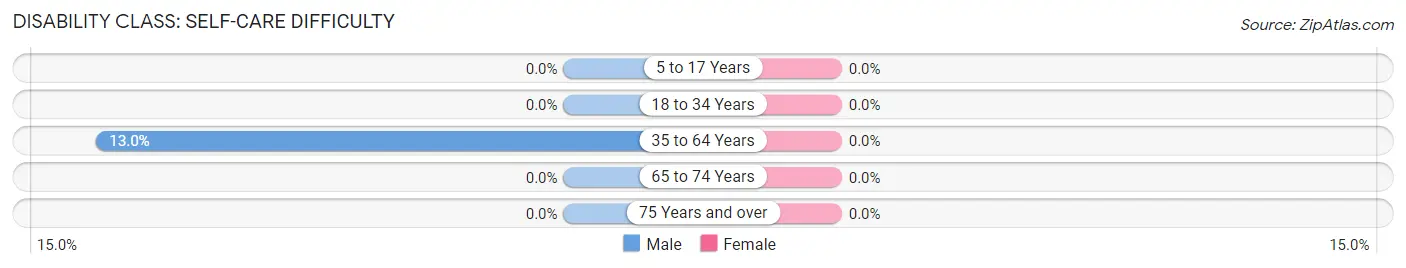
| Age Bracket | Male | Female |
| 5 to 17 Years | 0 (0.0%) | 0 (0.0%) |
| 18 to 34 Years | 0 (0.0%) | 0 (0.0%) |
| 35 to 64 Years | 13 (13.0%) | 0 (0.0%) |
| 65 to 74 Years | 0 (0.0%) | 0 (0.0%) |
| 75 Years and over | 0 (0.0%) | 0 (0.0%) |
Technology Access in Mesa del Caballo
Computing Device Access in Mesa del Caballo
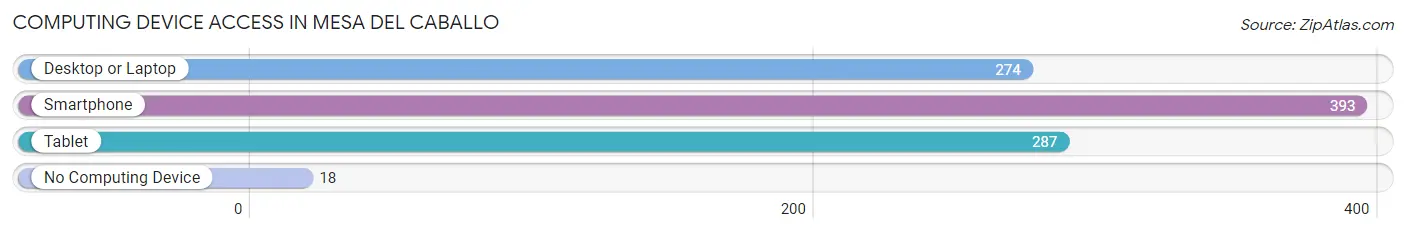
| Device Type | # Households | % Households |
| Desktop or Laptop | 274 | 64.2% |
| Smartphone | 393 | 92.0% |
| Tablet | 287 | 67.2% |
| No Computing Device | 18 | 4.2% |
| Total | 427 | 100.0% |
Internet Access in Mesa del Caballo
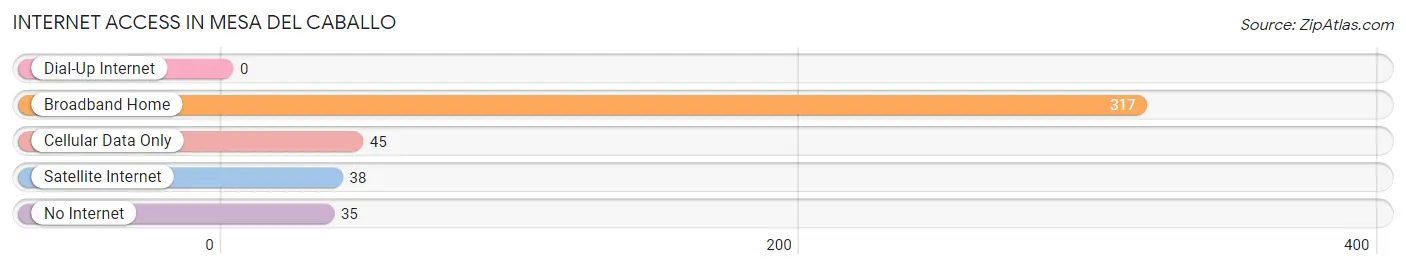
| Internet Type | # Households | % Households |
| Dial-Up Internet | 0 | 0.0% |
| Broadband Home | 317 | 74.2% |
| Cellular Data Only | 45 | 10.5% |
| Satellite Internet | 38 | 8.9% |
| No Internet | 35 | 8.2% |
| Total | 427 | 100.0% |
Mesa del Caballo Summary
Mesa Del Caballo is a small unincorporated community located in Gila County, Arizona. It is situated in the Tonto National Forest, approximately 25 miles east of Payson, Arizona. The community is located in the Mogollon Rim region of the state, and is surrounded by the Sierra Ancha Mountains. The area is known for its scenic beauty, and is a popular destination for outdoor recreation.
Geography
Mesa Del Caballo is located in the Mogollon Rim region of Arizona, at an elevation of 5,000 feet. The area is characterized by rolling hills, pine forests, and rocky outcroppings. The community is situated in the Tonto National Forest, and is surrounded by the Sierra Ancha Mountains. The area is known for its scenic beauty, and is a popular destination for outdoor recreation.
Climate
Mesa Del Caballo has a semi-arid climate, with hot summers and mild winters. The average high temperature in the summer is 90°F, and the average low temperature in the winter is 30°F. The area receives an average of 12 inches of precipitation per year, with most of it falling in the summer months.
Demographics
As of the 2010 census, the population of Mesa Del Caballo was 1,072. The population is primarily white (94.3%), with a small Hispanic population (4.3%). The median household income is $41,250, and the median age is 44.
Economy
Mesa Del Caballo is a small, rural community with a limited economy. The primary industries in the area are tourism and agriculture. The area is a popular destination for outdoor recreation, and is home to several campgrounds and hiking trails. The area is also known for its apple orchards, and is home to several small farms.
Conclusion
Mesa Del Caballo is a small, rural community located in the Mogollon Rim region of Arizona. The area is known for its scenic beauty, and is a popular destination for outdoor recreation. The population is primarily white, with a small Hispanic population. The primary industries in the area are tourism and agriculture. The area is home to several campgrounds and hiking trails, as well as several small farms.
Common Questions
What is Per Capita Income in Mesa del Caballo?
Per Capita income in Mesa del Caballo is $25,646.
What is the Median Family Income in Mesa del Caballo?
Median Family Income in Mesa del Caballo is $55,313.
What is the Median Household income in Mesa del Caballo?
Median Household Income in Mesa del Caballo is $65,313.
What is Income or Wage Gap in Mesa del Caballo?
Income or Wage Gap in Mesa del Caballo is 12.7%.
Women in Mesa del Caballo earn 87.3 cents for every dollar earned by a man.
What is Inequality or Gini Index in Mesa del Caballo?
Inequality or Gini Index in Mesa del Caballo is 0.32.
What is the Total Population of Mesa del Caballo?
Total Population of Mesa del Caballo is 1,194.
What is the Total Male Population of Mesa del Caballo?
Total Male Population of Mesa del Caballo is 556.
What is the Total Female Population of Mesa del Caballo?
Total Female Population of Mesa del Caballo is 638.
What is the Ratio of Males per 100 Females in Mesa del Caballo?
There are 87.15 Males per 100 Females in Mesa del Caballo.
What is the Ratio of Females per 100 Males in Mesa del Caballo?
There are 114.75 Females per 100 Males in Mesa del Caballo.
What is the Median Population Age in Mesa del Caballo?
Median Population Age in Mesa del Caballo is 29.6 Years.
What is the Average Family Size in Mesa del Caballo
Average Family Size in Mesa del Caballo is 3.1 People.
What is the Average Household Size in Mesa del Caballo
Average Household Size in Mesa del Caballo is 2.8 People.
How Large is the Labor Force in Mesa del Caballo?
There are 532 People in the Labor Forcein in Mesa del Caballo.
What is the Percentage of People in the Labor Force in Mesa del Caballo?
69.5% of People are in the Labor Force in Mesa del Caballo.
What is the Unemployment Rate in Mesa del Caballo?
Unemployment Rate in Mesa del Caballo is 4.9%.