Mayer, AZ Map & Demographics
Mayer Map
Mayer Overview
$34,270
PER CAPITA INCOME
$58,750
AVG FAMILY INCOME
$53,424
AVG HOUSEHOLD INCOME
11.8%
WAGE / INCOME GAP [ % ]
88.2¢/ $1
WAGE / INCOME GAP [ $ ]
0.33
INEQUALITY / GINI INDEX
920
TOTAL POPULATION
400
MALE POPULATION
520
FEMALE POPULATION
76.92
MALES / 100 FEMALES
130.00
FEMALES / 100 MALES
54.3
MEDIAN AGE
1.9
AVG FAMILY SIZE
1.4
AVG HOUSEHOLD SIZE
541
LABOR FORCE [ PEOPLE ]
60.9%
PERCENT IN LABOR FORCE
Mayer Zip Codes
Mayer Area Codes
Income in Mayer
Income Overview in Mayer
Per Capita Income in Mayer is $34,270, while median incomes of families and households are $58,750 and $53,424 respectively.
| Characteristic | Number | Measure |
| Per Capita Income | 920 | $34,270 |
| Median Family Income | 283 | $58,750 |
| Mean Family Income | 283 | $67,601 |
| Median Household Income | 637 | $53,424 |
| Mean Household Income | 637 | $51,342 |
| Income Deficit | 283 | $0 |
| Wage / Income Gap (%) | 920 | 11.79% |
| Wage / Income Gap ($) | 920 | 88.21¢ per $1 |
| Gini / Inequality Index | 920 | 0.33 |
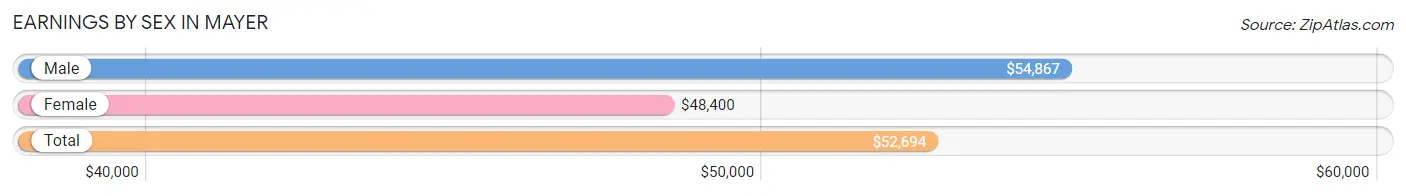
Earnings by Sex in Mayer
Average Earnings in Mayer are $52,694, $54,867 for men and $48,400 for women, a difference of 11.8%.
| Sex | Number | Average Earnings |
| Male | 249 (46.0%) | $54,867 |
| Female | 292 (54.0%) | $48,400 |
| Total | 541 (100.0%) | $52,694 |
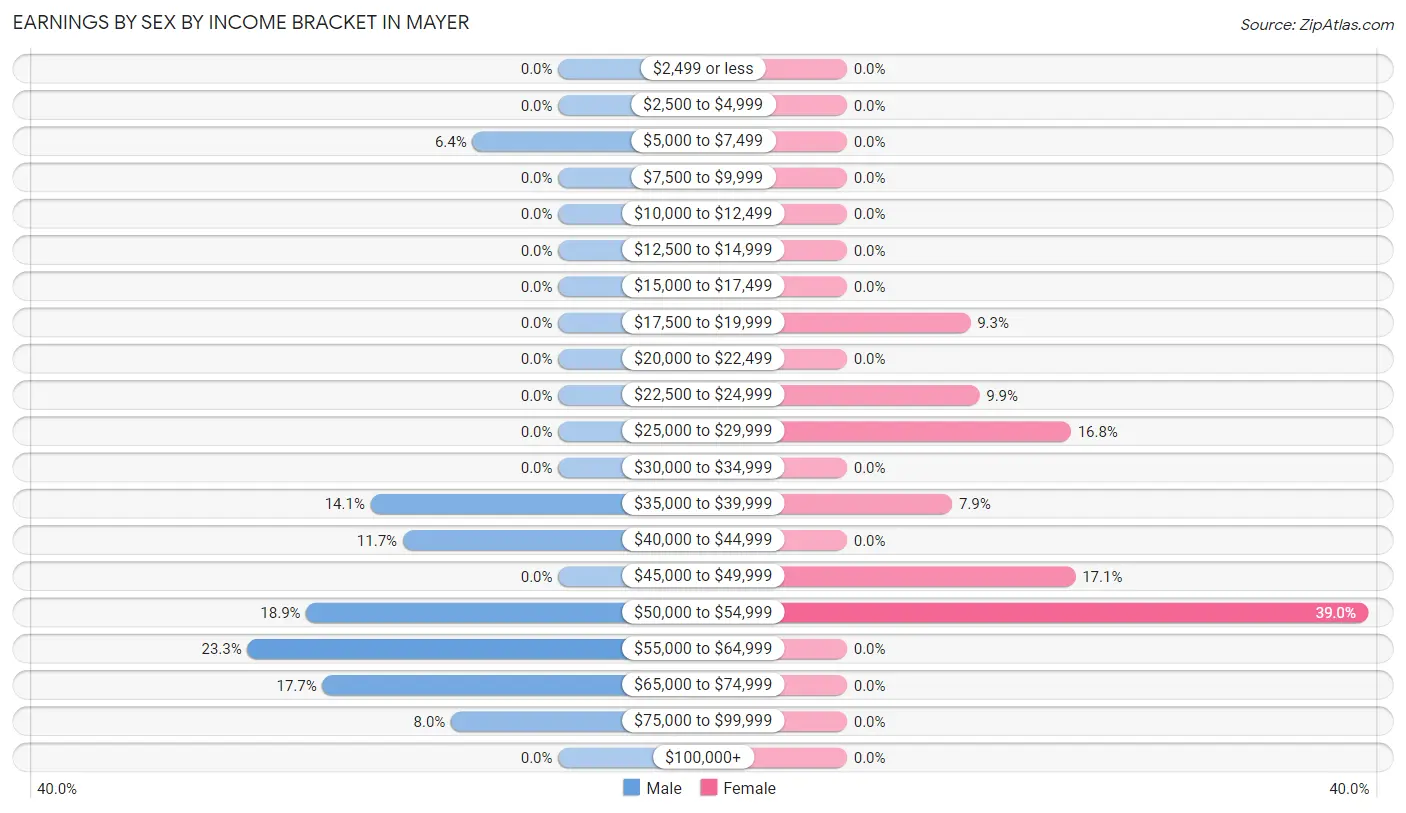
Earnings by Sex by Income Bracket in Mayer
The most common earnings brackets in Mayer are $55,000 to $64,999 for men (58 | 23.3%) and $50,000 to $54,999 for women (114 | 39.0%).
| Income | Male | Female |
| $2,499 or less | 0 (0.0%) | 0 (0.0%) |
| $2,500 to $4,999 | 0 (0.0%) | 0 (0.0%) |
| $5,000 to $7,499 | 16 (6.4%) | 0 (0.0%) |
| $7,500 to $9,999 | 0 (0.0%) | 0 (0.0%) |
| $10,000 to $12,499 | 0 (0.0%) | 0 (0.0%) |
| $12,500 to $14,999 | 0 (0.0%) | 0 (0.0%) |
| $15,000 to $17,499 | 0 (0.0%) | 0 (0.0%) |
| $17,500 to $19,999 | 0 (0.0%) | 27 (9.2%) |
| $20,000 to $22,499 | 0 (0.0%) | 0 (0.0%) |
| $22,500 to $24,999 | 0 (0.0%) | 29 (9.9%) |
| $25,000 to $29,999 | 0 (0.0%) | 49 (16.8%) |
| $30,000 to $34,999 | 0 (0.0%) | 0 (0.0%) |
| $35,000 to $39,999 | 35 (14.1%) | 23 (7.9%) |
| $40,000 to $44,999 | 29 (11.7%) | 0 (0.0%) |
| $45,000 to $49,999 | 0 (0.0%) | 50 (17.1%) |
| $50,000 to $54,999 | 47 (18.9%) | 114 (39.0%) |
| $55,000 to $64,999 | 58 (23.3%) | 0 (0.0%) |
| $65,000 to $74,999 | 44 (17.7%) | 0 (0.0%) |
| $75,000 to $99,999 | 20 (8.0%) | 0 (0.0%) |
| $100,000+ | 0 (0.0%) | 0 (0.0%) |
| Total | 249 (100.0%) | 292 (100.0%) |
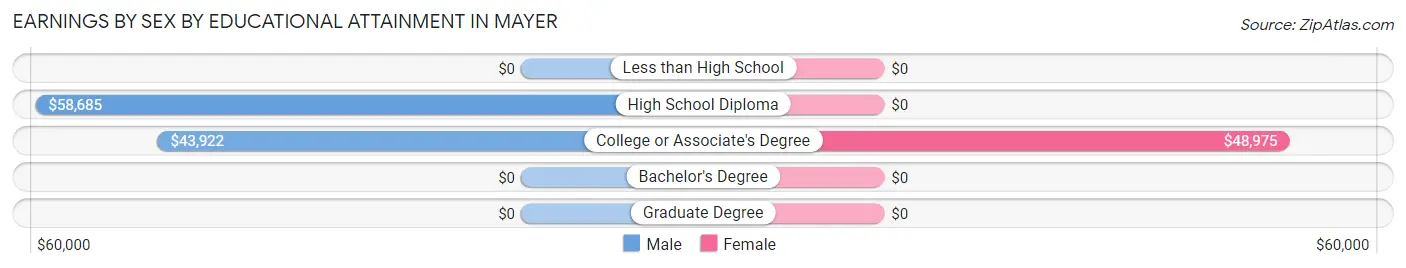
Earnings by Sex by Educational Attainment in Mayer
Average earnings in Mayer are $54,867 for men and $48,400 for women, a difference of 11.8%. Men with an educational attainment of high school diploma enjoy the highest average annual earnings of $58,685, while those with college or associate's degree education earn the least with $43,922. Women with an educational attainment of college or associate's degree earn the most with the average annual earnings of $48,975, while those with college or associate's degree education have the smallest earnings of $48,975.
| Educational Attainment | Male Income | Female Income |
| Less than High School | - | - |
| High School Diploma | $58,685 | $0 |
| College or Associate's Degree | $43,922 | $48,975 |
| Bachelor's Degree | - | - |
| Graduate Degree | - | - |
| Total | $54,867 | $48,400 |
Family Income in Mayer
Family Income Brackets in Mayer
According to the Mayer family income data, there are 81 families falling into the $100,000 to $149,999 income range, which is the most common income bracket and makes up 28.6% of all families.
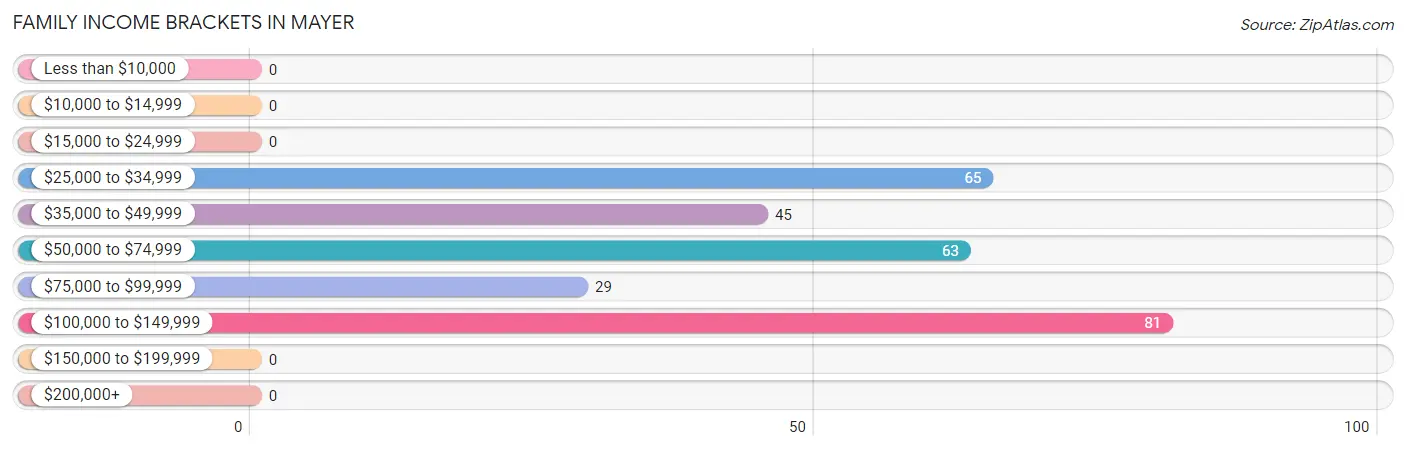
| Income Bracket | # Families | % Families |
| Less than $10,000 | 0 | 0.0% |
| $10,000 to $14,999 | 0 | 0.0% |
| $15,000 to $24,999 | 0 | 0.0% |
| $25,000 to $34,999 | 65 | 23.0% |
| $35,000 to $49,999 | 45 | 15.9% |
| $50,000 to $74,999 | 63 | 22.3% |
| $75,000 to $99,999 | 29 | 10.2% |
| $100,000 to $149,999 | 81 | 28.6% |
| $150,000 to $199,999 | 0 | 0.0% |
| $200,000+ | 0 | 0.0% |
Family Income by Famaliy Size in Mayer
2-person families (283 | 100.0%) account for the highest median family income in Mayer with $58,750 per family, while 2-person families (283 | 100.0%) have the highest median income of $29,375 per family member.
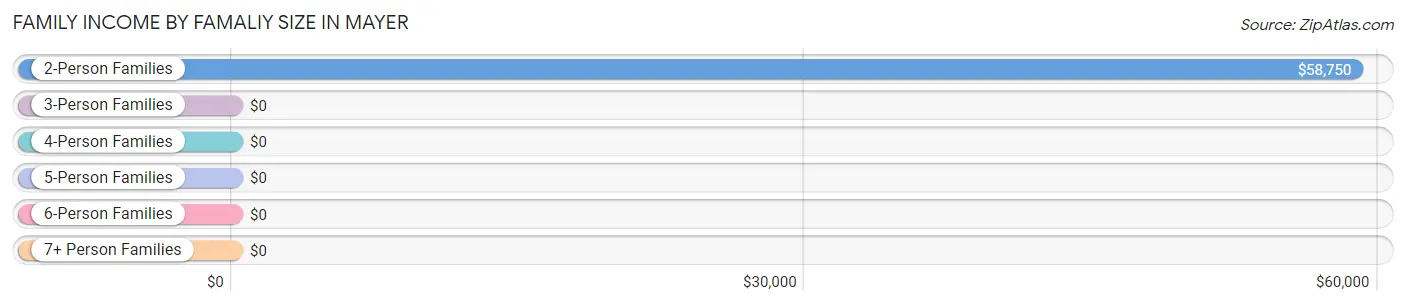
| Income Bracket | # Families | Median Income |
| 2-Person Families | 283 (100.0%) | $58,750 |
| 3-Person Families | 0 (0.0%) | $0 |
| 4-Person Families | 0 (0.0%) | $0 |
| 5-Person Families | 0 (0.0%) | $0 |
| 6-Person Families | 0 (0.0%) | $0 |
| 7+ Person Families | 0 (0.0%) | $0 |
| Total | 283 (100.0%) | $58,750 |
Family Income by Number of Earners in Mayer
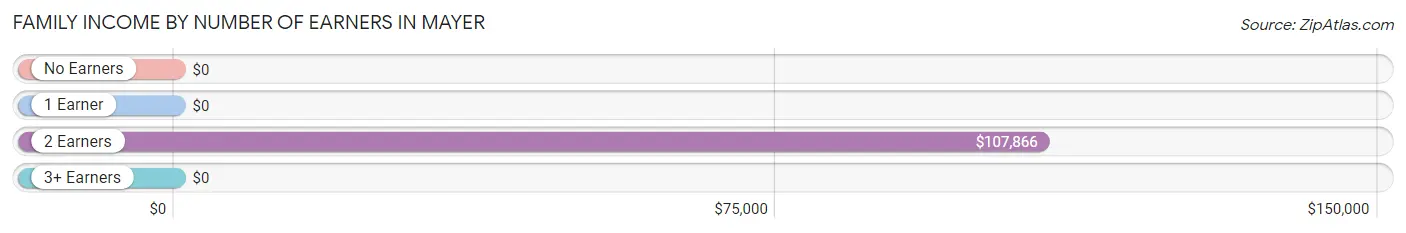
| Number of Earners | # Families | Median Income |
| No Earners | 73 (25.8%) | $0 |
| 1 Earner | 65 (23.0%) | $0 |
| 2 Earners | 145 (51.2%) | $107,866 |
| 3+ Earners | 0 (0.0%) | $0 |
| Total | 283 (100.0%) | $58,750 |
Household Income in Mayer
Household Income Brackets in Mayer
With 268 households falling in the category, the $50,000 to $74,999 income range is the most frequent in Mayer, accounting for 42.1% of all households.
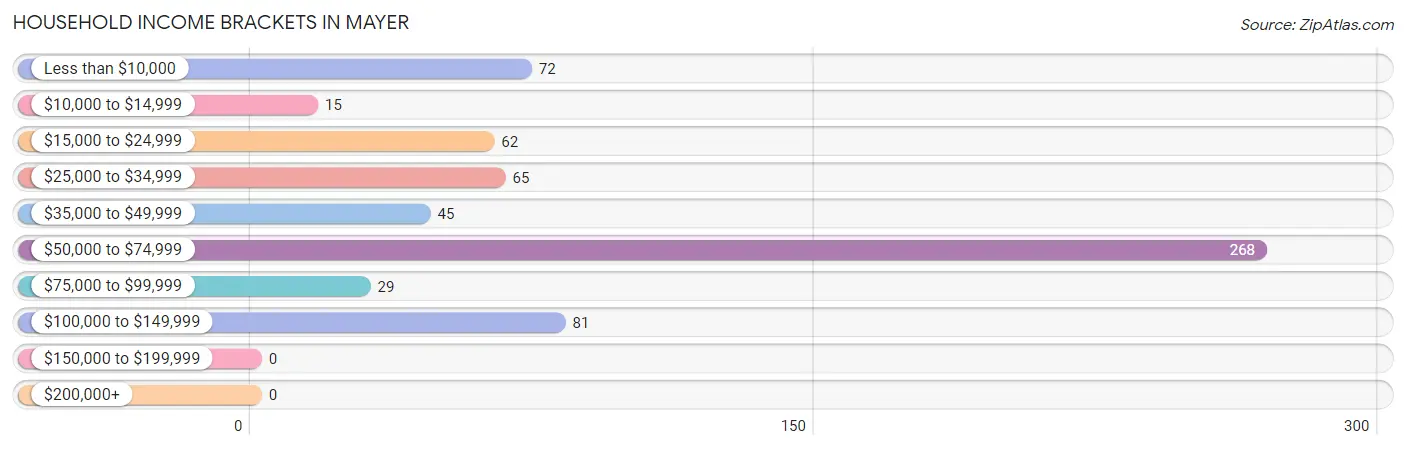
| Income Bracket | # Households | % Households |
| Less than $10,000 | 72 | 11.3% |
| $10,000 to $14,999 | 15 | 2.4% |
| $15,000 to $24,999 | 62 | 9.7% |
| $25,000 to $34,999 | 65 | 10.2% |
| $35,000 to $49,999 | 45 | 7.1% |
| $50,000 to $74,999 | 268 | 42.1% |
| $75,000 to $99,999 | 29 | 4.6% |
| $100,000 to $149,999 | 81 | 12.7% |
| $150,000 to $199,999 | 0 | 0.0% |
| $200,000+ | 0 | 0.0% |
Household Income by Householder Age in Mayer
The median household income in Mayer is $53,424, with the highest median household income of $54,581 found in the 45 to 64 years age bracket for the primary householder. A total of 386 households (60.6%) fall into this category.
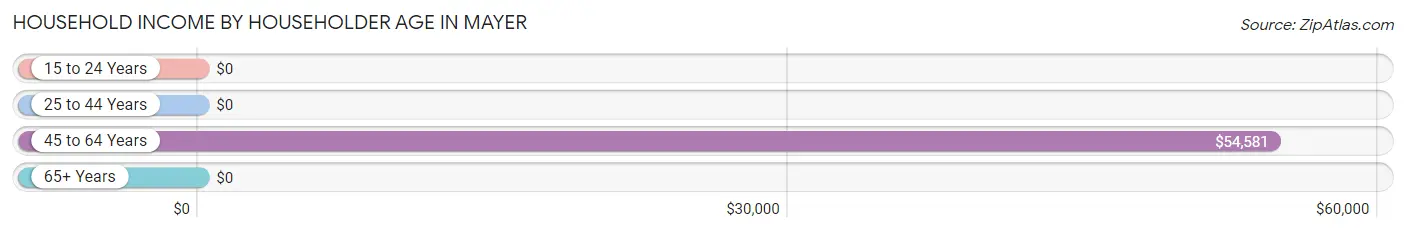
| Income Bracket | # Households | Median Income |
| 15 to 24 Years | 0 (0.0%) | $0 |
| 25 to 44 Years | 23 (3.6%) | $0 |
| 45 to 64 Years | 386 (60.6%) | $54,581 |
| 65+ Years | 228 (35.8%) | $0 |
| Total | 637 (100.0%) | $53,424 |
Poverty in Mayer
Income Below Poverty by Sex and Age in Mayer
With 15.2% poverty level for males and 10.4% for females among the residents of Mayer, 65 to 74 year old males and 75 year old and over females are the most vulnerable to poverty, with 18 males (28.1%) and 54 females (100.0%) in their respective age groups living below the poverty level.
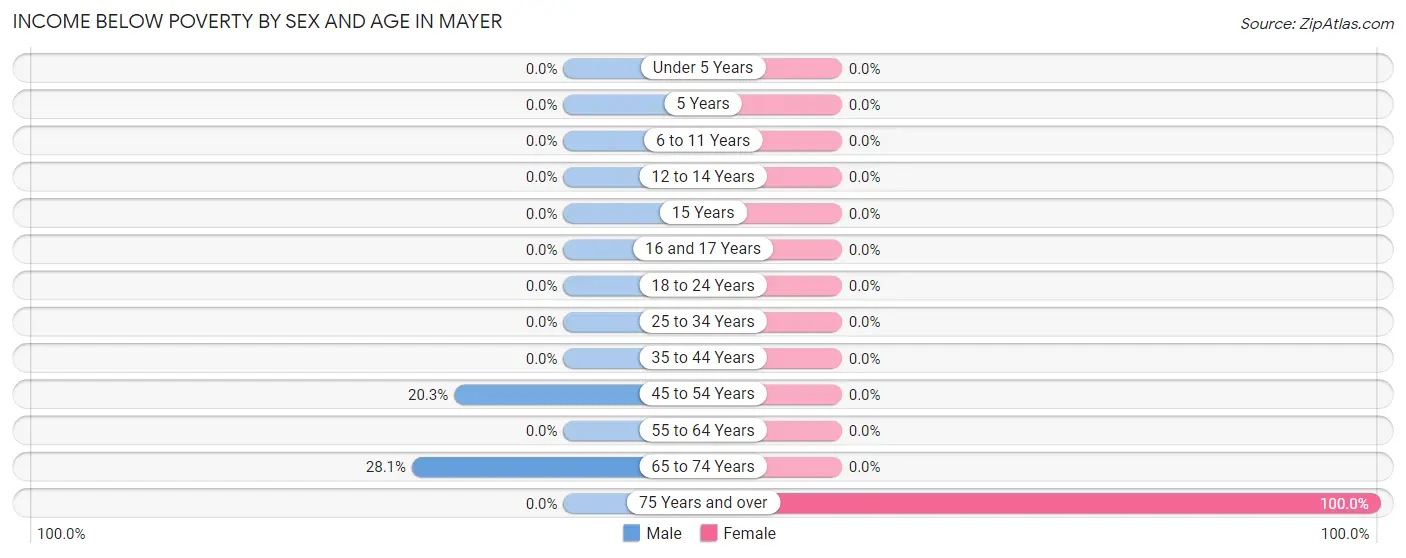
| Age Bracket | Male | Female |
| Under 5 Years | 0 (0.0%) | 0 (0.0%) |
| 5 Years | 0 (0.0%) | 0 (0.0%) |
| 6 to 11 Years | 0 (0.0%) | 0 (0.0%) |
| 12 to 14 Years | 0 (0.0%) | 0 (0.0%) |
| 15 Years | 0 (0.0%) | 0 (0.0%) |
| 16 and 17 Years | 0 (0.0%) | 0 (0.0%) |
| 18 to 24 Years | 0 (0.0%) | 0 (0.0%) |
| 25 to 34 Years | 0 (0.0%) | 0 (0.0%) |
| 35 to 44 Years | 0 (0.0%) | 0 (0.0%) |
| 45 to 54 Years | 43 (20.3%) | 0 (0.0%) |
| 55 to 64 Years | 0 (0.0%) | 0 (0.0%) |
| 65 to 74 Years | 18 (28.1%) | 0 (0.0%) |
| 75 Years and over | 0 (0.0%) | 54 (100.0%) |
| Total | 61 (15.2%) | 54 (10.4%) |
Income Above Poverty by Sex and Age in Mayer
According to the poverty statistics in Mayer, males aged 55 to 64 years and females aged 6 to 11 years are the age groups that are most secure financially, with 100.0% of males and 100.0% of females in these age groups living above the poverty line.
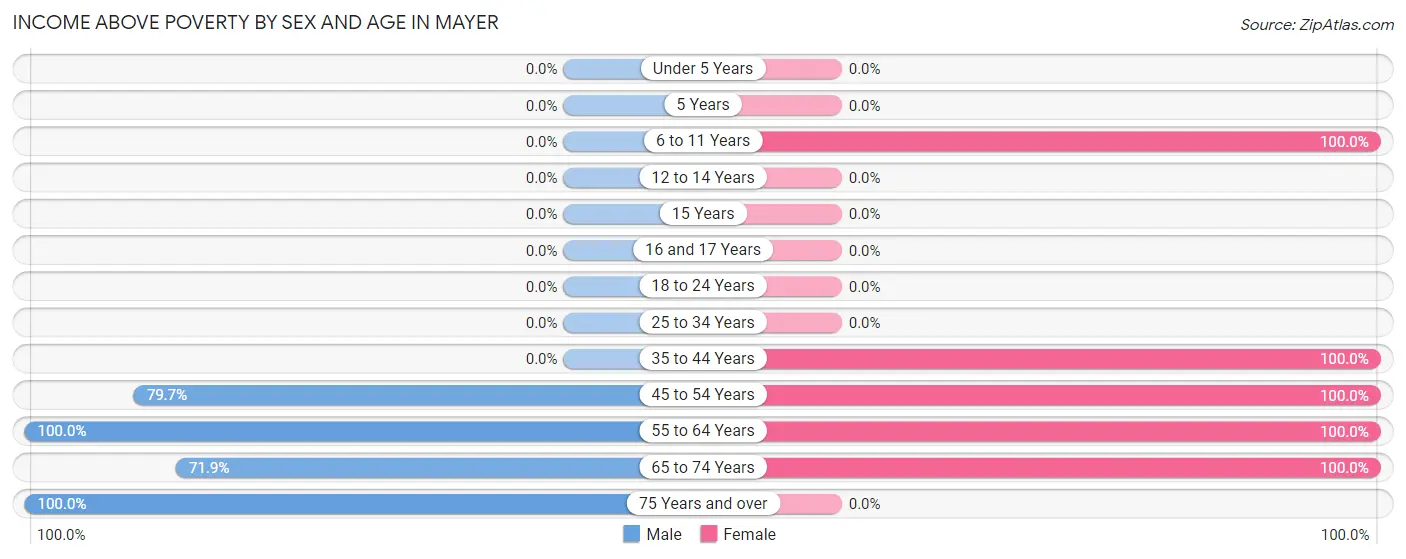
| Age Bracket | Male | Female |
| Under 5 Years | 0 (0.0%) | 0 (0.0%) |
| 5 Years | 0 (0.0%) | 0 (0.0%) |
| 6 to 11 Years | 0 (0.0%) | 31 (100.0%) |
| 12 to 14 Years | 0 (0.0%) | 0 (0.0%) |
| 15 Years | 0 (0.0%) | 0 (0.0%) |
| 16 and 17 Years | 0 (0.0%) | 0 (0.0%) |
| 18 to 24 Years | 0 (0.0%) | 0 (0.0%) |
| 25 to 34 Years | 0 (0.0%) | 0 (0.0%) |
| 35 to 44 Years | 0 (0.0%) | 23 (100.0%) |
| 45 to 54 Years | 169 (79.7%) | 242 (100.0%) |
| 55 to 64 Years | 64 (100.0%) | 44 (100.0%) |
| 65 to 74 Years | 46 (71.9%) | 126 (100.0%) |
| 75 Years and over | 60 (100.0%) | 0 (0.0%) |
| Total | 339 (84.8%) | 466 (89.6%) |
Income Below Poverty Among Married-Couple Families in Mayer
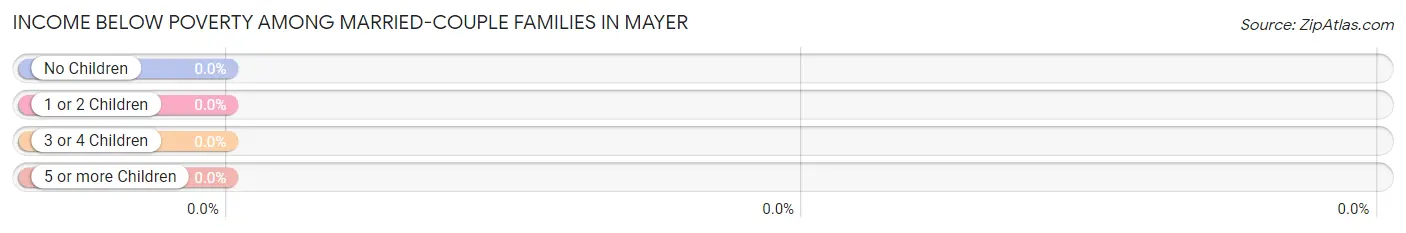
| Children | Above Poverty | Below Poverty |
| No Children | 234 (100.0%) | 0 (0.0%) |
| 1 or 2 Children | 0 (0.0%) | 0 (0.0%) |
| 3 or 4 Children | 0 (0.0%) | 0 (0.0%) |
| 5 or more Children | 0 (0.0%) | 0 (0.0%) |
| Total | 234 (100.0%) | 0 (0.0%) |
Income Below Poverty Among Single-Parent Households in Mayer
| Children | Single Father | Single Mother |
| No Children | 0 (0.0%) | 0 (0.0%) |
| 1 or 2 Children | 0 (0.0%) | 0 (0.0%) |
| 3 or 4 Children | 0 (0.0%) | 0 (0.0%) |
| 5 or more Children | 0 (0.0%) | 0 (0.0%) |
| Total | 0 (0.0%) | 0 (0.0%) |
Income Below Poverty Among Married-Couple vs Single-Parent Households in Mayer
| Children | Married-Couple Families | Single-Parent Households |
| No Children | 0 (0.0%) | 0 (0.0%) |
| 1 or 2 Children | 0 (0.0%) | 0 (0.0%) |
| 3 or 4 Children | 0 (0.0%) | 0 (0.0%) |
| 5 or more Children | 0 (0.0%) | 0 (0.0%) |
| Total | 0 (0.0%) | 0 (0.0%) |
Race in Mayer
The most populous races in Mayer are White / Caucasian (862 | 93.7%), Hispanic or Latino (81 | 8.8%), and Two or more Races (58 | 6.3%).
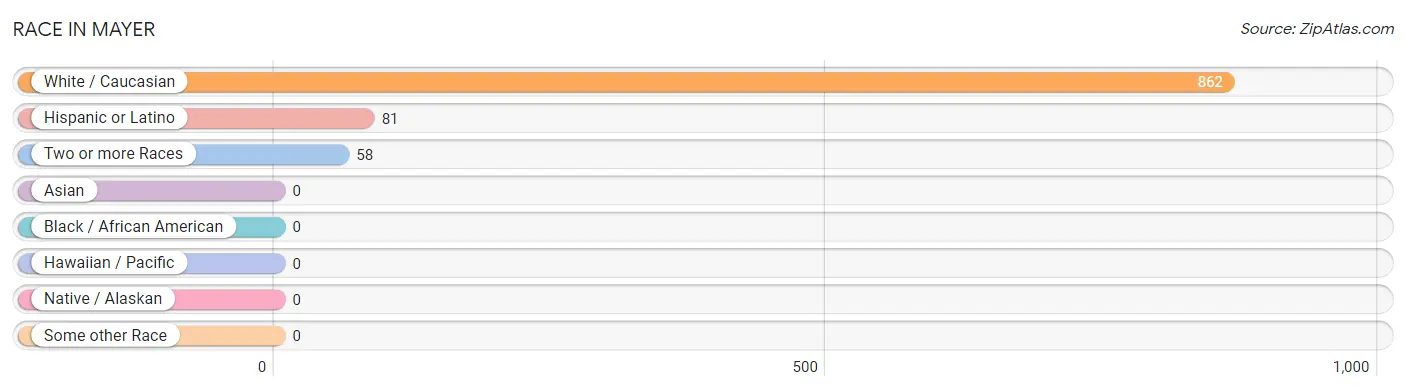
| Race | # Population | % Population |
| Asian | 0 | 0.0% |
| Black / African American | 0 | 0.0% |
| Hawaiian / Pacific | 0 | 0.0% |
| Hispanic or Latino | 81 | 8.8% |
| Native / Alaskan | 0 | 0.0% |
| White / Caucasian | 862 | 93.7% |
| Two or more Races | 58 | 6.3% |
| Some other Race | 0 | 0.0% |
| Total | 920 | 100.0% |
Ancestry in Mayer
The most populous ancestries reported in Mayer are Irish (203 | 22.1%), German (194 | 21.1%), French (73 | 7.9%), Italian (64 | 7.0%), and Mexican (58 | 6.3%), together accounting for 64.3% of all Mayer residents.
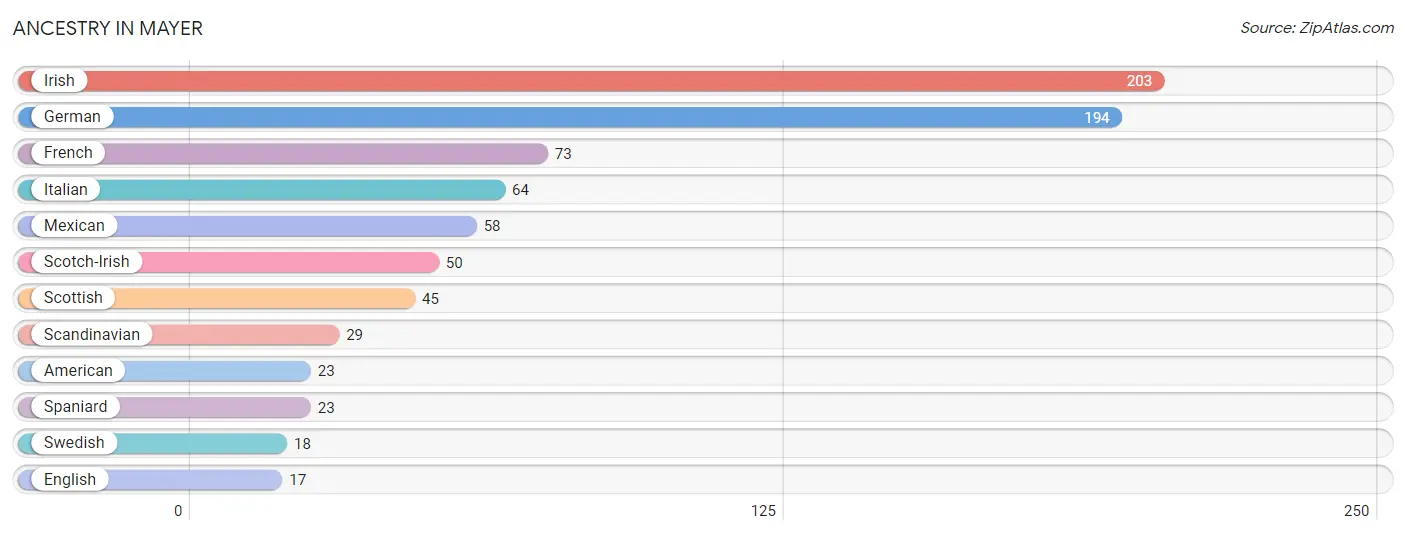
| Ancestry | # Population | % Population |
| American | 23 | 2.5% |
| English | 17 | 1.8% |
| French | 73 | 7.9% |
| German | 194 | 21.1% |
| Irish | 203 | 22.1% |
| Italian | 64 | 7.0% |
| Mexican | 58 | 6.3% |
| Scandinavian | 29 | 3.2% |
| Scotch-Irish | 50 | 5.4% |
| Scottish | 45 | 4.9% |
| Spaniard | 23 | 2.5% |
| Swedish | 18 | 2.0% | View All 12 Rows |
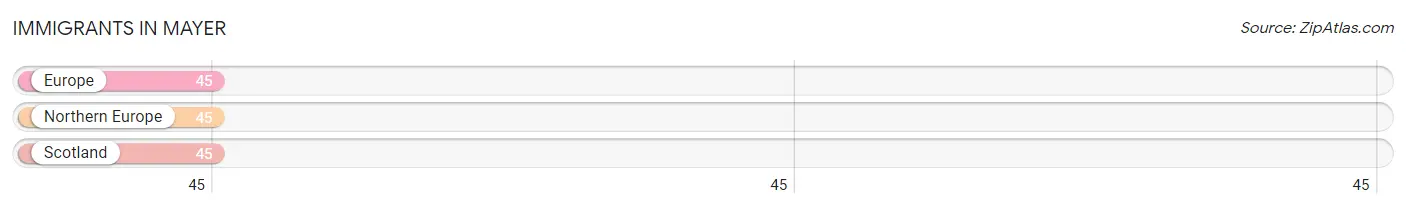
Immigrants in Mayer
The most numerous immigrant groups reported in Mayer came from Europe (45 | 4.9%), Northern Europe (45 | 4.9%), and Scotland (45 | 4.9%), together accounting for 14.7% of all Mayer residents.
| Immigration Origin | # Population | % Population |
| Europe | 45 | 4.9% |
| Northern Europe | 45 | 4.9% |
| Scotland | 45 | 4.9% | View All 3 Rows |
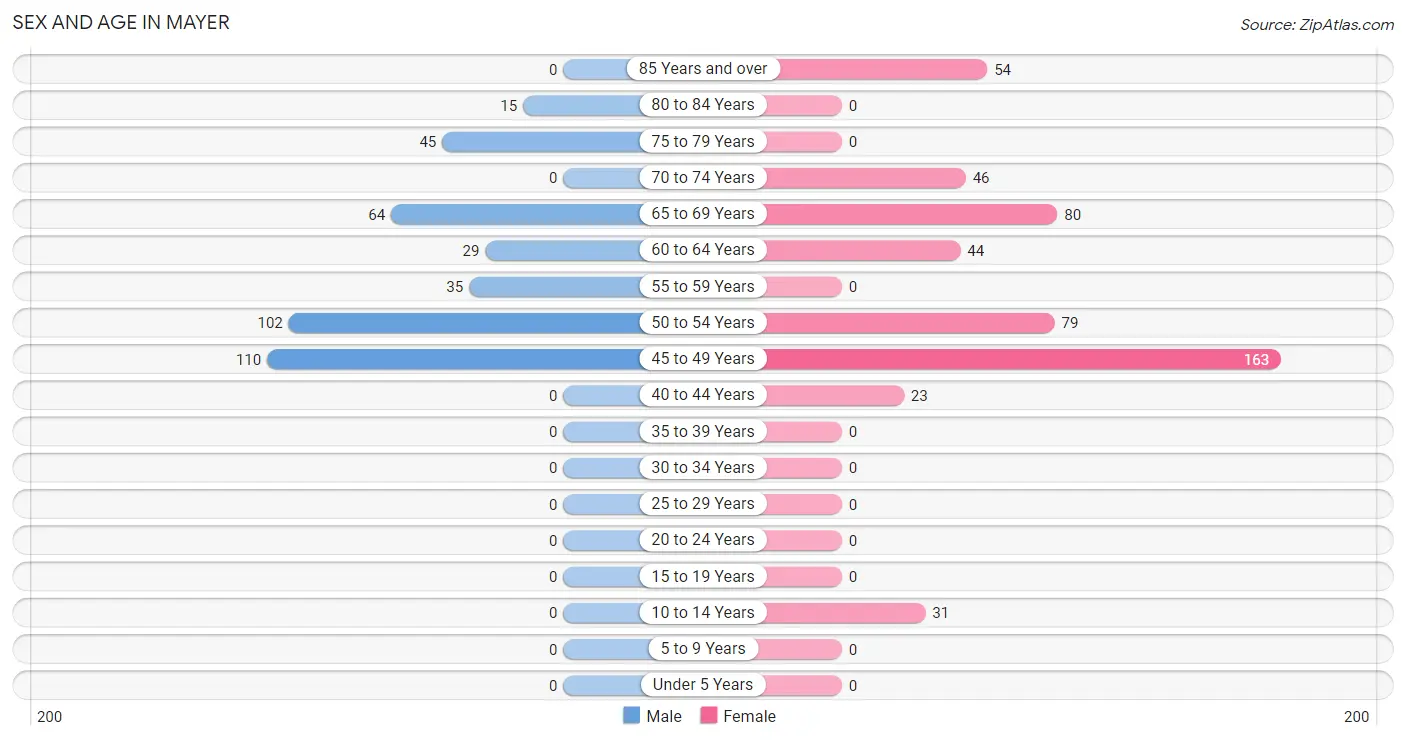
Sex and Age in Mayer
Sex and Age in Mayer
The most populous age groups in Mayer are 45 to 49 Years (110 | 27.5%) for men and 45 to 49 Years (163 | 31.4%) for women.
| Age Bracket | Male | Female |
| Under 5 Years | 0 (0.0%) | 0 (0.0%) |
| 5 to 9 Years | 0 (0.0%) | 0 (0.0%) |
| 10 to 14 Years | 0 (0.0%) | 31 (6.0%) |
| 15 to 19 Years | 0 (0.0%) | 0 (0.0%) |
| 20 to 24 Years | 0 (0.0%) | 0 (0.0%) |
| 25 to 29 Years | 0 (0.0%) | 0 (0.0%) |
| 30 to 34 Years | 0 (0.0%) | 0 (0.0%) |
| 35 to 39 Years | 0 (0.0%) | 0 (0.0%) |
| 40 to 44 Years | 0 (0.0%) | 23 (4.4%) |
| 45 to 49 Years | 110 (27.5%) | 163 (31.4%) |
| 50 to 54 Years | 102 (25.5%) | 79 (15.2%) |
| 55 to 59 Years | 35 (8.7%) | 0 (0.0%) |
| 60 to 64 Years | 29 (7.2%) | 44 (8.5%) |
| 65 to 69 Years | 64 (16.0%) | 80 (15.4%) |
| 70 to 74 Years | 0 (0.0%) | 46 (8.8%) |
| 75 to 79 Years | 45 (11.3%) | 0 (0.0%) |
| 80 to 84 Years | 15 (3.7%) | 0 (0.0%) |
| 85 Years and over | 0 (0.0%) | 54 (10.4%) |
| Total | 400 (100.0%) | 520 (100.0%) |
Families and Households in Mayer
Median Family Size in Mayer
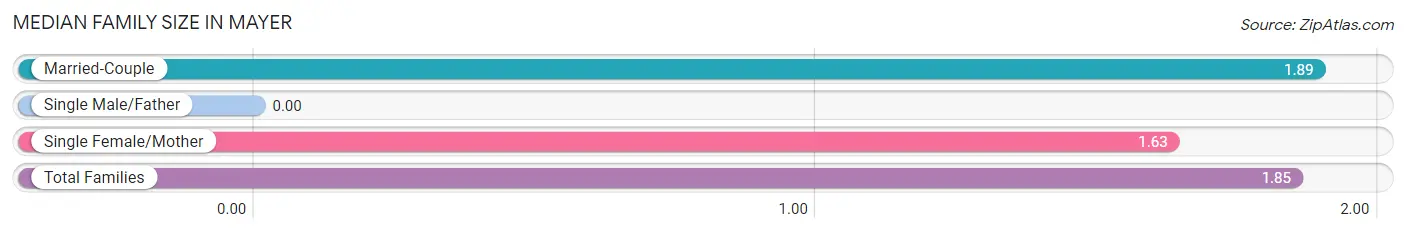
| Family Type | # Families | Family Size |
| Married-Couple | 234 (82.7%) | 1.89 |
| Single Male/Father | 0 (0.0%) | - |
| Single Female/Mother | 49 (17.3%) | 1.63 |
| Total Families | 283 (100.0%) | 1.85 |
Median Household Size in Mayer
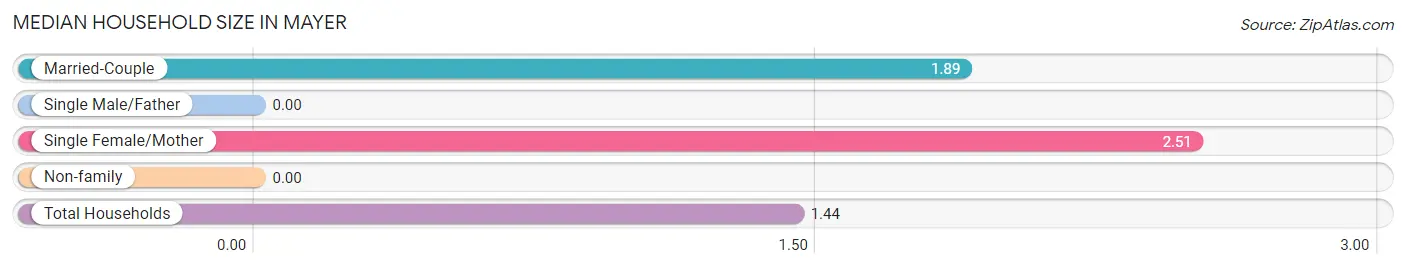
| Household Type | # Households | Household Size |
| Married-Couple | 234 (36.7%) | 1.89 |
| Single Male/Father | 0 (0.0%) | - |
| Single Female/Mother | 49 (7.7%) | 2.51 |
| Non-family | 354 (55.6%) | - |
| Total Households | 637 (100.0%) | 1.44 |
Household Size by Marriage Status in Mayer
Out of a total of 637 households in Mayer, 283 (44.4%) are family households, while 354 (55.6%) are nonfamily households. The most numerous type of family households are 2-person households, comprising 234, and the most common type of nonfamily households are 1-person households, comprising 354.
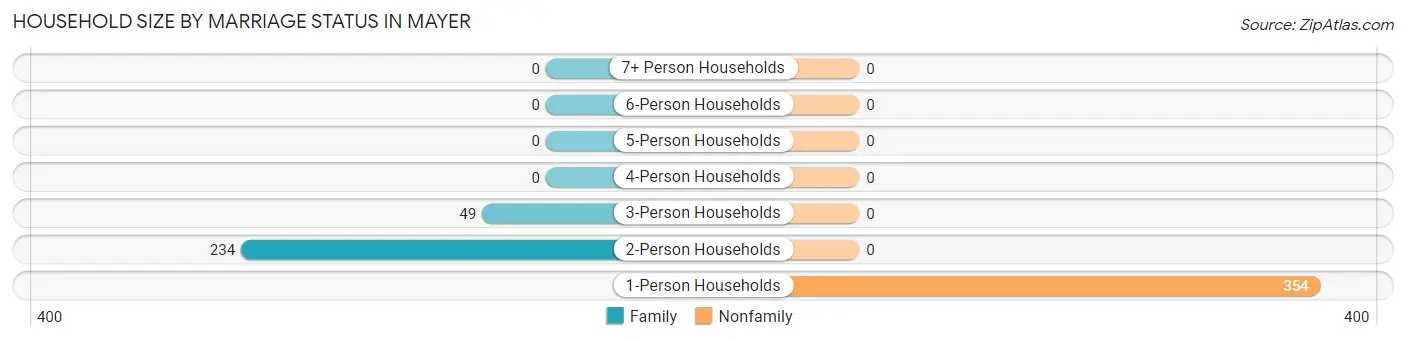
| Household Size | Family Households | Nonfamily Households |
| 1-Person Households | - | 354 (55.6%) |
| 2-Person Households | 234 (36.7%) | 0 (0.0%) |
| 3-Person Households | 49 (7.7%) | 0 (0.0%) |
| 4-Person Households | 0 (0.0%) | 0 (0.0%) |
| 5-Person Households | 0 (0.0%) | 0 (0.0%) |
| 6-Person Households | 0 (0.0%) | 0 (0.0%) |
| 7+ Person Households | 0 (0.0%) | 0 (0.0%) |
| Total | 283 (44.4%) | 354 (55.6%) |
Female Fertility in Mayer
Fertility by Age in Mayer
| Age Bracket | Women with Births | Births / 1,000 Women |
| 15 to 19 years | 0 (0.0%) | 0.0 |
| 20 to 34 years | 0 (0.0%) | 0.0 |
| 35 to 50 years | 0 (0.0%) | 0.0 |
| Total | 0 (0.0%) | 0.0 |
Fertility by Age by Marriage Status in Mayer
| Age Bracket | Married | Unmarried |
| 15 to 19 years | 0 (0.0%) | 0 (0.0%) |
| 20 to 34 years | 0 (0.0%) | 0 (0.0%) |
| 35 to 50 years | 0 (0.0%) | 0 (0.0%) |
| Total | 0 (0.0%) | 0 (0.0%) |
Fertility by Education in Mayer
| Educational Attainment | Women with Births | Births / 1,000 Women |
| Less than High School | 0 (0.0%) | 0.0 |
| High School Diploma | 0 (0.0%) | 0.0 |
| College or Associate's Degree | 0 (0.0%) | 0.0 |
| Bachelor's Degree | 0 (0.0%) | 0.0 |
| Graduate Degree | 0 (0.0%) | 0.0 |
| Total | 0 (0.0%) | 0.0 |
Fertility by Education by Marriage Status in Mayer
| Educational Attainment | Married | Unmarried |
| Less than High School | 0 (0.0%) | 0 (0.0%) |
| High School Diploma | 0 (0.0%) | 0 (0.0%) |
| College or Associate's Degree | 0 (0.0%) | 0 (0.0%) |
| Bachelor's Degree | 0 (0.0%) | 0 (0.0%) |
| Graduate Degree | 0 (0.0%) | 0 (0.0%) |
| Total | 0 (0.0%) | 0 (0.0%) |
Employment Characteristics in Mayer
Employment by Class of Employer in Mayer
Among the 512 employed individuals in Mayer, private company employees (450 | 87.9%), state government employees (29 | 5.7%), and self-employed (not incorporated) (23 | 4.5%) make up the most common classes of employment.
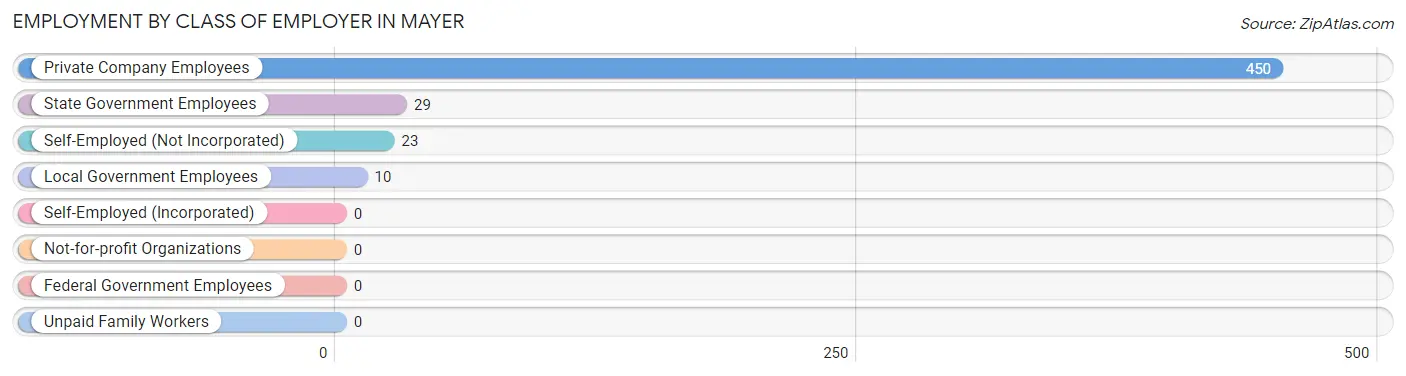
| Employer Class | # Employees | % Employees |
| Private Company Employees | 450 | 87.9% |
| Self-Employed (Incorporated) | 0 | 0.0% |
| Self-Employed (Not Incorporated) | 23 | 4.5% |
| Not-for-profit Organizations | 0 | 0.0% |
| Local Government Employees | 10 | 1.9% |
| State Government Employees | 29 | 5.7% |
| Federal Government Employees | 0 | 0.0% |
| Unpaid Family Workers | 0 | 0.0% |
| Total | 512 | 100.0% |
Employment Status by Age in Mayer
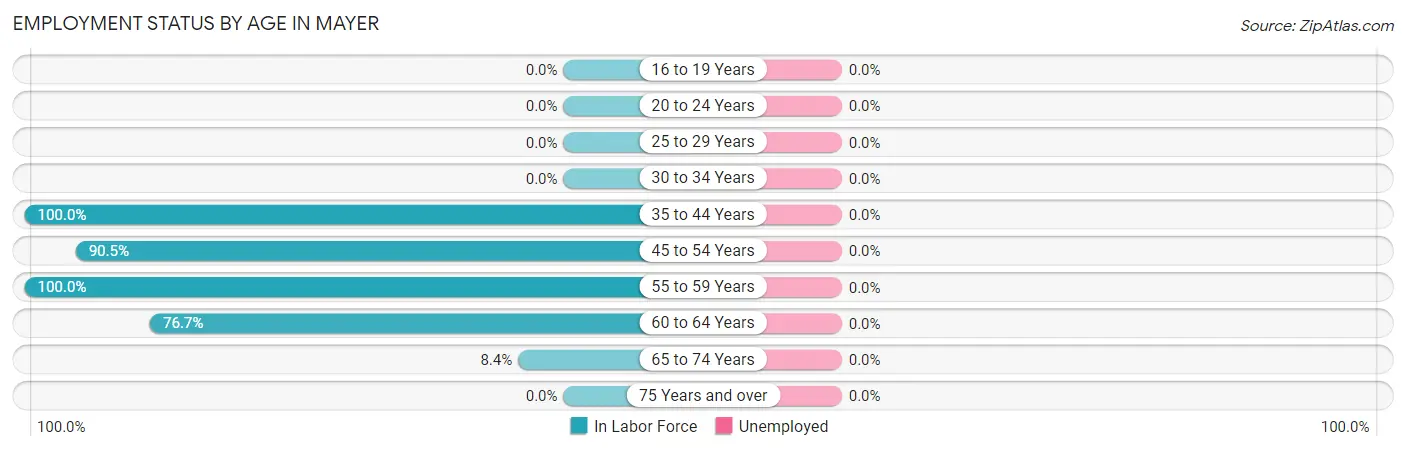
| Age Bracket | In Labor Force | Unemployed |
| 16 to 19 Years | 0 (0.0%) | 0 (0.0%) |
| 20 to 24 Years | 0 (0.0%) | 0 (0.0%) |
| 25 to 29 Years | 0 (0.0%) | 0 (0.0%) |
| 30 to 34 Years | 0 (0.0%) | 0 (0.0%) |
| 35 to 44 Years | 23 (100.0%) | 0 (0.0%) |
| 45 to 54 Years | 411 (90.5%) | 0 (0.0%) |
| 55 to 59 Years | 35 (100.0%) | 0 (0.0%) |
| 60 to 64 Years | 56 (76.7%) | 0 (0.0%) |
| 65 to 74 Years | 16 (8.4%) | 0 (0.0%) |
| 75 Years and over | 0 (0.0%) | 0 (0.0%) |
| Total | 541 (60.9%) | 0 (0.0%) |
Employment Status by Educational Attainment in Mayer
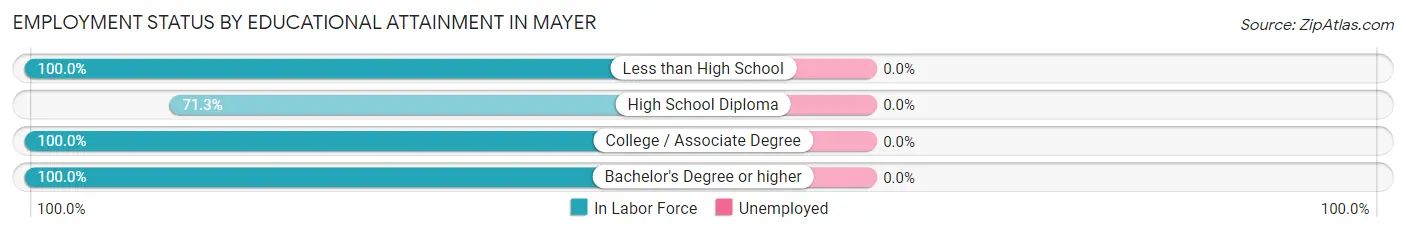
| Educational Attainment | In Labor Force | Unemployed |
| Less than High School | 35 (100.0%) | 0 (0.0%) |
| High School Diploma | 149 (71.3%) | 0 (0.0%) |
| College / Associate Degree | 318 (100.0%) | 0 (0.0%) |
| Bachelor's Degree or higher | 23 (100.0%) | 0 (0.0%) |
| Total | 525 (89.7%) | 0 (0.0%) |
Employment Occupations by Sex in Mayer
Management, Business, Science and Arts Occupations
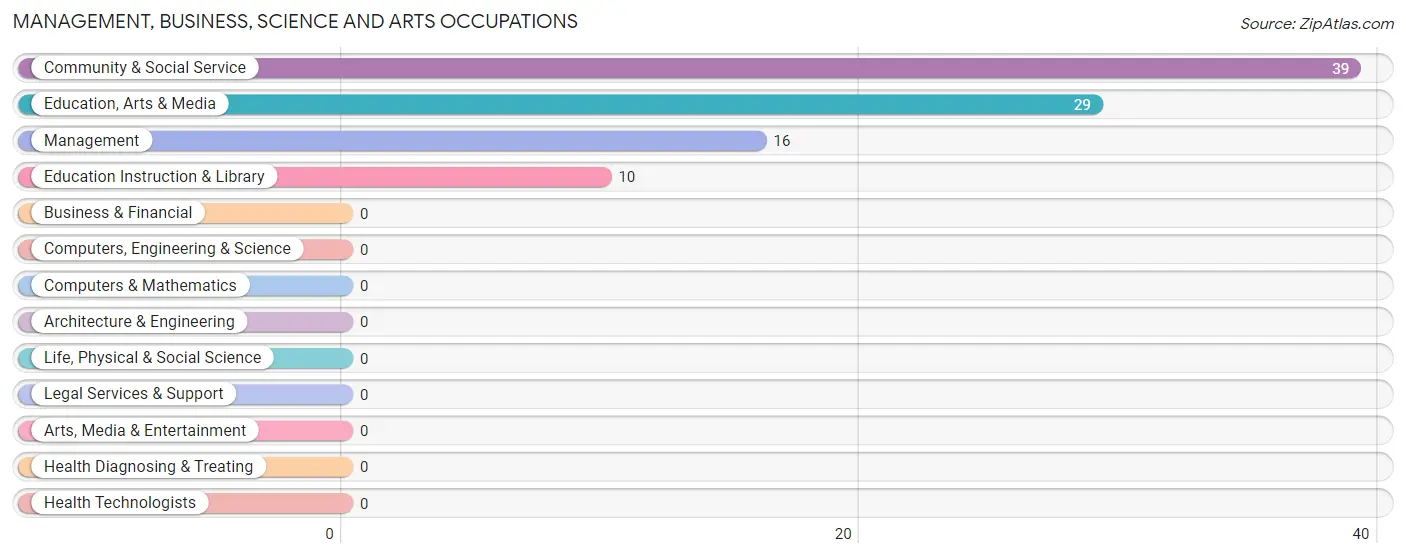
The most common Management, Business, Science and Arts occupations in Mayer are Community & Social Service (39 | 7.2%), Education, Arts & Media (29 | 5.4%), Management (16 | 3.0%), and Education Instruction & Library (10 | 1.8%).
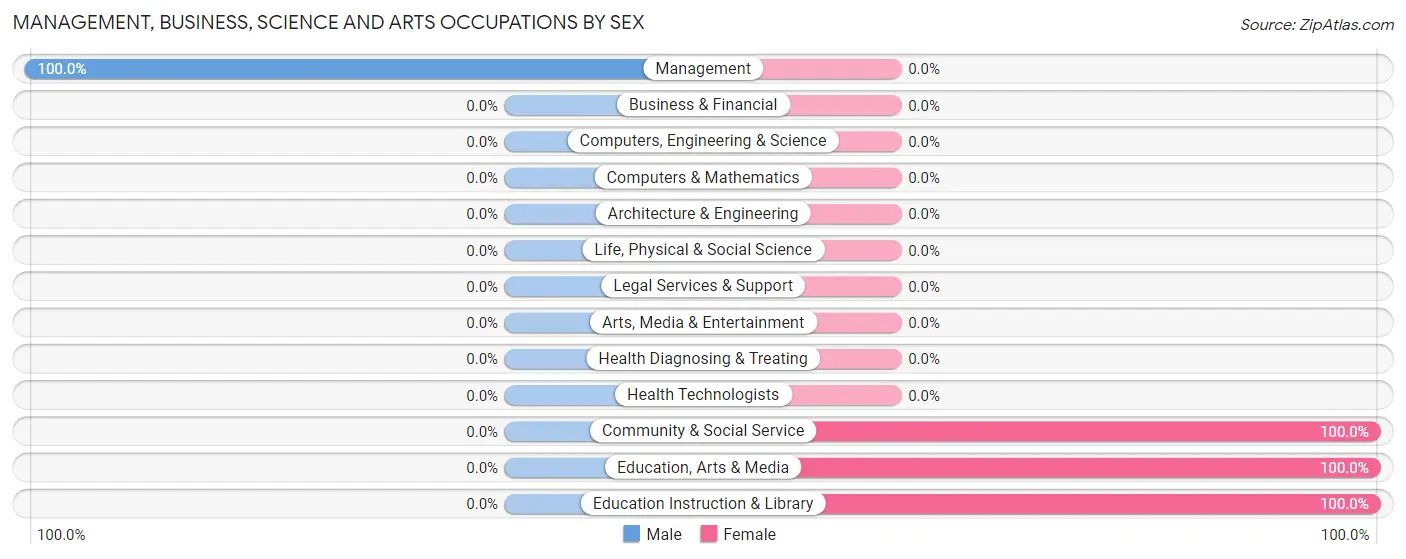
Management, Business, Science and Arts Occupations by Sex
| Occupation | Male | Female |
| Management | 16 (100.0%) | 0 (0.0%) |
| Business & Financial | 0 (0.0%) | 0 (0.0%) |
| Computers, Engineering & Science | 0 (0.0%) | 0 (0.0%) |
| Computers & Mathematics | 0 (0.0%) | 0 (0.0%) |
| Architecture & Engineering | 0 (0.0%) | 0 (0.0%) |
| Life, Physical & Social Science | 0 (0.0%) | 0 (0.0%) |
| Community & Social Service | 0 (0.0%) | 39 (100.0%) |
| Education, Arts & Media | 0 (0.0%) | 29 (100.0%) |
| Legal Services & Support | 0 (0.0%) | 0 (0.0%) |
| Education Instruction & Library | 0 (0.0%) | 10 (100.0%) |
| Arts, Media & Entertainment | 0 (0.0%) | 0 (0.0%) |
| Health Diagnosing & Treating | 0 (0.0%) | 0 (0.0%) |
| Health Technologists | 0 (0.0%) | 0 (0.0%) |
| Total (Category) | 16 (29.1%) | 39 (70.9%) |
| Total (Overall) | 249 (46.0%) | 292 (54.0%) |
Services Occupations
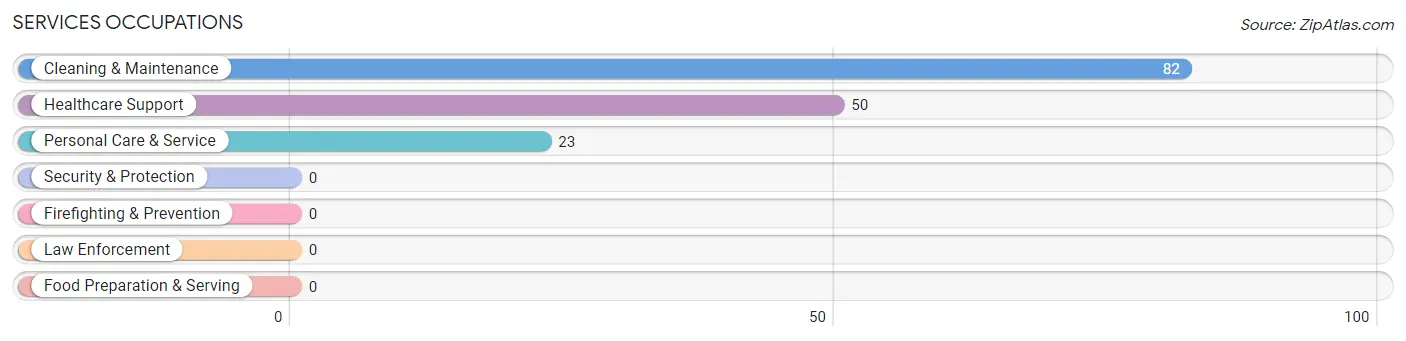
The most common Services occupations in Mayer are Cleaning & Maintenance (82 | 15.2%), Healthcare Support (50 | 9.2%), and Personal Care & Service (23 | 4.3%).
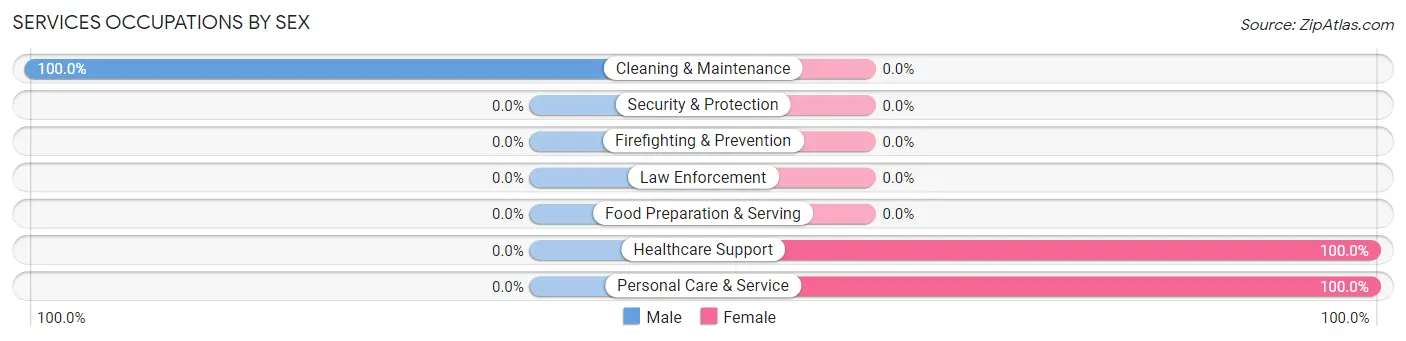
Services Occupations by Sex
| Occupation | Male | Female |
| Healthcare Support | 0 (0.0%) | 50 (100.0%) |
| Security & Protection | 0 (0.0%) | 0 (0.0%) |
| Firefighting & Prevention | 0 (0.0%) | 0 (0.0%) |
| Law Enforcement | 0 (0.0%) | 0 (0.0%) |
| Food Preparation & Serving | 0 (0.0%) | 0 (0.0%) |
| Cleaning & Maintenance | 82 (100.0%) | 0 (0.0%) |
| Personal Care & Service | 0 (0.0%) | 23 (100.0%) |
| Total (Category) | 82 (52.9%) | 73 (47.1%) |
| Total (Overall) | 249 (46.0%) | 292 (54.0%) |
Sales and Office Occupations
The most common Sales and Office occupations in Mayer are , and Office & Administration (163 | 30.1%).
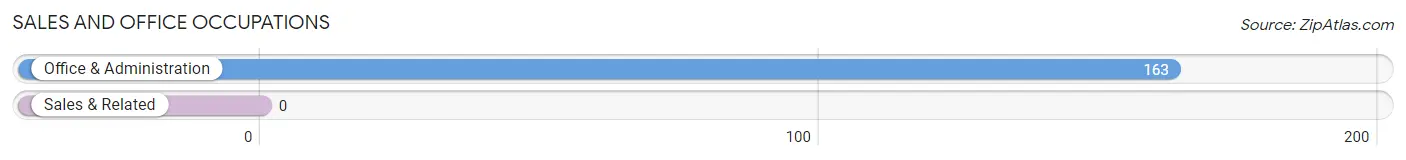
Sales and Office Occupations by Sex
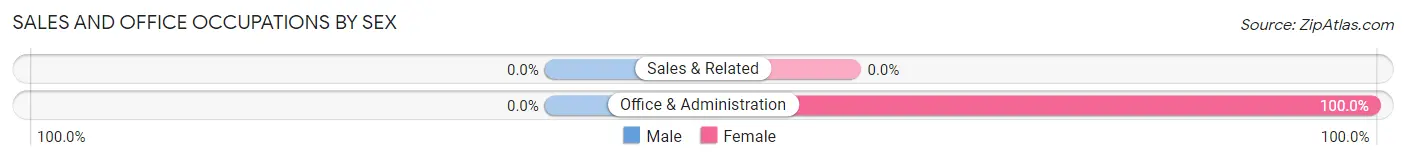
| Occupation | Male | Female |
| Sales & Related | 0 (0.0%) | 0 (0.0%) |
| Office & Administration | 0 (0.0%) | 163 (100.0%) |
| Total (Category) | 0 (0.0%) | 163 (100.0%) |
| Total (Overall) | 249 (46.0%) | 292 (54.0%) |
Natural Resources, Construction and Maintenance Occupations
The most common Natural Resources, Construction and Maintenance occupations in Mayer are Construction & Extraction (87 | 16.1%), and Installation, Maintenance & Repair (20 | 3.7%).
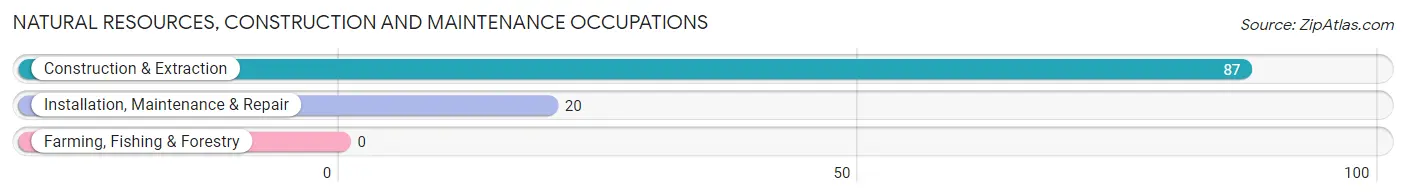
Natural Resources, Construction and Maintenance Occupations by Sex
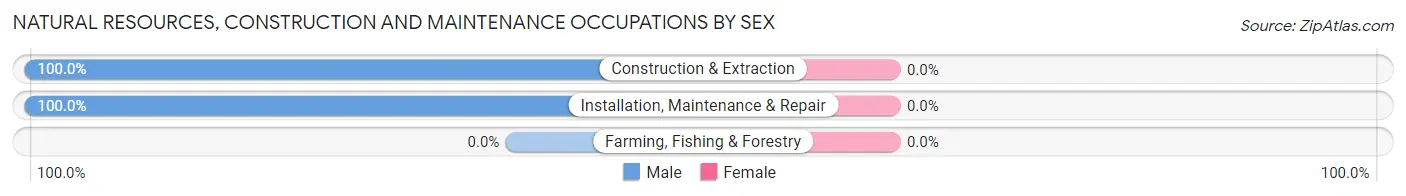
| Occupation | Male | Female |
| Farming, Fishing & Forestry | 0 (0.0%) | 0 (0.0%) |
| Construction & Extraction | 87 (100.0%) | 0 (0.0%) |
| Installation, Maintenance & Repair | 20 (100.0%) | 0 (0.0%) |
| Total (Category) | 107 (100.0%) | 0 (0.0%) |
| Total (Overall) | 249 (46.0%) | 292 (54.0%) |
Production, Transportation and Moving Occupations
The most common Production, Transportation and Moving occupations in Mayer are , and Production (61 | 11.3%).
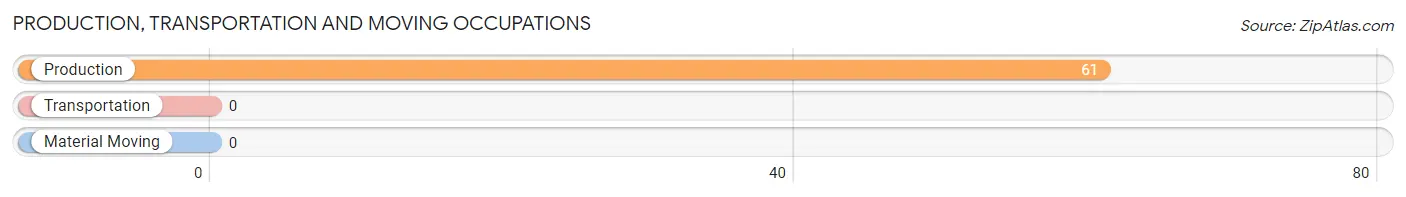
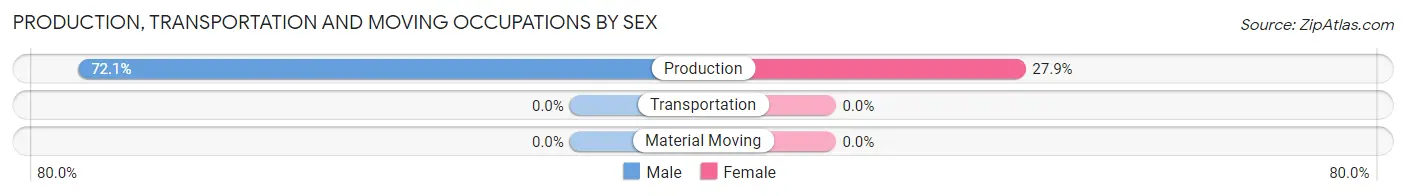
Production, Transportation and Moving Occupations by Sex
| Occupation | Male | Female |
| Production | 44 (72.1%) | 17 (27.9%) |
| Transportation | 0 (0.0%) | 0 (0.0%) |
| Material Moving | 0 (0.0%) | 0 (0.0%) |
| Total (Category) | 44 (72.1%) | 17 (27.9%) |
| Total (Overall) | 249 (46.0%) | 292 (54.0%) |
Employment Industries by Sex in Mayer
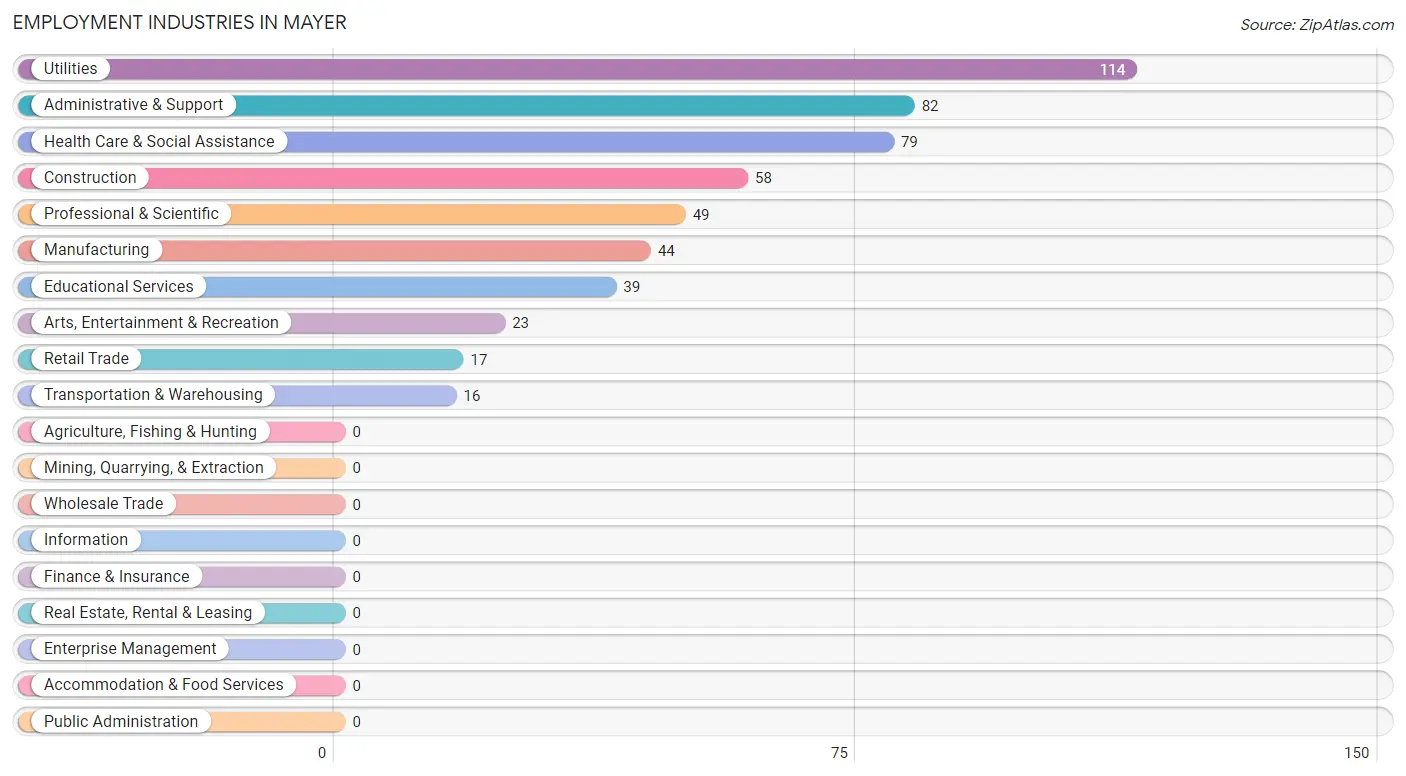
Employment Industries in Mayer
The major employment industries in Mayer include Utilities (114 | 21.1%), Administrative & Support (82 | 15.2%), Health Care & Social Assistance (79 | 14.6%), Construction (58 | 10.7%), and Professional & Scientific (49 | 9.1%).
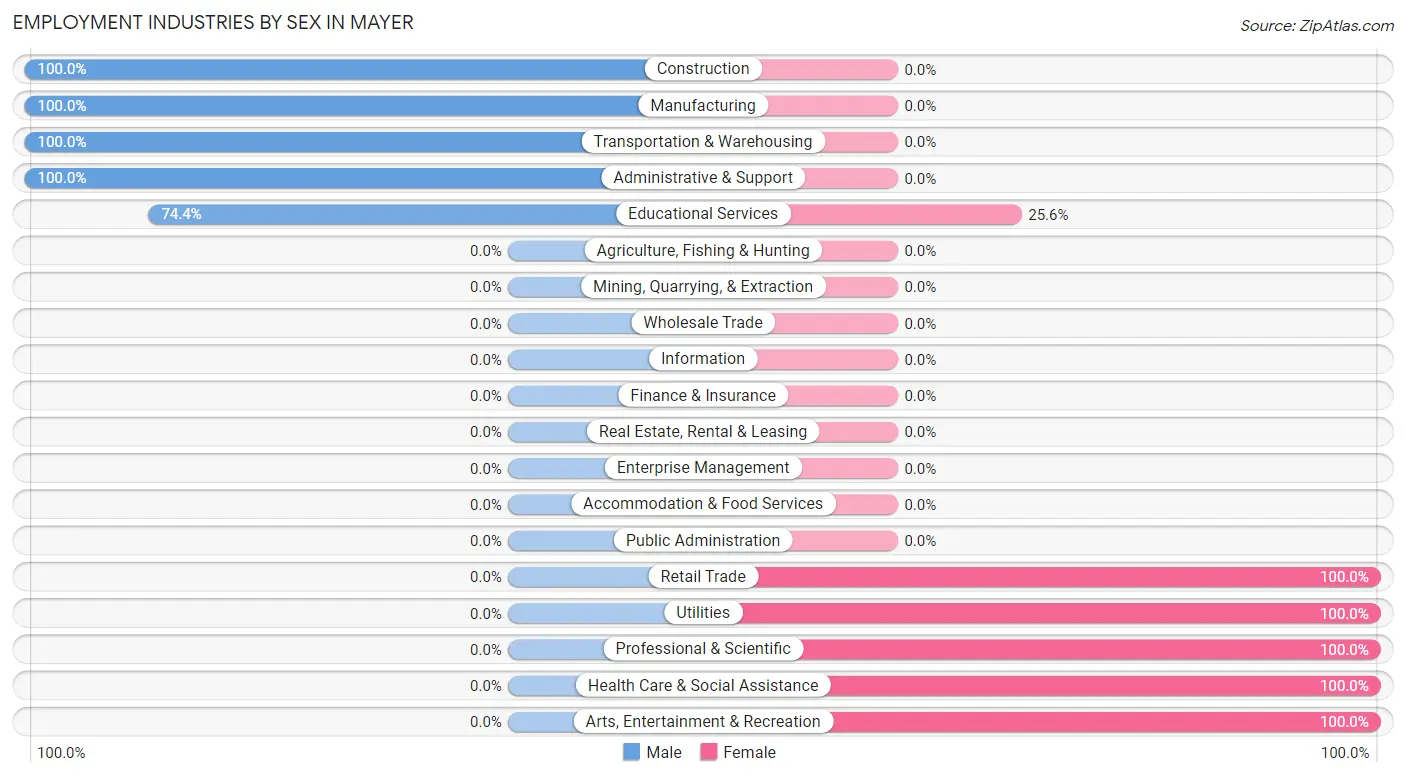
Employment Industries by Sex in Mayer
The Mayer industries that see more men than women are Construction (100.0%), Manufacturing (100.0%), and Transportation & Warehousing (100.0%), whereas the industries that tend to have a higher number of women are Retail Trade (100.0%), Utilities (100.0%), and Professional & Scientific (100.0%).
| Industry | Male | Female |
| Agriculture, Fishing & Hunting | 0 (0.0%) | 0 (0.0%) |
| Mining, Quarrying, & Extraction | 0 (0.0%) | 0 (0.0%) |
| Construction | 58 (100.0%) | 0 (0.0%) |
| Manufacturing | 44 (100.0%) | 0 (0.0%) |
| Wholesale Trade | 0 (0.0%) | 0 (0.0%) |
| Retail Trade | 0 (0.0%) | 17 (100.0%) |
| Transportation & Warehousing | 16 (100.0%) | 0 (0.0%) |
| Utilities | 0 (0.0%) | 114 (100.0%) |
| Information | 0 (0.0%) | 0 (0.0%) |
| Finance & Insurance | 0 (0.0%) | 0 (0.0%) |
| Real Estate, Rental & Leasing | 0 (0.0%) | 0 (0.0%) |
| Professional & Scientific | 0 (0.0%) | 49 (100.0%) |
| Enterprise Management | 0 (0.0%) | 0 (0.0%) |
| Administrative & Support | 82 (100.0%) | 0 (0.0%) |
| Educational Services | 29 (74.4%) | 10 (25.6%) |
| Health Care & Social Assistance | 0 (0.0%) | 79 (100.0%) |
| Arts, Entertainment & Recreation | 0 (0.0%) | 23 (100.0%) |
| Accommodation & Food Services | 0 (0.0%) | 0 (0.0%) |
| Public Administration | 0 (0.0%) | 0 (0.0%) |
| Total | 249 (46.0%) | 292 (54.0%) |
Education in Mayer
School Enrollment in Mayer
The most common levels of schooling among the 83 students in Mayer are middle school (31 | 37.3%), college / undergraduate (29 | 34.9%), and graduate / professional (23 | 27.7%).
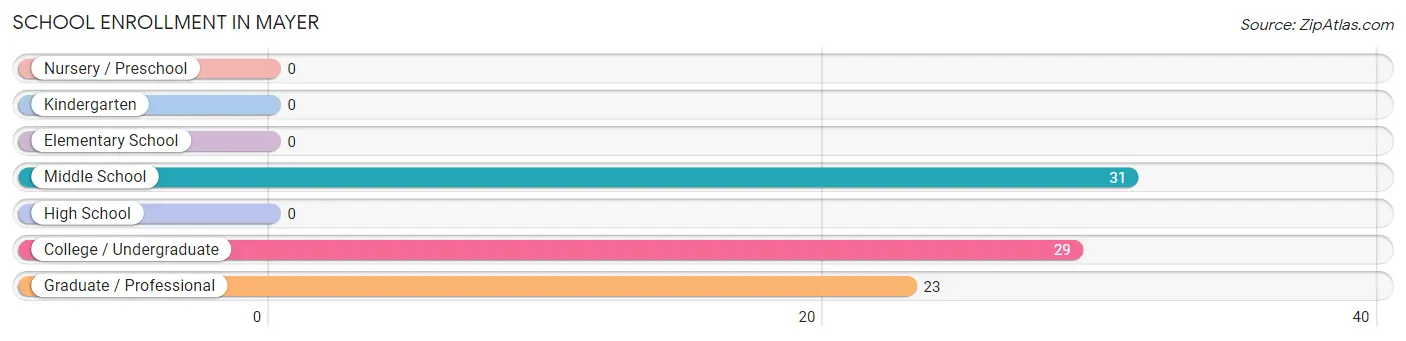
| School Level | # Students | % Students |
| Nursery / Preschool | 0 | 0.0% |
| Kindergarten | 0 | 0.0% |
| Elementary School | 0 | 0.0% |
| Middle School | 31 | 37.3% |
| High School | 0 | 0.0% |
| College / Undergraduate | 29 | 34.9% |
| Graduate / Professional | 23 | 27.7% |
| Total | 83 | 100.0% |
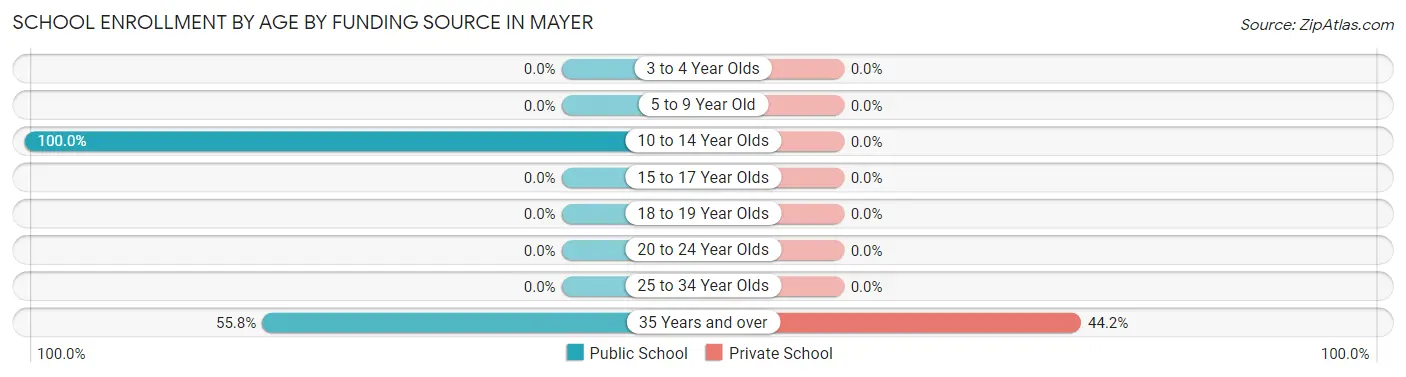
School Enrollment by Age by Funding Source in Mayer
Out of a total of 83 students who are enrolled in schools in Mayer, 23 (27.7%) attend a private institution, while the remaining 60 (72.3%) are enrolled in public schools. The age group of 35 years and over has the highest likelihood of being enrolled in private schools, with 23 (44.2% in the age bracket) enrolled. Conversely, the age group of 10 to 14 year olds has the lowest likelihood of being enrolled in a private school, with 31 (100.0% in the age bracket) attending a public institution.
| Age Bracket | Public School | Private School |
| 3 to 4 Year Olds | 0 (0.0%) | 0 (0.0%) |
| 5 to 9 Year Old | 0 (0.0%) | 0 (0.0%) |
| 10 to 14 Year Olds | 31 (100.0%) | 0 (0.0%) |
| 15 to 17 Year Olds | 0 (0.0%) | 0 (0.0%) |
| 18 to 19 Year Olds | 0 (0.0%) | 0 (0.0%) |
| 20 to 24 Year Olds | 0 (0.0%) | 0 (0.0%) |
| 25 to 34 Year Olds | 0 (0.0%) | 0 (0.0%) |
| 35 Years and over | 29 (55.8%) | 23 (44.2%) |
| Total | 60 (72.3%) | 23 (27.7%) |
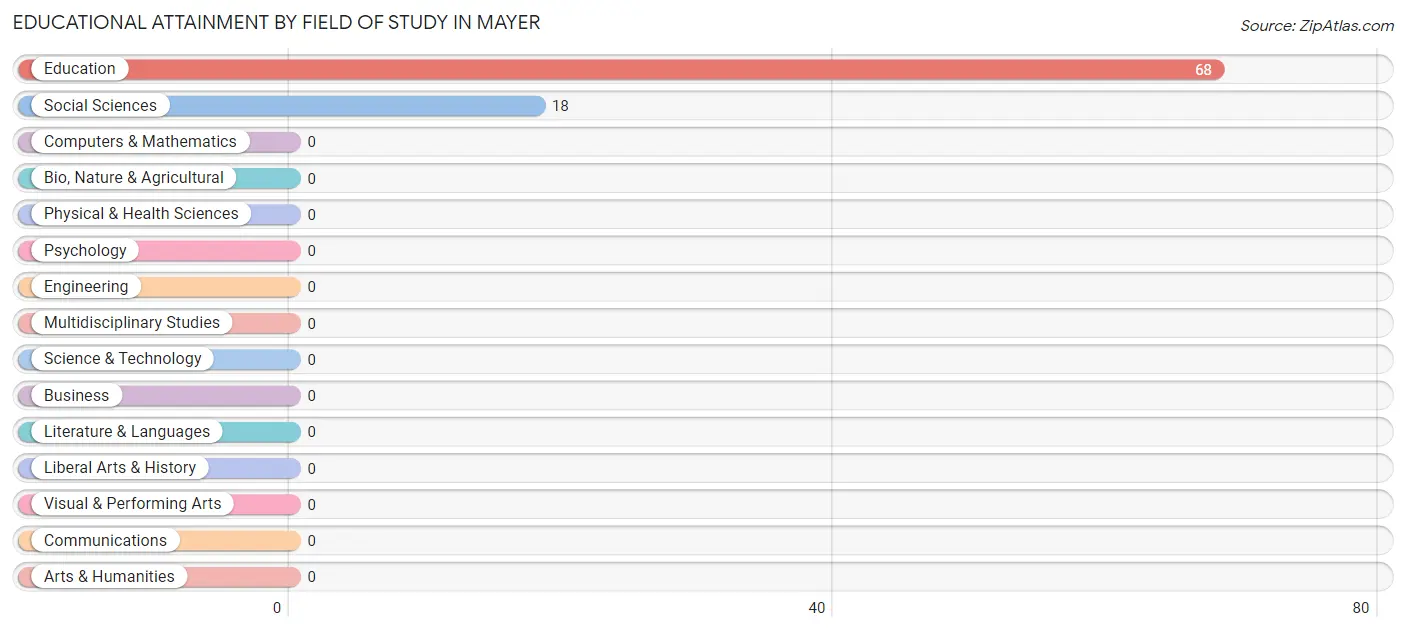
Educational Attainment by Field of Study in Mayer
Education (68 | 79.1%), and social sciences (18 | 20.9%) are the most common fields of study among 86 individuals in Mayer who have obtained a bachelor's degree or higher.
| Field of Study | # Graduates | % Graduates |
| Computers & Mathematics | 0 | 0.0% |
| Bio, Nature & Agricultural | 0 | 0.0% |
| Physical & Health Sciences | 0 | 0.0% |
| Psychology | 0 | 0.0% |
| Social Sciences | 18 | 20.9% |
| Engineering | 0 | 0.0% |
| Multidisciplinary Studies | 0 | 0.0% |
| Science & Technology | 0 | 0.0% |
| Business | 0 | 0.0% |
| Education | 68 | 79.1% |
| Literature & Languages | 0 | 0.0% |
| Liberal Arts & History | 0 | 0.0% |
| Visual & Performing Arts | 0 | 0.0% |
| Communications | 0 | 0.0% |
| Arts & Humanities | 0 | 0.0% |
| Total | 86 | 100.0% |
Transportation & Commute in Mayer
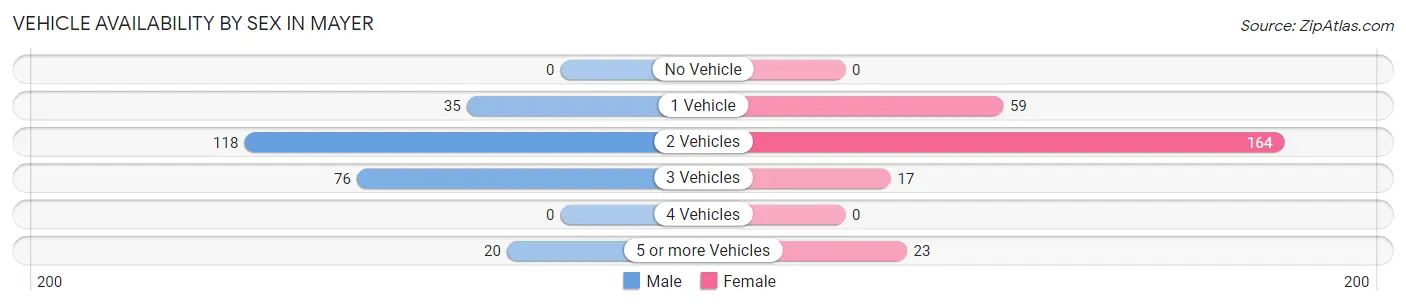
Vehicle Availability by Sex in Mayer
The most prevalent vehicle ownership categories in Mayer are males with 2 vehicles (118, accounting for 47.4%) and females with 2 vehicles (164, making up 44.9%).
| Vehicles Available | Male | Female |
| No Vehicle | 0 (0.0%) | 0 (0.0%) |
| 1 Vehicle | 35 (14.1%) | 59 (22.4%) |
| 2 Vehicles | 118 (47.4%) | 164 (62.4%) |
| 3 Vehicles | 76 (30.5%) | 17 (6.5%) |
| 4 Vehicles | 0 (0.0%) | 0 (0.0%) |
| 5 or more Vehicles | 20 (8.0%) | 23 (8.7%) |
| Total | 249 (100.0%) | 263 (100.0%) |
Commute Time in Mayer
The most frequently occuring commute durations in Mayer are 30 to 34 minutes (137 commuters, 26.8%), 20 to 24 minutes (114 commuters, 22.3%), and 45 to 59 minutes (97 commuters, 19.0%).
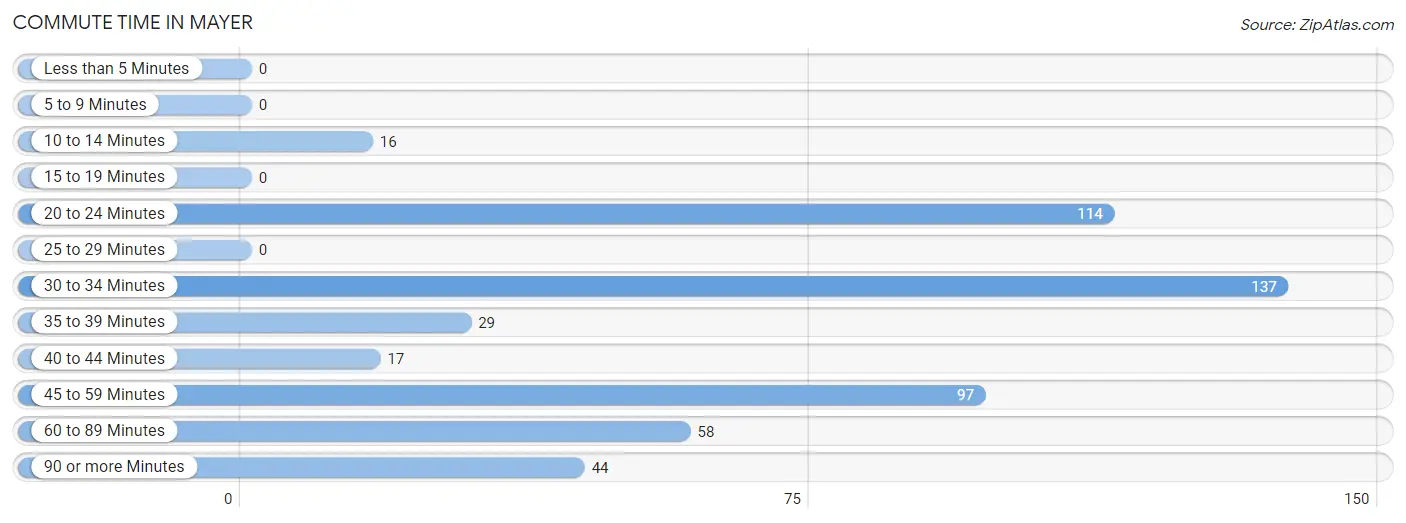
| Commute Time | # Commuters | % Commuters |
| Less than 5 Minutes | 0 | 0.0% |
| 5 to 9 Minutes | 0 | 0.0% |
| 10 to 14 Minutes | 16 | 3.1% |
| 15 to 19 Minutes | 0 | 0.0% |
| 20 to 24 Minutes | 114 | 22.3% |
| 25 to 29 Minutes | 0 | 0.0% |
| 30 to 34 Minutes | 137 | 26.8% |
| 35 to 39 Minutes | 29 | 5.7% |
| 40 to 44 Minutes | 17 | 3.3% |
| 45 to 59 Minutes | 97 | 19.0% |
| 60 to 89 Minutes | 58 | 11.3% |
| 90 or more Minutes | 44 | 8.6% |
Commute Time by Sex in Mayer
The most common commute times in Mayer are 60 to 89 minutes (58 commuters, 23.3%) for males and 20 to 24 minutes (114 commuters, 43.3%) for females.
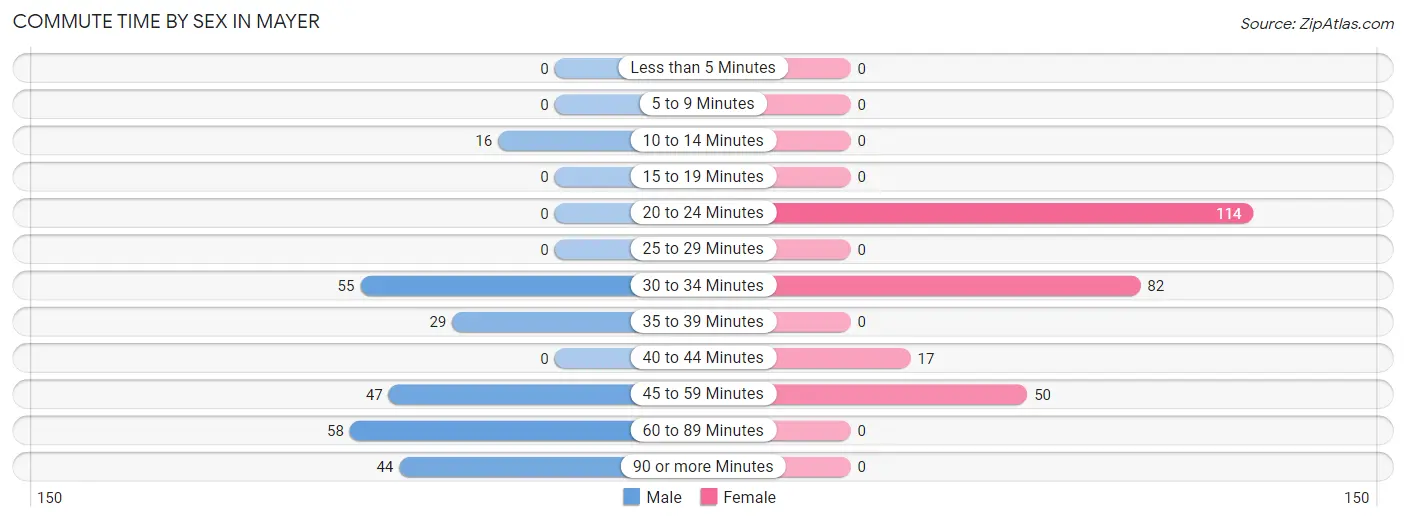
| Commute Time | Male | Female |
| Less than 5 Minutes | 0 (0.0%) | 0 (0.0%) |
| 5 to 9 Minutes | 0 (0.0%) | 0 (0.0%) |
| 10 to 14 Minutes | 16 (6.4%) | 0 (0.0%) |
| 15 to 19 Minutes | 0 (0.0%) | 0 (0.0%) |
| 20 to 24 Minutes | 0 (0.0%) | 114 (43.3%) |
| 25 to 29 Minutes | 0 (0.0%) | 0 (0.0%) |
| 30 to 34 Minutes | 55 (22.1%) | 82 (31.2%) |
| 35 to 39 Minutes | 29 (11.7%) | 0 (0.0%) |
| 40 to 44 Minutes | 0 (0.0%) | 17 (6.5%) |
| 45 to 59 Minutes | 47 (18.9%) | 50 (19.0%) |
| 60 to 89 Minutes | 58 (23.3%) | 0 (0.0%) |
| 90 or more Minutes | 44 (17.7%) | 0 (0.0%) |
Time of Departure to Work by Sex in Mayer
The most frequent times of departure to work in Mayer are 12:00 AM to 4:59 AM (118, 47.4%) for males and 7:00 AM to 7:29 AM (213, 81.0%) for females.
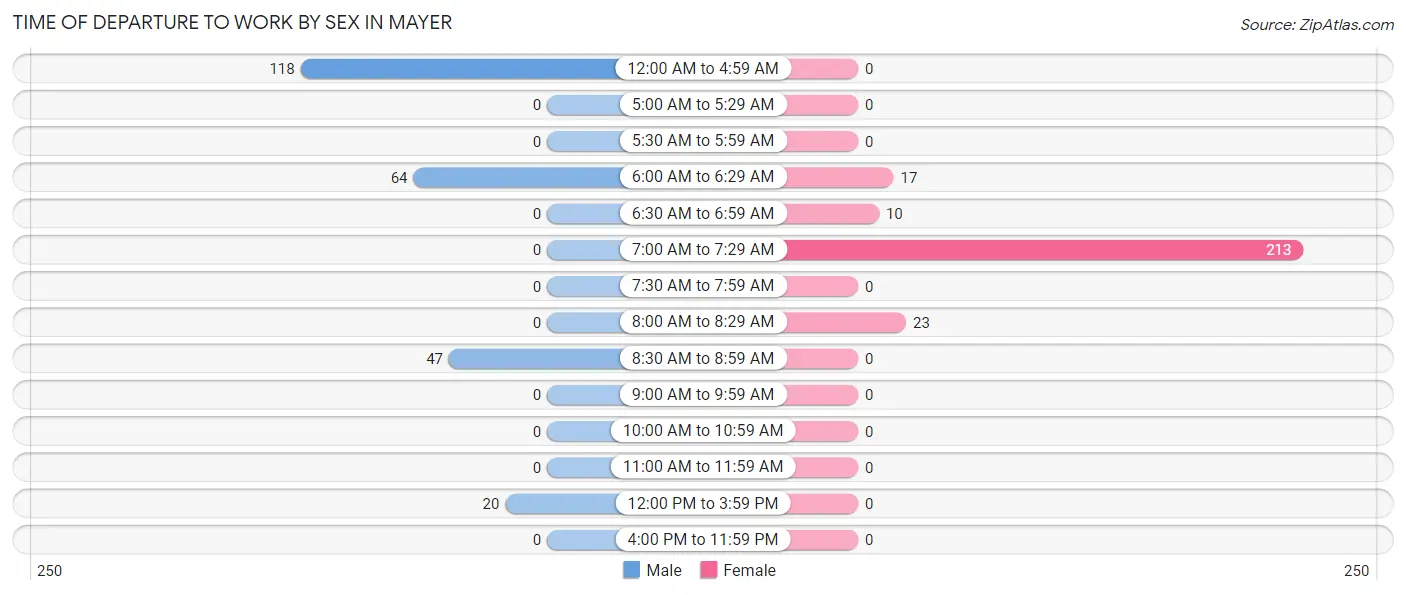
| Time of Departure | Male | Female |
| 12:00 AM to 4:59 AM | 118 (47.4%) | 0 (0.0%) |
| 5:00 AM to 5:29 AM | 0 (0.0%) | 0 (0.0%) |
| 5:30 AM to 5:59 AM | 0 (0.0%) | 0 (0.0%) |
| 6:00 AM to 6:29 AM | 64 (25.7%) | 17 (6.5%) |
| 6:30 AM to 6:59 AM | 0 (0.0%) | 10 (3.8%) |
| 7:00 AM to 7:29 AM | 0 (0.0%) | 213 (81.0%) |
| 7:30 AM to 7:59 AM | 0 (0.0%) | 0 (0.0%) |
| 8:00 AM to 8:29 AM | 0 (0.0%) | 23 (8.7%) |
| 8:30 AM to 8:59 AM | 47 (18.9%) | 0 (0.0%) |
| 9:00 AM to 9:59 AM | 0 (0.0%) | 0 (0.0%) |
| 10:00 AM to 10:59 AM | 0 (0.0%) | 0 (0.0%) |
| 11:00 AM to 11:59 AM | 0 (0.0%) | 0 (0.0%) |
| 12:00 PM to 3:59 PM | 20 (8.0%) | 0 (0.0%) |
| 4:00 PM to 11:59 PM | 0 (0.0%) | 0 (0.0%) |
| Total | 249 (100.0%) | 263 (100.0%) |
Housing Occupancy in Mayer
Occupancy by Ownership in Mayer
Of the total 637 dwellings in Mayer, owner-occupied units account for 557 (87.4%), while renter-occupied units make up 80 (12.6%).
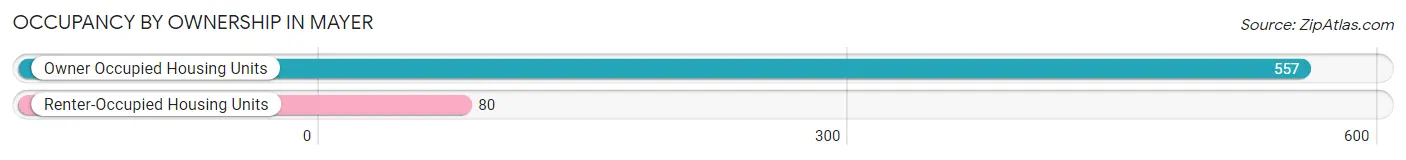
| Occupancy | # Housing Units | % Housing Units |
| Owner Occupied Housing Units | 557 | 87.4% |
| Renter-Occupied Housing Units | 80 | 12.6% |
| Total Occupied Housing Units | 637 | 100.0% |
Occupancy by Household Size in Mayer
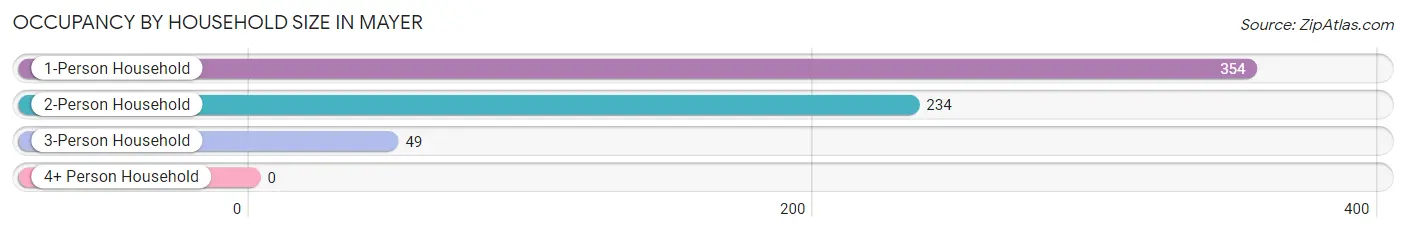
| Household Size | # Housing Units | % Housing Units |
| 1-Person Household | 354 | 55.6% |
| 2-Person Household | 234 | 36.7% |
| 3-Person Household | 49 | 7.7% |
| 4+ Person Household | 0 | 0.0% |
| Total Housing Units | 637 | 100.0% |
Occupancy by Ownership by Household Size in Mayer
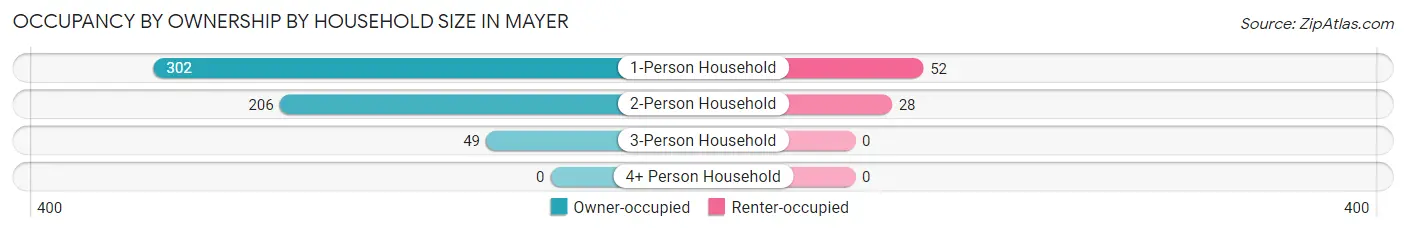
| Household Size | Owner-occupied | Renter-occupied |
| 1-Person Household | 302 (85.3%) | 52 (14.7%) |
| 2-Person Household | 206 (88.0%) | 28 (12.0%) |
| 3-Person Household | 49 (100.0%) | 0 (0.0%) |
| 4+ Person Household | 0 (0.0%) | 0 (0.0%) |
| Total Housing Units | 557 (87.4%) | 80 (12.6%) |
Occupancy by Educational Attainment in Mayer
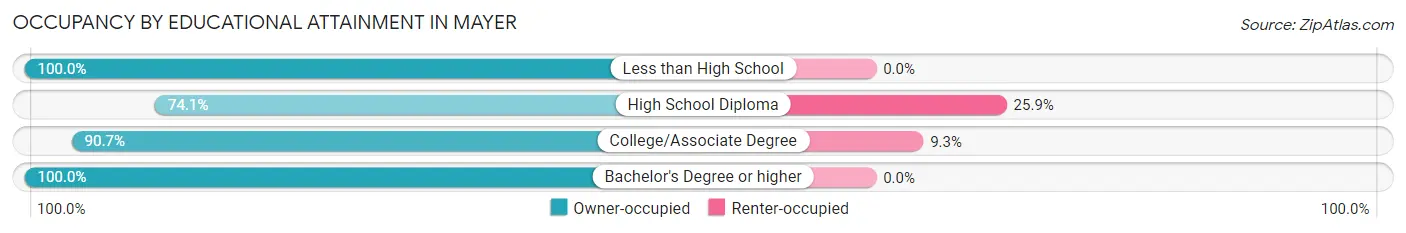
| Household Size | Owner-occupied | Renter-occupied |
| Less than High School | 50 (100.0%) | 0 (0.0%) |
| High School Diploma | 149 (74.1%) | 52 (25.9%) |
| College/Associate Degree | 272 (90.7%) | 28 (9.3%) |
| Bachelor's Degree or higher | 86 (100.0%) | 0 (0.0%) |
Occupancy by Age of Householder in Mayer
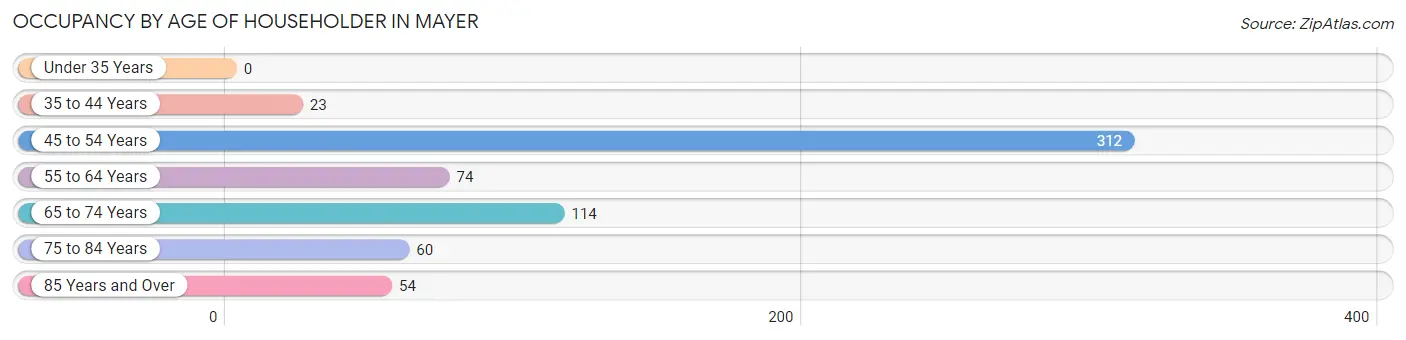
| Age Bracket | # Households | % Households |
| Under 35 Years | 0 | 0.0% |
| 35 to 44 Years | 23 | 3.6% |
| 45 to 54 Years | 312 | 49.0% |
| 55 to 64 Years | 74 | 11.6% |
| 65 to 74 Years | 114 | 17.9% |
| 75 to 84 Years | 60 | 9.4% |
| 85 Years and Over | 54 | 8.5% |
| Total | 637 | 100.0% |
Housing Finances in Mayer
Median Income by Occupancy in Mayer
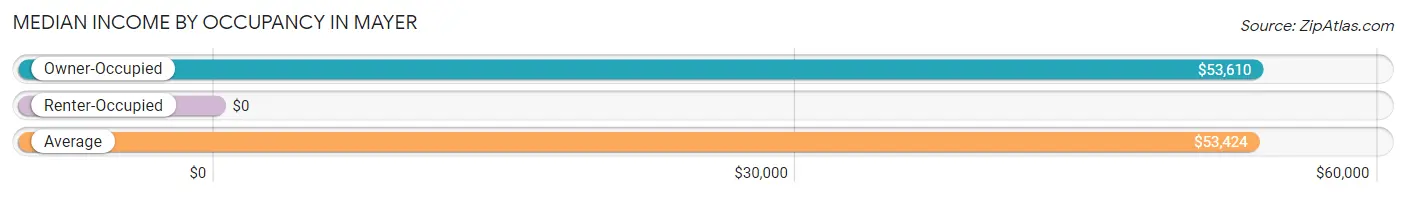
| Occupancy Type | # Households | Median Income |
| Owner-Occupied | 557 (87.4%) | $53,610 |
| Renter-Occupied | 80 (12.6%) | $0 |
| Average | 637 (100.0%) | $53,424 |
Occupancy by Householder Income Bracket in Mayer
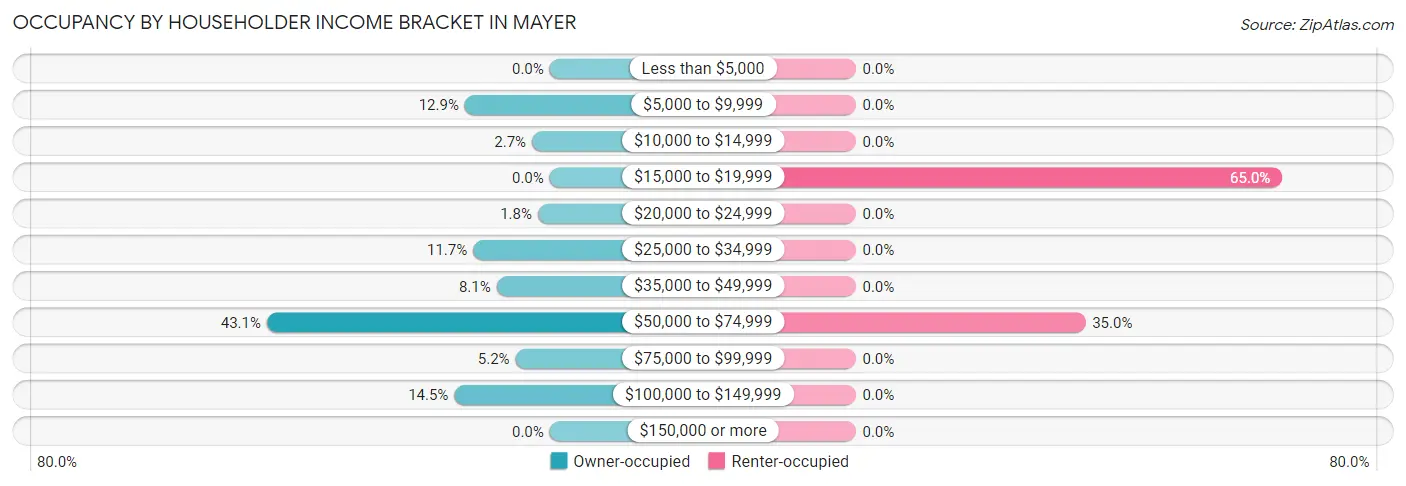
| Income Bracket | Owner-occupied | Renter-occupied |
| Less than $5,000 | 0 (0.0%) | 0 (0.0%) |
| $5,000 to $9,999 | 72 (12.9%) | 0 (0.0%) |
| $10,000 to $14,999 | 15 (2.7%) | 0 (0.0%) |
| $15,000 to $19,999 | 0 (0.0%) | 52 (65.0%) |
| $20,000 to $24,999 | 10 (1.8%) | 0 (0.0%) |
| $25,000 to $34,999 | 65 (11.7%) | 0 (0.0%) |
| $35,000 to $49,999 | 45 (8.1%) | 0 (0.0%) |
| $50,000 to $74,999 | 240 (43.1%) | 28 (35.0%) |
| $75,000 to $99,999 | 29 (5.2%) | 0 (0.0%) |
| $100,000 to $149,999 | 81 (14.5%) | 0 (0.0%) |
| $150,000 or more | 0 (0.0%) | 0 (0.0%) |
| Total | 557 (100.0%) | 80 (100.0%) |
Monthly Housing Cost Tiers in Mayer
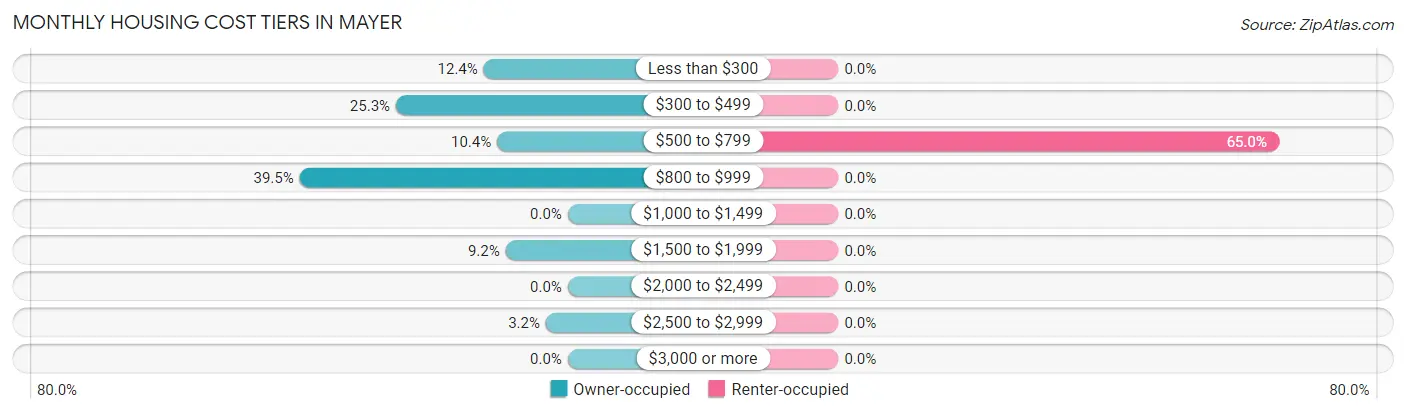
| Monthly Cost | Owner-occupied | Renter-occupied |
| Less than $300 | 69 (12.4%) | 0 (0.0%) |
| $300 to $499 | 141 (25.3%) | 0 (0.0%) |
| $500 to $799 | 58 (10.4%) | 52 (65.0%) |
| $800 to $999 | 220 (39.5%) | 0 (0.0%) |
| $1,000 to $1,499 | 0 (0.0%) | 0 (0.0%) |
| $1,500 to $1,999 | 51 (9.2%) | 0 (0.0%) |
| $2,000 to $2,499 | 0 (0.0%) | 0 (0.0%) |
| $2,500 to $2,999 | 18 (3.2%) | 0 (0.0%) |
| $3,000 or more | 0 (0.0%) | 0 (0.0%) |
| Total | 557 (100.0%) | 80 (100.0%) |
Physical Housing Characteristics in Mayer
Housing Structures in Mayer
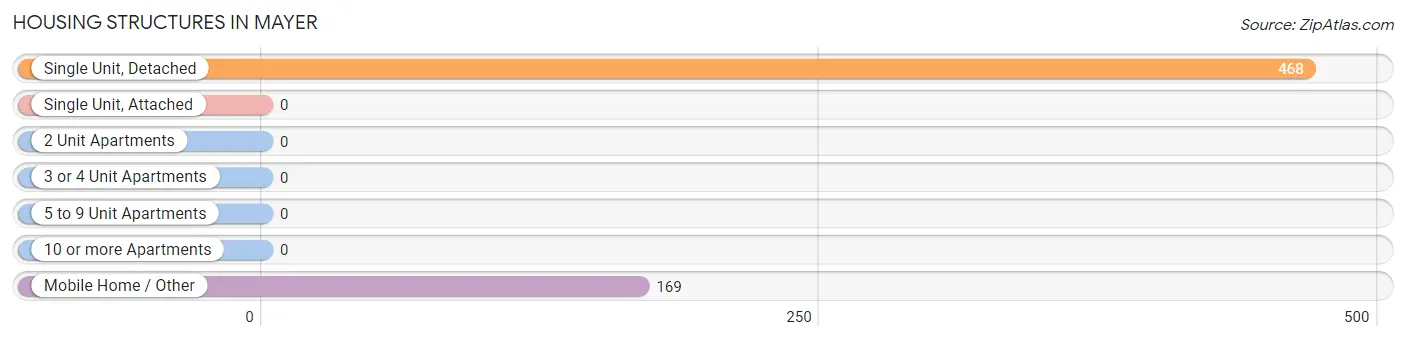
| Structure Type | # Housing Units | % Housing Units |
| Single Unit, Detached | 468 | 73.5% |
| Single Unit, Attached | 0 | 0.0% |
| 2 Unit Apartments | 0 | 0.0% |
| 3 or 4 Unit Apartments | 0 | 0.0% |
| 5 to 9 Unit Apartments | 0 | 0.0% |
| 10 or more Apartments | 0 | 0.0% |
| Mobile Home / Other | 169 | 26.5% |
| Total | 637 | 100.0% |
Housing Structures by Occupancy in Mayer
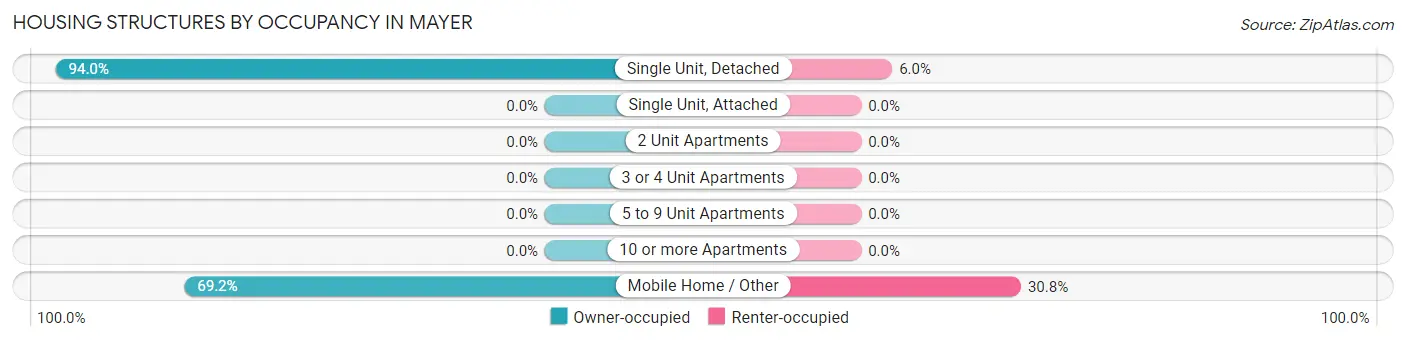
| Structure Type | Owner-occupied | Renter-occupied |
| Single Unit, Detached | 440 (94.0%) | 28 (6.0%) |
| Single Unit, Attached | 0 (0.0%) | 0 (0.0%) |
| 2 Unit Apartments | 0 (0.0%) | 0 (0.0%) |
| 3 or 4 Unit Apartments | 0 (0.0%) | 0 (0.0%) |
| 5 to 9 Unit Apartments | 0 (0.0%) | 0 (0.0%) |
| 10 or more Apartments | 0 (0.0%) | 0 (0.0%) |
| Mobile Home / Other | 117 (69.2%) | 52 (30.8%) |
| Total | 557 (87.4%) | 80 (12.6%) |
Housing Structures by Number of Rooms in Mayer
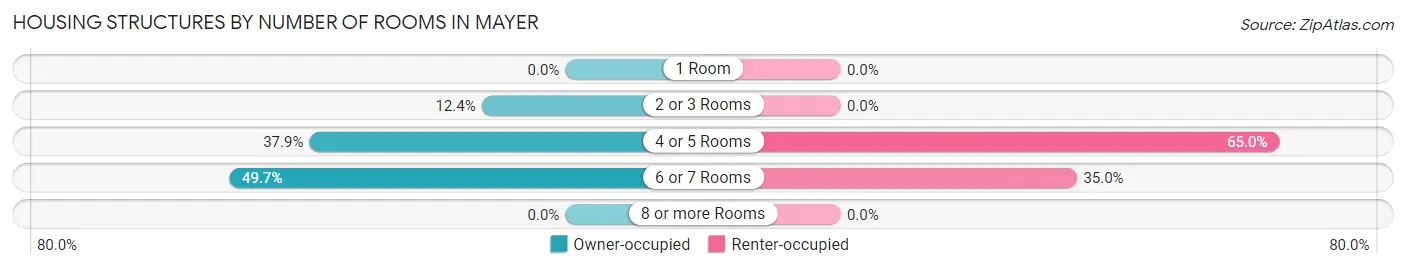
| Number of Rooms | Owner-occupied | Renter-occupied |
| 1 Room | 0 (0.0%) | 0 (0.0%) |
| 2 or 3 Rooms | 69 (12.4%) | 0 (0.0%) |
| 4 or 5 Rooms | 211 (37.9%) | 52 (65.0%) |
| 6 or 7 Rooms | 277 (49.7%) | 28 (35.0%) |
| 8 or more Rooms | 0 (0.0%) | 0 (0.0%) |
| Total | 557 (100.0%) | 80 (100.0%) |
Housing Structure by Heating Type in Mayer
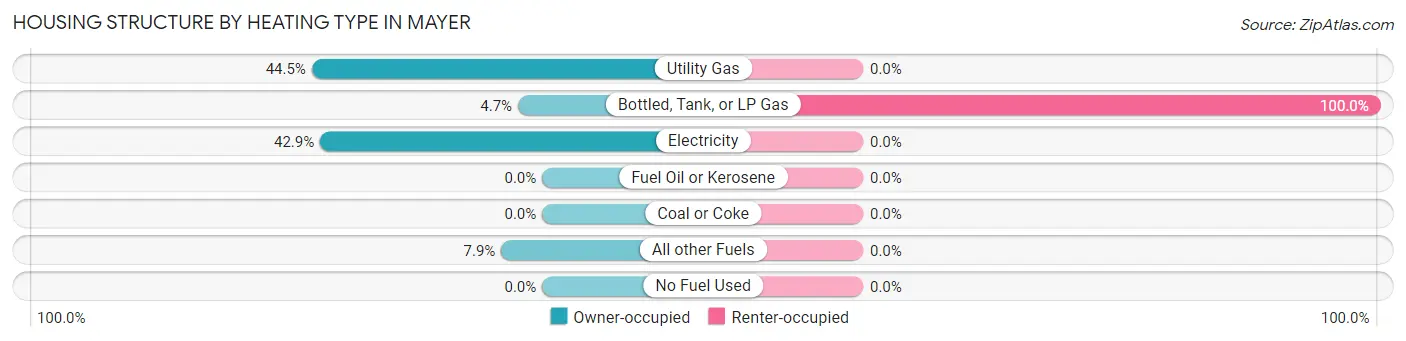
| Heating Type | Owner-occupied | Renter-occupied |
| Utility Gas | 248 (44.5%) | 0 (0.0%) |
| Bottled, Tank, or LP Gas | 26 (4.7%) | 80 (100.0%) |
| Electricity | 239 (42.9%) | 0 (0.0%) |
| Fuel Oil or Kerosene | 0 (0.0%) | 0 (0.0%) |
| Coal or Coke | 0 (0.0%) | 0 (0.0%) |
| All other Fuels | 44 (7.9%) | 0 (0.0%) |
| No Fuel Used | 0 (0.0%) | 0 (0.0%) |
| Total | 557 (100.0%) | 80 (100.0%) |
Household Vehicle Usage in Mayer
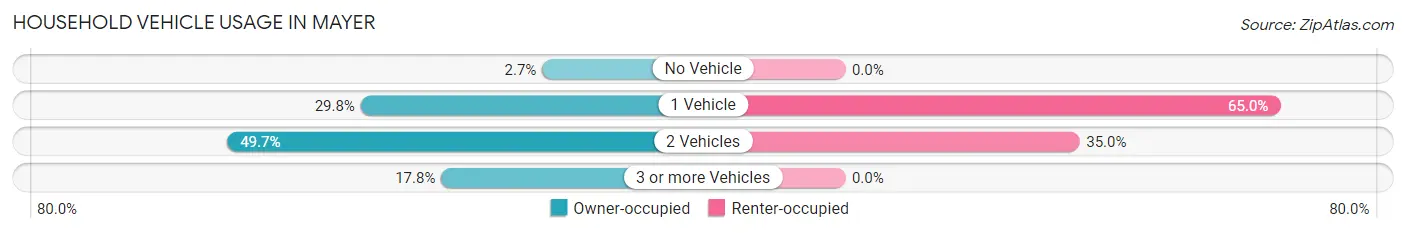
| Vehicles per Household | Owner-occupied | Renter-occupied |
| No Vehicle | 15 (2.7%) | 0 (0.0%) |
| 1 Vehicle | 166 (29.8%) | 52 (65.0%) |
| 2 Vehicles | 277 (49.7%) | 28 (35.0%) |
| 3 or more Vehicles | 99 (17.8%) | 0 (0.0%) |
| Total | 557 (100.0%) | 80 (100.0%) |
Real Estate & Mortgages in Mayer
Real Estate and Mortgage Overview in Mayer
| Characteristic | Without Mortgage | With Mortgage |
| Housing Units | 268 | 289 |
| Median Property Value | $223,000 | $216,900 |
| Median Household Income | $66,136 | $0 |
| Monthly Housing Costs | $328 | $0 |
| Real Estate Taxes | $1,322 | $0 |
Property Value by Mortgage Status in Mayer
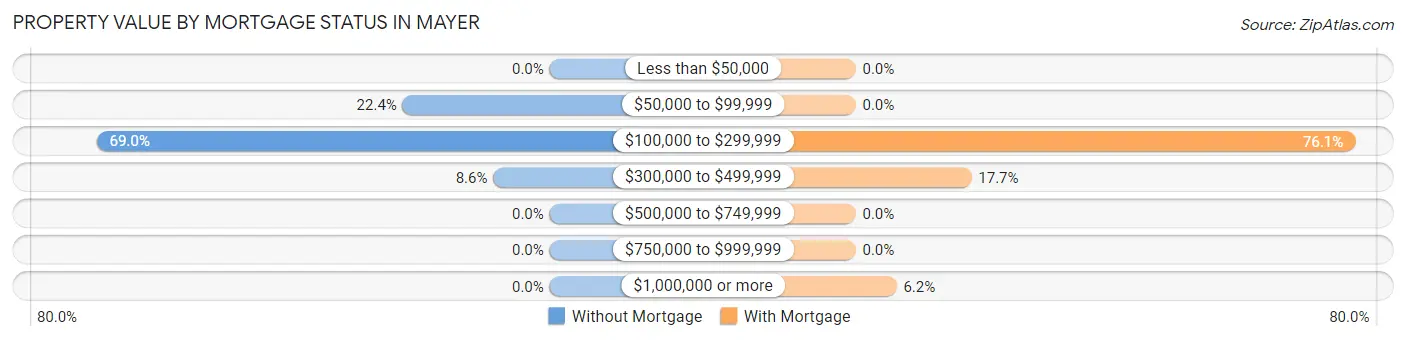
| Property Value | Without Mortgage | With Mortgage |
| Less than $50,000 | 0 (0.0%) | 0 (0.0%) |
| $50,000 to $99,999 | 60 (22.4%) | 0 (0.0%) |
| $100,000 to $299,999 | 185 (69.0%) | 220 (76.1%) |
| $300,000 to $499,999 | 23 (8.6%) | 51 (17.6%) |
| $500,000 to $749,999 | 0 (0.0%) | 0 (0.0%) |
| $750,000 to $999,999 | 0 (0.0%) | 0 (0.0%) |
| $1,000,000 or more | 0 (0.0%) | 18 (6.2%) |
| Total | 268 (100.0%) | 289 (100.0%) |
Household Income by Mortgage Status in Mayer
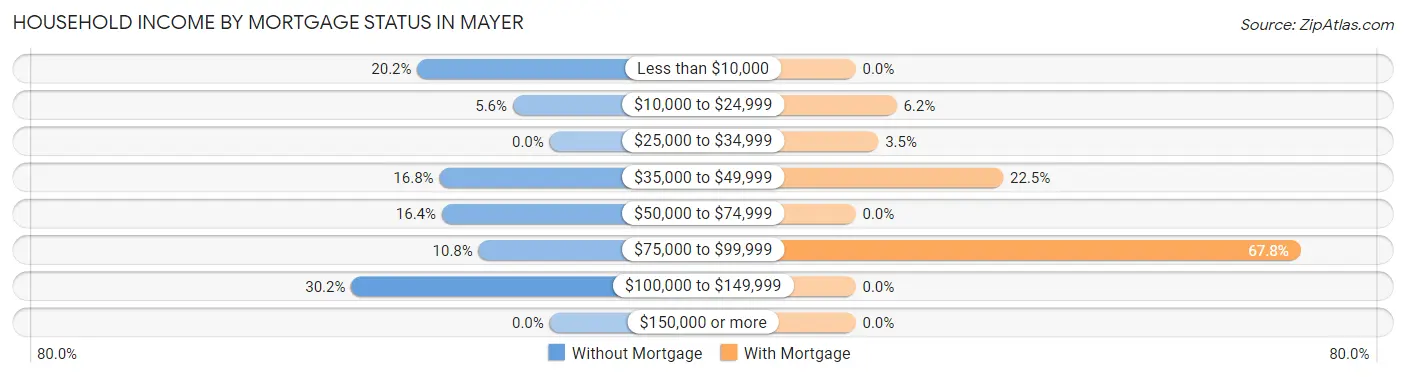
| Household Income | Without Mortgage | With Mortgage |
| Less than $10,000 | 54 (20.2%) | 0 (0.0%) |
| $10,000 to $24,999 | 15 (5.6%) | 18 (6.2%) |
| $25,000 to $34,999 | 0 (0.0%) | 10 (3.5%) |
| $35,000 to $49,999 | 45 (16.8%) | 65 (22.5%) |
| $50,000 to $74,999 | 44 (16.4%) | 0 (0.0%) |
| $75,000 to $99,999 | 29 (10.8%) | 196 (67.8%) |
| $100,000 to $149,999 | 81 (30.2%) | 0 (0.0%) |
| $150,000 or more | 0 (0.0%) | 0 (0.0%) |
| Total | 268 (100.0%) | 289 (100.0%) |
Property Value to Household Income Ratio in Mayer
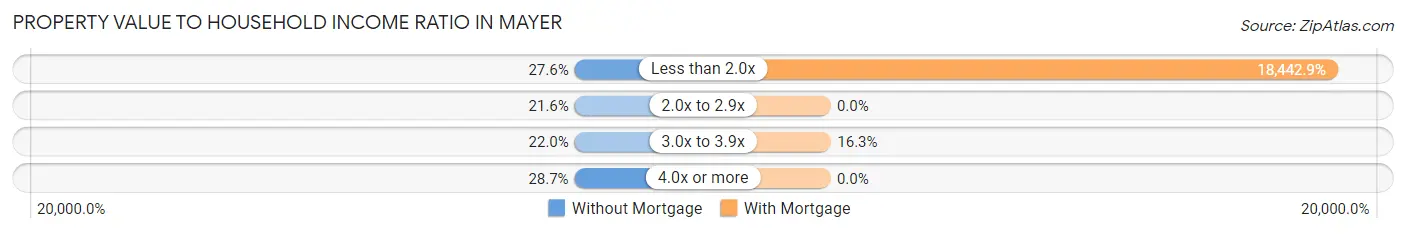
| Value-to-Income Ratio | Without Mortgage | With Mortgage |
| Less than 2.0x | 74 (27.6%) | 53,300 (18,442.9%) |
| 2.0x to 2.9x | 58 (21.6%) | 0 (0.0%) |
| 3.0x to 3.9x | 59 (22.0%) | 47 (16.3%) |
| 4.0x or more | 77 (28.7%) | 0 (0.0%) |
| Total | 268 (100.0%) | 289 (100.0%) |
Real Estate Taxes by Mortgage Status in Mayer
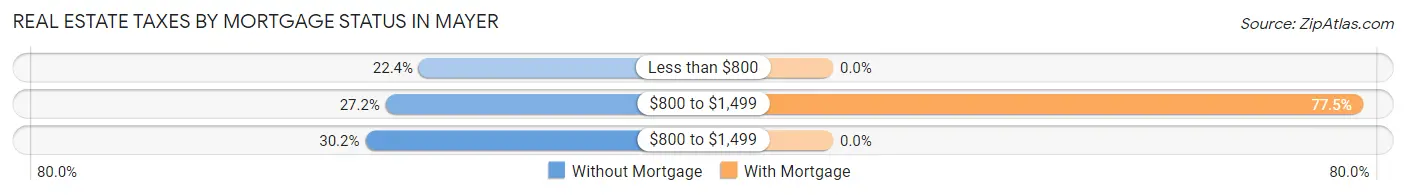
| Property Taxes | Without Mortgage | With Mortgage |
| Less than $800 | 60 (22.4%) | 0 (0.0%) |
| $800 to $1,499 | 73 (27.2%) | 224 (77.5%) |
| $800 to $1,499 | 81 (30.2%) | 0 (0.0%) |
| Total | 268 (100.0%) | 289 (100.0%) |
Health & Disability in Mayer
Health Insurance Coverage by Age in Mayer
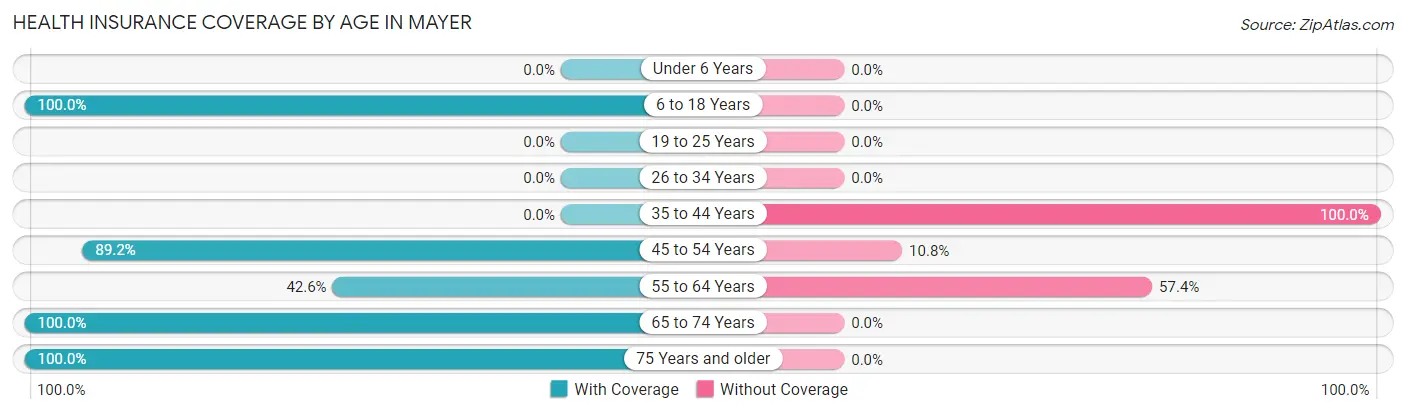
| Age Bracket | With Coverage | Without Coverage |
| Under 6 Years | 0 (0.0%) | 0 (0.0%) |
| 6 to 18 Years | 31 (100.0%) | 0 (0.0%) |
| 19 to 25 Years | 0 (0.0%) | 0 (0.0%) |
| 26 to 34 Years | 0 (0.0%) | 0 (0.0%) |
| 35 to 44 Years | 0 (0.0%) | 23 (100.0%) |
| 45 to 54 Years | 405 (89.2%) | 49 (10.8%) |
| 55 to 64 Years | 46 (42.6%) | 62 (57.4%) |
| 65 to 74 Years | 190 (100.0%) | 0 (0.0%) |
| 75 Years and older | 114 (100.0%) | 0 (0.0%) |
| Total | 786 (85.4%) | 134 (14.6%) |
Health Insurance Coverage by Citizenship Status in Mayer
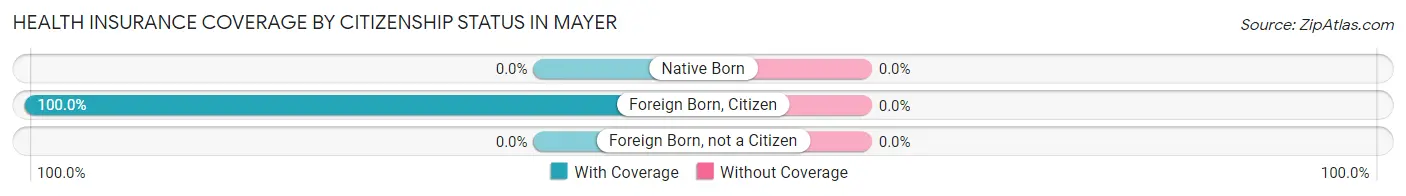
| Citizenship Status | With Coverage | Without Coverage |
| Native Born | 0 (0.0%) | 0 (0.0%) |
| Foreign Born, Citizen | 31 (100.0%) | 0 (0.0%) |
| Foreign Born, not a Citizen | 0 (0.0%) | 0 (0.0%) |
Health Insurance Coverage by Household Income in Mayer
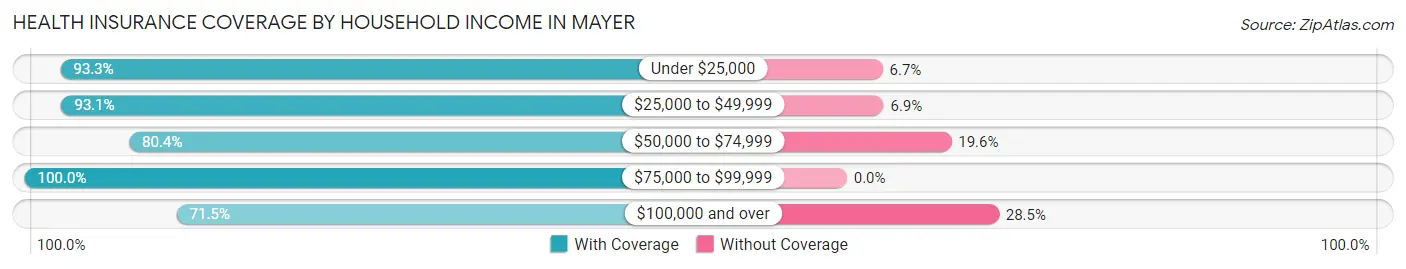
| Household Income | With Coverage | Without Coverage |
| Under $25,000 | 139 (93.3%) | 10 (6.7%) |
| $25,000 to $49,999 | 230 (93.1%) | 17 (6.9%) |
| $50,000 to $74,999 | 263 (80.4%) | 64 (19.6%) |
| $75,000 to $99,999 | 46 (100.0%) | 0 (0.0%) |
| $100,000 and over | 108 (71.5%) | 43 (28.5%) |
Public vs Private Health Insurance Coverage by Age in Mayer
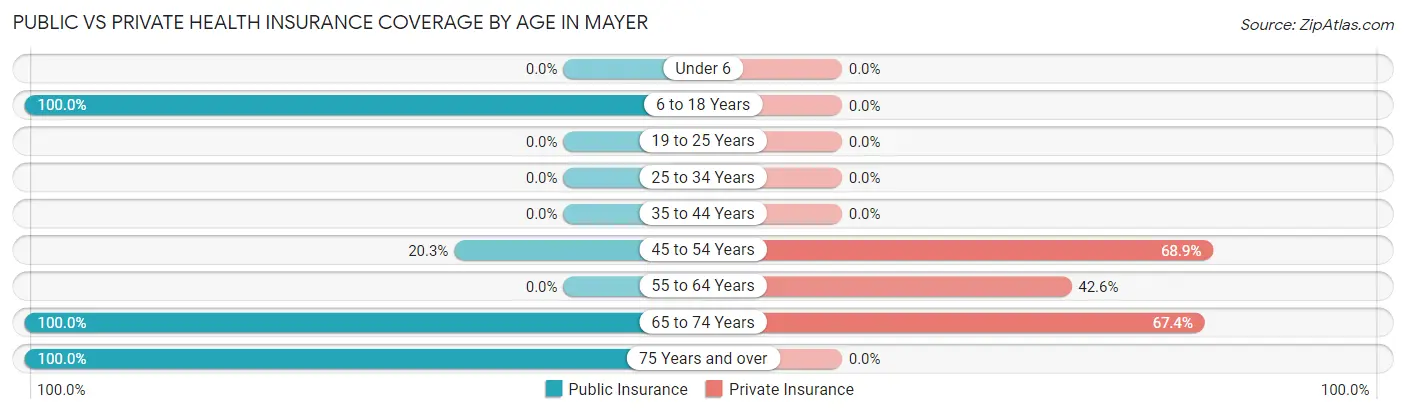
| Age Bracket | Public Insurance | Private Insurance |
| Under 6 | 0 (0.0%) | 0 (0.0%) |
| 6 to 18 Years | 31 (100.0%) | 0 (0.0%) |
| 19 to 25 Years | 0 (0.0%) | 0 (0.0%) |
| 25 to 34 Years | 0 (0.0%) | 0 (0.0%) |
| 35 to 44 Years | 0 (0.0%) | 0 (0.0%) |
| 45 to 54 Years | 92 (20.3%) | 313 (68.9%) |
| 55 to 64 Years | 0 (0.0%) | 46 (42.6%) |
| 65 to 74 Years | 190 (100.0%) | 128 (67.4%) |
| 75 Years and over | 114 (100.0%) | 0 (0.0%) |
| Total | 427 (46.4%) | 487 (52.9%) |
Disability Status by Sex by Age in Mayer
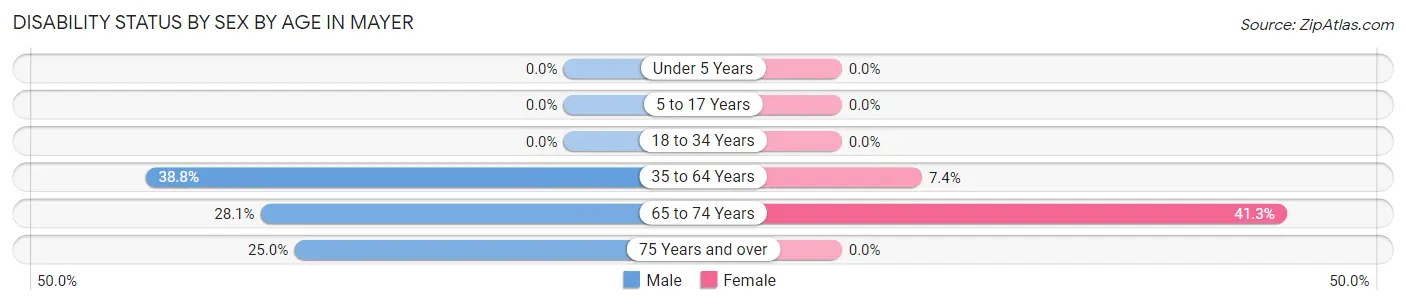
| Age Bracket | Male | Female |
| Under 5 Years | 0 (0.0%) | 0 (0.0%) |
| 5 to 17 Years | 0 (0.0%) | 0 (0.0%) |
| 18 to 34 Years | 0 (0.0%) | 0 (0.0%) |
| 35 to 64 Years | 107 (38.8%) | 23 (7.4%) |
| 65 to 74 Years | 18 (28.1%) | 52 (41.3%) |
| 75 Years and over | 15 (25.0%) | 0 (0.0%) |
Disability Class by Sex by Age in Mayer
Disability Class: Hearing Difficulty
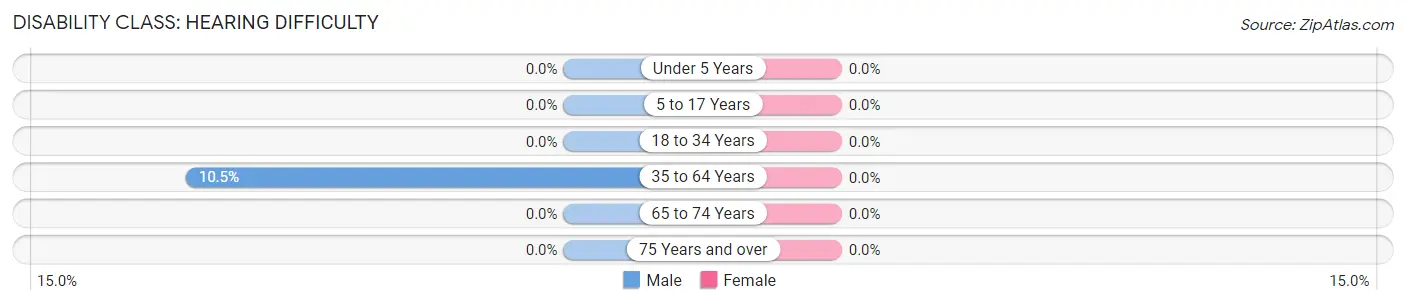
| Age Bracket | Male | Female |
| Under 5 Years | 0 (0.0%) | 0 (0.0%) |
| 5 to 17 Years | 0 (0.0%) | 0 (0.0%) |
| 18 to 34 Years | 0 (0.0%) | 0 (0.0%) |
| 35 to 64 Years | 29 (10.5%) | 0 (0.0%) |
| 65 to 74 Years | 0 (0.0%) | 0 (0.0%) |
| 75 Years and over | 0 (0.0%) | 0 (0.0%) |
Disability Class: Vision Difficulty
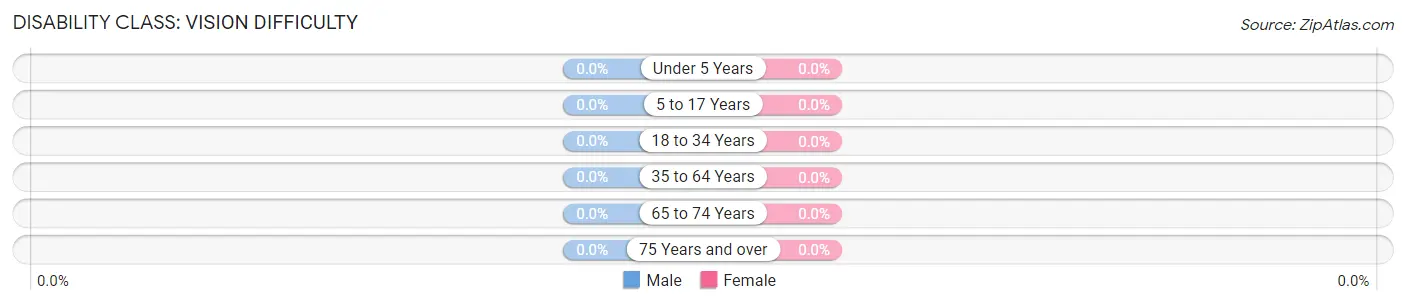
| Age Bracket | Male | Female |
| Under 5 Years | 0 (0.0%) | 0 (0.0%) |
| 5 to 17 Years | 0 (0.0%) | 0 (0.0%) |
| 18 to 34 Years | 0 (0.0%) | 0 (0.0%) |
| 35 to 64 Years | 0 (0.0%) | 0 (0.0%) |
| 65 to 74 Years | 0 (0.0%) | 0 (0.0%) |
| 75 Years and over | 0 (0.0%) | 0 (0.0%) |
Disability Class: Cognitive Difficulty
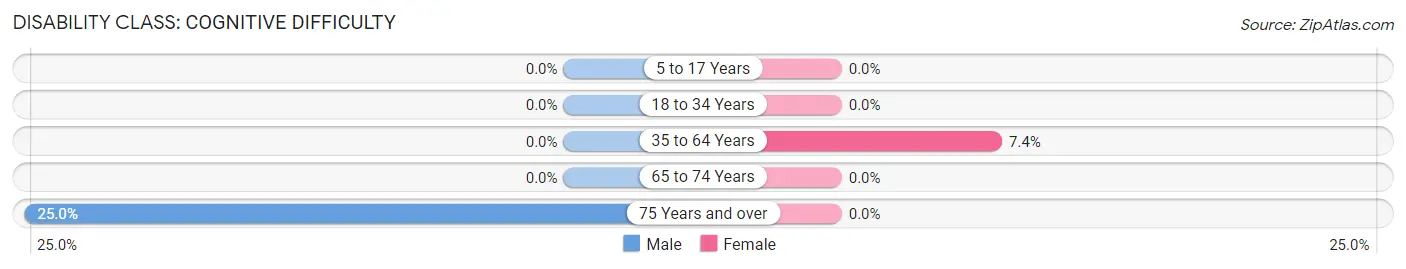
| Age Bracket | Male | Female |
| 5 to 17 Years | 0 (0.0%) | 0 (0.0%) |
| 18 to 34 Years | 0 (0.0%) | 0 (0.0%) |
| 35 to 64 Years | 0 (0.0%) | 23 (7.4%) |
| 65 to 74 Years | 0 (0.0%) | 0 (0.0%) |
| 75 Years and over | 15 (25.0%) | 0 (0.0%) |
Disability Class: Ambulatory Difficulty
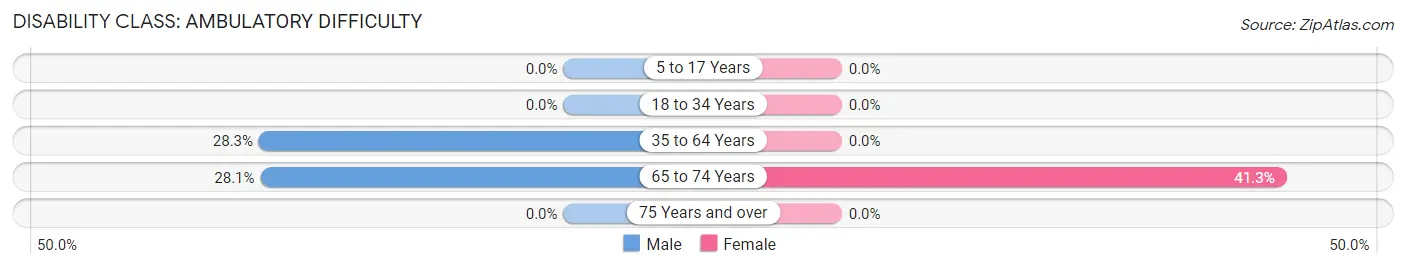
| Age Bracket | Male | Female |
| 5 to 17 Years | 0 (0.0%) | 0 (0.0%) |
| 18 to 34 Years | 0 (0.0%) | 0 (0.0%) |
| 35 to 64 Years | 78 (28.3%) | 0 (0.0%) |
| 65 to 74 Years | 18 (28.1%) | 52 (41.3%) |
| 75 Years and over | 0 (0.0%) | 0 (0.0%) |
Disability Class: Self-Care Difficulty
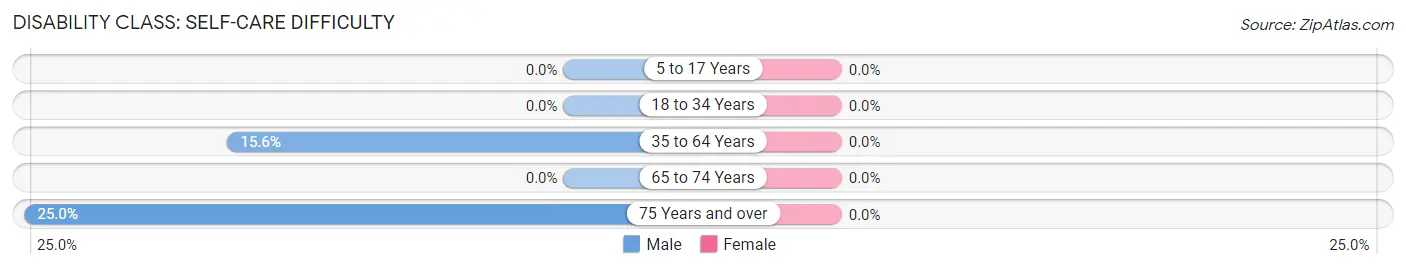
| Age Bracket | Male | Female |
| 5 to 17 Years | 0 (0.0%) | 0 (0.0%) |
| 18 to 34 Years | 0 (0.0%) | 0 (0.0%) |
| 35 to 64 Years | 43 (15.6%) | 0 (0.0%) |
| 65 to 74 Years | 0 (0.0%) | 0 (0.0%) |
| 75 Years and over | 15 (25.0%) | 0 (0.0%) |
Technology Access in Mayer
Computing Device Access in Mayer
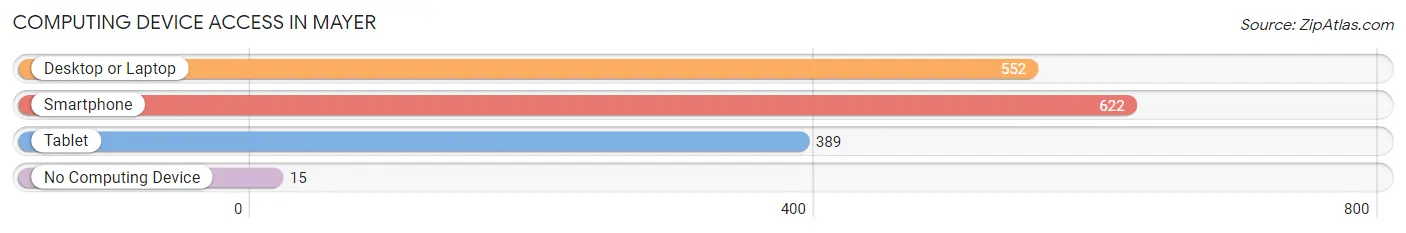
| Device Type | # Households | % Households |
| Desktop or Laptop | 552 | 86.7% |
| Smartphone | 622 | 97.7% |
| Tablet | 389 | 61.1% |
| No Computing Device | 15 | 2.4% |
| Total | 637 | 100.0% |
Internet Access in Mayer
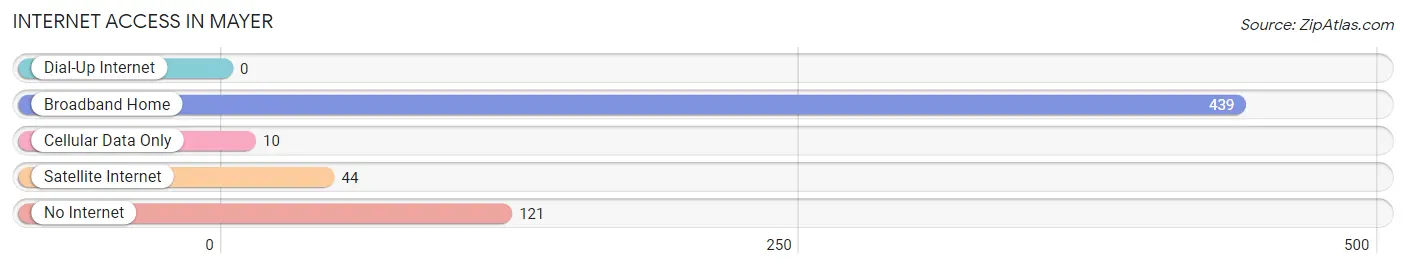
| Internet Type | # Households | % Households |
| Dial-Up Internet | 0 | 0.0% |
| Broadband Home | 439 | 68.9% |
| Cellular Data Only | 10 | 1.6% |
| Satellite Internet | 44 | 6.9% |
| No Internet | 121 | 19.0% |
| Total | 637 | 100.0% |
Mayer Summary
Mayer, Arizona is a small town located in Yavapai County, Arizona. It is situated in the foothills of the Bradshaw Mountains, approximately 30 miles south of Prescott. Mayer has a population of 1,400 people and is known for its rural atmosphere and small-town charm.
History
Mayer was founded in 1882 by German immigrant, John Mayer. He was a miner who had come to the area in search of gold. He established a small mining camp and named it after himself. The town grew slowly over the years, and by the early 1900s, it had become a bustling mining town. The town was home to several saloons, a hotel, a general store, and a post office.
In the early 1900s, Mayer began to experience a decline in its mining industry. This led to a decrease in population and the town began to struggle. In the 1950s, Mayer was revitalized when the Arizona State Highway Department built a road through the town. This allowed for easier access to the surrounding areas and brought new businesses and people to the town.
Geography
Mayer is located in the foothills of the Bradshaw Mountains, approximately 30 miles south of Prescott. The town is situated at an elevation of 4,400 feet and is surrounded by rolling hills and mountains. The town is located in a semi-arid climate, with hot summers and mild winters. The average annual precipitation is approximately 12 inches.
Economy
Mayer’s economy is largely based on tourism and agriculture. The town is home to several small businesses, including restaurants, shops, and a gas station. The town is also home to a number of farms and ranches, which produce hay, cattle, and other agricultural products.
Demographics
As of the 2010 census, Mayer had a population of 1,400 people. The racial makeup of the town was 94.3% White, 0.7% Native American, 0.3% Asian, 0.1% Pacific Islander, 0.1% from other races, and 4.5% from two or more races. The median household income was $37,500 and the median family income was $41,250.
Conclusion
Mayer, Arizona is a small town located in Yavapai County, Arizona. It is situated in the foothills of the Bradshaw Mountains, approximately 30 miles south of Prescott. Mayer has a population of 1,400 people and is known for its rural atmosphere and small-town charm. The town’s economy is largely based on tourism and agriculture, and the town is home to several small businesses, farms, and ranches. The racial makeup of the town is 94.3% White, 0.7% Native American, 0.3% Asian, 0.1% Pacific Islander, 0.1% from other races, and 4.5% from two or more races. The median household income was $37,500 and the median family income was $41,250.
Common Questions
What is Per Capita Income in Mayer?
Per Capita income in Mayer is $34,270.
What is the Median Family Income in Mayer?
Median Family Income in Mayer is $58,750.
What is the Median Household income in Mayer?
Median Household Income in Mayer is $53,424.
What is Income or Wage Gap in Mayer?
Income or Wage Gap in Mayer is 11.8%.
Women in Mayer earn 88.2 cents for every dollar earned by a man.
What is Inequality or Gini Index in Mayer?
Inequality or Gini Index in Mayer is 0.33.
What is the Total Population of Mayer?
Total Population of Mayer is 920.
What is the Total Male Population of Mayer?
Total Male Population of Mayer is 400.
What is the Total Female Population of Mayer?
Total Female Population of Mayer is 520.
What is the Ratio of Males per 100 Females in Mayer?
There are 76.92 Males per 100 Females in Mayer.
What is the Ratio of Females per 100 Males in Mayer?
There are 130.00 Females per 100 Males in Mayer.
What is the Median Population Age in Mayer?
Median Population Age in Mayer is 54.3 Years.
What is the Average Family Size in Mayer
Average Family Size in Mayer is 1.9 People.
What is the Average Household Size in Mayer
Average Household Size in Mayer is 1.4 People.
How Large is the Labor Force in Mayer?
There are 541 People in the Labor Forcein in Mayer.
What is the Percentage of People in the Labor Force in Mayer?
60.9% of People are in the Labor Force in Mayer.