Jerome, AZ Map & Demographics
Jerome Map
Jerome Overview
$29,542
PER CAPITA INCOME
$90,179
AVG FAMILY INCOME
$35,208
AVG HOUSEHOLD INCOME
23.7%
WAGE / INCOME GAP [ % ]
76.3¢/ $1
WAGE / INCOME GAP [ $ ]
0.42
INEQUALITY / GINI INDEX
363
TOTAL POPULATION
172
MALE POPULATION
191
FEMALE POPULATION
90.05
MALES / 100 FEMALES
111.05
FEMALES / 100 MALES
57.0
MEDIAN AGE
2.3
AVG FAMILY SIZE
1.6
AVG HOUSEHOLD SIZE
210
LABOR FORCE [ PEOPLE ]
61.9%
PERCENT IN LABOR FORCE
6.3%
UNEMPLOYMENT RATE
Jerome Zip Codes
Jerome Area Codes
Income in Jerome
Income Overview in Jerome
Per Capita Income in Jerome is $29,542, while median incomes of families and households are $90,179 and $35,208 respectively.
| Characteristic | Number | Measure |
| Per Capita Income | 363 | $29,542 |
| Median Family Income | 81 | $90,179 |
| Mean Family Income | 81 | $75,295 |
| Median Household Income | 228 | $35,208 |
| Mean Household Income | 228 | $47,154 |
| Income Deficit | 81 | $0 |
| Wage / Income Gap (%) | 363 | 23.69% |
| Wage / Income Gap ($) | 363 | 76.31¢ per $1 |
| Gini / Inequality Index | 363 | 0.42 |
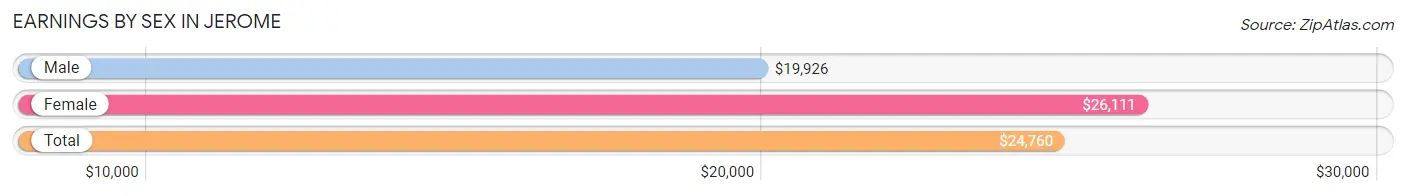
Earnings by Sex in Jerome
Average Earnings in Jerome are $24,760, $19,926 for men and $26,111 for women, a difference of 23.7%.
| Sex | Number | Average Earnings |
| Male | 121 (52.4%) | $19,926 |
| Female | 110 (47.6%) | $26,111 |
| Total | 231 (100.0%) | $24,760 |
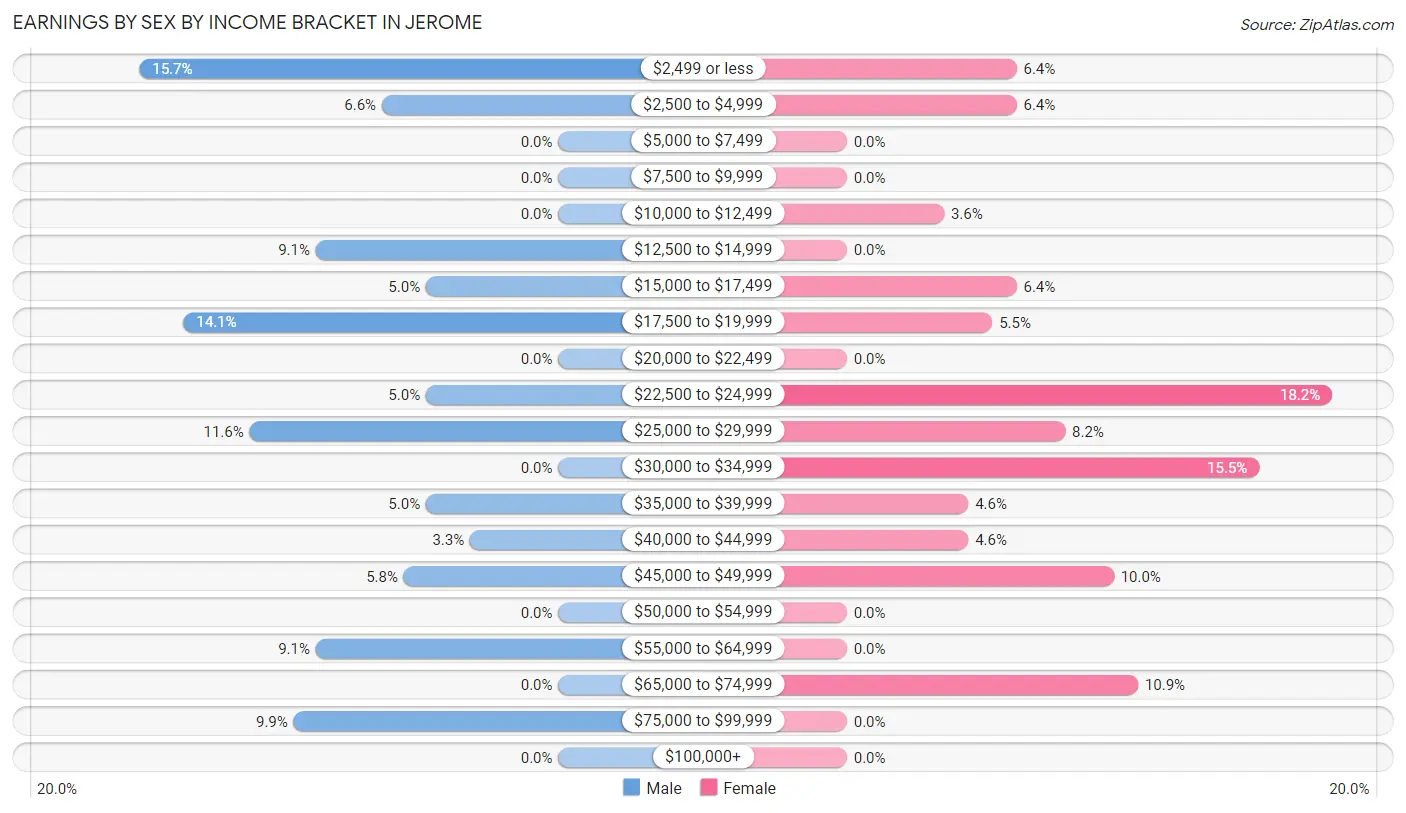
Earnings by Sex by Income Bracket in Jerome
The most common earnings brackets in Jerome are $2,499 or less for men (19 | 15.7%) and $22,500 to $24,999 for women (20 | 18.2%).
| Income | Male | Female |
| $2,499 or less | 19 (15.7%) | 7 (6.4%) |
| $2,500 to $4,999 | 8 (6.6%) | 7 (6.4%) |
| $5,000 to $7,499 | 0 (0.0%) | 0 (0.0%) |
| $7,500 to $9,999 | 0 (0.0%) | 0 (0.0%) |
| $10,000 to $12,499 | 0 (0.0%) | 4 (3.6%) |
| $12,500 to $14,999 | 11 (9.1%) | 0 (0.0%) |
| $15,000 to $17,499 | 6 (5.0%) | 7 (6.4%) |
| $17,500 to $19,999 | 17 (14.1%) | 6 (5.4%) |
| $20,000 to $22,499 | 0 (0.0%) | 0 (0.0%) |
| $22,500 to $24,999 | 6 (5.0%) | 20 (18.2%) |
| $25,000 to $29,999 | 14 (11.6%) | 9 (8.2%) |
| $30,000 to $34,999 | 0 (0.0%) | 17 (15.4%) |
| $35,000 to $39,999 | 6 (5.0%) | 5 (4.5%) |
| $40,000 to $44,999 | 4 (3.3%) | 5 (4.5%) |
| $45,000 to $49,999 | 7 (5.8%) | 11 (10.0%) |
| $50,000 to $54,999 | 0 (0.0%) | 0 (0.0%) |
| $55,000 to $64,999 | 11 (9.1%) | 0 (0.0%) |
| $65,000 to $74,999 | 0 (0.0%) | 12 (10.9%) |
| $75,000 to $99,999 | 12 (9.9%) | 0 (0.0%) |
| $100,000+ | 0 (0.0%) | 0 (0.0%) |
| Total | 121 (100.0%) | 110 (100.0%) |
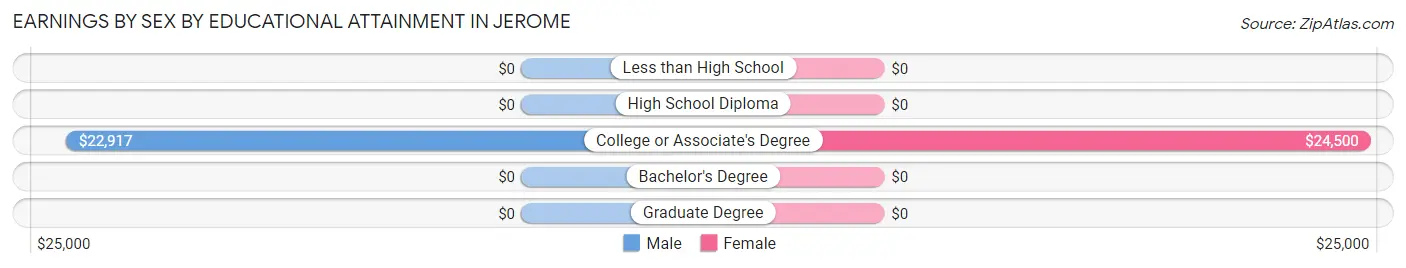
Earnings by Sex by Educational Attainment in Jerome
Average earnings in Jerome are $23,125 for men and $26,111 for women, a difference of 11.4%. Men with an educational attainment of college or associate's degree enjoy the highest average annual earnings of $22,917, while those with college or associate's degree education earn the least with $22,917. Women with an educational attainment of college or associate's degree earn the most with the average annual earnings of $24,500, while those with college or associate's degree education have the smallest earnings of $24,500.
| Educational Attainment | Male Income | Female Income |
| Less than High School | - | - |
| High School Diploma | - | - |
| College or Associate's Degree | $22,917 | $24,500 |
| Bachelor's Degree | - | - |
| Graduate Degree | - | - |
| Total | $23,125 | $26,111 |
Family Income in Jerome
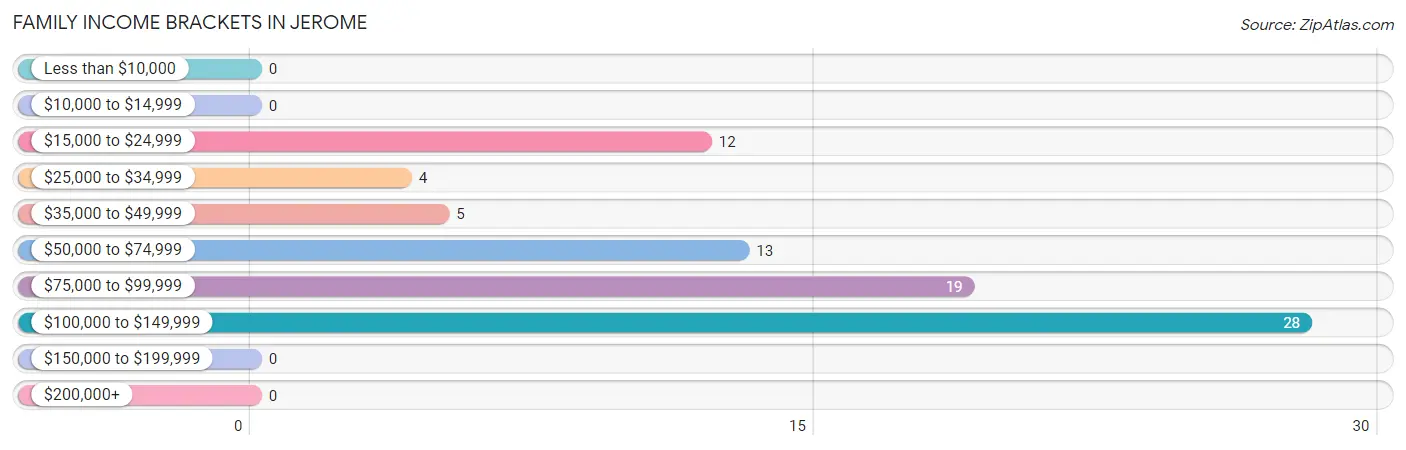
Family Income Brackets in Jerome
According to the Jerome family income data, there are 28 families falling into the $100,000 to $149,999 income range, which is the most common income bracket and makes up 34.6% of all families.
| Income Bracket | # Families | % Families |
| Less than $10,000 | 0 | 0.0% |
| $10,000 to $14,999 | 0 | 0.0% |
| $15,000 to $24,999 | 12 | 14.8% |
| $25,000 to $34,999 | 4 | 4.9% |
| $35,000 to $49,999 | 5 | 6.2% |
| $50,000 to $74,999 | 13 | 16.0% |
| $75,000 to $99,999 | 19 | 23.5% |
| $100,000 to $149,999 | 28 | 34.6% |
| $150,000 to $199,999 | 0 | 0.0% |
| $200,000+ | 0 | 0.0% |
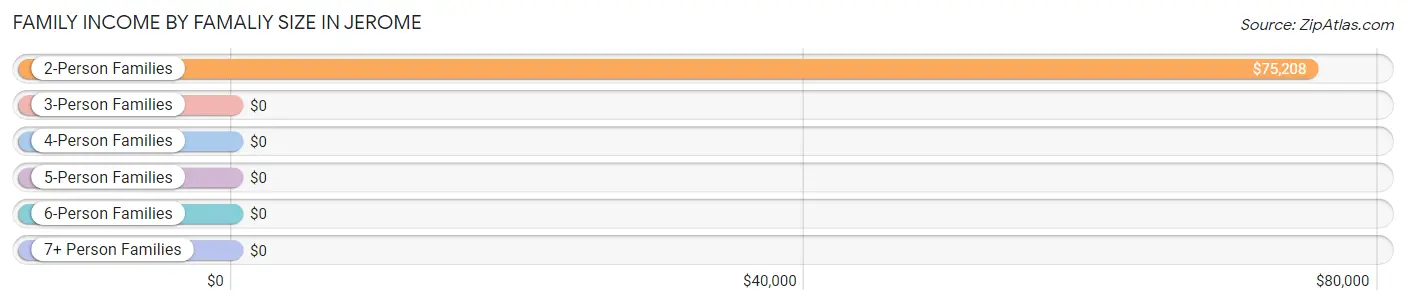
Family Income by Famaliy Size in Jerome
2-person families (69 | 85.2%) account for the highest median family income in Jerome with $75,208 per family, while 2-person families (69 | 85.2%) have the highest median income of $37,604 per family member.
| Income Bracket | # Families | Median Income |
| 2-Person Families | 69 (85.2%) | $75,208 |
| 3-Person Families | 0 (0.0%) | $0 |
| 4-Person Families | 12 (14.8%) | $0 |
| 5-Person Families | 0 (0.0%) | $0 |
| 6-Person Families | 0 (0.0%) | $0 |
| 7+ Person Families | 0 (0.0%) | $0 |
| Total | 81 (100.0%) | $90,179 |
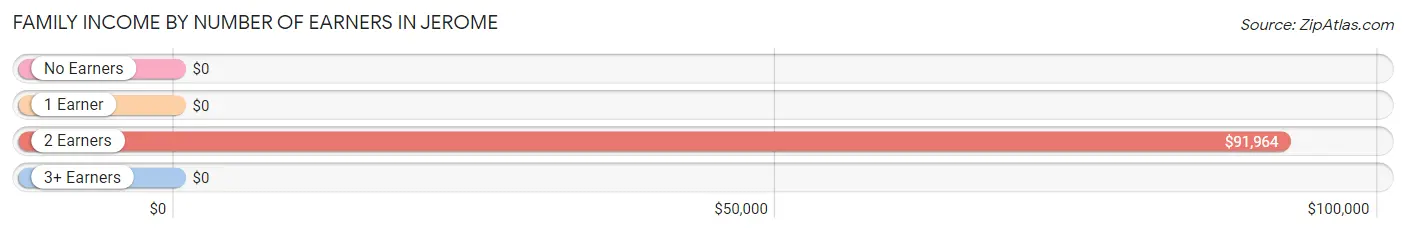
Family Income by Number of Earners in Jerome
| Number of Earners | # Families | Median Income |
| No Earners | 5 (6.2%) | $0 |
| 1 Earner | 27 (33.3%) | $0 |
| 2 Earners | 49 (60.5%) | $91,964 |
| 3+ Earners | 0 (0.0%) | $0 |
| Total | 81 (100.0%) | $90,179 |
Household Income in Jerome
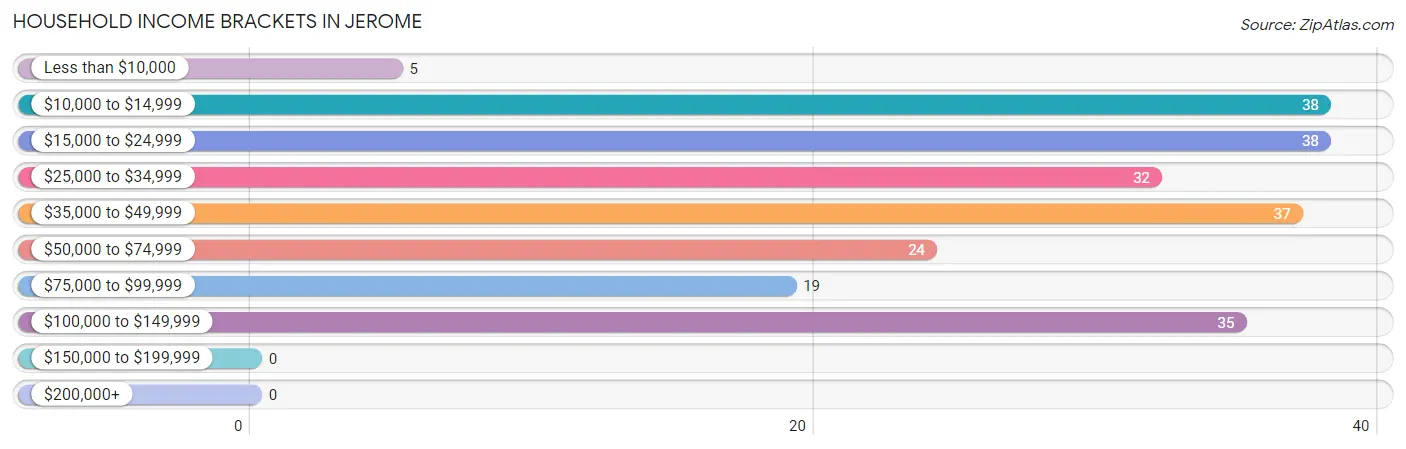
Household Income Brackets in Jerome
With 38 households falling in the category, the $10,000 to $14,999 income range is the most frequent in Jerome, accounting for 16.7% of all households.
| Income Bracket | # Households | % Households |
| Less than $10,000 | 5 | 2.2% |
| $10,000 to $14,999 | 38 | 16.7% |
| $15,000 to $24,999 | 38 | 16.7% |
| $25,000 to $34,999 | 32 | 14.0% |
| $35,000 to $49,999 | 37 | 16.2% |
| $50,000 to $74,999 | 24 | 10.5% |
| $75,000 to $99,999 | 19 | 8.3% |
| $100,000 to $149,999 | 35 | 15.4% |
| $150,000 to $199,999 | 0 | 0.0% |
| $200,000+ | 0 | 0.0% |
Household Income by Householder Age in Jerome
The median household income in Jerome is $35,208, with the highest median household income of $48,750 found in the 45 to 64 years age bracket for the primary householder. A total of 100 households (43.9%) fall into this category. Meanwhile, the 15 to 24 years age bracket for the primary householder has the lowest median household income of $0, with 4 households (1.8%) in this group.
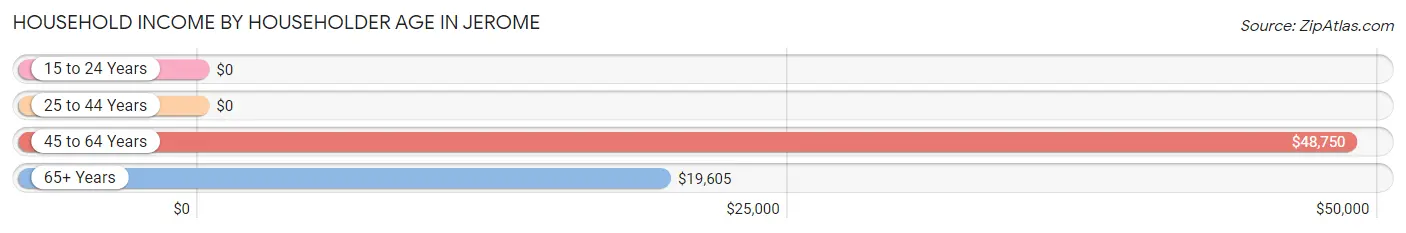
| Income Bracket | # Households | Median Income |
| 15 to 24 Years | 4 (1.8%) | $0 |
| 25 to 44 Years | 16 (7.0%) | $0 |
| 45 to 64 Years | 100 (43.9%) | $48,750 |
| 65+ Years | 108 (47.4%) | $19,605 |
| Total | 228 (100.0%) | $35,208 |
Poverty in Jerome
Income Below Poverty by Sex and Age in Jerome
With 23.3% poverty level for males and 16.8% for females among the residents of Jerome, 65 to 74 year old males and 75 year old and over females are the most vulnerable to poverty, with 22 males (37.9%) and 11 females (64.7%) in their respective age groups living below the poverty level.
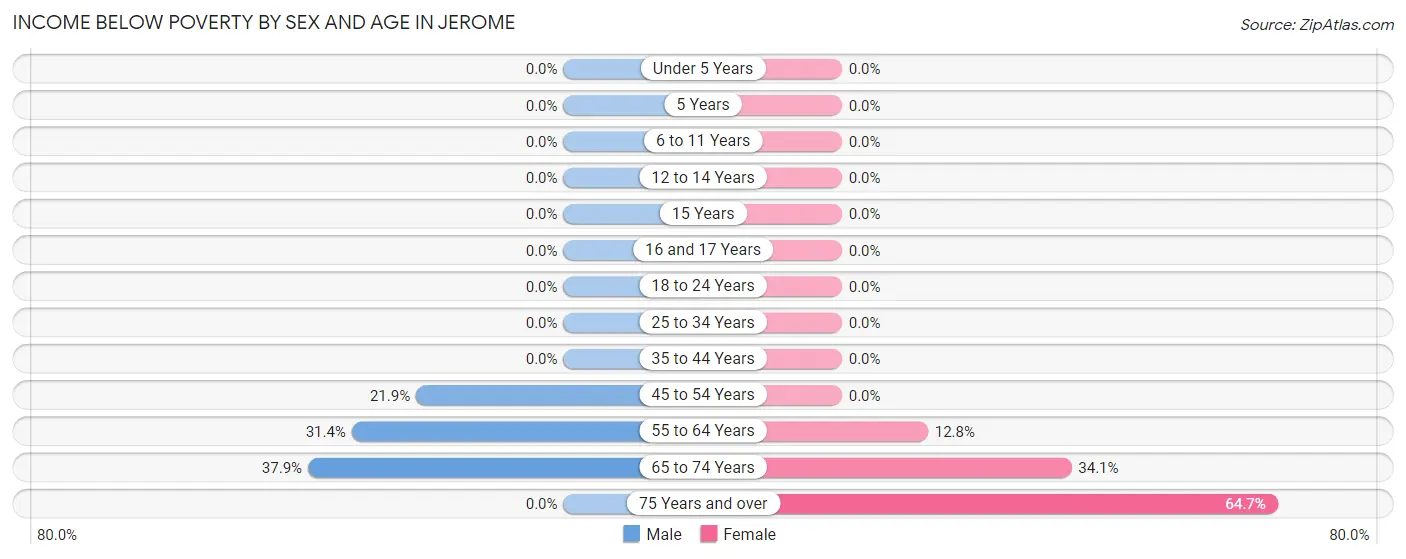
| Age Bracket | Male | Female |
| Under 5 Years | 0 (0.0%) | 0 (0.0%) |
| 5 Years | 0 (0.0%) | 0 (0.0%) |
| 6 to 11 Years | 0 (0.0%) | 0 (0.0%) |
| 12 to 14 Years | 0 (0.0%) | 0 (0.0%) |
| 15 Years | 0 (0.0%) | 0 (0.0%) |
| 16 and 17 Years | 0 (0.0%) | 0 (0.0%) |
| 18 to 24 Years | 0 (0.0%) | 0 (0.0%) |
| 25 to 34 Years | 0 (0.0%) | 0 (0.0%) |
| 35 to 44 Years | 0 (0.0%) | 0 (0.0%) |
| 45 to 54 Years | 7 (21.9%) | 0 (0.0%) |
| 55 to 64 Years | 11 (31.4%) | 6 (12.8%) |
| 65 to 74 Years | 22 (37.9%) | 15 (34.1%) |
| 75 Years and over | 0 (0.0%) | 11 (64.7%) |
| Total | 40 (23.3%) | 32 (16.8%) |
Income Above Poverty by Sex and Age in Jerome
According to the poverty statistics in Jerome, males aged 6 to 11 years and females aged under 5 years are the age groups that are most secure financially, with 100.0% of males and 100.0% of females in these age groups living above the poverty line.
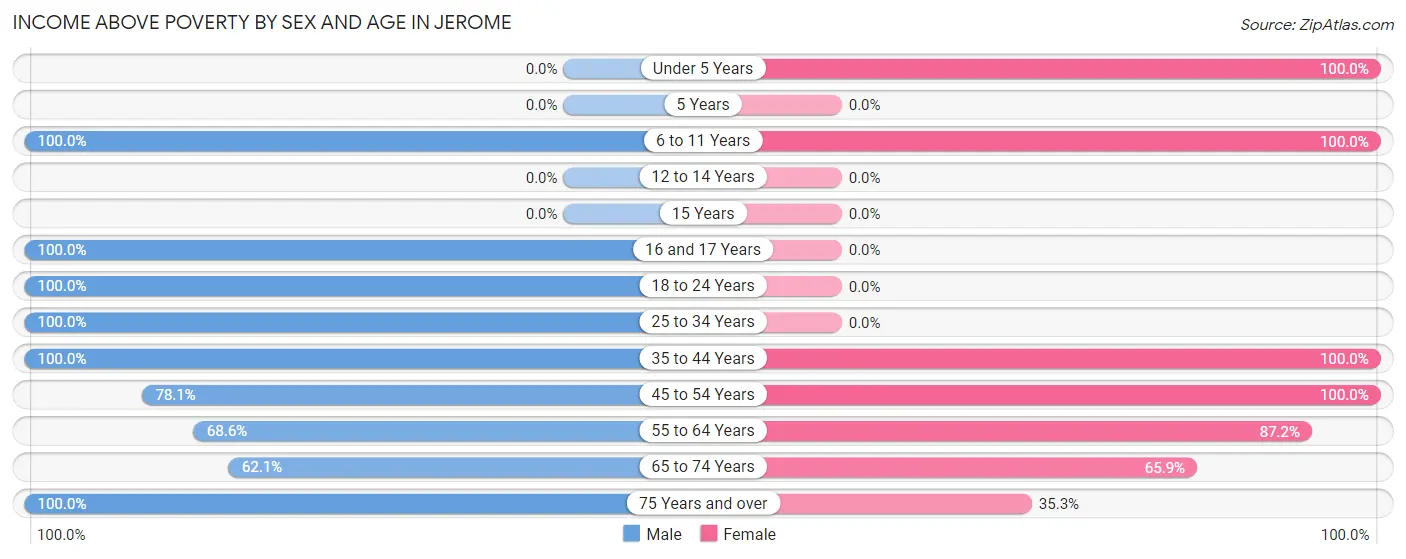
| Age Bracket | Male | Female |
| Under 5 Years | 0 (0.0%) | 6 (100.0%) |
| 5 Years | 0 (0.0%) | 0 (0.0%) |
| 6 to 11 Years | 7 (100.0%) | 11 (100.0%) |
| 12 to 14 Years | 0 (0.0%) | 0 (0.0%) |
| 15 Years | 0 (0.0%) | 0 (0.0%) |
| 16 and 17 Years | 12 (100.0%) | 0 (0.0%) |
| 18 to 24 Years | 4 (100.0%) | 0 (0.0%) |
| 25 to 34 Years | 6 (100.0%) | 0 (0.0%) |
| 35 to 44 Years | 13 (100.0%) | 14 (100.0%) |
| 45 to 54 Years | 25 (78.1%) | 52 (100.0%) |
| 55 to 64 Years | 24 (68.6%) | 41 (87.2%) |
| 65 to 74 Years | 36 (62.1%) | 29 (65.9%) |
| 75 Years and over | 5 (100.0%) | 6 (35.3%) |
| Total | 132 (76.7%) | 159 (83.3%) |
Income Below Poverty Among Married-Couple Families in Jerome
The poverty statistics for married-couple families in Jerome show that 14.6% or 6 of the total 41 families live below the poverty line. Families with no children have the highest poverty rate of 14.6%, comprising of 6 families. On the other hand, families with no children have the lowest poverty rate of 14.6%, which includes 6 families.
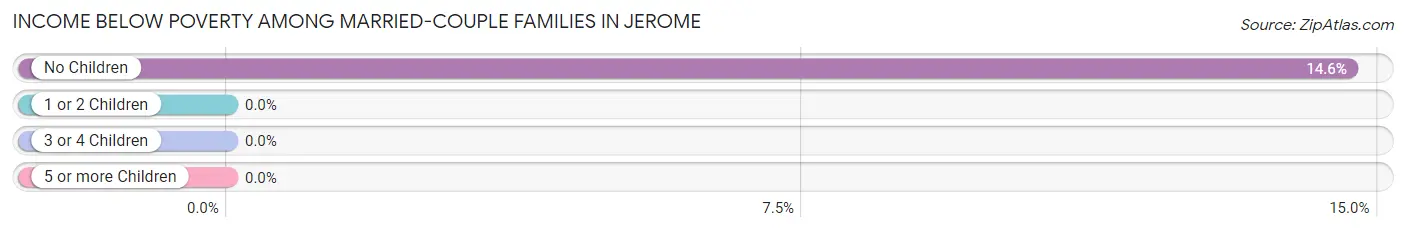
| Children | Above Poverty | Below Poverty |
| No Children | 35 (85.4%) | 6 (14.6%) |
| 1 or 2 Children | 0 (0.0%) | 0 (0.0%) |
| 3 or 4 Children | 0 (0.0%) | 0 (0.0%) |
| 5 or more Children | 0 (0.0%) | 0 (0.0%) |
| Total | 35 (85.4%) | 6 (14.6%) |
Income Below Poverty Among Single-Parent Households in Jerome
| Children | Single Father | Single Mother |
| No Children | 0 (0.0%) | 0 (0.0%) |
| 1 or 2 Children | 0 (0.0%) | 0 (0.0%) |
| 3 or 4 Children | 0 (0.0%) | 0 (0.0%) |
| 5 or more Children | 0 (0.0%) | 0 (0.0%) |
| Total | 0 (0.0%) | 0 (0.0%) |
Income Below Poverty Among Married-Couple vs Single-Parent Households in Jerome
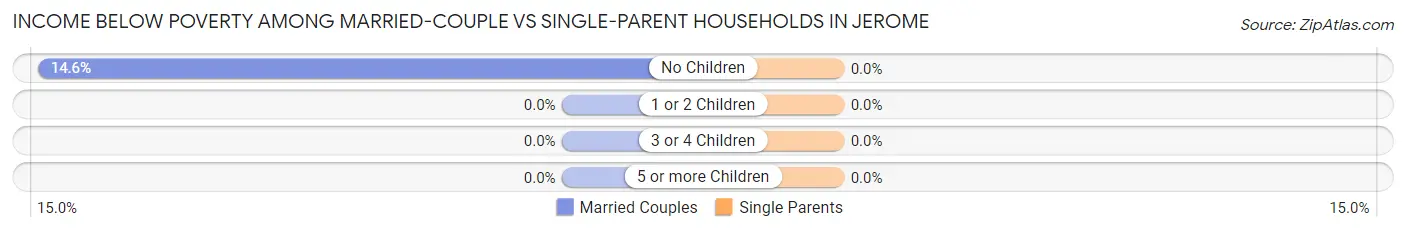
| Children | Married-Couple Families | Single-Parent Households |
| No Children | 6 (14.6%) | 0 (0.0%) |
| 1 or 2 Children | 0 (0.0%) | 0 (0.0%) |
| 3 or 4 Children | 0 (0.0%) | 0 (0.0%) |
| 5 or more Children | 0 (0.0%) | 0 (0.0%) |
| Total | 6 (14.6%) | 0 (0.0%) |
Race in Jerome
The most populous races in Jerome are White / Caucasian (346 | 95.3%), Hispanic or Latino (27 | 7.4%), and Some other Race (13 | 3.6%).
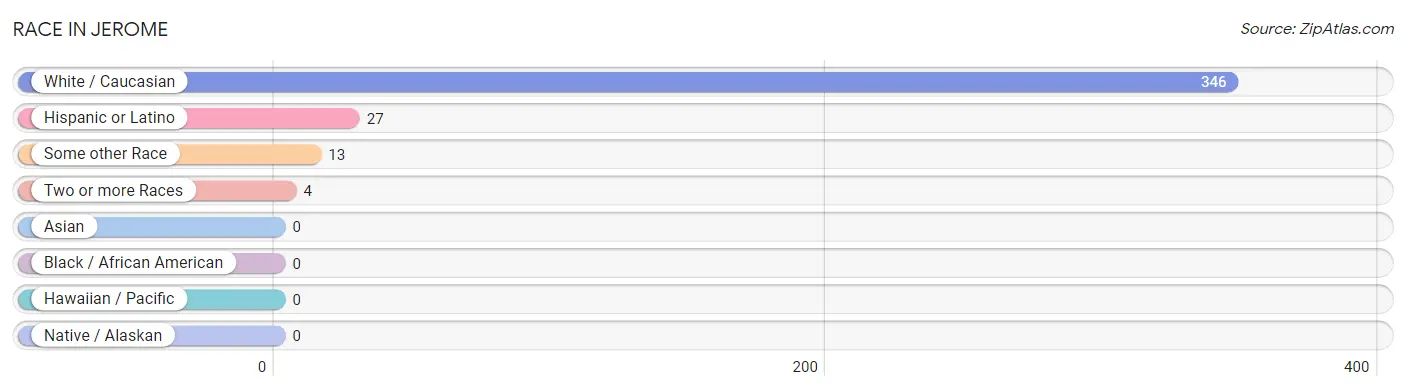
| Race | # Population | % Population |
| Asian | 0 | 0.0% |
| Black / African American | 0 | 0.0% |
| Hawaiian / Pacific | 0 | 0.0% |
| Hispanic or Latino | 27 | 7.4% |
| Native / Alaskan | 0 | 0.0% |
| White / Caucasian | 346 | 95.3% |
| Two or more Races | 4 | 1.1% |
| Some other Race | 13 | 3.6% |
| Total | 363 | 100.0% |
Ancestry in Jerome
The most populous ancestries reported in Jerome are English (91 | 25.1%), German (88 | 24.2%), American (54 | 14.9%), Scottish (46 | 12.7%), and Irish (35 | 9.6%), together accounting for 86.5% of all Jerome residents.
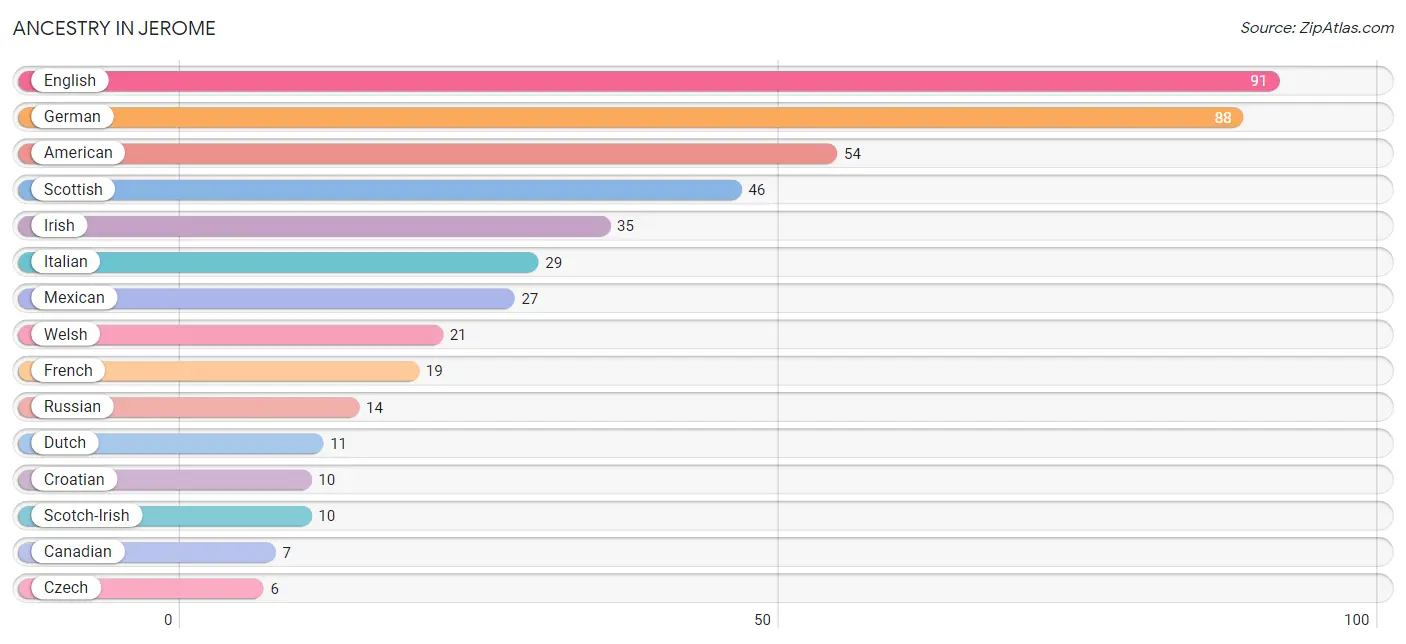
| Ancestry | # Population | % Population |
| American | 54 | 14.9% |
| Arab | 5 | 1.4% |
| Canadian | 7 | 1.9% |
| Croatian | 10 | 2.8% |
| Czech | 6 | 1.7% |
| Dutch | 11 | 3.0% |
| English | 91 | 25.1% |
| French | 19 | 5.2% |
| German | 88 | 24.2% |
| Hungarian | 6 | 1.7% |
| Irish | 35 | 9.6% |
| Italian | 29 | 8.0% |
| Luxembourger | 6 | 1.7% |
| Mexican | 27 | 7.4% |
| Norwegian | 6 | 1.7% |
| Polish | 6 | 1.7% |
| Russian | 14 | 3.9% |
| Scotch-Irish | 10 | 2.8% |
| Scottish | 46 | 12.7% |
| Swedish | 6 | 1.7% |
| Swiss | 5 | 1.4% |
| Syrian | 5 | 1.4% |
| Welsh | 21 | 5.8% | View All 23 Rows |
Immigrants in Jerome
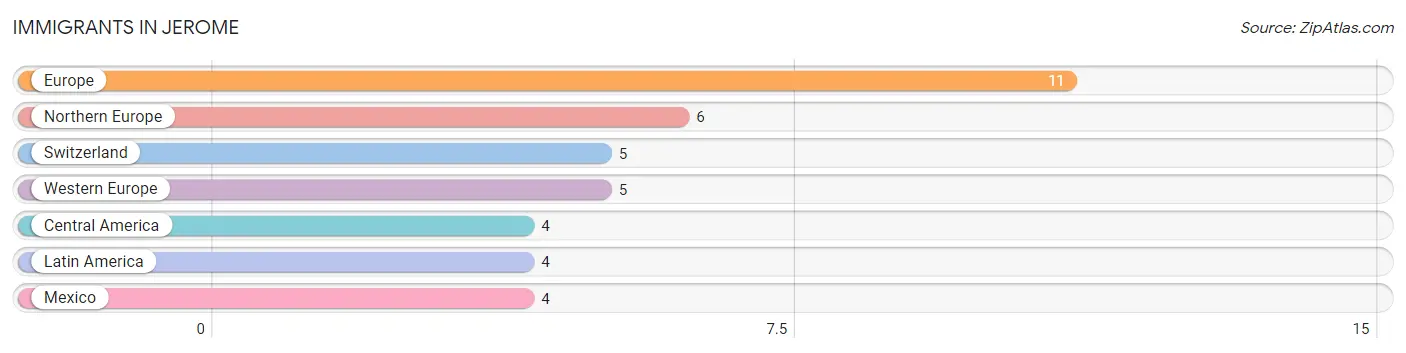
The most numerous immigrant groups reported in Jerome came from Europe (11 | 3.0%), Northern Europe (6 | 1.7%), Switzerland (5 | 1.4%), Western Europe (5 | 1.4%), and Central America (4 | 1.1%), together accounting for 8.5% of all Jerome residents.
| Immigration Origin | # Population | % Population |
| Central America | 4 | 1.1% |
| Europe | 11 | 3.0% |
| Latin America | 4 | 1.1% |
| Mexico | 4 | 1.1% |
| Northern Europe | 6 | 1.7% |
| Switzerland | 5 | 1.4% |
| Western Europe | 5 | 1.4% | View All 7 Rows |
Sex and Age in Jerome
Sex and Age in Jerome
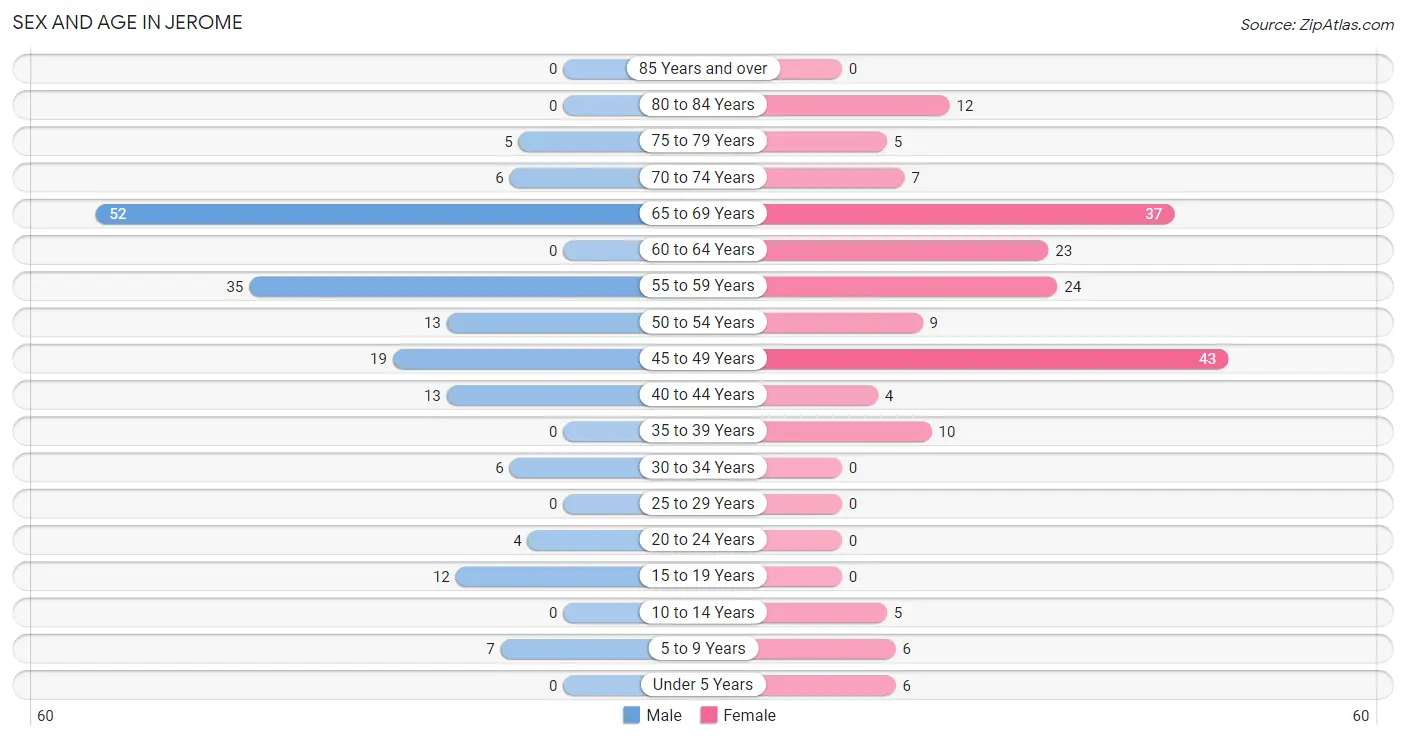
The most populous age groups in Jerome are 65 to 69 Years (52 | 30.2%) for men and 45 to 49 Years (43 | 22.5%) for women.
| Age Bracket | Male | Female |
| Under 5 Years | 0 (0.0%) | 6 (3.1%) |
| 5 to 9 Years | 7 (4.1%) | 6 (3.1%) |
| 10 to 14 Years | 0 (0.0%) | 5 (2.6%) |
| 15 to 19 Years | 12 (7.0%) | 0 (0.0%) |
| 20 to 24 Years | 4 (2.3%) | 0 (0.0%) |
| 25 to 29 Years | 0 (0.0%) | 0 (0.0%) |
| 30 to 34 Years | 6 (3.5%) | 0 (0.0%) |
| 35 to 39 Years | 0 (0.0%) | 10 (5.2%) |
| 40 to 44 Years | 13 (7.6%) | 4 (2.1%) |
| 45 to 49 Years | 19 (11.1%) | 43 (22.5%) |
| 50 to 54 Years | 13 (7.6%) | 9 (4.7%) |
| 55 to 59 Years | 35 (20.3%) | 24 (12.6%) |
| 60 to 64 Years | 0 (0.0%) | 23 (12.0%) |
| 65 to 69 Years | 52 (30.2%) | 37 (19.4%) |
| 70 to 74 Years | 6 (3.5%) | 7 (3.7%) |
| 75 to 79 Years | 5 (2.9%) | 5 (2.6%) |
| 80 to 84 Years | 0 (0.0%) | 12 (6.3%) |
| 85 Years and over | 0 (0.0%) | 0 (0.0%) |
| Total | 172 (100.0%) | 191 (100.0%) |
Families and Households in Jerome
Median Family Size in Jerome
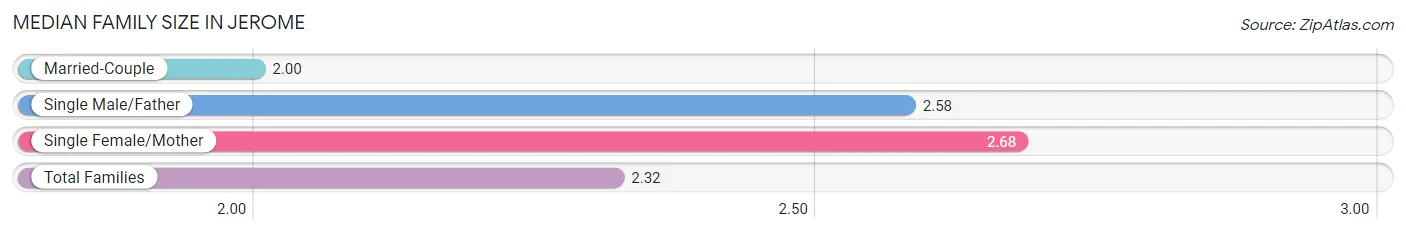
The median family size in Jerome is 2.32 persons per family, with single female/mother families (28 | 34.6%) accounting for the largest median family size of 2.68 persons per family. On the other hand, married-couple families (41 | 50.6%) represent the smallest median family size with 2.00 persons per family.
| Family Type | # Families | Family Size |
| Married-Couple | 41 (50.6%) | 2.00 |
| Single Male/Father | 12 (14.8%) | 2.58 |
| Single Female/Mother | 28 (34.6%) | 2.68 |
| Total Families | 81 (100.0%) | 2.32 |
Median Household Size in Jerome
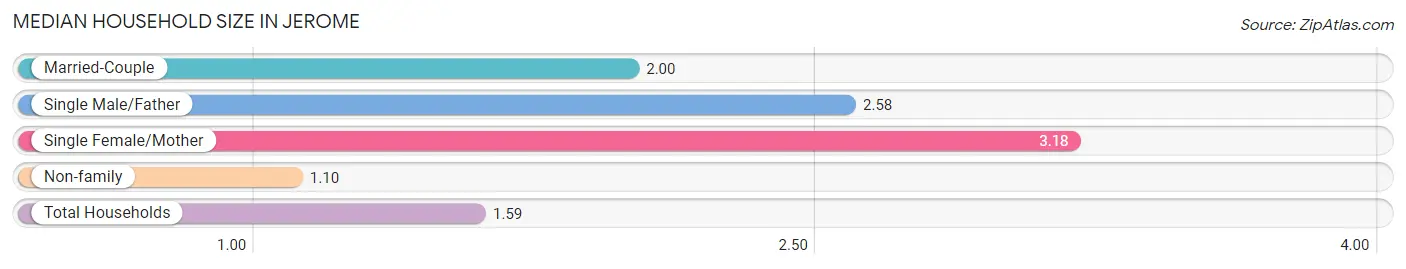
The median household size in Jerome is 1.59 persons per household, with single female/mother households (28 | 12.3%) accounting for the largest median household size of 3.18 persons per household. non-family households (147 | 64.5%) represent the smallest median household size with 1.10 persons per household.
| Household Type | # Households | Household Size |
| Married-Couple | 41 (18.0%) | 2.00 |
| Single Male/Father | 12 (5.3%) | 2.58 |
| Single Female/Mother | 28 (12.3%) | 3.18 |
| Non-family | 147 (64.5%) | 1.10 |
| Total Households | 228 (100.0%) | 1.59 |
Household Size by Marriage Status in Jerome
Out of a total of 228 households in Jerome, 81 (35.5%) are family households, while 147 (64.5%) are nonfamily households. The most numerous type of family households are 2-person households, comprising 64, and the most common type of nonfamily households are 1-person households, comprising 129.
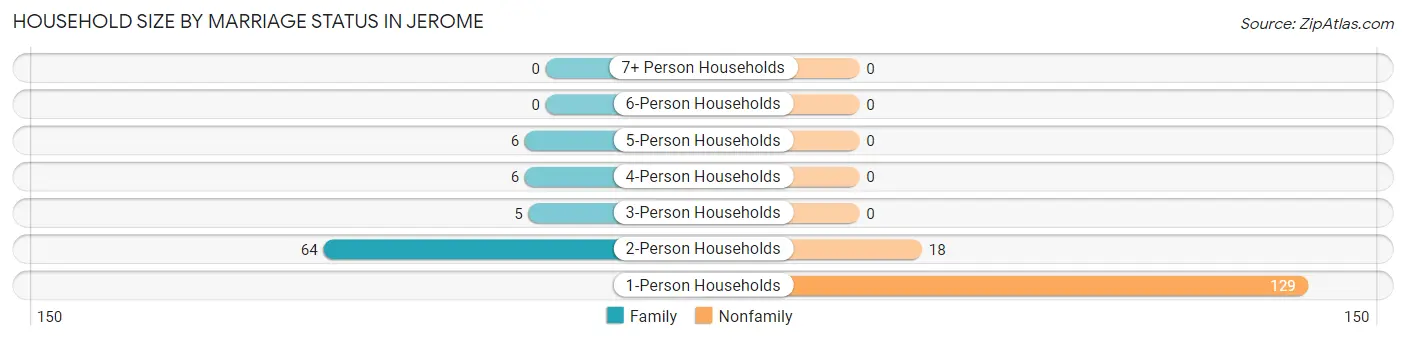
| Household Size | Family Households | Nonfamily Households |
| 1-Person Households | - | 129 (56.6%) |
| 2-Person Households | 64 (28.1%) | 18 (7.9%) |
| 3-Person Households | 5 (2.2%) | 0 (0.0%) |
| 4-Person Households | 6 (2.6%) | 0 (0.0%) |
| 5-Person Households | 6 (2.6%) | 0 (0.0%) |
| 6-Person Households | 0 (0.0%) | 0 (0.0%) |
| 7+ Person Households | 0 (0.0%) | 0 (0.0%) |
| Total | 81 (35.5%) | 147 (64.5%) |
Female Fertility in Jerome
Fertility by Age in Jerome
Average fertility rate in Jerome is 88.0 births per 1,000 women. Women in the age bracket of 35 to 50 years have the highest fertility rate with 88.0 births per 1,000 women. Women in the age bracket of 35 to 50 years acount for 100.0% of all women with births.
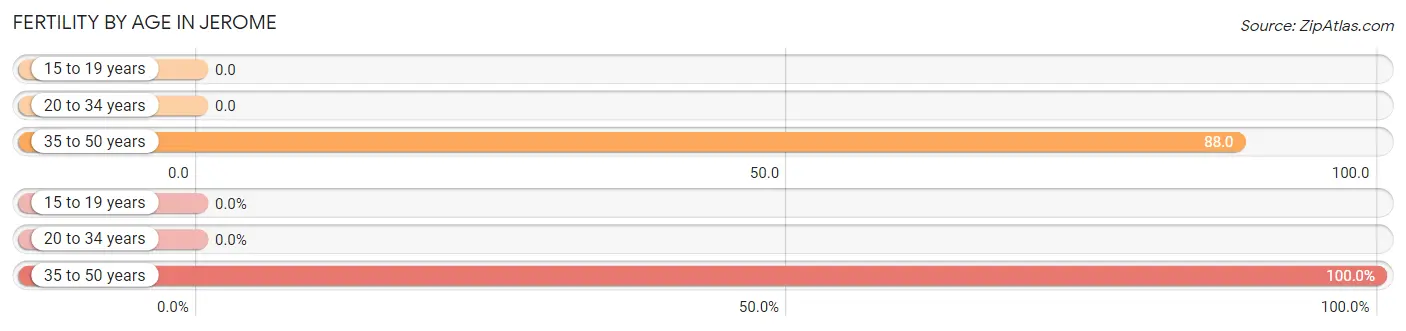
| Age Bracket | Women with Births | Births / 1,000 Women |
| 15 to 19 years | 0 (0.0%) | 0.0 |
| 20 to 34 years | 0 (0.0%) | 0.0 |
| 35 to 50 years | 5 (100.0%) | 88.0 |
| Total | 5 (100.0%) | 88.0 |
Fertility by Age by Marriage Status in Jerome
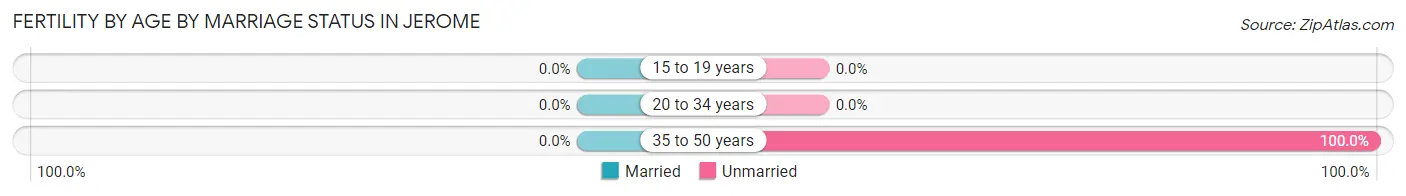
| Age Bracket | Married | Unmarried |
| 15 to 19 years | 0 (0.0%) | 0 (0.0%) |
| 20 to 34 years | 0 (0.0%) | 0 (0.0%) |
| 35 to 50 years | 0 (0.0%) | 5 (100.0%) |
| Total | 0 (0.0%) | 5 (100.0%) |
Fertility by Education in Jerome
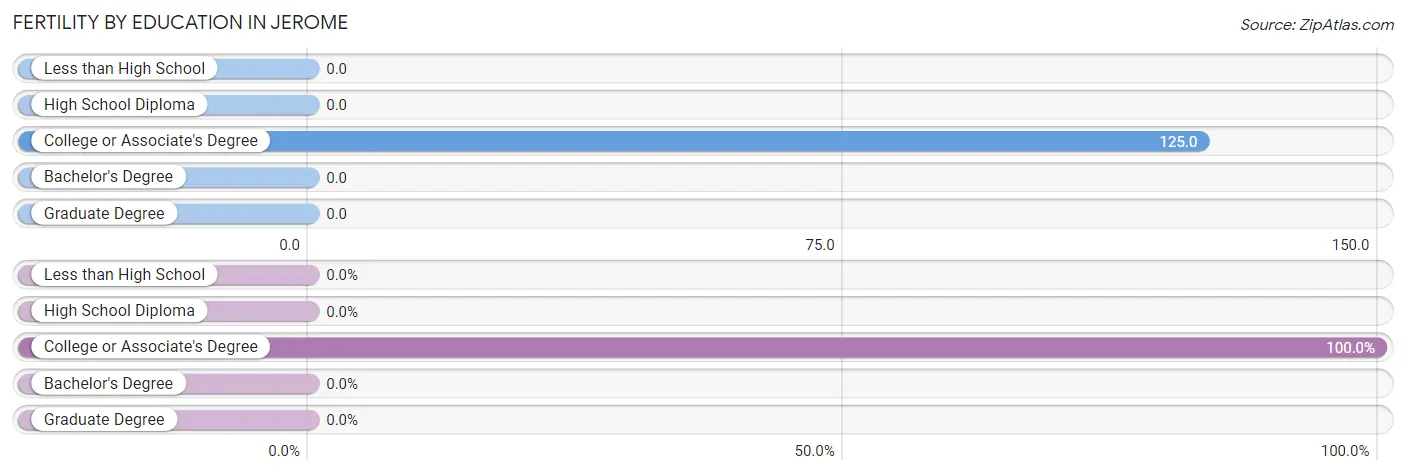
| Educational Attainment | Women with Births | Births / 1,000 Women |
| Less than High School | 0 (0.0%) | 0.0 |
| High School Diploma | 0 (0.0%) | 0.0 |
| College or Associate's Degree | 5 (100.0%) | 125.0 |
| Bachelor's Degree | 0 (0.0%) | 0.0 |
| Graduate Degree | 0 (0.0%) | 0.0 |
| Total | 5 (100.0%) | 88.0 |
Fertility by Education by Marriage Status in Jerome
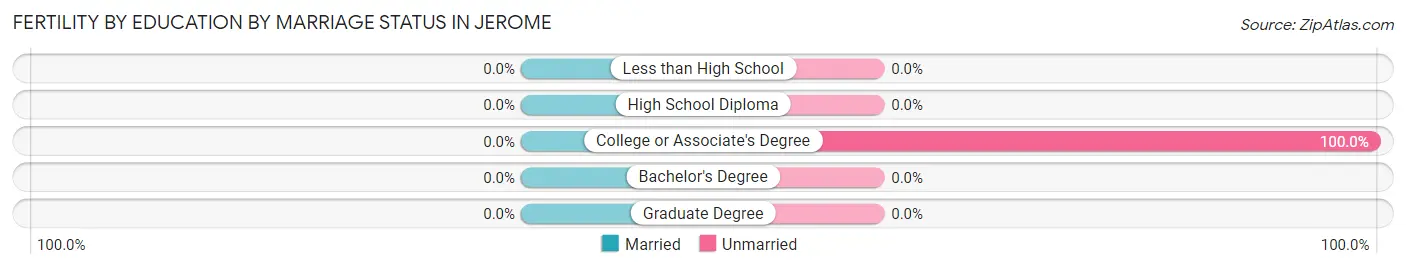
| Educational Attainment | Married | Unmarried |
| Less than High School | 0 (0.0%) | 0 (0.0%) |
| High School Diploma | 0 (0.0%) | 0 (0.0%) |
| College or Associate's Degree | 0 (0.0%) | 5 (100.0%) |
| Bachelor's Degree | 0 (0.0%) | 0 (0.0%) |
| Graduate Degree | 0 (0.0%) | 0 (0.0%) |
| Total | 0 (0.0%) | 5 (100.0%) |
Employment Characteristics in Jerome
Employment by Class of Employer in Jerome
Among the 191 employed individuals in Jerome, self-employed (not incorporated) (78 | 40.8%), private company employees (77 | 40.3%), and local government employees (17 | 8.9%) make up the most common classes of employment.
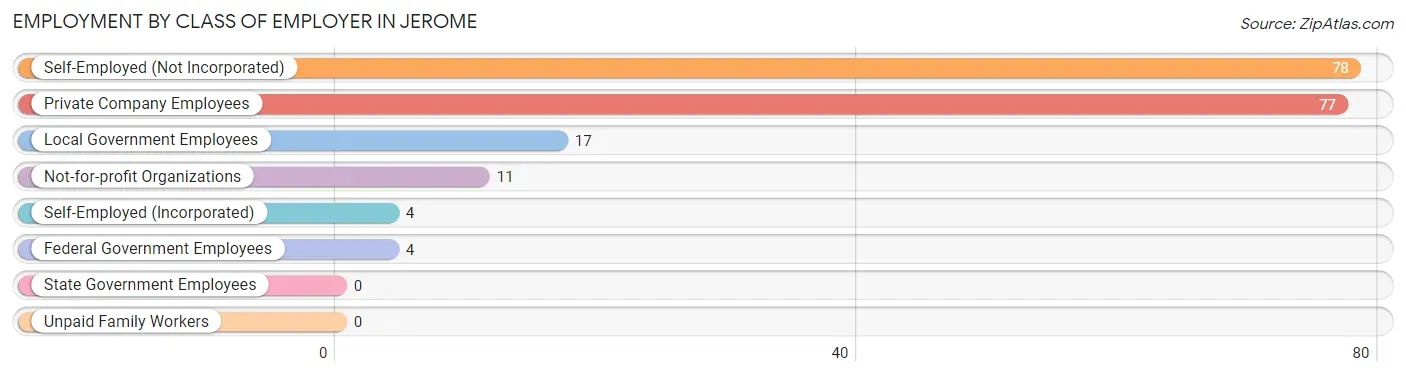
| Employer Class | # Employees | % Employees |
| Private Company Employees | 77 | 40.3% |
| Self-Employed (Incorporated) | 4 | 2.1% |
| Self-Employed (Not Incorporated) | 78 | 40.8% |
| Not-for-profit Organizations | 11 | 5.8% |
| Local Government Employees | 17 | 8.9% |
| State Government Employees | 0 | 0.0% |
| Federal Government Employees | 4 | 2.1% |
| Unpaid Family Workers | 0 | 0.0% |
| Total | 191 | 100.0% |
Employment Status by Age in Jerome
According to the labor force statistics for Jerome, out of the total population over 16 years of age (339), 61.9% or 210 individuals are in the labor force, with 6.3% or 13 of them unemployed. The age group with the highest labor force participation rate is 20 to 24 years, with 100.0% or 4 individuals in the labor force. Within the labor force, the 45 to 54 years age range has the highest percentage of unemployed individuals, with 10.4% or 7 of them being unemployed.
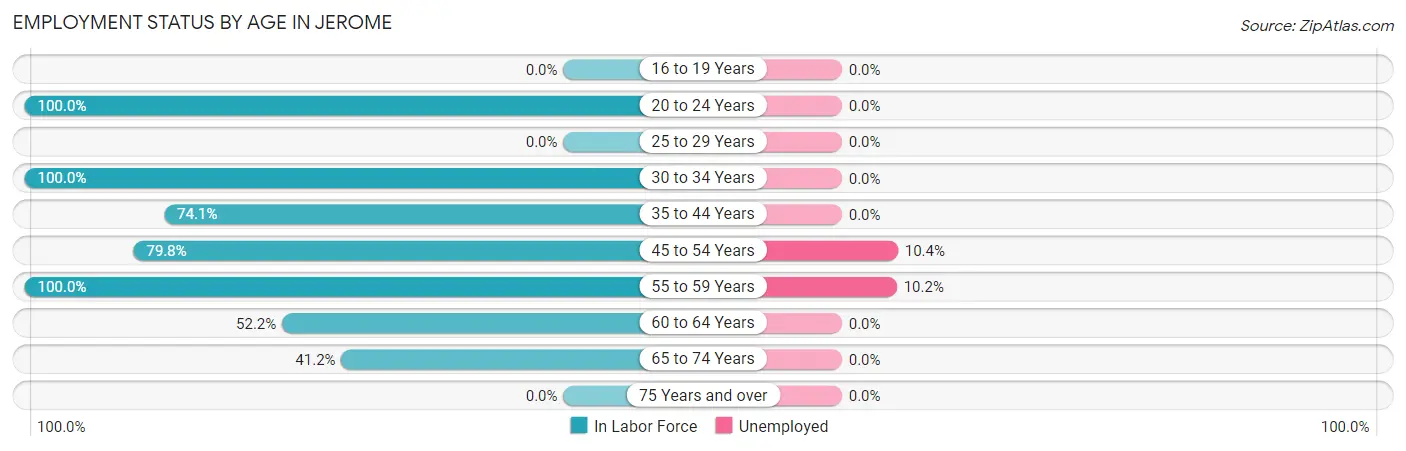
| Age Bracket | In Labor Force | Unemployed |
| 16 to 19 Years | 0 (0.0%) | 0 (0.0%) |
| 20 to 24 Years | 4 (100.0%) | 0 (0.0%) |
| 25 to 29 Years | 0 (0.0%) | 0 (0.0%) |
| 30 to 34 Years | 6 (100.0%) | 0 (0.0%) |
| 35 to 44 Years | 20 (74.1%) | 0 (0.0%) |
| 45 to 54 Years | 67 (79.8%) | 7 (10.4%) |
| 55 to 59 Years | 59 (100.0%) | 6 (10.2%) |
| 60 to 64 Years | 12 (52.2%) | 0 (0.0%) |
| 65 to 74 Years | 42 (41.2%) | 0 (0.0%) |
| 75 Years and over | 0 (0.0%) | 0 (0.0%) |
| Total | 210 (61.9%) | 13 (6.3%) |
Employment Status by Educational Attainment in Jerome
According to labor force statistics for Jerome, 82.4% of individuals (164) out of the total population between 25 and 64 years of age (199) are in the labor force, with 7.9% or 13 of them being unemployed. The group with the highest labor force participation rate are those with the educational attainment of high school diploma, with 100.0% or 13 individuals in the labor force. Within the labor force, individuals with bachelor's degree or higher education have the highest percentage of unemployment, with 12.5% or 7 of them being unemployed.
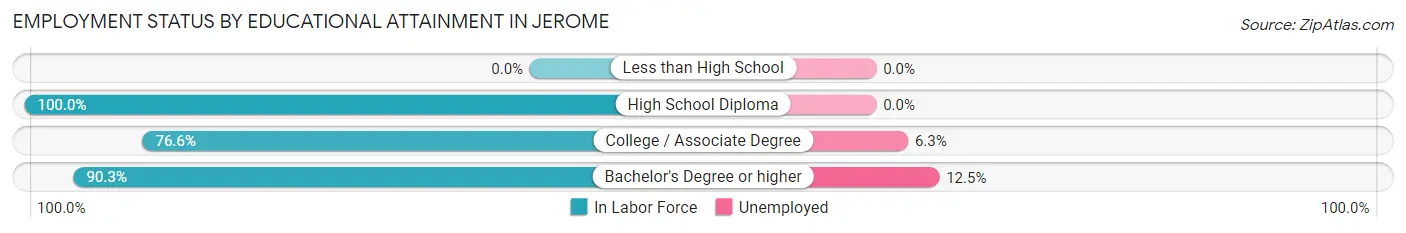
| Educational Attainment | In Labor Force | Unemployed |
| Less than High School | 0 (0.0%) | 0 (0.0%) |
| High School Diploma | 13 (100.0%) | 0 (0.0%) |
| College / Associate Degree | 95 (76.6%) | 8 (6.3%) |
| Bachelor's Degree or higher | 56 (90.3%) | 8 (12.5%) |
| Total | 164 (82.4%) | 16 (7.9%) |
Employment Occupations by Sex in Jerome
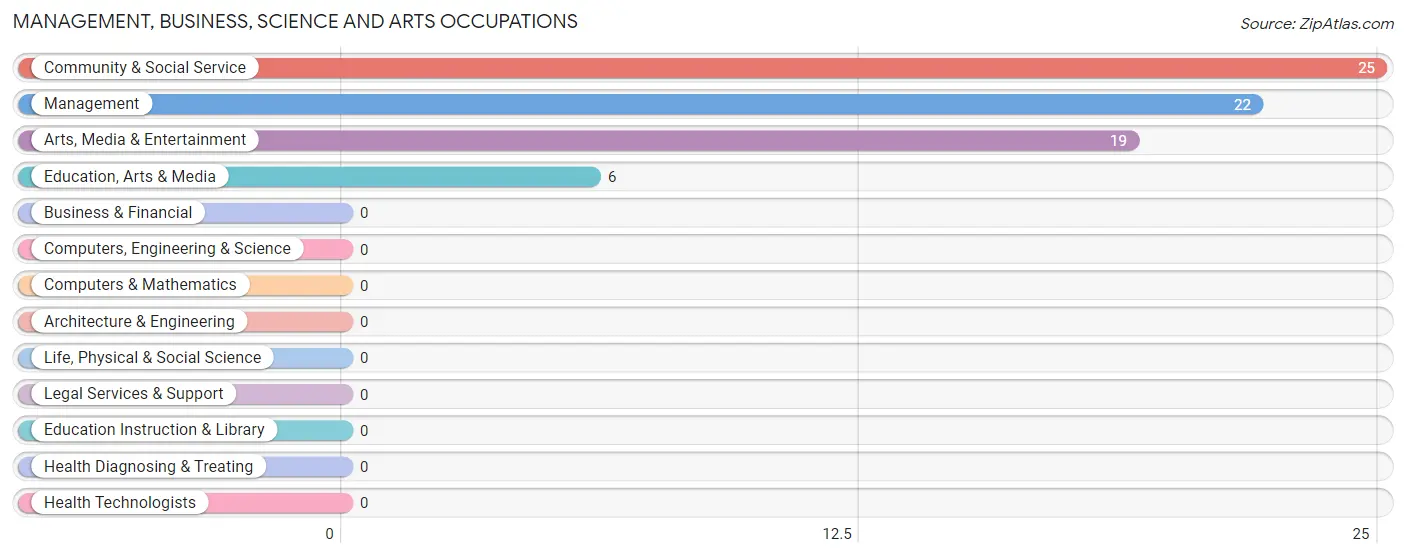
Management, Business, Science and Arts Occupations
The most common Management, Business, Science and Arts occupations in Jerome are Community & Social Service (25 | 13.0%), Management (22 | 11.4%), Arts, Media & Entertainment (19 | 9.8%), and Education, Arts & Media (6 | 3.1%).
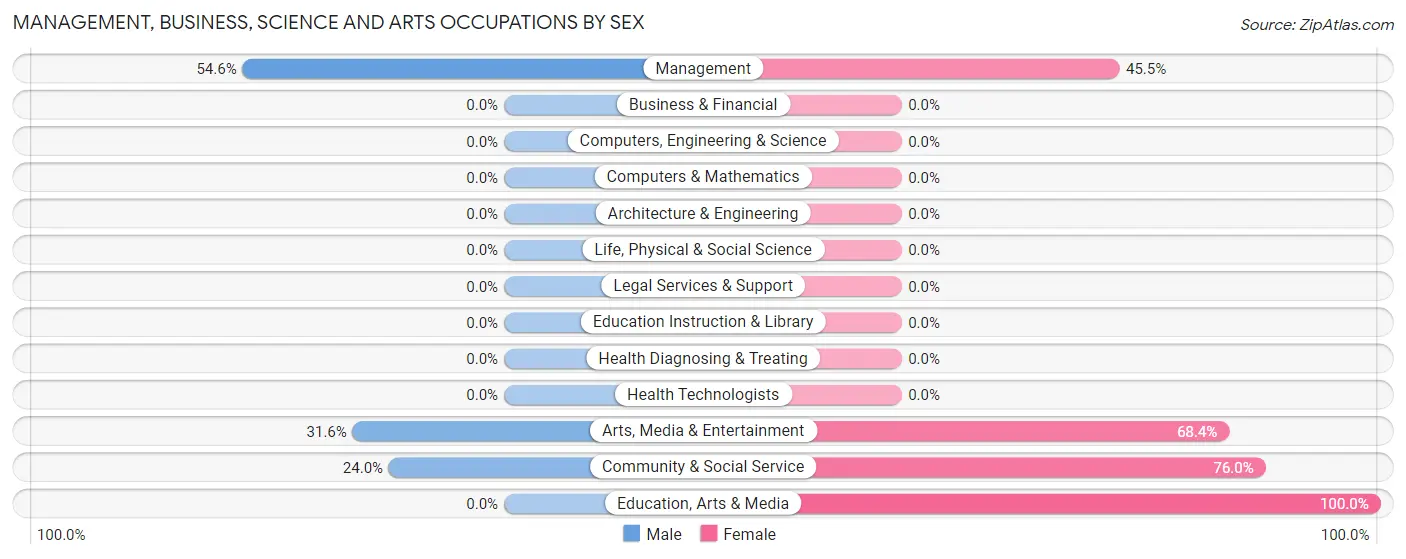
Management, Business, Science and Arts Occupations by Sex
Within the Management, Business, Science and Arts occupations in Jerome, the most male-oriented occupations are Management (54.5%), Arts, Media & Entertainment (31.6%), and Community & Social Service (24.0%), while the most female-oriented occupations are Education, Arts & Media (100.0%), Community & Social Service (76.0%), and Arts, Media & Entertainment (68.4%).
| Occupation | Male | Female |
| Management | 12 (54.5%) | 10 (45.5%) |
| Business & Financial | 0 (0.0%) | 0 (0.0%) |
| Computers, Engineering & Science | 0 (0.0%) | 0 (0.0%) |
| Computers & Mathematics | 0 (0.0%) | 0 (0.0%) |
| Architecture & Engineering | 0 (0.0%) | 0 (0.0%) |
| Life, Physical & Social Science | 0 (0.0%) | 0 (0.0%) |
| Community & Social Service | 6 (24.0%) | 19 (76.0%) |
| Education, Arts & Media | 0 (0.0%) | 6 (100.0%) |
| Legal Services & Support | 0 (0.0%) | 0 (0.0%) |
| Education Instruction & Library | 0 (0.0%) | 0 (0.0%) |
| Arts, Media & Entertainment | 6 (31.6%) | 13 (68.4%) |
| Health Diagnosing & Treating | 0 (0.0%) | 0 (0.0%) |
| Health Technologists | 0 (0.0%) | 0 (0.0%) |
| Total (Category) | 18 (38.3%) | 29 (61.7%) |
| Total (Overall) | 96 (49.7%) | 97 (50.3%) |
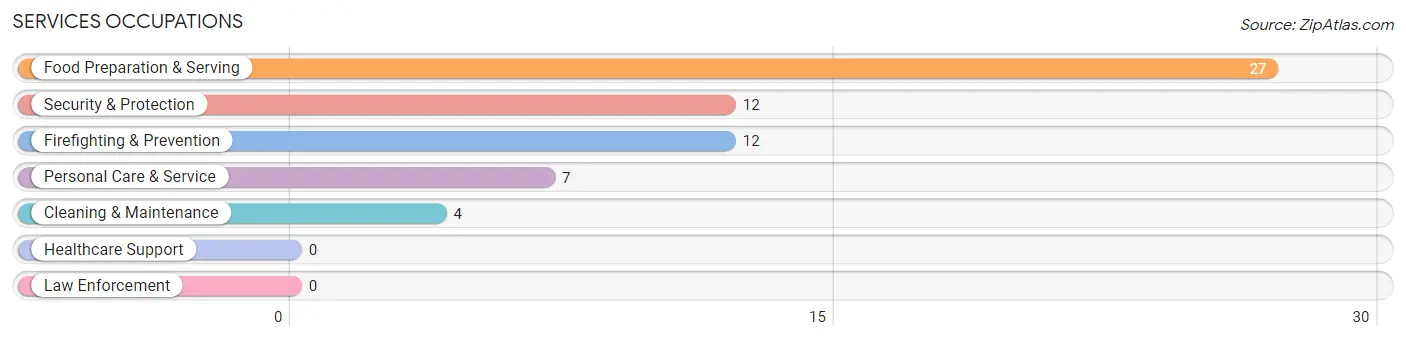
Services Occupations
The most common Services occupations in Jerome are Food Preparation & Serving (27 | 14.0%), Security & Protection (12 | 6.2%), Firefighting & Prevention (12 | 6.2%), Personal Care & Service (7 | 3.6%), and Cleaning & Maintenance (4 | 2.1%).
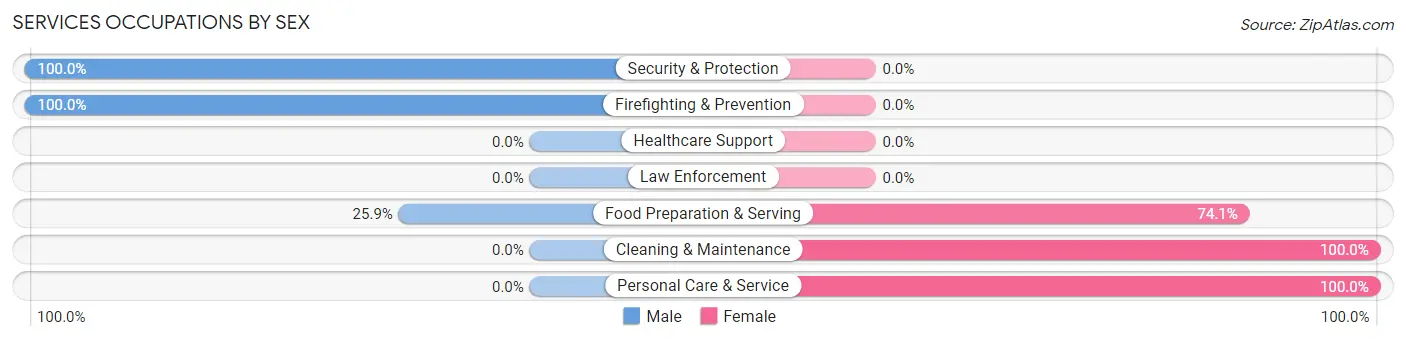
Services Occupations by Sex
Within the Services occupations in Jerome, the most male-oriented occupations are Security & Protection (100.0%), Firefighting & Prevention (100.0%), and Food Preparation & Serving (25.9%), while the most female-oriented occupations are Cleaning & Maintenance (100.0%), Personal Care & Service (100.0%), and Food Preparation & Serving (74.1%).
| Occupation | Male | Female |
| Healthcare Support | 0 (0.0%) | 0 (0.0%) |
| Security & Protection | 12 (100.0%) | 0 (0.0%) |
| Firefighting & Prevention | 12 (100.0%) | 0 (0.0%) |
| Law Enforcement | 0 (0.0%) | 0 (0.0%) |
| Food Preparation & Serving | 7 (25.9%) | 20 (74.1%) |
| Cleaning & Maintenance | 0 (0.0%) | 4 (100.0%) |
| Personal Care & Service | 0 (0.0%) | 7 (100.0%) |
| Total (Category) | 19 (38.0%) | 31 (62.0%) |
| Total (Overall) | 96 (49.7%) | 97 (50.3%) |
Sales and Office Occupations
The most common Sales and Office occupations in Jerome are Sales & Related (28 | 14.5%), and Office & Administration (20 | 10.4%).
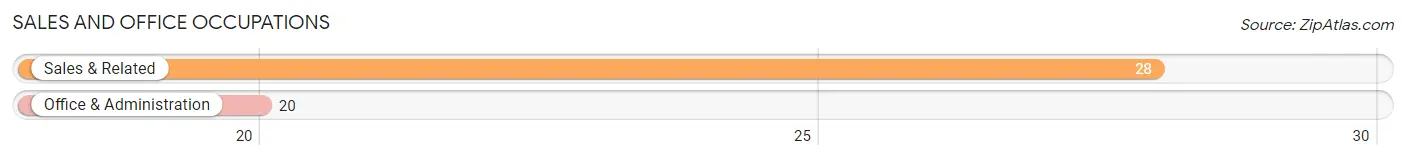
Sales and Office Occupations by Sex
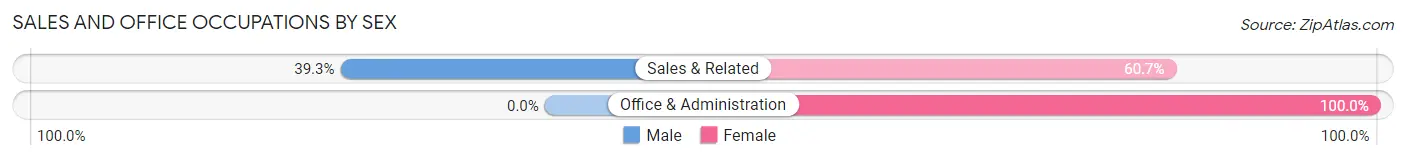
| Occupation | Male | Female |
| Sales & Related | 11 (39.3%) | 17 (60.7%) |
| Office & Administration | 0 (0.0%) | 20 (100.0%) |
| Total (Category) | 11 (22.9%) | 37 (77.1%) |
| Total (Overall) | 96 (49.7%) | 97 (50.3%) |
Natural Resources, Construction and Maintenance Occupations
The most common Natural Resources, Construction and Maintenance occupations in Jerome are , and Construction & Extraction (20 | 10.4%).
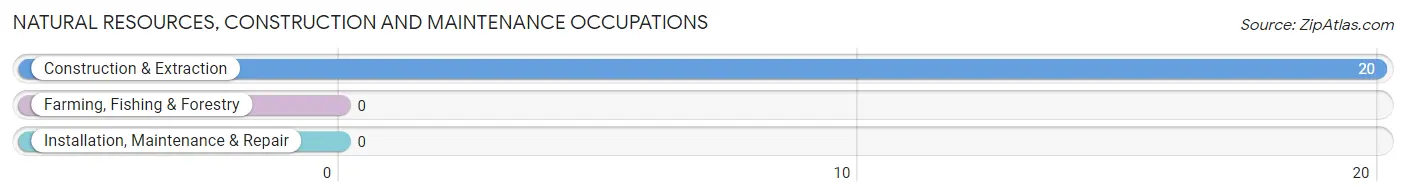
Natural Resources, Construction and Maintenance Occupations by Sex
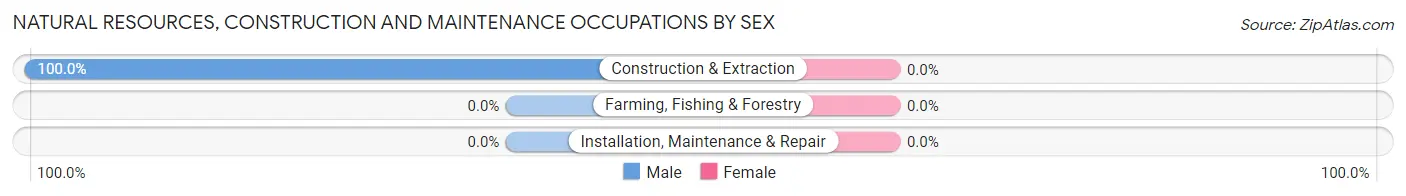
| Occupation | Male | Female |
| Farming, Fishing & Forestry | 0 (0.0%) | 0 (0.0%) |
| Construction & Extraction | 20 (100.0%) | 0 (0.0%) |
| Installation, Maintenance & Repair | 0 (0.0%) | 0 (0.0%) |
| Total (Category) | 20 (100.0%) | 0 (0.0%) |
| Total (Overall) | 96 (49.7%) | 97 (50.3%) |
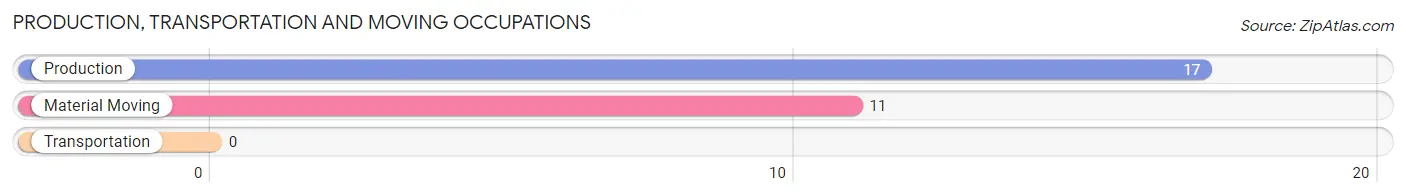
Production, Transportation and Moving Occupations
The most common Production, Transportation and Moving occupations in Jerome are Production (17 | 8.8%), and Material Moving (11 | 5.7%).
Production, Transportation and Moving Occupations by Sex
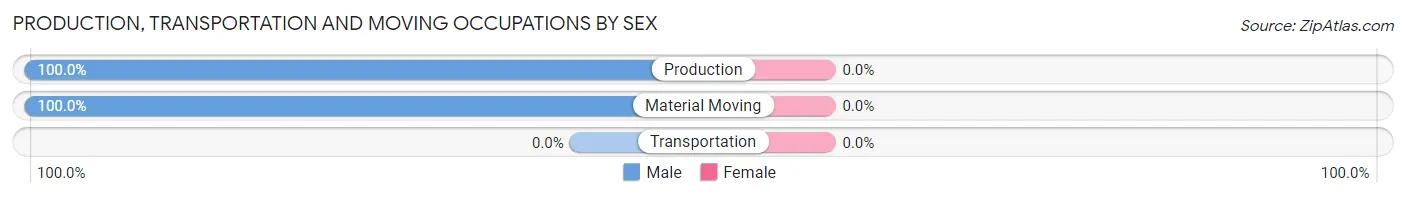
| Occupation | Male | Female |
| Production | 17 (100.0%) | 0 (0.0%) |
| Transportation | 0 (0.0%) | 0 (0.0%) |
| Material Moving | 11 (100.0%) | 0 (0.0%) |
| Total (Category) | 28 (100.0%) | 0 (0.0%) |
| Total (Overall) | 96 (49.7%) | 97 (50.3%) |
Employment Industries by Sex in Jerome
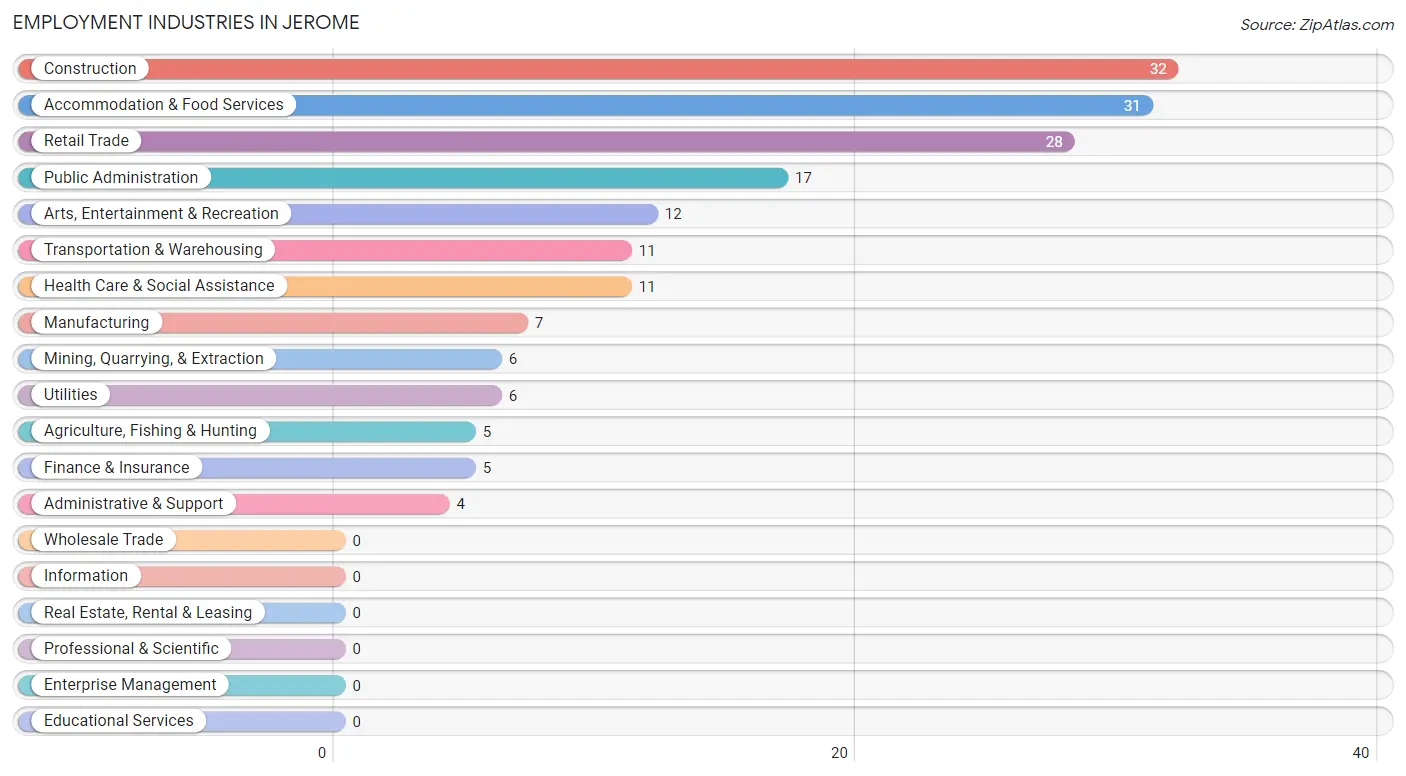
Employment Industries in Jerome
The major employment industries in Jerome include Construction (32 | 16.6%), Accommodation & Food Services (31 | 16.1%), Retail Trade (28 | 14.5%), Public Administration (17 | 8.8%), and Arts, Entertainment & Recreation (12 | 6.2%).
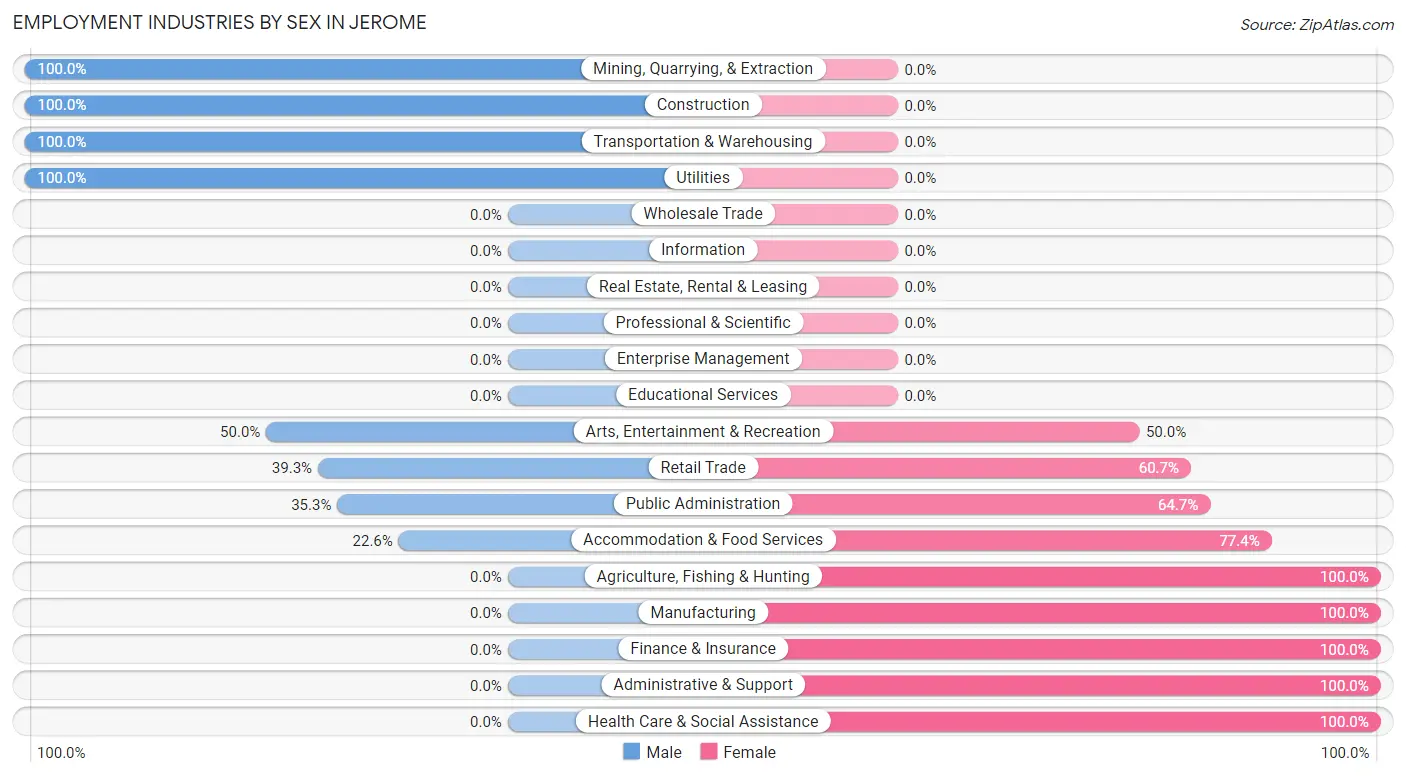
Employment Industries by Sex in Jerome
The Jerome industries that see more men than women are Mining, Quarrying, & Extraction (100.0%), Construction (100.0%), and Transportation & Warehousing (100.0%), whereas the industries that tend to have a higher number of women are Agriculture, Fishing & Hunting (100.0%), Manufacturing (100.0%), and Finance & Insurance (100.0%).
| Industry | Male | Female |
| Agriculture, Fishing & Hunting | 0 (0.0%) | 5 (100.0%) |
| Mining, Quarrying, & Extraction | 6 (100.0%) | 0 (0.0%) |
| Construction | 32 (100.0%) | 0 (0.0%) |
| Manufacturing | 0 (0.0%) | 7 (100.0%) |
| Wholesale Trade | 0 (0.0%) | 0 (0.0%) |
| Retail Trade | 11 (39.3%) | 17 (60.7%) |
| Transportation & Warehousing | 11 (100.0%) | 0 (0.0%) |
| Utilities | 6 (100.0%) | 0 (0.0%) |
| Information | 0 (0.0%) | 0 (0.0%) |
| Finance & Insurance | 0 (0.0%) | 5 (100.0%) |
| Real Estate, Rental & Leasing | 0 (0.0%) | 0 (0.0%) |
| Professional & Scientific | 0 (0.0%) | 0 (0.0%) |
| Enterprise Management | 0 (0.0%) | 0 (0.0%) |
| Administrative & Support | 0 (0.0%) | 4 (100.0%) |
| Educational Services | 0 (0.0%) | 0 (0.0%) |
| Health Care & Social Assistance | 0 (0.0%) | 11 (100.0%) |
| Arts, Entertainment & Recreation | 6 (50.0%) | 6 (50.0%) |
| Accommodation & Food Services | 7 (22.6%) | 24 (77.4%) |
| Public Administration | 6 (35.3%) | 11 (64.7%) |
| Total | 96 (49.7%) | 97 (50.3%) |
Education in Jerome
School Enrollment in Jerome
The most common levels of schooling among the 51 students in Jerome are college / undergraduate (19 | 37.2%), graduate / professional (10 | 19.6%), and kindergarten (7 | 13.7%).
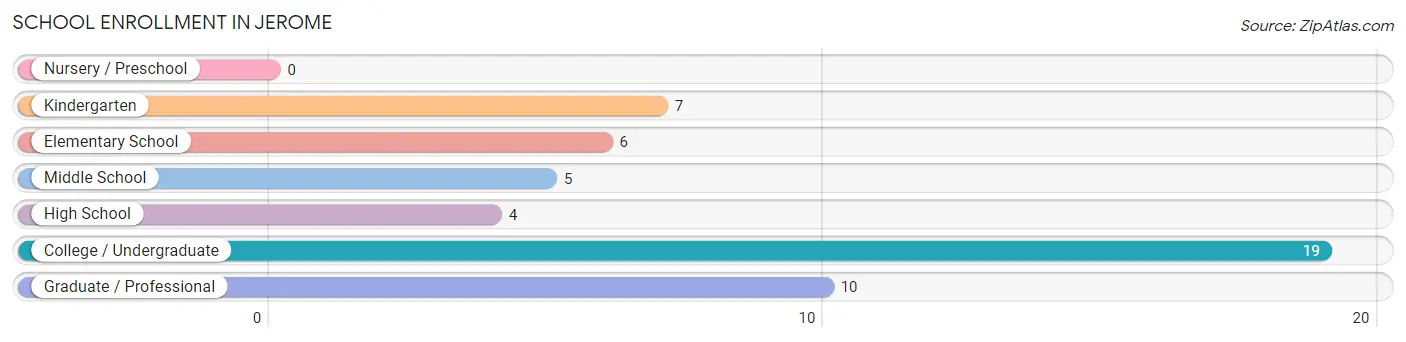
| School Level | # Students | % Students |
| Nursery / Preschool | 0 | 0.0% |
| Kindergarten | 7 | 13.7% |
| Elementary School | 6 | 11.8% |
| Middle School | 5 | 9.8% |
| High School | 4 | 7.8% |
| College / Undergraduate | 19 | 37.2% |
| Graduate / Professional | 10 | 19.6% |
| Total | 51 | 100.0% |
School Enrollment by Age by Funding Source in Jerome
Out of a total of 51 students who are enrolled in schools in Jerome, 10 (19.6%) attend a private institution, while the remaining 41 (80.4%) are enrolled in public schools. The age group of 15 to 17 year olds has the highest likelihood of being enrolled in private schools, with 4 (33.3% in the age bracket) enrolled. Conversely, the age group of 5 to 9 year old has the lowest likelihood of being enrolled in a private school, with 13 (100.0% in the age bracket) attending a public institution.
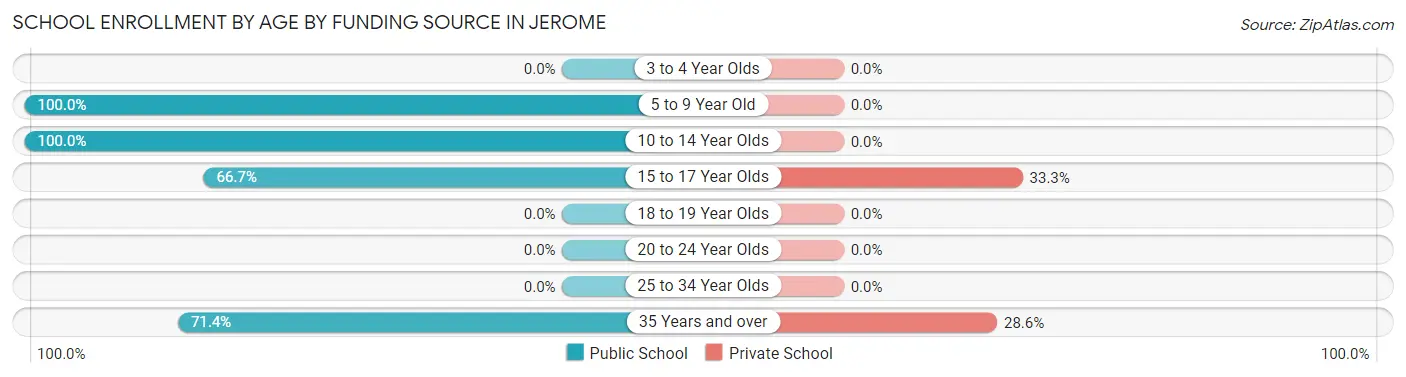
| Age Bracket | Public School | Private School |
| 3 to 4 Year Olds | 0 (0.0%) | 0 (0.0%) |
| 5 to 9 Year Old | 13 (100.0%) | 0 (0.0%) |
| 10 to 14 Year Olds | 5 (100.0%) | 0 (0.0%) |
| 15 to 17 Year Olds | 8 (66.7%) | 4 (33.3%) |
| 18 to 19 Year Olds | 0 (0.0%) | 0 (0.0%) |
| 20 to 24 Year Olds | 0 (0.0%) | 0 (0.0%) |
| 25 to 34 Year Olds | 0 (0.0%) | 0 (0.0%) |
| 35 Years and over | 15 (71.4%) | 6 (28.6%) |
| Total | 41 (80.4%) | 10 (19.6%) |
Educational Attainment by Field of Study in Jerome
Literature & languages (13 | 14.6%), liberal arts & history (13 | 14.6%), physical & health sciences (11 | 12.4%), business (11 | 12.4%), and psychology (10 | 11.2%) are the most common fields of study among 89 individuals in Jerome who have obtained a bachelor's degree or higher.
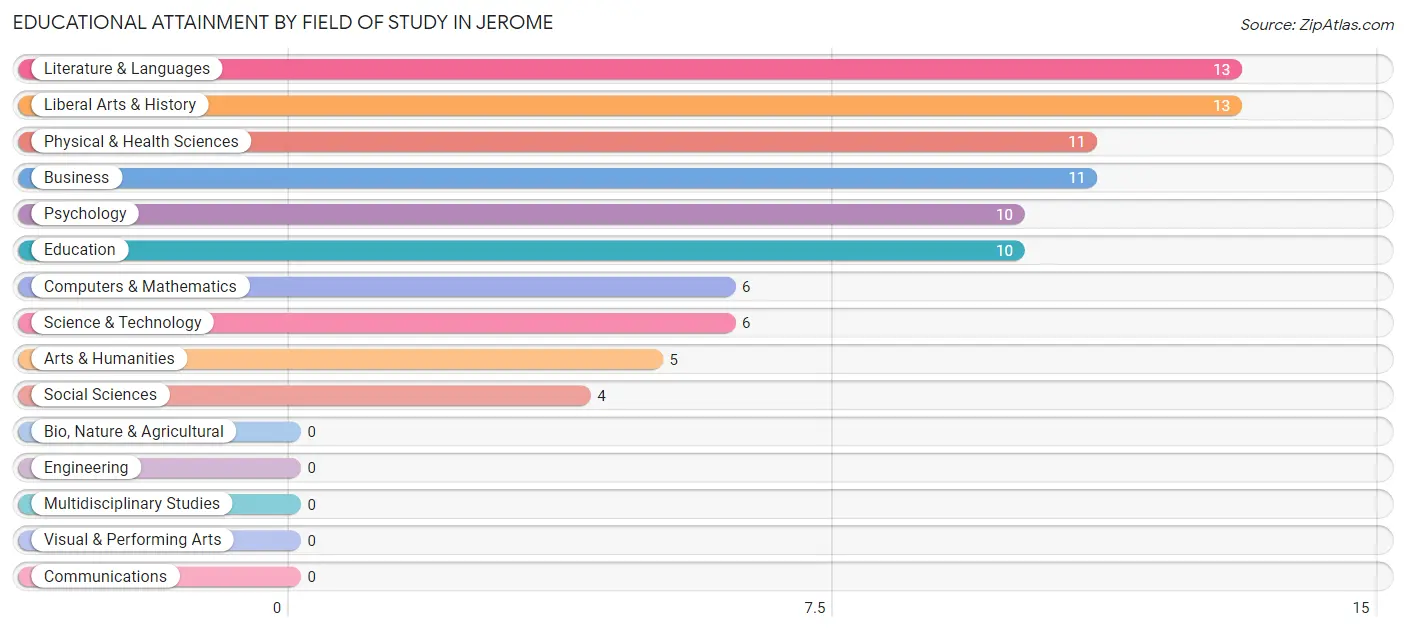
| Field of Study | # Graduates | % Graduates |
| Computers & Mathematics | 6 | 6.7% |
| Bio, Nature & Agricultural | 0 | 0.0% |
| Physical & Health Sciences | 11 | 12.4% |
| Psychology | 10 | 11.2% |
| Social Sciences | 4 | 4.5% |
| Engineering | 0 | 0.0% |
| Multidisciplinary Studies | 0 | 0.0% |
| Science & Technology | 6 | 6.7% |
| Business | 11 | 12.4% |
| Education | 10 | 11.2% |
| Literature & Languages | 13 | 14.6% |
| Liberal Arts & History | 13 | 14.6% |
| Visual & Performing Arts | 0 | 0.0% |
| Communications | 0 | 0.0% |
| Arts & Humanities | 5 | 5.6% |
| Total | 89 | 100.0% |
Transportation & Commute in Jerome
Vehicle Availability by Sex in Jerome
The most prevalent vehicle ownership categories in Jerome are males with 2 vehicles (59, accounting for 62.8%) and females with 2 vehicles (59, making up 60.8%).
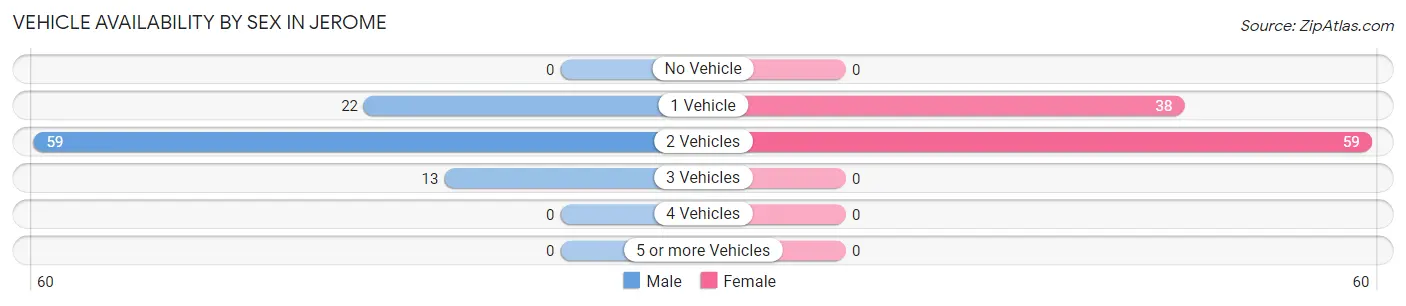
| Vehicles Available | Male | Female |
| No Vehicle | 0 (0.0%) | 0 (0.0%) |
| 1 Vehicle | 22 (23.4%) | 38 (39.2%) |
| 2 Vehicles | 59 (62.8%) | 59 (60.8%) |
| 3 Vehicles | 13 (13.8%) | 0 (0.0%) |
| 4 Vehicles | 0 (0.0%) | 0 (0.0%) |
| 5 or more Vehicles | 0 (0.0%) | 0 (0.0%) |
| Total | 94 (100.0%) | 97 (100.0%) |
Commute Time in Jerome
The most frequently occuring commute durations in Jerome are 5 to 9 minutes (60 commuters, 40.0%), less than 5 minutes (22 commuters, 14.7%), and 15 to 19 minutes (17 commuters, 11.3%).
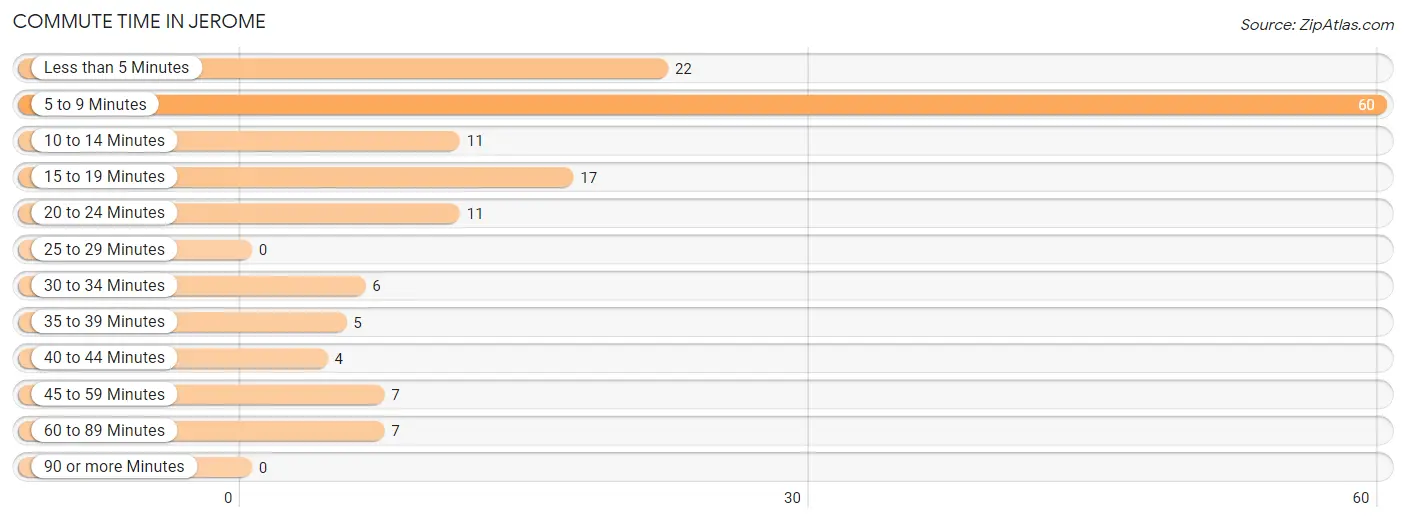
| Commute Time | # Commuters | % Commuters |
| Less than 5 Minutes | 22 | 14.7% |
| 5 to 9 Minutes | 60 | 40.0% |
| 10 to 14 Minutes | 11 | 7.3% |
| 15 to 19 Minutes | 17 | 11.3% |
| 20 to 24 Minutes | 11 | 7.3% |
| 25 to 29 Minutes | 0 | 0.0% |
| 30 to 34 Minutes | 6 | 4.0% |
| 35 to 39 Minutes | 5 | 3.3% |
| 40 to 44 Minutes | 4 | 2.7% |
| 45 to 59 Minutes | 7 | 4.7% |
| 60 to 89 Minutes | 7 | 4.7% |
| 90 or more Minutes | 0 | 0.0% |
Commute Time by Sex in Jerome
The most common commute times in Jerome are 5 to 9 minutes (13 commuters, 21.7%) for males and 5 to 9 minutes (47 commuters, 52.2%) for females.
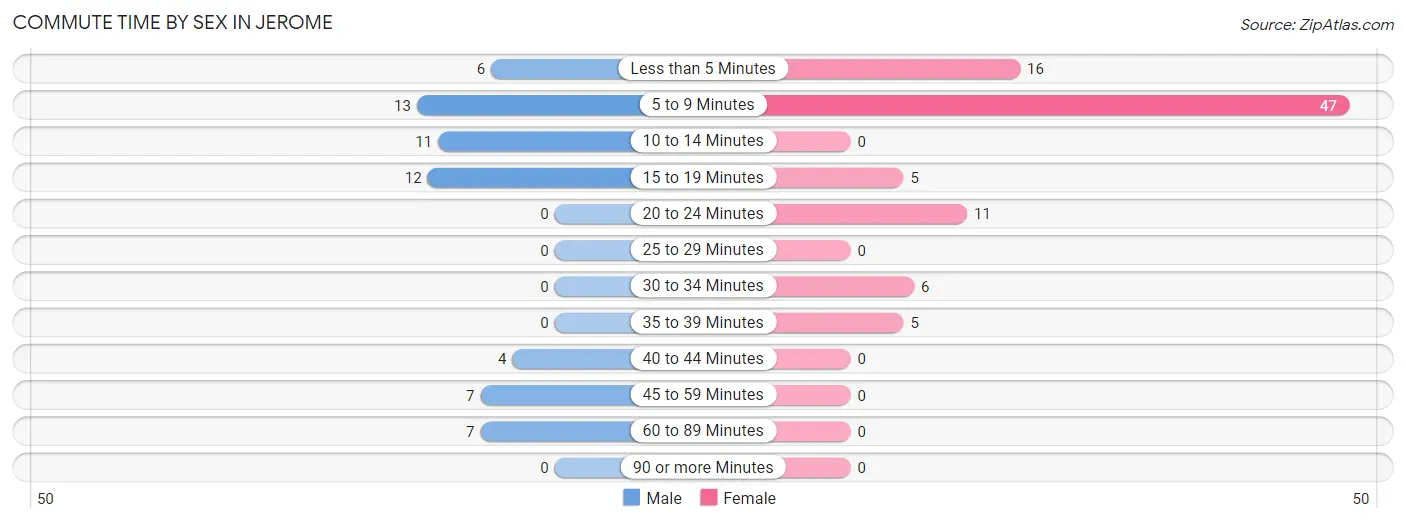
| Commute Time | Male | Female |
| Less than 5 Minutes | 6 (10.0%) | 16 (17.8%) |
| 5 to 9 Minutes | 13 (21.7%) | 47 (52.2%) |
| 10 to 14 Minutes | 11 (18.3%) | 0 (0.0%) |
| 15 to 19 Minutes | 12 (20.0%) | 5 (5.6%) |
| 20 to 24 Minutes | 0 (0.0%) | 11 (12.2%) |
| 25 to 29 Minutes | 0 (0.0%) | 0 (0.0%) |
| 30 to 34 Minutes | 0 (0.0%) | 6 (6.7%) |
| 35 to 39 Minutes | 0 (0.0%) | 5 (5.6%) |
| 40 to 44 Minutes | 4 (6.7%) | 0 (0.0%) |
| 45 to 59 Minutes | 7 (11.7%) | 0 (0.0%) |
| 60 to 89 Minutes | 7 (11.7%) | 0 (0.0%) |
| 90 or more Minutes | 0 (0.0%) | 0 (0.0%) |
Time of Departure to Work by Sex in Jerome
The most frequent times of departure to work in Jerome are 8:00 AM to 8:29 AM (17, 28.3%) for males and 9:00 AM to 9:59 AM (26, 28.9%) for females.
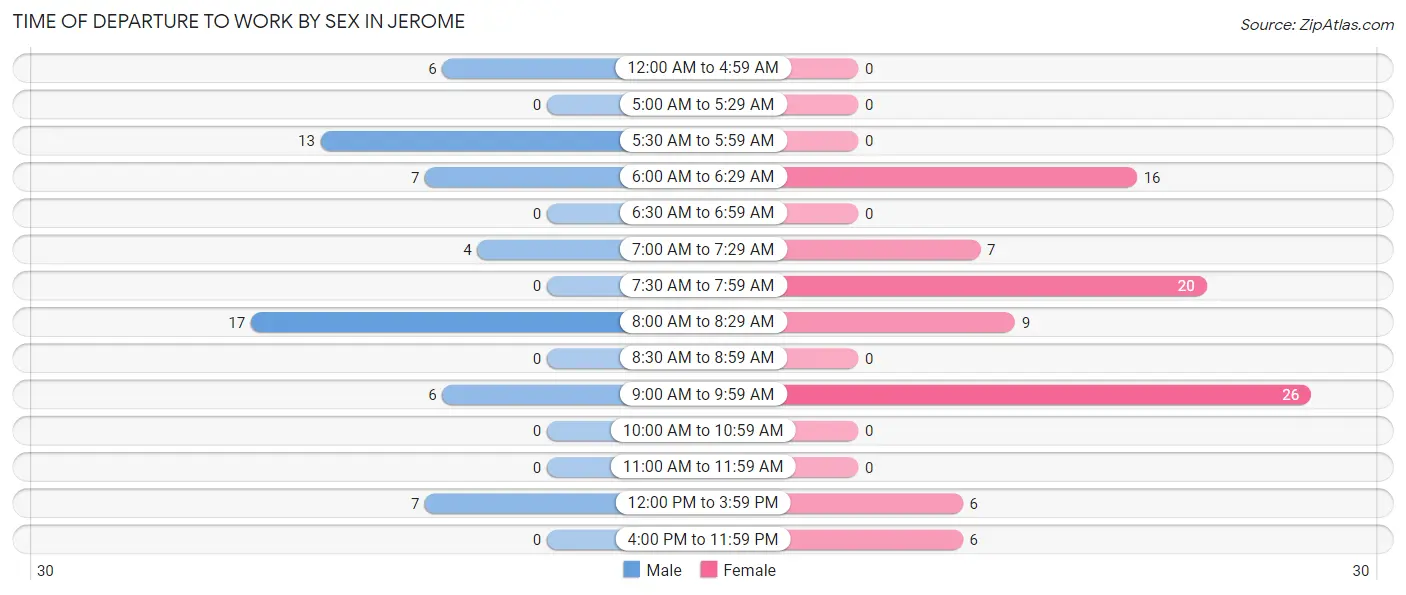
| Time of Departure | Male | Female |
| 12:00 AM to 4:59 AM | 6 (10.0%) | 0 (0.0%) |
| 5:00 AM to 5:29 AM | 0 (0.0%) | 0 (0.0%) |
| 5:30 AM to 5:59 AM | 13 (21.7%) | 0 (0.0%) |
| 6:00 AM to 6:29 AM | 7 (11.7%) | 16 (17.8%) |
| 6:30 AM to 6:59 AM | 0 (0.0%) | 0 (0.0%) |
| 7:00 AM to 7:29 AM | 4 (6.7%) | 7 (7.8%) |
| 7:30 AM to 7:59 AM | 0 (0.0%) | 20 (22.2%) |
| 8:00 AM to 8:29 AM | 17 (28.3%) | 9 (10.0%) |
| 8:30 AM to 8:59 AM | 0 (0.0%) | 0 (0.0%) |
| 9:00 AM to 9:59 AM | 6 (10.0%) | 26 (28.9%) |
| 10:00 AM to 10:59 AM | 0 (0.0%) | 0 (0.0%) |
| 11:00 AM to 11:59 AM | 0 (0.0%) | 0 (0.0%) |
| 12:00 PM to 3:59 PM | 7 (11.7%) | 6 (6.7%) |
| 4:00 PM to 11:59 PM | 0 (0.0%) | 6 (6.7%) |
| Total | 60 (100.0%) | 90 (100.0%) |
Housing Occupancy in Jerome
Occupancy by Ownership in Jerome
Of the total 228 dwellings in Jerome, owner-occupied units account for 123 (53.9%), while renter-occupied units make up 105 (46.1%).
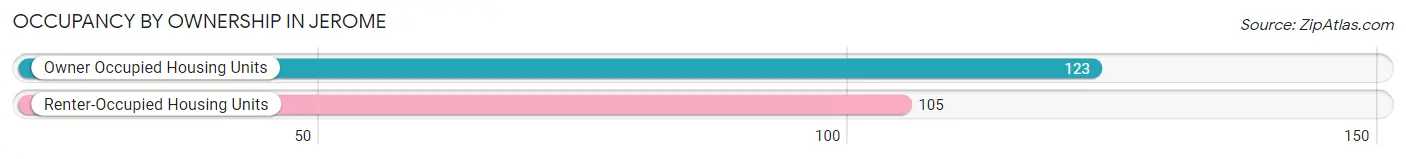
| Occupancy | # Housing Units | % Housing Units |
| Owner Occupied Housing Units | 123 | 53.9% |
| Renter-Occupied Housing Units | 105 | 46.1% |
| Total Occupied Housing Units | 228 | 100.0% |
Occupancy by Household Size in Jerome
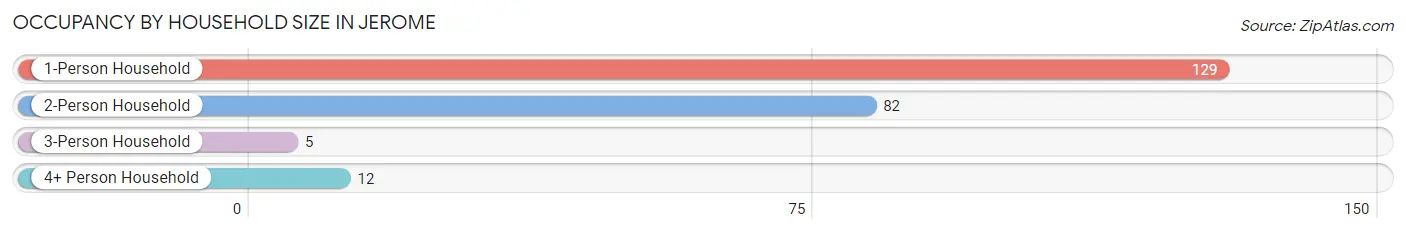
| Household Size | # Housing Units | % Housing Units |
| 1-Person Household | 129 | 56.6% |
| 2-Person Household | 82 | 36.0% |
| 3-Person Household | 5 | 2.2% |
| 4+ Person Household | 12 | 5.3% |
| Total Housing Units | 228 | 100.0% |
Occupancy by Ownership by Household Size in Jerome
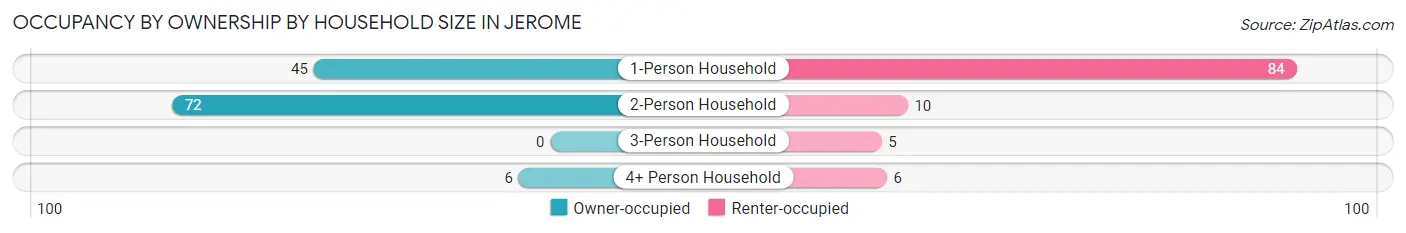
| Household Size | Owner-occupied | Renter-occupied |
| 1-Person Household | 45 (34.9%) | 84 (65.1%) |
| 2-Person Household | 72 (87.8%) | 10 (12.2%) |
| 3-Person Household | 0 (0.0%) | 5 (100.0%) |
| 4+ Person Household | 6 (50.0%) | 6 (50.0%) |
| Total Housing Units | 123 (53.9%) | 105 (46.1%) |
Occupancy by Educational Attainment in Jerome
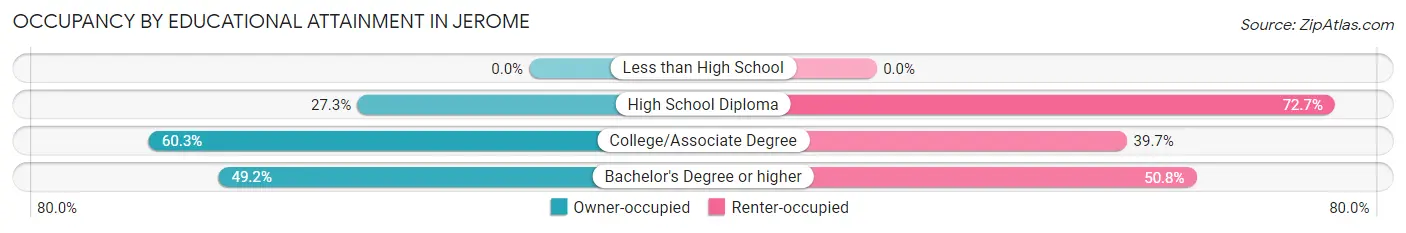
| Household Size | Owner-occupied | Renter-occupied |
| Less than High School | 0 (0.0%) | 0 (0.0%) |
| High School Diploma | 6 (27.3%) | 16 (72.7%) |
| College/Associate Degree | 85 (60.3%) | 56 (39.7%) |
| Bachelor's Degree or higher | 32 (49.2%) | 33 (50.8%) |
Occupancy by Age of Householder in Jerome
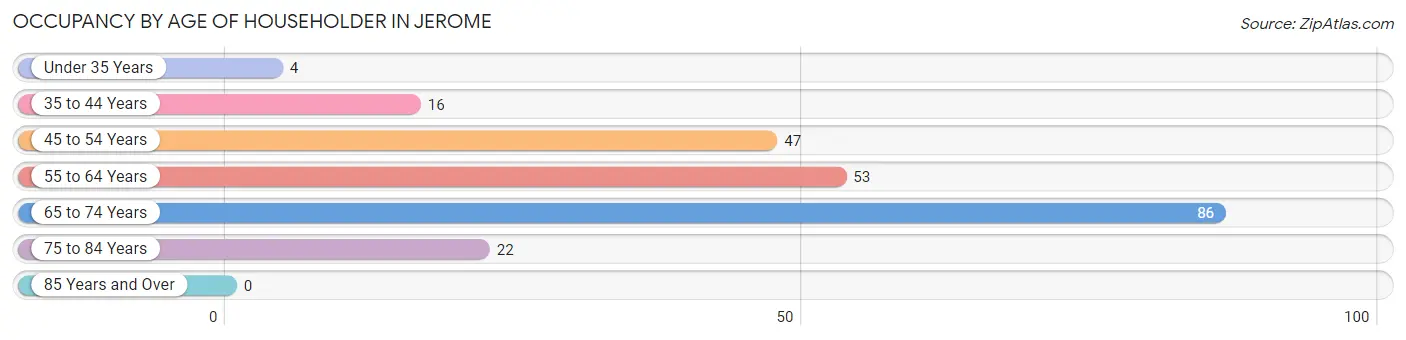
| Age Bracket | # Households | % Households |
| Under 35 Years | 4 | 1.8% |
| 35 to 44 Years | 16 | 7.0% |
| 45 to 54 Years | 47 | 20.6% |
| 55 to 64 Years | 53 | 23.3% |
| 65 to 74 Years | 86 | 37.7% |
| 75 to 84 Years | 22 | 9.7% |
| 85 Years and Over | 0 | 0.0% |
| Total | 228 | 100.0% |
Housing Finances in Jerome
Median Income by Occupancy in Jerome
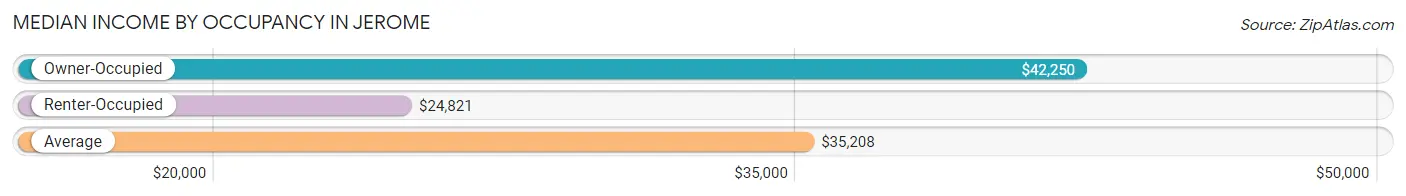
| Occupancy Type | # Households | Median Income |
| Owner-Occupied | 123 (53.9%) | $42,250 |
| Renter-Occupied | 105 (46.1%) | $24,821 |
| Average | 228 (100.0%) | $35,208 |
Occupancy by Householder Income Bracket in Jerome
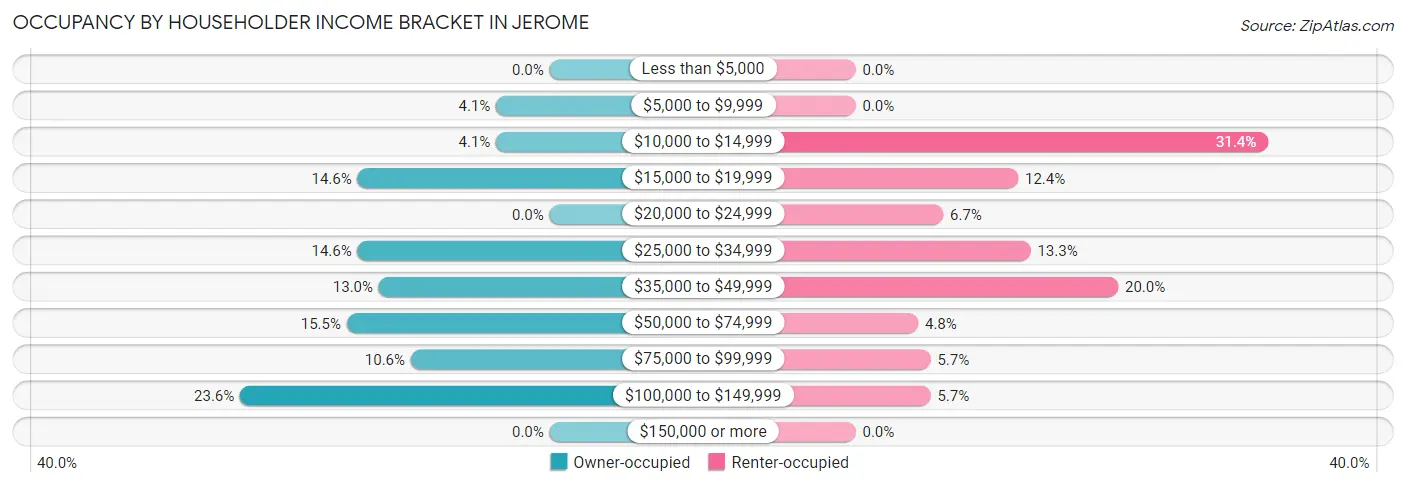
| Income Bracket | Owner-occupied | Renter-occupied |
| Less than $5,000 | 0 (0.0%) | 0 (0.0%) |
| $5,000 to $9,999 | 5 (4.1%) | 0 (0.0%) |
| $10,000 to $14,999 | 5 (4.1%) | 33 (31.4%) |
| $15,000 to $19,999 | 18 (14.6%) | 13 (12.4%) |
| $20,000 to $24,999 | 0 (0.0%) | 7 (6.7%) |
| $25,000 to $34,999 | 18 (14.6%) | 14 (13.3%) |
| $35,000 to $49,999 | 16 (13.0%) | 21 (20.0%) |
| $50,000 to $74,999 | 19 (15.4%) | 5 (4.8%) |
| $75,000 to $99,999 | 13 (10.6%) | 6 (5.7%) |
| $100,000 to $149,999 | 29 (23.6%) | 6 (5.7%) |
| $150,000 or more | 0 (0.0%) | 0 (0.0%) |
| Total | 123 (100.0%) | 105 (100.0%) |
Monthly Housing Cost Tiers in Jerome
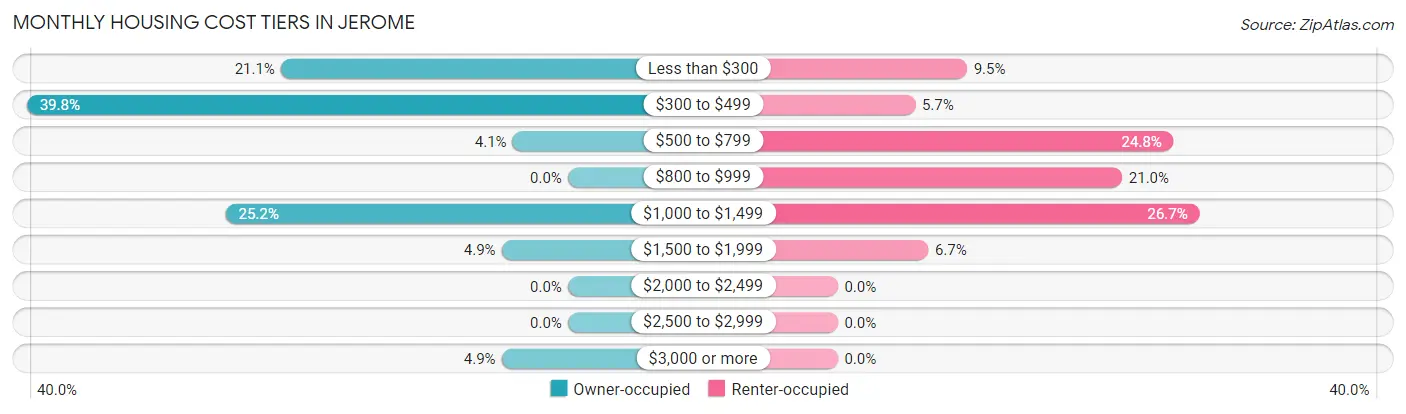
| Monthly Cost | Owner-occupied | Renter-occupied |
| Less than $300 | 26 (21.1%) | 10 (9.5%) |
| $300 to $499 | 49 (39.8%) | 6 (5.7%) |
| $500 to $799 | 5 (4.1%) | 26 (24.8%) |
| $800 to $999 | 0 (0.0%) | 22 (20.9%) |
| $1,000 to $1,499 | 31 (25.2%) | 28 (26.7%) |
| $1,500 to $1,999 | 6 (4.9%) | 7 (6.7%) |
| $2,000 to $2,499 | 0 (0.0%) | 0 (0.0%) |
| $2,500 to $2,999 | 0 (0.0%) | 0 (0.0%) |
| $3,000 or more | 6 (4.9%) | 0 (0.0%) |
| Total | 123 (100.0%) | 105 (100.0%) |
Physical Housing Characteristics in Jerome
Housing Structures in Jerome
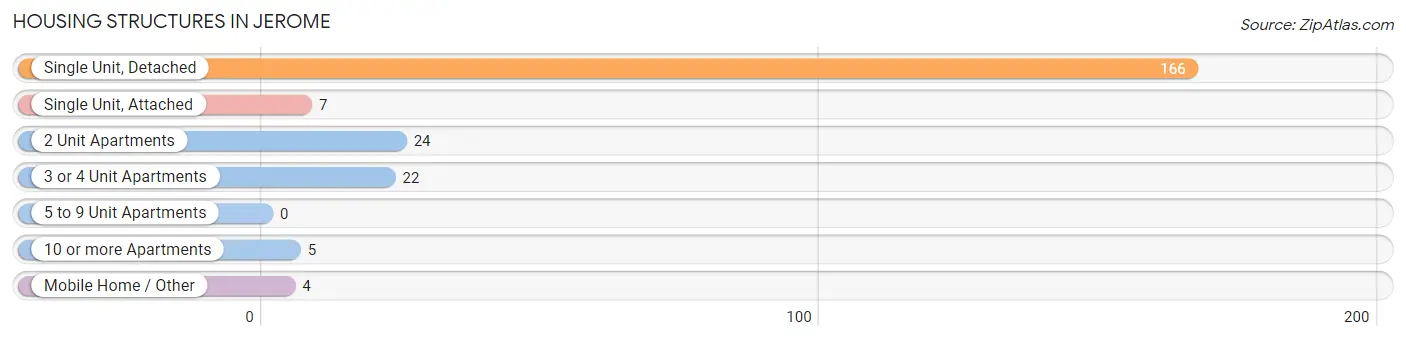
| Structure Type | # Housing Units | % Housing Units |
| Single Unit, Detached | 166 | 72.8% |
| Single Unit, Attached | 7 | 3.1% |
| 2 Unit Apartments | 24 | 10.5% |
| 3 or 4 Unit Apartments | 22 | 9.7% |
| 5 to 9 Unit Apartments | 0 | 0.0% |
| 10 or more Apartments | 5 | 2.2% |
| Mobile Home / Other | 4 | 1.8% |
| Total | 228 | 100.0% |
Housing Structures by Occupancy in Jerome
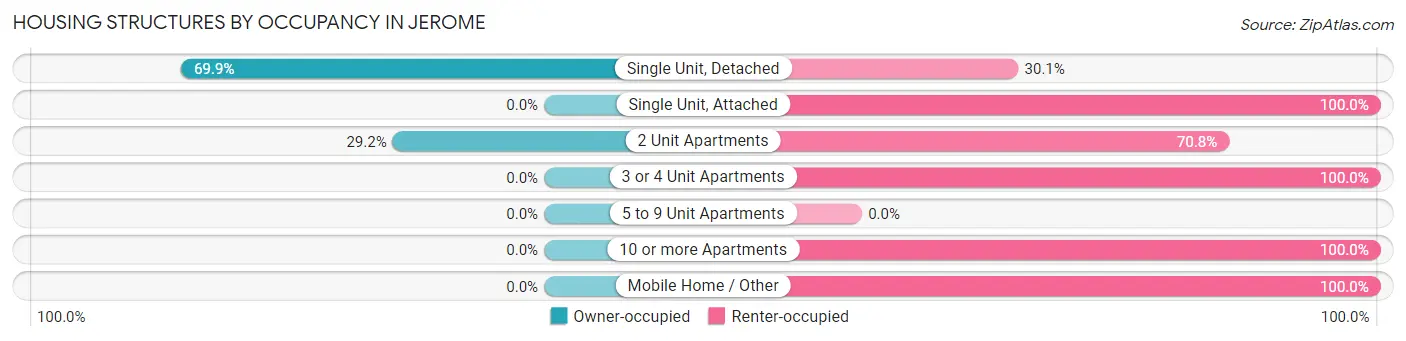
| Structure Type | Owner-occupied | Renter-occupied |
| Single Unit, Detached | 116 (69.9%) | 50 (30.1%) |
| Single Unit, Attached | 0 (0.0%) | 7 (100.0%) |
| 2 Unit Apartments | 7 (29.2%) | 17 (70.8%) |
| 3 or 4 Unit Apartments | 0 (0.0%) | 22 (100.0%) |
| 5 to 9 Unit Apartments | 0 (0.0%) | 0 (0.0%) |
| 10 or more Apartments | 0 (0.0%) | 5 (100.0%) |
| Mobile Home / Other | 0 (0.0%) | 4 (100.0%) |
| Total | 123 (53.9%) | 105 (46.1%) |
Housing Structures by Number of Rooms in Jerome
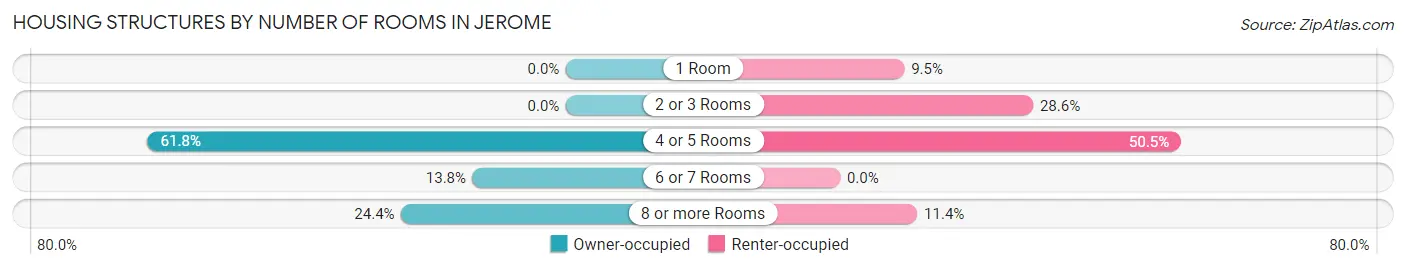
| Number of Rooms | Owner-occupied | Renter-occupied |
| 1 Room | 0 (0.0%) | 10 (9.5%) |
| 2 or 3 Rooms | 0 (0.0%) | 30 (28.6%) |
| 4 or 5 Rooms | 76 (61.8%) | 53 (50.5%) |
| 6 or 7 Rooms | 17 (13.8%) | 0 (0.0%) |
| 8 or more Rooms | 30 (24.4%) | 12 (11.4%) |
| Total | 123 (100.0%) | 105 (100.0%) |
Housing Structure by Heating Type in Jerome
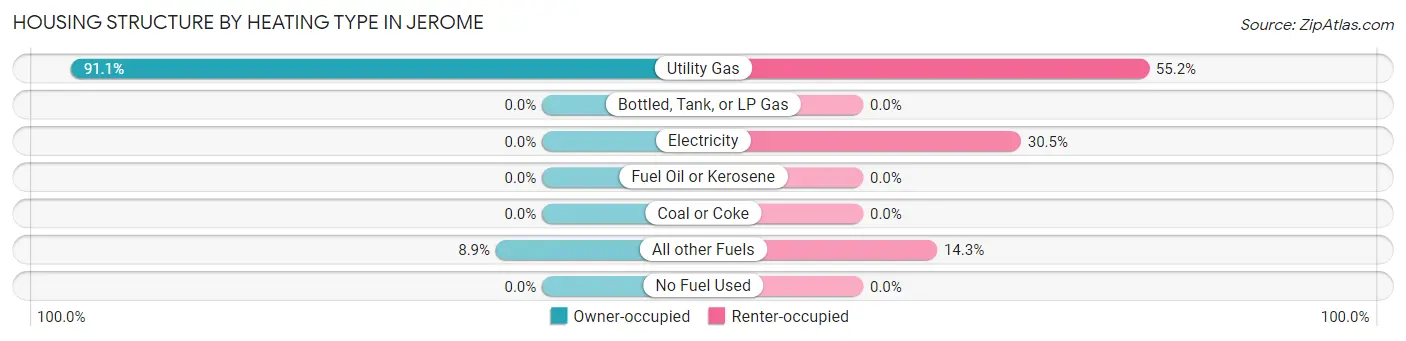
| Heating Type | Owner-occupied | Renter-occupied |
| Utility Gas | 112 (91.1%) | 58 (55.2%) |
| Bottled, Tank, or LP Gas | 0 (0.0%) | 0 (0.0%) |
| Electricity | 0 (0.0%) | 32 (30.5%) |
| Fuel Oil or Kerosene | 0 (0.0%) | 0 (0.0%) |
| Coal or Coke | 0 (0.0%) | 0 (0.0%) |
| All other Fuels | 11 (8.9%) | 15 (14.3%) |
| No Fuel Used | 0 (0.0%) | 0 (0.0%) |
| Total | 123 (100.0%) | 105 (100.0%) |
Household Vehicle Usage in Jerome
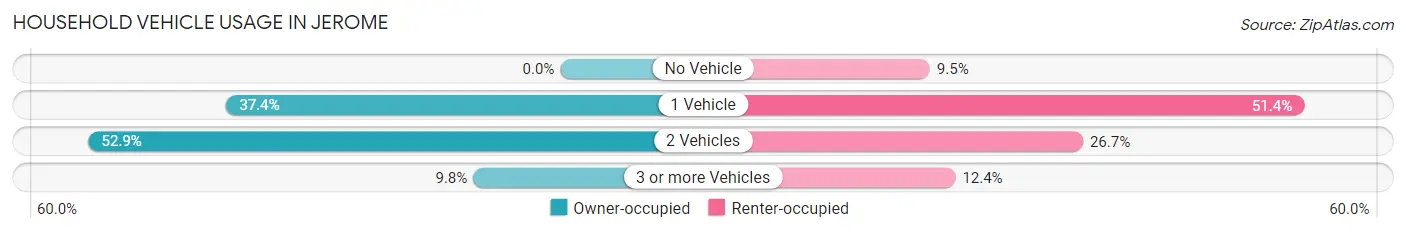
| Vehicles per Household | Owner-occupied | Renter-occupied |
| No Vehicle | 0 (0.0%) | 10 (9.5%) |
| 1 Vehicle | 46 (37.4%) | 54 (51.4%) |
| 2 Vehicles | 65 (52.8%) | 28 (26.7%) |
| 3 or more Vehicles | 12 (9.8%) | 13 (12.4%) |
| Total | 123 (100.0%) | 105 (100.0%) |
Real Estate & Mortgages in Jerome
Real Estate and Mortgage Overview in Jerome
| Characteristic | Without Mortgage | With Mortgage |
| Housing Units | 81 | 42 |
| Median Property Value | $236,500 | $377,800 |
| Median Household Income | $37,750 | $0 |
| Monthly Housing Costs | $333 | $6 |
| Real Estate Taxes | $997 | $0 |
Property Value by Mortgage Status in Jerome
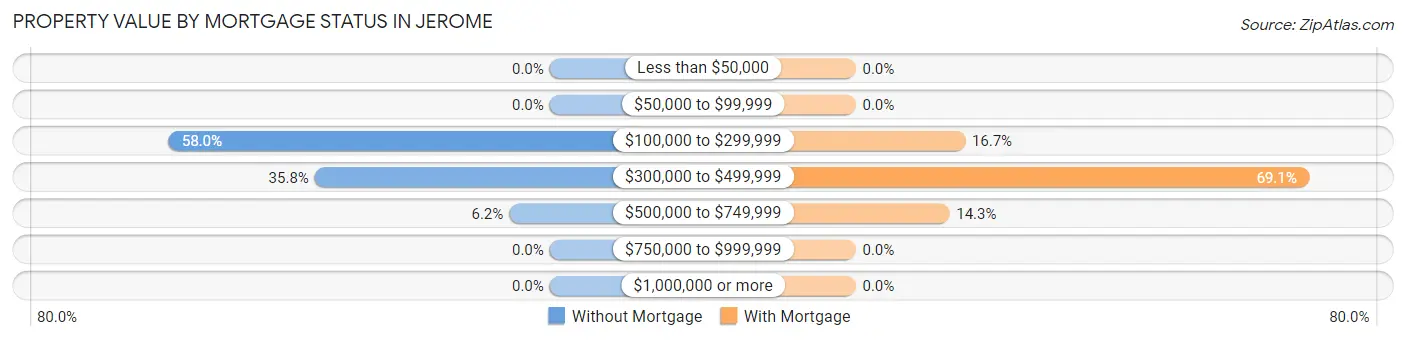
| Property Value | Without Mortgage | With Mortgage |
| Less than $50,000 | 0 (0.0%) | 0 (0.0%) |
| $50,000 to $99,999 | 0 (0.0%) | 0 (0.0%) |
| $100,000 to $299,999 | 47 (58.0%) | 7 (16.7%) |
| $300,000 to $499,999 | 29 (35.8%) | 29 (69.1%) |
| $500,000 to $749,999 | 5 (6.2%) | 6 (14.3%) |
| $750,000 to $999,999 | 0 (0.0%) | 0 (0.0%) |
| $1,000,000 or more | 0 (0.0%) | 0 (0.0%) |
| Total | 81 (100.0%) | 42 (100.0%) |
Household Income by Mortgage Status in Jerome
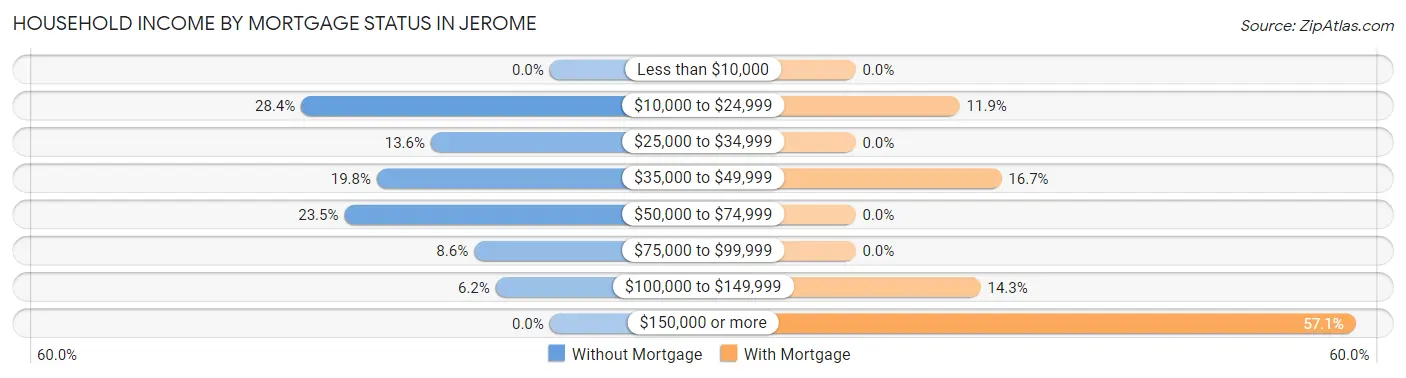
| Household Income | Without Mortgage | With Mortgage |
| Less than $10,000 | 0 (0.0%) | 0 (0.0%) |
| $10,000 to $24,999 | 23 (28.4%) | 5 (11.9%) |
| $25,000 to $34,999 | 11 (13.6%) | 0 (0.0%) |
| $35,000 to $49,999 | 16 (19.8%) | 7 (16.7%) |
| $50,000 to $74,999 | 19 (23.5%) | 0 (0.0%) |
| $75,000 to $99,999 | 7 (8.6%) | 0 (0.0%) |
| $100,000 to $149,999 | 5 (6.2%) | 6 (14.3%) |
| $150,000 or more | 0 (0.0%) | 24 (57.1%) |
| Total | 81 (100.0%) | 42 (100.0%) |
Property Value to Household Income Ratio in Jerome
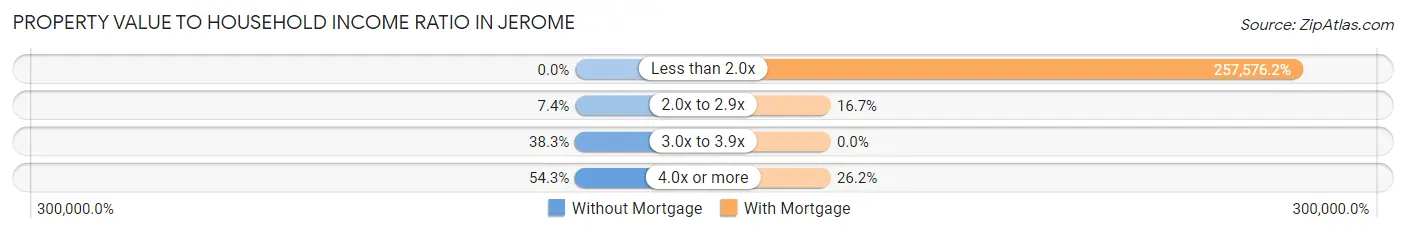
| Value-to-Income Ratio | Without Mortgage | With Mortgage |
| Less than 2.0x | 0 (0.0%) | 108,182 (257,576.2%) |
| 2.0x to 2.9x | 6 (7.4%) | 7 (16.7%) |
| 3.0x to 3.9x | 31 (38.3%) | 0 (0.0%) |
| 4.0x or more | 44 (54.3%) | 11 (26.2%) |
| Total | 81 (100.0%) | 42 (100.0%) |
Real Estate Taxes by Mortgage Status in Jerome
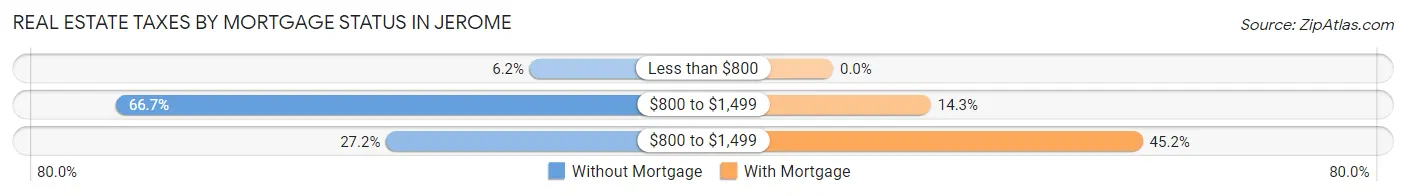
| Property Taxes | Without Mortgage | With Mortgage |
| Less than $800 | 5 (6.2%) | 0 (0.0%) |
| $800 to $1,499 | 54 (66.7%) | 6 (14.3%) |
| $800 to $1,499 | 22 (27.2%) | 19 (45.2%) |
| Total | 81 (100.0%) | 42 (100.0%) |
Health & Disability in Jerome
Health Insurance Coverage by Age in Jerome
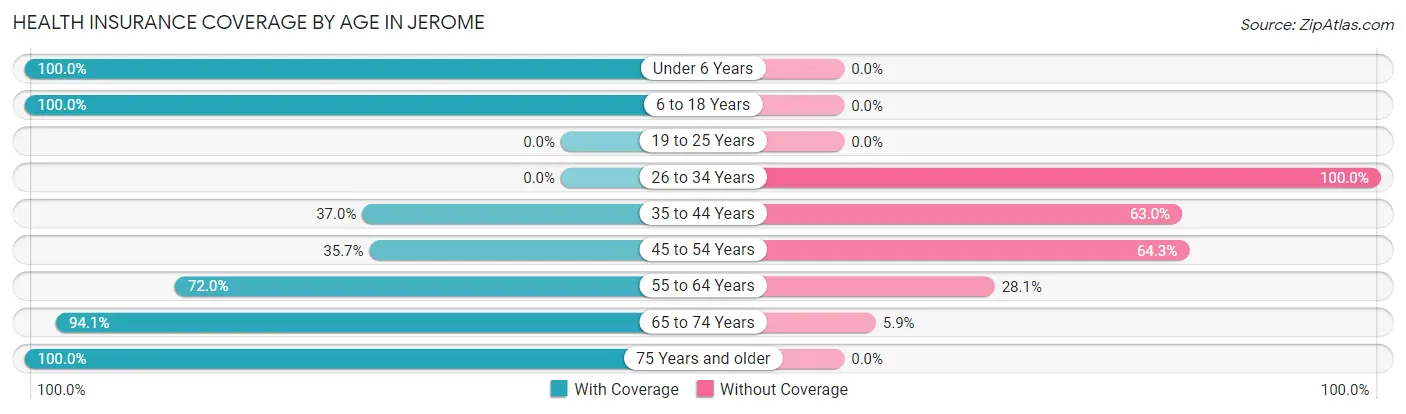
| Age Bracket | With Coverage | Without Coverage |
| Under 6 Years | 6 (100.0%) | 0 (0.0%) |
| 6 to 18 Years | 30 (100.0%) | 0 (0.0%) |
| 19 to 25 Years | 0 (0.0%) | 0 (0.0%) |
| 26 to 34 Years | 0 (0.0%) | 6 (100.0%) |
| 35 to 44 Years | 10 (37.0%) | 17 (63.0%) |
| 45 to 54 Years | 30 (35.7%) | 54 (64.3%) |
| 55 to 64 Years | 59 (72.0%) | 23 (28.1%) |
| 65 to 74 Years | 96 (94.1%) | 6 (5.9%) |
| 75 Years and older | 22 (100.0%) | 0 (0.0%) |
| Total | 253 (70.5%) | 106 (29.5%) |
Health Insurance Coverage by Citizenship Status in Jerome
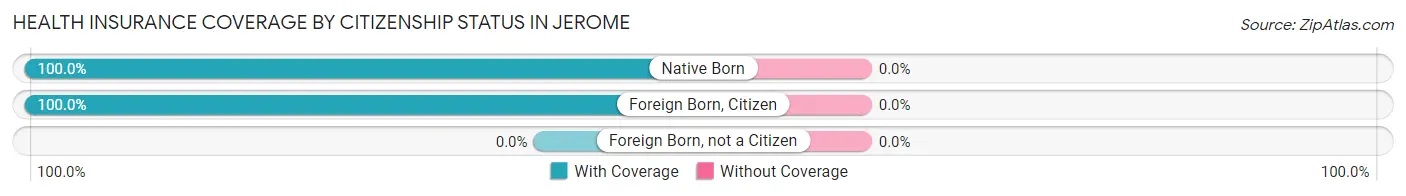
| Citizenship Status | With Coverage | Without Coverage |
| Native Born | 6 (100.0%) | 0 (0.0%) |
| Foreign Born, Citizen | 30 (100.0%) | 0 (0.0%) |
| Foreign Born, not a Citizen | 0 (0.0%) | 0 (0.0%) |
Health Insurance Coverage by Household Income in Jerome
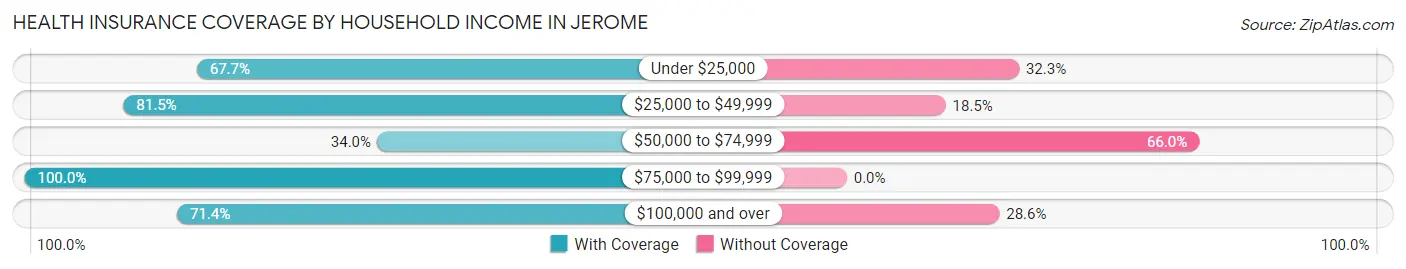
| Household Income | With Coverage | Without Coverage |
| Under $25,000 | 63 (67.7%) | 30 (32.3%) |
| $25,000 to $49,999 | 66 (81.5%) | 15 (18.5%) |
| $50,000 to $74,999 | 17 (34.0%) | 33 (66.0%) |
| $75,000 to $99,999 | 37 (100.0%) | 0 (0.0%) |
| $100,000 and over | 70 (71.4%) | 28 (28.6%) |
Public vs Private Health Insurance Coverage by Age in Jerome
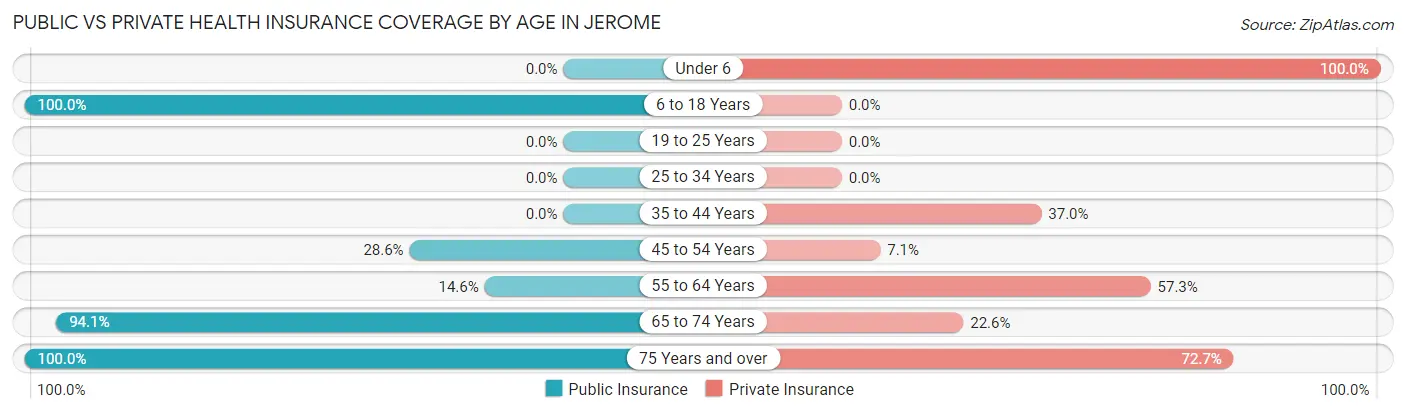
| Age Bracket | Public Insurance | Private Insurance |
| Under 6 | 0 (0.0%) | 6 (100.0%) |
| 6 to 18 Years | 30 (100.0%) | 0 (0.0%) |
| 19 to 25 Years | 0 (0.0%) | 0 (0.0%) |
| 25 to 34 Years | 0 (0.0%) | 0 (0.0%) |
| 35 to 44 Years | 0 (0.0%) | 10 (37.0%) |
| 45 to 54 Years | 24 (28.6%) | 6 (7.1%) |
| 55 to 64 Years | 12 (14.6%) | 47 (57.3%) |
| 65 to 74 Years | 96 (94.1%) | 23 (22.6%) |
| 75 Years and over | 22 (100.0%) | 16 (72.7%) |
| Total | 184 (51.2%) | 108 (30.1%) |
Disability Status by Sex by Age in Jerome
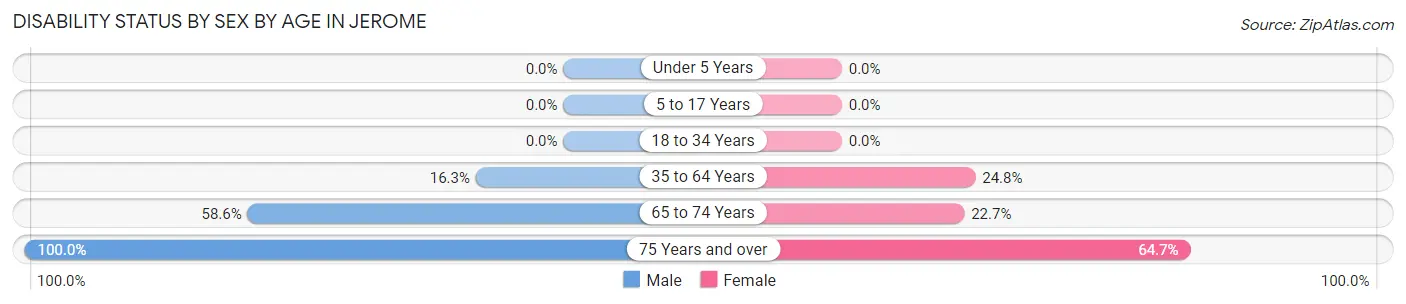
| Age Bracket | Male | Female |
| Under 5 Years | 0 (0.0%) | 0 (0.0%) |
| 5 to 17 Years | 0 (0.0%) | 0 (0.0%) |
| 18 to 34 Years | 0 (0.0%) | 0 (0.0%) |
| 35 to 64 Years | 13 (16.3%) | 28 (24.8%) |
| 65 to 74 Years | 34 (58.6%) | 10 (22.7%) |
| 75 Years and over | 5 (100.0%) | 11 (64.7%) |
Disability Class by Sex by Age in Jerome
Disability Class: Hearing Difficulty
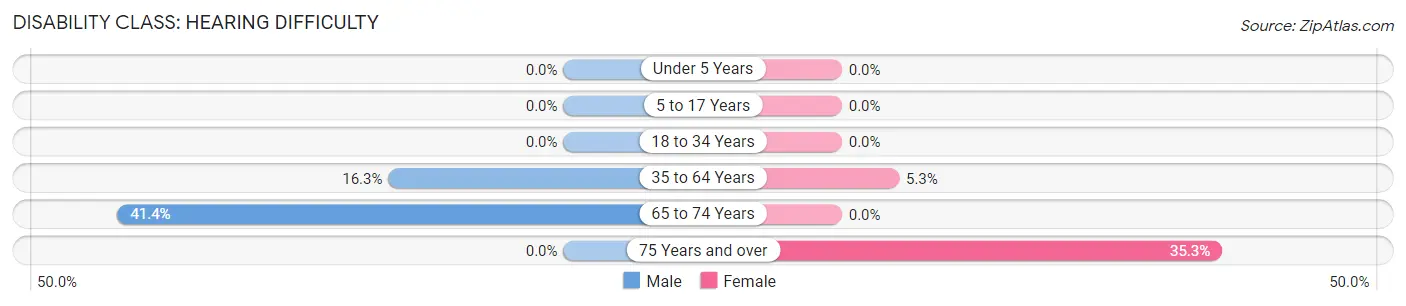
| Age Bracket | Male | Female |
| Under 5 Years | 0 (0.0%) | 0 (0.0%) |
| 5 to 17 Years | 0 (0.0%) | 0 (0.0%) |
| 18 to 34 Years | 0 (0.0%) | 0 (0.0%) |
| 35 to 64 Years | 13 (16.3%) | 6 (5.3%) |
| 65 to 74 Years | 24 (41.4%) | 0 (0.0%) |
| 75 Years and over | 0 (0.0%) | 6 (35.3%) |
Disability Class: Vision Difficulty
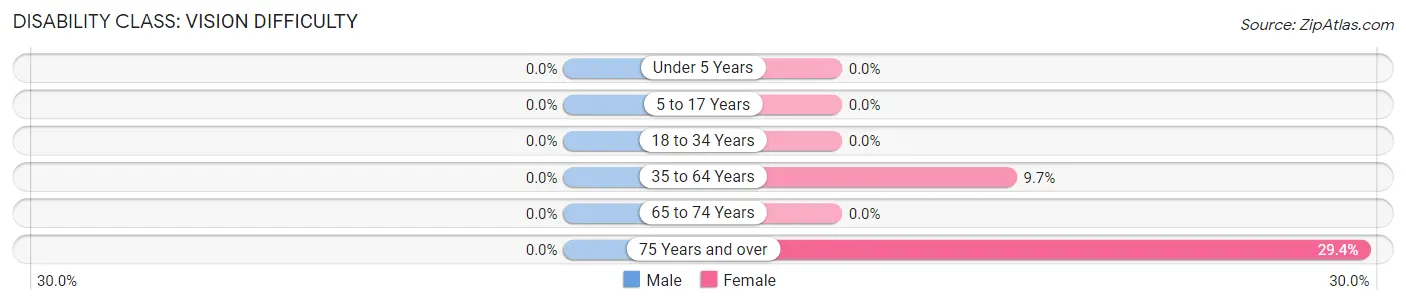
| Age Bracket | Male | Female |
| Under 5 Years | 0 (0.0%) | 0 (0.0%) |
| 5 to 17 Years | 0 (0.0%) | 0 (0.0%) |
| 18 to 34 Years | 0 (0.0%) | 0 (0.0%) |
| 35 to 64 Years | 0 (0.0%) | 11 (9.7%) |
| 65 to 74 Years | 0 (0.0%) | 0 (0.0%) |
| 75 Years and over | 0 (0.0%) | 5 (29.4%) |
Disability Class: Cognitive Difficulty
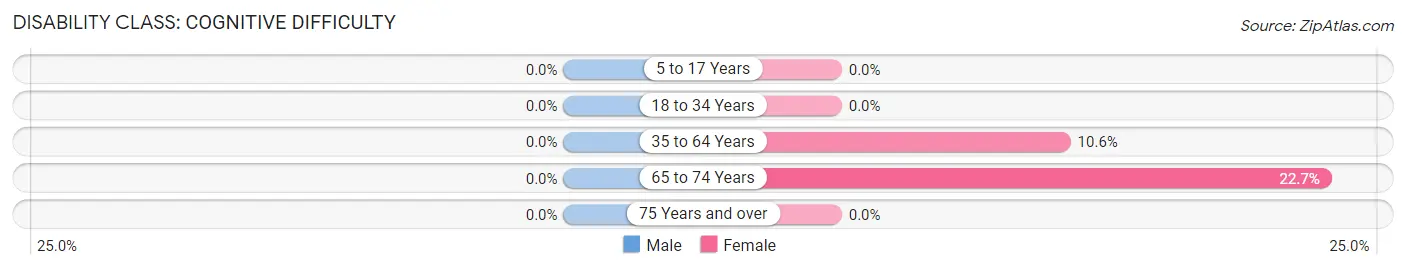
| Age Bracket | Male | Female |
| 5 to 17 Years | 0 (0.0%) | 0 (0.0%) |
| 18 to 34 Years | 0 (0.0%) | 0 (0.0%) |
| 35 to 64 Years | 0 (0.0%) | 12 (10.6%) |
| 65 to 74 Years | 0 (0.0%) | 10 (22.7%) |
| 75 Years and over | 0 (0.0%) | 0 (0.0%) |
Disability Class: Ambulatory Difficulty
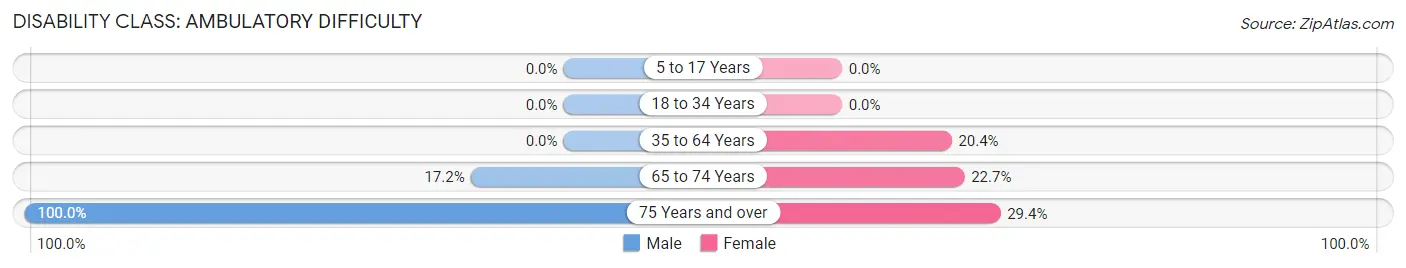
| Age Bracket | Male | Female |
| 5 to 17 Years | 0 (0.0%) | 0 (0.0%) |
| 18 to 34 Years | 0 (0.0%) | 0 (0.0%) |
| 35 to 64 Years | 0 (0.0%) | 23 (20.3%) |
| 65 to 74 Years | 10 (17.2%) | 10 (22.7%) |
| 75 Years and over | 5 (100.0%) | 5 (29.4%) |
Disability Class: Self-Care Difficulty
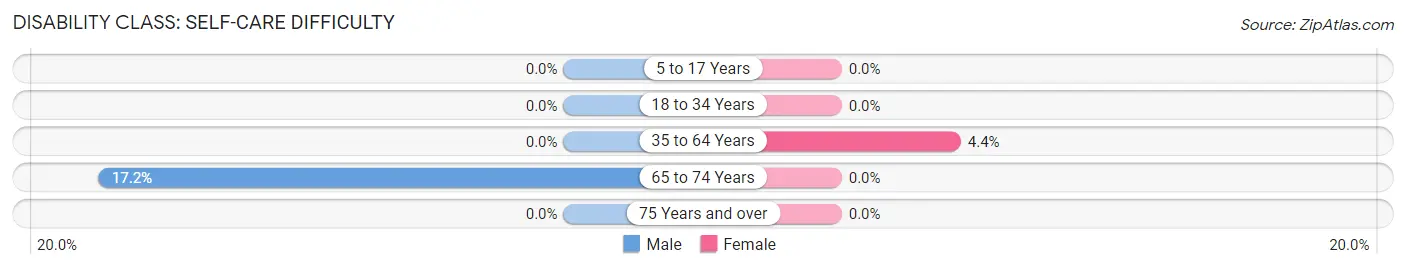
| Age Bracket | Male | Female |
| 5 to 17 Years | 0 (0.0%) | 0 (0.0%) |
| 18 to 34 Years | 0 (0.0%) | 0 (0.0%) |
| 35 to 64 Years | 0 (0.0%) | 5 (4.4%) |
| 65 to 74 Years | 10 (17.2%) | 0 (0.0%) |
| 75 Years and over | 0 (0.0%) | 0 (0.0%) |
Technology Access in Jerome
Computing Device Access in Jerome
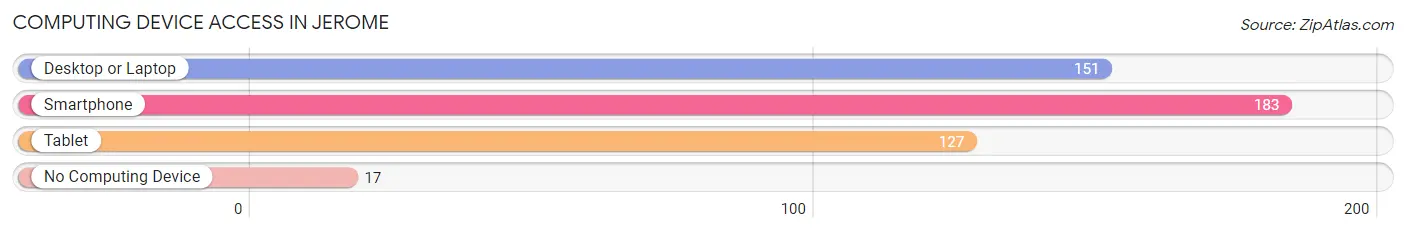
| Device Type | # Households | % Households |
| Desktop or Laptop | 151 | 66.2% |
| Smartphone | 183 | 80.3% |
| Tablet | 127 | 55.7% |
| No Computing Device | 17 | 7.5% |
| Total | 228 | 100.0% |
Internet Access in Jerome
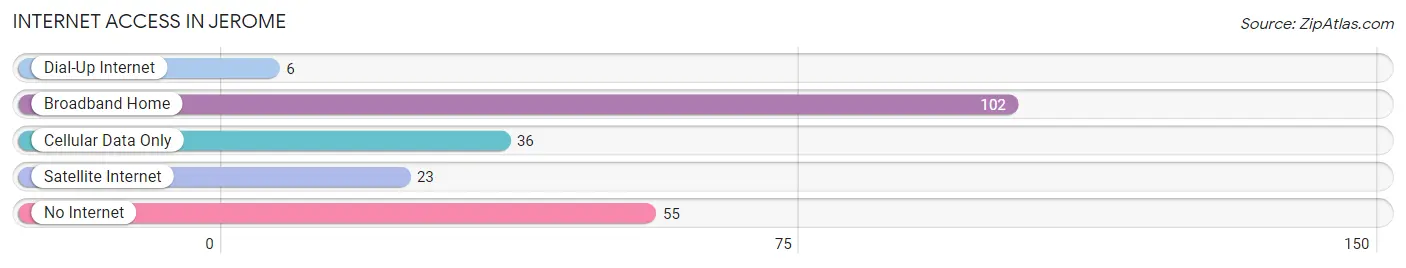
| Internet Type | # Households | % Households |
| Dial-Up Internet | 6 | 2.6% |
| Broadband Home | 102 | 44.7% |
| Cellular Data Only | 36 | 15.8% |
| Satellite Internet | 23 | 10.1% |
| No Internet | 55 | 24.1% |
| Total | 228 | 100.0% |
Jerome Summary
Jerome, Arizona is a small town located in the Black Hills of Yavapai County, Arizona. It is situated in the Verde Valley, approximately 100 miles north of Phoenix. The town was founded in 1876 and was once the fourth largest city in Arizona. It is now a popular tourist destination, known for its historic buildings, unique shops, and vibrant art scene.
History
The area that is now Jerome was first settled by miners in the late 1800s. The town was named after Eugene Murray Jerome, a prospector who discovered copper in the area in 1876. The town quickly grew as miners flocked to the area in search of copper, gold, and silver. By the early 1900s, Jerome had become the fourth largest city in Arizona, with a population of over 15,000.
The town’s fortunes changed in the 1920s, when the price of copper dropped and the mines began to close. By the 1950s, the population had dwindled to less than 500. In 1953, the town was declared a National Historic Landmark, and in 1967, it was designated a State Historic Park.
Today, Jerome is a popular tourist destination, known for its historic buildings, unique shops, and vibrant art scene. The town is home to several museums, including the Jerome Historical Society Museum, the Jerome State Historic Park, and the Mine Museum.
Geography
Jerome is located in the Black Hills of Yavapai County, Arizona. It is situated in the Verde Valley, approximately 100 miles north of Phoenix. The town is surrounded by mountains, including Mingus Mountain to the west and the Black Hills to the east. The town is located at an elevation of 5,200 feet, making it one of the highest towns in Arizona.
The climate in Jerome is semi-arid, with hot summers and mild winters. The average annual temperature is 64°F, and the average annual precipitation is 12.5 inches.
Economy
The economy of Jerome is largely based on tourism. The town is home to several museums, art galleries, and unique shops, which attract visitors from all over the world. The town is also home to several wineries, which produce a variety of wines.
In addition to tourism, Jerome is home to several small businesses, including restaurants, cafes, and retail stores. The town is also home to several mining companies, which extract copper, gold, and silver from the surrounding hills.
Demographics
As of the 2010 census, the population of Jerome was 444. The racial makeup of the town was 94.2% White, 0.2% African American, 0.2% Native American, 0.2% Asian, 0.2% Pacific Islander, 0.2% from other races, and 4.9% from two or more races. Hispanic or Latino of any race were 4.3% of the population.
The median household income in Jerome was $37,500, and the median family income was $41,250. The per capita income was $20,917. About 11.2% of families and 14.2% of the population were below the poverty line, including 18.2% of those under age 18 and none of those age 65 or over.
Common Questions
What is Per Capita Income in Jerome?
Per Capita income in Jerome is $29,542.
What is the Median Family Income in Jerome?
Median Family Income in Jerome is $90,179.
What is the Median Household income in Jerome?
Median Household Income in Jerome is $35,208.
What is Income or Wage Gap in Jerome?
Income or Wage Gap in Jerome is 23.7%.
Women in Jerome earn 76.3 cents for every dollar earned by a man.
What is Inequality or Gini Index in Jerome?
Inequality or Gini Index in Jerome is 0.42.
What is the Total Population of Jerome?
Total Population of Jerome is 363.
What is the Total Male Population of Jerome?
Total Male Population of Jerome is 172.
What is the Total Female Population of Jerome?
Total Female Population of Jerome is 191.
What is the Ratio of Males per 100 Females in Jerome?
There are 90.05 Males per 100 Females in Jerome.
What is the Ratio of Females per 100 Males in Jerome?
There are 111.05 Females per 100 Males in Jerome.
What is the Median Population Age in Jerome?
Median Population Age in Jerome is 57.0 Years.
What is the Average Family Size in Jerome
Average Family Size in Jerome is 2.3 People.
What is the Average Household Size in Jerome
Average Household Size in Jerome is 1.6 People.
How Large is the Labor Force in Jerome?
There are 210 People in the Labor Forcein in Jerome.
What is the Percentage of People in the Labor Force in Jerome?
61.9% of People are in the Labor Force in Jerome.
What is the Unemployment Rate in Jerome?
Unemployment Rate in Jerome is 6.3%.