Indian Wells, AZ Map & Demographics
Indian Wells Map
Indian Wells Overview
$11,801
PER CAPITA INCOME
$45,260
AVG FAMILY INCOME
$43,333
AVG HOUSEHOLD INCOME
11.0%
WAGE / INCOME GAP [ % ]
89.0¢/ $1
WAGE / INCOME GAP [ $ ]
0.43
INEQUALITY / GINI INDEX
357
TOTAL POPULATION
193
MALE POPULATION
164
FEMALE POPULATION
117.68
MALES / 100 FEMALES
84.97
FEMALES / 100 MALES
42.9
MEDIAN AGE
3.8
AVG FAMILY SIZE
3.5
AVG HOUSEHOLD SIZE
106
LABOR FORCE [ PEOPLE ]
38.4%
PERCENT IN LABOR FORCE
19.8%
UNEMPLOYMENT RATE
Indian Wells Zip Codes
Indian Wells Area Codes
Income in Indian Wells
Income Overview in Indian Wells
Per Capita Income in Indian Wells is $11,801, while median incomes of families and households are $45,260 and $43,333 respectively.
| Characteristic | Number | Measure |
| Per Capita Income | 357 | $11,801 |
| Median Family Income | 85 | $45,260 |
| Mean Family Income | 85 | $45,176 |
| Median Household Income | 94 | $43,333 |
| Mean Household Income | 94 | $41,245 |
| Income Deficit | 85 | $0 |
| Wage / Income Gap (%) | 357 | 11.01% |
| Wage / Income Gap ($) | 357 | 88.99¢ per $1 |
| Gini / Inequality Index | 357 | 0.43 |
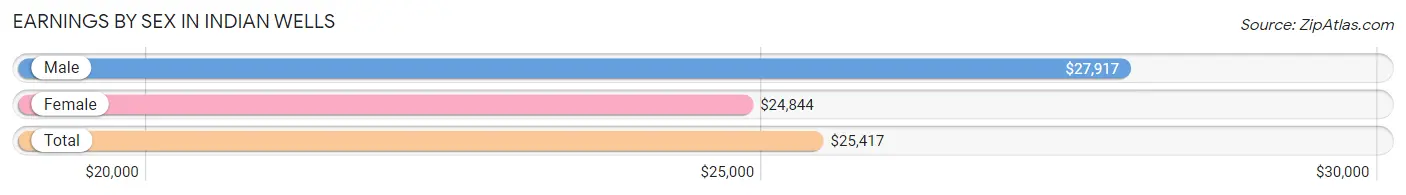
Earnings by Sex in Indian Wells
Average Earnings in Indian Wells are $25,417, $27,917 for men and $24,844 for women, a difference of 11.0%.
| Sex | Number | Average Earnings |
| Male | 54 (60.7%) | $27,917 |
| Female | 35 (39.3%) | $24,844 |
| Total | 89 (100.0%) | $25,417 |
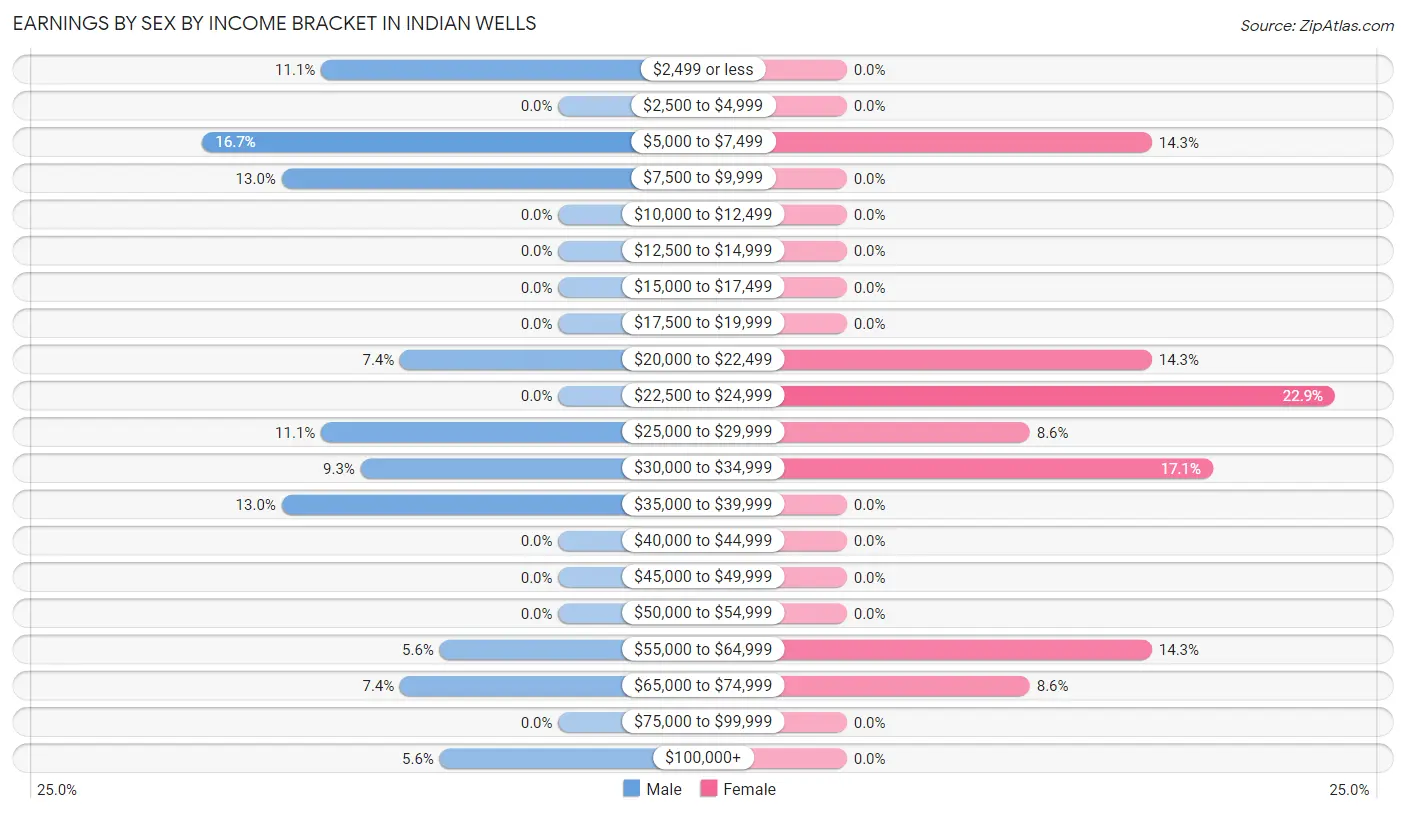
Earnings by Sex by Income Bracket in Indian Wells
The most common earnings brackets in Indian Wells are $5,000 to $7,499 for men (9 | 16.7%) and $22,500 to $24,999 for women (8 | 22.9%).
| Income | Male | Female |
| $2,499 or less | 6 (11.1%) | 0 (0.0%) |
| $2,500 to $4,999 | 0 (0.0%) | 0 (0.0%) |
| $5,000 to $7,499 | 9 (16.7%) | 5 (14.3%) |
| $7,500 to $9,999 | 7 (13.0%) | 0 (0.0%) |
| $10,000 to $12,499 | 0 (0.0%) | 0 (0.0%) |
| $12,500 to $14,999 | 0 (0.0%) | 0 (0.0%) |
| $15,000 to $17,499 | 0 (0.0%) | 0 (0.0%) |
| $17,500 to $19,999 | 0 (0.0%) | 0 (0.0%) |
| $20,000 to $22,499 | 4 (7.4%) | 5 (14.3%) |
| $22,500 to $24,999 | 0 (0.0%) | 8 (22.9%) |
| $25,000 to $29,999 | 6 (11.1%) | 3 (8.6%) |
| $30,000 to $34,999 | 5 (9.3%) | 6 (17.1%) |
| $35,000 to $39,999 | 7 (13.0%) | 0 (0.0%) |
| $40,000 to $44,999 | 0 (0.0%) | 0 (0.0%) |
| $45,000 to $49,999 | 0 (0.0%) | 0 (0.0%) |
| $50,000 to $54,999 | 0 (0.0%) | 0 (0.0%) |
| $55,000 to $64,999 | 3 (5.6%) | 5 (14.3%) |
| $65,000 to $74,999 | 4 (7.4%) | 3 (8.6%) |
| $75,000 to $99,999 | 0 (0.0%) | 0 (0.0%) |
| $100,000+ | 3 (5.6%) | 0 (0.0%) |
| Total | 54 (100.0%) | 35 (100.0%) |
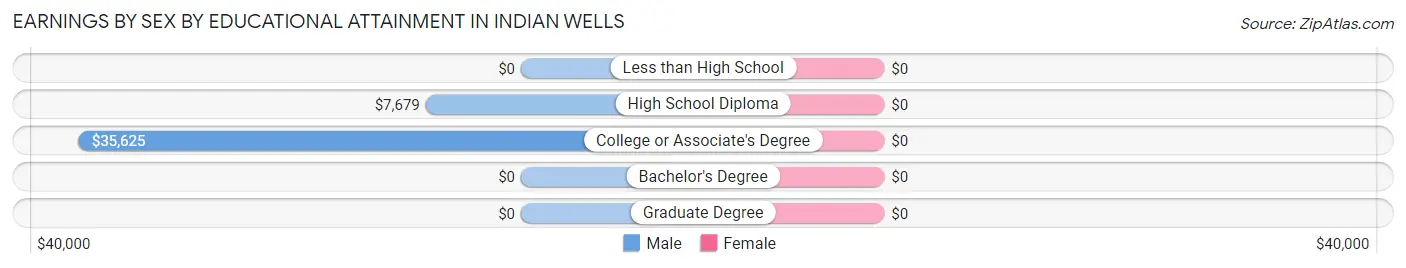
Earnings by Sex by Educational Attainment in Indian Wells
| Educational Attainment | Male Income | Female Income |
| Less than High School | - | - |
| High School Diploma | $7,679 | $0 |
| College or Associate's Degree | $35,625 | $0 |
| Bachelor's Degree | - | - |
| Graduate Degree | - | - |
| Total | $29,167 | $33,333 |
Family Income in Indian Wells
Family Income Brackets in Indian Wells
According to the Indian Wells family income data, there are 29 families falling into the $35,000 to $49,999 income range, which is the most common income bracket and makes up 34.1% of all families.
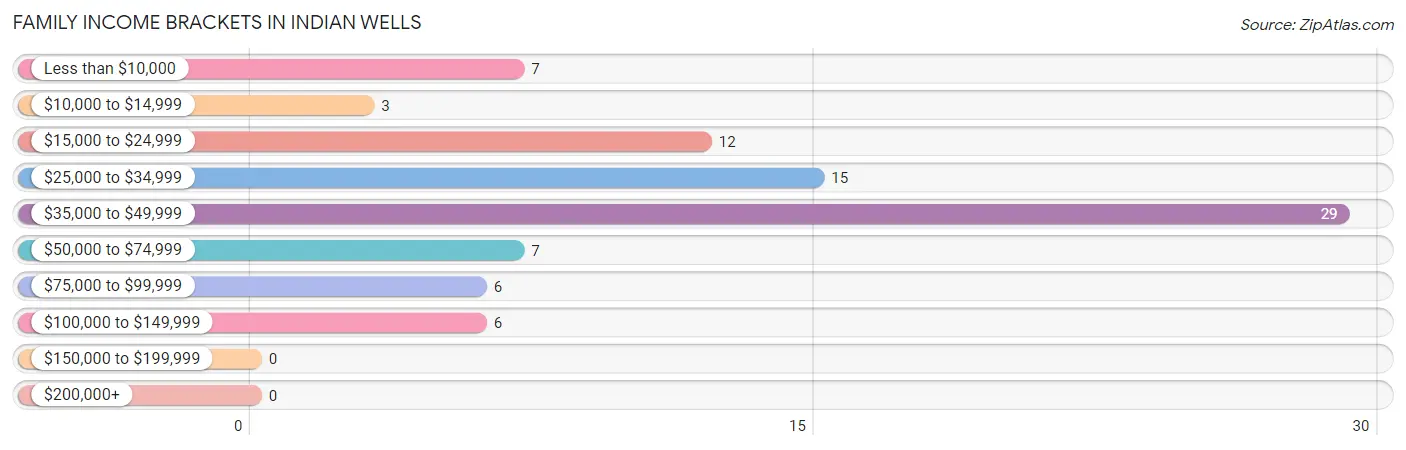
| Income Bracket | # Families | % Families |
| Less than $10,000 | 7 | 8.2% |
| $10,000 to $14,999 | 3 | 3.5% |
| $15,000 to $24,999 | 12 | 14.1% |
| $25,000 to $34,999 | 15 | 17.6% |
| $35,000 to $49,999 | 29 | 34.1% |
| $50,000 to $74,999 | 7 | 8.2% |
| $75,000 to $99,999 | 6 | 7.1% |
| $100,000 to $149,999 | 6 | 7.1% |
| $150,000 to $199,999 | 0 | 0.0% |
| $200,000+ | 0 | 0.0% |
Family Income by Famaliy Size in Indian Wells
5-person families (45 | 52.9%) account for the highest median family income in Indian Wells with $46,094 per family, while 3-person families (16 | 18.8%) have the highest median income of $10,278 per family member.
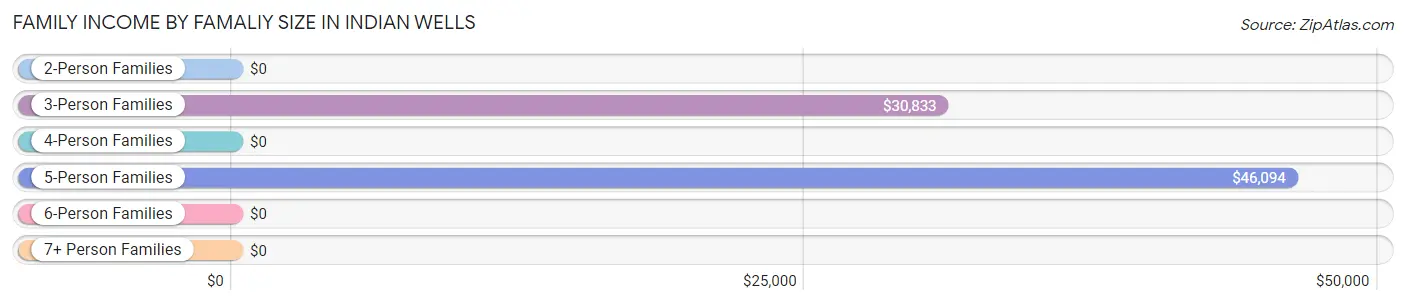
| Income Bracket | # Families | Median Income |
| 2-Person Families | 11 (12.9%) | $0 |
| 3-Person Families | 16 (18.8%) | $30,833 |
| 4-Person Families | 4 (4.7%) | $0 |
| 5-Person Families | 45 (52.9%) | $46,094 |
| 6-Person Families | 6 (7.1%) | $0 |
| 7+ Person Families | 3 (3.5%) | $0 |
| Total | 85 (100.0%) | $45,260 |
Family Income by Number of Earners in Indian Wells
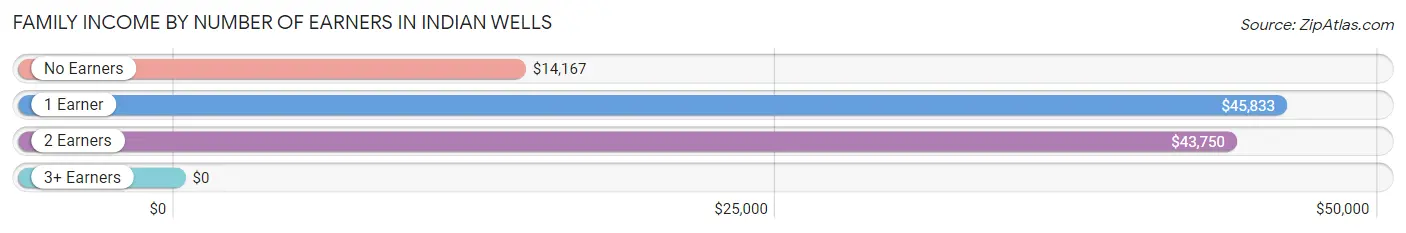
| Number of Earners | # Families | Median Income |
| No Earners | 18 (21.2%) | $14,167 |
| 1 Earner | 52 (61.2%) | $45,833 |
| 2 Earners | 9 (10.6%) | $43,750 |
| 3+ Earners | 6 (7.1%) | $0 |
| Total | 85 (100.0%) | $45,260 |
Household Income in Indian Wells
Household Income Brackets in Indian Wells
With 29 households falling in the category, the $35,000 to $49,999 income range is the most frequent in Indian Wells, accounting for 30.8% of all households.
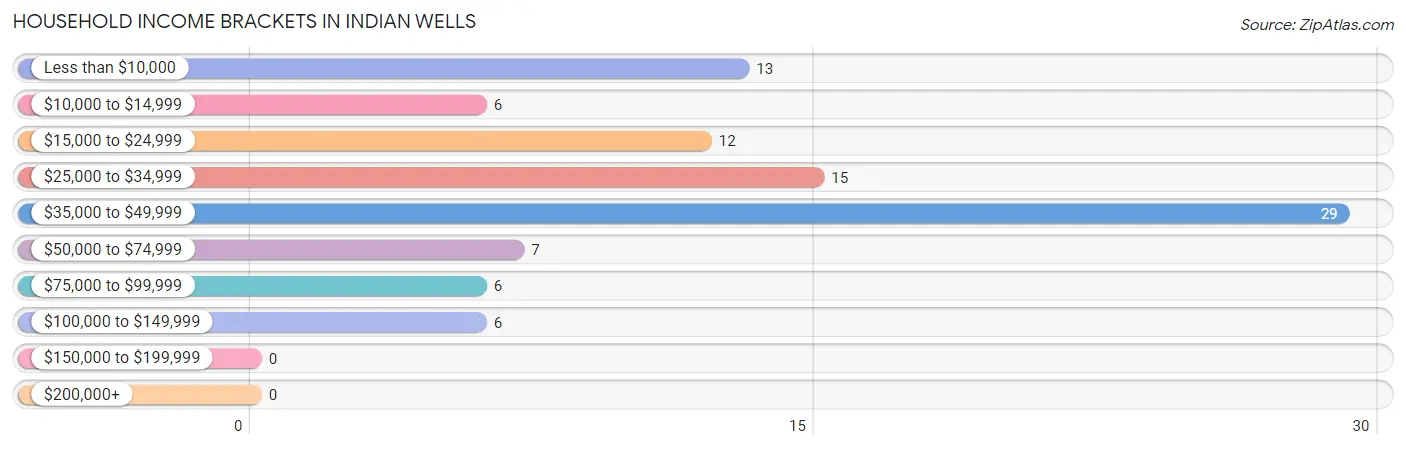
| Income Bracket | # Households | % Households |
| Less than $10,000 | 13 | 13.8% |
| $10,000 to $14,999 | 6 | 6.4% |
| $15,000 to $24,999 | 12 | 12.8% |
| $25,000 to $34,999 | 15 | 16.0% |
| $35,000 to $49,999 | 29 | 30.9% |
| $50,000 to $74,999 | 7 | 7.4% |
| $75,000 to $99,999 | 6 | 6.4% |
| $100,000 to $149,999 | 6 | 6.4% |
| $150,000 to $199,999 | 0 | 0.0% |
| $200,000+ | 0 | 0.0% |
Household Income by Householder Age in Indian Wells
The median household income in Indian Wells is $43,333, with the highest median household income of $45,729 found in the 65+ years age bracket for the primary householder. A total of 50 households (53.2%) fall into this category. Meanwhile, the 15 to 24 years age bracket for the primary householder has the lowest median household income of $0, with 4 households (4.3%) in this group.
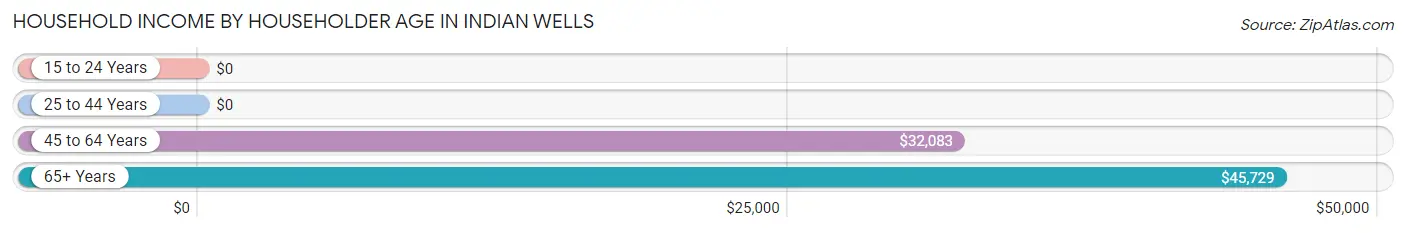
| Income Bracket | # Households | Median Income |
| 15 to 24 Years | 4 (4.3%) | $0 |
| 25 to 44 Years | 6 (6.4%) | $0 |
| 45 to 64 Years | 34 (36.2%) | $32,083 |
| 65+ Years | 50 (53.2%) | $45,729 |
| Total | 94 (100.0%) | $43,333 |
Poverty in Indian Wells
Income Below Poverty by Sex and Age in Indian Wells
With 39.7% poverty level for males and 22.6% for females among the residents of Indian Wells, 25 to 34 year old males and under 5 year old females are the most vulnerable to poverty, with 12 males (85.7%) and 6 females (100.0%) in their respective age groups living below the poverty level.
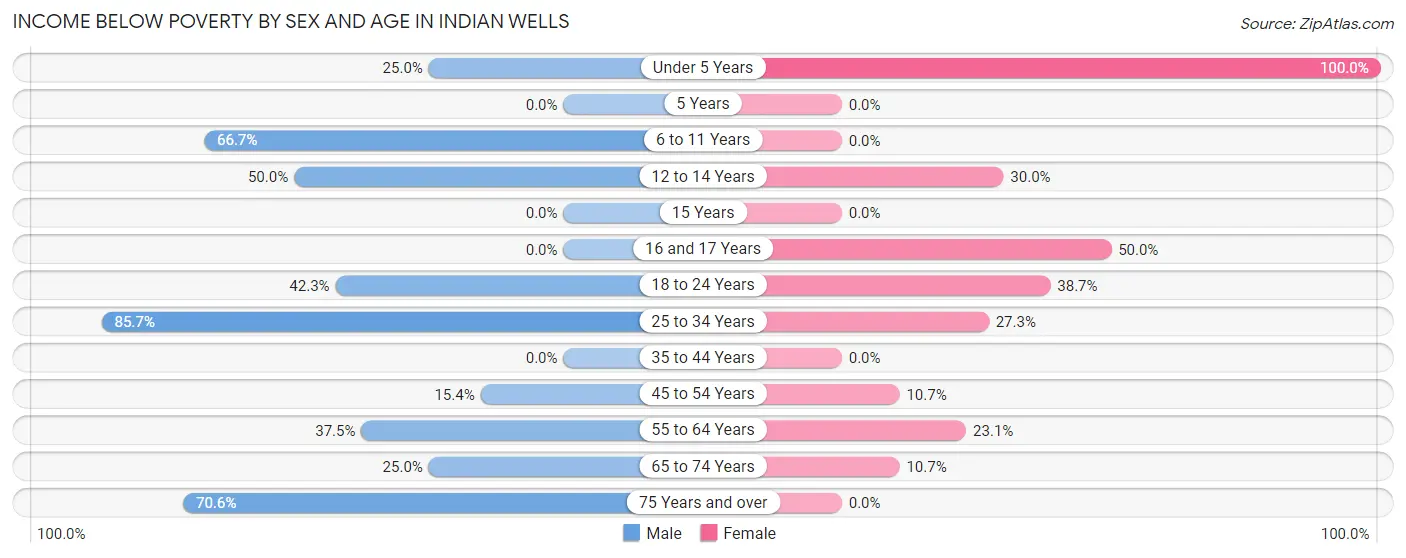
| Age Bracket | Male | Female |
| Under 5 Years | 3 (25.0%) | 6 (100.0%) |
| 5 Years | 0 (0.0%) | 0 (0.0%) |
| 6 to 11 Years | 10 (66.7%) | 0 (0.0%) |
| 12 to 14 Years | 3 (50.0%) | 3 (30.0%) |
| 15 Years | 0 (0.0%) | 0 (0.0%) |
| 16 and 17 Years | 0 (0.0%) | 4 (50.0%) |
| 18 to 24 Years | 11 (42.3%) | 12 (38.7%) |
| 25 to 34 Years | 12 (85.7%) | 3 (27.3%) |
| 35 to 44 Years | 0 (0.0%) | 0 (0.0%) |
| 45 to 54 Years | 4 (15.4%) | 3 (10.7%) |
| 55 to 64 Years | 9 (37.5%) | 3 (23.1%) |
| 65 to 74 Years | 9 (25.0%) | 3 (10.7%) |
| 75 Years and over | 12 (70.6%) | 0 (0.0%) |
| Total | 73 (39.7%) | 37 (22.6%) |
Income Above Poverty by Sex and Age in Indian Wells
According to the poverty statistics in Indian Wells, males aged 35 to 44 years and females aged 6 to 11 years are the age groups that are most secure financially, with 100.0% of males and 100.0% of females in these age groups living above the poverty line.
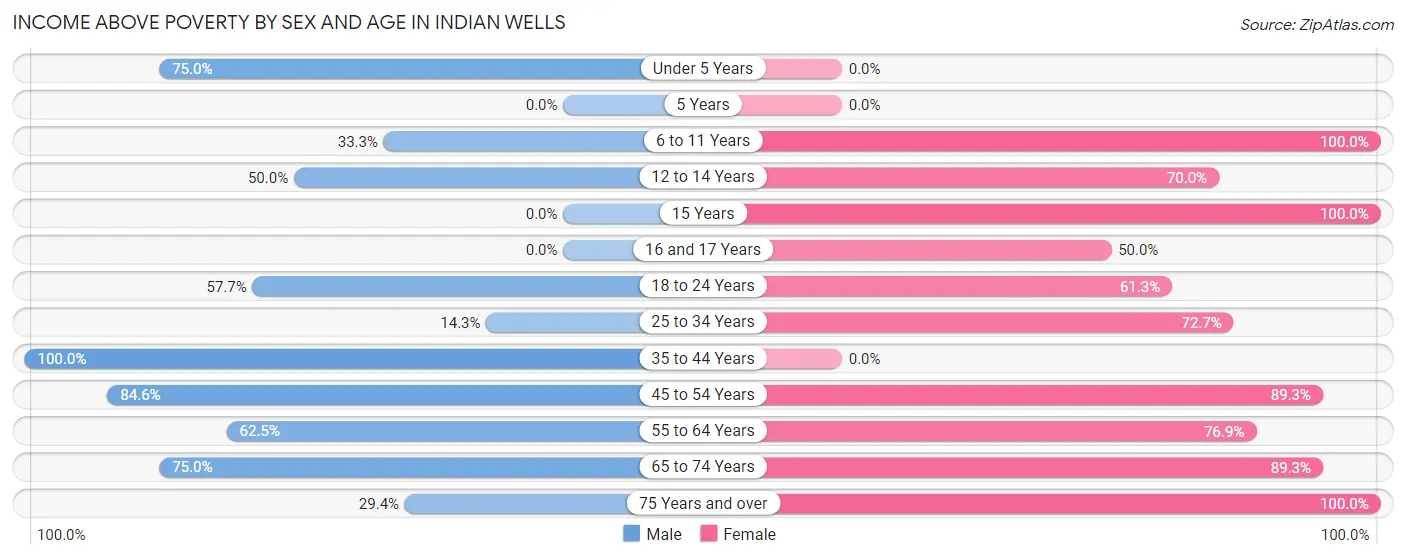
| Age Bracket | Male | Female |
| Under 5 Years | 9 (75.0%) | 0 (0.0%) |
| 5 Years | 0 (0.0%) | 0 (0.0%) |
| 6 to 11 Years | 5 (33.3%) | 16 (100.0%) |
| 12 to 14 Years | 3 (50.0%) | 7 (70.0%) |
| 15 Years | 0 (0.0%) | 7 (100.0%) |
| 16 and 17 Years | 0 (0.0%) | 4 (50.0%) |
| 18 to 24 Years | 15 (57.7%) | 19 (61.3%) |
| 25 to 34 Years | 2 (14.3%) | 8 (72.7%) |
| 35 to 44 Years | 8 (100.0%) | 0 (0.0%) |
| 45 to 54 Years | 22 (84.6%) | 25 (89.3%) |
| 55 to 64 Years | 15 (62.5%) | 10 (76.9%) |
| 65 to 74 Years | 27 (75.0%) | 25 (89.3%) |
| 75 Years and over | 5 (29.4%) | 6 (100.0%) |
| Total | 111 (60.3%) | 127 (77.4%) |
Income Below Poverty Among Married-Couple Families in Indian Wells
The poverty statistics for married-couple families in Indian Wells show that 21.8% or 12 of the total 55 families live below the poverty line. Families with no children have the highest poverty rate of 66.7%, comprising of 6 families. On the other hand, families with 1 or 2 children have the lowest poverty rate of 0.0%, which includes 0 families.
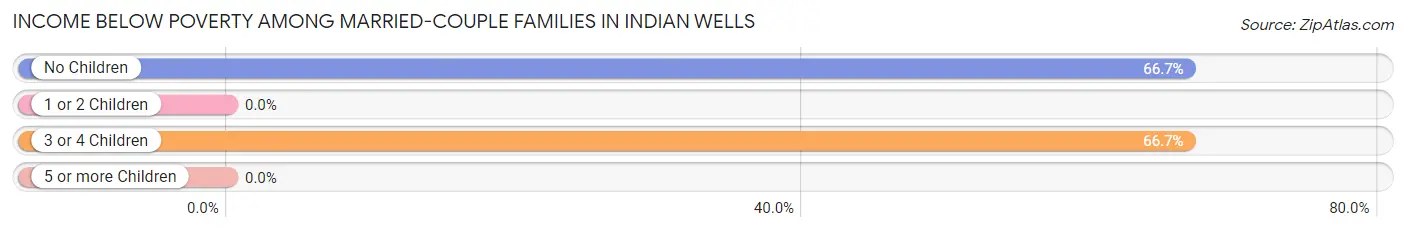
| Children | Above Poverty | Below Poverty |
| No Children | 3 (33.3%) | 6 (66.7%) |
| 1 or 2 Children | 37 (100.0%) | 0 (0.0%) |
| 3 or 4 Children | 3 (33.3%) | 6 (66.7%) |
| 5 or more Children | 0 (0.0%) | 0 (0.0%) |
| Total | 43 (78.2%) | 12 (21.8%) |
Income Below Poverty Among Single-Parent Households in Indian Wells
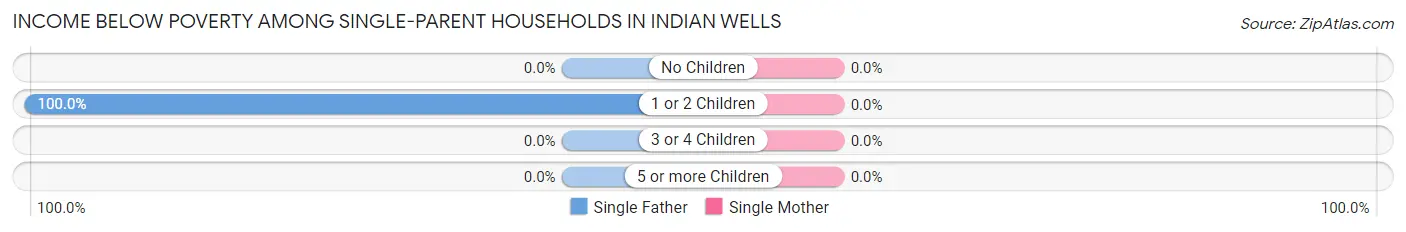
| Children | Single Father | Single Mother |
| No Children | 0 (0.0%) | 0 (0.0%) |
| 1 or 2 Children | 13 (100.0%) | 0 (0.0%) |
| 3 or 4 Children | 0 (0.0%) | 0 (0.0%) |
| 5 or more Children | 0 (0.0%) | 0 (0.0%) |
| Total | 13 (86.7%) | 0 (0.0%) |
Income Below Poverty Among Married-Couple vs Single-Parent Households in Indian Wells
The poverty data for Indian Wells shows that 12 of the married-couple family households (21.8%) and 13 of the single-parent households (43.3%) are living below the poverty level. Within the married-couple family households, those with no children have the highest poverty rate, with 6 households (66.7%) falling below the poverty line. Among the single-parent households, those with 1 or 2 children have the highest poverty rate, with 13 household (52.0%) living below poverty.
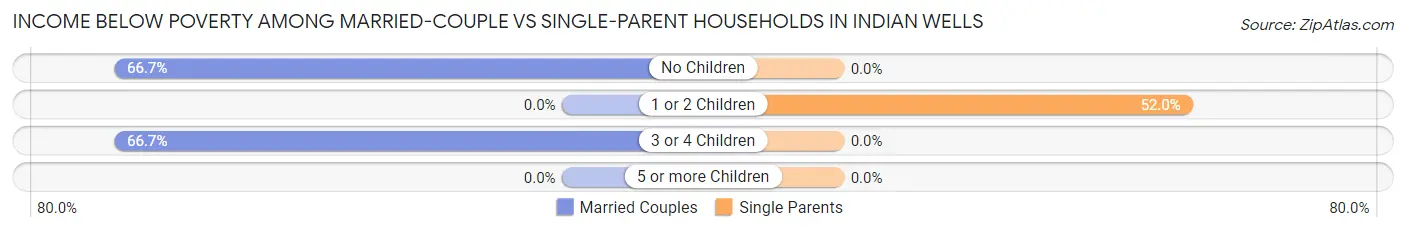
| Children | Married-Couple Families | Single-Parent Households |
| No Children | 6 (66.7%) | 0 (0.0%) |
| 1 or 2 Children | 0 (0.0%) | 13 (52.0%) |
| 3 or 4 Children | 6 (66.7%) | 0 (0.0%) |
| 5 or more Children | 0 (0.0%) | 0 (0.0%) |
| Total | 12 (21.8%) | 13 (43.3%) |
Race in Indian Wells
The most populous races in Indian Wells are Native / Alaskan (332 | 93.0%), Hispanic or Latino (20 | 5.6%), and White / Caucasian (12 | 3.4%).
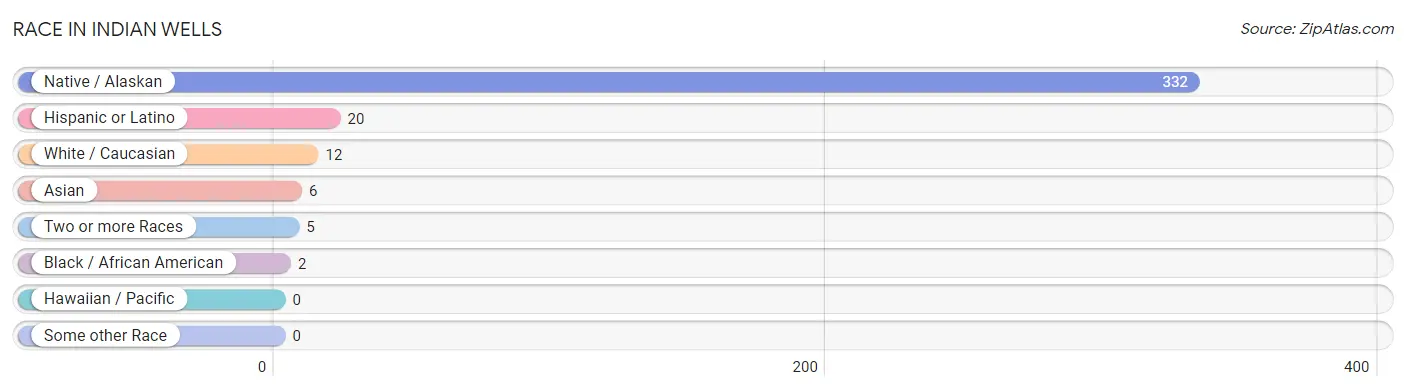
| Race | # Population | % Population |
| Asian | 6 | 1.7% |
| Black / African American | 2 | 0.6% |
| Hawaiian / Pacific | 0 | 0.0% |
| Hispanic or Latino | 20 | 5.6% |
| Native / Alaskan | 332 | 93.0% |
| White / Caucasian | 12 | 3.4% |
| Two or more Races | 5 | 1.4% |
| Some other Race | 0 | 0.0% |
| Total | 357 | 100.0% |
Ancestry in Indian Wells
The most populous ancestries reported in Indian Wells are Navajo (328 | 91.9%), Mexican (20 | 5.6%), Laotian (6 | 1.7%), and Portuguese (5 | 1.4%), together accounting for 100.6% of all Indian Wells residents.
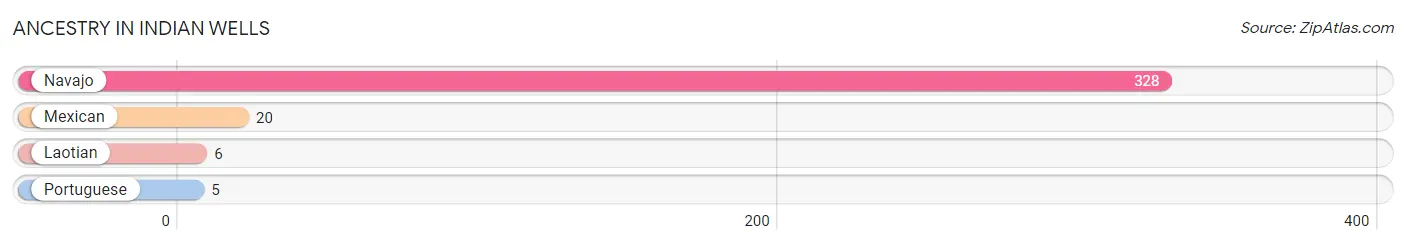
| Ancestry | # Population | % Population |
| Laotian | 6 | 1.7% |
| Mexican | 20 | 5.6% |
| Navajo | 328 | 91.9% |
| Portuguese | 5 | 1.4% | View All 4 Rows |
Immigrants in Indian Wells
The most numerous immigrant groups reported in Indian Wells came from Asia (6 | 1.7%), Central America (6 | 1.7%), Indonesia (6 | 1.7%), Latin America (6 | 1.7%), and Mexico (6 | 1.7%), together accounting for 8.4% of all Indian Wells residents.
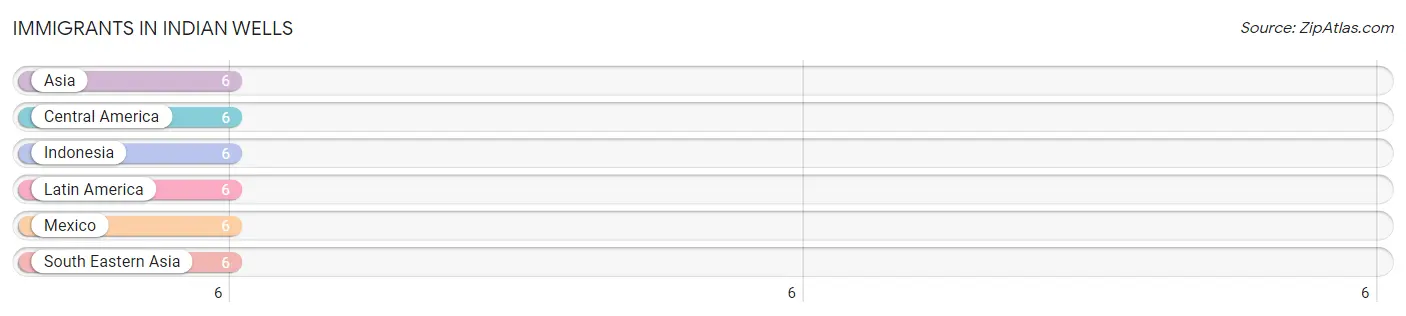
| Immigration Origin | # Population | % Population |
| Asia | 6 | 1.7% |
| Central America | 6 | 1.7% |
| Indonesia | 6 | 1.7% |
| Latin America | 6 | 1.7% |
| Mexico | 6 | 1.7% |
| South Eastern Asia | 6 | 1.7% | View All 6 Rows |
Sex and Age in Indian Wells
Sex and Age in Indian Wells
The most populous age groups in Indian Wells are 70 to 74 Years (30 | 15.5%) for men and 70 to 74 Years (28 | 17.1%) for women.
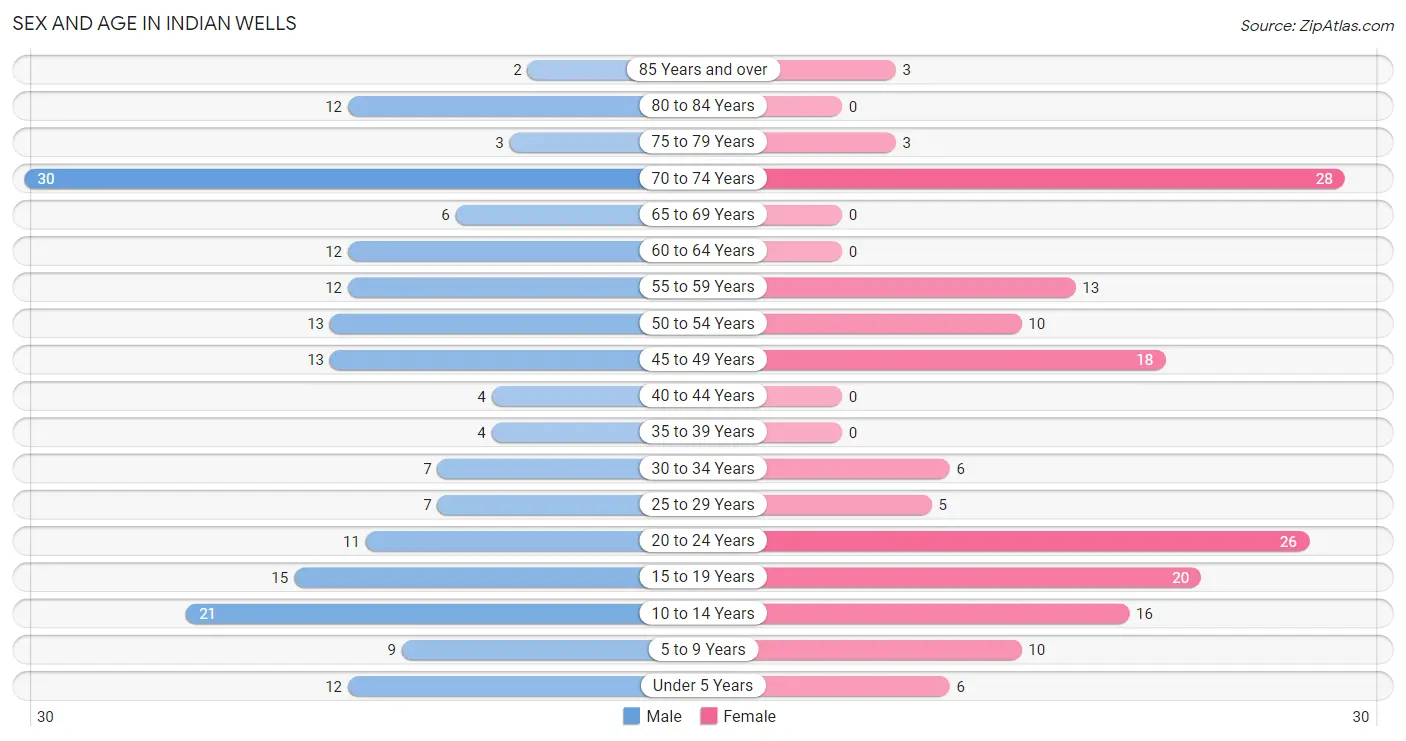
| Age Bracket | Male | Female |
| Under 5 Years | 12 (6.2%) | 6 (3.7%) |
| 5 to 9 Years | 9 (4.7%) | 10 (6.1%) |
| 10 to 14 Years | 21 (10.9%) | 16 (9.8%) |
| 15 to 19 Years | 15 (7.8%) | 20 (12.2%) |
| 20 to 24 Years | 11 (5.7%) | 26 (15.9%) |
| 25 to 29 Years | 7 (3.6%) | 5 (3.0%) |
| 30 to 34 Years | 7 (3.6%) | 6 (3.7%) |
| 35 to 39 Years | 4 (2.1%) | 0 (0.0%) |
| 40 to 44 Years | 4 (2.1%) | 0 (0.0%) |
| 45 to 49 Years | 13 (6.7%) | 18 (11.0%) |
| 50 to 54 Years | 13 (6.7%) | 10 (6.1%) |
| 55 to 59 Years | 12 (6.2%) | 13 (7.9%) |
| 60 to 64 Years | 12 (6.2%) | 0 (0.0%) |
| 65 to 69 Years | 6 (3.1%) | 0 (0.0%) |
| 70 to 74 Years | 30 (15.5%) | 28 (17.1%) |
| 75 to 79 Years | 3 (1.5%) | 3 (1.8%) |
| 80 to 84 Years | 12 (6.2%) | 0 (0.0%) |
| 85 Years and over | 2 (1.0%) | 3 (1.8%) |
| Total | 193 (100.0%) | 164 (100.0%) |
Families and Households in Indian Wells
Median Family Size in Indian Wells
The median family size in Indian Wells is 3.82 persons per family, with married-couple families (55 | 64.7%) accounting for the largest median family size of 4.02 persons per family. On the other hand, single male/father families (15 | 17.6%) represent the smallest median family size with 3.00 persons per family.
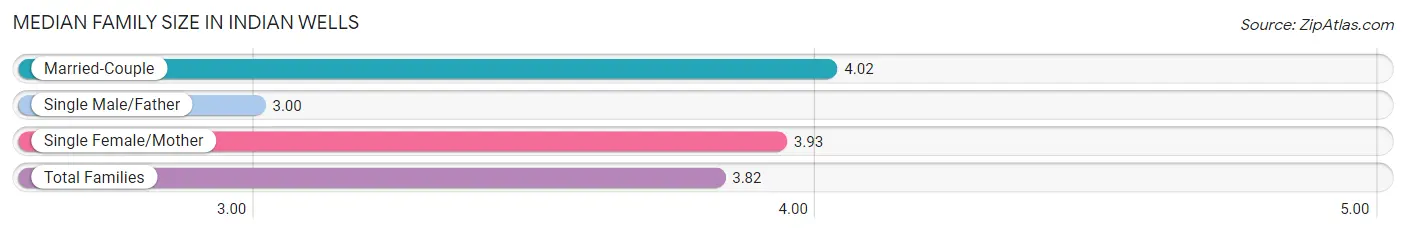
| Family Type | # Families | Family Size |
| Married-Couple | 55 (64.7%) | 4.02 |
| Single Male/Father | 15 (17.6%) | 3.00 |
| Single Female/Mother | 15 (17.6%) | 3.93 |
| Total Families | 85 (100.0%) | 3.82 |
Median Household Size in Indian Wells
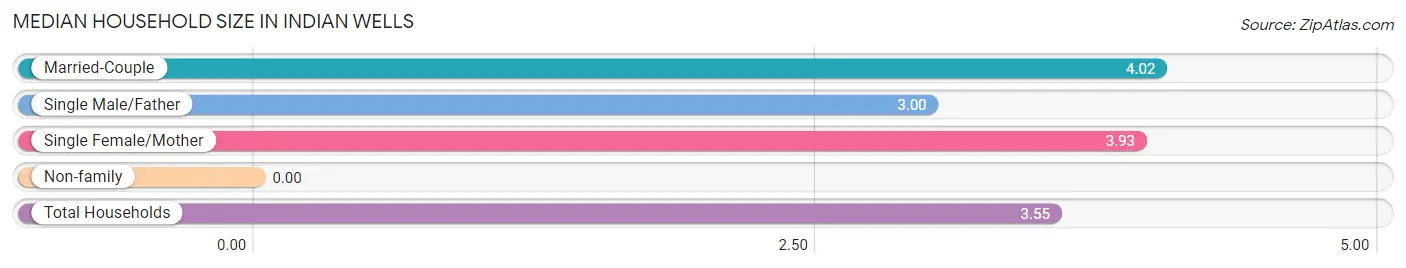
| Household Type | # Households | Household Size |
| Married-Couple | 55 (58.5%) | 4.02 |
| Single Male/Father | 15 (16.0%) | 3.00 |
| Single Female/Mother | 15 (16.0%) | 3.93 |
| Non-family | 9 (9.6%) | - |
| Total Households | 94 (100.0%) | 3.55 |
Household Size by Marriage Status in Indian Wells
Out of a total of 94 households in Indian Wells, 85 (90.4%) are family households, while 9 (9.6%) are nonfamily households. The most numerous type of family households are 5-person households, comprising 45, and the most common type of nonfamily households are 1-person households, comprising 9.
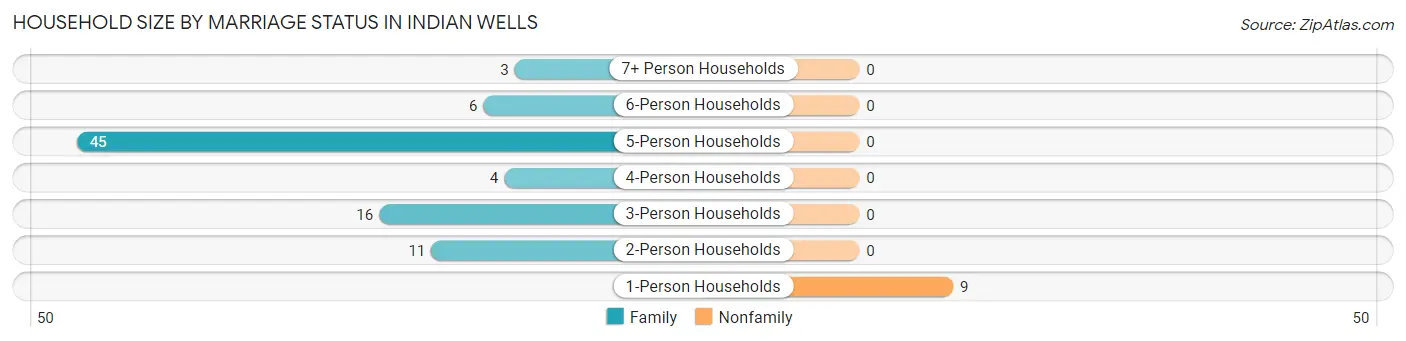
| Household Size | Family Households | Nonfamily Households |
| 1-Person Households | - | 9 (9.6%) |
| 2-Person Households | 11 (11.7%) | 0 (0.0%) |
| 3-Person Households | 16 (17.0%) | 0 (0.0%) |
| 4-Person Households | 4 (4.3%) | 0 (0.0%) |
| 5-Person Households | 45 (47.9%) | 0 (0.0%) |
| 6-Person Households | 6 (6.4%) | 0 (0.0%) |
| 7+ Person Households | 3 (3.2%) | 0 (0.0%) |
| Total | 85 (90.4%) | 9 (9.6%) |
Female Fertility in Indian Wells
Fertility by Age in Indian Wells
Average fertility rate in Indian Wells is 67.0 births per 1,000 women. Women in the age bracket of 20 to 34 years have the highest fertility rate with 135.0 births per 1,000 women. Women in the age bracket of 20 to 34 years acount for 100.0% of all women with births.
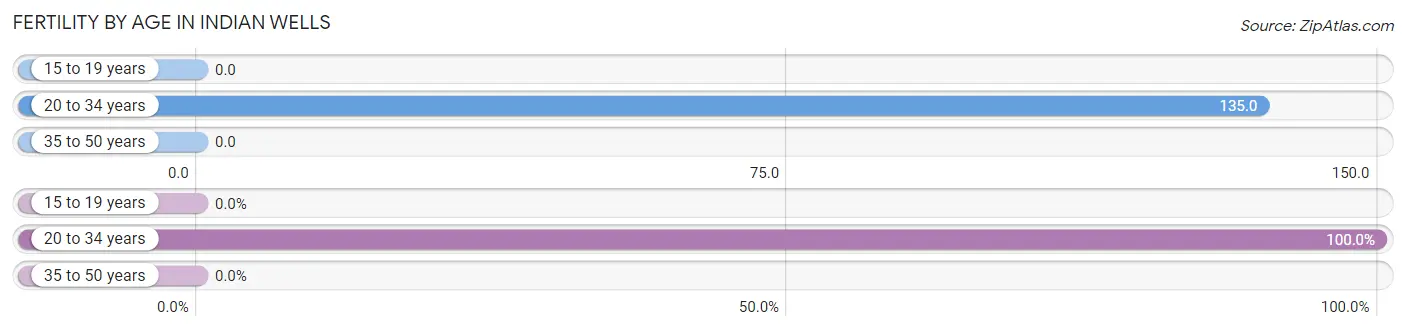
| Age Bracket | Women with Births | Births / 1,000 Women |
| 15 to 19 years | 0 (0.0%) | 0.0 |
| 20 to 34 years | 5 (100.0%) | 135.0 |
| 35 to 50 years | 0 (0.0%) | 0.0 |
| Total | 5 (100.0%) | 67.0 |
Fertility by Age by Marriage Status in Indian Wells
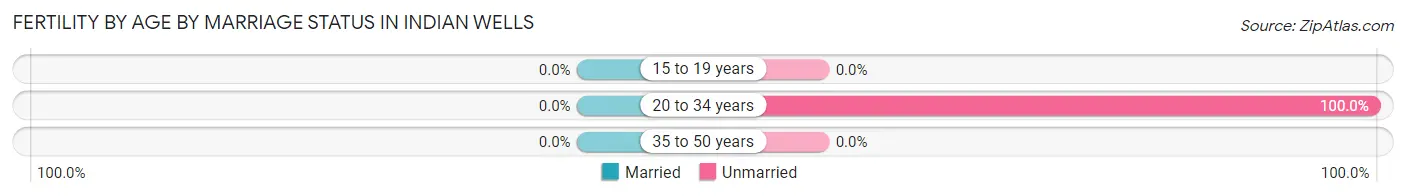
| Age Bracket | Married | Unmarried |
| 15 to 19 years | 0 (0.0%) | 0 (0.0%) |
| 20 to 34 years | 0 (0.0%) | 5 (100.0%) |
| 35 to 50 years | 0 (0.0%) | 0 (0.0%) |
| Total | 0 (0.0%) | 5 (100.0%) |
Fertility by Education in Indian Wells
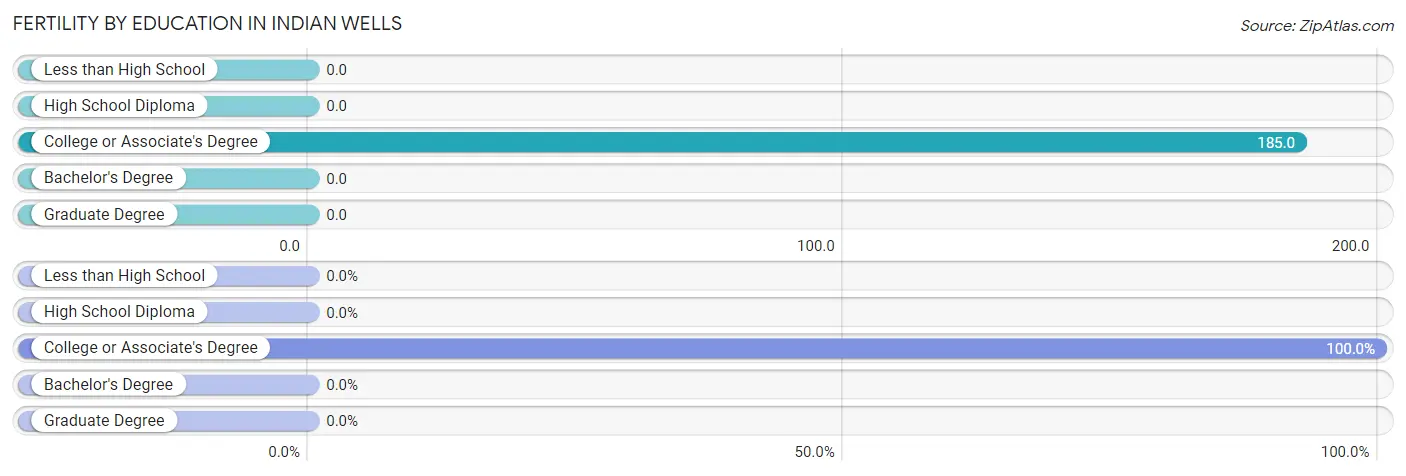
| Educational Attainment | Women with Births | Births / 1,000 Women |
| Less than High School | 0 (0.0%) | 0.0 |
| High School Diploma | 0 (0.0%) | 0.0 |
| College or Associate's Degree | 5 (100.0%) | 185.0 |
| Bachelor's Degree | 0 (0.0%) | 0.0 |
| Graduate Degree | 0 (0.0%) | 0.0 |
| Total | 5 (100.0%) | 67.0 |
Fertility by Education by Marriage Status in Indian Wells
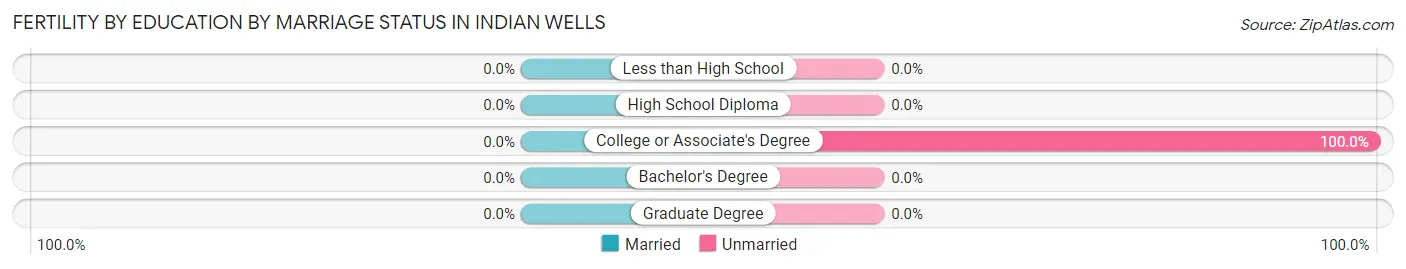
| Educational Attainment | Married | Unmarried |
| Less than High School | 0 (0.0%) | 0 (0.0%) |
| High School Diploma | 0 (0.0%) | 0 (0.0%) |
| College or Associate's Degree | 0 (0.0%) | 5 (100.0%) |
| Bachelor's Degree | 0 (0.0%) | 0 (0.0%) |
| Graduate Degree | 0 (0.0%) | 0 (0.0%) |
| Total | 0 (0.0%) | 5 (100.0%) |
Employment Characteristics in Indian Wells
Employment by Class of Employer in Indian Wells
Among the 85 employed individuals in Indian Wells, private company employees (54 | 63.5%), local government employees (13 | 15.3%), and not-for-profit organizations (9 | 10.6%) make up the most common classes of employment.
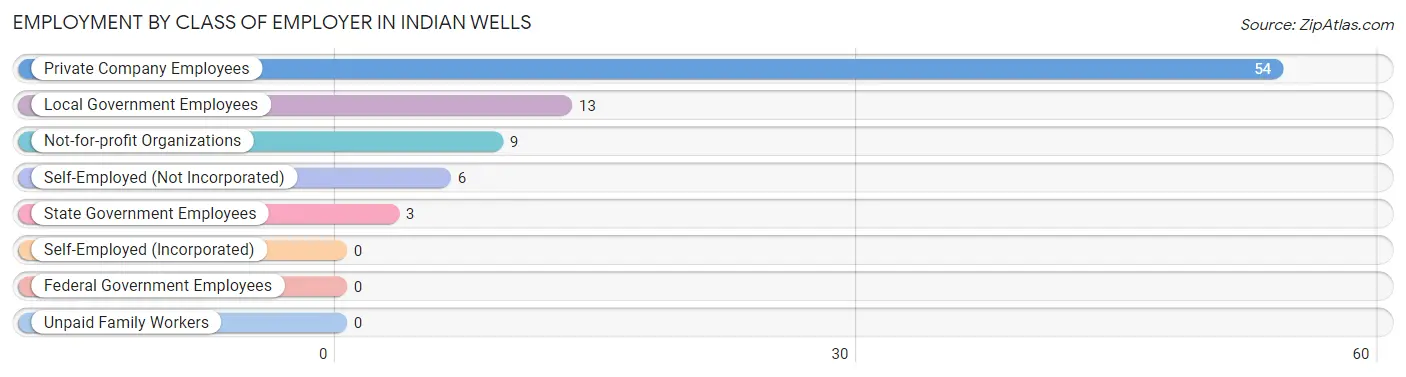
| Employer Class | # Employees | % Employees |
| Private Company Employees | 54 | 63.5% |
| Self-Employed (Incorporated) | 0 | 0.0% |
| Self-Employed (Not Incorporated) | 6 | 7.1% |
| Not-for-profit Organizations | 9 | 10.6% |
| Local Government Employees | 13 | 15.3% |
| State Government Employees | 3 | 3.5% |
| Federal Government Employees | 0 | 0.0% |
| Unpaid Family Workers | 0 | 0.0% |
| Total | 85 | 100.0% |
Employment Status by Age in Indian Wells
According to the labor force statistics for Indian Wells, out of the total population over 16 years of age (276), 38.4% or 106 individuals are in the labor force, with 19.8% or 21 of them unemployed. The age group with the highest labor force participation rate is 25 to 29 years, with 100.0% or 12 individuals in the labor force. Within the labor force, the 25 to 29 years age range has the highest percentage of unemployed individuals, with 58.3% or 7 of them being unemployed.
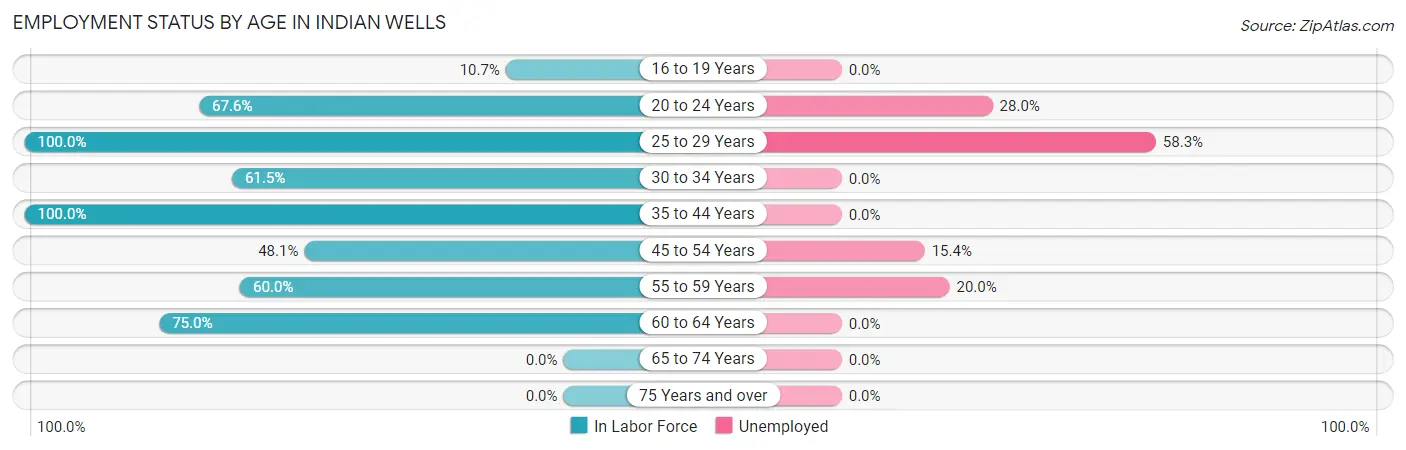
| Age Bracket | In Labor Force | Unemployed |
| 16 to 19 Years | 3 (10.7%) | 0 (0.0%) |
| 20 to 24 Years | 25 (67.6%) | 7 (28.0%) |
| 25 to 29 Years | 12 (100.0%) | 7 (58.3%) |
| 30 to 34 Years | 8 (61.5%) | 0 (0.0%) |
| 35 to 44 Years | 8 (100.0%) | 0 (0.0%) |
| 45 to 54 Years | 26 (48.1%) | 4 (15.4%) |
| 55 to 59 Years | 15 (60.0%) | 3 (20.0%) |
| 60 to 64 Years | 9 (75.0%) | 0 (0.0%) |
| 65 to 74 Years | 0 (0.0%) | 0 (0.0%) |
| 75 Years and over | 0 (0.0%) | 0 (0.0%) |
| Total | 106 (38.4%) | 21 (19.8%) |
Employment Status by Educational Attainment in Indian Wells
According to labor force statistics for Indian Wells, 62.9% of individuals (78) out of the total population between 25 and 64 years of age (124) are in the labor force, with 17.9% or 14 of them being unemployed. The group with the highest labor force participation rate are those with the educational attainment of bachelor's degree or higher, with 100.0% or 6 individuals in the labor force. Within the labor force, individuals with less than high school education have the highest percentage of unemployment, with 30.8% or 4 of them being unemployed.
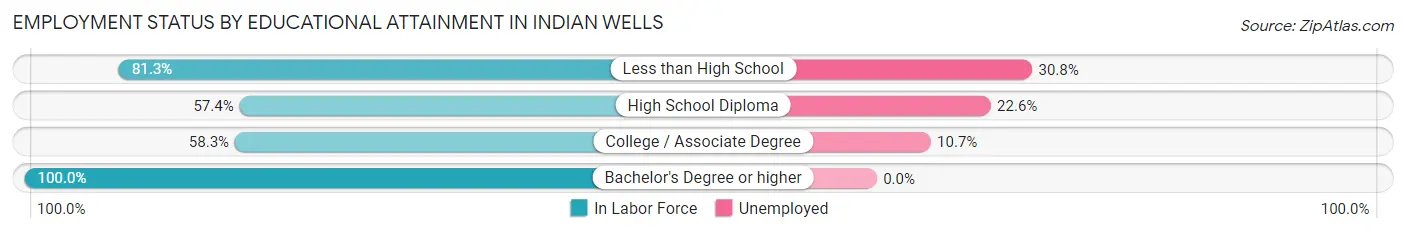
| Educational Attainment | In Labor Force | Unemployed |
| Less than High School | 13 (81.3%) | 5 (30.8%) |
| High School Diploma | 31 (57.4%) | 12 (22.6%) |
| College / Associate Degree | 28 (58.3%) | 5 (10.7%) |
| Bachelor's Degree or higher | 6 (100.0%) | 0 (0.0%) |
| Total | 78 (62.9%) | 22 (17.9%) |
Employment Occupations by Sex in Indian Wells
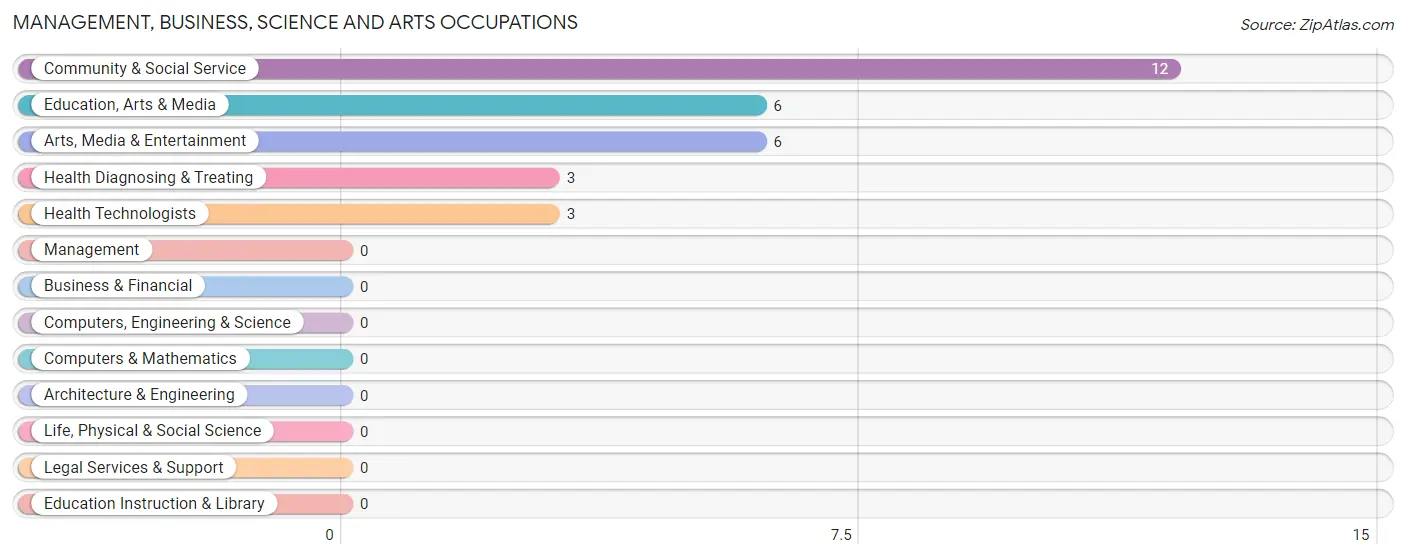
Management, Business, Science and Arts Occupations
The most common Management, Business, Science and Arts occupations in Indian Wells are Community & Social Service (12 | 14.1%), Education, Arts & Media (6 | 7.1%), Arts, Media & Entertainment (6 | 7.1%), Health Diagnosing & Treating (3 | 3.5%), and Health Technologists (3 | 3.5%).
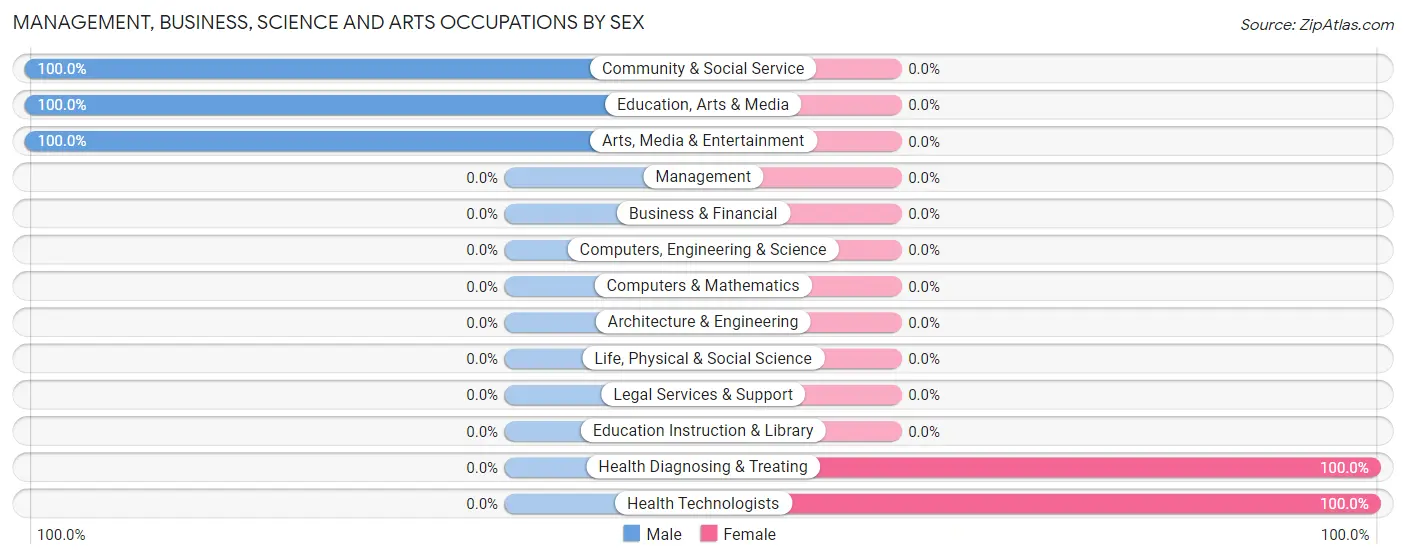
Management, Business, Science and Arts Occupations by Sex
Within the Management, Business, Science and Arts occupations in Indian Wells, the most male-oriented occupations are Community & Social Service (100.0%), Education, Arts & Media (100.0%), and Arts, Media & Entertainment (100.0%), while the most female-oriented occupations are Health Diagnosing & Treating (100.0%), and Health Technologists (100.0%).
| Occupation | Male | Female |
| Management | 0 (0.0%) | 0 (0.0%) |
| Business & Financial | 0 (0.0%) | 0 (0.0%) |
| Computers, Engineering & Science | 0 (0.0%) | 0 (0.0%) |
| Computers & Mathematics | 0 (0.0%) | 0 (0.0%) |
| Architecture & Engineering | 0 (0.0%) | 0 (0.0%) |
| Life, Physical & Social Science | 0 (0.0%) | 0 (0.0%) |
| Community & Social Service | 12 (100.0%) | 0 (0.0%) |
| Education, Arts & Media | 6 (100.0%) | 0 (0.0%) |
| Legal Services & Support | 0 (0.0%) | 0 (0.0%) |
| Education Instruction & Library | 0 (0.0%) | 0 (0.0%) |
| Arts, Media & Entertainment | 6 (100.0%) | 0 (0.0%) |
| Health Diagnosing & Treating | 0 (0.0%) | 3 (100.0%) |
| Health Technologists | 0 (0.0%) | 3 (100.0%) |
| Total (Category) | 12 (80.0%) | 3 (20.0%) |
| Total (Overall) | 50 (58.8%) | 35 (41.2%) |
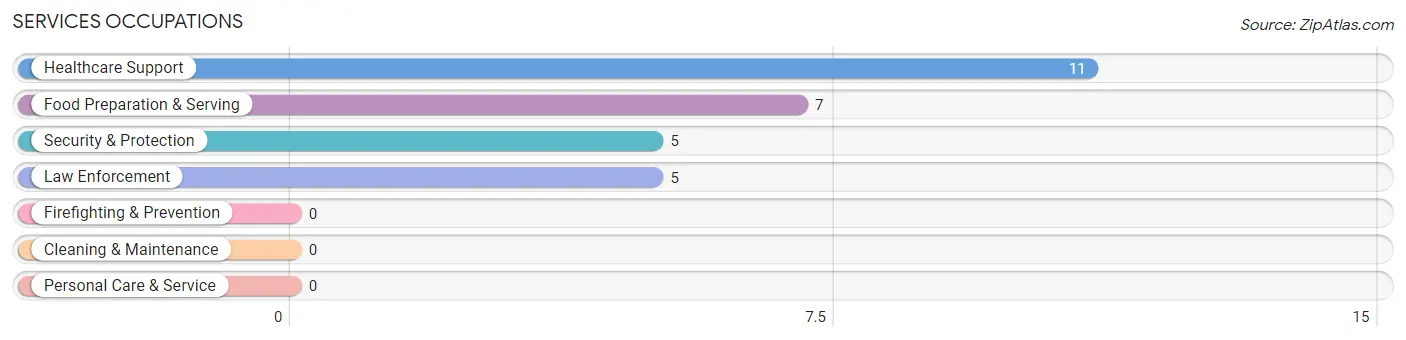
Services Occupations
The most common Services occupations in Indian Wells are Healthcare Support (11 | 12.9%), Food Preparation & Serving (7 | 8.2%), Security & Protection (5 | 5.9%), and Law Enforcement (5 | 5.9%).
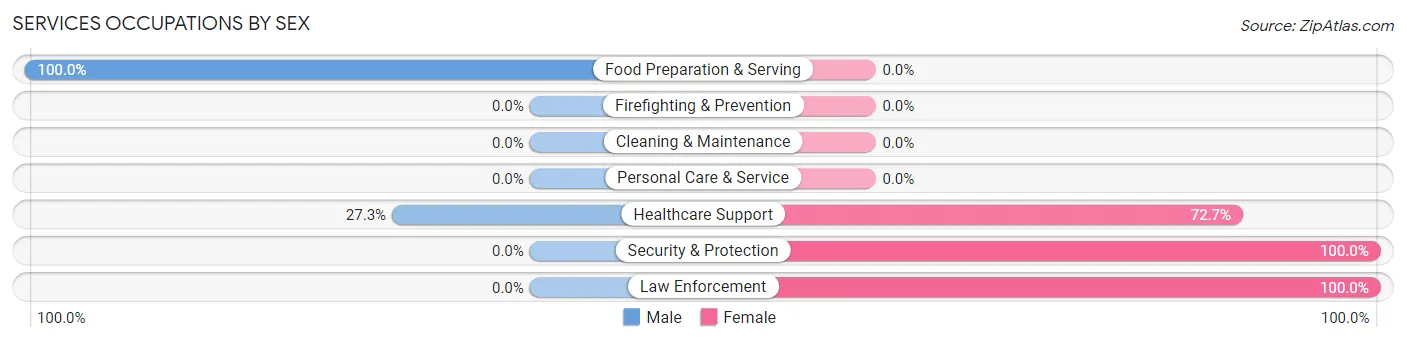
Services Occupations by Sex
Within the Services occupations in Indian Wells, the most male-oriented occupations are Food Preparation & Serving (100.0%), and Healthcare Support (27.3%), while the most female-oriented occupations are Security & Protection (100.0%), Law Enforcement (100.0%), and Healthcare Support (72.7%).
| Occupation | Male | Female |
| Healthcare Support | 3 (27.3%) | 8 (72.7%) |
| Security & Protection | 0 (0.0%) | 5 (100.0%) |
| Firefighting & Prevention | 0 (0.0%) | 0 (0.0%) |
| Law Enforcement | 0 (0.0%) | 5 (100.0%) |
| Food Preparation & Serving | 7 (100.0%) | 0 (0.0%) |
| Cleaning & Maintenance | 0 (0.0%) | 0 (0.0%) |
| Personal Care & Service | 0 (0.0%) | 0 (0.0%) |
| Total (Category) | 10 (43.5%) | 13 (56.5%) |
| Total (Overall) | 50 (58.8%) | 35 (41.2%) |
Sales and Office Occupations
The most common Sales and Office occupations in Indian Wells are Sales & Related (8 | 9.4%), and Office & Administration (8 | 9.4%).
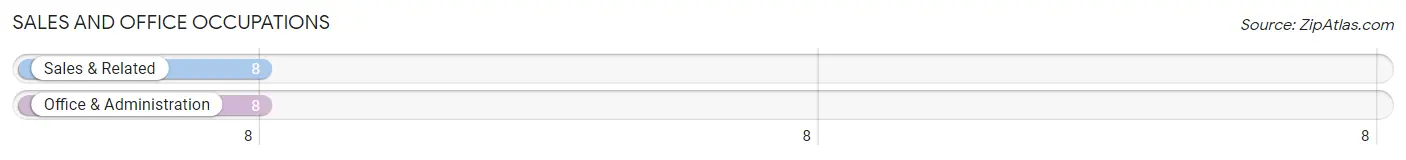
Sales and Office Occupations by Sex
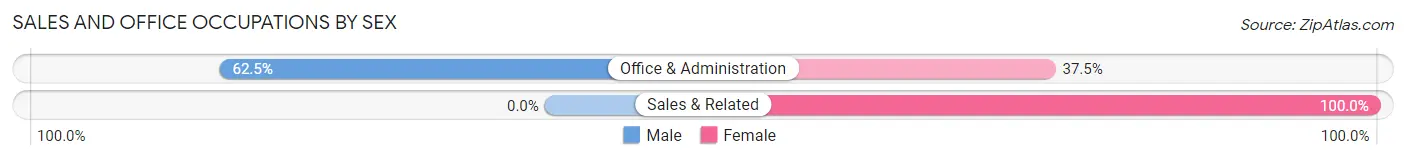
| Occupation | Male | Female |
| Sales & Related | 0 (0.0%) | 8 (100.0%) |
| Office & Administration | 5 (62.5%) | 3 (37.5%) |
| Total (Category) | 5 (31.2%) | 11 (68.8%) |
| Total (Overall) | 50 (58.8%) | 35 (41.2%) |
Natural Resources, Construction and Maintenance Occupations
The most common Natural Resources, Construction and Maintenance occupations in Indian Wells are Construction & Extraction (12 | 14.1%), and Installation, Maintenance & Repair (4 | 4.7%).
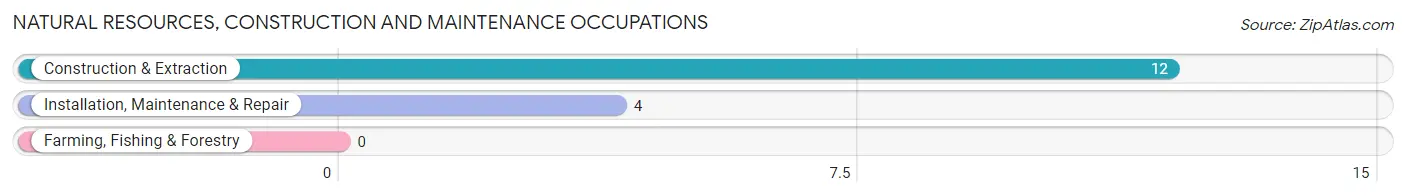
Natural Resources, Construction and Maintenance Occupations by Sex
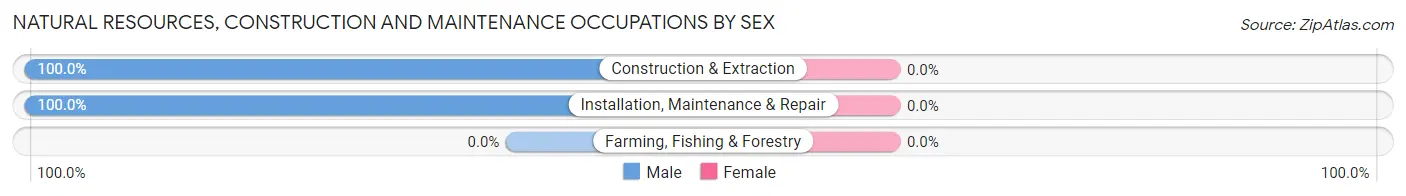
| Occupation | Male | Female |
| Farming, Fishing & Forestry | 0 (0.0%) | 0 (0.0%) |
| Construction & Extraction | 12 (100.0%) | 0 (0.0%) |
| Installation, Maintenance & Repair | 4 (100.0%) | 0 (0.0%) |
| Total (Category) | 16 (100.0%) | 0 (0.0%) |
| Total (Overall) | 50 (58.8%) | 35 (41.2%) |
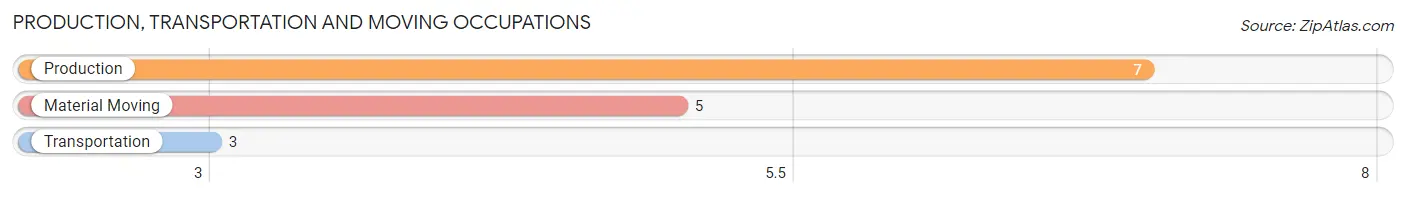
Production, Transportation and Moving Occupations
The most common Production, Transportation and Moving occupations in Indian Wells are Production (7 | 8.2%), Material Moving (5 | 5.9%), and Transportation (3 | 3.5%).
Production, Transportation and Moving Occupations by Sex
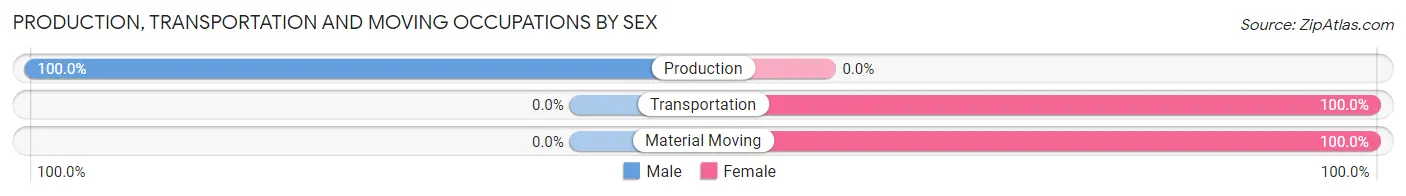
| Occupation | Male | Female |
| Production | 7 (100.0%) | 0 (0.0%) |
| Transportation | 0 (0.0%) | 3 (100.0%) |
| Material Moving | 0 (0.0%) | 5 (100.0%) |
| Total (Category) | 7 (46.7%) | 8 (53.3%) |
| Total (Overall) | 50 (58.8%) | 35 (41.2%) |
Employment Industries by Sex in Indian Wells
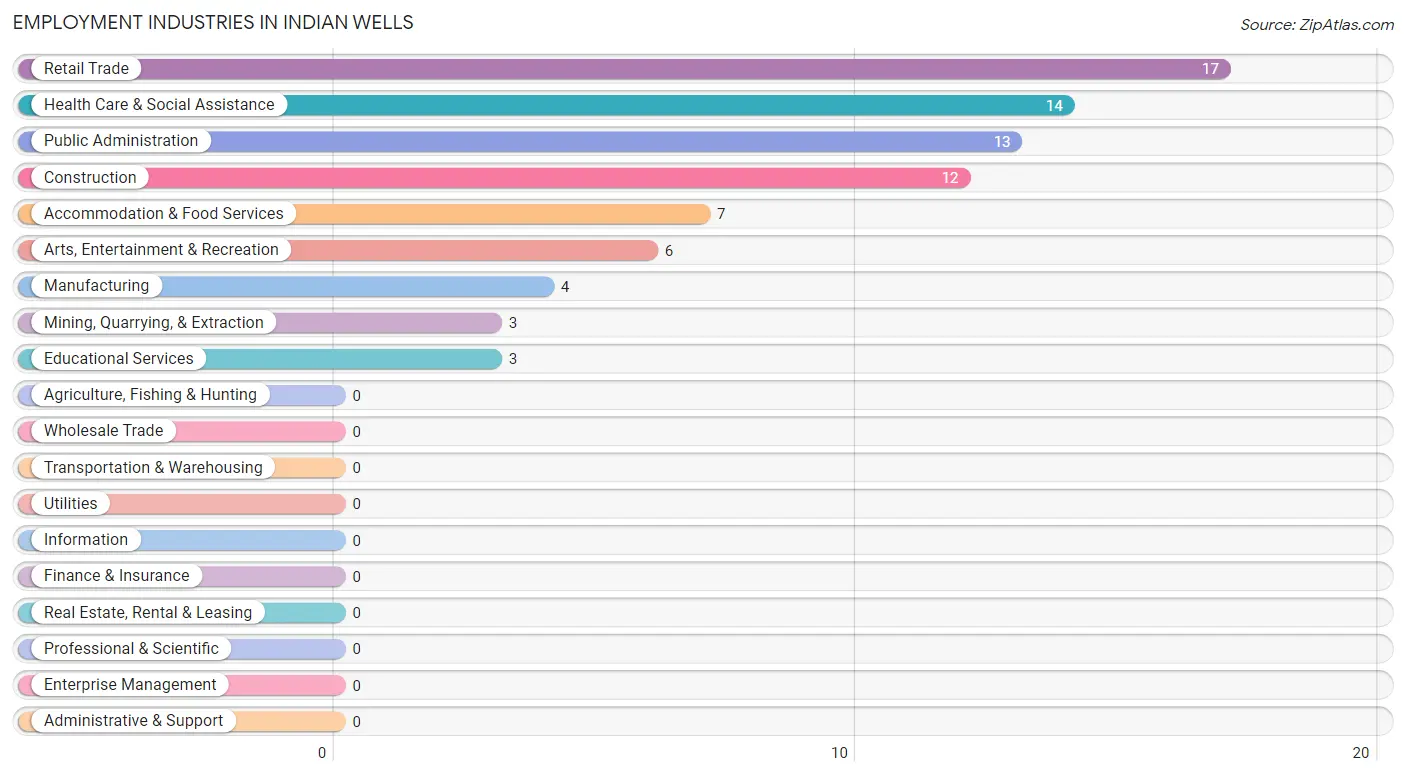
Employment Industries in Indian Wells
The major employment industries in Indian Wells include Retail Trade (17 | 20.0%), Health Care & Social Assistance (14 | 16.5%), Public Administration (13 | 15.3%), Construction (12 | 14.1%), and Accommodation & Food Services (7 | 8.2%).
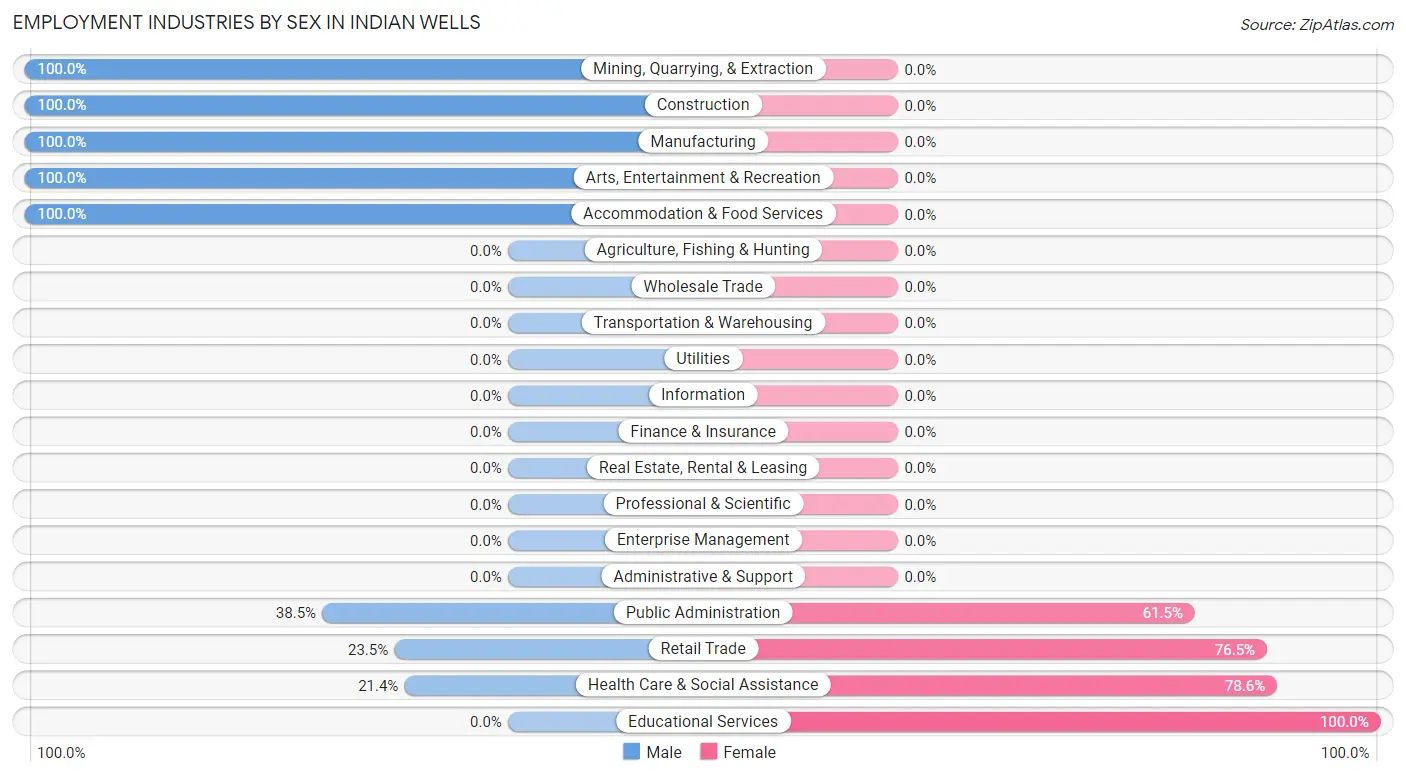
Employment Industries by Sex in Indian Wells
The Indian Wells industries that see more men than women are Mining, Quarrying, & Extraction (100.0%), Construction (100.0%), and Manufacturing (100.0%), whereas the industries that tend to have a higher number of women are Educational Services (100.0%), Health Care & Social Assistance (78.6%), and Retail Trade (76.5%).
| Industry | Male | Female |
| Agriculture, Fishing & Hunting | 0 (0.0%) | 0 (0.0%) |
| Mining, Quarrying, & Extraction | 3 (100.0%) | 0 (0.0%) |
| Construction | 12 (100.0%) | 0 (0.0%) |
| Manufacturing | 4 (100.0%) | 0 (0.0%) |
| Wholesale Trade | 0 (0.0%) | 0 (0.0%) |
| Retail Trade | 4 (23.5%) | 13 (76.5%) |
| Transportation & Warehousing | 0 (0.0%) | 0 (0.0%) |
| Utilities | 0 (0.0%) | 0 (0.0%) |
| Information | 0 (0.0%) | 0 (0.0%) |
| Finance & Insurance | 0 (0.0%) | 0 (0.0%) |
| Real Estate, Rental & Leasing | 0 (0.0%) | 0 (0.0%) |
| Professional & Scientific | 0 (0.0%) | 0 (0.0%) |
| Enterprise Management | 0 (0.0%) | 0 (0.0%) |
| Administrative & Support | 0 (0.0%) | 0 (0.0%) |
| Educational Services | 0 (0.0%) | 3 (100.0%) |
| Health Care & Social Assistance | 3 (21.4%) | 11 (78.6%) |
| Arts, Entertainment & Recreation | 6 (100.0%) | 0 (0.0%) |
| Accommodation & Food Services | 7 (100.0%) | 0 (0.0%) |
| Public Administration | 5 (38.5%) | 8 (61.5%) |
| Total | 50 (58.8%) | 35 (41.2%) |
Education in Indian Wells
School Enrollment in Indian Wells
The most common levels of schooling among the 82 students in Indian Wells are middle school (38 | 46.3%), elementary school (19 | 23.2%), and high school (15 | 18.3%).
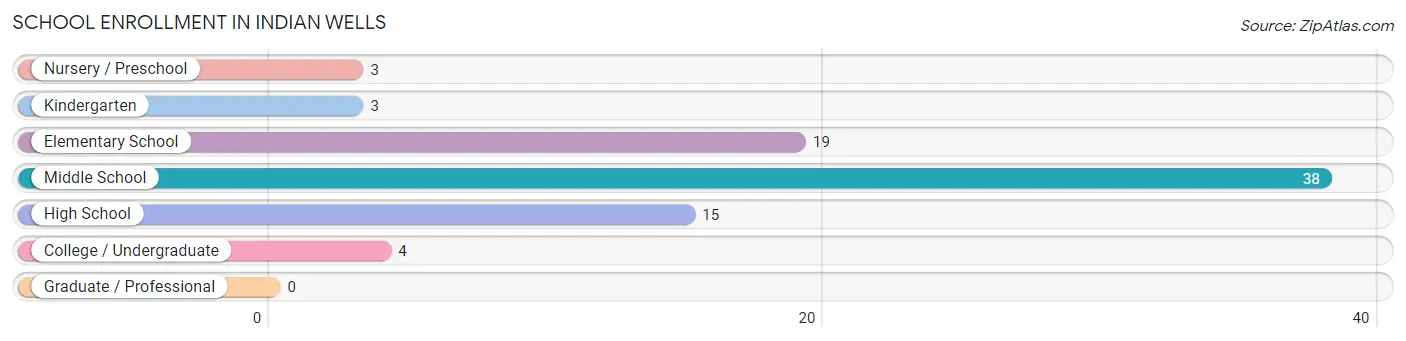
| School Level | # Students | % Students |
| Nursery / Preschool | 3 | 3.7% |
| Kindergarten | 3 | 3.7% |
| Elementary School | 19 | 23.2% |
| Middle School | 38 | 46.3% |
| High School | 15 | 18.3% |
| College / Undergraduate | 4 | 4.9% |
| Graduate / Professional | 0 | 0.0% |
| Total | 82 | 100.0% |
School Enrollment by Age by Funding Source in Indian Wells
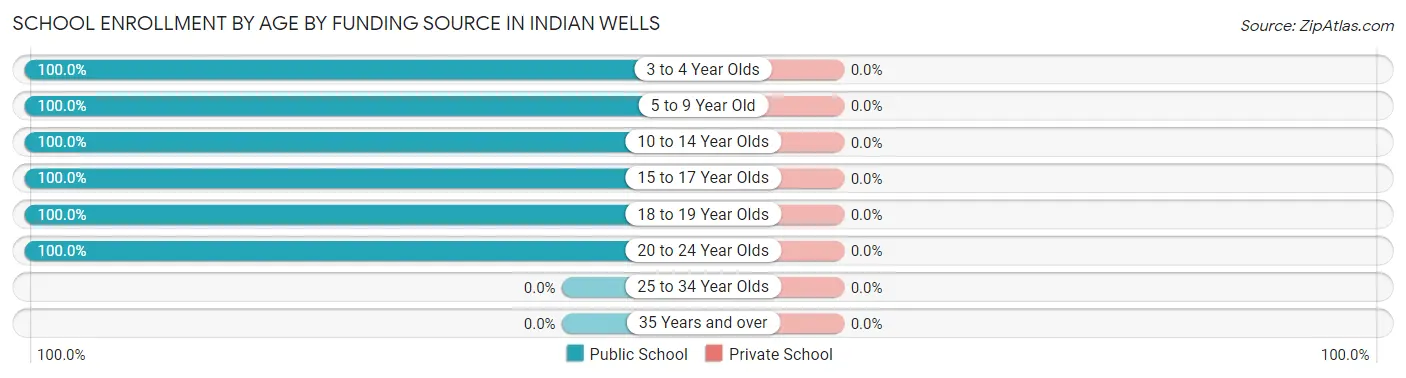
| Age Bracket | Public School | Private School |
| 3 to 4 Year Olds | 3 (100.0%) | 0 (0.0%) |
| 5 to 9 Year Old | 19 (100.0%) | 0 (0.0%) |
| 10 to 14 Year Olds | 37 (100.0%) | 0 (0.0%) |
| 15 to 17 Year Olds | 15 (100.0%) | 0 (0.0%) |
| 18 to 19 Year Olds | 4 (100.0%) | 0 (0.0%) |
| 20 to 24 Year Olds | 4 (100.0%) | 0 (0.0%) |
| 25 to 34 Year Olds | 0 (0.0%) | 0 (0.0%) |
| 35 Years and over | 0 (0.0%) | 0 (0.0%) |
| Total | 82 (100.0%) | 0 (0.0%) |
Educational Attainment by Field of Study in Indian Wells
, and liberal arts & history (6 | 100.0%) are the most common fields of study among 6 individuals in Indian Wells who have obtained a bachelor's degree or higher.
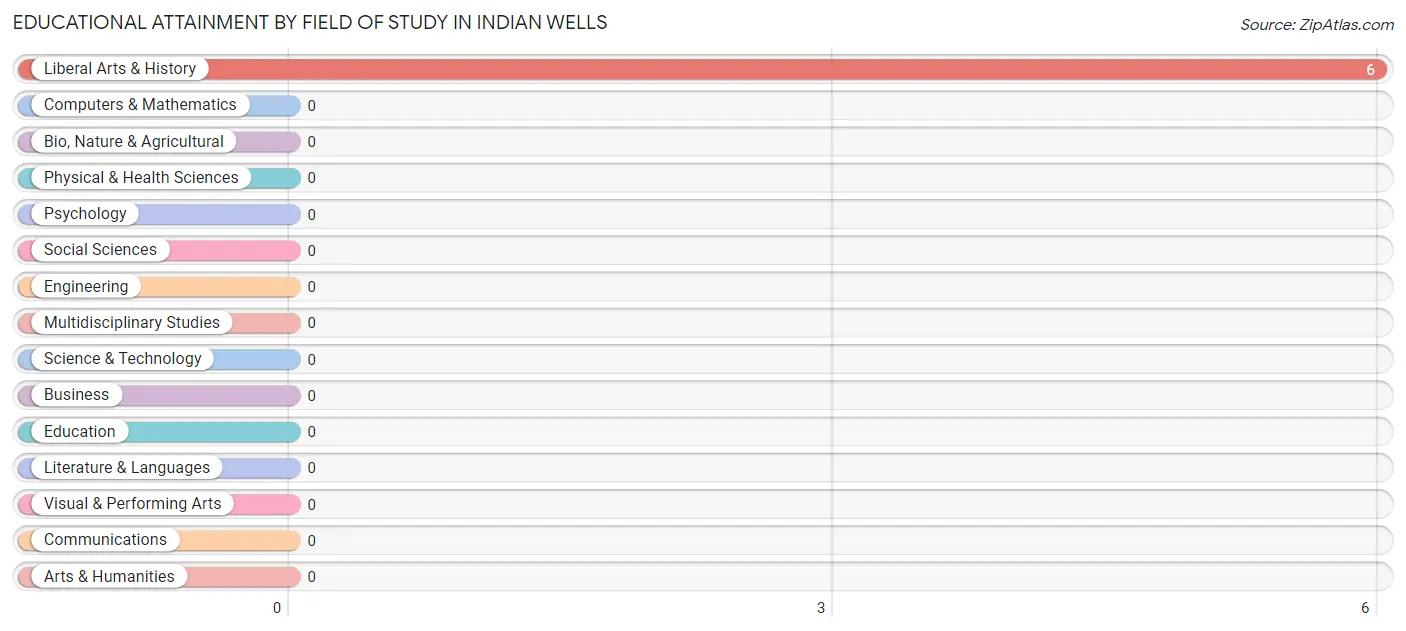
| Field of Study | # Graduates | % Graduates |
| Computers & Mathematics | 0 | 0.0% |
| Bio, Nature & Agricultural | 0 | 0.0% |
| Physical & Health Sciences | 0 | 0.0% |
| Psychology | 0 | 0.0% |
| Social Sciences | 0 | 0.0% |
| Engineering | 0 | 0.0% |
| Multidisciplinary Studies | 0 | 0.0% |
| Science & Technology | 0 | 0.0% |
| Business | 0 | 0.0% |
| Education | 0 | 0.0% |
| Literature & Languages | 0 | 0.0% |
| Liberal Arts & History | 6 | 100.0% |
| Visual & Performing Arts | 0 | 0.0% |
| Communications | 0 | 0.0% |
| Arts & Humanities | 0 | 0.0% |
| Total | 6 | 100.0% |
Transportation & Commute in Indian Wells
Vehicle Availability by Sex in Indian Wells
The most prevalent vehicle ownership categories in Indian Wells are males with 2 vehicles (17, accounting for 38.6%) and females with 2 vehicles (19, making up 48.6%).
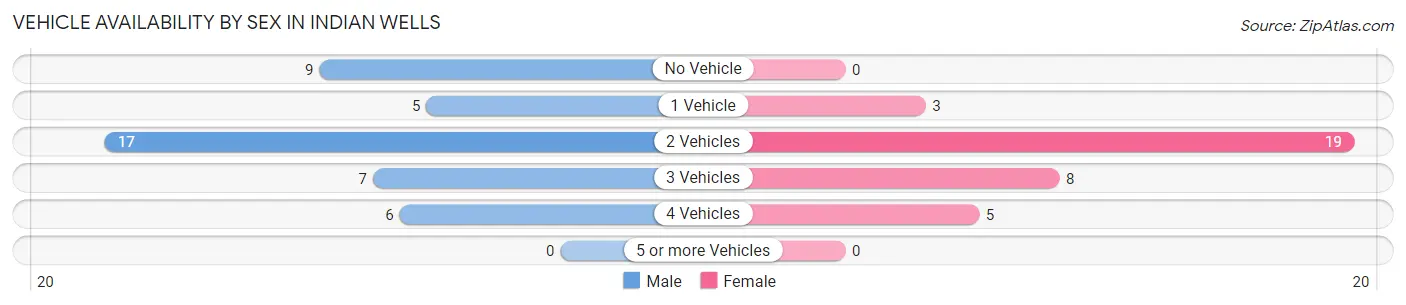
| Vehicles Available | Male | Female |
| No Vehicle | 9 (20.4%) | 0 (0.0%) |
| 1 Vehicle | 5 (11.4%) | 3 (8.6%) |
| 2 Vehicles | 17 (38.6%) | 19 (54.3%) |
| 3 Vehicles | 7 (15.9%) | 8 (22.9%) |
| 4 Vehicles | 6 (13.6%) | 5 (14.3%) |
| 5 or more Vehicles | 0 (0.0%) | 0 (0.0%) |
| Total | 44 (100.0%) | 35 (100.0%) |
Commute Time in Indian Wells
The most frequently occuring commute durations in Indian Wells are 60 to 89 minutes (27 commuters, 35.5%), 45 to 59 minutes (15 commuters, 19.7%), and 90 or more minutes (14 commuters, 18.4%).
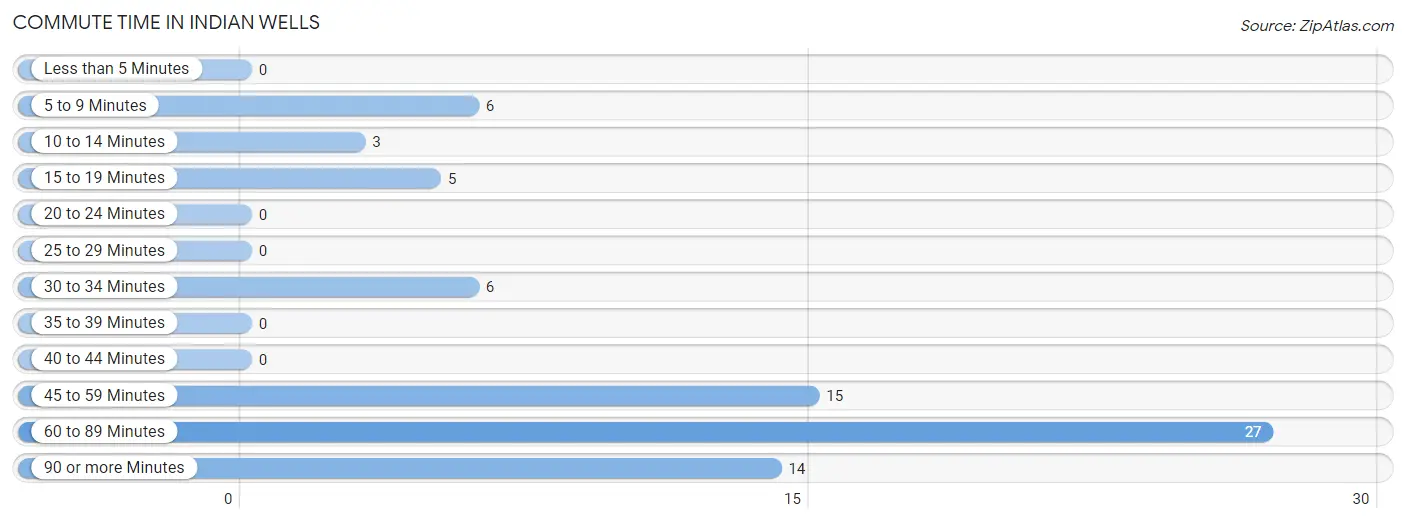
| Commute Time | # Commuters | % Commuters |
| Less than 5 Minutes | 0 | 0.0% |
| 5 to 9 Minutes | 6 | 7.9% |
| 10 to 14 Minutes | 3 | 4.0% |
| 15 to 19 Minutes | 5 | 6.6% |
| 20 to 24 Minutes | 0 | 0.0% |
| 25 to 29 Minutes | 0 | 0.0% |
| 30 to 34 Minutes | 6 | 7.9% |
| 35 to 39 Minutes | 0 | 0.0% |
| 40 to 44 Minutes | 0 | 0.0% |
| 45 to 59 Minutes | 15 | 19.7% |
| 60 to 89 Minutes | 27 | 35.5% |
| 90 or more Minutes | 14 | 18.4% |
Commute Time by Sex in Indian Wells
The most common commute times in Indian Wells are 90 or more minutes (14 commuters, 31.8%) for males and 60 to 89 minutes (21 commuters, 65.6%) for females.
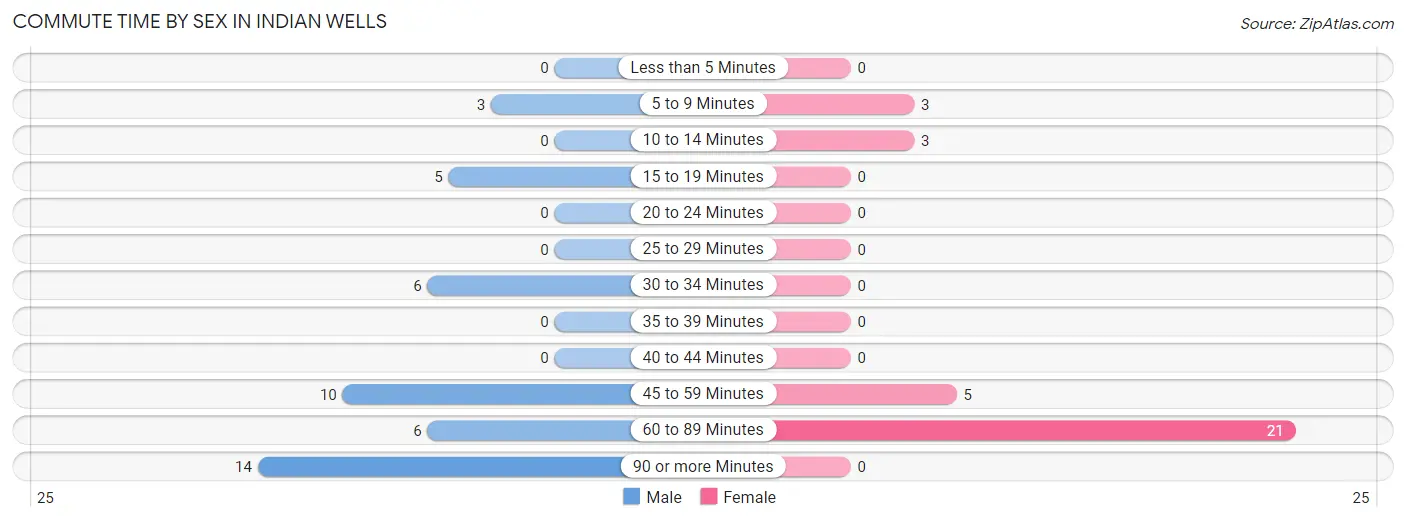
| Commute Time | Male | Female |
| Less than 5 Minutes | 0 (0.0%) | 0 (0.0%) |
| 5 to 9 Minutes | 3 (6.8%) | 3 (9.4%) |
| 10 to 14 Minutes | 0 (0.0%) | 3 (9.4%) |
| 15 to 19 Minutes | 5 (11.4%) | 0 (0.0%) |
| 20 to 24 Minutes | 0 (0.0%) | 0 (0.0%) |
| 25 to 29 Minutes | 0 (0.0%) | 0 (0.0%) |
| 30 to 34 Minutes | 6 (13.6%) | 0 (0.0%) |
| 35 to 39 Minutes | 0 (0.0%) | 0 (0.0%) |
| 40 to 44 Minutes | 0 (0.0%) | 0 (0.0%) |
| 45 to 59 Minutes | 10 (22.7%) | 5 (15.6%) |
| 60 to 89 Minutes | 6 (13.6%) | 21 (65.6%) |
| 90 or more Minutes | 14 (31.8%) | 0 (0.0%) |
Time of Departure to Work by Sex in Indian Wells
The most frequent times of departure to work in Indian Wells are 12:00 AM to 4:59 AM (13, 29.5%) for males and 5:30 AM to 5:59 AM (8, 25.0%) for females.
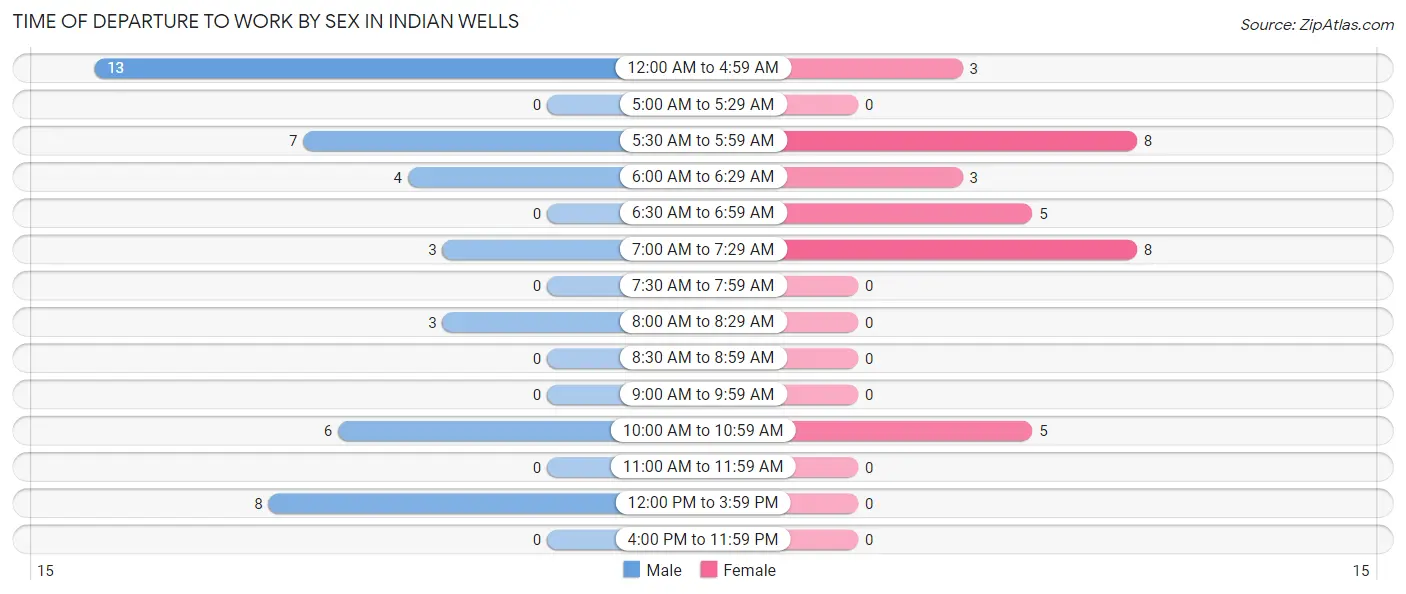
| Time of Departure | Male | Female |
| 12:00 AM to 4:59 AM | 13 (29.5%) | 3 (9.4%) |
| 5:00 AM to 5:29 AM | 0 (0.0%) | 0 (0.0%) |
| 5:30 AM to 5:59 AM | 7 (15.9%) | 8 (25.0%) |
| 6:00 AM to 6:29 AM | 4 (9.1%) | 3 (9.4%) |
| 6:30 AM to 6:59 AM | 0 (0.0%) | 5 (15.6%) |
| 7:00 AM to 7:29 AM | 3 (6.8%) | 8 (25.0%) |
| 7:30 AM to 7:59 AM | 0 (0.0%) | 0 (0.0%) |
| 8:00 AM to 8:29 AM | 3 (6.8%) | 0 (0.0%) |
| 8:30 AM to 8:59 AM | 0 (0.0%) | 0 (0.0%) |
| 9:00 AM to 9:59 AM | 0 (0.0%) | 0 (0.0%) |
| 10:00 AM to 10:59 AM | 6 (13.6%) | 5 (15.6%) |
| 11:00 AM to 11:59 AM | 0 (0.0%) | 0 (0.0%) |
| 12:00 PM to 3:59 PM | 8 (18.2%) | 0 (0.0%) |
| 4:00 PM to 11:59 PM | 0 (0.0%) | 0 (0.0%) |
| Total | 44 (100.0%) | 32 (100.0%) |
Housing Occupancy in Indian Wells
Occupancy by Ownership in Indian Wells
Of the total 94 dwellings in Indian Wells, owner-occupied units account for 75 (79.8%), while renter-occupied units make up 19 (20.2%).
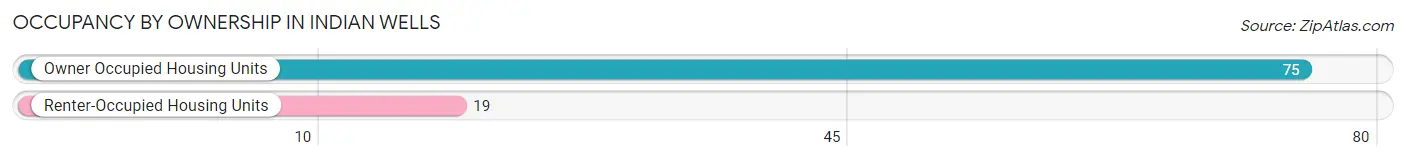
| Occupancy | # Housing Units | % Housing Units |
| Owner Occupied Housing Units | 75 | 79.8% |
| Renter-Occupied Housing Units | 19 | 20.2% |
| Total Occupied Housing Units | 94 | 100.0% |
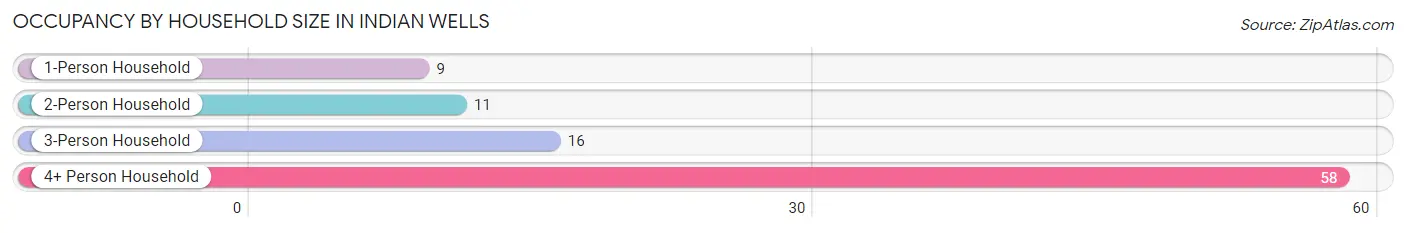
Occupancy by Household Size in Indian Wells
| Household Size | # Housing Units | % Housing Units |
| 1-Person Household | 9 | 9.6% |
| 2-Person Household | 11 | 11.7% |
| 3-Person Household | 16 | 17.0% |
| 4+ Person Household | 58 | 61.7% |
| Total Housing Units | 94 | 100.0% |
Occupancy by Ownership by Household Size in Indian Wells
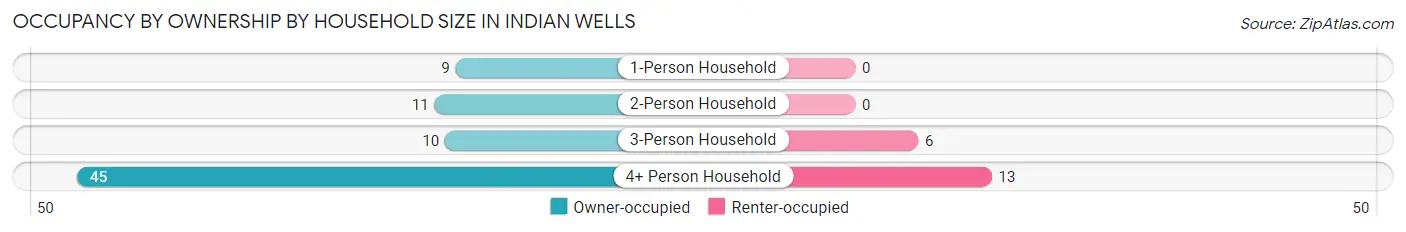
| Household Size | Owner-occupied | Renter-occupied |
| 1-Person Household | 9 (100.0%) | 0 (0.0%) |
| 2-Person Household | 11 (100.0%) | 0 (0.0%) |
| 3-Person Household | 10 (62.5%) | 6 (37.5%) |
| 4+ Person Household | 45 (77.6%) | 13 (22.4%) |
| Total Housing Units | 75 (79.8%) | 19 (20.2%) |
Occupancy by Educational Attainment in Indian Wells
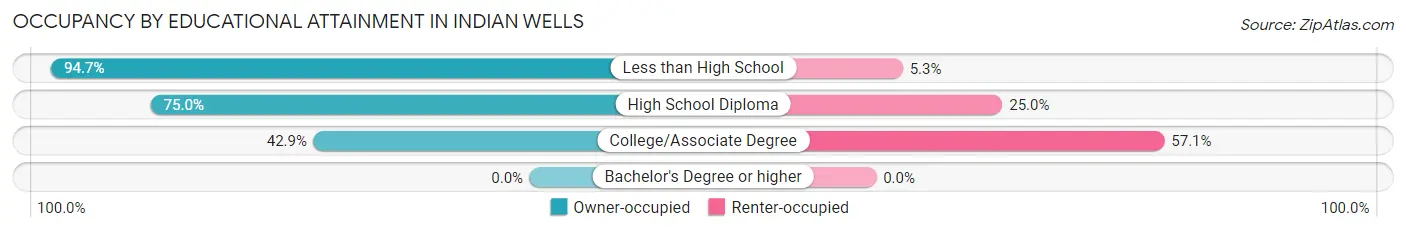
| Household Size | Owner-occupied | Renter-occupied |
| Less than High School | 54 (94.7%) | 3 (5.3%) |
| High School Diploma | 12 (75.0%) | 4 (25.0%) |
| College/Associate Degree | 9 (42.9%) | 12 (57.1%) |
| Bachelor's Degree or higher | 0 (0.0%) | 0 (0.0%) |
Occupancy by Age of Householder in Indian Wells
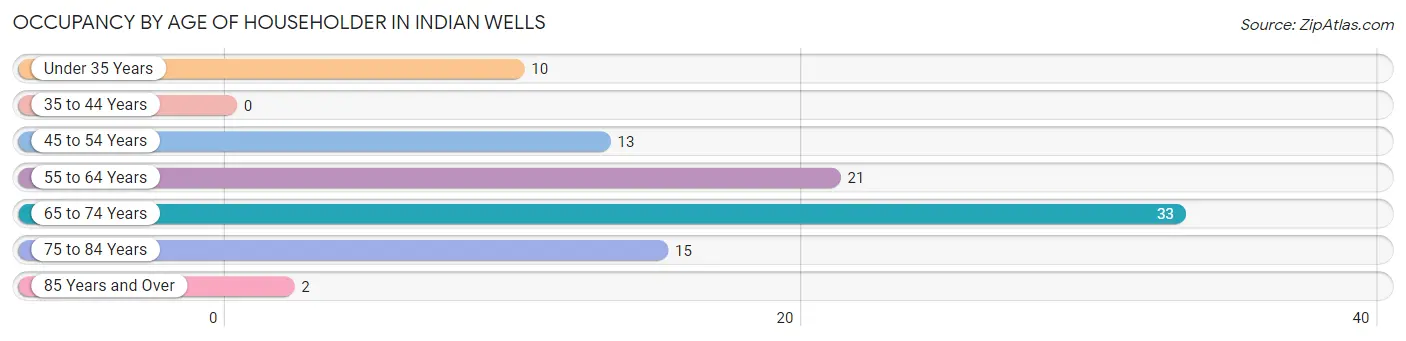
| Age Bracket | # Households | % Households |
| Under 35 Years | 10 | 10.6% |
| 35 to 44 Years | 0 | 0.0% |
| 45 to 54 Years | 13 | 13.8% |
| 55 to 64 Years | 21 | 22.3% |
| 65 to 74 Years | 33 | 35.1% |
| 75 to 84 Years | 15 | 16.0% |
| 85 Years and Over | 2 | 2.1% |
| Total | 94 | 100.0% |
Housing Finances in Indian Wells
Median Income by Occupancy in Indian Wells
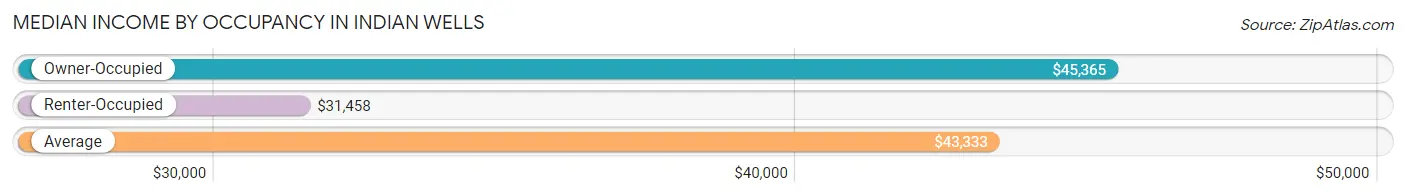
| Occupancy Type | # Households | Median Income |
| Owner-Occupied | 75 (79.8%) | $45,365 |
| Renter-Occupied | 19 (20.2%) | $31,458 |
| Average | 94 (100.0%) | $43,333 |
Occupancy by Householder Income Bracket in Indian Wells
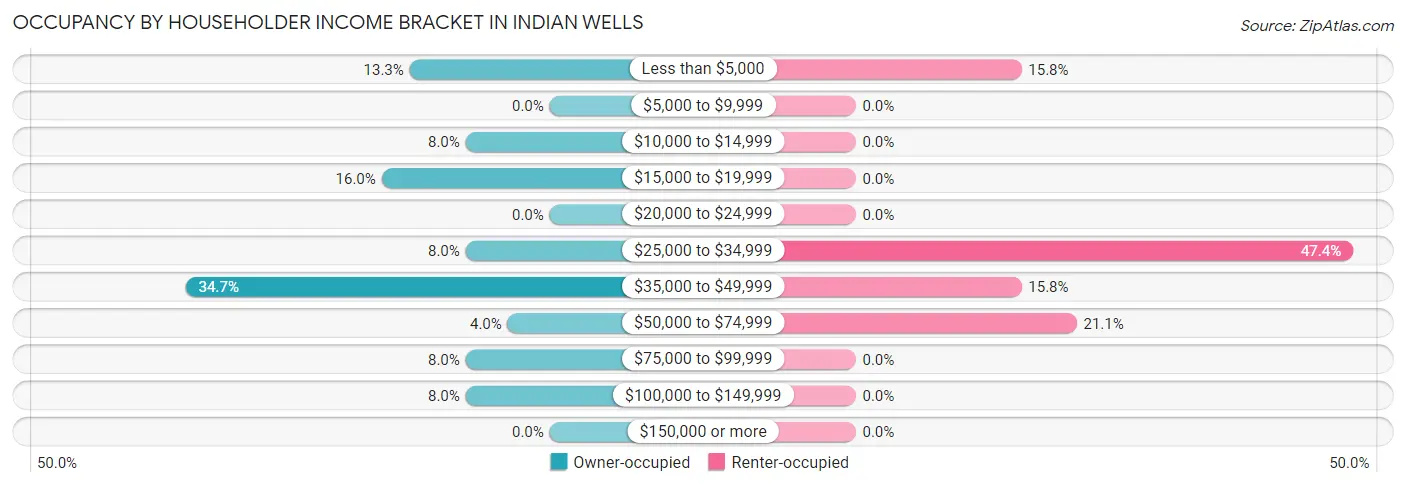
| Income Bracket | Owner-occupied | Renter-occupied |
| Less than $5,000 | 10 (13.3%) | 3 (15.8%) |
| $5,000 to $9,999 | 0 (0.0%) | 0 (0.0%) |
| $10,000 to $14,999 | 6 (8.0%) | 0 (0.0%) |
| $15,000 to $19,999 | 12 (16.0%) | 0 (0.0%) |
| $20,000 to $24,999 | 0 (0.0%) | 0 (0.0%) |
| $25,000 to $34,999 | 6 (8.0%) | 9 (47.4%) |
| $35,000 to $49,999 | 26 (34.7%) | 3 (15.8%) |
| $50,000 to $74,999 | 3 (4.0%) | 4 (21.0%) |
| $75,000 to $99,999 | 6 (8.0%) | 0 (0.0%) |
| $100,000 to $149,999 | 6 (8.0%) | 0 (0.0%) |
| $150,000 or more | 0 (0.0%) | 0 (0.0%) |
| Total | 75 (100.0%) | 19 (100.0%) |
Monthly Housing Cost Tiers in Indian Wells
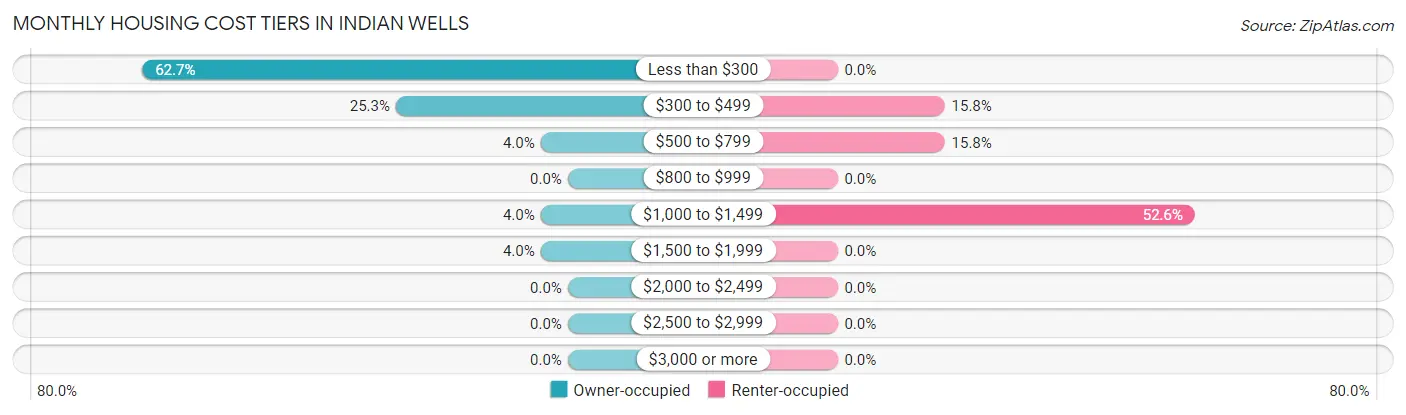
| Monthly Cost | Owner-occupied | Renter-occupied |
| Less than $300 | 47 (62.7%) | 0 (0.0%) |
| $300 to $499 | 19 (25.3%) | 3 (15.8%) |
| $500 to $799 | 3 (4.0%) | 3 (15.8%) |
| $800 to $999 | 0 (0.0%) | 0 (0.0%) |
| $1,000 to $1,499 | 3 (4.0%) | 10 (52.6%) |
| $1,500 to $1,999 | 3 (4.0%) | 0 (0.0%) |
| $2,000 to $2,499 | 0 (0.0%) | 0 (0.0%) |
| $2,500 to $2,999 | 0 (0.0%) | 0 (0.0%) |
| $3,000 or more | 0 (0.0%) | 0 (0.0%) |
| Total | 75 (100.0%) | 19 (100.0%) |
Physical Housing Characteristics in Indian Wells
Housing Structures in Indian Wells

| Structure Type | # Housing Units | % Housing Units |
| Single Unit, Detached | 85 | 90.4% |
| Single Unit, Attached | 0 | 0.0% |
| 2 Unit Apartments | 0 | 0.0% |
| 3 or 4 Unit Apartments | 0 | 0.0% |
| 5 to 9 Unit Apartments | 0 | 0.0% |
| 10 or more Apartments | 0 | 0.0% |
| Mobile Home / Other | 9 | 9.6% |
| Total | 94 | 100.0% |
Housing Structures by Occupancy in Indian Wells
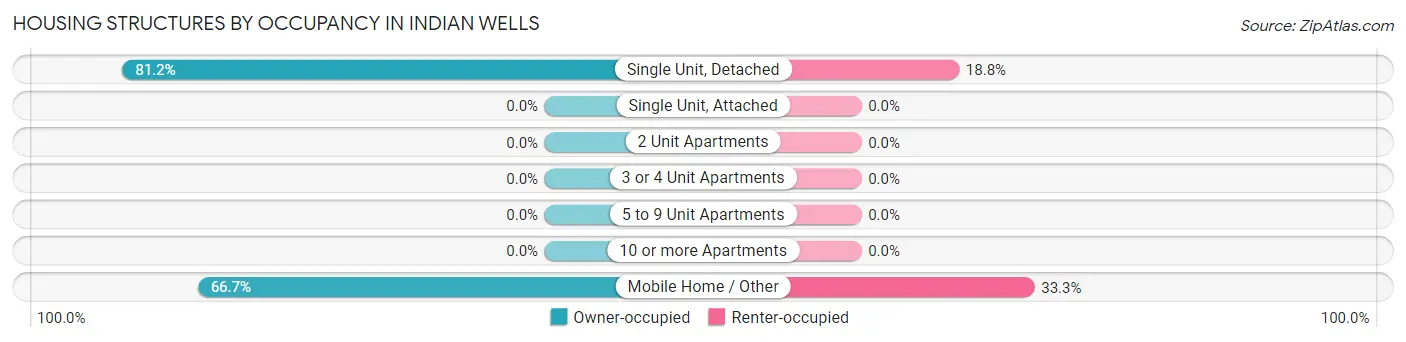
| Structure Type | Owner-occupied | Renter-occupied |
| Single Unit, Detached | 69 (81.2%) | 16 (18.8%) |
| Single Unit, Attached | 0 (0.0%) | 0 (0.0%) |
| 2 Unit Apartments | 0 (0.0%) | 0 (0.0%) |
| 3 or 4 Unit Apartments | 0 (0.0%) | 0 (0.0%) |
| 5 to 9 Unit Apartments | 0 (0.0%) | 0 (0.0%) |
| 10 or more Apartments | 0 (0.0%) | 0 (0.0%) |
| Mobile Home / Other | 6 (66.7%) | 3 (33.3%) |
| Total | 75 (79.8%) | 19 (20.2%) |
Housing Structures by Number of Rooms in Indian Wells
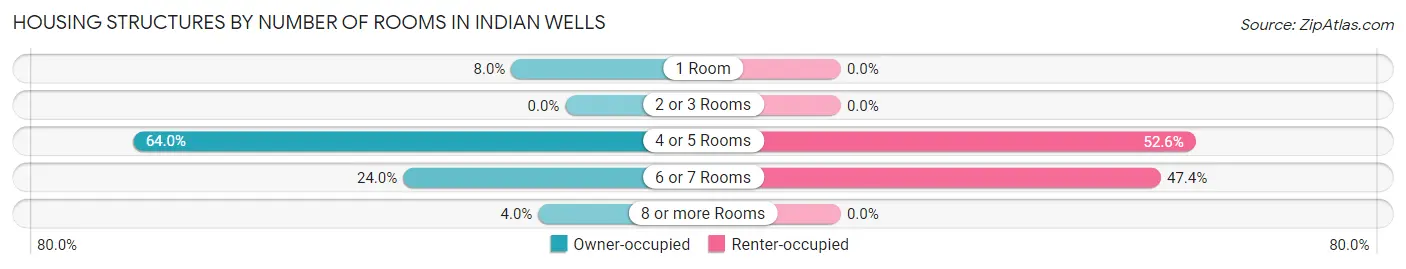
| Number of Rooms | Owner-occupied | Renter-occupied |
| 1 Room | 6 (8.0%) | 0 (0.0%) |
| 2 or 3 Rooms | 0 (0.0%) | 0 (0.0%) |
| 4 or 5 Rooms | 48 (64.0%) | 10 (52.6%) |
| 6 or 7 Rooms | 18 (24.0%) | 9 (47.4%) |
| 8 or more Rooms | 3 (4.0%) | 0 (0.0%) |
| Total | 75 (100.0%) | 19 (100.0%) |
Housing Structure by Heating Type in Indian Wells
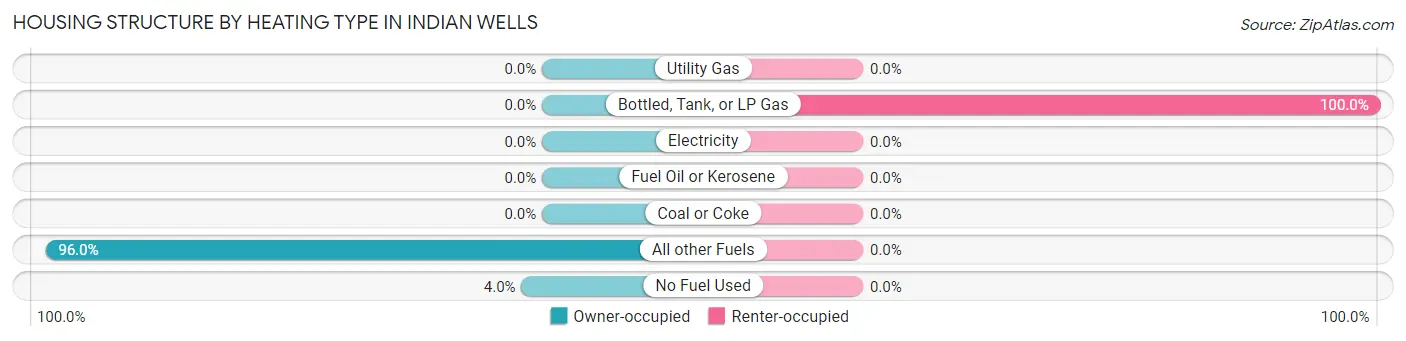
| Heating Type | Owner-occupied | Renter-occupied |
| Utility Gas | 0 (0.0%) | 0 (0.0%) |
| Bottled, Tank, or LP Gas | 0 (0.0%) | 19 (100.0%) |
| Electricity | 0 (0.0%) | 0 (0.0%) |
| Fuel Oil or Kerosene | 0 (0.0%) | 0 (0.0%) |
| Coal or Coke | 0 (0.0%) | 0 (0.0%) |
| All other Fuels | 72 (96.0%) | 0 (0.0%) |
| No Fuel Used | 3 (4.0%) | 0 (0.0%) |
| Total | 75 (100.0%) | 19 (100.0%) |
Household Vehicle Usage in Indian Wells
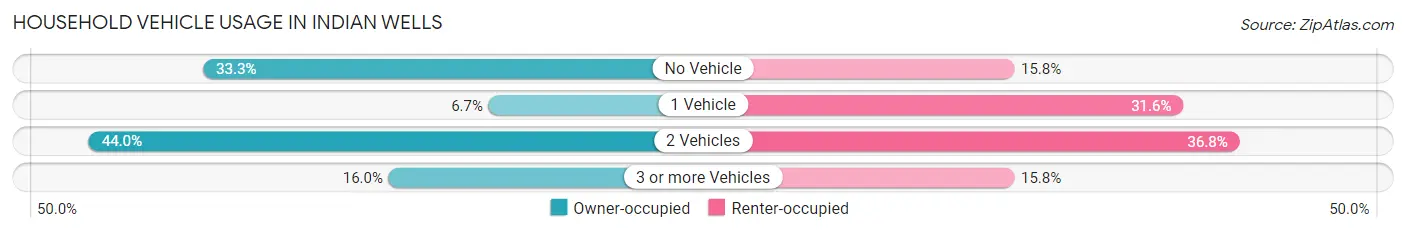
| Vehicles per Household | Owner-occupied | Renter-occupied |
| No Vehicle | 25 (33.3%) | 3 (15.8%) |
| 1 Vehicle | 5 (6.7%) | 6 (31.6%) |
| 2 Vehicles | 33 (44.0%) | 7 (36.8%) |
| 3 or more Vehicles | 12 (16.0%) | 3 (15.8%) |
| Total | 75 (100.0%) | 19 (100.0%) |
Real Estate & Mortgages in Indian Wells
Real Estate and Mortgage Overview in Indian Wells
| Characteristic | Without Mortgage | With Mortgage |
| Housing Units | 72 | 3 |
| Median Property Value | $56,000 | $0 |
| Median Household Income | $45,208 | $0 |
| Monthly Housing Costs | $200 | $0 |
| Real Estate Taxes | - | - |
Property Value by Mortgage Status in Indian Wells
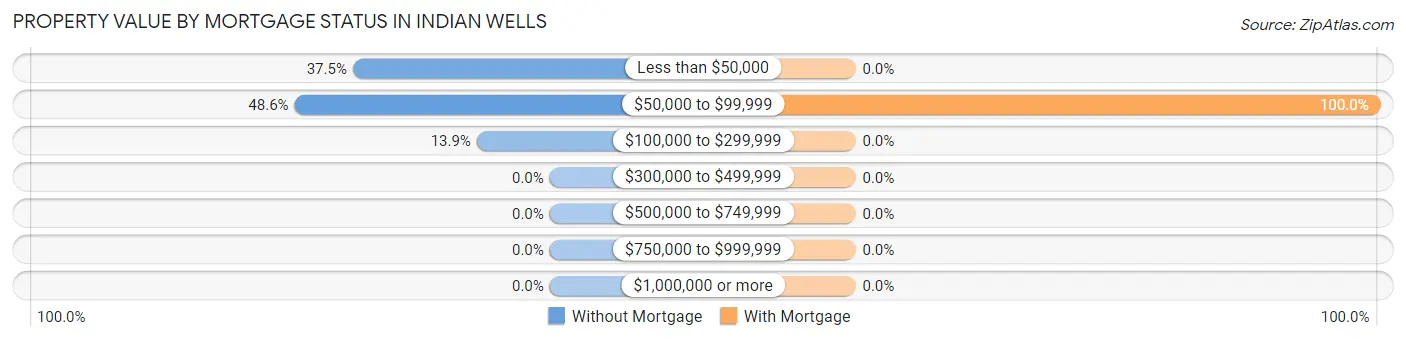
| Property Value | Without Mortgage | With Mortgage |
| Less than $50,000 | 27 (37.5%) | 0 (0.0%) |
| $50,000 to $99,999 | 35 (48.6%) | 3 (100.0%) |
| $100,000 to $299,999 | 10 (13.9%) | 0 (0.0%) |
| $300,000 to $499,999 | 0 (0.0%) | 0 (0.0%) |
| $500,000 to $749,999 | 0 (0.0%) | 0 (0.0%) |
| $750,000 to $999,999 | 0 (0.0%) | 0 (0.0%) |
| $1,000,000 or more | 0 (0.0%) | 0 (0.0%) |
| Total | 72 (100.0%) | 3 (100.0%) |
Household Income by Mortgage Status in Indian Wells
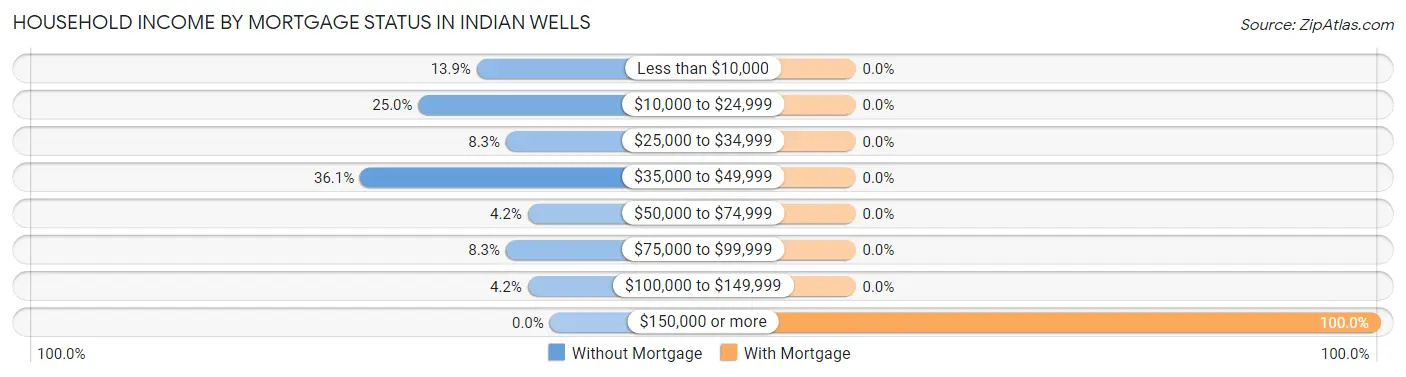
| Household Income | Without Mortgage | With Mortgage |
| Less than $10,000 | 10 (13.9%) | 0 (0.0%) |
| $10,000 to $24,999 | 18 (25.0%) | 0 (0.0%) |
| $25,000 to $34,999 | 6 (8.3%) | 0 (0.0%) |
| $35,000 to $49,999 | 26 (36.1%) | 0 (0.0%) |
| $50,000 to $74,999 | 3 (4.2%) | 0 (0.0%) |
| $75,000 to $99,999 | 6 (8.3%) | 0 (0.0%) |
| $100,000 to $149,999 | 3 (4.2%) | 0 (0.0%) |
| $150,000 or more | 0 (0.0%) | 3 (100.0%) |
| Total | 72 (100.0%) | 3 (100.0%) |
Property Value to Household Income Ratio in Indian Wells

| Value-to-Income Ratio | Without Mortgage | With Mortgage |
| Less than 2.0x | 47 (65.3%) | 0 (0.0%) |
| 2.0x to 2.9x | 0 (0.0%) | 3 (100.0%) |
| 3.0x to 3.9x | 0 (0.0%) | 0 (0.0%) |
| 4.0x or more | 21 (29.2%) | 0 (0.0%) |
| Total | 72 (100.0%) | 3 (100.0%) |
Real Estate Taxes by Mortgage Status in Indian Wells
| Property Taxes | Without Mortgage | With Mortgage |
| Less than $800 | 0 (0.0%) | 0 (0.0%) |
| $800 to $1,499 | 0 (0.0%) | 0 (0.0%) |
| $800 to $1,499 | 0 (0.0%) | 0 (0.0%) |
| Total | 72 (100.0%) | 3 (100.0%) |
Health & Disability in Indian Wells
Health Insurance Coverage by Age in Indian Wells
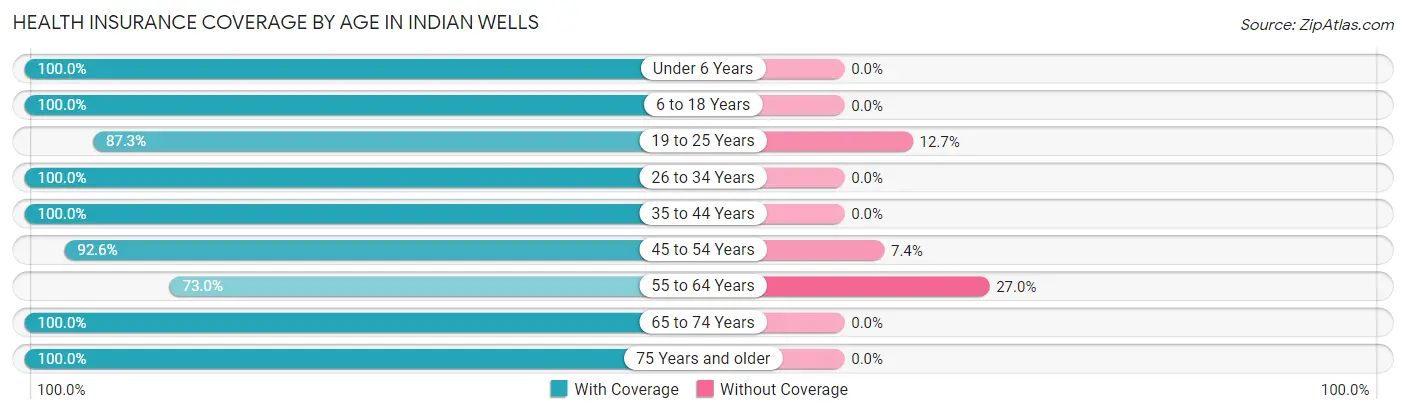
| Age Bracket | With Coverage | Without Coverage |
| Under 6 Years | 18 (100.0%) | 0 (0.0%) |
| 6 to 18 Years | 80 (100.0%) | 0 (0.0%) |
| 19 to 25 Years | 48 (87.3%) | 7 (12.7%) |
| 26 to 34 Years | 18 (100.0%) | 0 (0.0%) |
| 35 to 44 Years | 8 (100.0%) | 0 (0.0%) |
| 45 to 54 Years | 50 (92.6%) | 4 (7.4%) |
| 55 to 64 Years | 27 (73.0%) | 10 (27.0%) |
| 65 to 74 Years | 64 (100.0%) | 0 (0.0%) |
| 75 Years and older | 23 (100.0%) | 0 (0.0%) |
| Total | 336 (94.1%) | 21 (5.9%) |
Health Insurance Coverage by Citizenship Status in Indian Wells
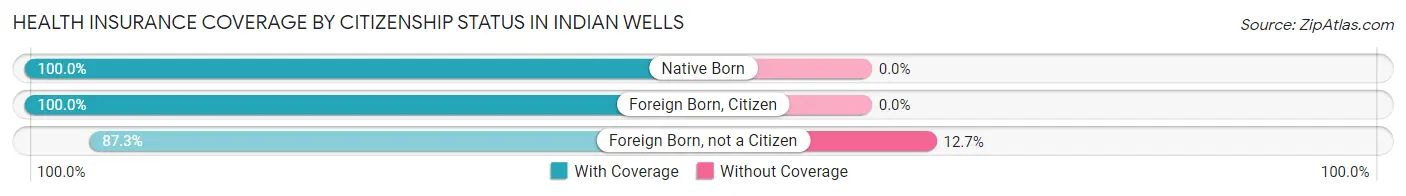
| Citizenship Status | With Coverage | Without Coverage |
| Native Born | 18 (100.0%) | 0 (0.0%) |
| Foreign Born, Citizen | 80 (100.0%) | 0 (0.0%) |
| Foreign Born, not a Citizen | 48 (87.3%) | 7 (12.7%) |
Health Insurance Coverage by Household Income in Indian Wells
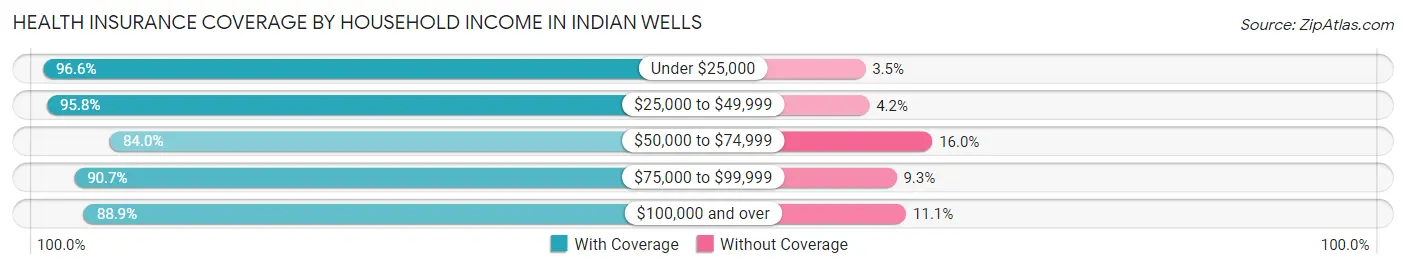
| Household Income | With Coverage | Without Coverage |
| Under $25,000 | 84 (96.6%) | 3 (3.5%) |
| $25,000 to $49,999 | 137 (95.8%) | 6 (4.2%) |
| $50,000 to $74,999 | 21 (84.0%) | 4 (16.0%) |
| $75,000 to $99,999 | 39 (90.7%) | 4 (9.3%) |
| $100,000 and over | 32 (88.9%) | 4 (11.1%) |
Public vs Private Health Insurance Coverage by Age in Indian Wells
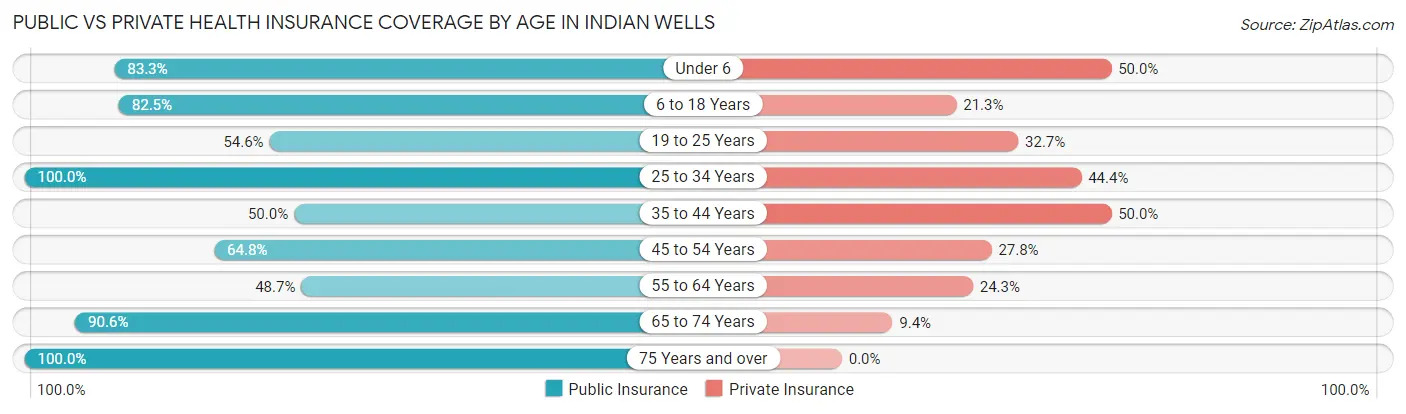
| Age Bracket | Public Insurance | Private Insurance |
| Under 6 | 15 (83.3%) | 9 (50.0%) |
| 6 to 18 Years | 66 (82.5%) | 17 (21.2%) |
| 19 to 25 Years | 30 (54.5%) | 18 (32.7%) |
| 25 to 34 Years | 18 (100.0%) | 8 (44.4%) |
| 35 to 44 Years | 4 (50.0%) | 4 (50.0%) |
| 45 to 54 Years | 35 (64.8%) | 15 (27.8%) |
| 55 to 64 Years | 18 (48.6%) | 9 (24.3%) |
| 65 to 74 Years | 58 (90.6%) | 6 (9.4%) |
| 75 Years and over | 23 (100.0%) | 0 (0.0%) |
| Total | 267 (74.8%) | 86 (24.1%) |
Disability Status by Sex by Age in Indian Wells
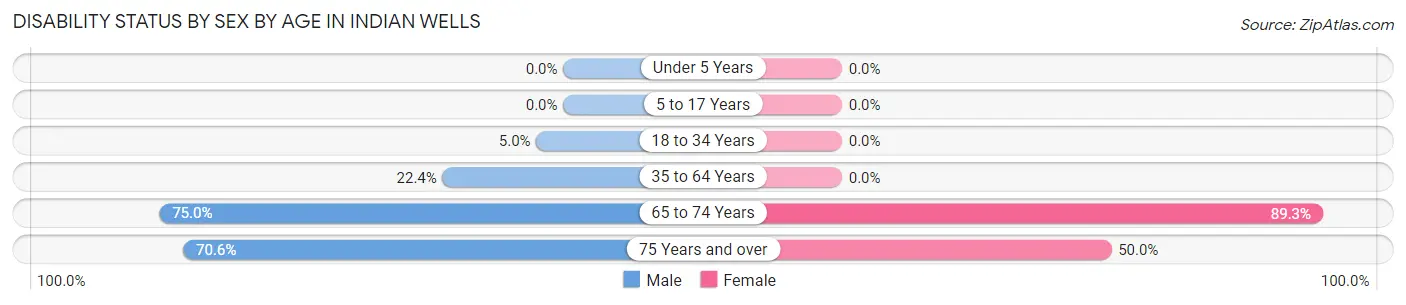
| Age Bracket | Male | Female |
| Under 5 Years | 0 (0.0%) | 0 (0.0%) |
| 5 to 17 Years | 0 (0.0%) | 0 (0.0%) |
| 18 to 34 Years | 2 (5.0%) | 0 (0.0%) |
| 35 to 64 Years | 13 (22.4%) | 0 (0.0%) |
| 65 to 74 Years | 27 (75.0%) | 25 (89.3%) |
| 75 Years and over | 12 (70.6%) | 3 (50.0%) |
Disability Class by Sex by Age in Indian Wells
Disability Class: Hearing Difficulty
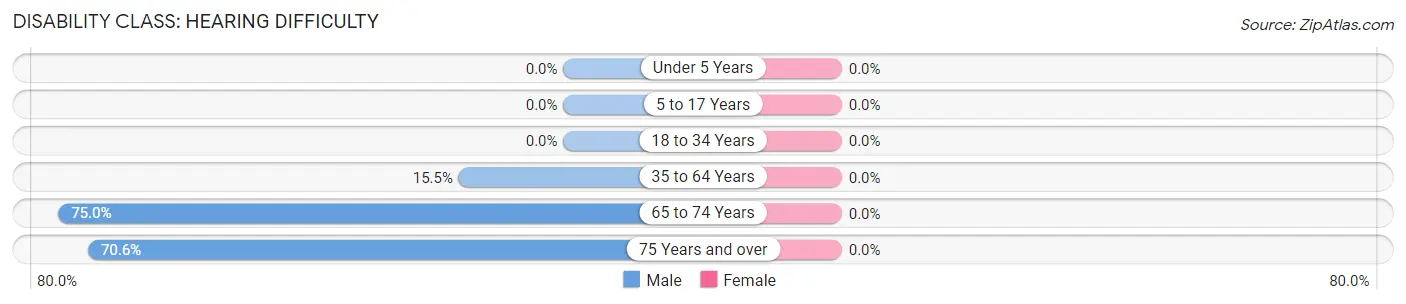
| Age Bracket | Male | Female |
| Under 5 Years | 0 (0.0%) | 0 (0.0%) |
| 5 to 17 Years | 0 (0.0%) | 0 (0.0%) |
| 18 to 34 Years | 0 (0.0%) | 0 (0.0%) |
| 35 to 64 Years | 9 (15.5%) | 0 (0.0%) |
| 65 to 74 Years | 27 (75.0%) | 0 (0.0%) |
| 75 Years and over | 12 (70.6%) | 0 (0.0%) |
Disability Class: Vision Difficulty
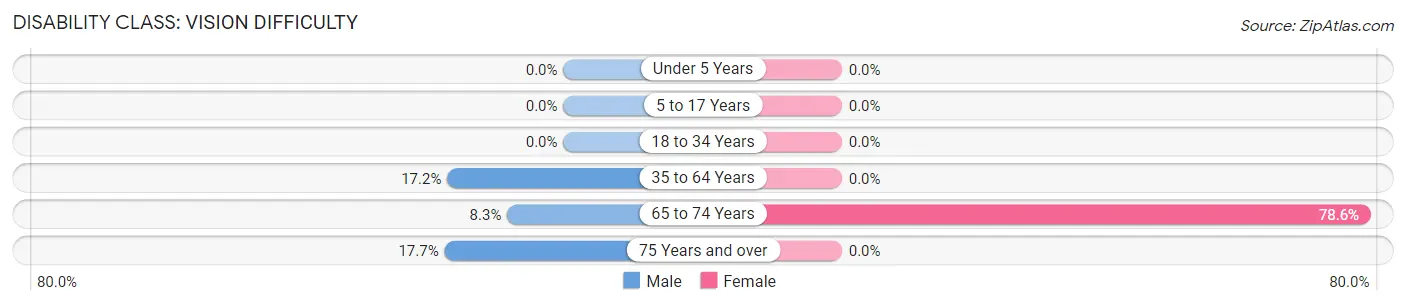
| Age Bracket | Male | Female |
| Under 5 Years | 0 (0.0%) | 0 (0.0%) |
| 5 to 17 Years | 0 (0.0%) | 0 (0.0%) |
| 18 to 34 Years | 0 (0.0%) | 0 (0.0%) |
| 35 to 64 Years | 10 (17.2%) | 0 (0.0%) |
| 65 to 74 Years | 3 (8.3%) | 22 (78.6%) |
| 75 Years and over | 3 (17.6%) | 0 (0.0%) |
Disability Class: Cognitive Difficulty
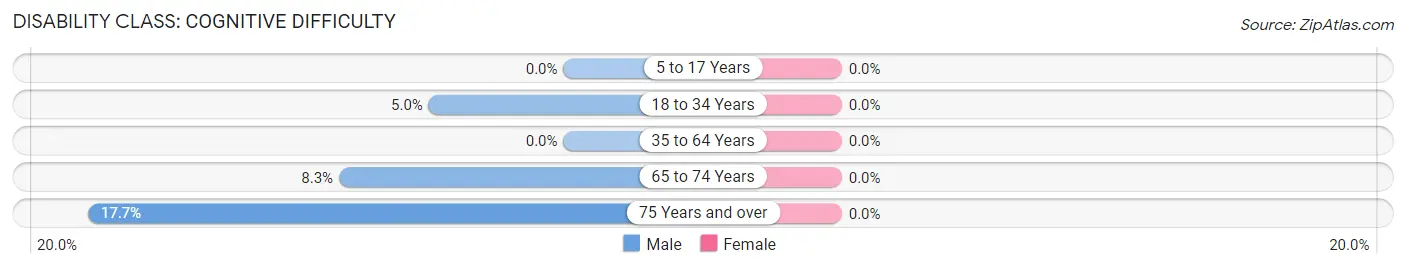
| Age Bracket | Male | Female |
| 5 to 17 Years | 0 (0.0%) | 0 (0.0%) |
| 18 to 34 Years | 2 (5.0%) | 0 (0.0%) |
| 35 to 64 Years | 0 (0.0%) | 0 (0.0%) |
| 65 to 74 Years | 3 (8.3%) | 0 (0.0%) |
| 75 Years and over | 3 (17.6%) | 0 (0.0%) |
Disability Class: Ambulatory Difficulty
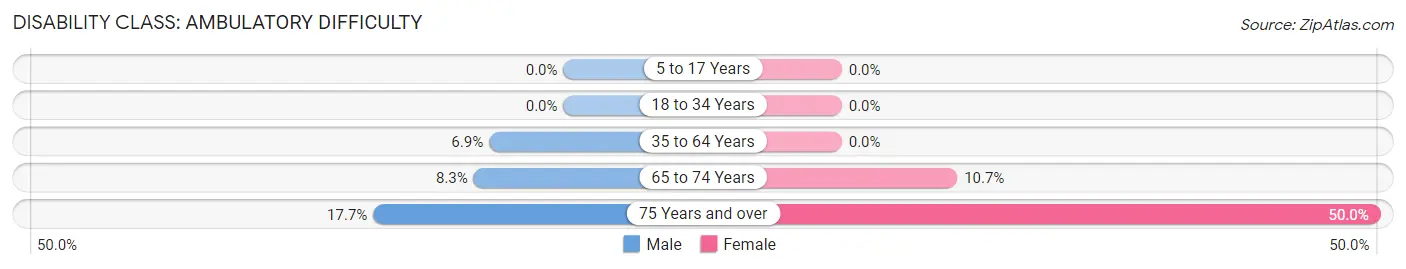
| Age Bracket | Male | Female |
| 5 to 17 Years | 0 (0.0%) | 0 (0.0%) |
| 18 to 34 Years | 0 (0.0%) | 0 (0.0%) |
| 35 to 64 Years | 4 (6.9%) | 0 (0.0%) |
| 65 to 74 Years | 3 (8.3%) | 3 (10.7%) |
| 75 Years and over | 3 (17.6%) | 3 (50.0%) |
Disability Class: Self-Care Difficulty
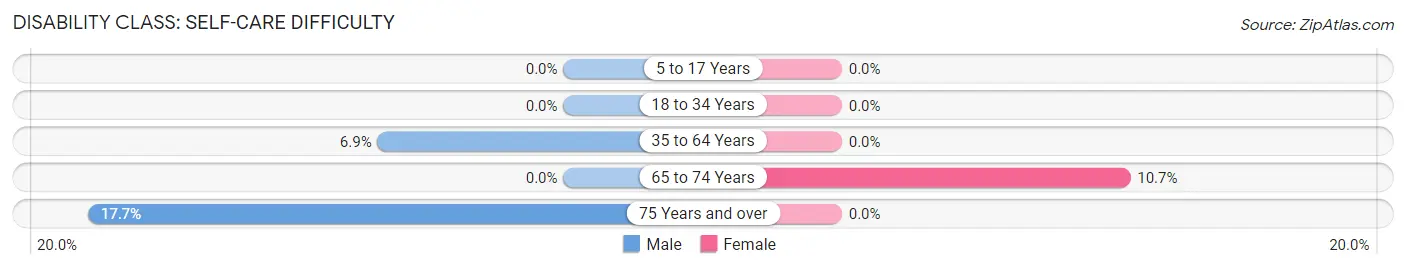
| Age Bracket | Male | Female |
| 5 to 17 Years | 0 (0.0%) | 0 (0.0%) |
| 18 to 34 Years | 0 (0.0%) | 0 (0.0%) |
| 35 to 64 Years | 4 (6.9%) | 0 (0.0%) |
| 65 to 74 Years | 0 (0.0%) | 3 (10.7%) |
| 75 Years and over | 3 (17.6%) | 0 (0.0%) |
Technology Access in Indian Wells
Computing Device Access in Indian Wells
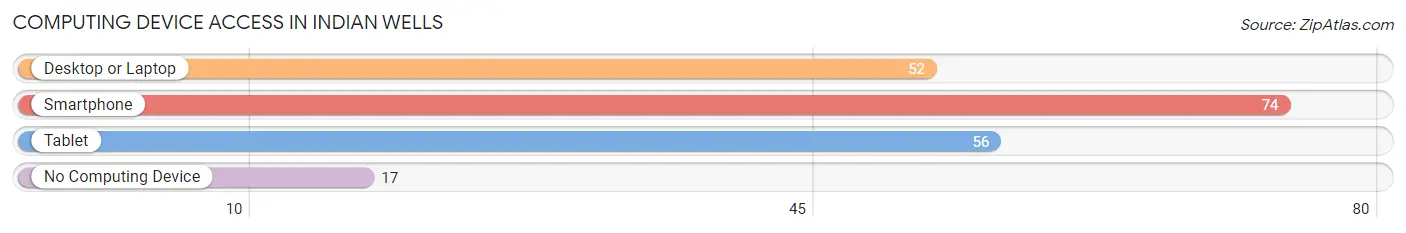
| Device Type | # Households | % Households |
| Desktop or Laptop | 52 | 55.3% |
| Smartphone | 74 | 78.7% |
| Tablet | 56 | 59.6% |
| No Computing Device | 17 | 18.1% |
| Total | 94 | 100.0% |
Internet Access in Indian Wells
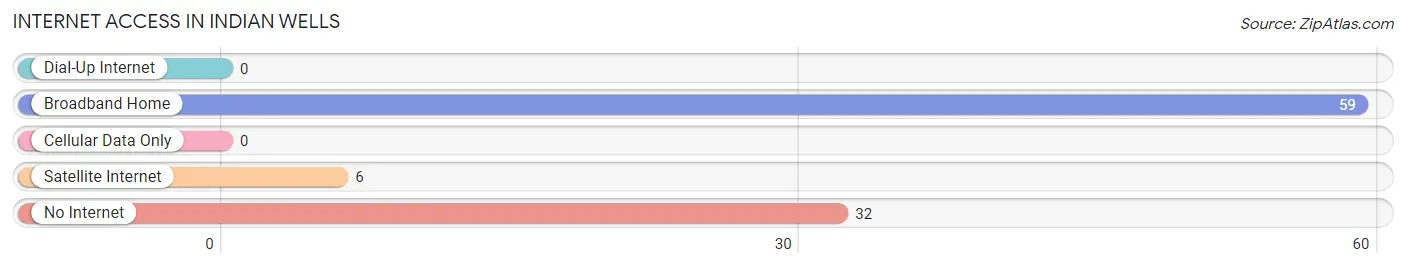
| Internet Type | # Households | % Households |
| Dial-Up Internet | 0 | 0.0% |
| Broadband Home | 59 | 62.8% |
| Cellular Data Only | 0 | 0.0% |
| Satellite Internet | 6 | 6.4% |
| No Internet | 32 | 34.0% |
| Total | 94 | 100.0% |
Indian Wells Summary
History
The area now known as Indian Wells, Arizona was first inhabited by the Hualapai and Havasupai Native American tribes. The Hualapai tribe is believed to have been in the area since the 1500s, while the Havasupai tribe is believed to have arrived in the 1700s. The two tribes lived in the area for centuries, relying on the land for sustenance and trading with other tribes.
In the late 1800s, the area was explored by settlers from the United States. The first settlers were ranchers, who established ranches in the area. The first post office in the area was established in 1891, and the town of Indian Wells was officially founded in 1895.
The town was named after the nearby Indian Wells, a natural spring that was used by the Native American tribes for centuries. The spring was also used by the settlers for their water supply.
The town grew slowly, but steadily, over the next few decades. In the early 1900s, the town was home to a few stores, a school, and a few churches. The town also had a few saloons and a hotel.
In the 1920s, the town began to grow more rapidly. The population increased from around 200 in 1920 to over 1,000 by 1930. The town was home to several businesses, including a bank, a movie theater, and a few restaurants.
In the 1940s, the town experienced a period of decline. The population decreased to around 500 by 1950. The town was still home to a few businesses, but most of the businesses had closed.
In the 1950s, the town began to experience a period of growth. The population increased to over 1,000 by 1960. The town was home to several businesses, including a grocery store, a hardware store, and a few restaurants.
In the 1970s, the town experienced a period of decline. The population decreased to around 500 by 1980. The town was still home to a few businesses, but most of the businesses had closed.
In the 1990s, the town began to experience a period of growth. The population increased to over 1,000 by 2000. The town was home to several businesses, including a grocery store, a hardware store, and a few restaurants.
Geography
Indian Wells is located in the western part of Arizona, in the Mohave County. The town is situated in the Hualapai Valley, at an elevation of 2,400 feet. The town is surrounded by the Hualapai Mountains to the north and the Black Mountains to the south.
The town is located near the Colorado River, which is the main source of water for the area. The town is also located near several other natural attractions, including the Grand Canyon, the Havasu Falls, and the Hualapai Mountains.
Economy
The economy of Indian Wells is largely based on tourism. The town is home to several tourist attractions, including the Grand Canyon, the Havasu Falls, and the Hualapai Mountains. The town is also home to several restaurants, hotels, and other businesses that cater to tourists.
The town is also home to several businesses that provide goods and services to the local population. These businesses include grocery stores, hardware stores, and other retail stores.
Demographics
As of the 2010 census, the population of Indian Wells was 1,093. The population is largely composed of Native Americans, with the majority of the population being of Hualapai and Havasupai descent. The town is also home to a small number of non-Native Americans.
The median household income in Indian Wells is $30,000, and the median age is 40. The town has a high rate of poverty, with over 30% of the population living below the poverty line. The town also has a high rate of unemployment, with over 10% of the population unemployed.
Common Questions
What is Per Capita Income in Indian Wells?
Per Capita income in Indian Wells is $11,801.
What is the Median Family Income in Indian Wells?
Median Family Income in Indian Wells is $45,260.
What is the Median Household income in Indian Wells?
Median Household Income in Indian Wells is $43,333.
What is Income or Wage Gap in Indian Wells?
Income or Wage Gap in Indian Wells is 11.0%.
Women in Indian Wells earn 89.0 cents for every dollar earned by a man.
What is Inequality or Gini Index in Indian Wells?
Inequality or Gini Index in Indian Wells is 0.43.
What is the Total Population of Indian Wells?
Total Population of Indian Wells is 357.
What is the Total Male Population of Indian Wells?
Total Male Population of Indian Wells is 193.
What is the Total Female Population of Indian Wells?
Total Female Population of Indian Wells is 164.
What is the Ratio of Males per 100 Females in Indian Wells?
There are 117.68 Males per 100 Females in Indian Wells.
What is the Ratio of Females per 100 Males in Indian Wells?
There are 84.97 Females per 100 Males in Indian Wells.
What is the Median Population Age in Indian Wells?
Median Population Age in Indian Wells is 42.9 Years.
What is the Average Family Size in Indian Wells
Average Family Size in Indian Wells is 3.8 People.
What is the Average Household Size in Indian Wells
Average Household Size in Indian Wells is 3.5 People.
How Large is the Labor Force in Indian Wells?
There are 106 People in the Labor Forcein in Indian Wells.
What is the Percentage of People in the Labor Force in Indian Wells?
38.4% of People are in the Labor Force in Indian Wells.
What is the Unemployment Rate in Indian Wells?
Unemployment Rate in Indian Wells is 19.8%.