Hotevilla Bacavi, AZ Map & Demographics
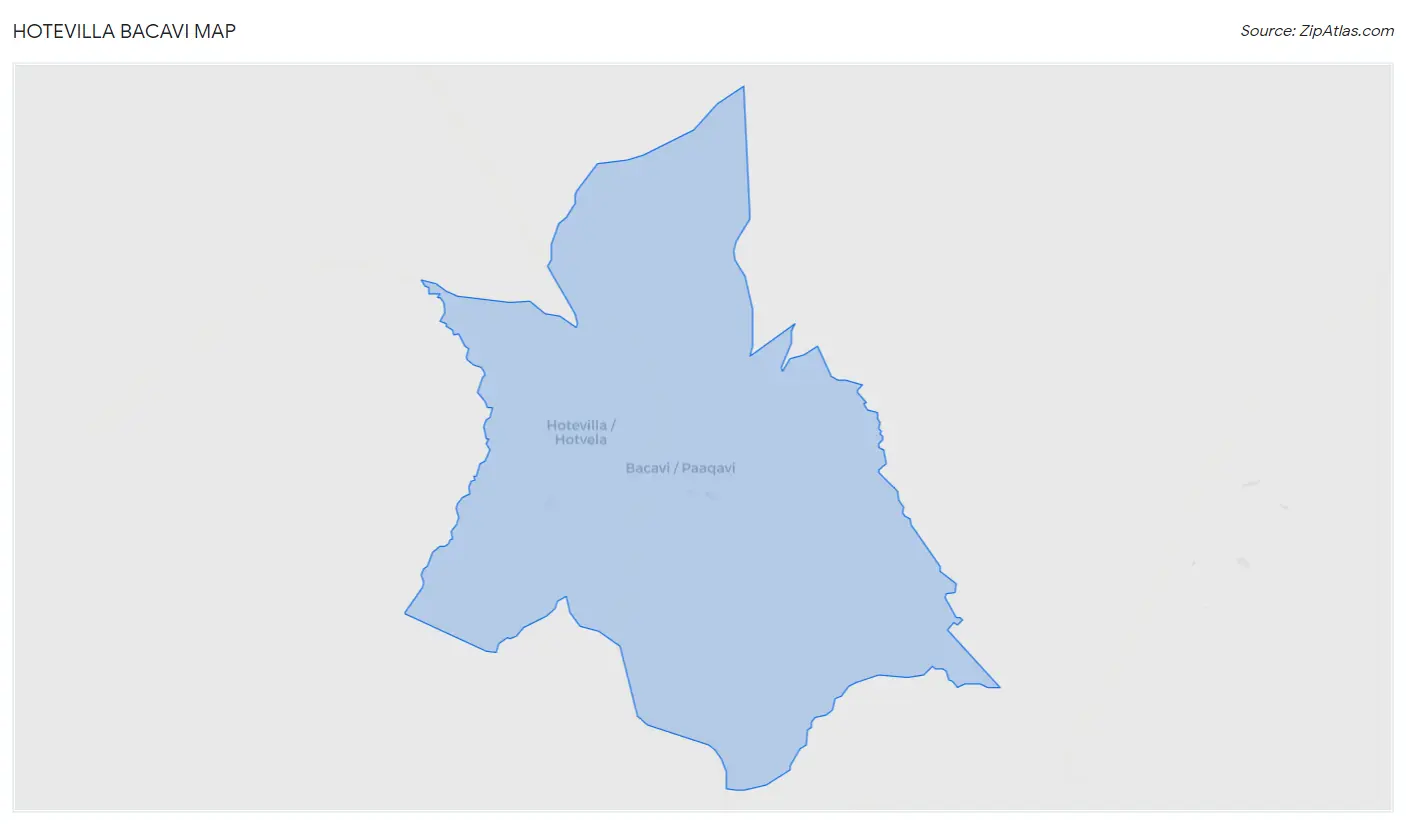
Hotevilla Bacavi Map
Hotevilla Bacavi Overview
$10,646
PER CAPITA INCOME
$31,250
AVG FAMILY INCOME
$31,339
AVG HOUSEHOLD INCOME
0.44
INEQUALITY / GINI INDEX
678
TOTAL POPULATION
340
MALE POPULATION
338
FEMALE POPULATION
100.59
MALES / 100 FEMALES
99.41
FEMALES / 100 MALES
49.4
MEDIAN AGE
3.2
AVG FAMILY SIZE
3.0
AVG HOUSEHOLD SIZE
161
LABOR FORCE [ PEOPLE ]
31.4%
PERCENT IN LABOR FORCE
15.5%
UNEMPLOYMENT RATE
Income in Hotevilla Bacavi
Income Overview in Hotevilla Bacavi
Per Capita Income in Hotevilla Bacavi is $10,646, while median incomes of families and households are $31,250 and $31,339 respectively.
| Characteristic | Number | Measure |
| Per Capita Income | 678 | $10,646 |
| Median Family Income | 178 | $31,250 |
| Mean Family Income | 178 | $35,253 |
| Median Household Income | 229 | $31,339 |
| Mean Household Income | 229 | $33,241 |
| Income Deficit | 178 | $0 |
| Wage / Income Gap (%) | 678 | 0.00% |
| Wage / Income Gap ($) | 678 | 100.00¢ per $1 |
| Gini / Inequality Index | 678 | 0.44 |
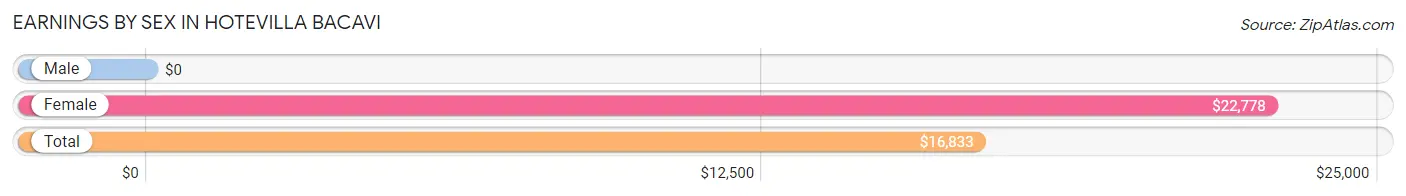
Earnings by Sex in Hotevilla Bacavi
| Sex | Number | Average Earnings |
| Male | 76 (43.7%) | $0 |
| Female | 98 (56.3%) | $22,778 |
| Total | 174 (100.0%) | $16,833 |
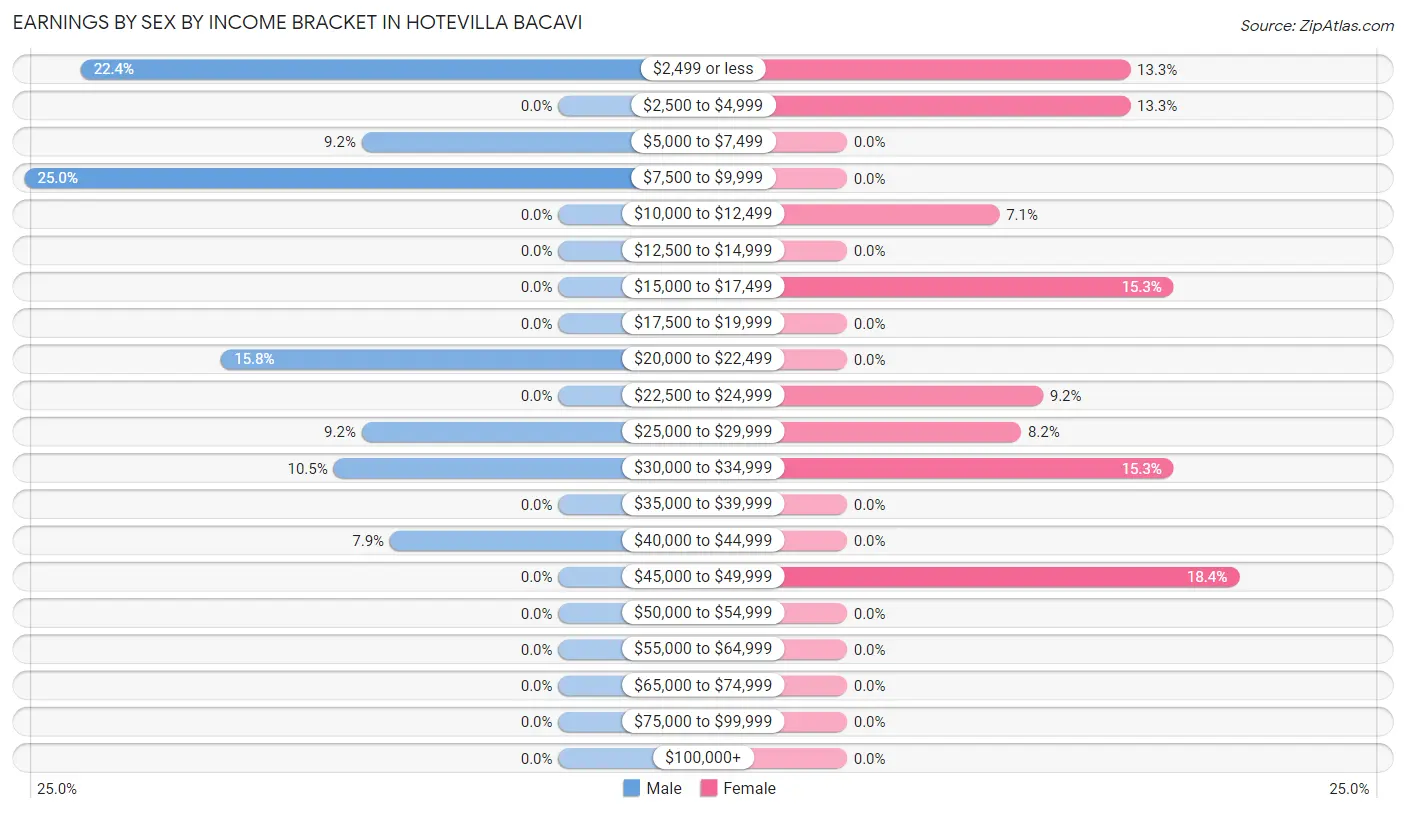
Earnings by Sex by Income Bracket in Hotevilla Bacavi
The most common earnings brackets in Hotevilla Bacavi are $7,500 to $9,999 for men (19 | 25.0%) and $45,000 to $49,999 for women (18 | 18.4%).
| Income | Male | Female |
| $2,499 or less | 17 (22.4%) | 13 (13.3%) |
| $2,500 to $4,999 | 0 (0.0%) | 13 (13.3%) |
| $5,000 to $7,499 | 7 (9.2%) | 0 (0.0%) |
| $7,500 to $9,999 | 19 (25.0%) | 0 (0.0%) |
| $10,000 to $12,499 | 0 (0.0%) | 7 (7.1%) |
| $12,500 to $14,999 | 0 (0.0%) | 0 (0.0%) |
| $15,000 to $17,499 | 0 (0.0%) | 15 (15.3%) |
| $17,500 to $19,999 | 0 (0.0%) | 0 (0.0%) |
| $20,000 to $22,499 | 12 (15.8%) | 0 (0.0%) |
| $22,500 to $24,999 | 0 (0.0%) | 9 (9.2%) |
| $25,000 to $29,999 | 7 (9.2%) | 8 (8.2%) |
| $30,000 to $34,999 | 8 (10.5%) | 15 (15.3%) |
| $35,000 to $39,999 | 0 (0.0%) | 0 (0.0%) |
| $40,000 to $44,999 | 6 (7.9%) | 0 (0.0%) |
| $45,000 to $49,999 | 0 (0.0%) | 18 (18.4%) |
| $50,000 to $54,999 | 0 (0.0%) | 0 (0.0%) |
| $55,000 to $64,999 | 0 (0.0%) | 0 (0.0%) |
| $65,000 to $74,999 | 0 (0.0%) | 0 (0.0%) |
| $75,000 to $99,999 | 0 (0.0%) | 0 (0.0%) |
| $100,000+ | 0 (0.0%) | 0 (0.0%) |
| Total | 76 (100.0%) | 98 (100.0%) |
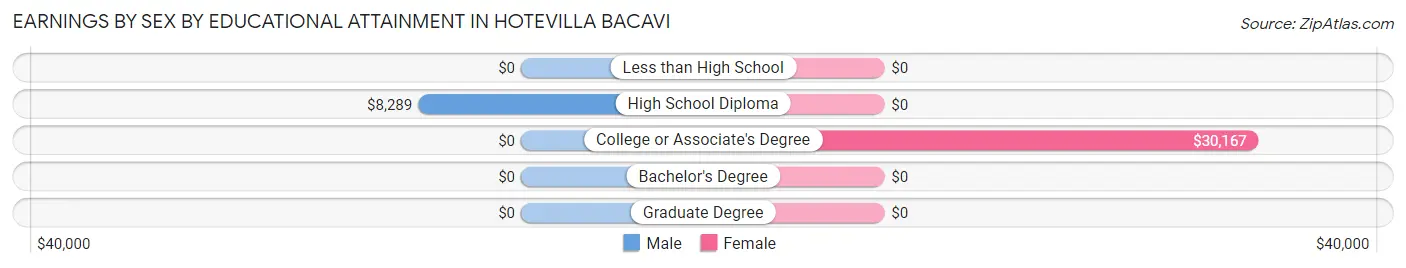
Earnings by Sex by Educational Attainment in Hotevilla Bacavi
| Educational Attainment | Male Income | Female Income |
| Less than High School | - | - |
| High School Diploma | $8,289 | $0 |
| College or Associate's Degree | - | - |
| Bachelor's Degree | - | - |
| Graduate Degree | - | - |
| Total | - | - |
Family Income in Hotevilla Bacavi
Family Income Brackets in Hotevilla Bacavi
According to the Hotevilla Bacavi family income data, there are 60 families falling into the $15,000 to $24,999 income range, which is the most common income bracket and makes up 33.7% of all families.
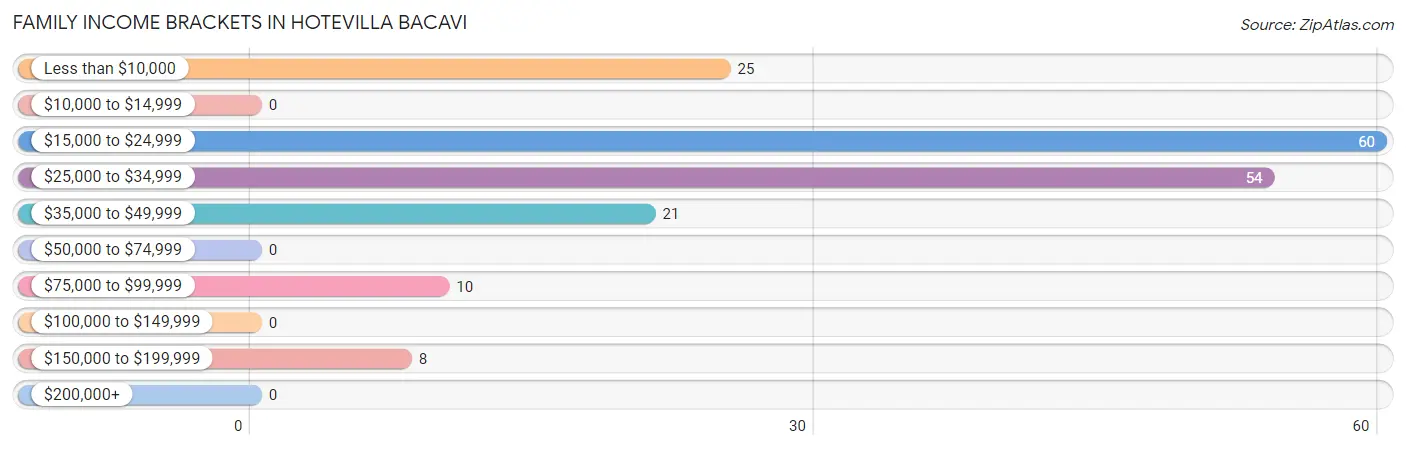
| Income Bracket | # Families | % Families |
| Less than $10,000 | 25 | 14.0% |
| $10,000 to $14,999 | 0 | 0.0% |
| $15,000 to $24,999 | 60 | 33.7% |
| $25,000 to $34,999 | 54 | 30.3% |
| $35,000 to $49,999 | 21 | 11.8% |
| $50,000 to $74,999 | 0 | 0.0% |
| $75,000 to $99,999 | 10 | 5.6% |
| $100,000 to $149,999 | 0 | 0.0% |
| $150,000 to $199,999 | 8 | 4.5% |
| $200,000+ | 0 | 0.0% |
Family Income by Famaliy Size in Hotevilla Bacavi
2-person families (81 | 45.5%) account for the highest median family income in Hotevilla Bacavi with $33,125 per family, while 2-person families (81 | 45.5%) have the highest median income of $16,562 per family member.
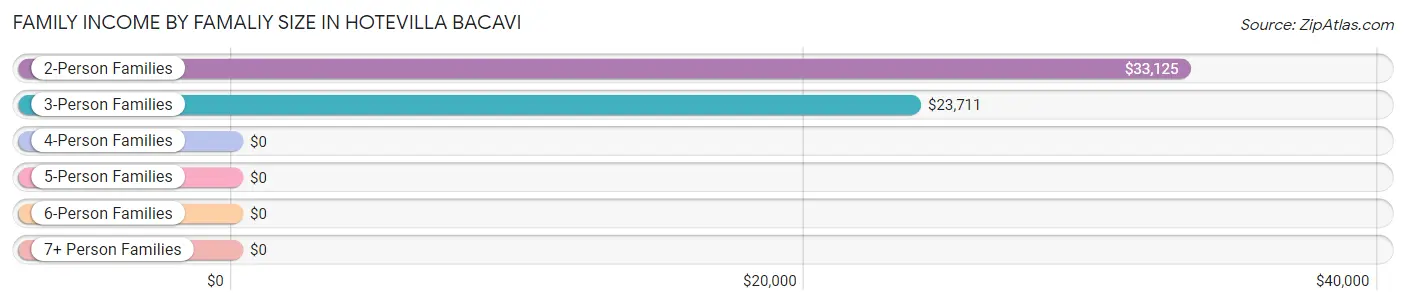
| Income Bracket | # Families | Median Income |
| 2-Person Families | 81 (45.5%) | $33,125 |
| 3-Person Families | 43 (24.2%) | $23,711 |
| 4-Person Families | 22 (12.4%) | $0 |
| 5-Person Families | 8 (4.5%) | $0 |
| 6-Person Families | 8 (4.5%) | $0 |
| 7+ Person Families | 16 (9.0%) | $0 |
| Total | 178 (100.0%) | $31,250 |
Family Income by Number of Earners in Hotevilla Bacavi
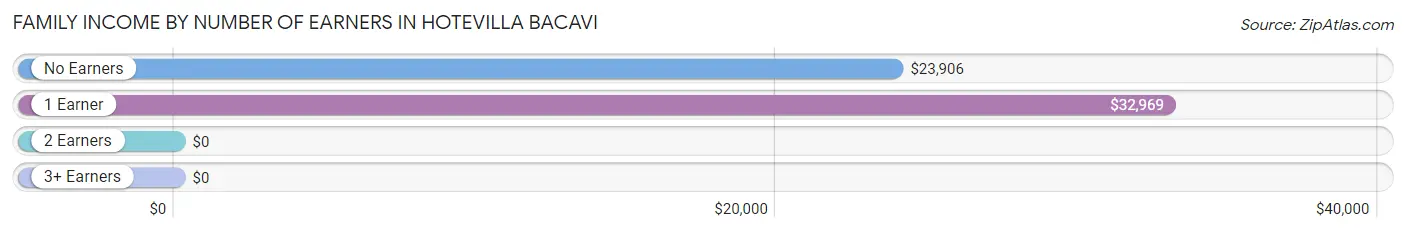
| Number of Earners | # Families | Median Income |
| No Earners | 86 (48.3%) | $23,906 |
| 1 Earner | 52 (29.2%) | $32,969 |
| 2 Earners | 32 (18.0%) | $0 |
| 3+ Earners | 8 (4.5%) | $0 |
| Total | 178 (100.0%) | $31,250 |
Household Income in Hotevilla Bacavi
Household Income Brackets in Hotevilla Bacavi
With 60 households falling in the category, the $25,000 to $34,999 income range is the most frequent in Hotevilla Bacavi, accounting for 26.2% of all households.
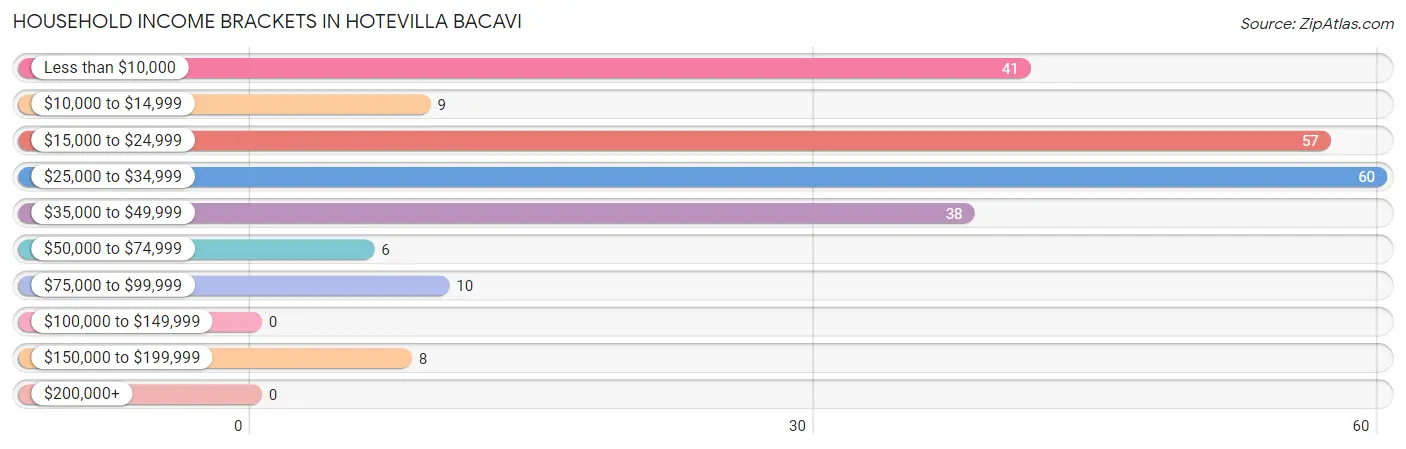
| Income Bracket | # Households | % Households |
| Less than $10,000 | 41 | 17.9% |
| $10,000 to $14,999 | 9 | 3.9% |
| $15,000 to $24,999 | 57 | 24.9% |
| $25,000 to $34,999 | 60 | 26.2% |
| $35,000 to $49,999 | 38 | 16.6% |
| $50,000 to $74,999 | 6 | 2.6% |
| $75,000 to $99,999 | 10 | 4.4% |
| $100,000 to $149,999 | 0 | 0.0% |
| $150,000 to $199,999 | 8 | 3.5% |
| $200,000+ | 0 | 0.0% |
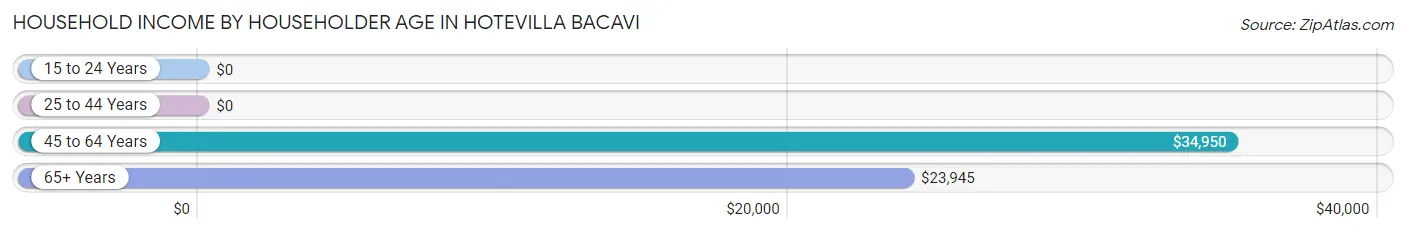
Household Income by Householder Age in Hotevilla Bacavi
The median household income in Hotevilla Bacavi is $31,339, with the highest median household income of $34,950 found in the 45 to 64 years age bracket for the primary householder. A total of 87 households (38.0%) fall into this category. Meanwhile, the 15 to 24 years age bracket for the primary householder has the lowest median household income of $0, with 11 households (4.8%) in this group.
| Income Bracket | # Households | Median Income |
| 15 to 24 Years | 11 (4.8%) | $0 |
| 25 to 44 Years | 10 (4.4%) | $0 |
| 45 to 64 Years | 87 (38.0%) | $34,950 |
| 65+ Years | 121 (52.8%) | $23,945 |
| Total | 229 (100.0%) | $31,339 |
Poverty in Hotevilla Bacavi
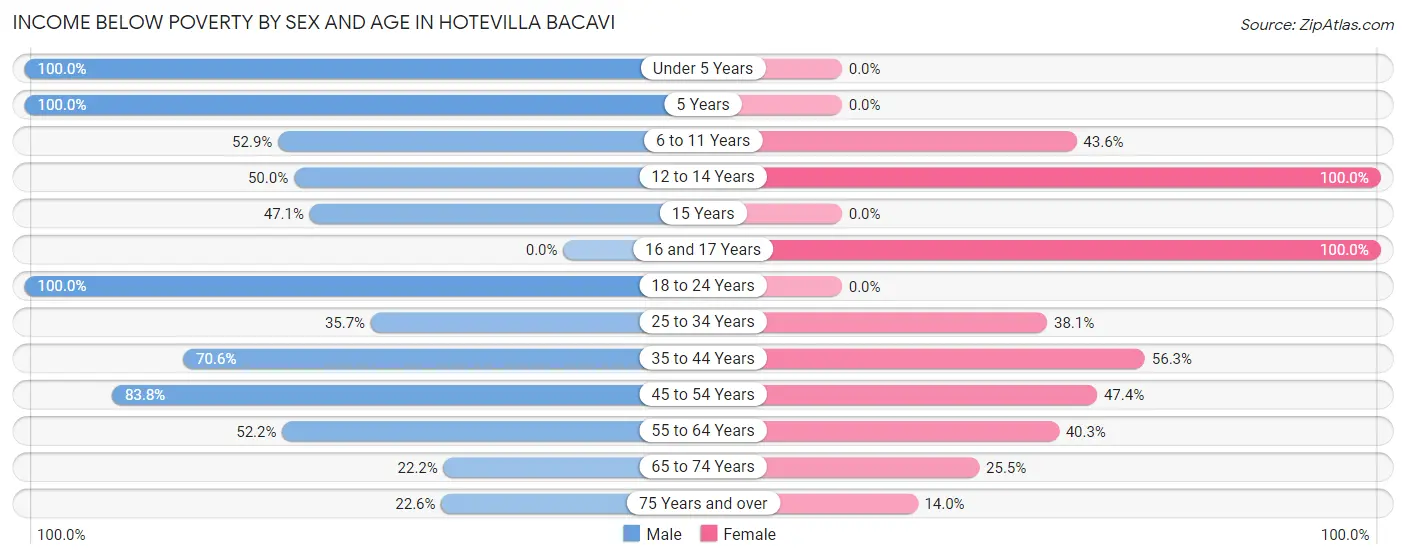
Income Below Poverty by Sex and Age in Hotevilla Bacavi
With 54.4% poverty level for males and 38.3% for females among the residents of Hotevilla Bacavi, under 5 year old males and 12 to 14 year old females are the most vulnerable to poverty, with 20 males (100.0%) and 9 females (100.0%) in their respective age groups living below the poverty level.
| Age Bracket | Male | Female |
| Under 5 Years | 20 (100.0%) | 0 (0.0%) |
| 5 Years | 8 (100.0%) | 0 (0.0%) |
| 6 to 11 Years | 9 (52.9%) | 27 (43.5%) |
| 12 to 14 Years | 8 (50.0%) | 9 (100.0%) |
| 15 Years | 8 (47.1%) | 0 (0.0%) |
| 16 and 17 Years | 0 (0.0%) | 9 (100.0%) |
| 18 to 24 Years | 11 (100.0%) | 0 (0.0%) |
| 25 to 34 Years | 10 (35.7%) | 8 (38.1%) |
| 35 to 44 Years | 36 (70.6%) | 9 (56.2%) |
| 45 to 54 Years | 31 (83.8%) | 9 (47.4%) |
| 55 to 64 Years | 24 (52.2%) | 31 (40.3%) |
| 65 to 74 Years | 8 (22.2%) | 13 (25.5%) |
| 75 Years and over | 12 (22.6%) | 8 (14.0%) |
| Total | 185 (54.4%) | 123 (38.3%) |
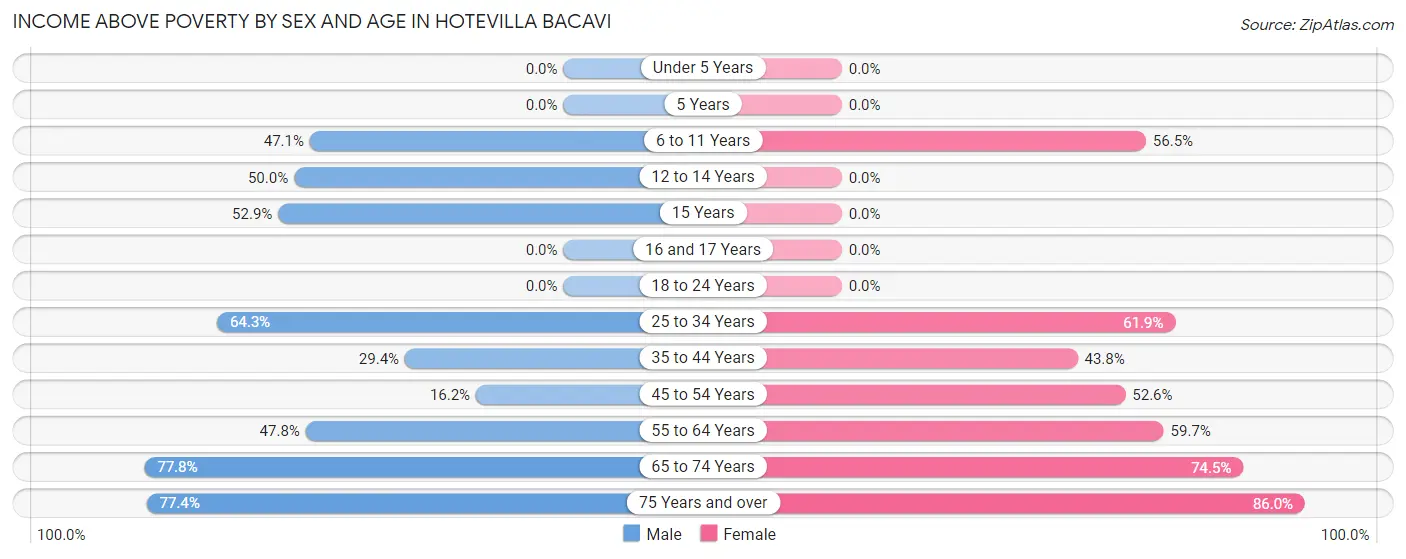
Income Above Poverty by Sex and Age in Hotevilla Bacavi
According to the poverty statistics in Hotevilla Bacavi, males aged 65 to 74 years and females aged 75 years and over are the age groups that are most secure financially, with 77.8% of males and 86.0% of females in these age groups living above the poverty line.
| Age Bracket | Male | Female |
| Under 5 Years | 0 (0.0%) | 0 (0.0%) |
| 5 Years | 0 (0.0%) | 0 (0.0%) |
| 6 to 11 Years | 8 (47.1%) | 35 (56.5%) |
| 12 to 14 Years | 8 (50.0%) | 0 (0.0%) |
| 15 Years | 9 (52.9%) | 0 (0.0%) |
| 16 and 17 Years | 0 (0.0%) | 0 (0.0%) |
| 18 to 24 Years | 0 (0.0%) | 0 (0.0%) |
| 25 to 34 Years | 18 (64.3%) | 13 (61.9%) |
| 35 to 44 Years | 15 (29.4%) | 7 (43.8%) |
| 45 to 54 Years | 6 (16.2%) | 10 (52.6%) |
| 55 to 64 Years | 22 (47.8%) | 46 (59.7%) |
| 65 to 74 Years | 28 (77.8%) | 38 (74.5%) |
| 75 Years and over | 41 (77.4%) | 49 (86.0%) |
| Total | 155 (45.6%) | 198 (61.7%) |
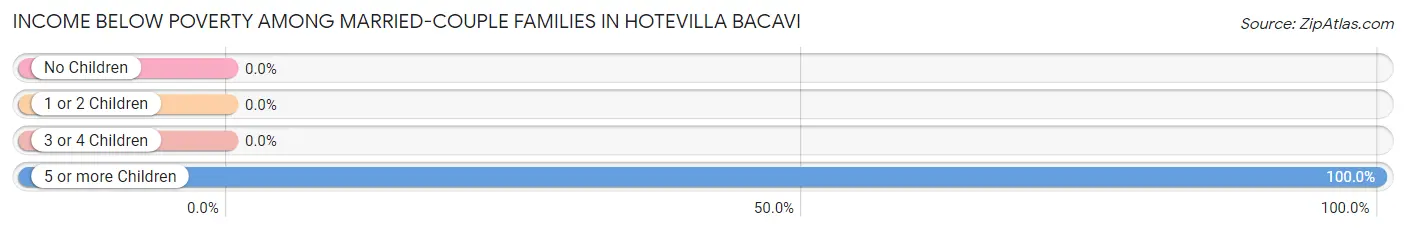
Income Below Poverty Among Married-Couple Families in Hotevilla Bacavi
The poverty statistics for married-couple families in Hotevilla Bacavi show that 8.1% or 8 of the total 99 families live below the poverty line. Families with 5 or more children have the highest poverty rate of 100.0%, comprising of 8 families. On the other hand, families with no children have the lowest poverty rate of 0.0%, which includes 0 families.
| Children | Above Poverty | Below Poverty |
| No Children | 91 (100.0%) | 0 (0.0%) |
| 1 or 2 Children | 0 (0.0%) | 0 (0.0%) |
| 3 or 4 Children | 0 (0.0%) | 0 (0.0%) |
| 5 or more Children | 0 (0.0%) | 8 (100.0%) |
| Total | 91 (91.9%) | 8 (8.1%) |
Income Below Poverty Among Single-Parent Households in Hotevilla Bacavi
According to the poverty data in Hotevilla Bacavi, 100.0% or 17 single-father households and 61.3% or 38 single-mother households are living below the poverty line. Among single-father households, those with no children have the highest poverty rate, with 17 households (100.0%) experiencing poverty. Likewise, among single-mother households, those with no children have the highest poverty rate, with 8 households (100.0%) falling below the poverty line.
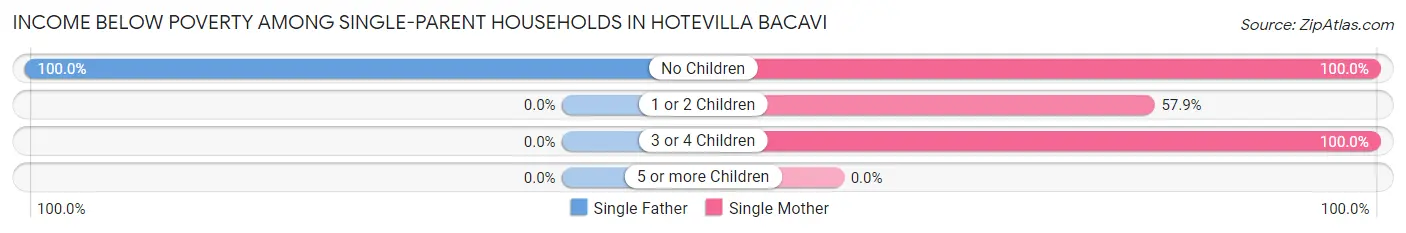
| Children | Single Father | Single Mother |
| No Children | 17 (100.0%) | 8 (100.0%) |
| 1 or 2 Children | 0 (0.0%) | 22 (57.9%) |
| 3 or 4 Children | 0 (0.0%) | 8 (100.0%) |
| 5 or more Children | 0 (0.0%) | 0 (0.0%) |
| Total | 17 (100.0%) | 38 (61.3%) |
Income Below Poverty Among Married-Couple vs Single-Parent Households in Hotevilla Bacavi
The poverty data for Hotevilla Bacavi shows that 8 of the married-couple family households (8.1%) and 55 of the single-parent households (69.6%) are living below the poverty level. Within the married-couple family households, those with 5 or more children have the highest poverty rate, with 8 households (100.0%) falling below the poverty line. Among the single-parent households, those with no children have the highest poverty rate, with 25 household (100.0%) living below poverty.
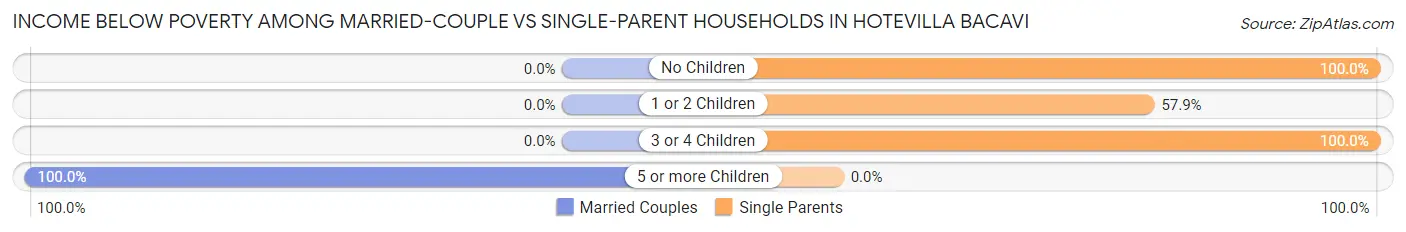
| Children | Married-Couple Families | Single-Parent Households |
| No Children | 0 (0.0%) | 25 (100.0%) |
| 1 or 2 Children | 0 (0.0%) | 22 (57.9%) |
| 3 or 4 Children | 0 (0.0%) | 8 (100.0%) |
| 5 or more Children | 8 (100.0%) | 0 (0.0%) |
| Total | 8 (8.1%) | 55 (69.6%) |
Race in Hotevilla Bacavi
The most populous races in Hotevilla Bacavi are Native / Alaskan (678 | 100.0%), and Hispanic or Latino (25 | 3.7%).
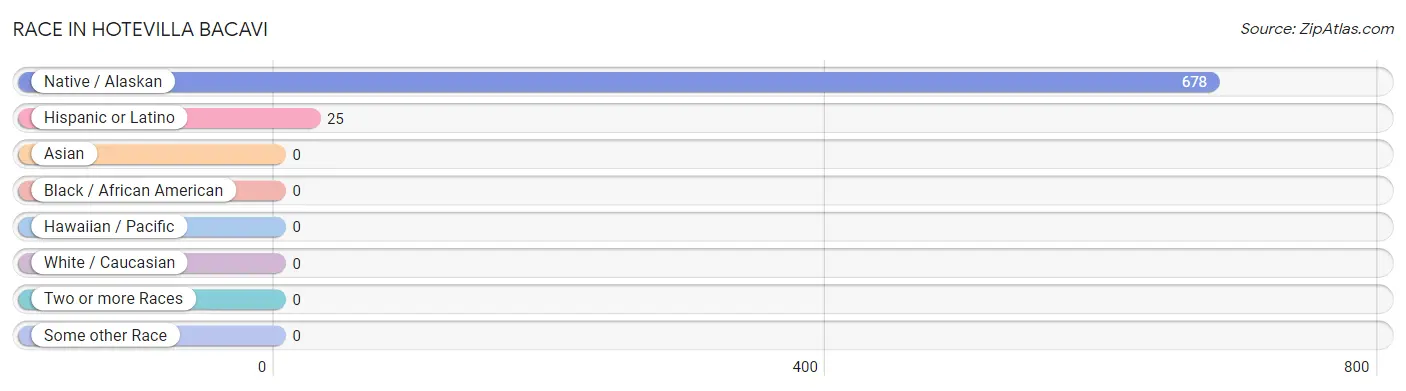
| Race | # Population | % Population |
| Asian | 0 | 0.0% |
| Black / African American | 0 | 0.0% |
| Hawaiian / Pacific | 0 | 0.0% |
| Hispanic or Latino | 25 | 3.7% |
| Native / Alaskan | 678 | 100.0% |
| White / Caucasian | 0 | 0.0% |
| Two or more Races | 0 | 0.0% |
| Some other Race | 0 | 0.0% |
| Total | 678 | 100.0% |
Ancestry in Hotevilla Bacavi
The most populous ancestries reported in Hotevilla Bacavi are Hopi (649 | 95.7%), Mexican (25 | 3.7%), Creek (21 | 3.1%), and Navajo (17 | 2.5%), together accounting for 105.0% of all Hotevilla Bacavi residents.
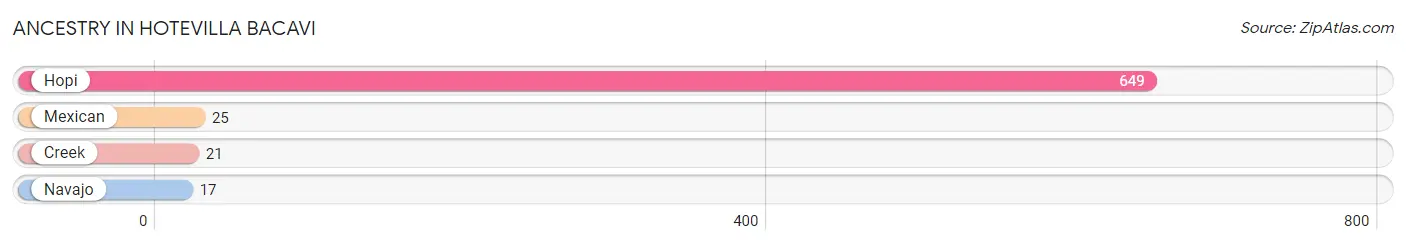
| Ancestry | # Population | % Population |
| Creek | 21 | 3.1% |
| Hopi | 649 | 95.7% |
| Mexican | 25 | 3.7% |
| Navajo | 17 | 2.5% | View All 4 Rows |
Immigrants in Hotevilla Bacavi

| Immigration Origin | # Population | % Population | View All 0 Rows |
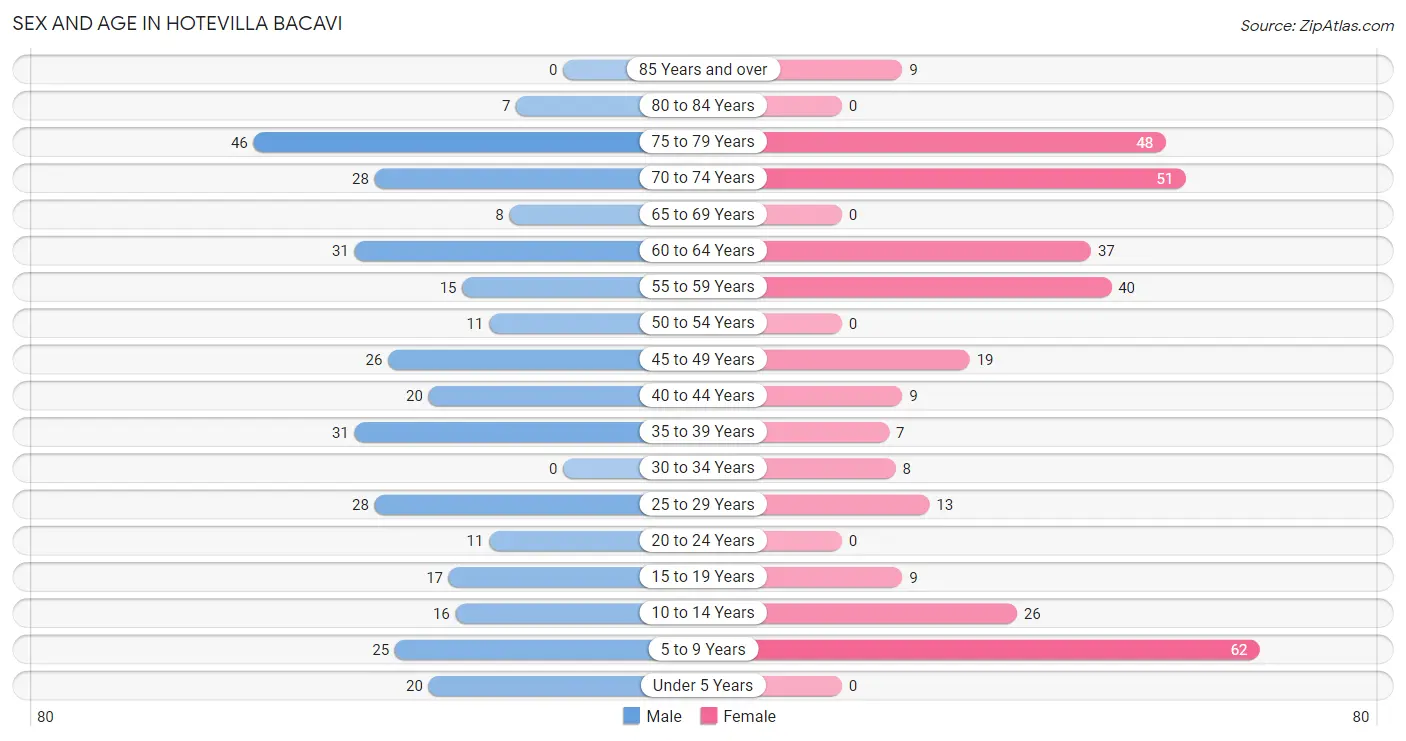
Sex and Age in Hotevilla Bacavi
Sex and Age in Hotevilla Bacavi
The most populous age groups in Hotevilla Bacavi are 75 to 79 Years (46 | 13.5%) for men and 5 to 9 Years (62 | 18.3%) for women.
| Age Bracket | Male | Female |
| Under 5 Years | 20 (5.9%) | 0 (0.0%) |
| 5 to 9 Years | 25 (7.3%) | 62 (18.3%) |
| 10 to 14 Years | 16 (4.7%) | 26 (7.7%) |
| 15 to 19 Years | 17 (5.0%) | 9 (2.7%) |
| 20 to 24 Years | 11 (3.2%) | 0 (0.0%) |
| 25 to 29 Years | 28 (8.2%) | 13 (3.8%) |
| 30 to 34 Years | 0 (0.0%) | 8 (2.4%) |
| 35 to 39 Years | 31 (9.1%) | 7 (2.1%) |
| 40 to 44 Years | 20 (5.9%) | 9 (2.7%) |
| 45 to 49 Years | 26 (7.6%) | 19 (5.6%) |
| 50 to 54 Years | 11 (3.2%) | 0 (0.0%) |
| 55 to 59 Years | 15 (4.4%) | 40 (11.8%) |
| 60 to 64 Years | 31 (9.1%) | 37 (11.0%) |
| 65 to 69 Years | 8 (2.4%) | 0 (0.0%) |
| 70 to 74 Years | 28 (8.2%) | 51 (15.1%) |
| 75 to 79 Years | 46 (13.5%) | 48 (14.2%) |
| 80 to 84 Years | 7 (2.1%) | 0 (0.0%) |
| 85 Years and over | 0 (0.0%) | 9 (2.7%) |
| Total | 340 (100.0%) | 338 (100.0%) |
Families and Households in Hotevilla Bacavi
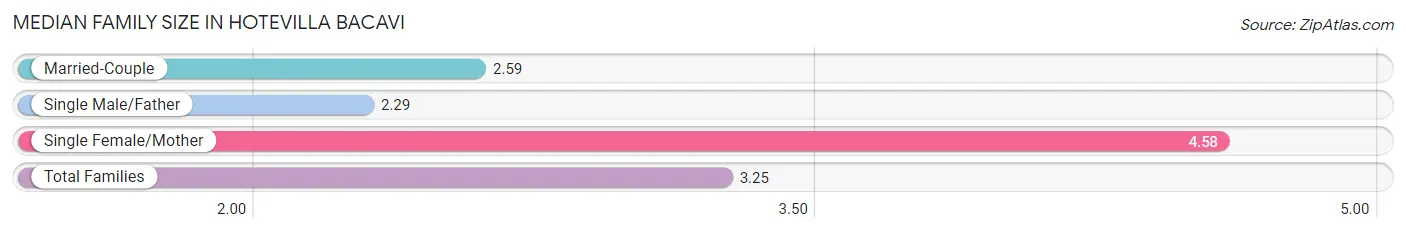
Median Family Size in Hotevilla Bacavi
The median family size in Hotevilla Bacavi is 3.25 persons per family, with single female/mother families (62 | 34.8%) accounting for the largest median family size of 4.58 persons per family. On the other hand, single male/father families (17 | 9.6%) represent the smallest median family size with 2.29 persons per family.
| Family Type | # Families | Family Size |
| Married-Couple | 99 (55.6%) | 2.59 |
| Single Male/Father | 17 (9.6%) | 2.29 |
| Single Female/Mother | 62 (34.8%) | 4.58 |
| Total Families | 178 (100.0%) | 3.25 |
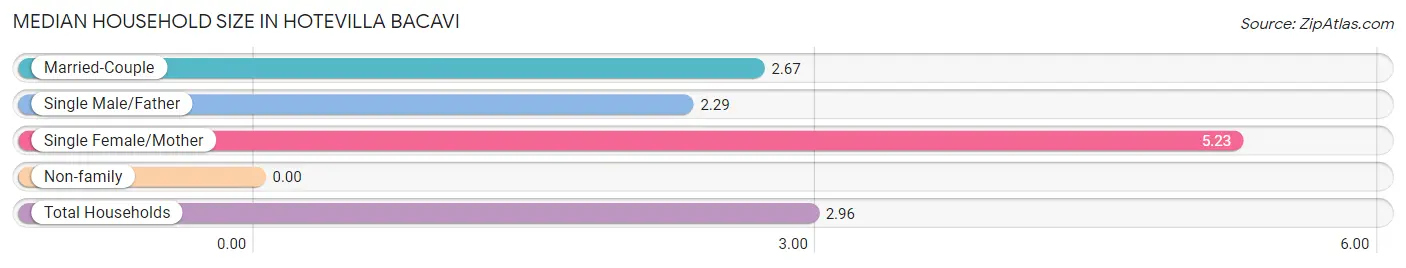
Median Household Size in Hotevilla Bacavi
| Household Type | # Households | Household Size |
| Married-Couple | 99 (43.2%) | 2.67 |
| Single Male/Father | 17 (7.4%) | 2.29 |
| Single Female/Mother | 62 (27.1%) | 5.23 |
| Non-family | 51 (22.3%) | - |
| Total Households | 229 (100.0%) | 2.96 |
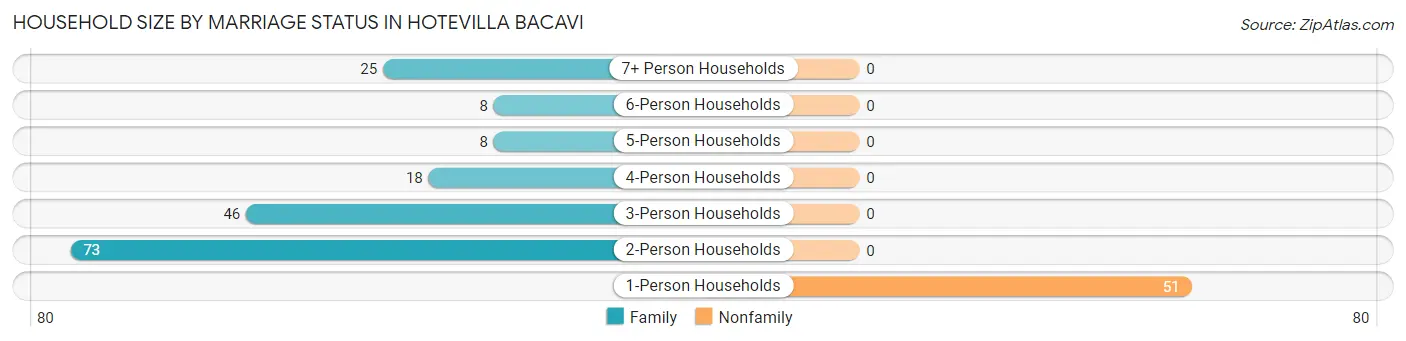
Household Size by Marriage Status in Hotevilla Bacavi
Out of a total of 229 households in Hotevilla Bacavi, 178 (77.7%) are family households, while 51 (22.3%) are nonfamily households. The most numerous type of family households are 2-person households, comprising 73, and the most common type of nonfamily households are 1-person households, comprising 51.
| Household Size | Family Households | Nonfamily Households |
| 1-Person Households | - | 51 (22.3%) |
| 2-Person Households | 73 (31.9%) | 0 (0.0%) |
| 3-Person Households | 46 (20.1%) | 0 (0.0%) |
| 4-Person Households | 18 (7.9%) | 0 (0.0%) |
| 5-Person Households | 8 (3.5%) | 0 (0.0%) |
| 6-Person Households | 8 (3.5%) | 0 (0.0%) |
| 7+ Person Households | 25 (10.9%) | 0 (0.0%) |
| Total | 178 (77.7%) | 51 (22.3%) |
Female Fertility in Hotevilla Bacavi
Fertility by Age in Hotevilla Bacavi
| Age Bracket | Women with Births | Births / 1,000 Women |
| 15 to 19 years | 0 (0.0%) | 0.0 |
| 20 to 34 years | 0 (0.0%) | 0.0 |
| 35 to 50 years | 0 (0.0%) | 0.0 |
| Total | 0 (0.0%) | 0.0 |
Fertility by Age by Marriage Status in Hotevilla Bacavi
| Age Bracket | Married | Unmarried |
| 15 to 19 years | 0 (0.0%) | 0 (0.0%) |
| 20 to 34 years | 0 (0.0%) | 0 (0.0%) |
| 35 to 50 years | 0 (0.0%) | 0 (0.0%) |
| Total | 0 (0.0%) | 0 (0.0%) |
Fertility by Education in Hotevilla Bacavi
| Educational Attainment | Women with Births | Births / 1,000 Women |
| Less than High School | 0 (0.0%) | 0.0 |
| High School Diploma | 0 (0.0%) | 0.0 |
| College or Associate's Degree | 0 (0.0%) | 0.0 |
| Bachelor's Degree | 0 (0.0%) | 0.0 |
| Graduate Degree | 0 (0.0%) | 0.0 |
| Total | 0 (0.0%) | 0.0 |
Fertility by Education by Marriage Status in Hotevilla Bacavi
| Educational Attainment | Married | Unmarried |
| Less than High School | 0 (0.0%) | 0 (0.0%) |
| High School Diploma | 0 (0.0%) | 0 (0.0%) |
| College or Associate's Degree | 0 (0.0%) | 0 (0.0%) |
| Bachelor's Degree | 0 (0.0%) | 0 (0.0%) |
| Graduate Degree | 0 (0.0%) | 0 (0.0%) |
| Total | 0 (0.0%) | 0 (0.0%) |
Employment Characteristics in Hotevilla Bacavi
Employment by Class of Employer in Hotevilla Bacavi
Among the 136 employed individuals in Hotevilla Bacavi, local government employees (51 | 37.5%), private company employees (30 | 22.1%), and self-employed (not incorporated) (27 | 19.9%) make up the most common classes of employment.
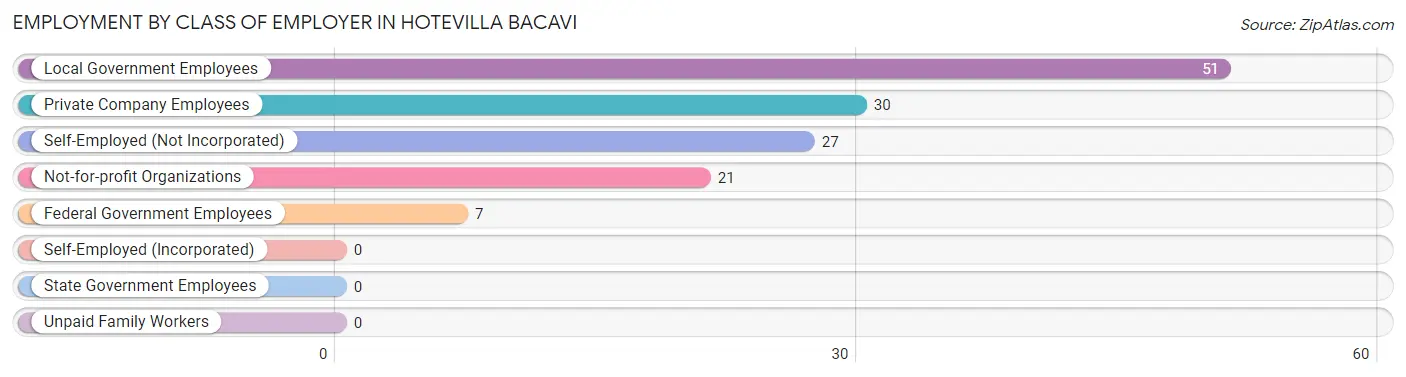
| Employer Class | # Employees | % Employees |
| Private Company Employees | 30 | 22.1% |
| Self-Employed (Incorporated) | 0 | 0.0% |
| Self-Employed (Not Incorporated) | 27 | 19.9% |
| Not-for-profit Organizations | 21 | 15.4% |
| Local Government Employees | 51 | 37.5% |
| State Government Employees | 0 | 0.0% |
| Federal Government Employees | 7 | 5.1% |
| Unpaid Family Workers | 0 | 0.0% |
| Total | 136 | 100.0% |
Employment Status by Age in Hotevilla Bacavi
According to the labor force statistics for Hotevilla Bacavi, out of the total population over 16 years of age (512), 31.4% or 161 individuals are in the labor force, with 15.5% or 25 of them unemployed. The age group with the highest labor force participation rate is 30 to 34 years, with 100.0% or 8 individuals in the labor force. Within the labor force, the 30 to 34 years age range has the highest percentage of unemployed individuals, with 100.0% or 8 of them being unemployed.
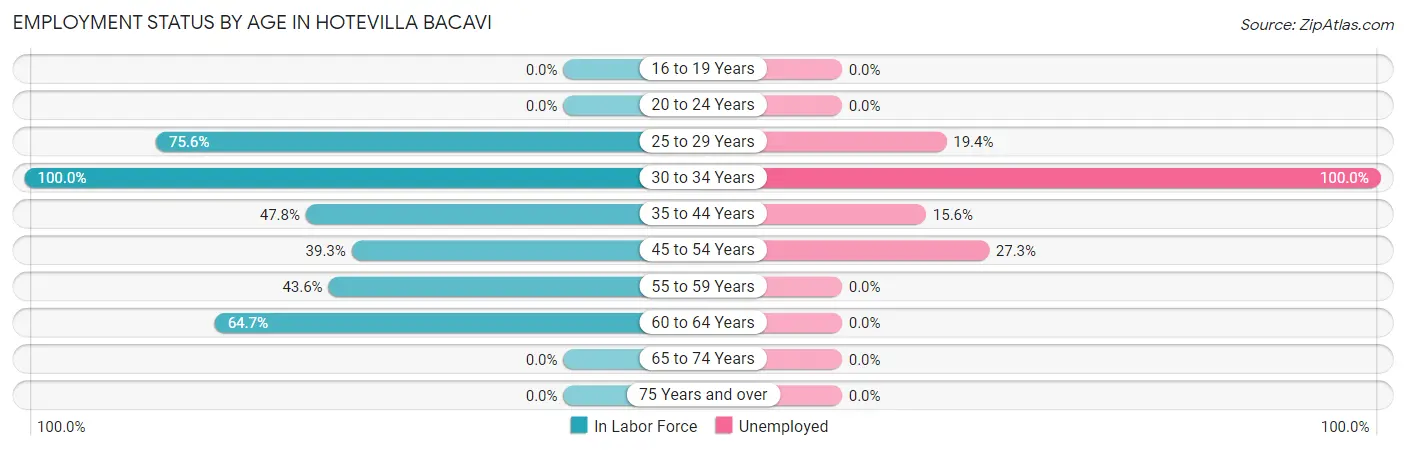
| Age Bracket | In Labor Force | Unemployed |
| 16 to 19 Years | 0 (0.0%) | 0 (0.0%) |
| 20 to 24 Years | 0 (0.0%) | 0 (0.0%) |
| 25 to 29 Years | 31 (75.6%) | 6 (19.4%) |
| 30 to 34 Years | 8 (100.0%) | 8 (100.0%) |
| 35 to 44 Years | 32 (47.8%) | 5 (15.6%) |
| 45 to 54 Years | 22 (39.3%) | 6 (27.3%) |
| 55 to 59 Years | 24 (43.6%) | 0 (0.0%) |
| 60 to 64 Years | 44 (64.7%) | 0 (0.0%) |
| 65 to 74 Years | 0 (0.0%) | 0 (0.0%) |
| 75 Years and over | 0 (0.0%) | 0 (0.0%) |
| Total | 161 (31.4%) | 25 (15.5%) |
Employment Status by Educational Attainment in Hotevilla Bacavi
According to labor force statistics for Hotevilla Bacavi, 54.6% of individuals (161) out of the total population between 25 and 64 years of age (295) are in the labor force, with 15.5% or 25 of them being unemployed. The group with the highest labor force participation rate are those with the educational attainment of college / associate degree, with 75.5% or 74 individuals in the labor force. Within the labor force, individuals with high school diploma education have the highest percentage of unemployment, with 33.3% or 25 of them being unemployed.
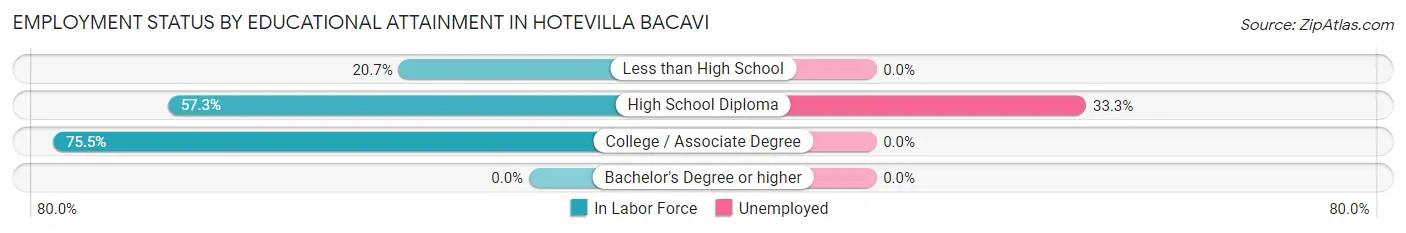
| Educational Attainment | In Labor Force | Unemployed |
| Less than High School | 12 (20.7%) | 0 (0.0%) |
| High School Diploma | 75 (57.3%) | 44 (33.3%) |
| College / Associate Degree | 74 (75.5%) | 0 (0.0%) |
| Bachelor's Degree or higher | 0 (0.0%) | 0 (0.0%) |
| Total | 161 (54.6%) | 46 (15.5%) |
Employment Occupations by Sex in Hotevilla Bacavi
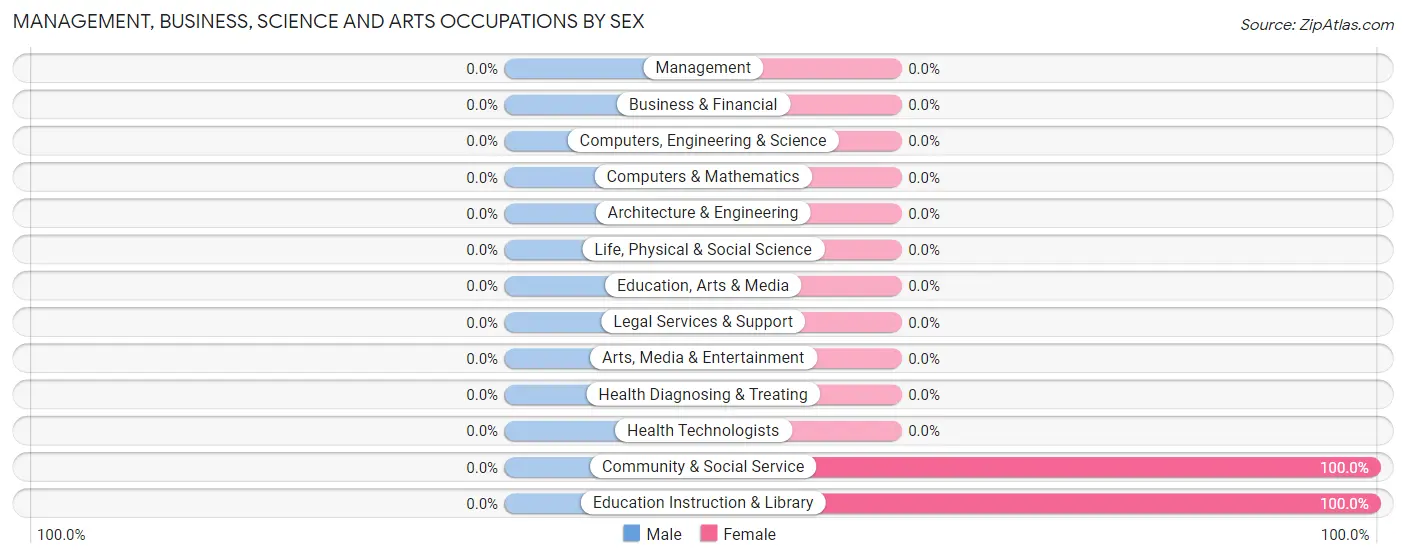
Management, Business, Science and Arts Occupations
The most common Management, Business, Science and Arts occupations in Hotevilla Bacavi are Community & Social Service (9 | 6.6%), and Education Instruction & Library (9 | 6.6%).
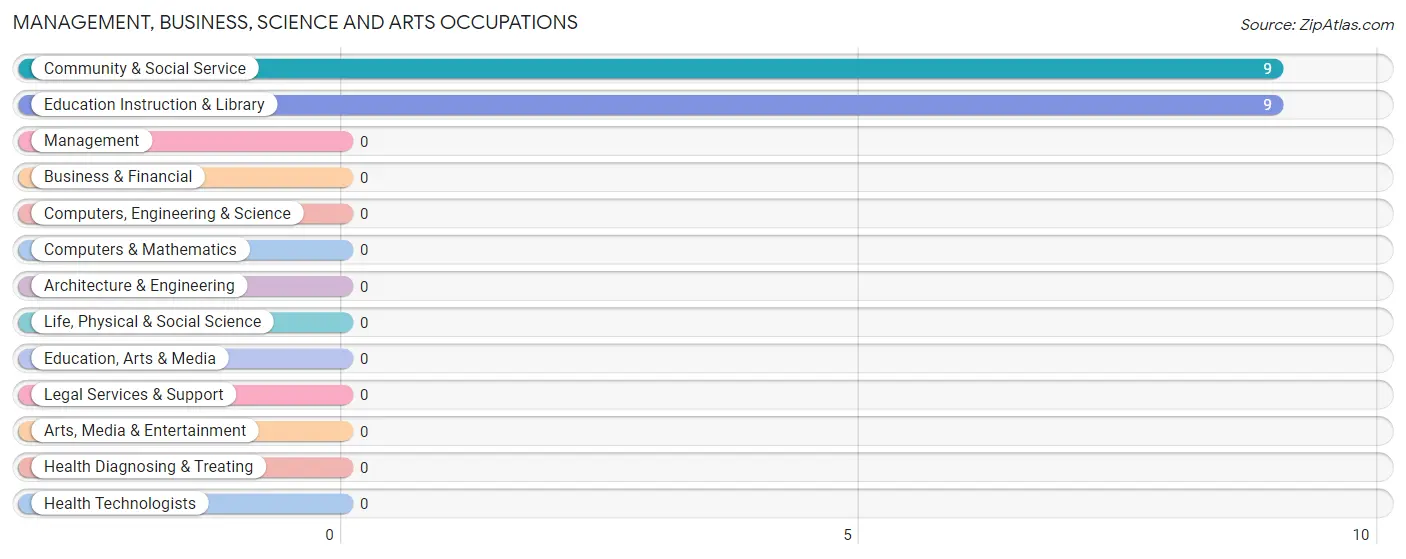
Management, Business, Science and Arts Occupations by Sex
| Occupation | Male | Female |
| Management | 0 (0.0%) | 0 (0.0%) |
| Business & Financial | 0 (0.0%) | 0 (0.0%) |
| Computers, Engineering & Science | 0 (0.0%) | 0 (0.0%) |
| Computers & Mathematics | 0 (0.0%) | 0 (0.0%) |
| Architecture & Engineering | 0 (0.0%) | 0 (0.0%) |
| Life, Physical & Social Science | 0 (0.0%) | 0 (0.0%) |
| Community & Social Service | 0 (0.0%) | 9 (100.0%) |
| Education, Arts & Media | 0 (0.0%) | 0 (0.0%) |
| Legal Services & Support | 0 (0.0%) | 0 (0.0%) |
| Education Instruction & Library | 0 (0.0%) | 9 (100.0%) |
| Arts, Media & Entertainment | 0 (0.0%) | 0 (0.0%) |
| Health Diagnosing & Treating | 0 (0.0%) | 0 (0.0%) |
| Health Technologists | 0 (0.0%) | 0 (0.0%) |
| Total (Category) | 0 (0.0%) | 9 (100.0%) |
| Total (Overall) | 59 (43.4%) | 77 (56.6%) |
Services Occupations
The most common Services occupations in Hotevilla Bacavi are Cleaning & Maintenance (42 | 30.9%), and Personal Care & Service (16 | 11.8%).
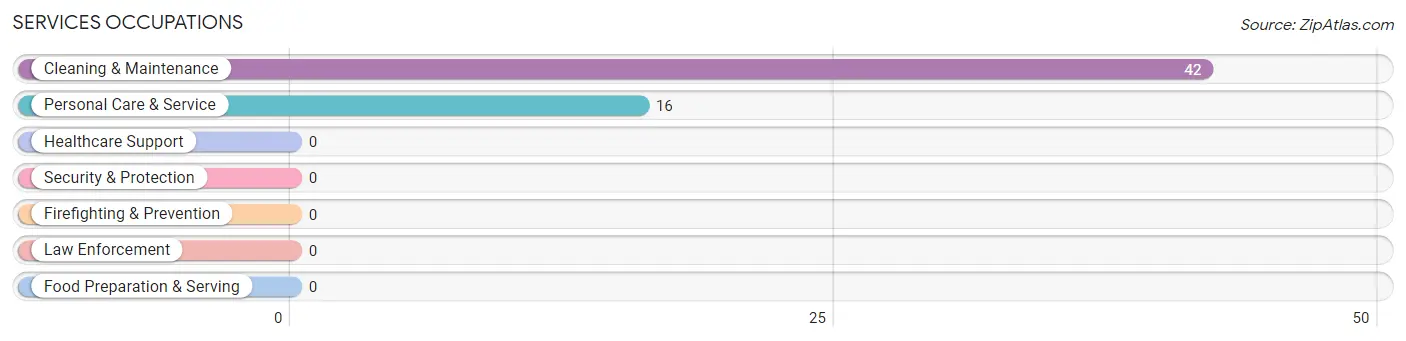
Services Occupations by Sex
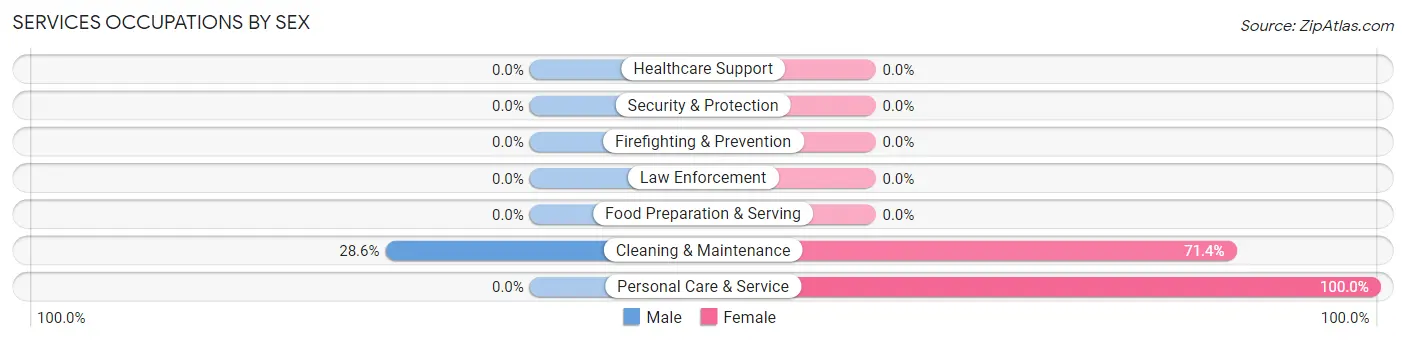
| Occupation | Male | Female |
| Healthcare Support | 0 (0.0%) | 0 (0.0%) |
| Security & Protection | 0 (0.0%) | 0 (0.0%) |
| Firefighting & Prevention | 0 (0.0%) | 0 (0.0%) |
| Law Enforcement | 0 (0.0%) | 0 (0.0%) |
| Food Preparation & Serving | 0 (0.0%) | 0 (0.0%) |
| Cleaning & Maintenance | 12 (28.6%) | 30 (71.4%) |
| Personal Care & Service | 0 (0.0%) | 16 (100.0%) |
| Total (Category) | 12 (20.7%) | 46 (79.3%) |
| Total (Overall) | 59 (43.4%) | 77 (56.6%) |
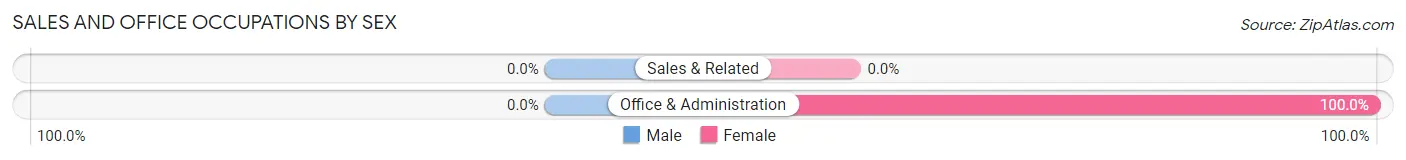
Sales and Office Occupations
The most common Sales and Office occupations in Hotevilla Bacavi are , and Office & Administration (22 | 16.2%).
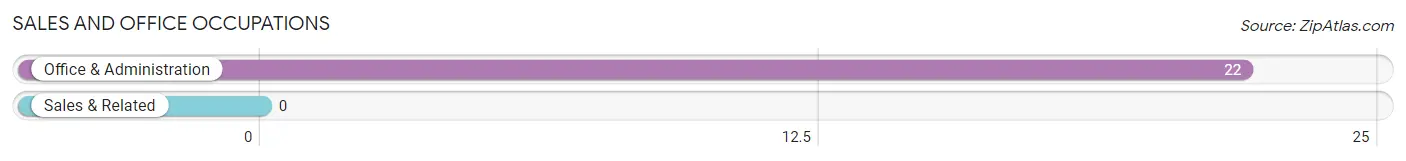
Sales and Office Occupations by Sex
| Occupation | Male | Female |
| Sales & Related | 0 (0.0%) | 0 (0.0%) |
| Office & Administration | 0 (0.0%) | 22 (100.0%) |
| Total (Category) | 0 (0.0%) | 22 (100.0%) |
| Total (Overall) | 59 (43.4%) | 77 (56.6%) |
Natural Resources, Construction and Maintenance Occupations
The most common Natural Resources, Construction and Maintenance occupations in Hotevilla Bacavi are Construction & Extraction (26 | 19.1%), and Installation, Maintenance & Repair (8 | 5.9%).
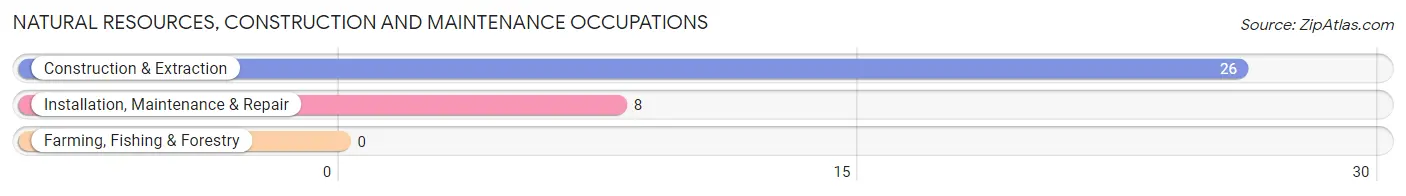
Natural Resources, Construction and Maintenance Occupations by Sex
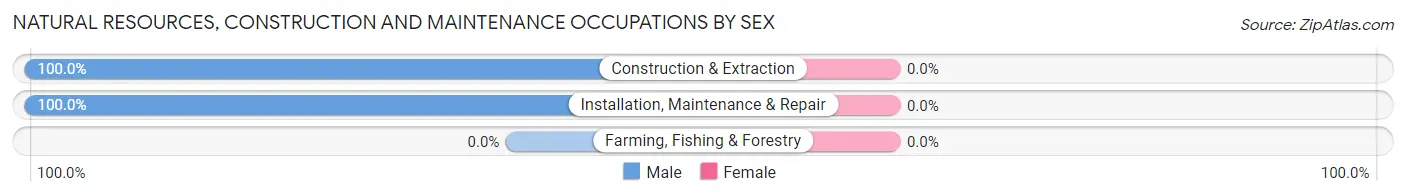
| Occupation | Male | Female |
| Farming, Fishing & Forestry | 0 (0.0%) | 0 (0.0%) |
| Construction & Extraction | 26 (100.0%) | 0 (0.0%) |
| Installation, Maintenance & Repair | 8 (100.0%) | 0 (0.0%) |
| Total (Category) | 34 (100.0%) | 0 (0.0%) |
| Total (Overall) | 59 (43.4%) | 77 (56.6%) |
Production, Transportation and Moving Occupations
The most common Production, Transportation and Moving occupations in Hotevilla Bacavi are Transportation (7 | 5.1%), and Production (6 | 4.4%).
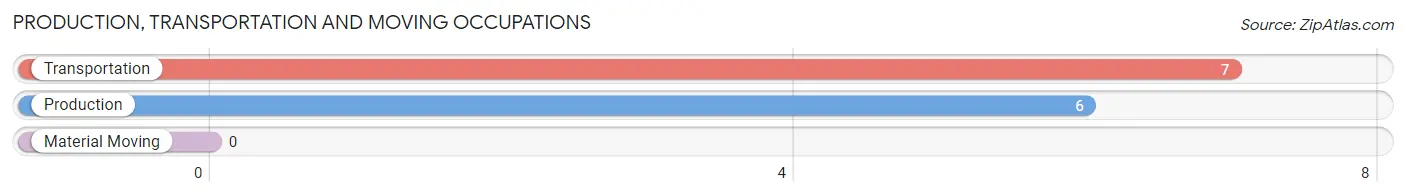
Production, Transportation and Moving Occupations by Sex
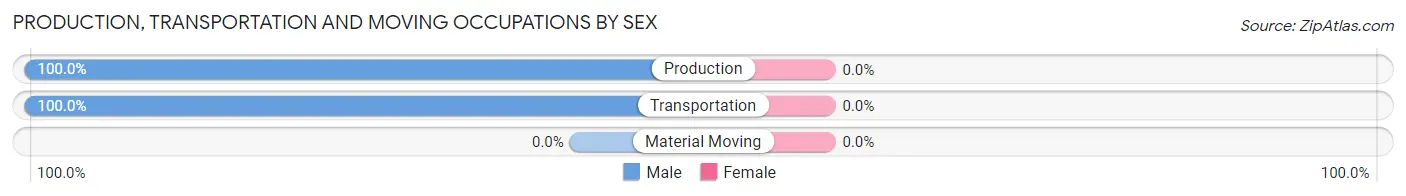
| Occupation | Male | Female |
| Production | 6 (100.0%) | 0 (0.0%) |
| Transportation | 7 (100.0%) | 0 (0.0%) |
| Material Moving | 0 (0.0%) | 0 (0.0%) |
| Total (Category) | 13 (100.0%) | 0 (0.0%) |
| Total (Overall) | 59 (43.4%) | 77 (56.6%) |
Employment Industries by Sex in Hotevilla Bacavi
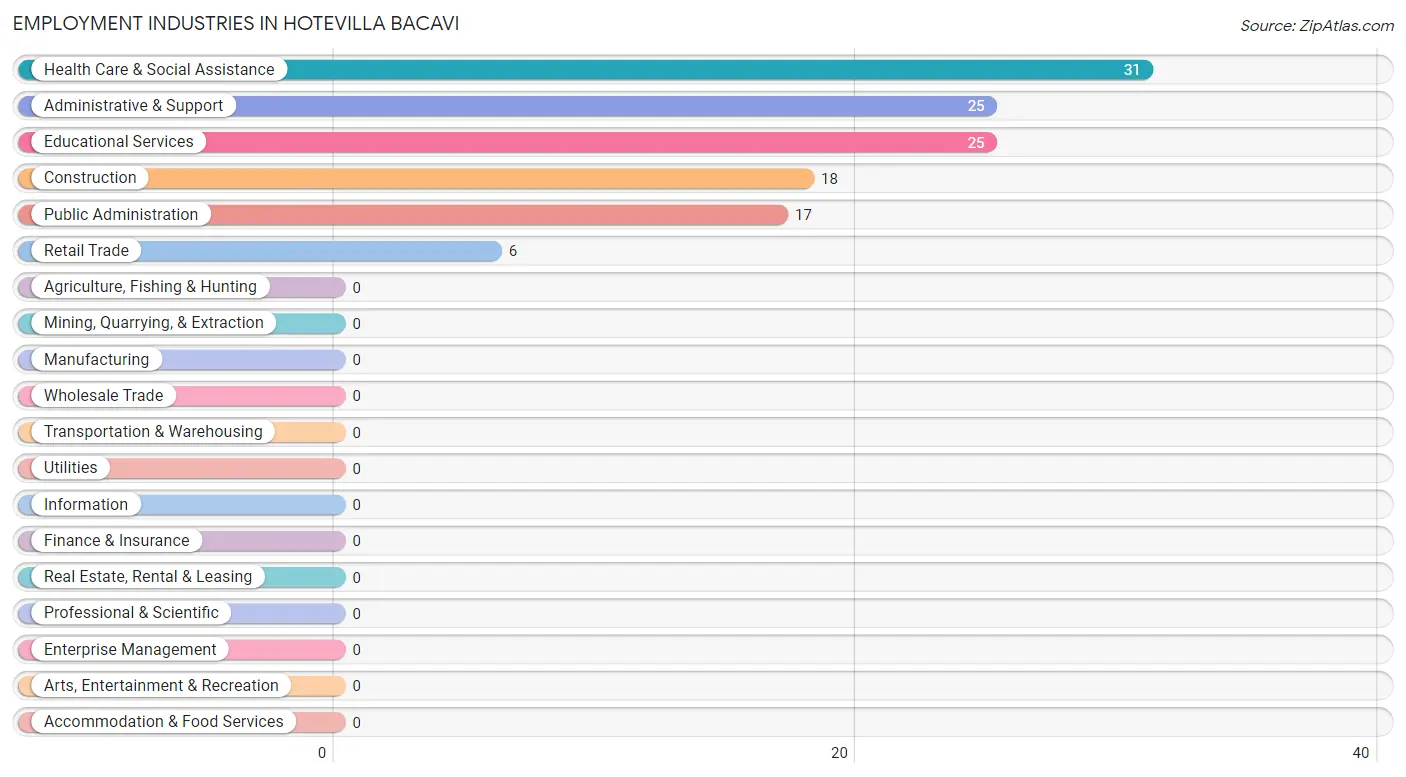
Employment Industries in Hotevilla Bacavi
The major employment industries in Hotevilla Bacavi include Health Care & Social Assistance (31 | 22.8%), Administrative & Support (25 | 18.4%), Educational Services (25 | 18.4%), Construction (18 | 13.2%), and Public Administration (17 | 12.5%).
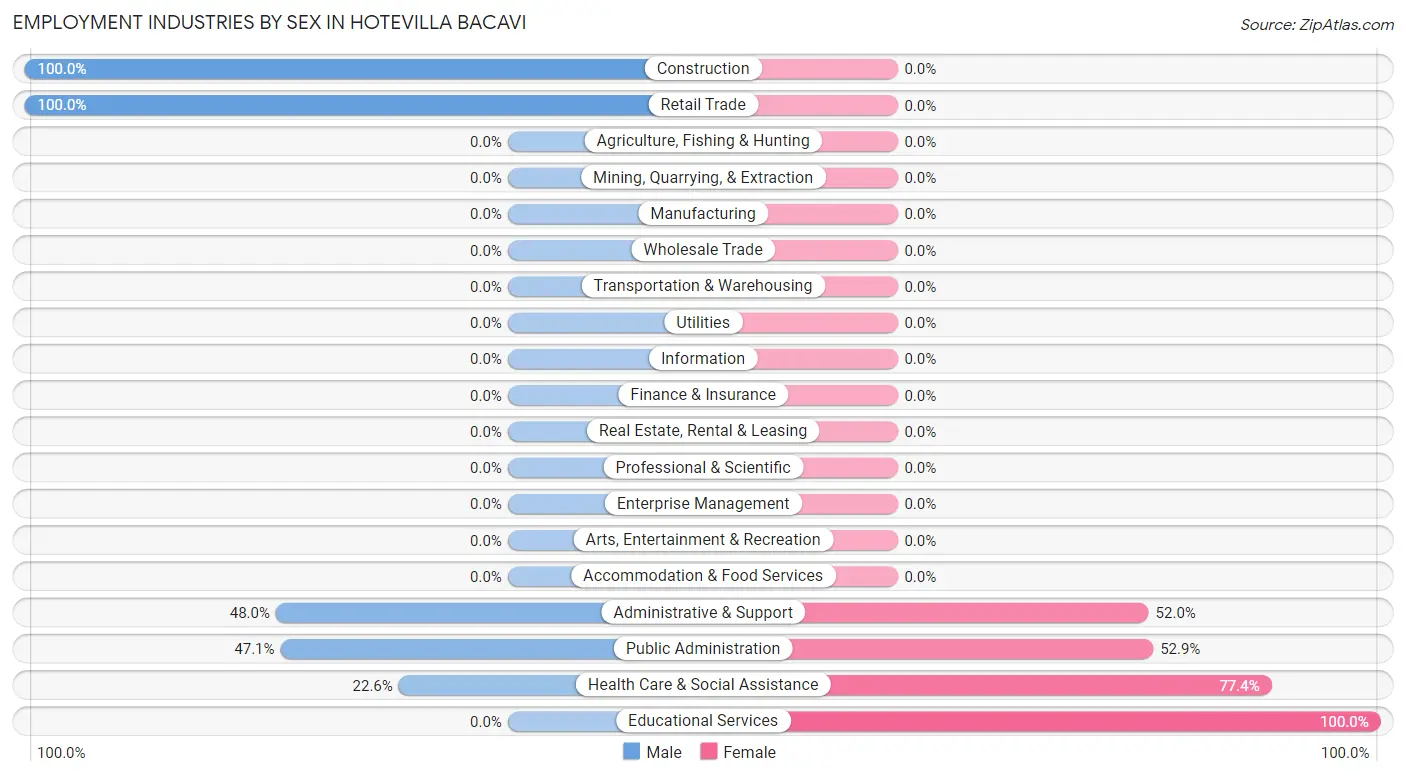
Employment Industries by Sex in Hotevilla Bacavi
The Hotevilla Bacavi industries that see more men than women are Construction (100.0%), Retail Trade (100.0%), and Administrative & Support (48.0%), whereas the industries that tend to have a higher number of women are Educational Services (100.0%), Health Care & Social Assistance (77.4%), and Public Administration (52.9%).
| Industry | Male | Female |
| Agriculture, Fishing & Hunting | 0 (0.0%) | 0 (0.0%) |
| Mining, Quarrying, & Extraction | 0 (0.0%) | 0 (0.0%) |
| Construction | 18 (100.0%) | 0 (0.0%) |
| Manufacturing | 0 (0.0%) | 0 (0.0%) |
| Wholesale Trade | 0 (0.0%) | 0 (0.0%) |
| Retail Trade | 6 (100.0%) | 0 (0.0%) |
| Transportation & Warehousing | 0 (0.0%) | 0 (0.0%) |
| Utilities | 0 (0.0%) | 0 (0.0%) |
| Information | 0 (0.0%) | 0 (0.0%) |
| Finance & Insurance | 0 (0.0%) | 0 (0.0%) |
| Real Estate, Rental & Leasing | 0 (0.0%) | 0 (0.0%) |
| Professional & Scientific | 0 (0.0%) | 0 (0.0%) |
| Enterprise Management | 0 (0.0%) | 0 (0.0%) |
| Administrative & Support | 12 (48.0%) | 13 (52.0%) |
| Educational Services | 0 (0.0%) | 25 (100.0%) |
| Health Care & Social Assistance | 7 (22.6%) | 24 (77.4%) |
| Arts, Entertainment & Recreation | 0 (0.0%) | 0 (0.0%) |
| Accommodation & Food Services | 0 (0.0%) | 0 (0.0%) |
| Public Administration | 8 (47.1%) | 9 (52.9%) |
| Total | 59 (43.4%) | 77 (56.6%) |
Education in Hotevilla Bacavi
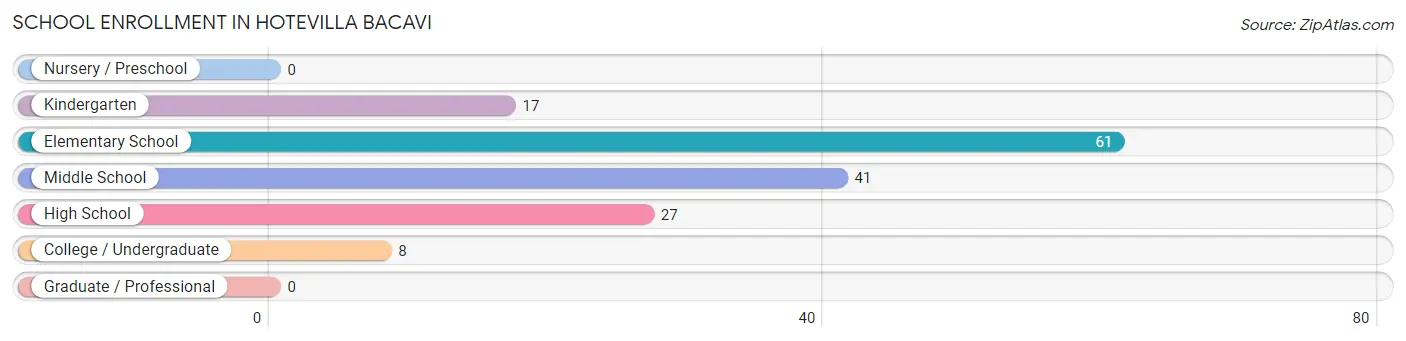
School Enrollment in Hotevilla Bacavi
The most common levels of schooling among the 154 students in Hotevilla Bacavi are elementary school (61 | 39.6%), middle school (41 | 26.6%), and high school (27 | 17.5%).
| School Level | # Students | % Students |
| Nursery / Preschool | 0 | 0.0% |
| Kindergarten | 17 | 11.0% |
| Elementary School | 61 | 39.6% |
| Middle School | 41 | 26.6% |
| High School | 27 | 17.5% |
| College / Undergraduate | 8 | 5.2% |
| Graduate / Professional | 0 | 0.0% |
| Total | 154 | 100.0% |
School Enrollment by Age by Funding Source in Hotevilla Bacavi
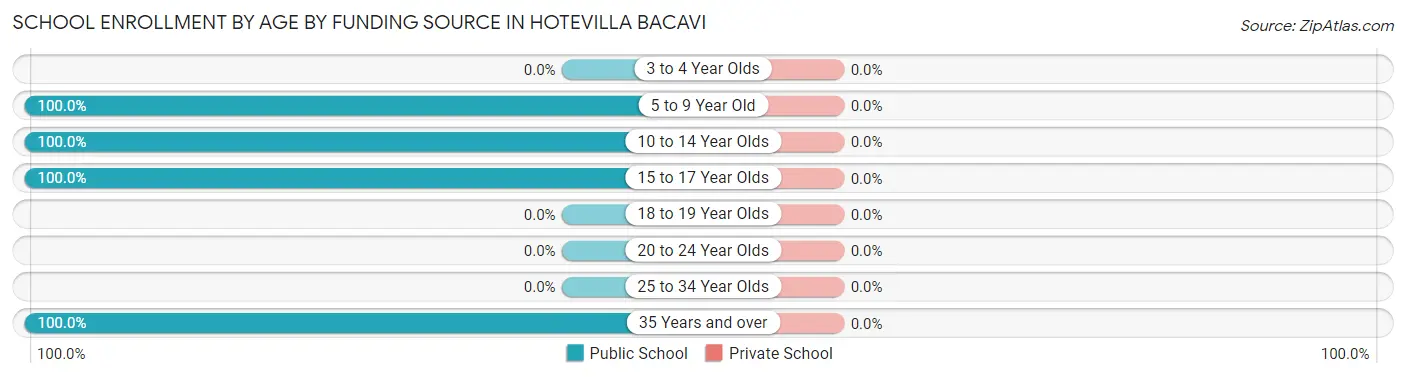
| Age Bracket | Public School | Private School |
| 3 to 4 Year Olds | 0 (0.0%) | 0 (0.0%) |
| 5 to 9 Year Old | 78 (100.0%) | 0 (0.0%) |
| 10 to 14 Year Olds | 42 (100.0%) | 0 (0.0%) |
| 15 to 17 Year Olds | 26 (100.0%) | 0 (0.0%) |
| 18 to 19 Year Olds | 0 (0.0%) | 0 (0.0%) |
| 20 to 24 Year Olds | 0 (0.0%) | 0 (0.0%) |
| 25 to 34 Year Olds | 0 (0.0%) | 0 (0.0%) |
| 35 Years and over | 8 (100.0%) | 0 (0.0%) |
| Total | 154 (100.0%) | 0 (0.0%) |
Educational Attainment by Field of Study in Hotevilla Bacavi
Education (8 | 57.1%), and science & technology (6 | 42.9%) are the most common fields of study among 14 individuals in Hotevilla Bacavi who have obtained a bachelor's degree or higher.
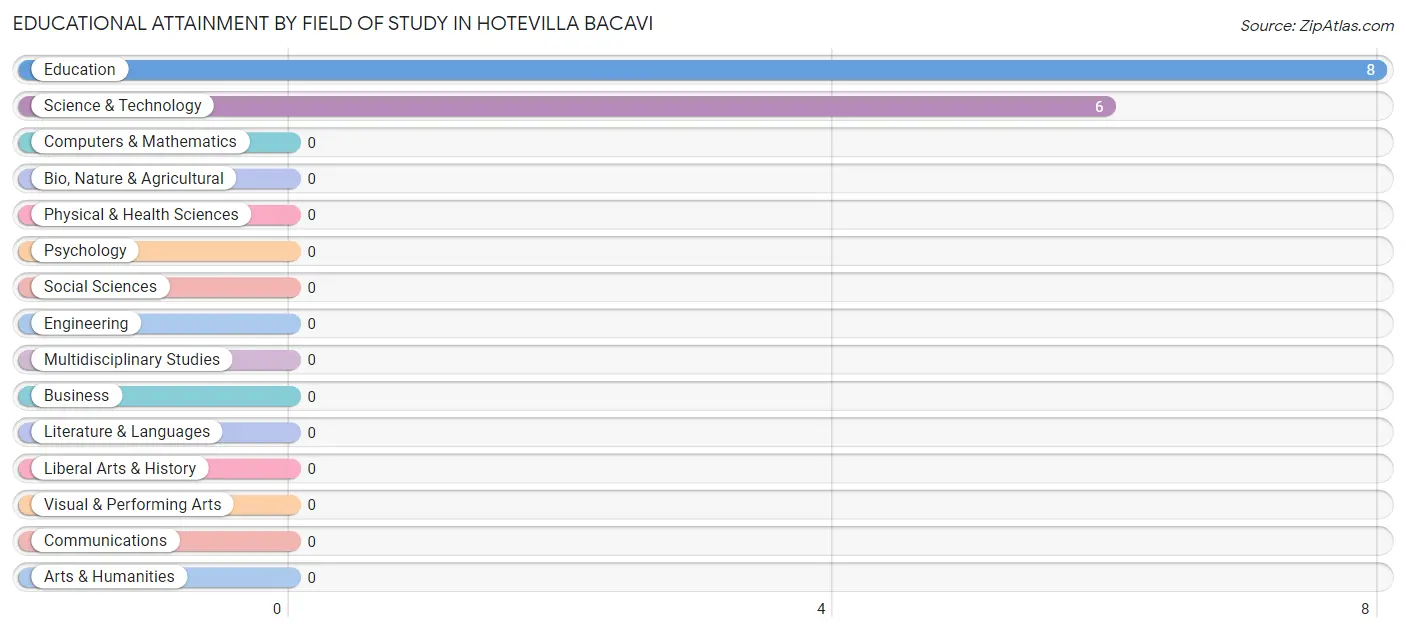
| Field of Study | # Graduates | % Graduates |
| Computers & Mathematics | 0 | 0.0% |
| Bio, Nature & Agricultural | 0 | 0.0% |
| Physical & Health Sciences | 0 | 0.0% |
| Psychology | 0 | 0.0% |
| Social Sciences | 0 | 0.0% |
| Engineering | 0 | 0.0% |
| Multidisciplinary Studies | 0 | 0.0% |
| Science & Technology | 6 | 42.9% |
| Business | 0 | 0.0% |
| Education | 8 | 57.1% |
| Literature & Languages | 0 | 0.0% |
| Liberal Arts & History | 0 | 0.0% |
| Visual & Performing Arts | 0 | 0.0% |
| Communications | 0 | 0.0% |
| Arts & Humanities | 0 | 0.0% |
| Total | 14 | 100.0% |
Transportation & Commute in Hotevilla Bacavi
Vehicle Availability by Sex in Hotevilla Bacavi
The most prevalent vehicle ownership categories in Hotevilla Bacavi are males with 1 vehicle (44, accounting for 74.6%) and females with 1 vehicle (37, making up 57.1%).
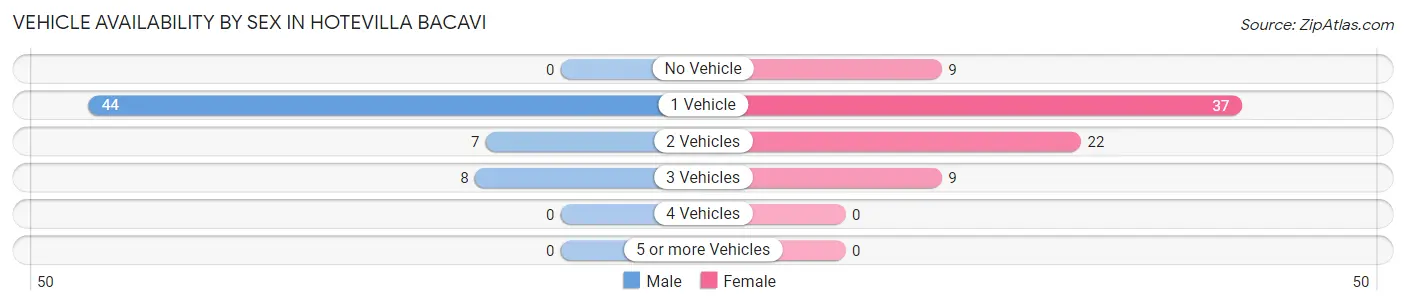
| Vehicles Available | Male | Female |
| No Vehicle | 0 (0.0%) | 9 (11.7%) |
| 1 Vehicle | 44 (74.6%) | 37 (48.0%) |
| 2 Vehicles | 7 (11.9%) | 22 (28.6%) |
| 3 Vehicles | 8 (13.6%) | 9 (11.7%) |
| 4 Vehicles | 0 (0.0%) | 0 (0.0%) |
| 5 or more Vehicles | 0 (0.0%) | 0 (0.0%) |
| Total | 59 (100.0%) | 77 (100.0%) |
Commute Time in Hotevilla Bacavi
The most frequently occuring commute durations in Hotevilla Bacavi are 10 to 14 minutes (34 commuters, 29.6%), 15 to 19 minutes (29 commuters, 25.2%), and 30 to 34 minutes (22 commuters, 19.1%).
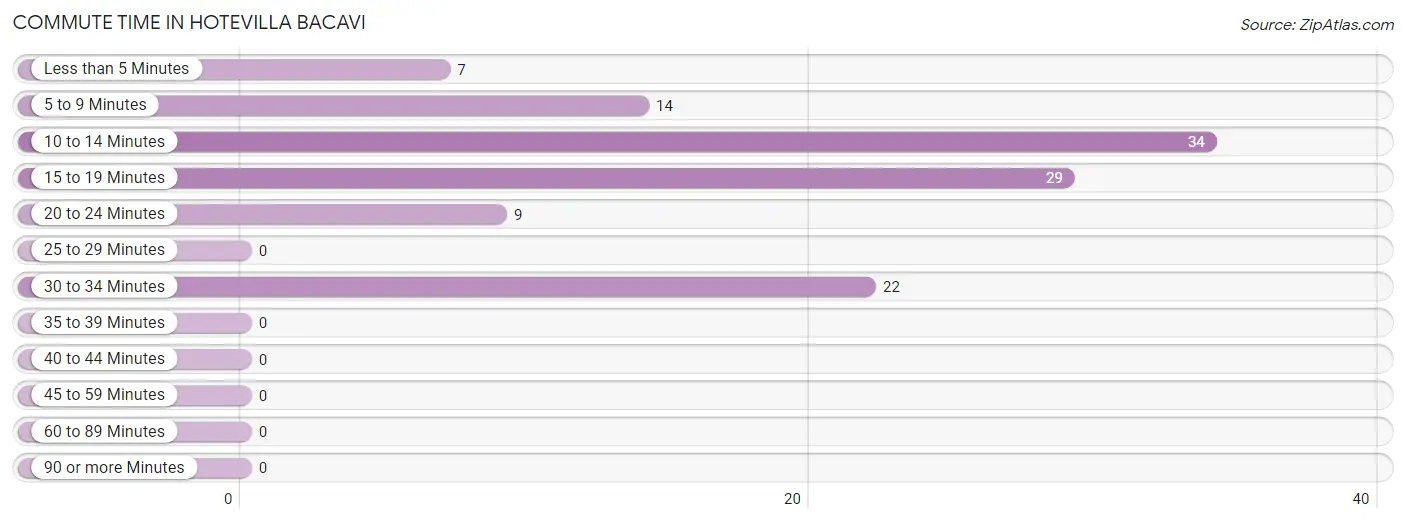
| Commute Time | # Commuters | % Commuters |
| Less than 5 Minutes | 7 | 6.1% |
| 5 to 9 Minutes | 14 | 12.2% |
| 10 to 14 Minutes | 34 | 29.6% |
| 15 to 19 Minutes | 29 | 25.2% |
| 20 to 24 Minutes | 9 | 7.8% |
| 25 to 29 Minutes | 0 | 0.0% |
| 30 to 34 Minutes | 22 | 19.1% |
| 35 to 39 Minutes | 0 | 0.0% |
| 40 to 44 Minutes | 0 | 0.0% |
| 45 to 59 Minutes | 0 | 0.0% |
| 60 to 89 Minutes | 0 | 0.0% |
| 90 or more Minutes | 0 | 0.0% |
Commute Time by Sex in Hotevilla Bacavi
The most common commute times in Hotevilla Bacavi are 15 to 19 minutes (20 commuters, 52.6%) for males and 10 to 14 minutes (23 commuters, 29.9%) for females.
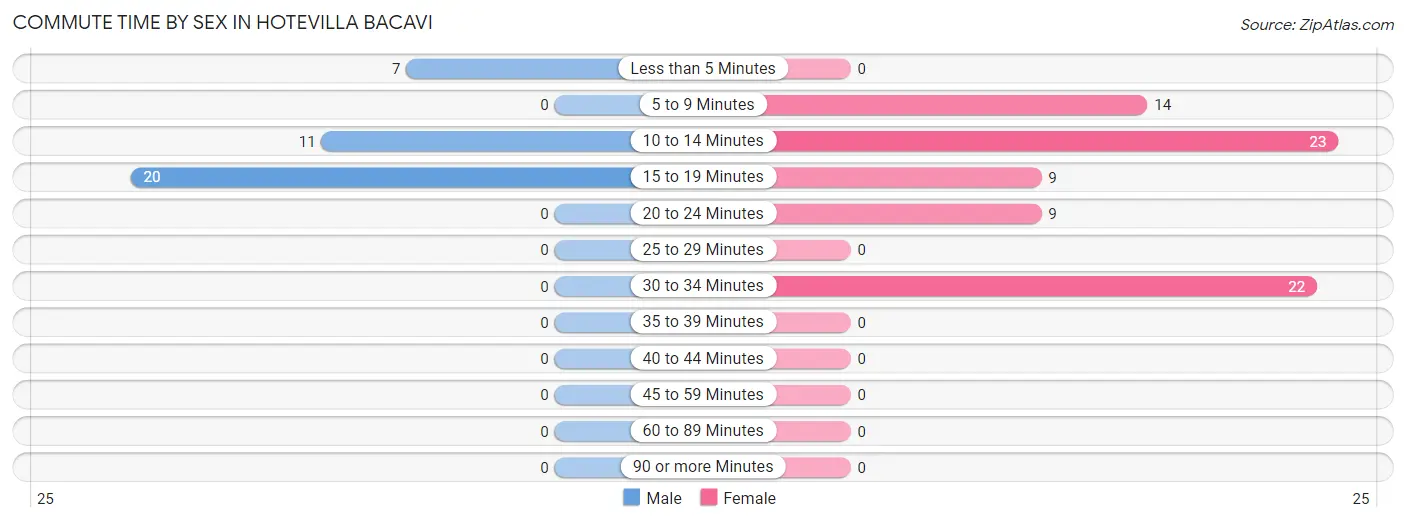
| Commute Time | Male | Female |
| Less than 5 Minutes | 7 (18.4%) | 0 (0.0%) |
| 5 to 9 Minutes | 0 (0.0%) | 14 (18.2%) |
| 10 to 14 Minutes | 11 (28.9%) | 23 (29.9%) |
| 15 to 19 Minutes | 20 (52.6%) | 9 (11.7%) |
| 20 to 24 Minutes | 0 (0.0%) | 9 (11.7%) |
| 25 to 29 Minutes | 0 (0.0%) | 0 (0.0%) |
| 30 to 34 Minutes | 0 (0.0%) | 22 (28.6%) |
| 35 to 39 Minutes | 0 (0.0%) | 0 (0.0%) |
| 40 to 44 Minutes | 0 (0.0%) | 0 (0.0%) |
| 45 to 59 Minutes | 0 (0.0%) | 0 (0.0%) |
| 60 to 89 Minutes | 0 (0.0%) | 0 (0.0%) |
| 90 or more Minutes | 0 (0.0%) | 0 (0.0%) |
Time of Departure to Work by Sex in Hotevilla Bacavi
The most frequent times of departure to work in Hotevilla Bacavi are 7:00 AM to 7:29 AM (15, 39.5%) for males and 7:30 AM to 7:59 AM (15, 19.5%) for females.
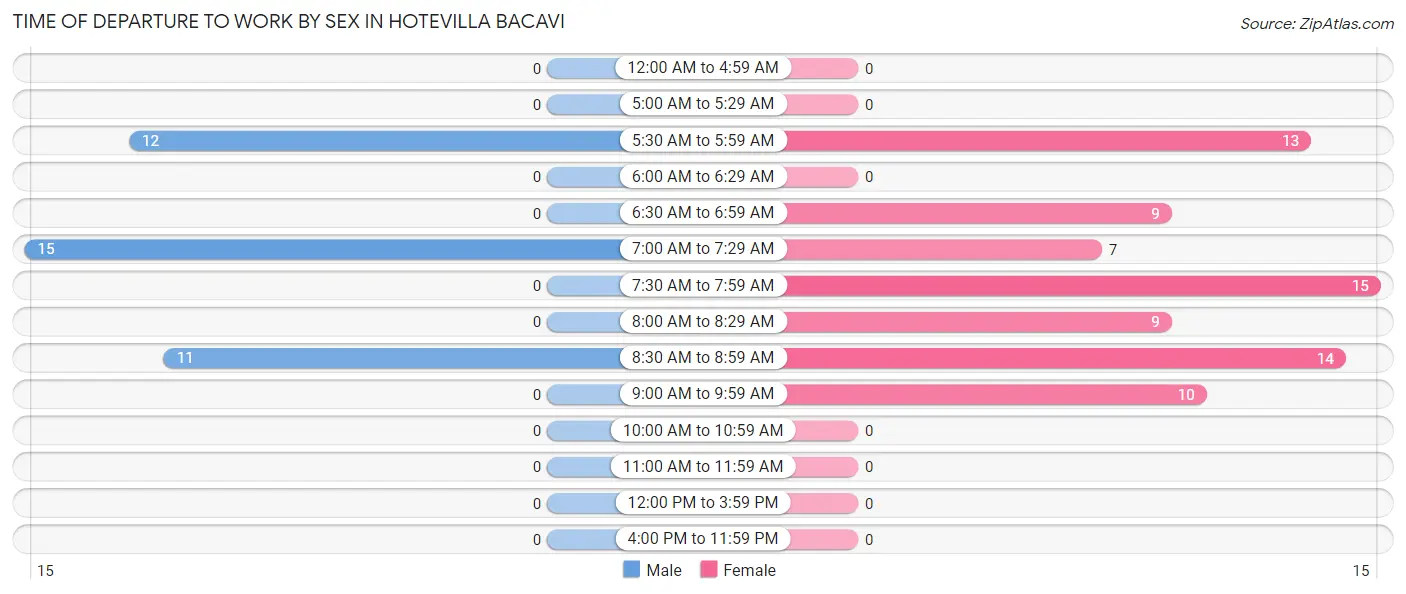
| Time of Departure | Male | Female |
| 12:00 AM to 4:59 AM | 0 (0.0%) | 0 (0.0%) |
| 5:00 AM to 5:29 AM | 0 (0.0%) | 0 (0.0%) |
| 5:30 AM to 5:59 AM | 12 (31.6%) | 13 (16.9%) |
| 6:00 AM to 6:29 AM | 0 (0.0%) | 0 (0.0%) |
| 6:30 AM to 6:59 AM | 0 (0.0%) | 9 (11.7%) |
| 7:00 AM to 7:29 AM | 15 (39.5%) | 7 (9.1%) |
| 7:30 AM to 7:59 AM | 0 (0.0%) | 15 (19.5%) |
| 8:00 AM to 8:29 AM | 0 (0.0%) | 9 (11.7%) |
| 8:30 AM to 8:59 AM | 11 (28.9%) | 14 (18.2%) |
| 9:00 AM to 9:59 AM | 0 (0.0%) | 10 (13.0%) |
| 10:00 AM to 10:59 AM | 0 (0.0%) | 0 (0.0%) |
| 11:00 AM to 11:59 AM | 0 (0.0%) | 0 (0.0%) |
| 12:00 PM to 3:59 PM | 0 (0.0%) | 0 (0.0%) |
| 4:00 PM to 11:59 PM | 0 (0.0%) | 0 (0.0%) |
| Total | 38 (100.0%) | 77 (100.0%) |
Housing Occupancy in Hotevilla Bacavi
Occupancy by Ownership in Hotevilla Bacavi
Of the total 229 dwellings in Hotevilla Bacavi, owner-occupied units account for 200 (87.3%), while renter-occupied units make up 29 (12.7%).
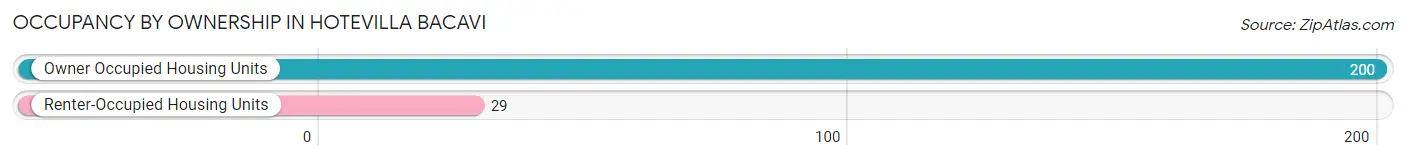
| Occupancy | # Housing Units | % Housing Units |
| Owner Occupied Housing Units | 200 | 87.3% |
| Renter-Occupied Housing Units | 29 | 12.7% |
| Total Occupied Housing Units | 229 | 100.0% |
Occupancy by Household Size in Hotevilla Bacavi
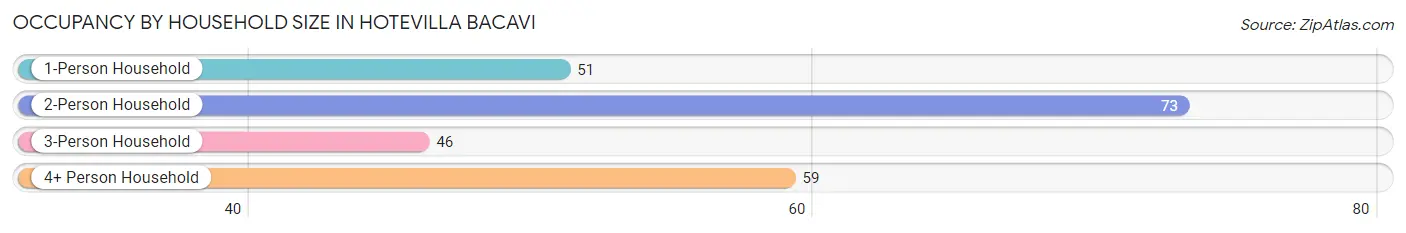
| Household Size | # Housing Units | % Housing Units |
| 1-Person Household | 51 | 22.3% |
| 2-Person Household | 73 | 31.9% |
| 3-Person Household | 46 | 20.1% |
| 4+ Person Household | 59 | 25.8% |
| Total Housing Units | 229 | 100.0% |
Occupancy by Ownership by Household Size in Hotevilla Bacavi
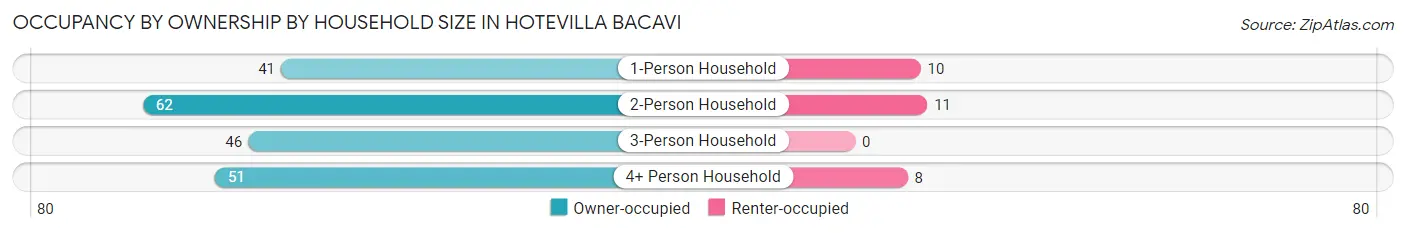
| Household Size | Owner-occupied | Renter-occupied |
| 1-Person Household | 41 (80.4%) | 10 (19.6%) |
| 2-Person Household | 62 (84.9%) | 11 (15.1%) |
| 3-Person Household | 46 (100.0%) | 0 (0.0%) |
| 4+ Person Household | 51 (86.4%) | 8 (13.6%) |
| Total Housing Units | 200 (87.3%) | 29 (12.7%) |
Occupancy by Educational Attainment in Hotevilla Bacavi
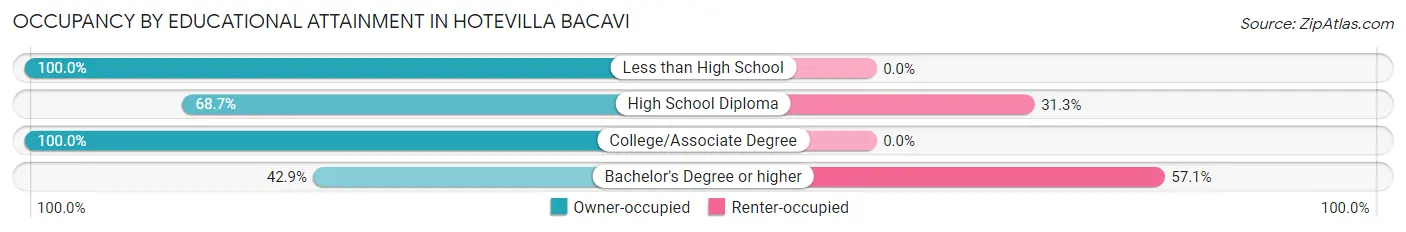
| Household Size | Owner-occupied | Renter-occupied |
| Less than High School | 48 (100.0%) | 0 (0.0%) |
| High School Diploma | 46 (68.7%) | 21 (31.3%) |
| College/Associate Degree | 100 (100.0%) | 0 (0.0%) |
| Bachelor's Degree or higher | 6 (42.9%) | 8 (57.1%) |
Occupancy by Age of Householder in Hotevilla Bacavi
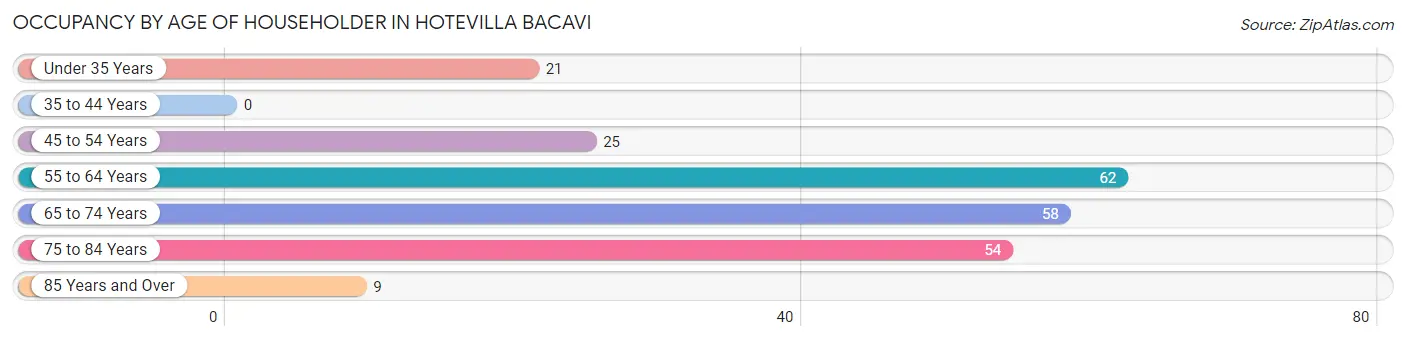
| Age Bracket | # Households | % Households |
| Under 35 Years | 21 | 9.2% |
| 35 to 44 Years | 0 | 0.0% |
| 45 to 54 Years | 25 | 10.9% |
| 55 to 64 Years | 62 | 27.1% |
| 65 to 74 Years | 58 | 25.3% |
| 75 to 84 Years | 54 | 23.6% |
| 85 Years and Over | 9 | 3.9% |
| Total | 229 | 100.0% |
Housing Finances in Hotevilla Bacavi
Median Income by Occupancy in Hotevilla Bacavi
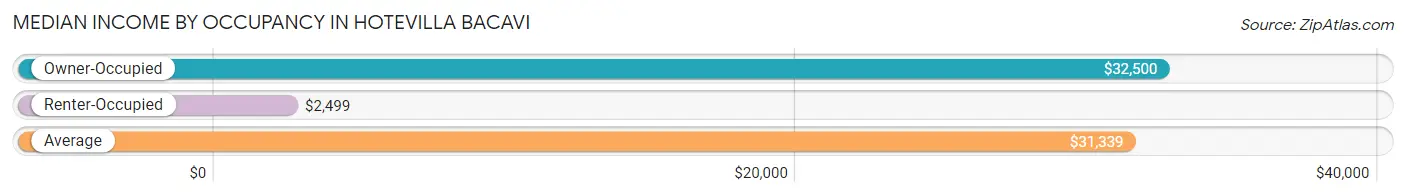
| Occupancy Type | # Households | Median Income |
| Owner-Occupied | 200 (87.3%) | $32,500 |
| Renter-Occupied | 29 (12.7%) | $2,499 |
| Average | 229 (100.0%) | $31,339 |
Occupancy by Householder Income Bracket in Hotevilla Bacavi
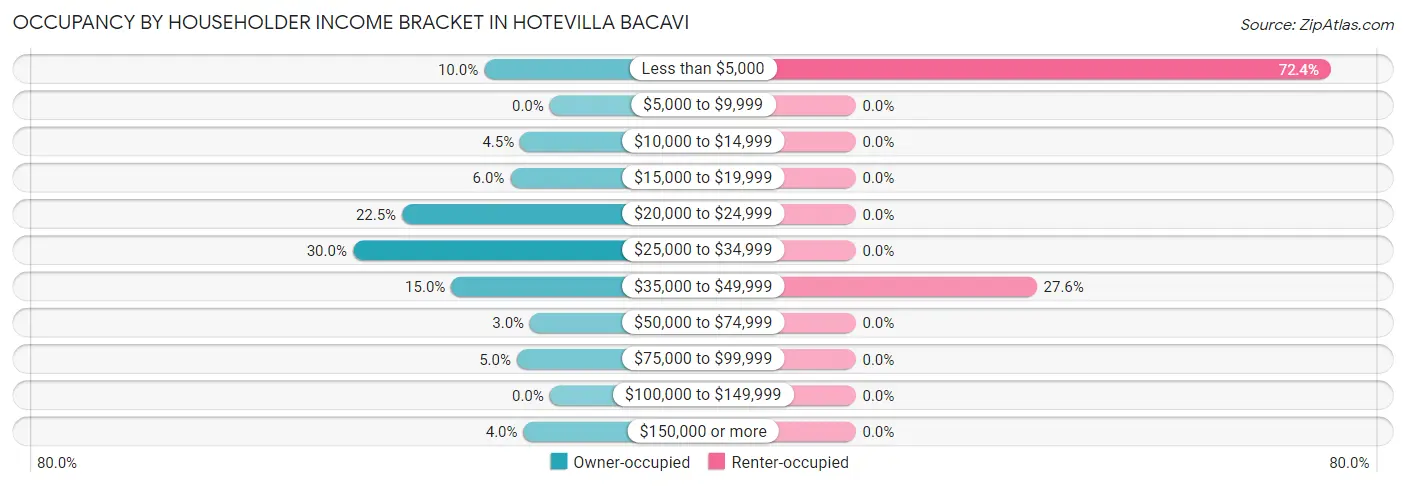
| Income Bracket | Owner-occupied | Renter-occupied |
| Less than $5,000 | 20 (10.0%) | 21 (72.4%) |
| $5,000 to $9,999 | 0 (0.0%) | 0 (0.0%) |
| $10,000 to $14,999 | 9 (4.5%) | 0 (0.0%) |
| $15,000 to $19,999 | 12 (6.0%) | 0 (0.0%) |
| $20,000 to $24,999 | 45 (22.5%) | 0 (0.0%) |
| $25,000 to $34,999 | 60 (30.0%) | 0 (0.0%) |
| $35,000 to $49,999 | 30 (15.0%) | 8 (27.6%) |
| $50,000 to $74,999 | 6 (3.0%) | 0 (0.0%) |
| $75,000 to $99,999 | 10 (5.0%) | 0 (0.0%) |
| $100,000 to $149,999 | 0 (0.0%) | 0 (0.0%) |
| $150,000 or more | 8 (4.0%) | 0 (0.0%) |
| Total | 200 (100.0%) | 29 (100.0%) |
Monthly Housing Cost Tiers in Hotevilla Bacavi
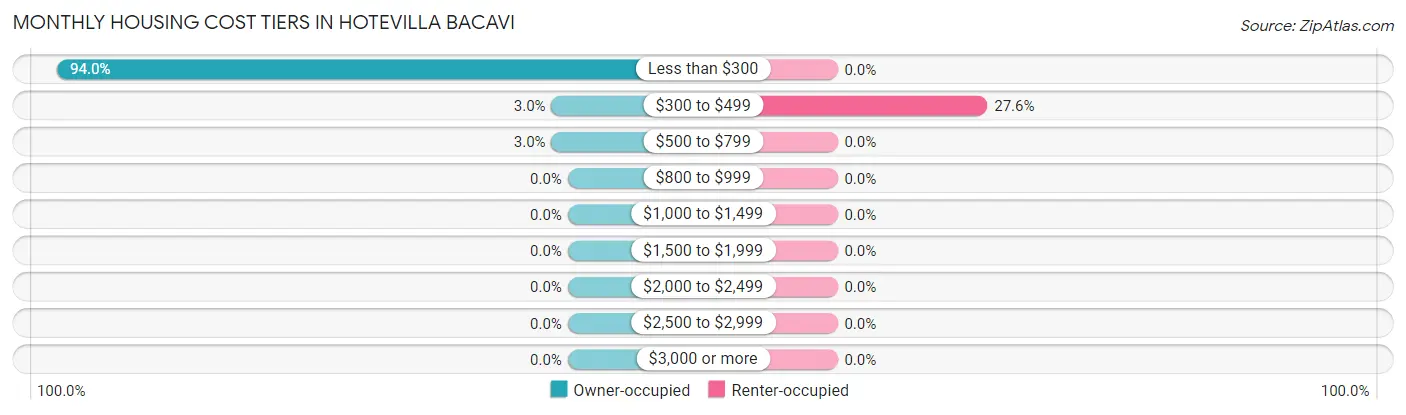
| Monthly Cost | Owner-occupied | Renter-occupied |
| Less than $300 | 188 (94.0%) | 0 (0.0%) |
| $300 to $499 | 6 (3.0%) | 8 (27.6%) |
| $500 to $799 | 6 (3.0%) | 0 (0.0%) |
| $800 to $999 | 0 (0.0%) | 0 (0.0%) |
| $1,000 to $1,499 | 0 (0.0%) | 0 (0.0%) |
| $1,500 to $1,999 | 0 (0.0%) | 0 (0.0%) |
| $2,000 to $2,499 | 0 (0.0%) | 0 (0.0%) |
| $2,500 to $2,999 | 0 (0.0%) | 0 (0.0%) |
| $3,000 or more | 0 (0.0%) | 0 (0.0%) |
| Total | 200 (100.0%) | 29 (100.0%) |
Physical Housing Characteristics in Hotevilla Bacavi
Housing Structures in Hotevilla Bacavi
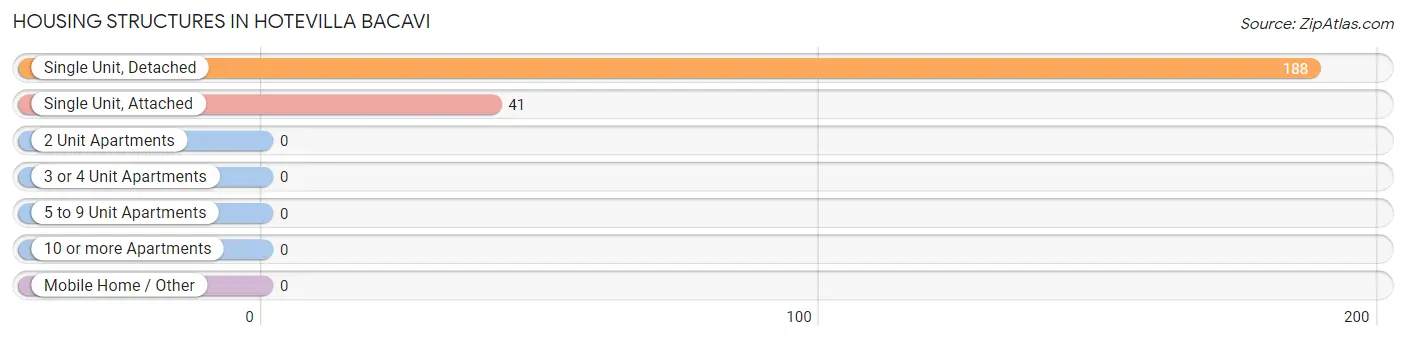
| Structure Type | # Housing Units | % Housing Units |
| Single Unit, Detached | 188 | 82.1% |
| Single Unit, Attached | 41 | 17.9% |
| 2 Unit Apartments | 0 | 0.0% |
| 3 or 4 Unit Apartments | 0 | 0.0% |
| 5 to 9 Unit Apartments | 0 | 0.0% |
| 10 or more Apartments | 0 | 0.0% |
| Mobile Home / Other | 0 | 0.0% |
| Total | 229 | 100.0% |
Housing Structures by Occupancy in Hotevilla Bacavi
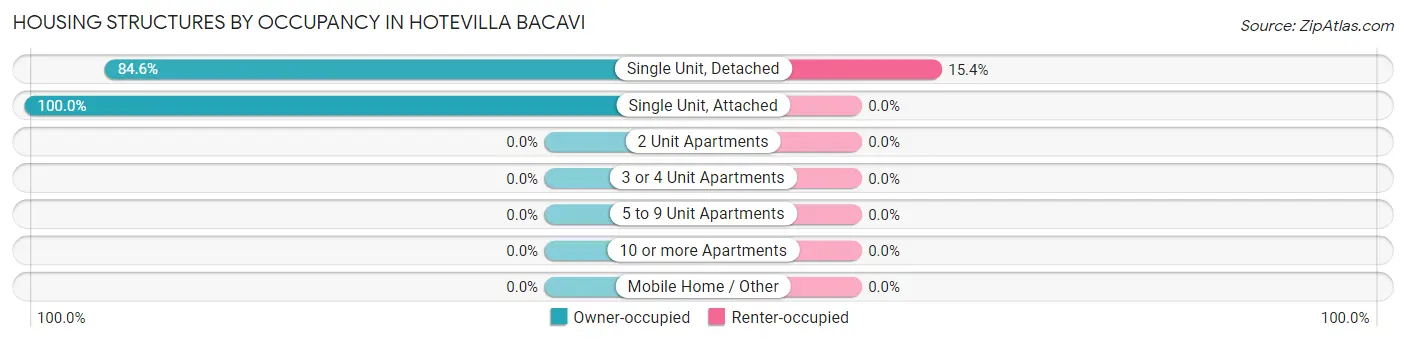
| Structure Type | Owner-occupied | Renter-occupied |
| Single Unit, Detached | 159 (84.6%) | 29 (15.4%) |
| Single Unit, Attached | 41 (100.0%) | 0 (0.0%) |
| 2 Unit Apartments | 0 (0.0%) | 0 (0.0%) |
| 3 or 4 Unit Apartments | 0 (0.0%) | 0 (0.0%) |
| 5 to 9 Unit Apartments | 0 (0.0%) | 0 (0.0%) |
| 10 or more Apartments | 0 (0.0%) | 0 (0.0%) |
| Mobile Home / Other | 0 (0.0%) | 0 (0.0%) |
| Total | 200 (87.3%) | 29 (12.7%) |
Housing Structures by Number of Rooms in Hotevilla Bacavi
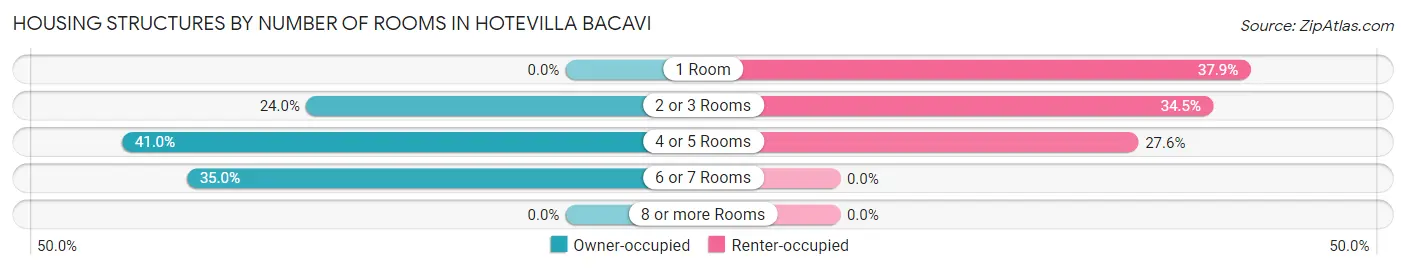
| Number of Rooms | Owner-occupied | Renter-occupied |
| 1 Room | 0 (0.0%) | 11 (37.9%) |
| 2 or 3 Rooms | 48 (24.0%) | 10 (34.5%) |
| 4 or 5 Rooms | 82 (41.0%) | 8 (27.6%) |
| 6 or 7 Rooms | 70 (35.0%) | 0 (0.0%) |
| 8 or more Rooms | 0 (0.0%) | 0 (0.0%) |
| Total | 200 (100.0%) | 29 (100.0%) |
Housing Structure by Heating Type in Hotevilla Bacavi
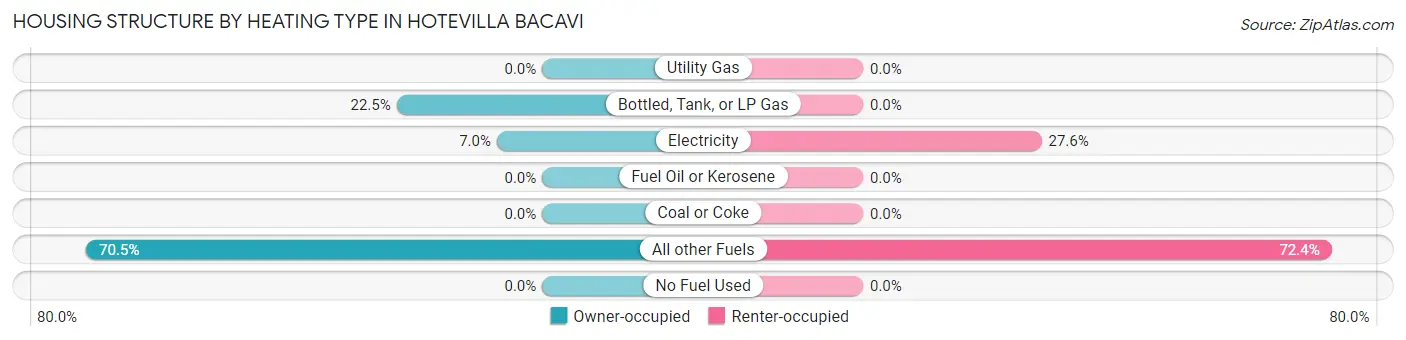
| Heating Type | Owner-occupied | Renter-occupied |
| Utility Gas | 0 (0.0%) | 0 (0.0%) |
| Bottled, Tank, or LP Gas | 45 (22.5%) | 0 (0.0%) |
| Electricity | 14 (7.0%) | 8 (27.6%) |
| Fuel Oil or Kerosene | 0 (0.0%) | 0 (0.0%) |
| Coal or Coke | 0 (0.0%) | 0 (0.0%) |
| All other Fuels | 141 (70.5%) | 21 (72.4%) |
| No Fuel Used | 0 (0.0%) | 0 (0.0%) |
| Total | 200 (100.0%) | 29 (100.0%) |
Household Vehicle Usage in Hotevilla Bacavi
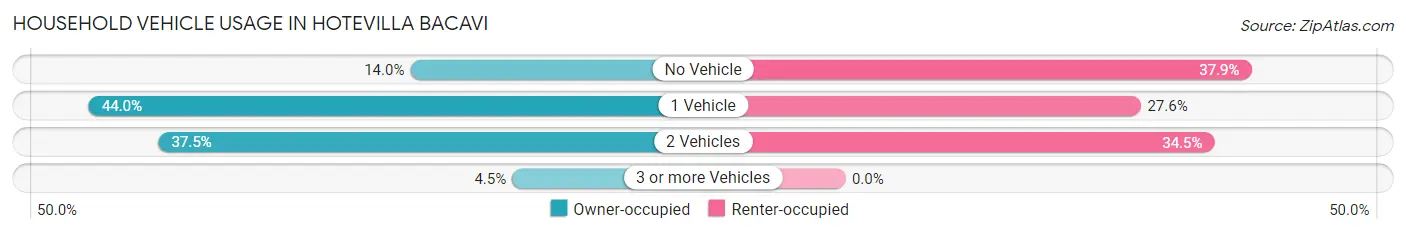
| Vehicles per Household | Owner-occupied | Renter-occupied |
| No Vehicle | 28 (14.0%) | 11 (37.9%) |
| 1 Vehicle | 88 (44.0%) | 8 (27.6%) |
| 2 Vehicles | 75 (37.5%) | 10 (34.5%) |
| 3 or more Vehicles | 9 (4.5%) | 0 (0.0%) |
| Total | 200 (100.0%) | 29 (100.0%) |
Real Estate & Mortgages in Hotevilla Bacavi
Real Estate and Mortgage Overview in Hotevilla Bacavi
| Characteristic | Without Mortgage | With Mortgage |
| Housing Units | 194 | 6 |
| Median Property Value | $135,700 | $0 |
| Median Household Income | $32,663 | $0 |
| Monthly Housing Costs | $211 | $0 |
| Real Estate Taxes | - | - |
Property Value by Mortgage Status in Hotevilla Bacavi
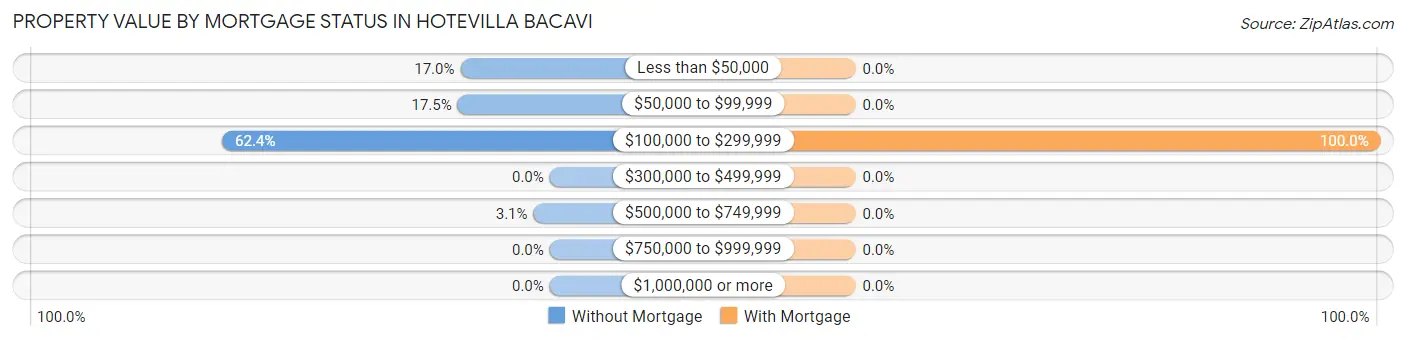
| Property Value | Without Mortgage | With Mortgage |
| Less than $50,000 | 33 (17.0%) | 0 (0.0%) |
| $50,000 to $99,999 | 34 (17.5%) | 0 (0.0%) |
| $100,000 to $299,999 | 121 (62.4%) | 6 (100.0%) |
| $300,000 to $499,999 | 0 (0.0%) | 0 (0.0%) |
| $500,000 to $749,999 | 6 (3.1%) | 0 (0.0%) |
| $750,000 to $999,999 | 0 (0.0%) | 0 (0.0%) |
| $1,000,000 or more | 0 (0.0%) | 0 (0.0%) |
| Total | 194 (100.0%) | 6 (100.0%) |
Household Income by Mortgage Status in Hotevilla Bacavi
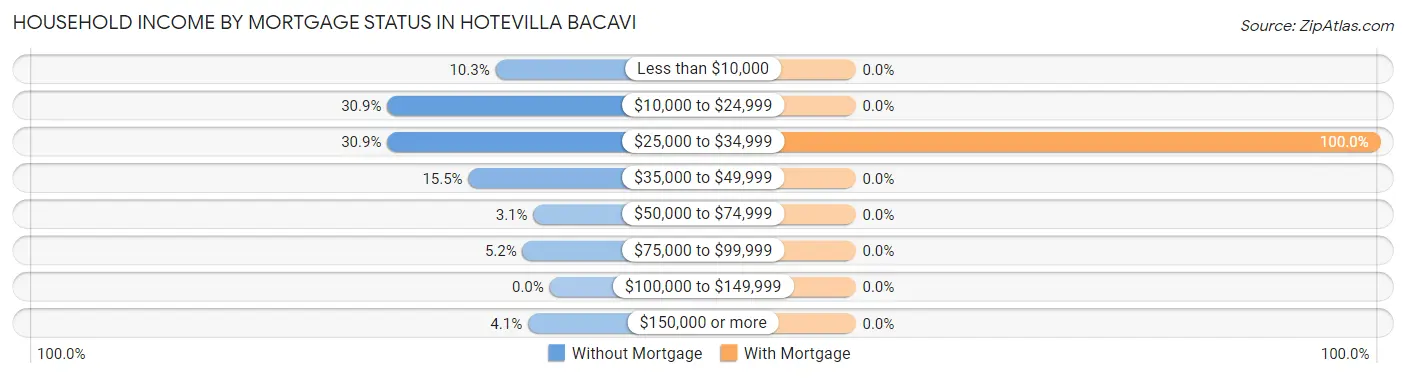
| Household Income | Without Mortgage | With Mortgage |
| Less than $10,000 | 20 (10.3%) | 0 (0.0%) |
| $10,000 to $24,999 | 60 (30.9%) | 0 (0.0%) |
| $25,000 to $34,999 | 60 (30.9%) | 6 (100.0%) |
| $35,000 to $49,999 | 30 (15.5%) | 0 (0.0%) |
| $50,000 to $74,999 | 6 (3.1%) | 0 (0.0%) |
| $75,000 to $99,999 | 10 (5.1%) | 0 (0.0%) |
| $100,000 to $149,999 | 0 (0.0%) | 0 (0.0%) |
| $150,000 or more | 8 (4.1%) | 0 (0.0%) |
| Total | 194 (100.0%) | 6 (100.0%) |
Property Value to Household Income Ratio in Hotevilla Bacavi
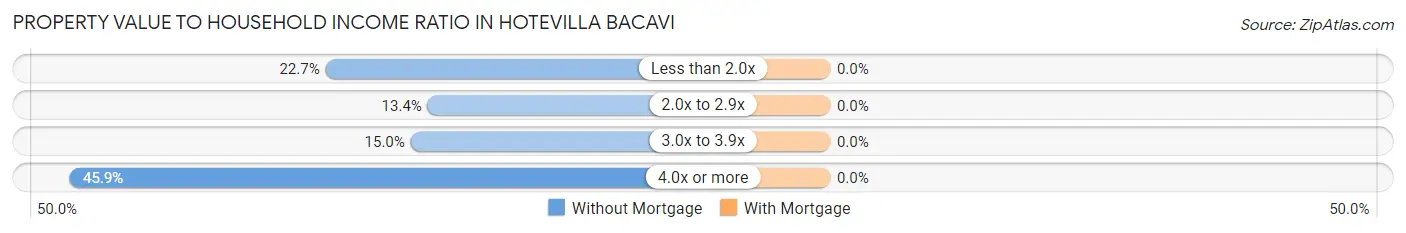
| Value-to-Income Ratio | Without Mortgage | With Mortgage |
| Less than 2.0x | 44 (22.7%) | 0 (0.0%) |
| 2.0x to 2.9x | 26 (13.4%) | 0 (0.0%) |
| 3.0x to 3.9x | 29 (14.9%) | 0 (0.0%) |
| 4.0x or more | 89 (45.9%) | 0 (0.0%) |
| Total | 194 (100.0%) | 6 (100.0%) |
Real Estate Taxes by Mortgage Status in Hotevilla Bacavi
| Property Taxes | Without Mortgage | With Mortgage |
| Less than $800 | 0 (0.0%) | 0 (0.0%) |
| $800 to $1,499 | 0 (0.0%) | 0 (0.0%) |
| $800 to $1,499 | 0 (0.0%) | 0 (0.0%) |
| Total | 194 (100.0%) | 6 (100.0%) |
Health & Disability in Hotevilla Bacavi
Health Insurance Coverage by Age in Hotevilla Bacavi
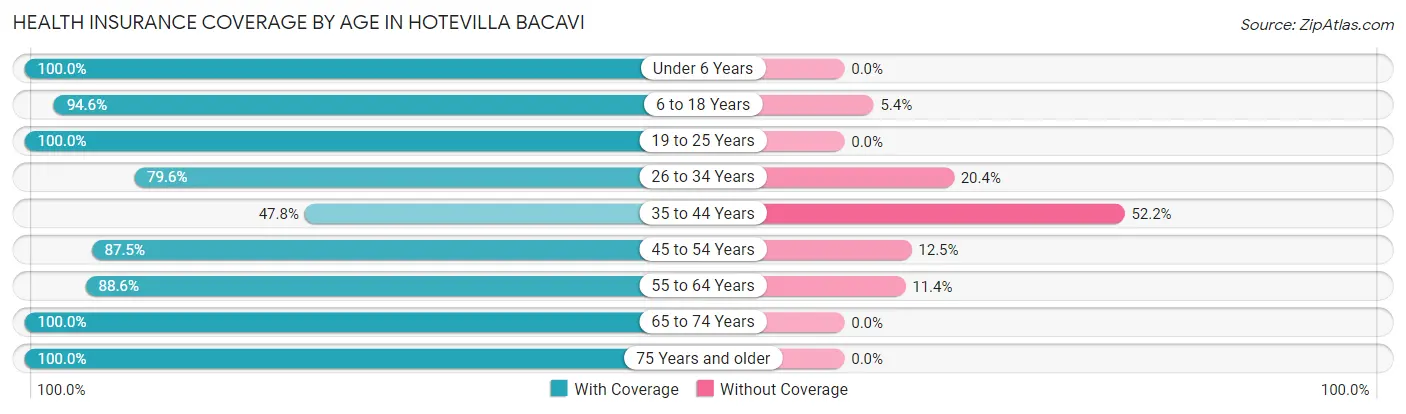
| Age Bracket | With Coverage | Without Coverage |
| Under 6 Years | 28 (100.0%) | 0 (0.0%) |
| 6 to 18 Years | 139 (94.6%) | 8 (5.4%) |
| 19 to 25 Years | 11 (100.0%) | 0 (0.0%) |
| 26 to 34 Years | 39 (79.6%) | 10 (20.4%) |
| 35 to 44 Years | 32 (47.8%) | 35 (52.2%) |
| 45 to 54 Years | 49 (87.5%) | 7 (12.5%) |
| 55 to 64 Years | 109 (88.6%) | 14 (11.4%) |
| 65 to 74 Years | 87 (100.0%) | 0 (0.0%) |
| 75 Years and older | 110 (100.0%) | 0 (0.0%) |
| Total | 604 (89.1%) | 74 (10.9%) |
Health Insurance Coverage by Citizenship Status in Hotevilla Bacavi
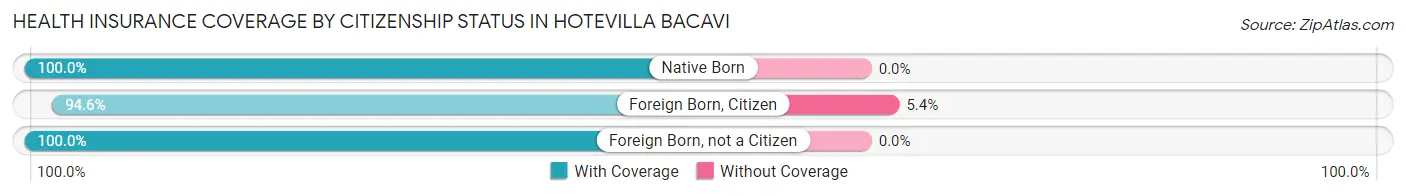
| Citizenship Status | With Coverage | Without Coverage |
| Native Born | 28 (100.0%) | 0 (0.0%) |
| Foreign Born, Citizen | 139 (94.6%) | 8 (5.4%) |
| Foreign Born, not a Citizen | 11 (100.0%) | 0 (0.0%) |
Health Insurance Coverage by Household Income in Hotevilla Bacavi
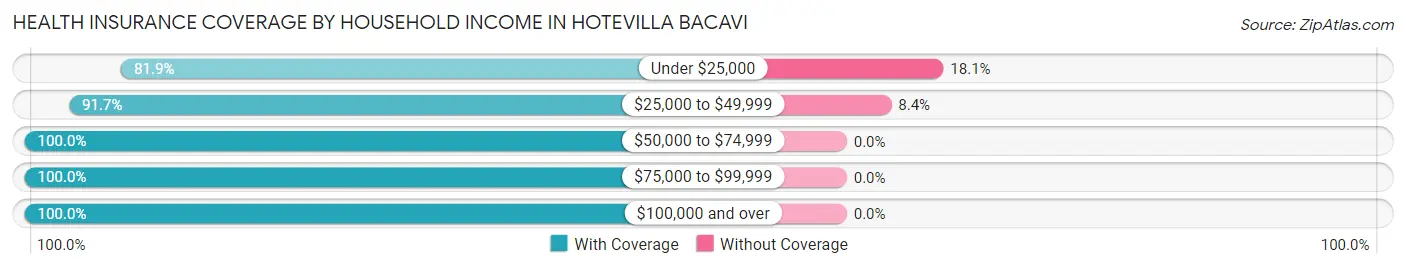
| Household Income | With Coverage | Without Coverage |
| Under $25,000 | 172 (81.9%) | 38 (18.1%) |
| $25,000 to $49,999 | 395 (91.6%) | 36 (8.4%) |
| $50,000 to $74,999 | 6 (100.0%) | 0 (0.0%) |
| $75,000 to $99,999 | 16 (100.0%) | 0 (0.0%) |
| $100,000 and over | 15 (100.0%) | 0 (0.0%) |
Public vs Private Health Insurance Coverage by Age in Hotevilla Bacavi
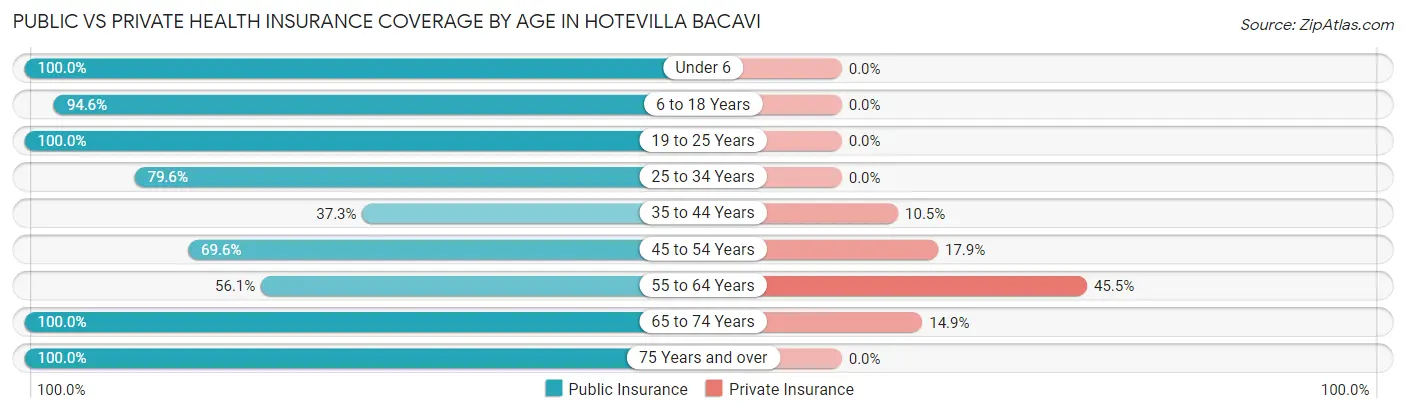
| Age Bracket | Public Insurance | Private Insurance |
| Under 6 | 28 (100.0%) | 0 (0.0%) |
| 6 to 18 Years | 139 (94.6%) | 0 (0.0%) |
| 19 to 25 Years | 11 (100.0%) | 0 (0.0%) |
| 25 to 34 Years | 39 (79.6%) | 0 (0.0%) |
| 35 to 44 Years | 25 (37.3%) | 7 (10.4%) |
| 45 to 54 Years | 39 (69.6%) | 10 (17.9%) |
| 55 to 64 Years | 69 (56.1%) | 56 (45.5%) |
| 65 to 74 Years | 87 (100.0%) | 13 (14.9%) |
| 75 Years and over | 110 (100.0%) | 0 (0.0%) |
| Total | 547 (80.7%) | 86 (12.7%) |
Disability Status by Sex by Age in Hotevilla Bacavi
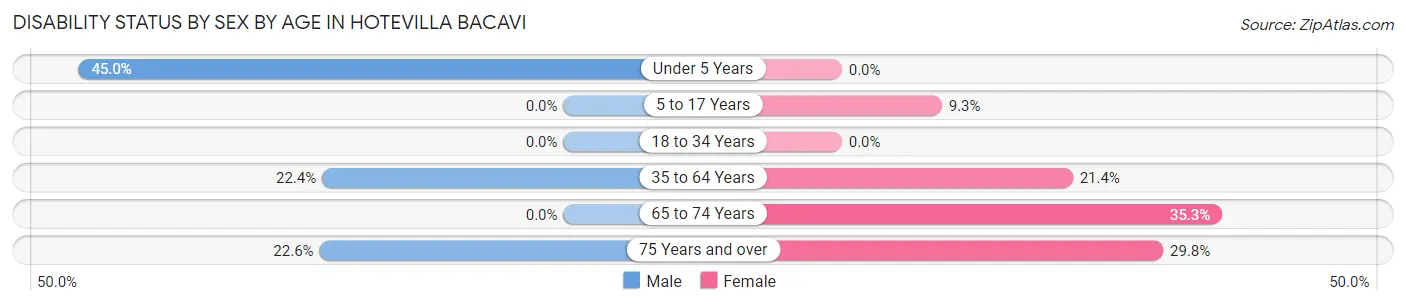
| Age Bracket | Male | Female |
| Under 5 Years | 9 (45.0%) | 0 (0.0%) |
| 5 to 17 Years | 0 (0.0%) | 9 (9.3%) |
| 18 to 34 Years | 0 (0.0%) | 0 (0.0%) |
| 35 to 64 Years | 30 (22.4%) | 24 (21.4%) |
| 65 to 74 Years | 0 (0.0%) | 18 (35.3%) |
| 75 Years and over | 12 (22.6%) | 17 (29.8%) |
Disability Class by Sex by Age in Hotevilla Bacavi
Disability Class: Hearing Difficulty
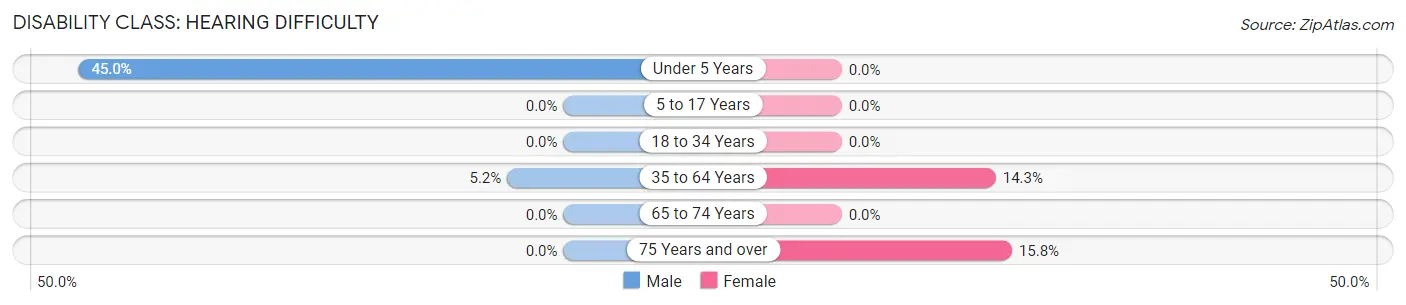
| Age Bracket | Male | Female |
| Under 5 Years | 9 (45.0%) | 0 (0.0%) |
| 5 to 17 Years | 0 (0.0%) | 0 (0.0%) |
| 18 to 34 Years | 0 (0.0%) | 0 (0.0%) |
| 35 to 64 Years | 7 (5.2%) | 16 (14.3%) |
| 65 to 74 Years | 0 (0.0%) | 0 (0.0%) |
| 75 Years and over | 0 (0.0%) | 9 (15.8%) |
Disability Class: Vision Difficulty
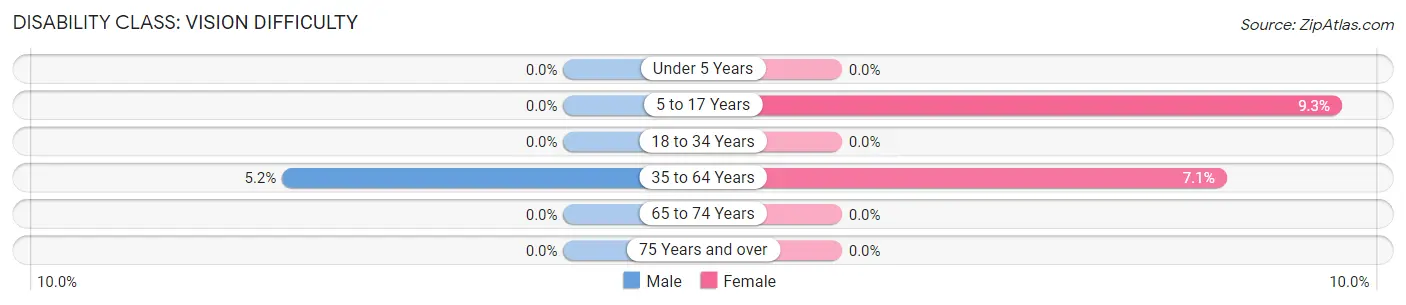
| Age Bracket | Male | Female |
| Under 5 Years | 0 (0.0%) | 0 (0.0%) |
| 5 to 17 Years | 0 (0.0%) | 9 (9.3%) |
| 18 to 34 Years | 0 (0.0%) | 0 (0.0%) |
| 35 to 64 Years | 7 (5.2%) | 8 (7.1%) |
| 65 to 74 Years | 0 (0.0%) | 0 (0.0%) |
| 75 Years and over | 0 (0.0%) | 0 (0.0%) |
Disability Class: Cognitive Difficulty
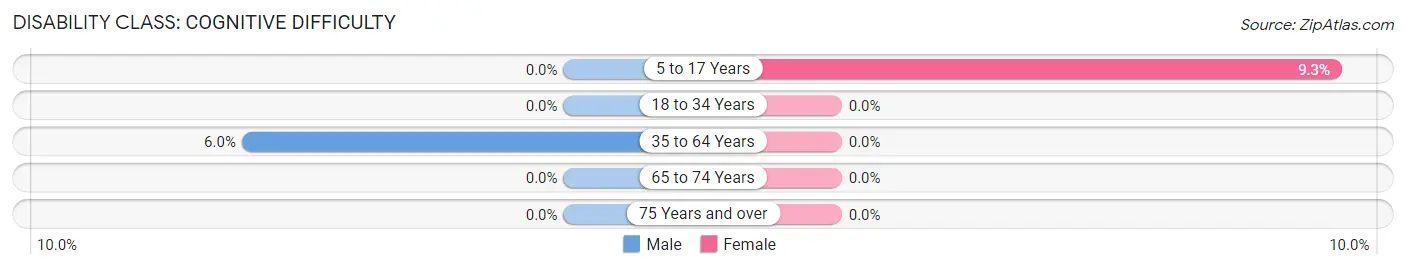
| Age Bracket | Male | Female |
| 5 to 17 Years | 0 (0.0%) | 9 (9.3%) |
| 18 to 34 Years | 0 (0.0%) | 0 (0.0%) |
| 35 to 64 Years | 8 (6.0%) | 0 (0.0%) |
| 65 to 74 Years | 0 (0.0%) | 0 (0.0%) |
| 75 Years and over | 0 (0.0%) | 0 (0.0%) |
Disability Class: Ambulatory Difficulty
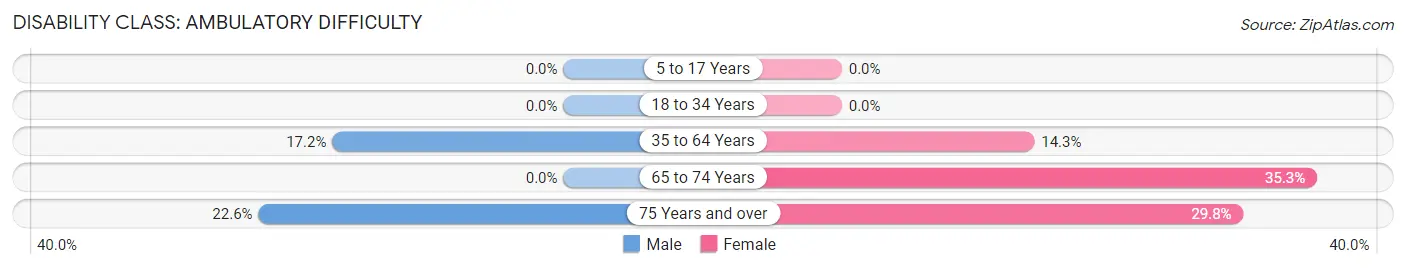
| Age Bracket | Male | Female |
| 5 to 17 Years | 0 (0.0%) | 0 (0.0%) |
| 18 to 34 Years | 0 (0.0%) | 0 (0.0%) |
| 35 to 64 Years | 23 (17.2%) | 16 (14.3%) |
| 65 to 74 Years | 0 (0.0%) | 18 (35.3%) |
| 75 Years and over | 12 (22.6%) | 17 (29.8%) |
Disability Class: Self-Care Difficulty
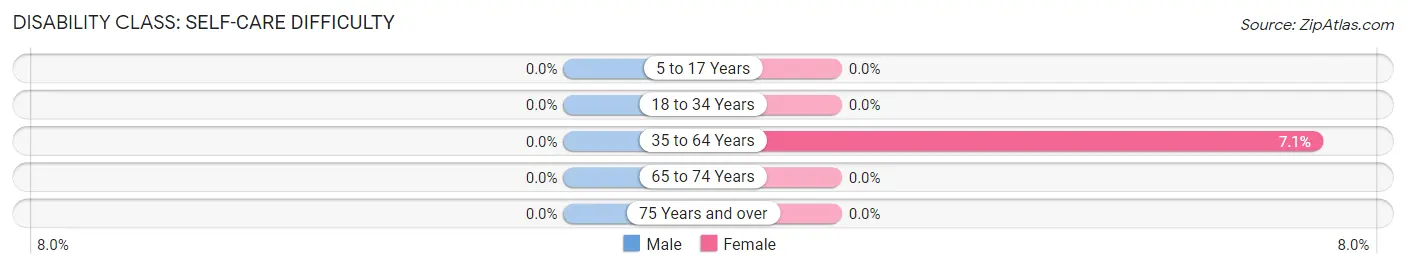
| Age Bracket | Male | Female |
| 5 to 17 Years | 0 (0.0%) | 0 (0.0%) |
| 18 to 34 Years | 0 (0.0%) | 0 (0.0%) |
| 35 to 64 Years | 0 (0.0%) | 8 (7.1%) |
| 65 to 74 Years | 0 (0.0%) | 0 (0.0%) |
| 75 Years and over | 0 (0.0%) | 0 (0.0%) |
Technology Access in Hotevilla Bacavi
Computing Device Access in Hotevilla Bacavi
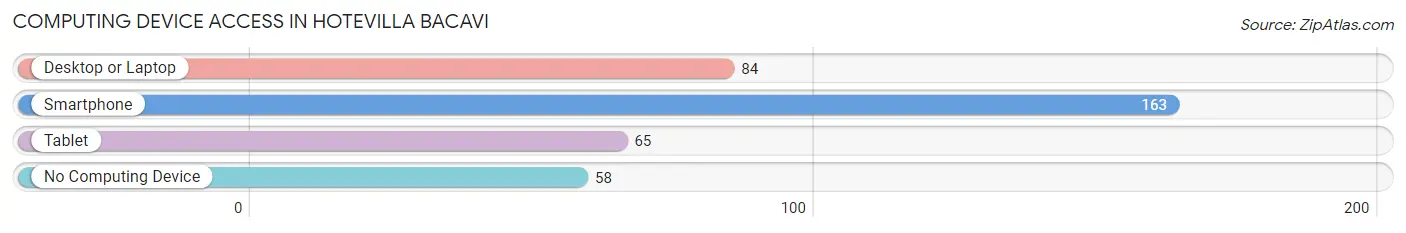
| Device Type | # Households | % Households |
| Desktop or Laptop | 84 | 36.7% |
| Smartphone | 163 | 71.2% |
| Tablet | 65 | 28.4% |
| No Computing Device | 58 | 25.3% |
| Total | 229 | 100.0% |
Internet Access in Hotevilla Bacavi
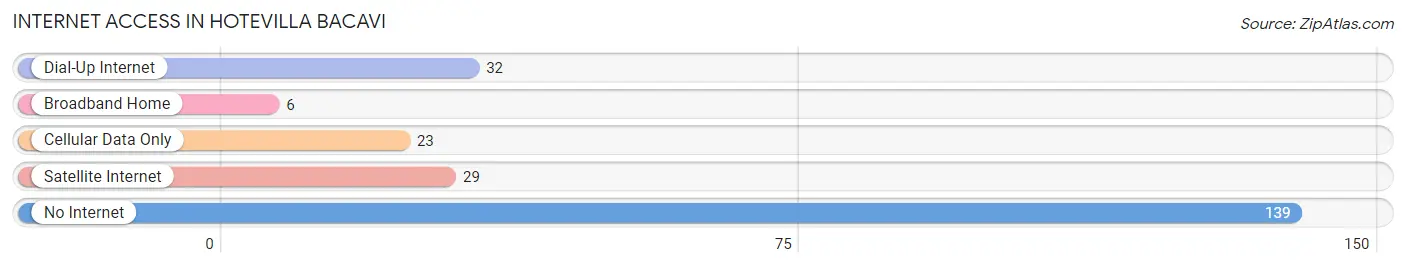
| Internet Type | # Households | % Households |
| Dial-Up Internet | 32 | 14.0% |
| Broadband Home | 6 | 2.6% |
| Cellular Data Only | 23 | 10.0% |
| Satellite Internet | 29 | 12.7% |
| No Internet | 139 | 60.7% |
| Total | 229 | 100.0% |
Hotevilla Bacavi Summary
Hotevilla-Bacavi is a small unincorporated community located on the Hopi Reservation in Coconino County, Arizona. It is located about 10 miles south of the city of Flagstaff and is home to about 500 people. The community is made up of two villages, Hotevilla and Bacavi, which are located on either side of Second Mesa. The two villages are connected by a road that runs through the center of the mesa.
Geography
Hotevilla-Bacavi is located in the northern part of the Hopi Reservation in Coconino County, Arizona. It is situated on the Second Mesa, which is about 10 miles south of Flagstaff. The mesa is surrounded by the Hopi Buttes to the east, the San Francisco Peaks to the north, and the Painted Desert to the south. The mesa is about 4,000 feet above sea level and is composed of sandstone and shale. The area is characterized by dry, hot summers and cold, wet winters.
Economy
The economy of Hotevilla-Bacavi is largely based on agriculture and tourism. The Hopi Tribe operates a number of businesses in the area, including a gas station, a grocery store, and a restaurant. The tribe also operates a number of tourist attractions, including the Hopi Cultural Center, the Hopi Arts and Crafts Center, and the Hopi Cultural Museum. The Hopi Tribe also operates a number of agricultural operations, including a cattle ranch and a farm.
Demographics
As of the 2010 census, the population of Hotevilla-Bacavi was 498. The population is primarily Native American, with the majority of the population being Hopi. The median age of the population is 37.5 years, and the median household income is $25,000. The unemployment rate is 8.3%, and the poverty rate is 28.3%.
History
Hotevilla-Bacavi was established in the early 1900s by a group of Hopi people who were seeking to preserve their traditional culture and way of life. The two villages were founded by two different clans, the Hotevilla clan and the Bacavi clan. The two villages have remained separate, but have maintained close ties over the years.
The Hopi people have lived in the area for centuries, and the Hopi Reservation was established in 1882. The Hopi people have maintained their traditional culture and way of life, and the Hopi language is still spoken in the area. The Hopi people are known for their pottery, basketry, and jewelry, and these crafts are still practiced in the area.
Conclusion
Hotevilla-Bacavi is a small unincorporated community located on the Hopi Reservation in Coconino County, Arizona. It is home to about 500 people and is made up of two villages, Hotevilla and Bacavi. The economy of the area is largely based on agriculture and tourism, and the population is primarily Native American, with the majority of the population being Hopi. The Hopi people have lived in the area for centuries, and the Hopi language is still spoken in the area. The Hopi people are known for their pottery, basketry, and jewelry, and these crafts are still practiced in the area.
Common Questions
What is Per Capita Income in Hotevilla Bacavi?
Per Capita income in Hotevilla Bacavi is $10,646.
What is the Median Family Income in Hotevilla Bacavi?
Median Family Income in Hotevilla Bacavi is $31,250.
What is the Median Household income in Hotevilla Bacavi?
Median Household Income in Hotevilla Bacavi is $31,339.
What is Inequality or Gini Index in Hotevilla Bacavi?
Inequality or Gini Index in Hotevilla Bacavi is 0.44.
What is the Total Population of Hotevilla Bacavi?
Total Population of Hotevilla Bacavi is 678.
What is the Total Male Population of Hotevilla Bacavi?
Total Male Population of Hotevilla Bacavi is 340.
What is the Total Female Population of Hotevilla Bacavi?
Total Female Population of Hotevilla Bacavi is 338.
What is the Ratio of Males per 100 Females in Hotevilla Bacavi?
There are 100.59 Males per 100 Females in Hotevilla Bacavi.
What is the Ratio of Females per 100 Males in Hotevilla Bacavi?
There are 99.41 Females per 100 Males in Hotevilla Bacavi.
What is the Median Population Age in Hotevilla Bacavi?
Median Population Age in Hotevilla Bacavi is 49.4 Years.
What is the Average Family Size in Hotevilla Bacavi
Average Family Size in Hotevilla Bacavi is 3.2 People.
What is the Average Household Size in Hotevilla Bacavi
Average Household Size in Hotevilla Bacavi is 3.0 People.
How Large is the Labor Force in Hotevilla Bacavi?
There are 161 People in the Labor Forcein in Hotevilla Bacavi.
What is the Percentage of People in the Labor Force in Hotevilla Bacavi?
31.4% of People are in the Labor Force in Hotevilla Bacavi.
What is the Unemployment Rate in Hotevilla Bacavi?
Unemployment Rate in Hotevilla Bacavi is 15.5%.