Holbrook, AZ Map & Demographics
Holbrook Map
Holbrook Overview
$22,268
PER CAPITA INCOME
$68,077
AVG FAMILY INCOME
$58,856
AVG HOUSEHOLD INCOME
30.0%
WAGE / INCOME GAP [ % ]
70.0¢/ $1
WAGE / INCOME GAP [ $ ]
0.41
INEQUALITY / GINI INDEX
4,842
TOTAL POPULATION
2,783
MALE POPULATION
2,059
FEMALE POPULATION
135.16
MALES / 100 FEMALES
73.98
FEMALES / 100 MALES
38.2
MEDIAN AGE
3.2
AVG FAMILY SIZE
2.8
AVG HOUSEHOLD SIZE
1,661
LABOR FORCE [ PEOPLE ]
44.5%
PERCENT IN LABOR FORCE
3.9%
UNEMPLOYMENT RATE
Holbrook Zip Codes
Holbrook Area Codes
Income in Holbrook
Income Overview in Holbrook
Per Capita Income in Holbrook is $22,268, while median incomes of families and households are $68,077 and $58,856 respectively.
| Characteristic | Number | Measure |
| Per Capita Income | 4,842 | $22,268 |
| Median Family Income | 1,164 | $68,077 |
| Mean Family Income | 1,164 | $75,104 |
| Median Household Income | 1,528 | $58,856 |
| Mean Household Income | 1,528 | $69,004 |
| Income Deficit | 1,164 | $0 |
| Wage / Income Gap (%) | 4,842 | 30.04% |
| Wage / Income Gap ($) | 4,842 | 69.96¢ per $1 |
| Gini / Inequality Index | 4,842 | 0.41 |
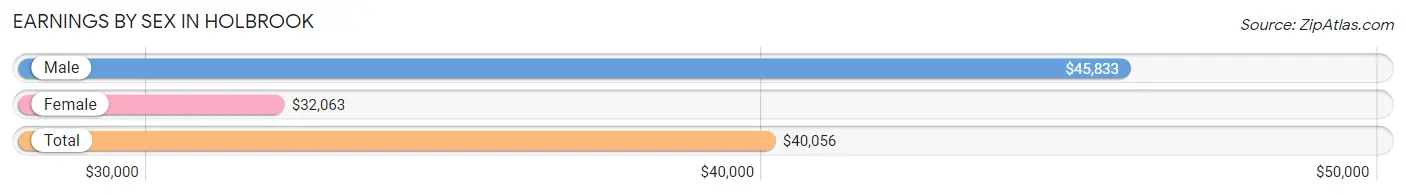
Earnings by Sex in Holbrook
Average Earnings in Holbrook are $40,056, $45,833 for men and $32,063 for women, a difference of 30.0%.
| Sex | Number | Average Earnings |
| Male | 896 (50.6%) | $45,833 |
| Female | 874 (49.4%) | $32,063 |
| Total | 1,770 (100.0%) | $40,056 |
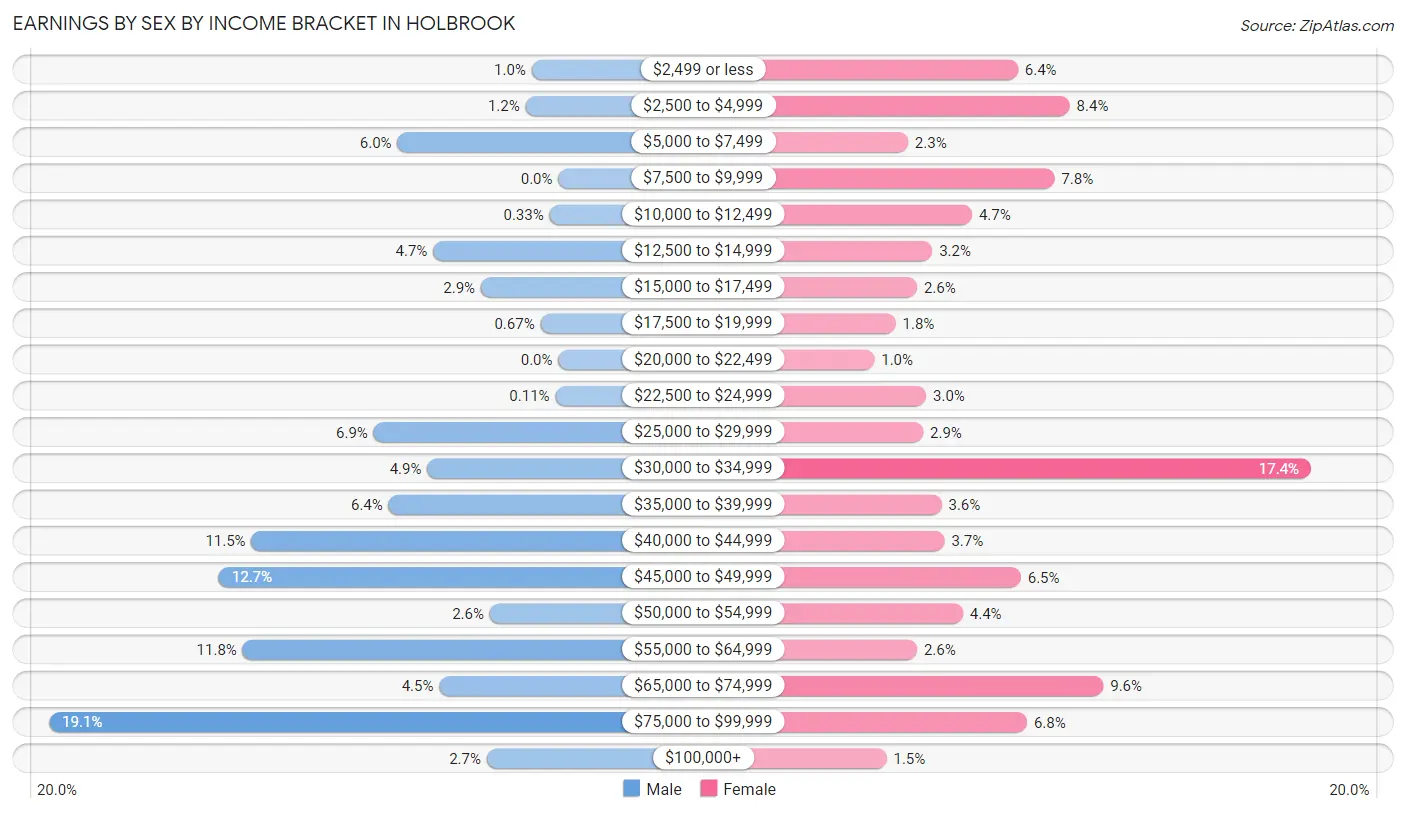
Earnings by Sex by Income Bracket in Holbrook
The most common earnings brackets in Holbrook are $75,000 to $99,999 for men (171 | 19.1%) and $30,000 to $34,999 for women (152 | 17.4%).
| Income | Male | Female |
| $2,499 or less | 9 (1.0%) | 56 (6.4%) |
| $2,500 to $4,999 | 11 (1.2%) | 73 (8.4%) |
| $5,000 to $7,499 | 54 (6.0%) | 20 (2.3%) |
| $7,500 to $9,999 | 0 (0.0%) | 68 (7.8%) |
| $10,000 to $12,499 | 3 (0.3%) | 41 (4.7%) |
| $12,500 to $14,999 | 42 (4.7%) | 28 (3.2%) |
| $15,000 to $17,499 | 26 (2.9%) | 23 (2.6%) |
| $17,500 to $19,999 | 6 (0.7%) | 16 (1.8%) |
| $20,000 to $22,499 | 0 (0.0%) | 9 (1.0%) |
| $22,500 to $24,999 | 1 (0.1%) | 26 (3.0%) |
| $25,000 to $29,999 | 62 (6.9%) | 25 (2.9%) |
| $30,000 to $34,999 | 44 (4.9%) | 152 (17.4%) |
| $35,000 to $39,999 | 57 (6.4%) | 31 (3.5%) |
| $40,000 to $44,999 | 103 (11.5%) | 32 (3.7%) |
| $45,000 to $49,999 | 114 (12.7%) | 57 (6.5%) |
| $50,000 to $54,999 | 23 (2.6%) | 38 (4.3%) |
| $55,000 to $64,999 | 106 (11.8%) | 23 (2.6%) |
| $65,000 to $74,999 | 40 (4.5%) | 84 (9.6%) |
| $75,000 to $99,999 | 171 (19.1%) | 59 (6.8%) |
| $100,000+ | 24 (2.7%) | 13 (1.5%) |
| Total | 896 (100.0%) | 874 (100.0%) |
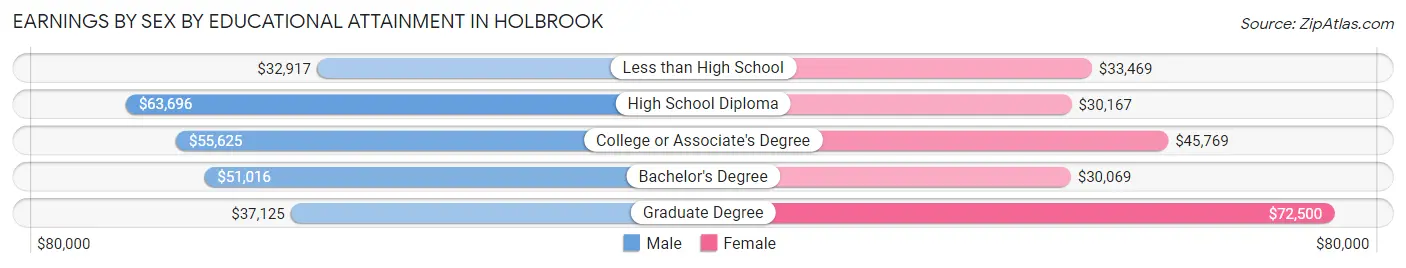
Earnings by Sex by Educational Attainment in Holbrook
Average earnings in Holbrook are $49,063 for men and $33,188 for women, a difference of 32.4%. Men with an educational attainment of high school diploma enjoy the highest average annual earnings of $63,696, while those with less than high school education earn the least with $32,917. Women with an educational attainment of graduate degree earn the most with the average annual earnings of $72,500, while those with bachelor's degree education have the smallest earnings of $30,069.
| Educational Attainment | Male Income | Female Income |
| Less than High School | $32,917 | $33,469 |
| High School Diploma | $63,696 | $30,167 |
| College or Associate's Degree | $55,625 | $45,769 |
| Bachelor's Degree | $51,016 | $30,069 |
| Graduate Degree | $37,125 | $72,500 |
| Total | $49,063 | $33,188 |
Family Income in Holbrook
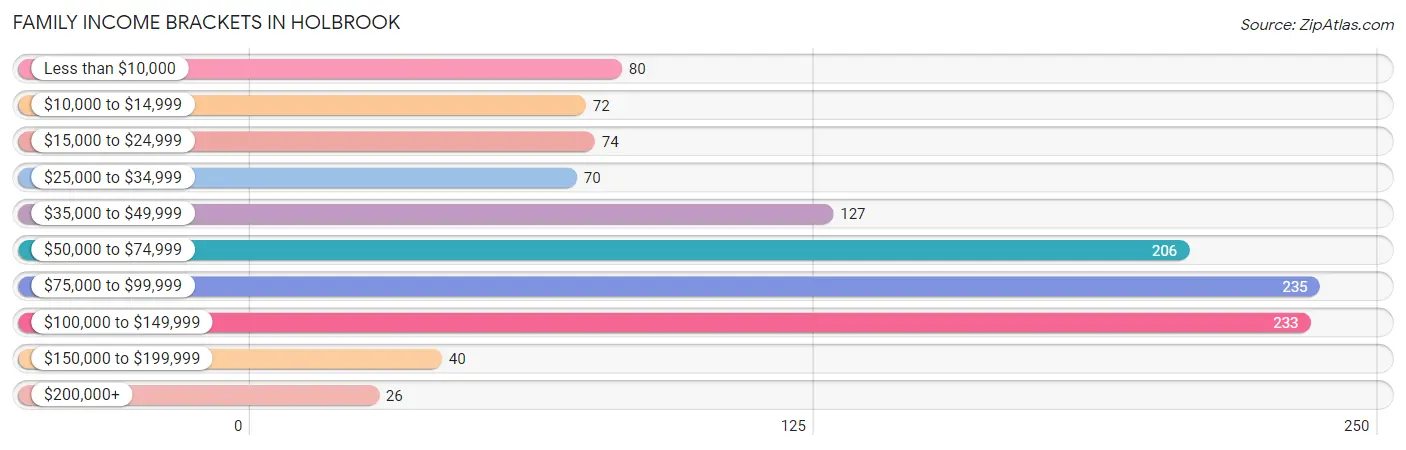
Family Income Brackets in Holbrook
According to the Holbrook family income data, there are 235 families falling into the $75,000 to $99,999 income range, which is the most common income bracket and makes up 20.2% of all families. Conversely, the $200,000+ income bracket is the least frequent group with only 26 families (2.2%) belonging to this category.
| Income Bracket | # Families | % Families |
| Less than $10,000 | 80 | 6.9% |
| $10,000 to $14,999 | 72 | 6.2% |
| $15,000 to $24,999 | 74 | 6.4% |
| $25,000 to $34,999 | 70 | 6.0% |
| $35,000 to $49,999 | 127 | 10.9% |
| $50,000 to $74,999 | 206 | 17.7% |
| $75,000 to $99,999 | 235 | 20.2% |
| $100,000 to $149,999 | 233 | 20.0% |
| $150,000 to $199,999 | 40 | 3.4% |
| $200,000+ | 26 | 2.2% |
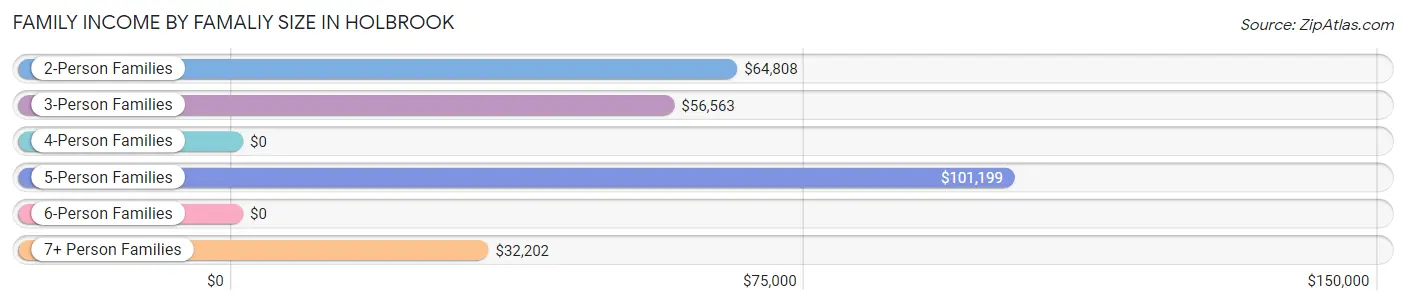
Family Income by Famaliy Size in Holbrook
5-person families (177 | 15.2%) account for the highest median family income in Holbrook with $101,199 per family, while 2-person families (546 | 46.9%) have the highest median income of $32,404 per family member.
| Income Bracket | # Families | Median Income |
| 2-Person Families | 546 (46.9%) | $64,808 |
| 3-Person Families | 199 (17.1%) | $56,563 |
| 4-Person Families | 110 (9.5%) | $0 |
| 5-Person Families | 177 (15.2%) | $101,199 |
| 6-Person Families | 95 (8.2%) | $0 |
| 7+ Person Families | 37 (3.2%) | $32,202 |
| Total | 1,164 (100.0%) | $68,077 |
Family Income by Number of Earners in Holbrook
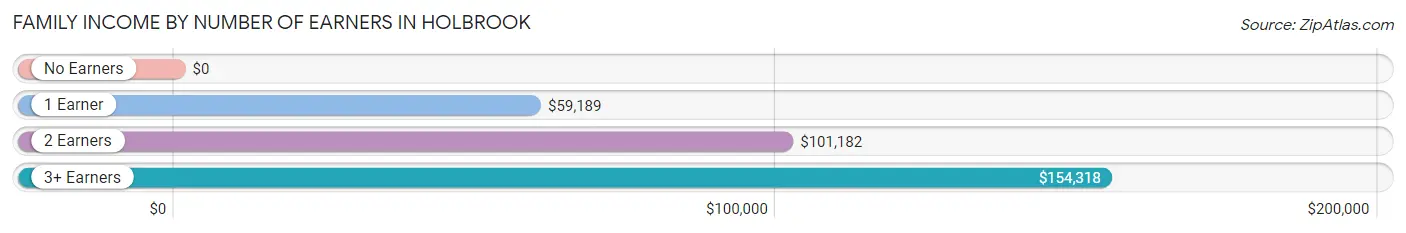
| Number of Earners | # Families | Median Income |
| No Earners | 206 (17.7%) | $0 |
| 1 Earner | 520 (44.7%) | $59,189 |
| 2 Earners | 404 (34.7%) | $101,182 |
| 3+ Earners | 34 (2.9%) | $154,318 |
| Total | 1,164 (100.0%) | $68,077 |
Household Income in Holbrook
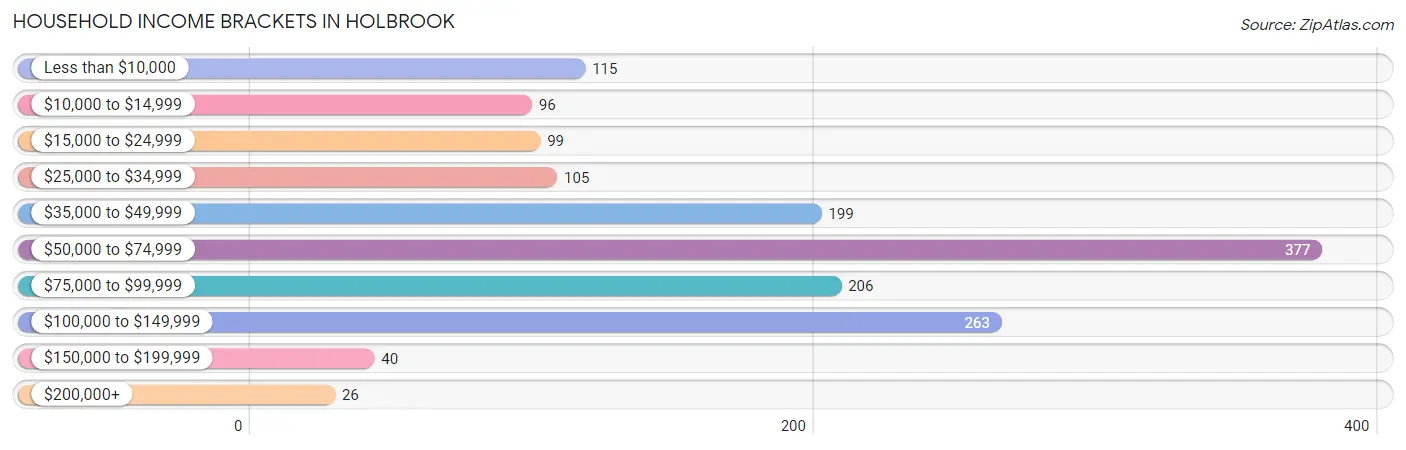
Household Income Brackets in Holbrook
With 377 households falling in the category, the $50,000 to $74,999 income range is the most frequent in Holbrook, accounting for 24.7% of all households. In contrast, only 26 households (1.7%) fall into the $200,000+ income bracket, making it the least populous group.
| Income Bracket | # Households | % Households |
| Less than $10,000 | 115 | 7.5% |
| $10,000 to $14,999 | 96 | 6.3% |
| $15,000 to $24,999 | 99 | 6.5% |
| $25,000 to $34,999 | 105 | 6.9% |
| $35,000 to $49,999 | 199 | 13.0% |
| $50,000 to $74,999 | 377 | 24.7% |
| $75,000 to $99,999 | 206 | 13.5% |
| $100,000 to $149,999 | 263 | 17.2% |
| $150,000 to $199,999 | 40 | 2.6% |
| $200,000+ | 26 | 1.7% |
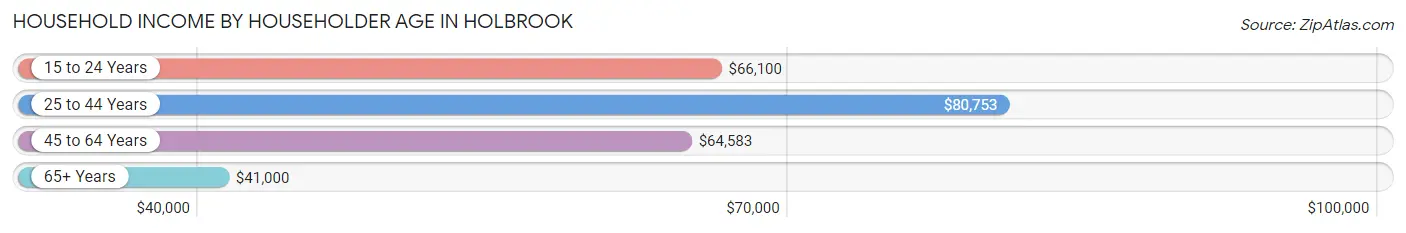
Household Income by Householder Age in Holbrook
The median household income in Holbrook is $58,856, with the highest median household income of $80,753 found in the 25 to 44 years age bracket for the primary householder. A total of 338 households (22.1%) fall into this category. Meanwhile, the 65+ years age bracket for the primary householder has the lowest median household income of $41,000, with 426 households (27.9%) in this group.
| Income Bracket | # Households | Median Income |
| 15 to 24 Years | 78 (5.1%) | $66,100 |
| 25 to 44 Years | 338 (22.1%) | $80,753 |
| 45 to 64 Years | 686 (44.9%) | $64,583 |
| 65+ Years | 426 (27.9%) | $41,000 |
| Total | 1,528 (100.0%) | $58,856 |
Poverty in Holbrook
Income Below Poverty by Sex and Age in Holbrook
With 21.9% poverty level for males and 25.5% for females among the residents of Holbrook, 16 and 17 year old males and 16 and 17 year old females are the most vulnerable to poverty, with 99 males (100.0%) and 30 females (75.0%) in their respective age groups living below the poverty level.
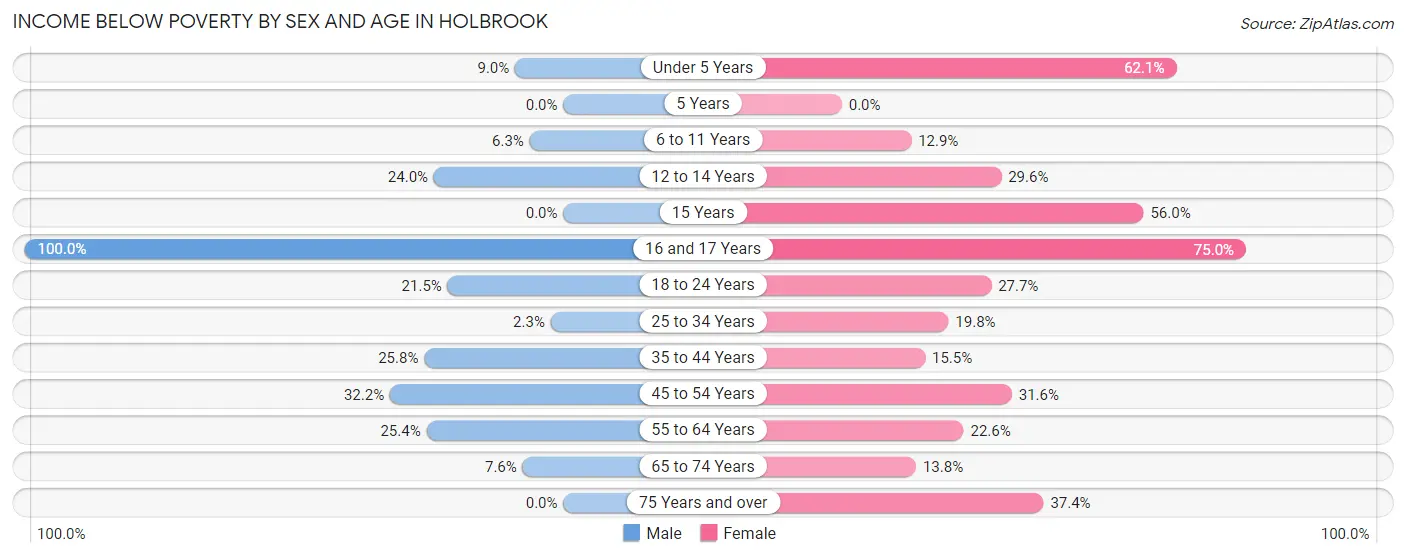
| Age Bracket | Male | Female |
| Under 5 Years | 17 (8.9%) | 18 (62.1%) |
| 5 Years | 0 (0.0%) | 0 (0.0%) |
| 6 to 11 Years | 15 (6.2%) | 17 (12.9%) |
| 12 to 14 Years | 62 (24.0%) | 58 (29.6%) |
| 15 Years | 0 (0.0%) | 14 (56.0%) |
| 16 and 17 Years | 99 (100.0%) | 30 (75.0%) |
| 18 to 24 Years | 67 (21.5%) | 33 (27.7%) |
| 25 to 34 Years | 4 (2.3%) | 37 (19.8%) |
| 35 to 44 Years | 79 (25.8%) | 53 (15.4%) |
| 45 to 54 Years | 102 (32.2%) | 100 (31.6%) |
| 55 to 64 Years | 64 (25.4%) | 73 (22.6%) |
| 65 to 74 Years | 9 (7.6%) | 19 (13.8%) |
| 75 Years and over | 0 (0.0%) | 70 (37.4%) |
| Total | 518 (21.9%) | 522 (25.5%) |
Income Above Poverty by Sex and Age in Holbrook
According to the poverty statistics in Holbrook, males aged 15 years and females aged 5 years are the age groups that are most secure financially, with 100.0% of males and 100.0% of females in these age groups living above the poverty line.
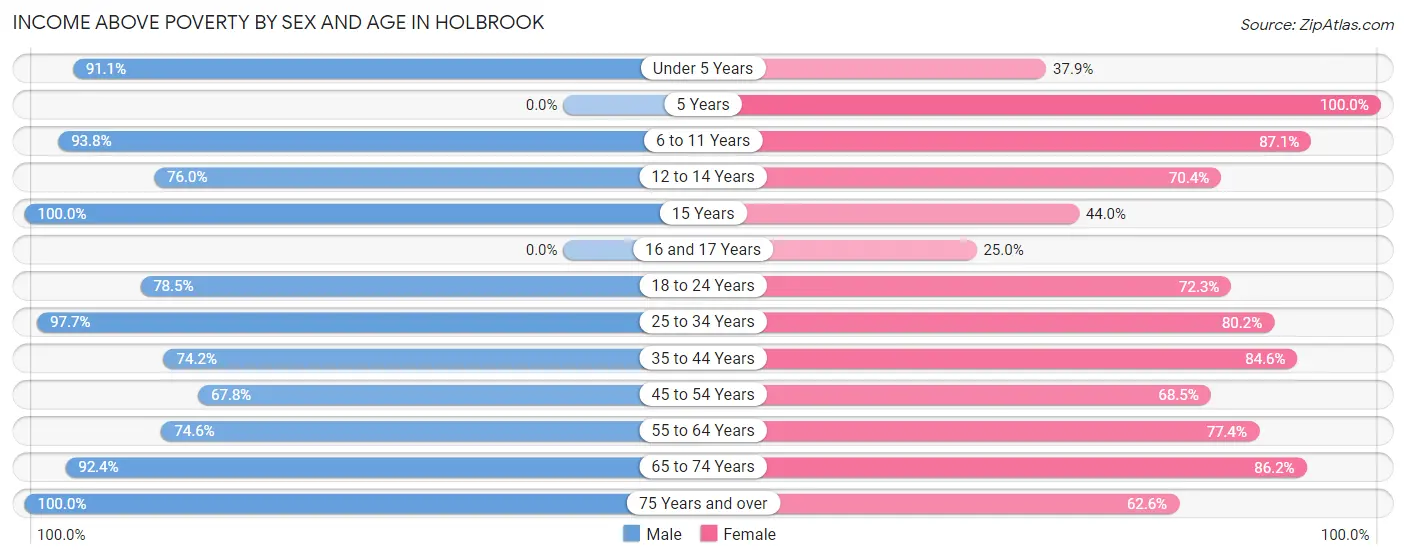
| Age Bracket | Male | Female |
| Under 5 Years | 173 (91.0%) | 11 (37.9%) |
| 5 Years | 0 (0.0%) | 11 (100.0%) |
| 6 to 11 Years | 225 (93.8%) | 115 (87.1%) |
| 12 to 14 Years | 196 (76.0%) | 138 (70.4%) |
| 15 Years | 2 (100.0%) | 11 (44.0%) |
| 16 and 17 Years | 0 (0.0%) | 10 (25.0%) |
| 18 to 24 Years | 245 (78.5%) | 86 (72.3%) |
| 25 to 34 Years | 167 (97.7%) | 150 (80.2%) |
| 35 to 44 Years | 227 (74.2%) | 290 (84.6%) |
| 45 to 54 Years | 215 (67.8%) | 217 (68.4%) |
| 55 to 64 Years | 188 (74.6%) | 250 (77.4%) |
| 65 to 74 Years | 110 (92.4%) | 119 (86.2%) |
| 75 Years and over | 95 (100.0%) | 117 (62.6%) |
| Total | 1,843 (78.1%) | 1,525 (74.5%) |
Income Below Poverty Among Married-Couple Families in Holbrook
The poverty statistics for married-couple families in Holbrook show that 2.1% or 13 of the total 620 families live below the poverty line. Families with no children have the highest poverty rate of 4.2%, comprising of 13 families. On the other hand, families with 1 or 2 children have the lowest poverty rate of 0.0%, which includes 0 families.
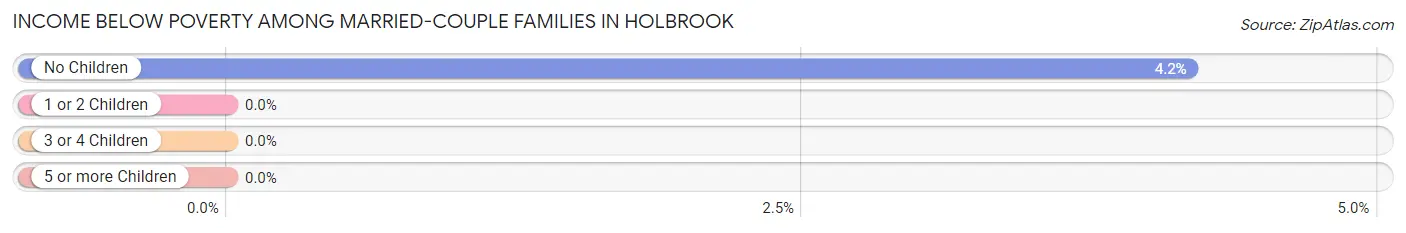
| Children | Above Poverty | Below Poverty |
| No Children | 298 (95.8%) | 13 (4.2%) |
| 1 or 2 Children | 43 (100.0%) | 0 (0.0%) |
| 3 or 4 Children | 266 (100.0%) | 0 (0.0%) |
| 5 or more Children | 0 (0.0%) | 0 (0.0%) |
| Total | 607 (97.9%) | 13 (2.1%) |
Income Below Poverty Among Single-Parent Households in Holbrook
According to the poverty data in Holbrook, 35.2% or 77 single-father households and 41.2% or 134 single-mother households are living below the poverty line. Among single-father households, those with 1 or 2 children have the highest poverty rate, with 42 households (49.4%) experiencing poverty. Likewise, among single-mother households, those with 3 or 4 children have the highest poverty rate, with 30 households (100.0%) falling below the poverty line.
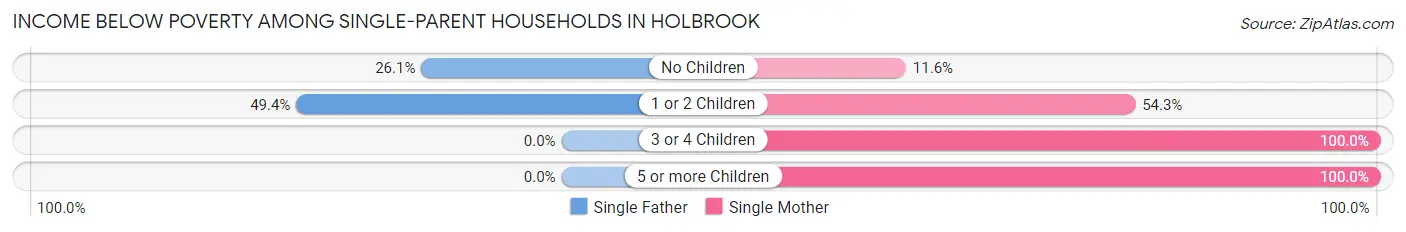
| Children | Single Father | Single Mother |
| No Children | 35 (26.1%) | 16 (11.6%) |
| 1 or 2 Children | 42 (49.4%) | 82 (54.3%) |
| 3 or 4 Children | 0 (0.0%) | 30 (100.0%) |
| 5 or more Children | 0 (0.0%) | 6 (100.0%) |
| Total | 77 (35.2%) | 134 (41.2%) |
Income Below Poverty Among Married-Couple vs Single-Parent Households in Holbrook
The poverty data for Holbrook shows that 13 of the married-couple family households (2.1%) and 211 of the single-parent households (38.8%) are living below the poverty level. Within the married-couple family households, those with no children have the highest poverty rate, with 13 households (4.2%) falling below the poverty line. Among the single-parent households, those with 3 or 4 children have the highest poverty rate, with 30 household (100.0%) living below poverty.
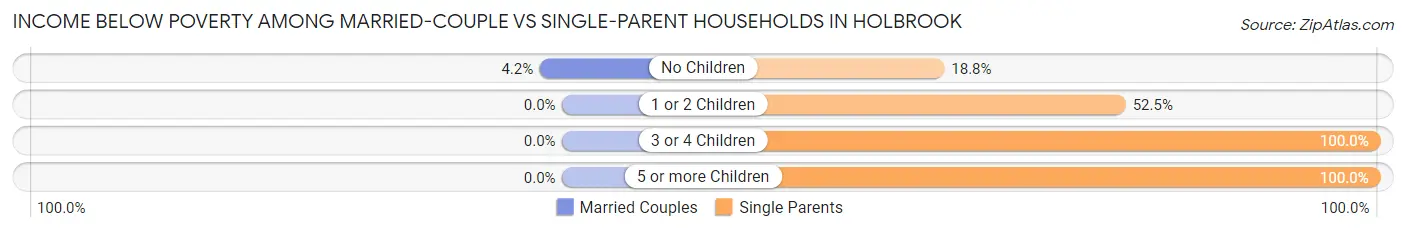
| Children | Married-Couple Families | Single-Parent Households |
| No Children | 13 (4.2%) | 51 (18.8%) |
| 1 or 2 Children | 0 (0.0%) | 124 (52.5%) |
| 3 or 4 Children | 0 (0.0%) | 30 (100.0%) |
| 5 or more Children | 0 (0.0%) | 6 (100.0%) |
| Total | 13 (2.1%) | 211 (38.8%) |
Race in Holbrook
The most populous races in Holbrook are White / Caucasian (1,878 | 38.8%), Native / Alaskan (1,726 | 35.6%), and Hispanic or Latino (1,669 | 34.5%).
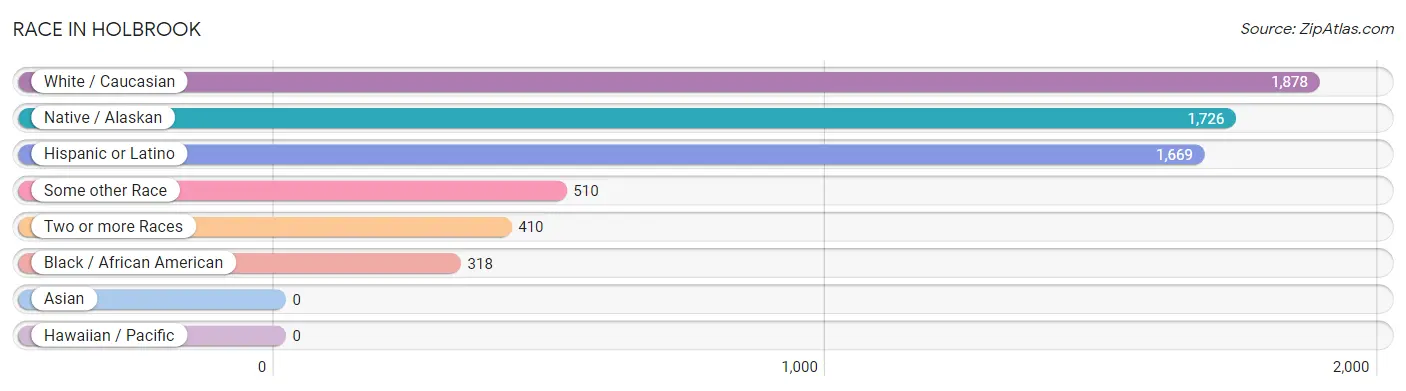
| Race | # Population | % Population |
| Asian | 0 | 0.0% |
| Black / African American | 318 | 6.6% |
| Hawaiian / Pacific | 0 | 0.0% |
| Hispanic or Latino | 1,669 | 34.5% |
| Native / Alaskan | 1,726 | 35.6% |
| White / Caucasian | 1,878 | 38.8% |
| Two or more Races | 410 | 8.5% |
| Some other Race | 510 | 10.5% |
| Total | 4,842 | 100.0% |
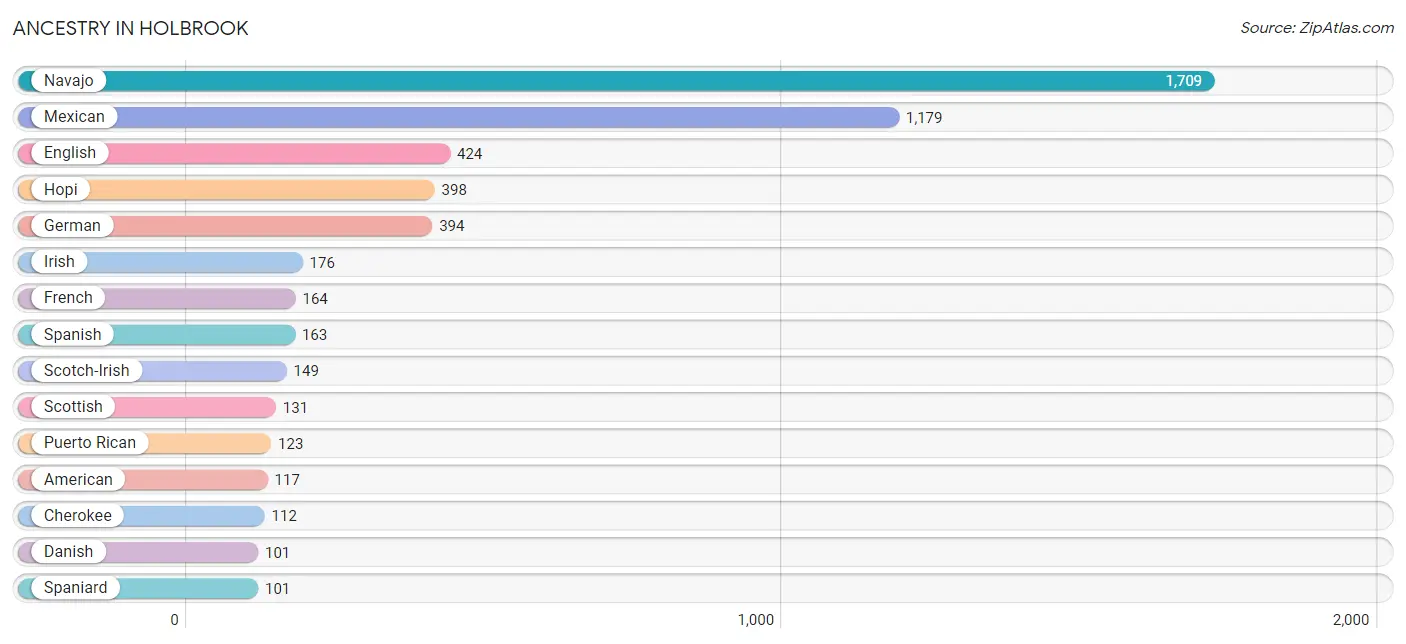
Ancestry in Holbrook
The most populous ancestries reported in Holbrook are Navajo (1,709 | 35.3%), Mexican (1,179 | 24.3%), English (424 | 8.8%), Hopi (398 | 8.2%), and German (394 | 8.1%), together accounting for 84.8% of all Holbrook residents.
| Ancestry | # Population | % Population |
| American | 117 | 2.4% |
| Apache | 24 | 0.5% |
| Bhutanese | 75 | 1.5% |
| British | 26 | 0.5% |
| Central American | 12 | 0.3% |
| Cherokee | 112 | 2.3% |
| Croatian | 15 | 0.3% |
| Danish | 101 | 2.1% |
| Dutch | 56 | 1.2% |
| English | 424 | 8.8% |
| European | 23 | 0.5% |
| French | 164 | 3.4% |
| French Canadian | 21 | 0.4% |
| German | 394 | 8.1% |
| Greek | 4 | 0.1% |
| Honduran | 12 | 0.3% |
| Hopi | 398 | 8.2% |
| Hungarian | 21 | 0.4% |
| Irish | 176 | 3.6% |
| Italian | 87 | 1.8% |
| Mexican | 1,179 | 24.3% |
| Native Hawaiian | 8 | 0.2% |
| Navajo | 1,709 | 35.3% |
| Norwegian | 22 | 0.4% |
| Pima | 10 | 0.2% |
| Polish | 46 | 0.9% |
| Puerto Rican | 123 | 2.5% |
| Russian | 7 | 0.1% |
| Scotch-Irish | 149 | 3.1% |
| Scottish | 131 | 2.7% |
| Sioux | 18 | 0.4% |
| Slovak | 8 | 0.2% |
| Spaniard | 101 | 2.1% |
| Spanish | 163 | 3.4% |
| Spanish American | 77 | 1.6% |
| Swedish | 28 | 0.6% |
| Ukrainian | 23 | 0.5% |
| Welsh | 29 | 0.6% |
| Yaqui | 1 | 0.0% | View All 39 Rows |
Immigrants in Holbrook
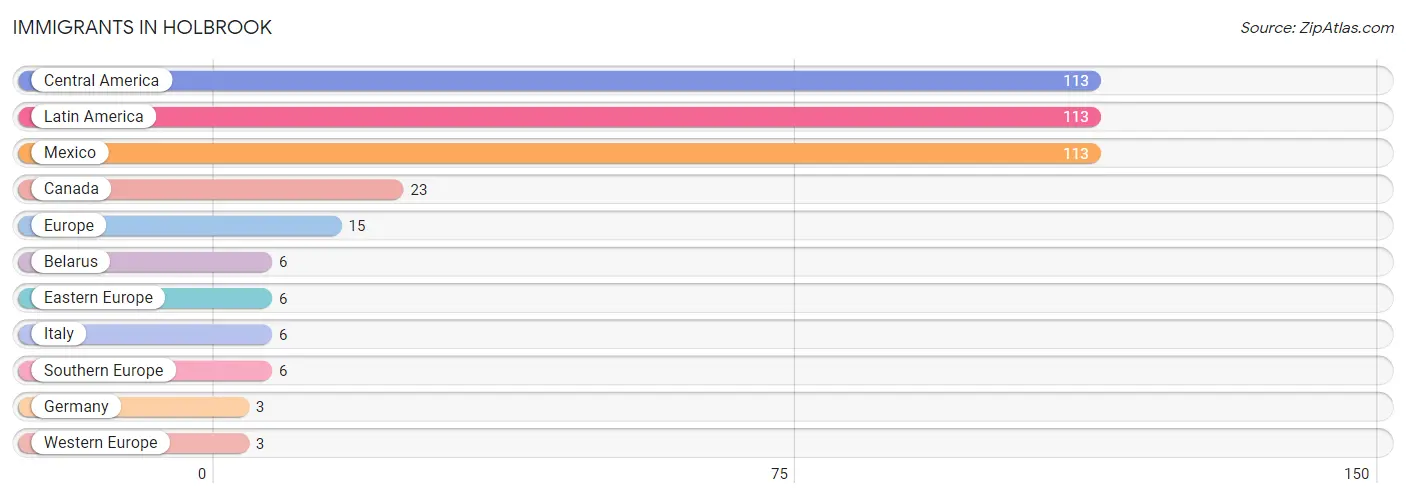
The most numerous immigrant groups reported in Holbrook came from Central America (113 | 2.3%), Latin America (113 | 2.3%), Mexico (113 | 2.3%), Canada (23 | 0.5%), and Europe (15 | 0.3%), together accounting for 7.8% of all Holbrook residents.
| Immigration Origin | # Population | % Population |
| Belarus | 6 | 0.1% |
| Canada | 23 | 0.5% |
| Central America | 113 | 2.3% |
| Eastern Europe | 6 | 0.1% |
| Europe | 15 | 0.3% |
| Germany | 3 | 0.1% |
| Italy | 6 | 0.1% |
| Latin America | 113 | 2.3% |
| Mexico | 113 | 2.3% |
| Southern Europe | 6 | 0.1% |
| Western Europe | 3 | 0.1% | View All 11 Rows |
Sex and Age in Holbrook
Sex and Age in Holbrook
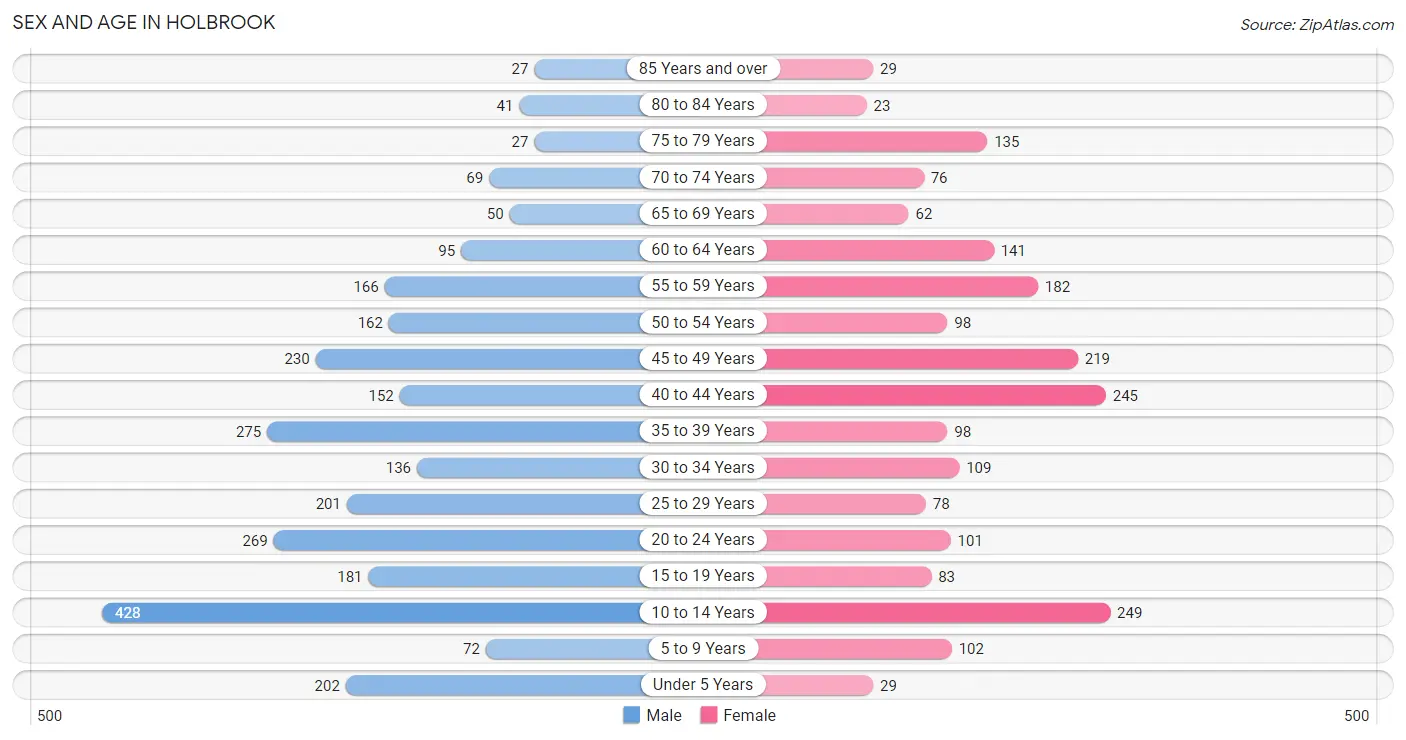
The most populous age groups in Holbrook are 10 to 14 Years (428 | 15.4%) for men and 10 to 14 Years (249 | 12.1%) for women.
| Age Bracket | Male | Female |
| Under 5 Years | 202 (7.3%) | 29 (1.4%) |
| 5 to 9 Years | 72 (2.6%) | 102 (5.0%) |
| 10 to 14 Years | 428 (15.4%) | 249 (12.1%) |
| 15 to 19 Years | 181 (6.5%) | 83 (4.0%) |
| 20 to 24 Years | 269 (9.7%) | 101 (4.9%) |
| 25 to 29 Years | 201 (7.2%) | 78 (3.8%) |
| 30 to 34 Years | 136 (4.9%) | 109 (5.3%) |
| 35 to 39 Years | 275 (9.9%) | 98 (4.8%) |
| 40 to 44 Years | 152 (5.5%) | 245 (11.9%) |
| 45 to 49 Years | 230 (8.3%) | 219 (10.6%) |
| 50 to 54 Years | 162 (5.8%) | 98 (4.8%) |
| 55 to 59 Years | 166 (6.0%) | 182 (8.8%) |
| 60 to 64 Years | 95 (3.4%) | 141 (6.9%) |
| 65 to 69 Years | 50 (1.8%) | 62 (3.0%) |
| 70 to 74 Years | 69 (2.5%) | 76 (3.7%) |
| 75 to 79 Years | 27 (1.0%) | 135 (6.6%) |
| 80 to 84 Years | 41 (1.5%) | 23 (1.1%) |
| 85 Years and over | 27 (1.0%) | 29 (1.4%) |
| Total | 2,783 (100.0%) | 2,059 (100.0%) |
Families and Households in Holbrook
Median Family Size in Holbrook
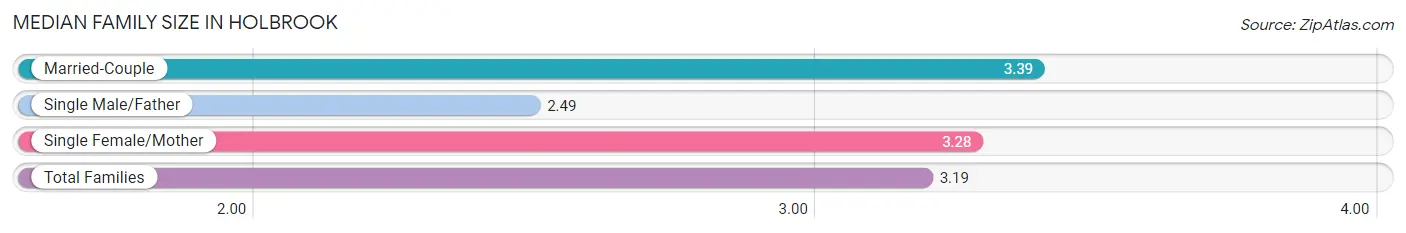
The median family size in Holbrook is 3.19 persons per family, with married-couple families (620 | 53.3%) accounting for the largest median family size of 3.39 persons per family. On the other hand, single male/father families (219 | 18.8%) represent the smallest median family size with 2.49 persons per family.
| Family Type | # Families | Family Size |
| Married-Couple | 620 (53.3%) | 3.39 |
| Single Male/Father | 219 (18.8%) | 2.49 |
| Single Female/Mother | 325 (27.9%) | 3.28 |
| Total Families | 1,164 (100.0%) | 3.19 |
Median Household Size in Holbrook
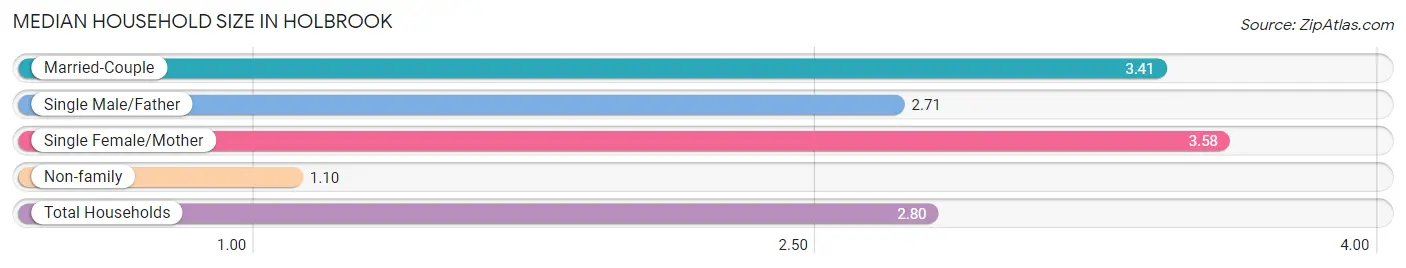
The median household size in Holbrook is 2.80 persons per household, with single female/mother households (325 | 21.3%) accounting for the largest median household size of 3.58 persons per household. non-family households (364 | 23.8%) represent the smallest median household size with 1.10 persons per household.
| Household Type | # Households | Household Size |
| Married-Couple | 620 (40.6%) | 3.41 |
| Single Male/Father | 219 (14.3%) | 2.71 |
| Single Female/Mother | 325 (21.3%) | 3.58 |
| Non-family | 364 (23.8%) | 1.10 |
| Total Households | 1,528 (100.0%) | 2.80 |
Household Size by Marriage Status in Holbrook
Out of a total of 1,528 households in Holbrook, 1,164 (76.2%) are family households, while 364 (23.8%) are nonfamily households. The most numerous type of family households are 2-person households, comprising 459, and the most common type of nonfamily households are 1-person households, comprising 354.
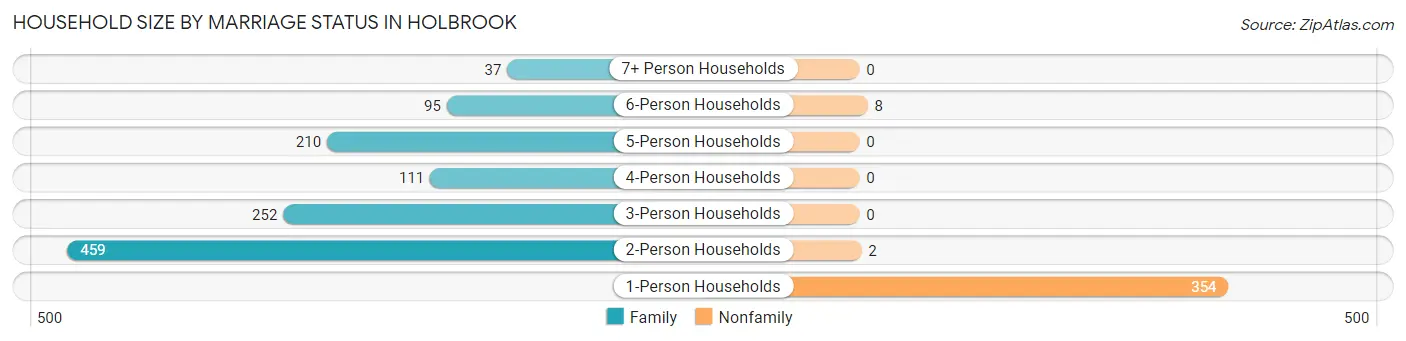
| Household Size | Family Households | Nonfamily Households |
| 1-Person Households | - | 354 (23.2%) |
| 2-Person Households | 459 (30.0%) | 2 (0.1%) |
| 3-Person Households | 252 (16.5%) | 0 (0.0%) |
| 4-Person Households | 111 (7.3%) | 0 (0.0%) |
| 5-Person Households | 210 (13.7%) | 0 (0.0%) |
| 6-Person Households | 95 (6.2%) | 8 (0.5%) |
| 7+ Person Households | 37 (2.4%) | 0 (0.0%) |
| Total | 1,164 (76.2%) | 364 (23.8%) |
Female Fertility in Holbrook
Fertility by Age in Holbrook
Average fertility rate in Holbrook is 36.0 births per 1,000 women. Women in the age bracket of 20 to 34 years have the highest fertility rate with 45.0 births per 1,000 women. Women in the age bracket of 35 to 50 years acount for 62.9% of all women with births.
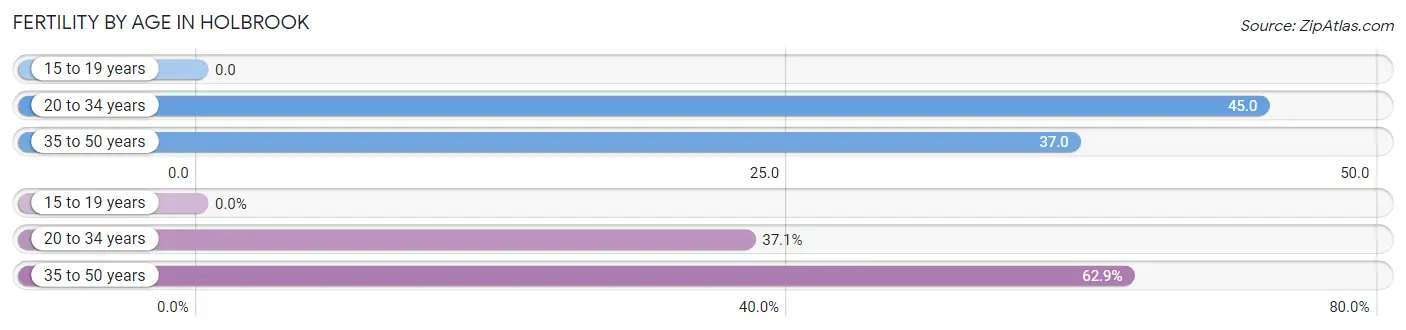
| Age Bracket | Women with Births | Births / 1,000 Women |
| 15 to 19 years | 0 (0.0%) | 0.0 |
| 20 to 34 years | 13 (37.1%) | 45.0 |
| 35 to 50 years | 22 (62.9%) | 37.0 |
| Total | 35 (100.0%) | 36.0 |
Fertility by Age by Marriage Status in Holbrook
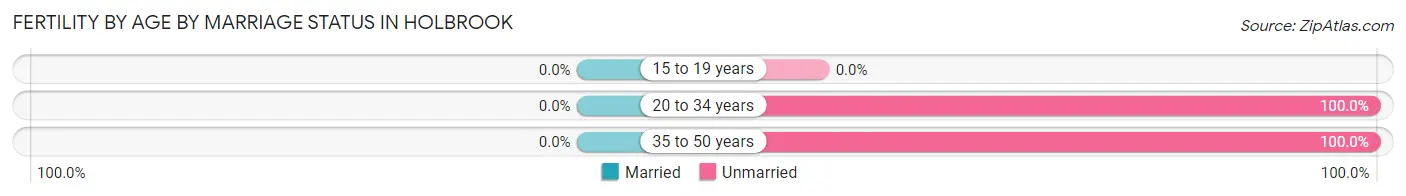
| Age Bracket | Married | Unmarried |
| 15 to 19 years | 0 (0.0%) | 0 (0.0%) |
| 20 to 34 years | 0 (0.0%) | 13 (100.0%) |
| 35 to 50 years | 0 (0.0%) | 22 (100.0%) |
| Total | 0 (0.0%) | 35 (100.0%) |
Fertility by Education in Holbrook
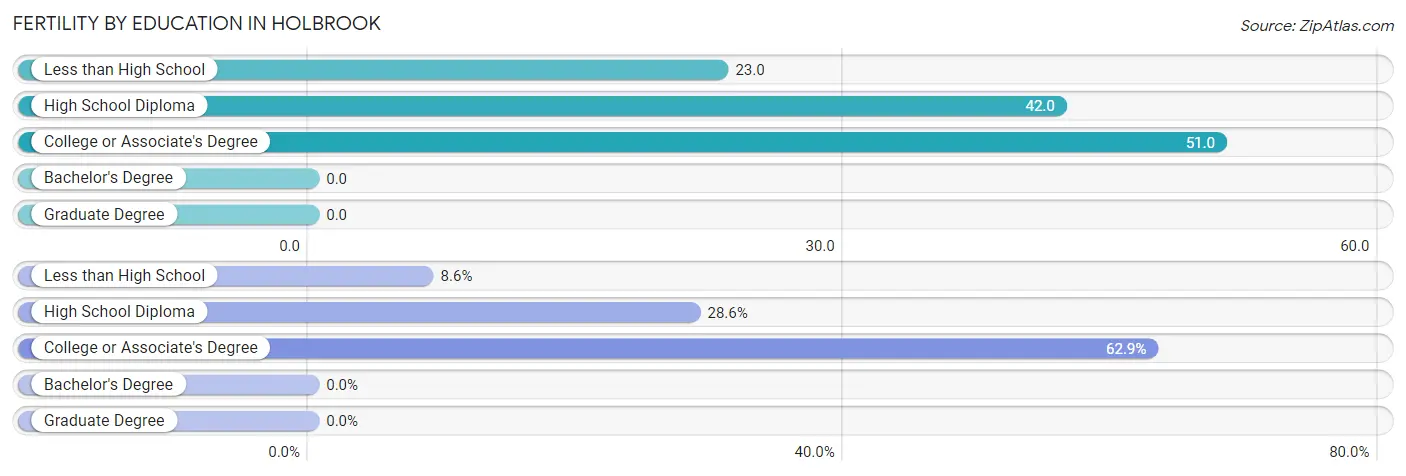
| Educational Attainment | Women with Births | Births / 1,000 Women |
| Less than High School | 3 (8.6%) | 23.0 |
| High School Diploma | 10 (28.6%) | 42.0 |
| College or Associate's Degree | 22 (62.9%) | 51.0 |
| Bachelor's Degree | 0 (0.0%) | 0.0 |
| Graduate Degree | 0 (0.0%) | 0.0 |
| Total | 35 (100.0%) | 36.0 |
Fertility by Education by Marriage Status in Holbrook
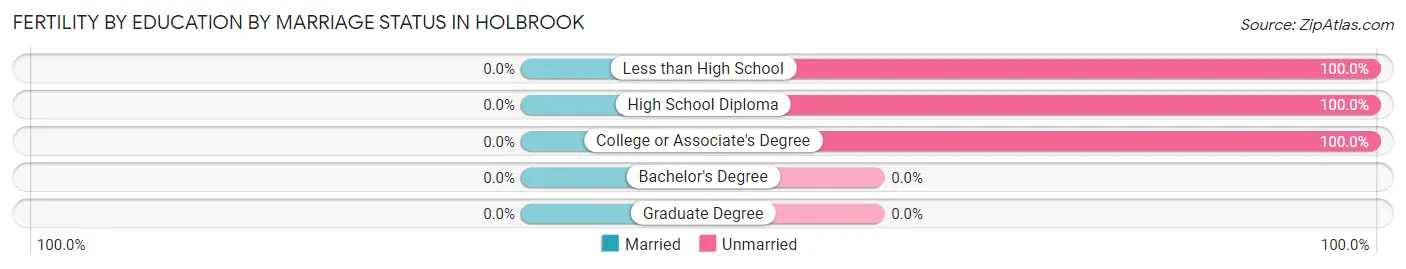
| Educational Attainment | Married | Unmarried |
| Less than High School | 0 (0.0%) | 3 (100.0%) |
| High School Diploma | 0 (0.0%) | 10 (100.0%) |
| College or Associate's Degree | 0 (0.0%) | 22 (100.0%) |
| Bachelor's Degree | 0 (0.0%) | 0 (0.0%) |
| Graduate Degree | 0 (0.0%) | 0 (0.0%) |
| Total | 0 (0.0%) | 35 (100.0%) |
Employment Characteristics in Holbrook
Employment by Class of Employer in Holbrook
Among the 1,579 employed individuals in Holbrook, private company employees (844 | 53.4%), local government employees (263 | 16.7%), and state government employees (171 | 10.8%) make up the most common classes of employment.
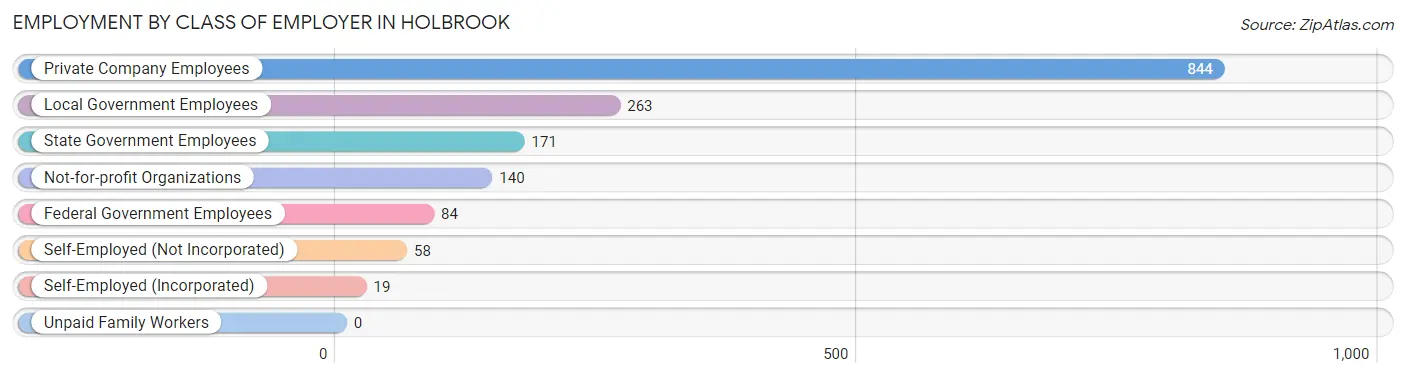
| Employer Class | # Employees | % Employees |
| Private Company Employees | 844 | 53.4% |
| Self-Employed (Incorporated) | 19 | 1.2% |
| Self-Employed (Not Incorporated) | 58 | 3.7% |
| Not-for-profit Organizations | 140 | 8.9% |
| Local Government Employees | 263 | 16.7% |
| State Government Employees | 171 | 10.8% |
| Federal Government Employees | 84 | 5.3% |
| Unpaid Family Workers | 0 | 0.0% |
| Total | 1,579 | 100.0% |
Employment Status by Age in Holbrook
According to the labor force statistics for Holbrook, out of the total population over 16 years of age (3,733), 44.5% or 1,661 individuals are in the labor force, with 3.9% or 65 of them unemployed. The age group with the highest labor force participation rate is 45 to 54 years, with 67.7% or 480 individuals in the labor force. Within the labor force, the 16 to 19 years age range has the highest percentage of unemployed individuals, with 88.9% or 8 of them being unemployed.
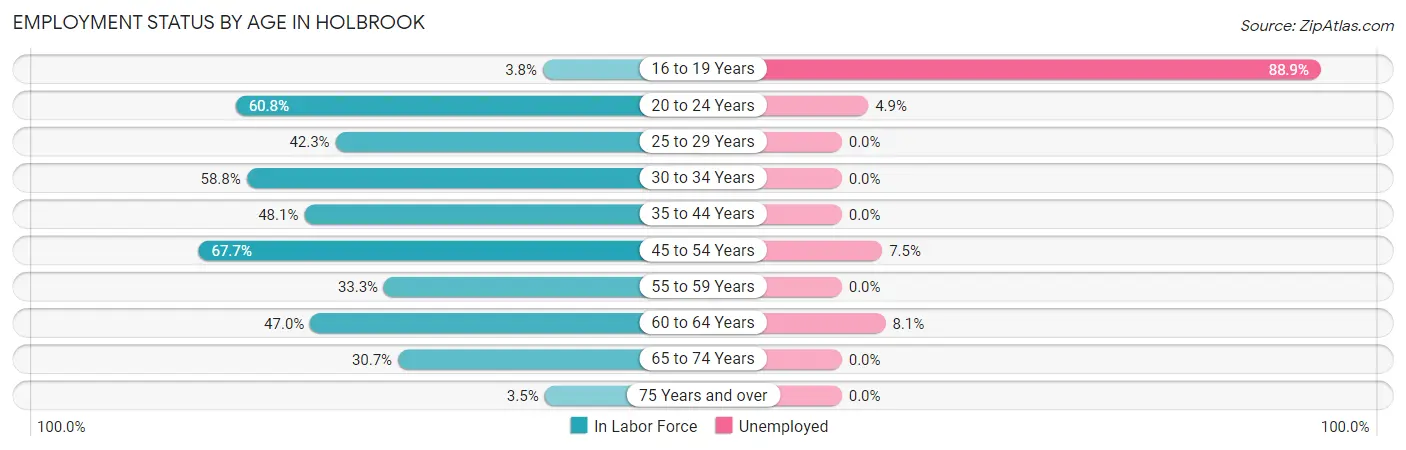
| Age Bracket | In Labor Force | Unemployed |
| 16 to 19 Years | 9 (3.8%) | 8 (88.9%) |
| 20 to 24 Years | 225 (60.8%) | 11 (4.9%) |
| 25 to 29 Years | 118 (42.3%) | 0 (0.0%) |
| 30 to 34 Years | 144 (58.8%) | 0 (0.0%) |
| 35 to 44 Years | 370 (48.1%) | 0 (0.0%) |
| 45 to 54 Years | 480 (67.7%) | 36 (7.5%) |
| 55 to 59 Years | 116 (33.3%) | 0 (0.0%) |
| 60 to 64 Years | 111 (47.0%) | 9 (8.1%) |
| 65 to 74 Years | 79 (30.7%) | 0 (0.0%) |
| 75 Years and over | 10 (3.5%) | 0 (0.0%) |
| Total | 1,661 (44.5%) | 65 (3.9%) |
Employment Status by Educational Attainment in Holbrook
According to labor force statistics for Holbrook, 51.8% of individuals (1,340) out of the total population between 25 and 64 years of age (2,587) are in the labor force, with 3.4% or 46 of them being unemployed. The group with the highest labor force participation rate are those with the educational attainment of bachelor's degree or higher, with 79.6% or 249 individuals in the labor force. Within the labor force, individuals with less than high school education have the highest percentage of unemployment, with 24.2% or 23 of them being unemployed.
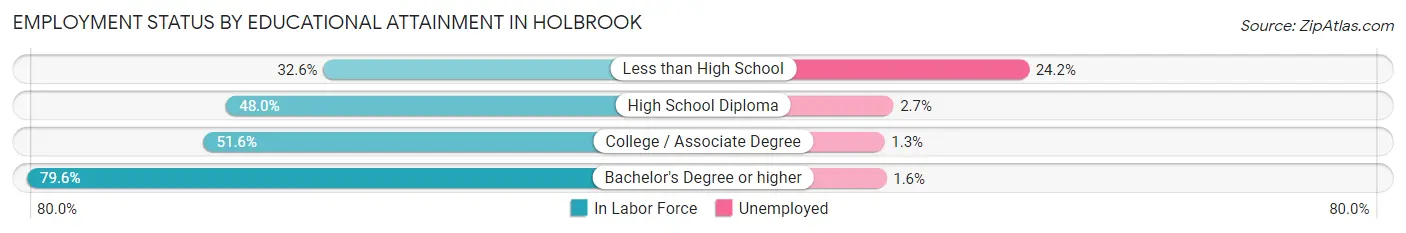
| Educational Attainment | In Labor Force | Unemployed |
| Less than High School | 95 (32.6%) | 70 (24.2%) |
| High School Diploma | 373 (48.0%) | 21 (2.7%) |
| College / Associate Degree | 622 (51.6%) | 16 (1.3%) |
| Bachelor's Degree or higher | 249 (79.6%) | 5 (1.6%) |
| Total | 1,340 (51.8%) | 88 (3.4%) |
Employment Occupations by Sex in Holbrook
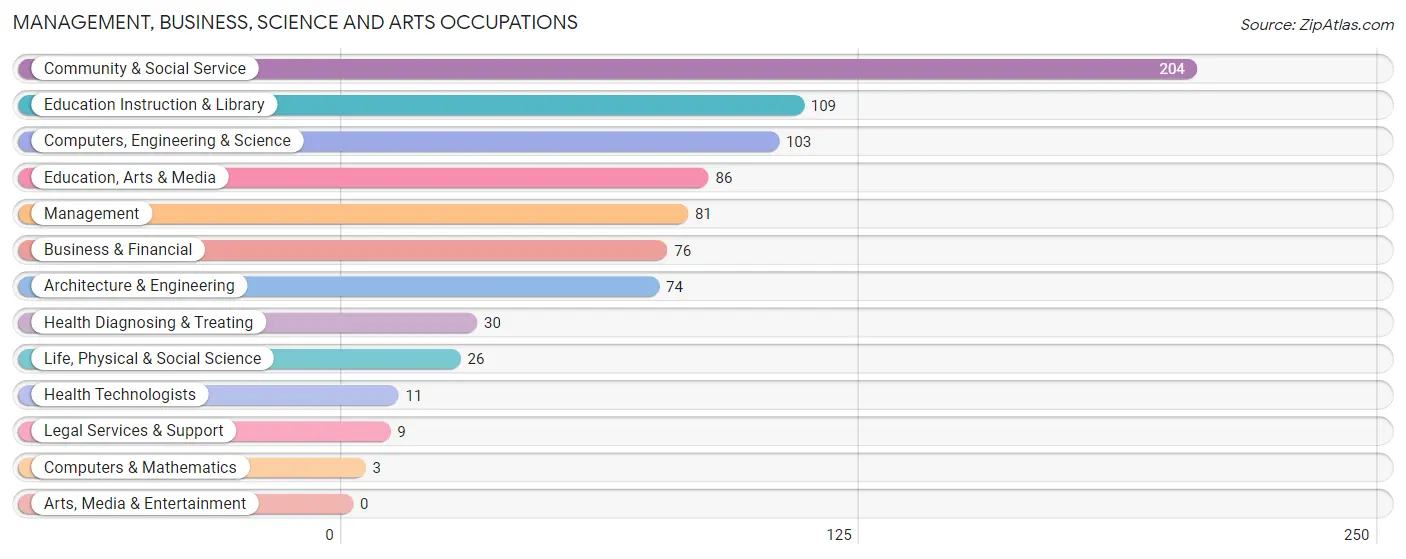
Management, Business, Science and Arts Occupations
The most common Management, Business, Science and Arts occupations in Holbrook are Community & Social Service (204 | 12.8%), Education Instruction & Library (109 | 6.8%), Computers, Engineering & Science (103 | 6.5%), Education, Arts & Media (86 | 5.4%), and Management (81 | 5.1%).
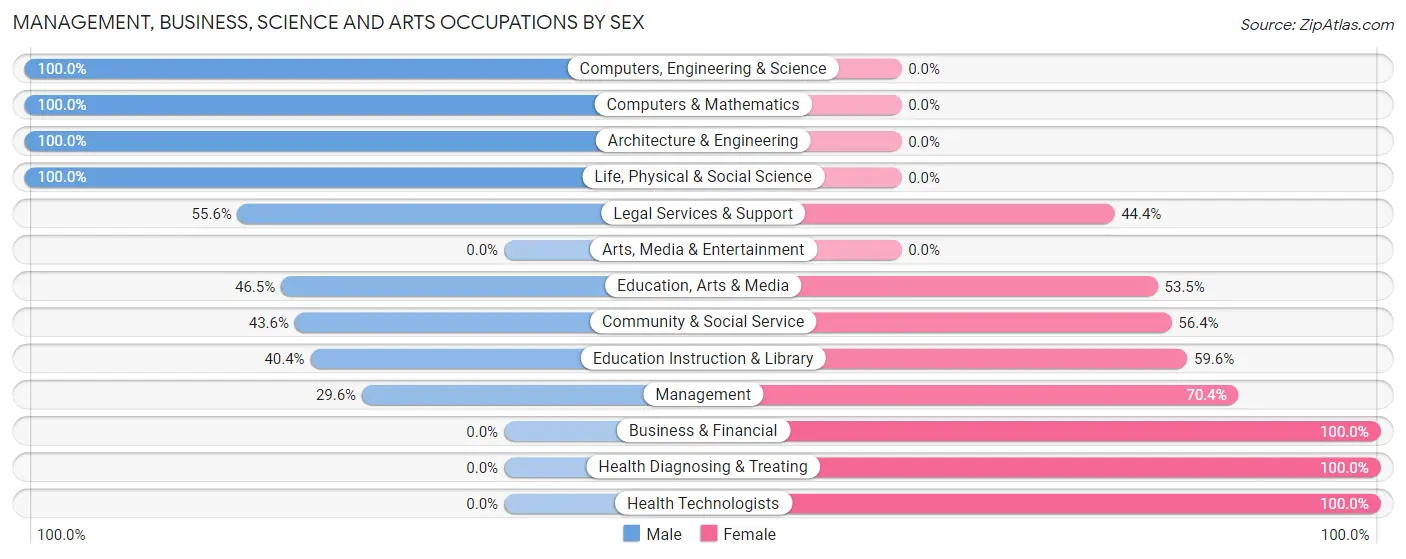
Management, Business, Science and Arts Occupations by Sex
Within the Management, Business, Science and Arts occupations in Holbrook, the most male-oriented occupations are Computers, Engineering & Science (100.0%), Computers & Mathematics (100.0%), and Architecture & Engineering (100.0%), while the most female-oriented occupations are Business & Financial (100.0%), Health Diagnosing & Treating (100.0%), and Health Technologists (100.0%).
| Occupation | Male | Female |
| Management | 24 (29.6%) | 57 (70.4%) |
| Business & Financial | 0 (0.0%) | 76 (100.0%) |
| Computers, Engineering & Science | 103 (100.0%) | 0 (0.0%) |
| Computers & Mathematics | 3 (100.0%) | 0 (0.0%) |
| Architecture & Engineering | 74 (100.0%) | 0 (0.0%) |
| Life, Physical & Social Science | 26 (100.0%) | 0 (0.0%) |
| Community & Social Service | 89 (43.6%) | 115 (56.4%) |
| Education, Arts & Media | 40 (46.5%) | 46 (53.5%) |
| Legal Services & Support | 5 (55.6%) | 4 (44.4%) |
| Education Instruction & Library | 44 (40.4%) | 65 (59.6%) |
| Arts, Media & Entertainment | 0 (0.0%) | 0 (0.0%) |
| Health Diagnosing & Treating | 0 (0.0%) | 30 (100.0%) |
| Health Technologists | 0 (0.0%) | 11 (100.0%) |
| Total (Category) | 216 (43.7%) | 278 (56.3%) |
| Total (Overall) | 813 (50.9%) | 785 (49.1%) |
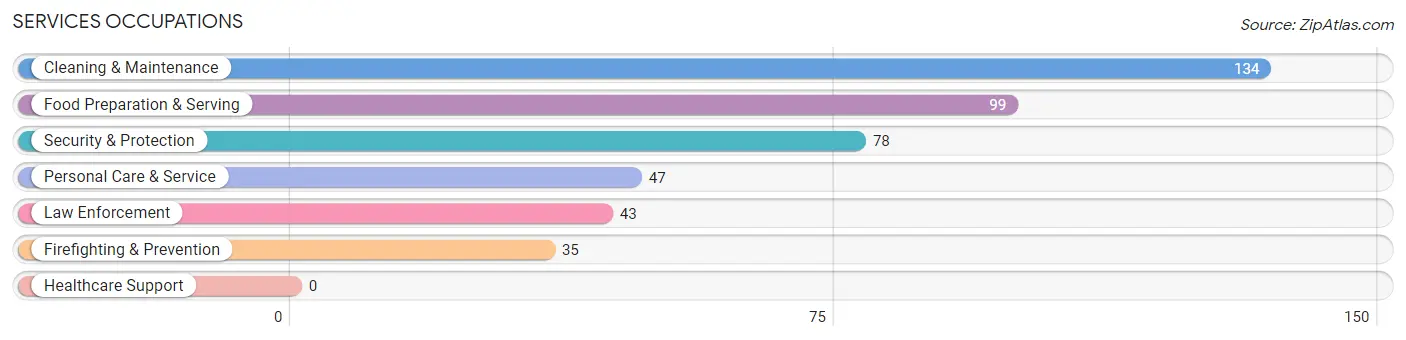
Services Occupations
The most common Services occupations in Holbrook are Cleaning & Maintenance (134 | 8.4%), Food Preparation & Serving (99 | 6.2%), Security & Protection (78 | 4.9%), Personal Care & Service (47 | 2.9%), and Law Enforcement (43 | 2.7%).
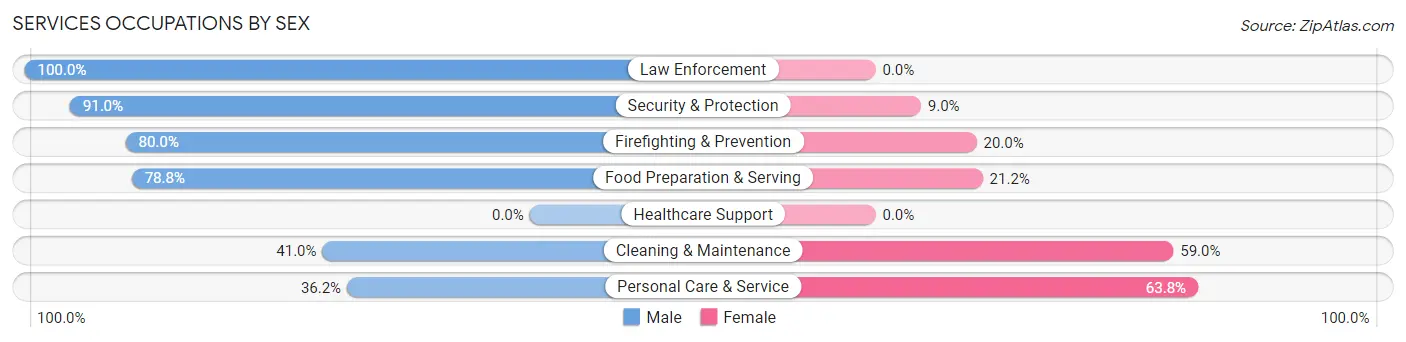
Services Occupations by Sex
Within the Services occupations in Holbrook, the most male-oriented occupations are Law Enforcement (100.0%), Security & Protection (91.0%), and Firefighting & Prevention (80.0%), while the most female-oriented occupations are Personal Care & Service (63.8%), Cleaning & Maintenance (59.0%), and Food Preparation & Serving (21.2%).
| Occupation | Male | Female |
| Healthcare Support | 0 (0.0%) | 0 (0.0%) |
| Security & Protection | 71 (91.0%) | 7 (9.0%) |
| Firefighting & Prevention | 28 (80.0%) | 7 (20.0%) |
| Law Enforcement | 43 (100.0%) | 0 (0.0%) |
| Food Preparation & Serving | 78 (78.8%) | 21 (21.2%) |
| Cleaning & Maintenance | 55 (41.0%) | 79 (59.0%) |
| Personal Care & Service | 17 (36.2%) | 30 (63.8%) |
| Total (Category) | 221 (61.7%) | 137 (38.3%) |
| Total (Overall) | 813 (50.9%) | 785 (49.1%) |
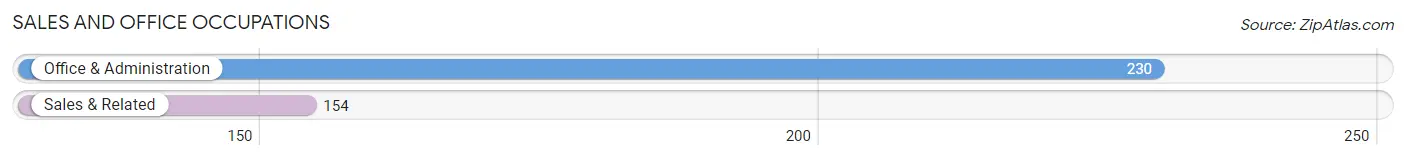
Sales and Office Occupations
The most common Sales and Office occupations in Holbrook are Office & Administration (230 | 14.4%), and Sales & Related (154 | 9.6%).
Sales and Office Occupations by Sex
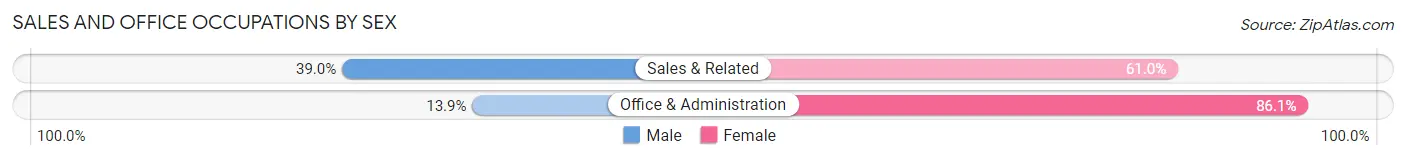
| Occupation | Male | Female |
| Sales & Related | 60 (39.0%) | 94 (61.0%) |
| Office & Administration | 32 (13.9%) | 198 (86.1%) |
| Total (Category) | 92 (24.0%) | 292 (76.0%) |
| Total (Overall) | 813 (50.9%) | 785 (49.1%) |
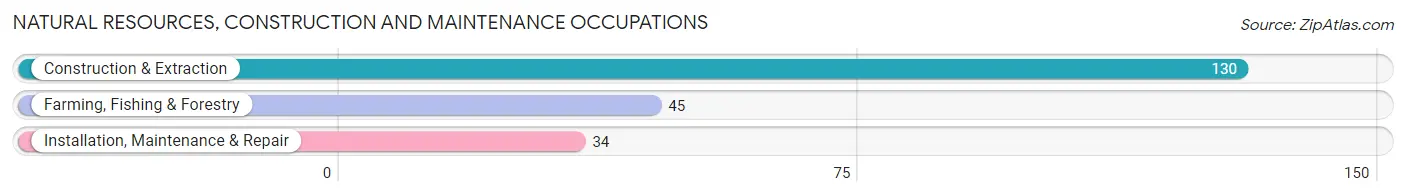
Natural Resources, Construction and Maintenance Occupations
The most common Natural Resources, Construction and Maintenance occupations in Holbrook are Construction & Extraction (130 | 8.1%), Farming, Fishing & Forestry (45 | 2.8%), and Installation, Maintenance & Repair (34 | 2.1%).
Natural Resources, Construction and Maintenance Occupations by Sex
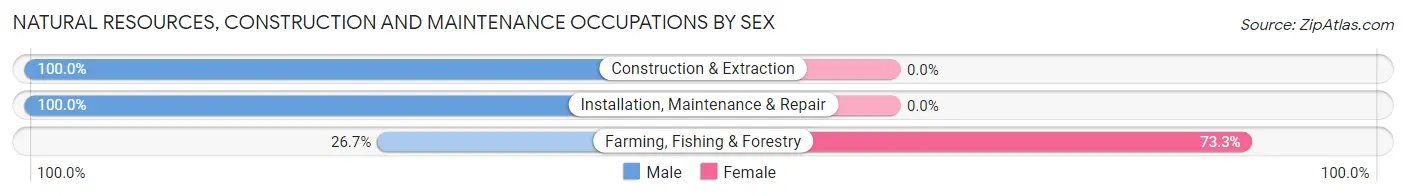
| Occupation | Male | Female |
| Farming, Fishing & Forestry | 12 (26.7%) | 33 (73.3%) |
| Construction & Extraction | 130 (100.0%) | 0 (0.0%) |
| Installation, Maintenance & Repair | 34 (100.0%) | 0 (0.0%) |
| Total (Category) | 176 (84.2%) | 33 (15.8%) |
| Total (Overall) | 813 (50.9%) | 785 (49.1%) |
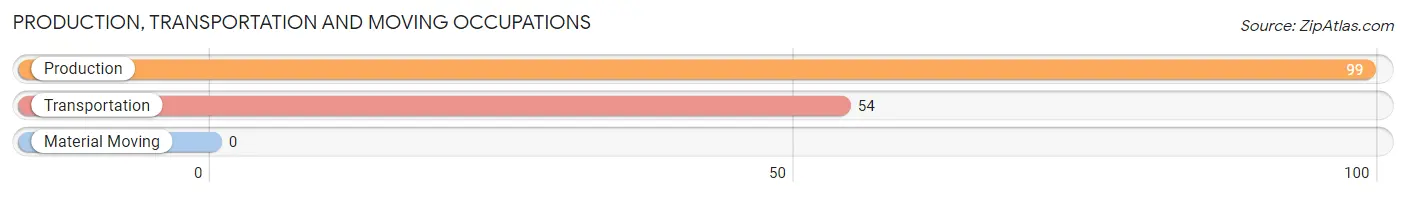
Production, Transportation and Moving Occupations
The most common Production, Transportation and Moving occupations in Holbrook are Production (99 | 6.2%), and Transportation (54 | 3.4%).
Production, Transportation and Moving Occupations by Sex
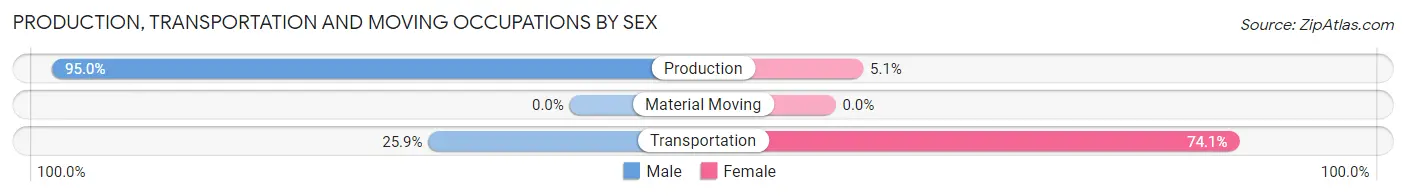
| Occupation | Male | Female |
| Production | 94 (95.0%) | 5 (5.1%) |
| Transportation | 14 (25.9%) | 40 (74.1%) |
| Material Moving | 0 (0.0%) | 0 (0.0%) |
| Total (Category) | 108 (70.6%) | 45 (29.4%) |
| Total (Overall) | 813 (50.9%) | 785 (49.1%) |
Employment Industries by Sex in Holbrook
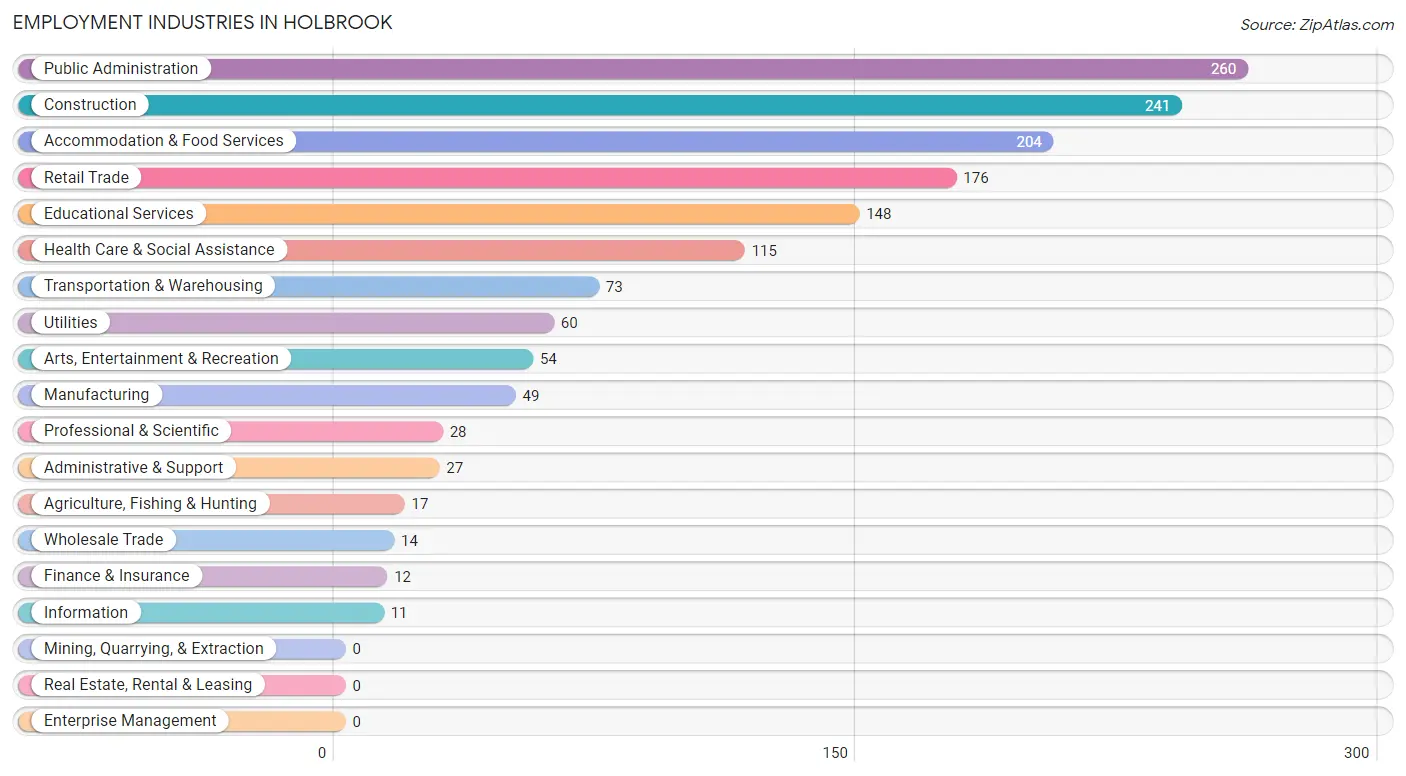
Employment Industries in Holbrook
The major employment industries in Holbrook include Public Administration (260 | 16.3%), Construction (241 | 15.1%), Accommodation & Food Services (204 | 12.8%), Retail Trade (176 | 11.0%), and Educational Services (148 | 9.3%).
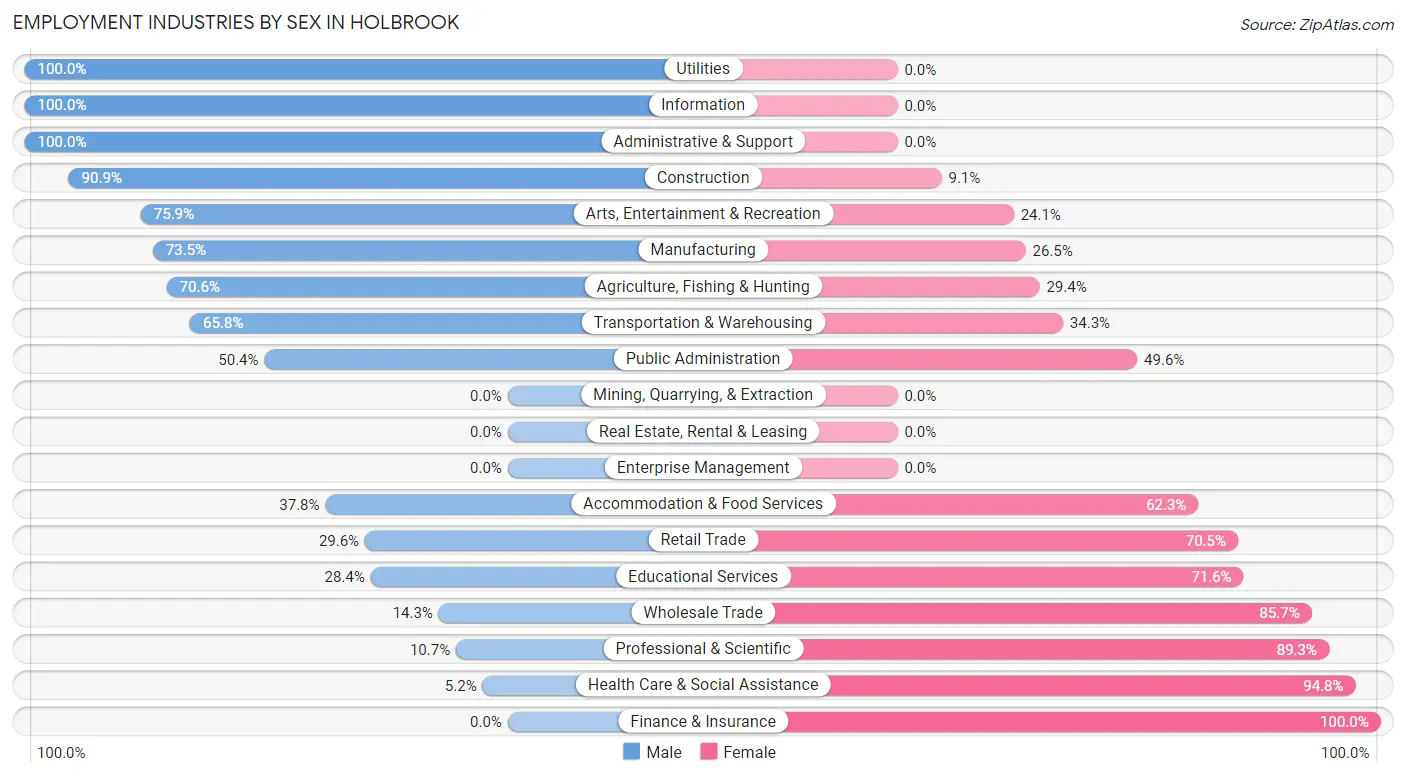
Employment Industries by Sex in Holbrook
The Holbrook industries that see more men than women are Utilities (100.0%), Information (100.0%), and Administrative & Support (100.0%), whereas the industries that tend to have a higher number of women are Finance & Insurance (100.0%), Health Care & Social Assistance (94.8%), and Professional & Scientific (89.3%).
| Industry | Male | Female |
| Agriculture, Fishing & Hunting | 12 (70.6%) | 5 (29.4%) |
| Mining, Quarrying, & Extraction | 0 (0.0%) | 0 (0.0%) |
| Construction | 219 (90.9%) | 22 (9.1%) |
| Manufacturing | 36 (73.5%) | 13 (26.5%) |
| Wholesale Trade | 2 (14.3%) | 12 (85.7%) |
| Retail Trade | 52 (29.5%) | 124 (70.5%) |
| Transportation & Warehousing | 48 (65.7%) | 25 (34.3%) |
| Utilities | 60 (100.0%) | 0 (0.0%) |
| Information | 11 (100.0%) | 0 (0.0%) |
| Finance & Insurance | 0 (0.0%) | 12 (100.0%) |
| Real Estate, Rental & Leasing | 0 (0.0%) | 0 (0.0%) |
| Professional & Scientific | 3 (10.7%) | 25 (89.3%) |
| Enterprise Management | 0 (0.0%) | 0 (0.0%) |
| Administrative & Support | 27 (100.0%) | 0 (0.0%) |
| Educational Services | 42 (28.4%) | 106 (71.6%) |
| Health Care & Social Assistance | 6 (5.2%) | 109 (94.8%) |
| Arts, Entertainment & Recreation | 41 (75.9%) | 13 (24.1%) |
| Accommodation & Food Services | 77 (37.8%) | 127 (62.3%) |
| Public Administration | 131 (50.4%) | 129 (49.6%) |
| Total | 813 (50.9%) | 785 (49.1%) |
Education in Holbrook
School Enrollment in Holbrook
The most common levels of schooling among the 1,267 students in Holbrook are middle school (459 | 36.2%), high school (307 | 24.2%), and elementary school (251 | 19.8%).
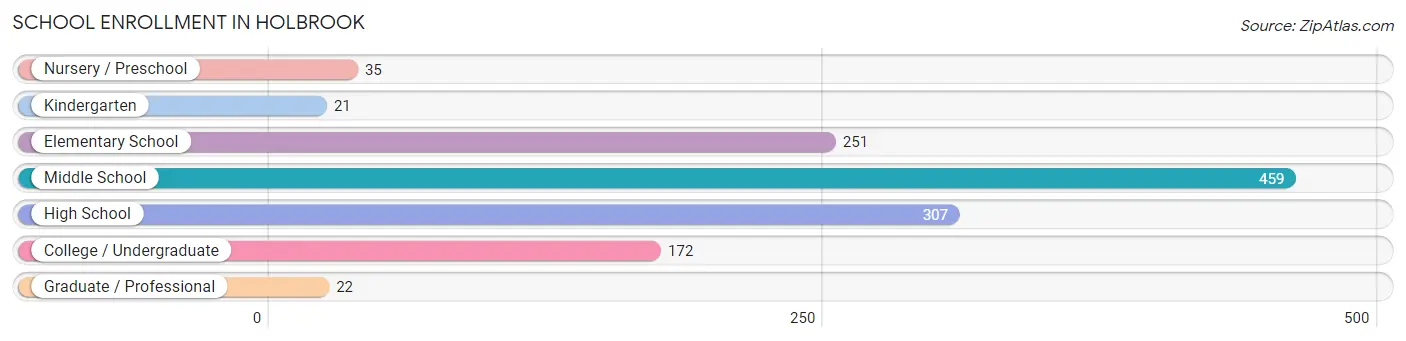
| School Level | # Students | % Students |
| Nursery / Preschool | 35 | 2.8% |
| Kindergarten | 21 | 1.7% |
| Elementary School | 251 | 19.8% |
| Middle School | 459 | 36.2% |
| High School | 307 | 24.2% |
| College / Undergraduate | 172 | 13.6% |
| Graduate / Professional | 22 | 1.7% |
| Total | 1,267 | 100.0% |
School Enrollment by Age by Funding Source in Holbrook
Out of a total of 1,267 students who are enrolled in schools in Holbrook, 109 (8.6%) attend a private institution, while the remaining 1,158 (91.4%) are enrolled in public schools. The age group of 25 to 34 year olds has the highest likelihood of being enrolled in private schools, with 15 (83.3% in the age bracket) enrolled. Conversely, the age group of 5 to 9 year old has the lowest likelihood of being enrolled in a private school, with 163 (100.0% in the age bracket) attending a public institution.
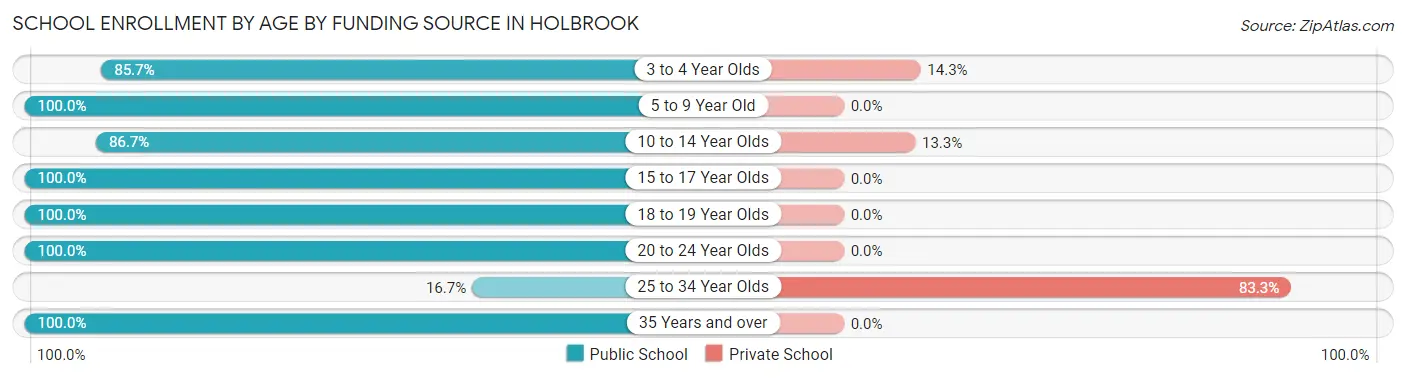
| Age Bracket | Public School | Private School |
| 3 to 4 Year Olds | 30 (85.7%) | 5 (14.3%) |
| 5 to 9 Year Old | 163 (100.0%) | 0 (0.0%) |
| 10 to 14 Year Olds | 580 (86.7%) | 89 (13.3%) |
| 15 to 17 Year Olds | 170 (100.0%) | 0 (0.0%) |
| 18 to 19 Year Olds | 21 (100.0%) | 0 (0.0%) |
| 20 to 24 Year Olds | 64 (100.0%) | 0 (0.0%) |
| 25 to 34 Year Olds | 3 (16.7%) | 15 (83.3%) |
| 35 Years and over | 127 (100.0%) | 0 (0.0%) |
| Total | 1,158 (91.4%) | 109 (8.6%) |
Educational Attainment by Field of Study in Holbrook
Education (107 | 24.6%), communications (60 | 13.8%), bio, nature & agricultural (58 | 13.3%), psychology (56 | 12.9%), and business (41 | 9.4%) are the most common fields of study among 435 individuals in Holbrook who have obtained a bachelor's degree or higher.
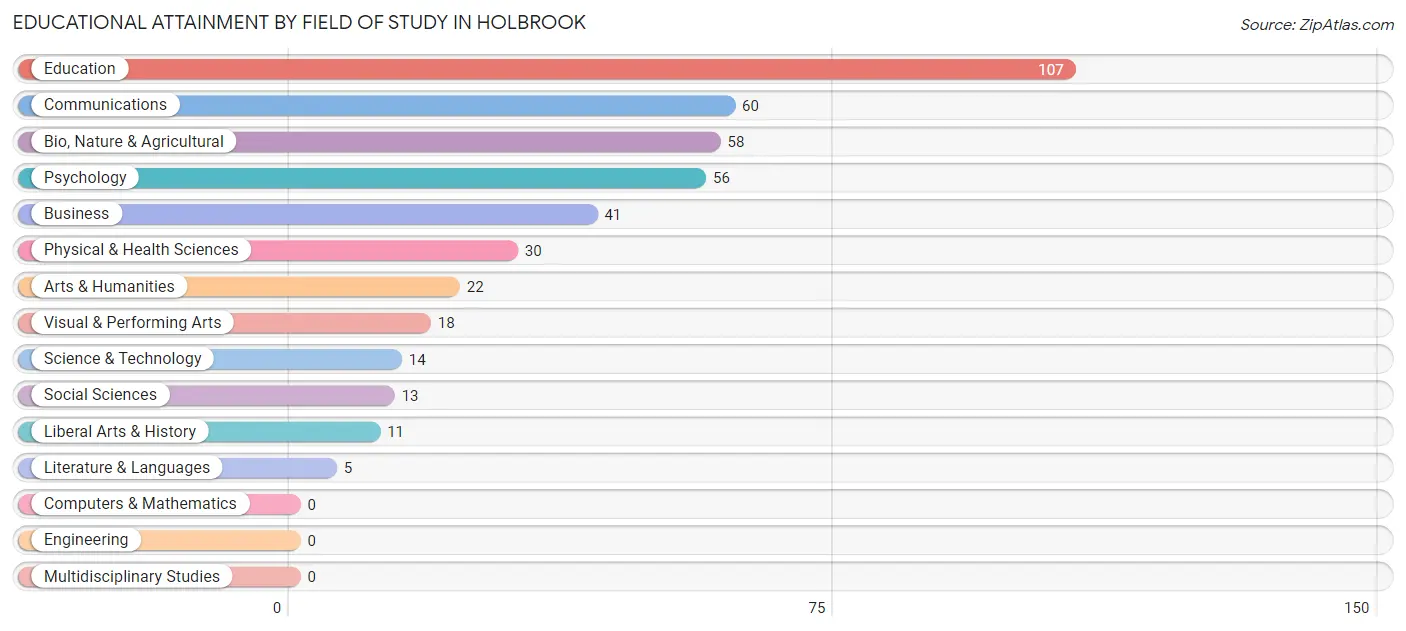
| Field of Study | # Graduates | % Graduates |
| Computers & Mathematics | 0 | 0.0% |
| Bio, Nature & Agricultural | 58 | 13.3% |
| Physical & Health Sciences | 30 | 6.9% |
| Psychology | 56 | 12.9% |
| Social Sciences | 13 | 3.0% |
| Engineering | 0 | 0.0% |
| Multidisciplinary Studies | 0 | 0.0% |
| Science & Technology | 14 | 3.2% |
| Business | 41 | 9.4% |
| Education | 107 | 24.6% |
| Literature & Languages | 5 | 1.1% |
| Liberal Arts & History | 11 | 2.5% |
| Visual & Performing Arts | 18 | 4.1% |
| Communications | 60 | 13.8% |
| Arts & Humanities | 22 | 5.1% |
| Total | 435 | 100.0% |
Transportation & Commute in Holbrook
Vehicle Availability by Sex in Holbrook
The most prevalent vehicle ownership categories in Holbrook are males with 1 vehicle (246, accounting for 31.3%) and females with 1 vehicle (150, making up 33.6%).
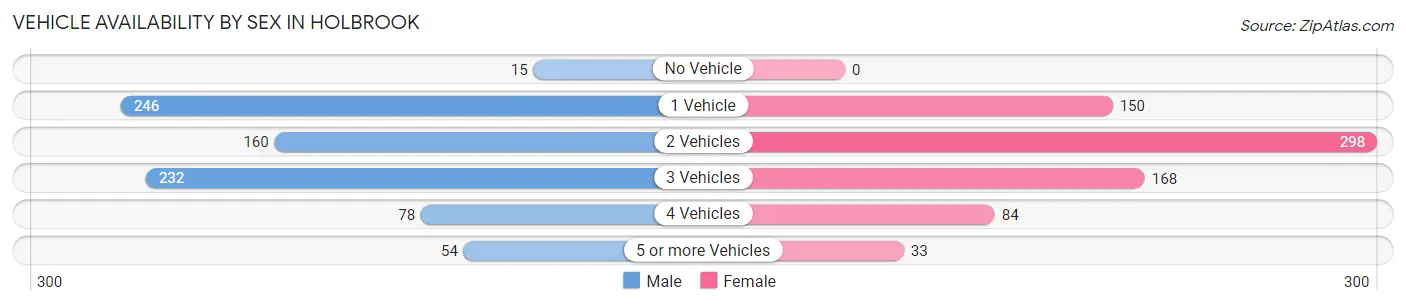
| Vehicles Available | Male | Female |
| No Vehicle | 15 (1.9%) | 0 (0.0%) |
| 1 Vehicle | 246 (31.3%) | 150 (20.5%) |
| 2 Vehicles | 160 (20.4%) | 298 (40.6%) |
| 3 Vehicles | 232 (29.5%) | 168 (22.9%) |
| 4 Vehicles | 78 (9.9%) | 84 (11.5%) |
| 5 or more Vehicles | 54 (6.9%) | 33 (4.5%) |
| Total | 785 (100.0%) | 733 (100.0%) |
Commute Time in Holbrook
The most frequently occuring commute durations in Holbrook are 5 to 9 minutes (535 commuters, 34.3%), less than 5 minutes (317 commuters, 20.3%), and 15 to 19 minutes (229 commuters, 14.7%).
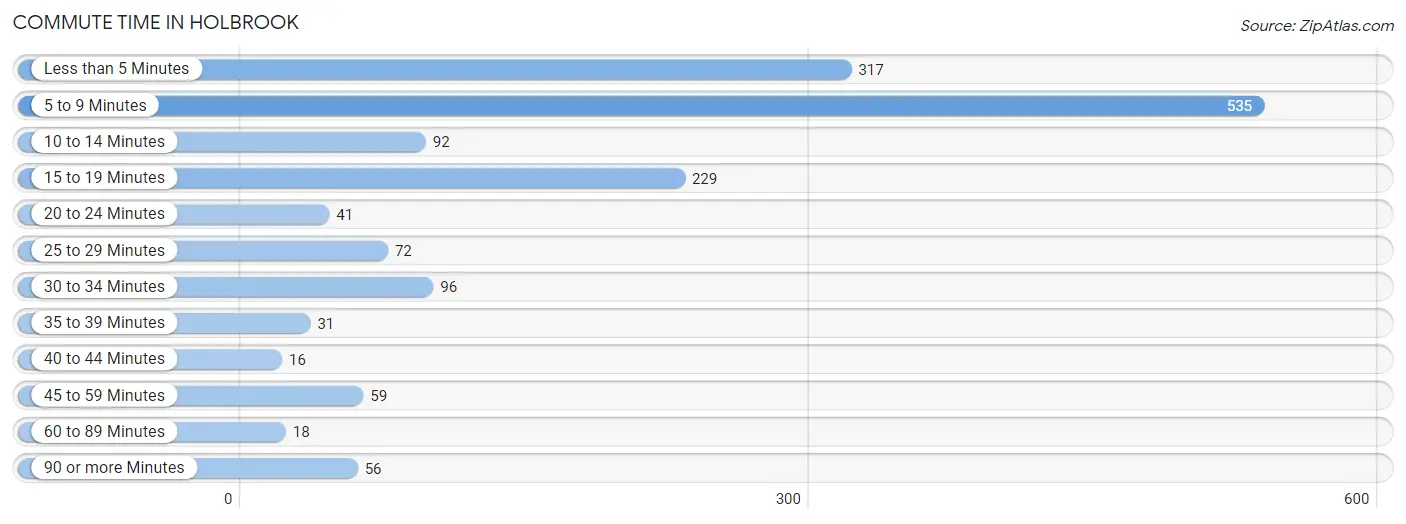
| Commute Time | # Commuters | % Commuters |
| Less than 5 Minutes | 317 | 20.3% |
| 5 to 9 Minutes | 535 | 34.3% |
| 10 to 14 Minutes | 92 | 5.9% |
| 15 to 19 Minutes | 229 | 14.7% |
| 20 to 24 Minutes | 41 | 2.6% |
| 25 to 29 Minutes | 72 | 4.6% |
| 30 to 34 Minutes | 96 | 6.1% |
| 35 to 39 Minutes | 31 | 2.0% |
| 40 to 44 Minutes | 16 | 1.0% |
| 45 to 59 Minutes | 59 | 3.8% |
| 60 to 89 Minutes | 18 | 1.1% |
| 90 or more Minutes | 56 | 3.6% |
Commute Time by Sex in Holbrook
The most common commute times in Holbrook are 5 to 9 minutes (276 commuters, 34.0%) for males and 5 to 9 minutes (259 commuters, 34.6%) for females.
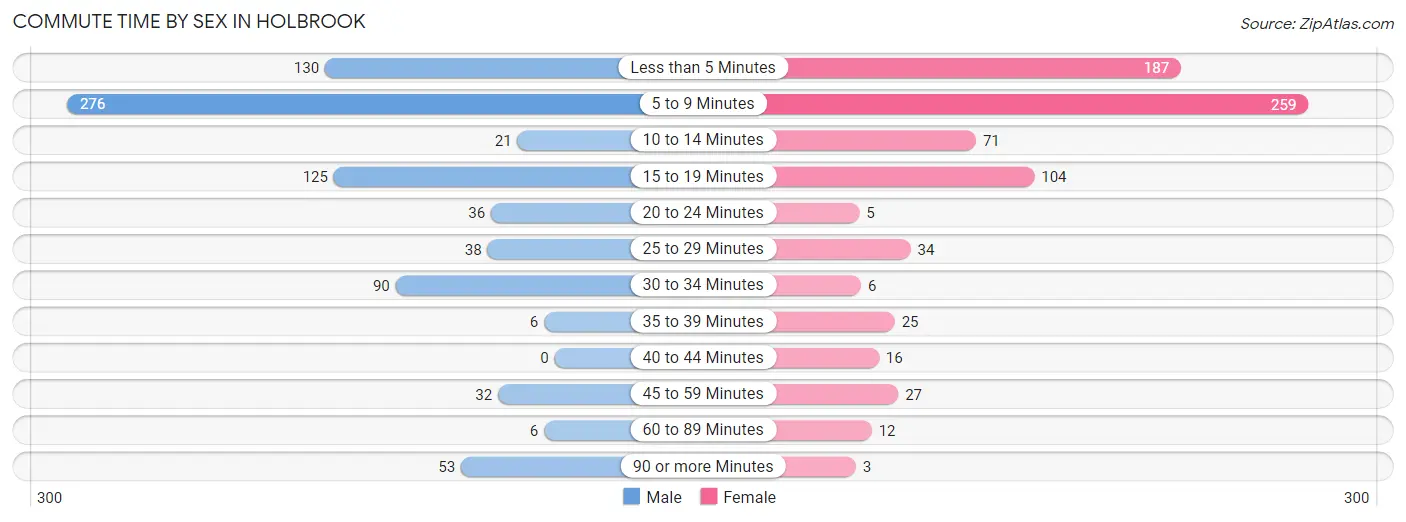
| Commute Time | Male | Female |
| Less than 5 Minutes | 130 (16.0%) | 187 (25.0%) |
| 5 to 9 Minutes | 276 (34.0%) | 259 (34.6%) |
| 10 to 14 Minutes | 21 (2.6%) | 71 (9.5%) |
| 15 to 19 Minutes | 125 (15.4%) | 104 (13.9%) |
| 20 to 24 Minutes | 36 (4.4%) | 5 (0.7%) |
| 25 to 29 Minutes | 38 (4.7%) | 34 (4.5%) |
| 30 to 34 Minutes | 90 (11.1%) | 6 (0.8%) |
| 35 to 39 Minutes | 6 (0.7%) | 25 (3.3%) |
| 40 to 44 Minutes | 0 (0.0%) | 16 (2.1%) |
| 45 to 59 Minutes | 32 (3.9%) | 27 (3.6%) |
| 60 to 89 Minutes | 6 (0.7%) | 12 (1.6%) |
| 90 or more Minutes | 53 (6.5%) | 3 (0.4%) |
Time of Departure to Work by Sex in Holbrook
The most frequent times of departure to work in Holbrook are 7:00 AM to 7:29 AM (143, 17.6%) for males and 7:00 AM to 7:29 AM (180, 24.0%) for females.
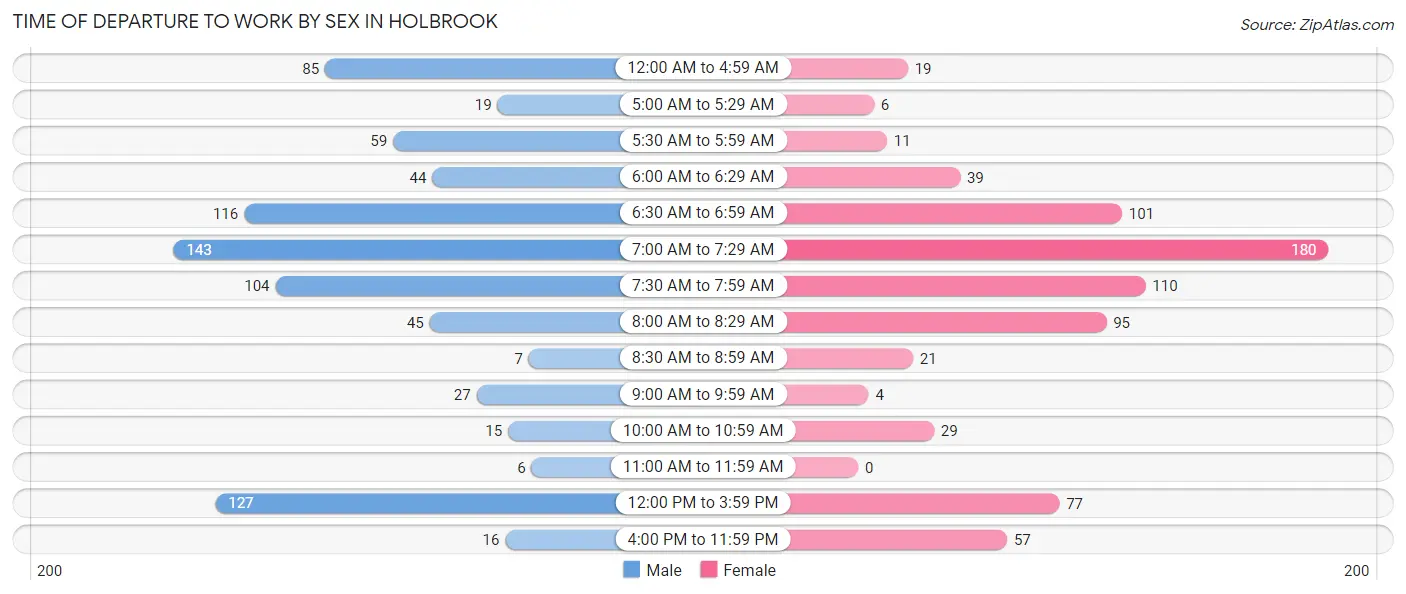
| Time of Departure | Male | Female |
| 12:00 AM to 4:59 AM | 85 (10.5%) | 19 (2.5%) |
| 5:00 AM to 5:29 AM | 19 (2.3%) | 6 (0.8%) |
| 5:30 AM to 5:59 AM | 59 (7.3%) | 11 (1.5%) |
| 6:00 AM to 6:29 AM | 44 (5.4%) | 39 (5.2%) |
| 6:30 AM to 6:59 AM | 116 (14.3%) | 101 (13.5%) |
| 7:00 AM to 7:29 AM | 143 (17.6%) | 180 (24.0%) |
| 7:30 AM to 7:59 AM | 104 (12.8%) | 110 (14.7%) |
| 8:00 AM to 8:29 AM | 45 (5.5%) | 95 (12.7%) |
| 8:30 AM to 8:59 AM | 7 (0.9%) | 21 (2.8%) |
| 9:00 AM to 9:59 AM | 27 (3.3%) | 4 (0.5%) |
| 10:00 AM to 10:59 AM | 15 (1.8%) | 29 (3.9%) |
| 11:00 AM to 11:59 AM | 6 (0.7%) | 0 (0.0%) |
| 12:00 PM to 3:59 PM | 127 (15.6%) | 77 (10.3%) |
| 4:00 PM to 11:59 PM | 16 (2.0%) | 57 (7.6%) |
| Total | 813 (100.0%) | 749 (100.0%) |
Housing Occupancy in Holbrook
Occupancy by Ownership in Holbrook
Of the total 1,528 dwellings in Holbrook, owner-occupied units account for 928 (60.7%), while renter-occupied units make up 600 (39.3%).
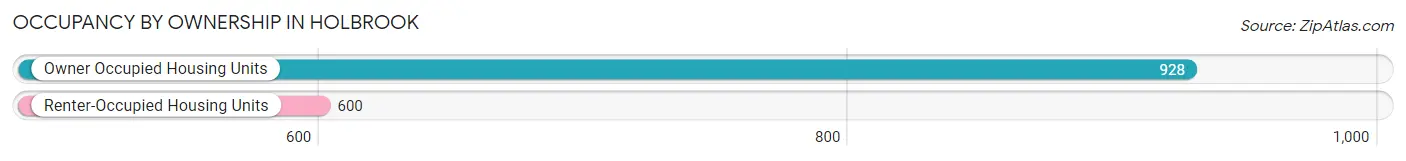
| Occupancy | # Housing Units | % Housing Units |
| Owner Occupied Housing Units | 928 | 60.7% |
| Renter-Occupied Housing Units | 600 | 39.3% |
| Total Occupied Housing Units | 1,528 | 100.0% |
Occupancy by Household Size in Holbrook
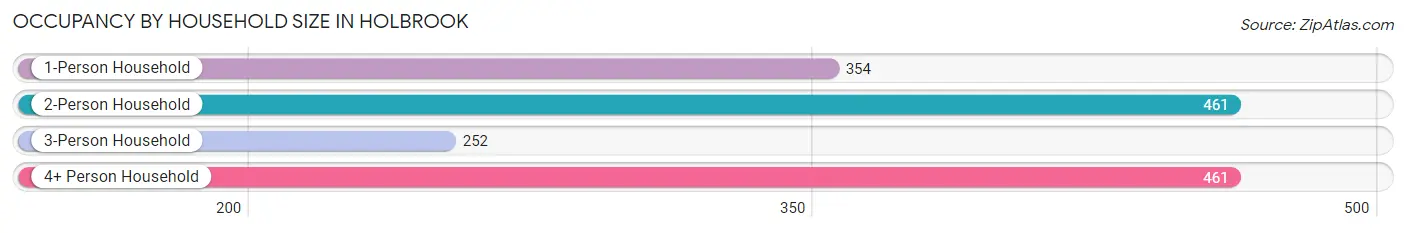
| Household Size | # Housing Units | % Housing Units |
| 1-Person Household | 354 | 23.2% |
| 2-Person Household | 461 | 30.2% |
| 3-Person Household | 252 | 16.5% |
| 4+ Person Household | 461 | 30.2% |
| Total Housing Units | 1,528 | 100.0% |
Occupancy by Ownership by Household Size in Holbrook
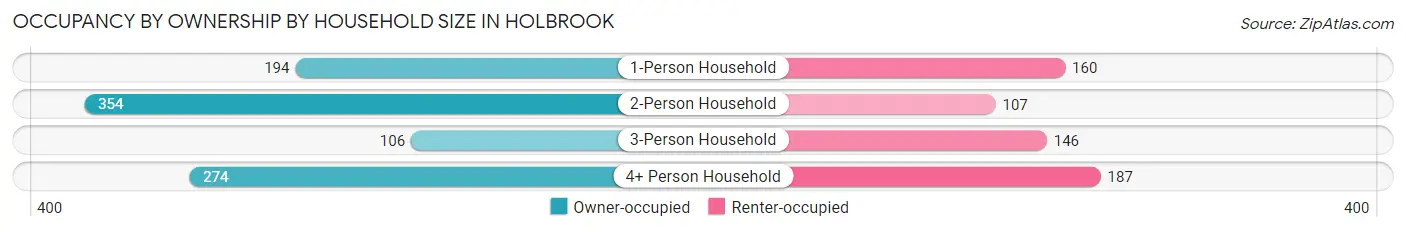
| Household Size | Owner-occupied | Renter-occupied |
| 1-Person Household | 194 (54.8%) | 160 (45.2%) |
| 2-Person Household | 354 (76.8%) | 107 (23.2%) |
| 3-Person Household | 106 (42.1%) | 146 (57.9%) |
| 4+ Person Household | 274 (59.4%) | 187 (40.6%) |
| Total Housing Units | 928 (60.7%) | 600 (39.3%) |
Occupancy by Educational Attainment in Holbrook
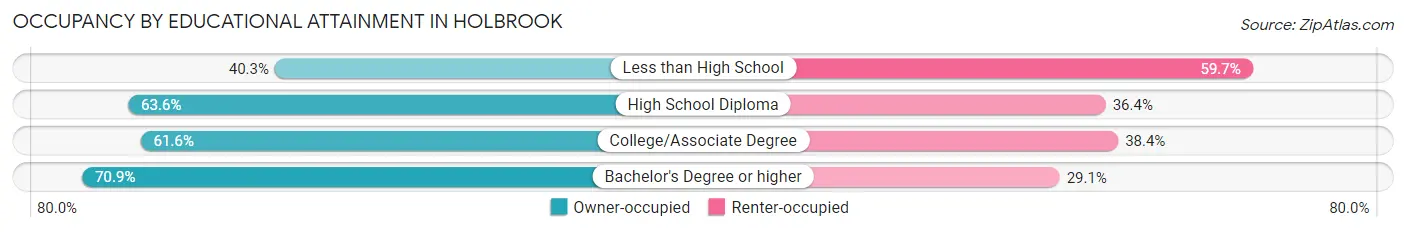
| Household Size | Owner-occupied | Renter-occupied |
| Less than High School | 79 (40.3%) | 117 (59.7%) |
| High School Diploma | 276 (63.6%) | 158 (36.4%) |
| College/Associate Degree | 422 (61.6%) | 263 (38.4%) |
| Bachelor's Degree or higher | 151 (70.9%) | 62 (29.1%) |
Occupancy by Age of Householder in Holbrook
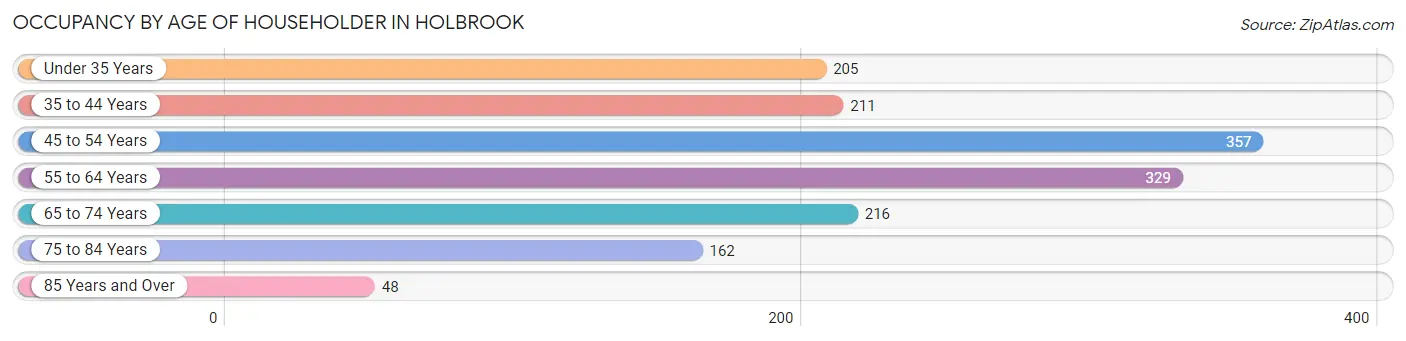
| Age Bracket | # Households | % Households |
| Under 35 Years | 205 | 13.4% |
| 35 to 44 Years | 211 | 13.8% |
| 45 to 54 Years | 357 | 23.4% |
| 55 to 64 Years | 329 | 21.5% |
| 65 to 74 Years | 216 | 14.1% |
| 75 to 84 Years | 162 | 10.6% |
| 85 Years and Over | 48 | 3.1% |
| Total | 1,528 | 100.0% |
Housing Finances in Holbrook
Median Income by Occupancy in Holbrook
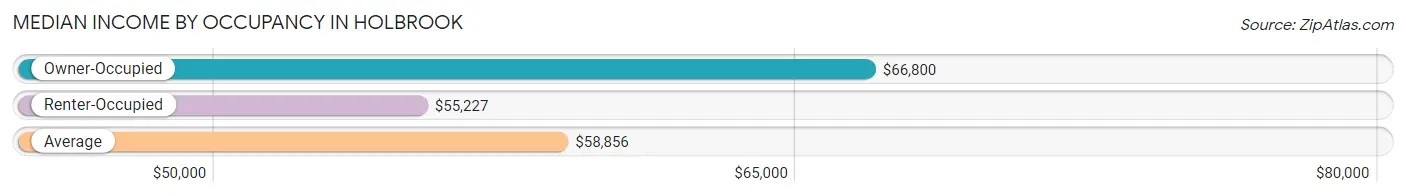
| Occupancy Type | # Households | Median Income |
| Owner-Occupied | 928 (60.7%) | $66,800 |
| Renter-Occupied | 600 (39.3%) | $55,227 |
| Average | 1,528 (100.0%) | $58,856 |
Occupancy by Householder Income Bracket in Holbrook
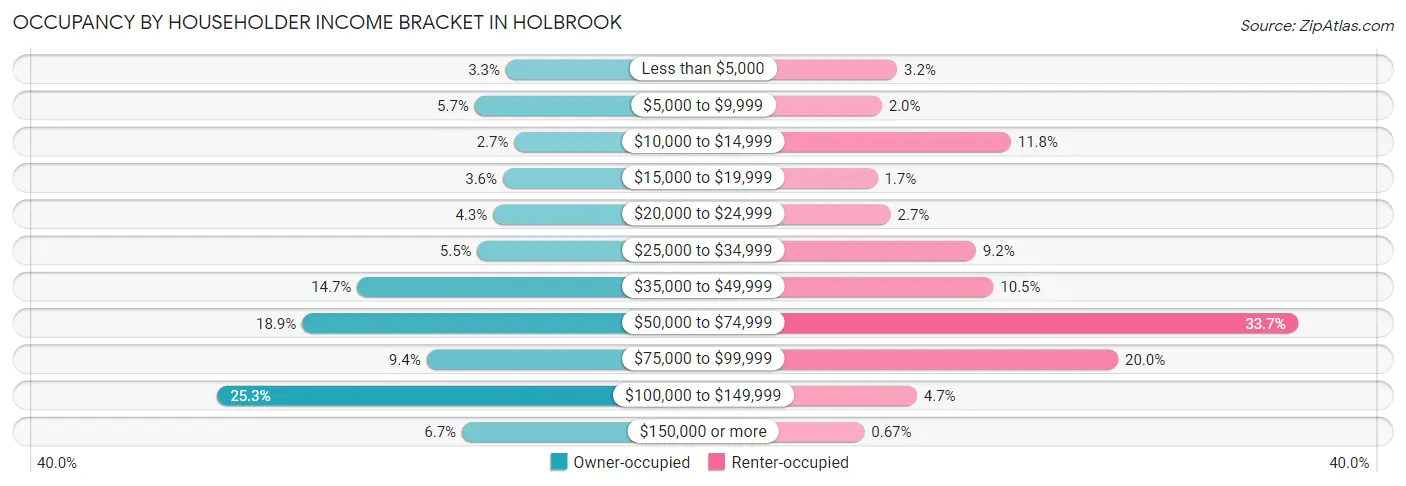
| Income Bracket | Owner-occupied | Renter-occupied |
| Less than $5,000 | 31 (3.3%) | 19 (3.2%) |
| $5,000 to $9,999 | 53 (5.7%) | 12 (2.0%) |
| $10,000 to $14,999 | 25 (2.7%) | 71 (11.8%) |
| $15,000 to $19,999 | 33 (3.6%) | 10 (1.7%) |
| $20,000 to $24,999 | 40 (4.3%) | 16 (2.7%) |
| $25,000 to $34,999 | 51 (5.5%) | 55 (9.2%) |
| $35,000 to $49,999 | 136 (14.7%) | 63 (10.5%) |
| $50,000 to $74,999 | 175 (18.9%) | 202 (33.7%) |
| $75,000 to $99,999 | 87 (9.4%) | 120 (20.0%) |
| $100,000 to $149,999 | 235 (25.3%) | 28 (4.7%) |
| $150,000 or more | 62 (6.7%) | 4 (0.7%) |
| Total | 928 (100.0%) | 600 (100.0%) |
Monthly Housing Cost Tiers in Holbrook
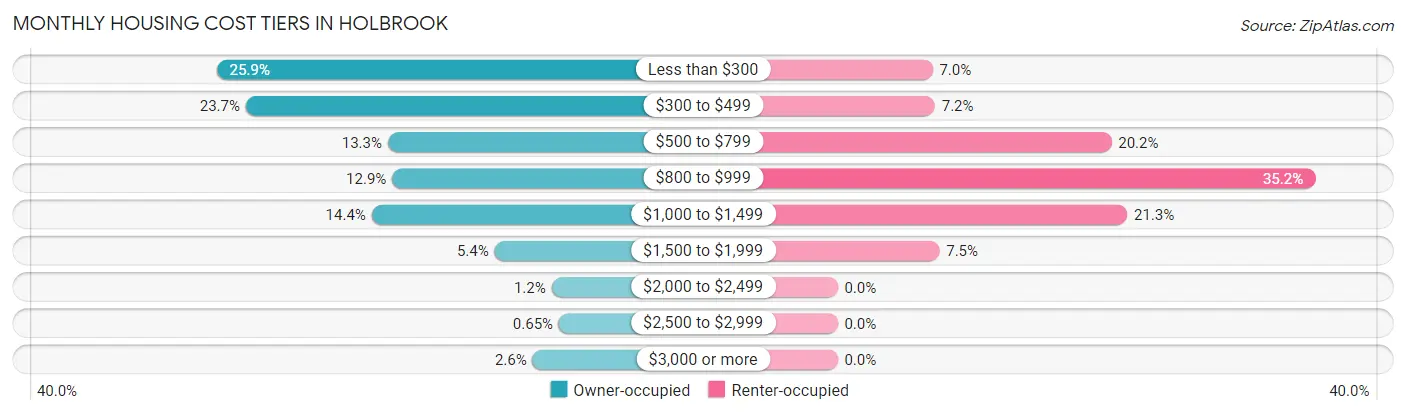
| Monthly Cost | Owner-occupied | Renter-occupied |
| Less than $300 | 240 (25.9%) | 42 (7.0%) |
| $300 to $499 | 220 (23.7%) | 43 (7.2%) |
| $500 to $799 | 123 (13.3%) | 121 (20.2%) |
| $800 to $999 | 120 (12.9%) | 211 (35.2%) |
| $1,000 to $1,499 | 134 (14.4%) | 128 (21.3%) |
| $1,500 to $1,999 | 50 (5.4%) | 45 (7.5%) |
| $2,000 to $2,499 | 11 (1.2%) | 0 (0.0%) |
| $2,500 to $2,999 | 6 (0.6%) | 0 (0.0%) |
| $3,000 or more | 24 (2.6%) | 0 (0.0%) |
| Total | 928 (100.0%) | 600 (100.0%) |
Physical Housing Characteristics in Holbrook
Housing Structures in Holbrook
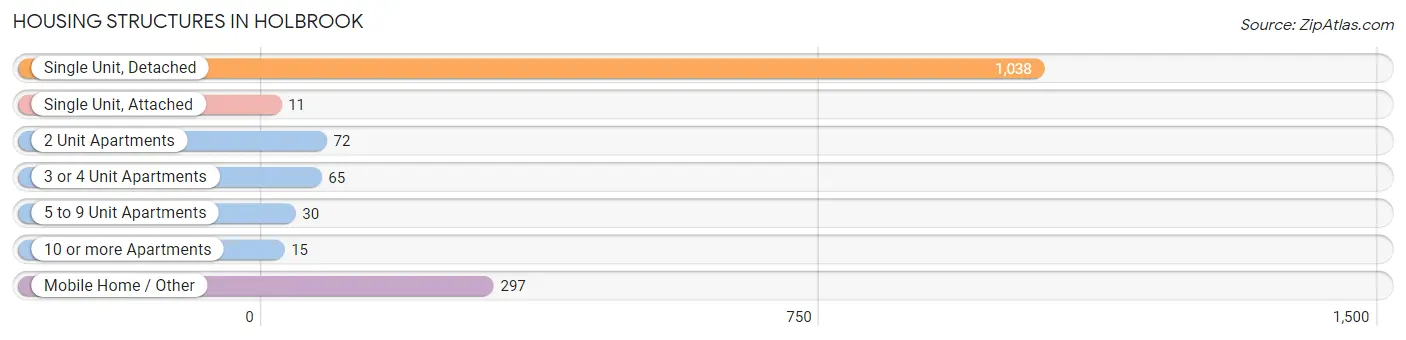
| Structure Type | # Housing Units | % Housing Units |
| Single Unit, Detached | 1,038 | 67.9% |
| Single Unit, Attached | 11 | 0.7% |
| 2 Unit Apartments | 72 | 4.7% |
| 3 or 4 Unit Apartments | 65 | 4.3% |
| 5 to 9 Unit Apartments | 30 | 2.0% |
| 10 or more Apartments | 15 | 1.0% |
| Mobile Home / Other | 297 | 19.4% |
| Total | 1,528 | 100.0% |
Housing Structures by Occupancy in Holbrook
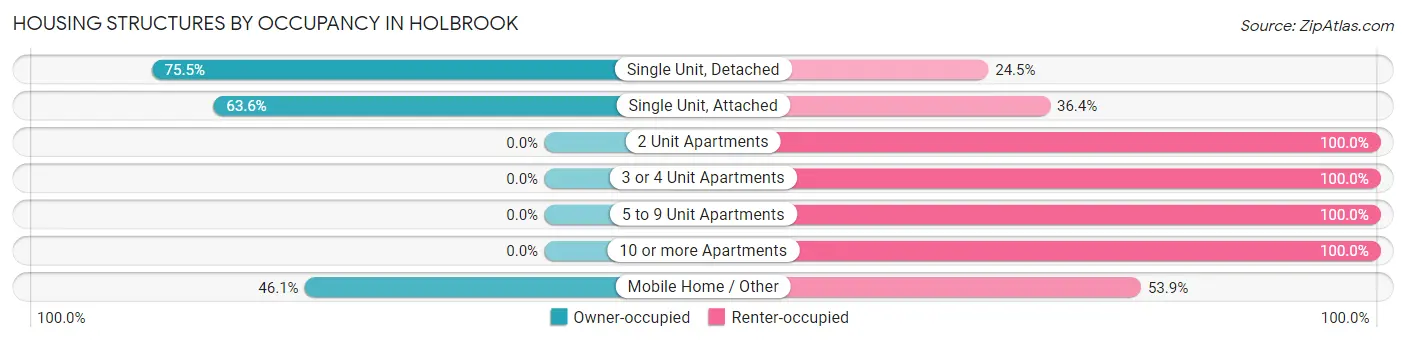
| Structure Type | Owner-occupied | Renter-occupied |
| Single Unit, Detached | 784 (75.5%) | 254 (24.5%) |
| Single Unit, Attached | 7 (63.6%) | 4 (36.4%) |
| 2 Unit Apartments | 0 (0.0%) | 72 (100.0%) |
| 3 or 4 Unit Apartments | 0 (0.0%) | 65 (100.0%) |
| 5 to 9 Unit Apartments | 0 (0.0%) | 30 (100.0%) |
| 10 or more Apartments | 0 (0.0%) | 15 (100.0%) |
| Mobile Home / Other | 137 (46.1%) | 160 (53.9%) |
| Total | 928 (60.7%) | 600 (39.3%) |
Housing Structures by Number of Rooms in Holbrook
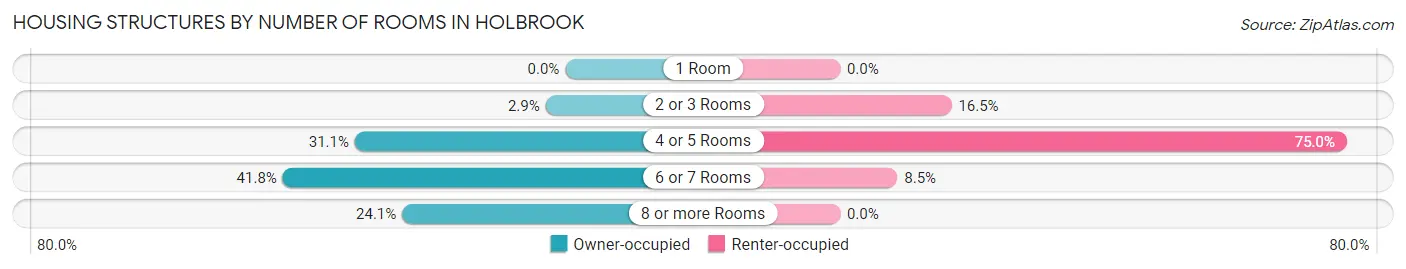
| Number of Rooms | Owner-occupied | Renter-occupied |
| 1 Room | 0 (0.0%) | 0 (0.0%) |
| 2 or 3 Rooms | 27 (2.9%) | 99 (16.5%) |
| 4 or 5 Rooms | 289 (31.1%) | 450 (75.0%) |
| 6 or 7 Rooms | 388 (41.8%) | 51 (8.5%) |
| 8 or more Rooms | 224 (24.1%) | 0 (0.0%) |
| Total | 928 (100.0%) | 600 (100.0%) |
Housing Structure by Heating Type in Holbrook
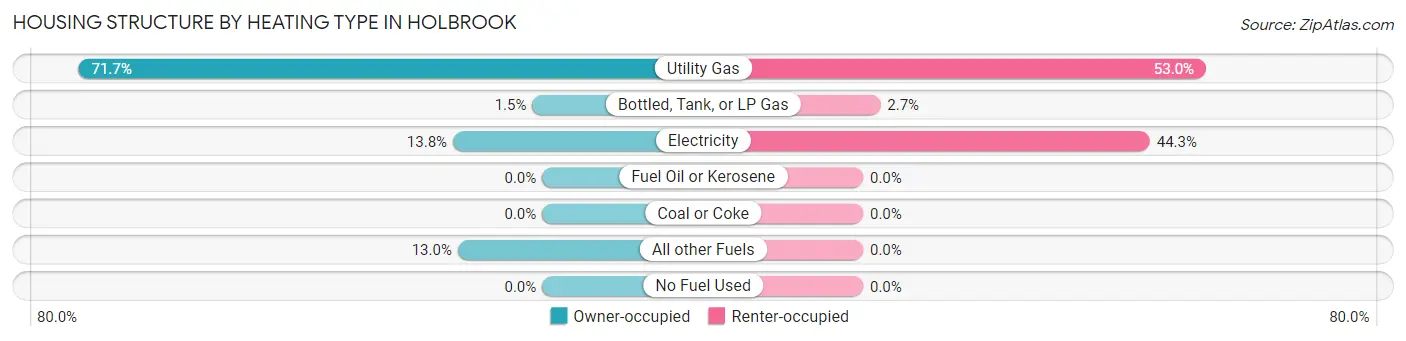
| Heating Type | Owner-occupied | Renter-occupied |
| Utility Gas | 665 (71.7%) | 318 (53.0%) |
| Bottled, Tank, or LP Gas | 14 (1.5%) | 16 (2.7%) |
| Electricity | 128 (13.8%) | 266 (44.3%) |
| Fuel Oil or Kerosene | 0 (0.0%) | 0 (0.0%) |
| Coal or Coke | 0 (0.0%) | 0 (0.0%) |
| All other Fuels | 121 (13.0%) | 0 (0.0%) |
| No Fuel Used | 0 (0.0%) | 0 (0.0%) |
| Total | 928 (100.0%) | 600 (100.0%) |
Household Vehicle Usage in Holbrook
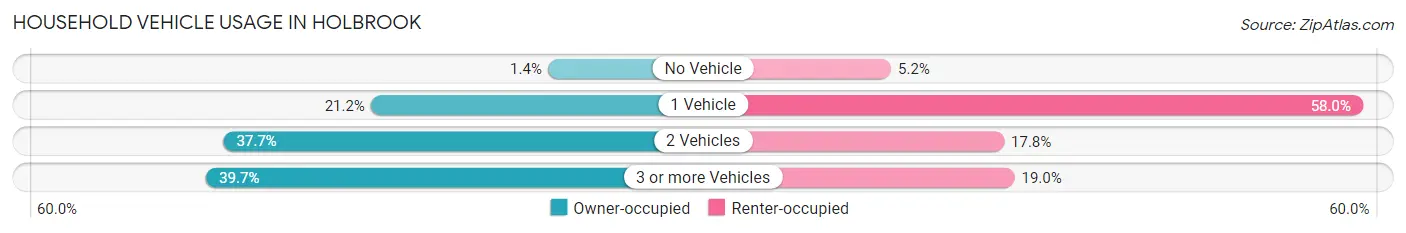
| Vehicles per Household | Owner-occupied | Renter-occupied |
| No Vehicle | 13 (1.4%) | 31 (5.2%) |
| 1 Vehicle | 197 (21.2%) | 348 (58.0%) |
| 2 Vehicles | 350 (37.7%) | 107 (17.8%) |
| 3 or more Vehicles | 368 (39.7%) | 114 (19.0%) |
| Total | 928 (100.0%) | 600 (100.0%) |
Real Estate & Mortgages in Holbrook
Real Estate and Mortgage Overview in Holbrook
| Characteristic | Without Mortgage | With Mortgage |
| Housing Units | 514 | 414 |
| Median Property Value | $111,500 | $142,900 |
| Median Household Income | $49,554 | $58 |
| Monthly Housing Costs | $314 | $24 |
| Real Estate Taxes | $411 | $6 |
Property Value by Mortgage Status in Holbrook
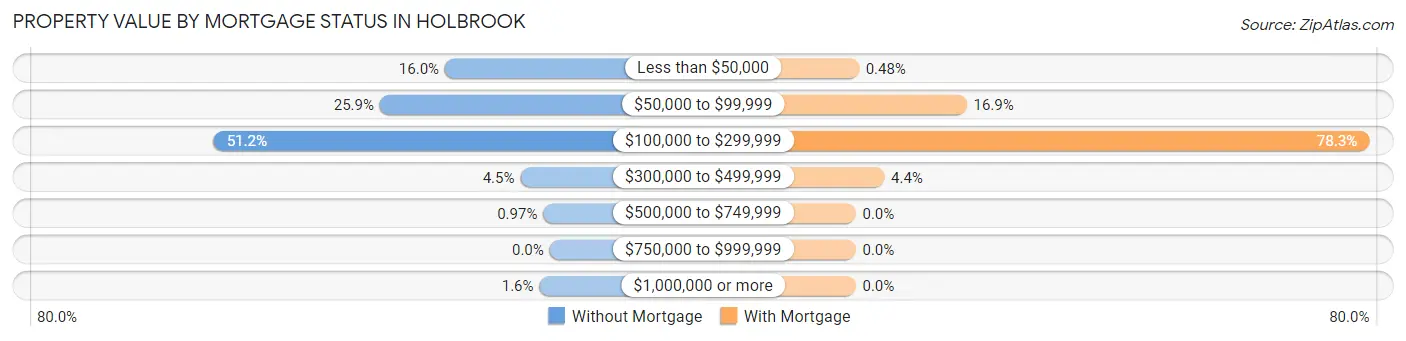
| Property Value | Without Mortgage | With Mortgage |
| Less than $50,000 | 82 (16.0%) | 2 (0.5%) |
| $50,000 to $99,999 | 133 (25.9%) | 70 (16.9%) |
| $100,000 to $299,999 | 263 (51.2%) | 324 (78.3%) |
| $300,000 to $499,999 | 23 (4.5%) | 18 (4.3%) |
| $500,000 to $749,999 | 5 (1.0%) | 0 (0.0%) |
| $750,000 to $999,999 | 0 (0.0%) | 0 (0.0%) |
| $1,000,000 or more | 8 (1.6%) | 0 (0.0%) |
| Total | 514 (100.0%) | 414 (100.0%) |
Household Income by Mortgage Status in Holbrook
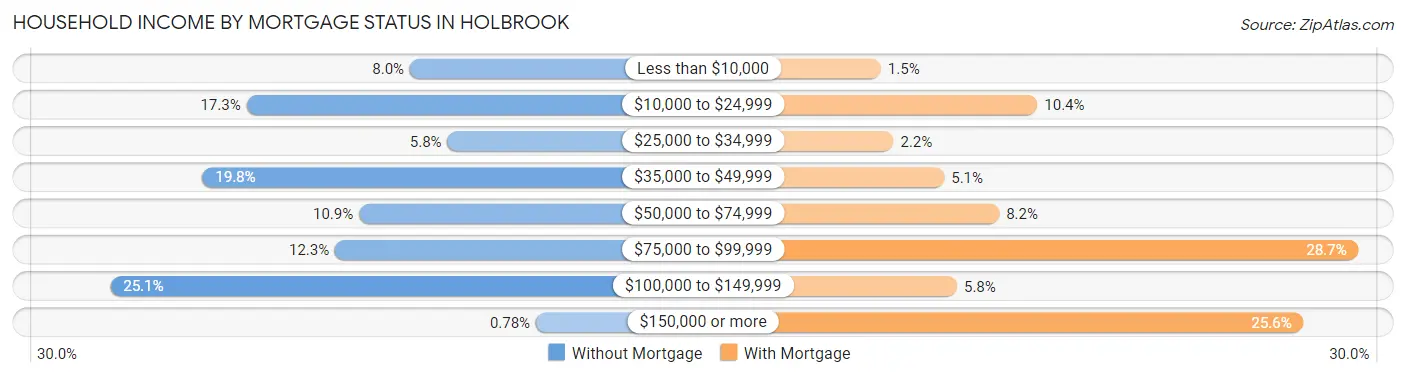
| Household Income | Without Mortgage | With Mortgage |
| Less than $10,000 | 41 (8.0%) | 6 (1.5%) |
| $10,000 to $24,999 | 89 (17.3%) | 43 (10.4%) |
| $25,000 to $34,999 | 30 (5.8%) | 9 (2.2%) |
| $35,000 to $49,999 | 102 (19.8%) | 21 (5.1%) |
| $50,000 to $74,999 | 56 (10.9%) | 34 (8.2%) |
| $75,000 to $99,999 | 63 (12.3%) | 119 (28.7%) |
| $100,000 to $149,999 | 129 (25.1%) | 24 (5.8%) |
| $150,000 or more | 4 (0.8%) | 106 (25.6%) |
| Total | 514 (100.0%) | 414 (100.0%) |
Property Value to Household Income Ratio in Holbrook
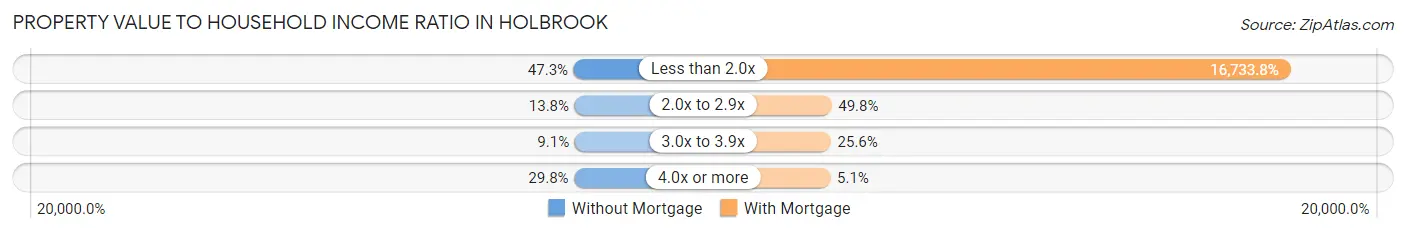
| Value-to-Income Ratio | Without Mortgage | With Mortgage |
| Less than 2.0x | 243 (47.3%) | 69,278 (16,733.8%) |
| 2.0x to 2.9x | 71 (13.8%) | 206 (49.8%) |
| 3.0x to 3.9x | 47 (9.1%) | 106 (25.6%) |
| 4.0x or more | 153 (29.8%) | 21 (5.1%) |
| Total | 514 (100.0%) | 414 (100.0%) |
Real Estate Taxes by Mortgage Status in Holbrook
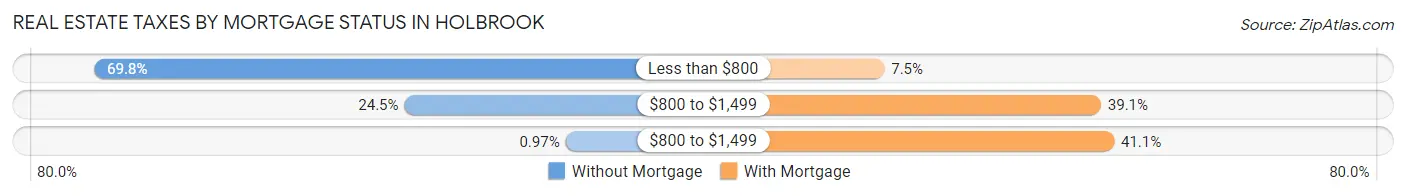
| Property Taxes | Without Mortgage | With Mortgage |
| Less than $800 | 359 (69.8%) | 31 (7.5%) |
| $800 to $1,499 | 126 (24.5%) | 162 (39.1%) |
| $800 to $1,499 | 5 (1.0%) | 170 (41.1%) |
| Total | 514 (100.0%) | 414 (100.0%) |
Health & Disability in Holbrook
Health Insurance Coverage by Age in Holbrook
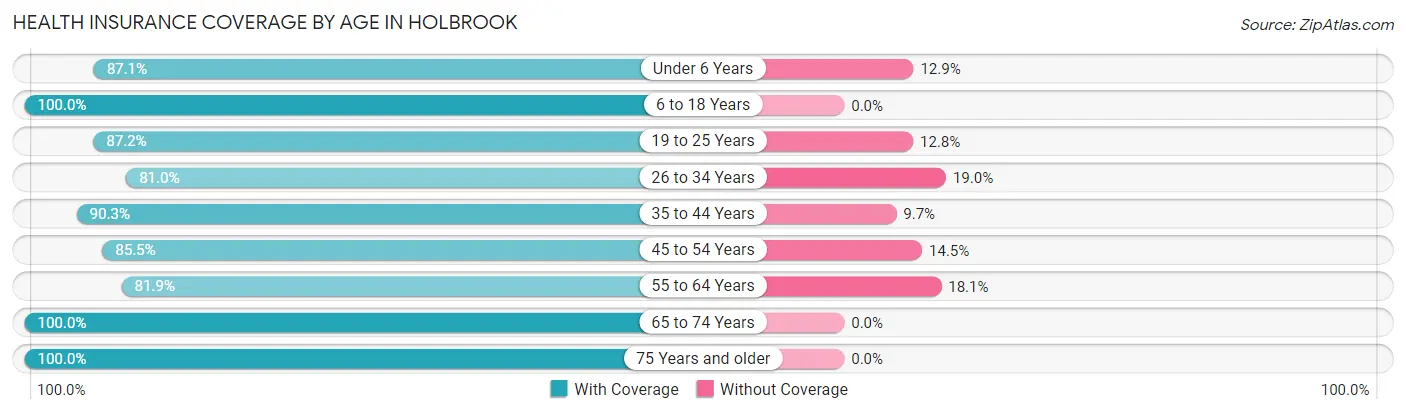
| Age Bracket | With Coverage | Without Coverage |
| Under 6 Years | 216 (87.1%) | 32 (12.9%) |
| 6 to 18 Years | 1,039 (100.0%) | 0 (0.0%) |
| 19 to 25 Years | 367 (87.2%) | 54 (12.8%) |
| 26 to 34 Years | 265 (81.0%) | 62 (19.0%) |
| 35 to 44 Years | 586 (90.3%) | 63 (9.7%) |
| 45 to 54 Years | 542 (85.5%) | 92 (14.5%) |
| 55 to 64 Years | 471 (81.9%) | 104 (18.1%) |
| 65 to 74 Years | 257 (100.0%) | 0 (0.0%) |
| 75 Years and older | 282 (100.0%) | 0 (0.0%) |
| Total | 4,025 (90.8%) | 407 (9.2%) |
Health Insurance Coverage by Citizenship Status in Holbrook
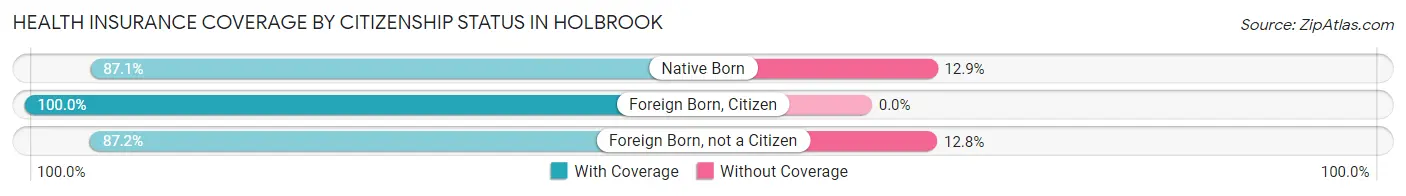
| Citizenship Status | With Coverage | Without Coverage |
| Native Born | 216 (87.1%) | 32 (12.9%) |
| Foreign Born, Citizen | 1,039 (100.0%) | 0 (0.0%) |
| Foreign Born, not a Citizen | 367 (87.2%) | 54 (12.8%) |
Health Insurance Coverage by Household Income in Holbrook
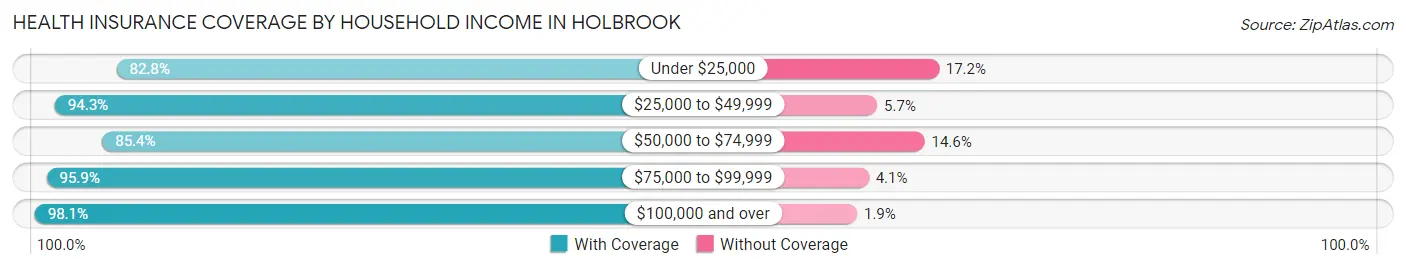
| Household Income | With Coverage | Without Coverage |
| Under $25,000 | 543 (82.8%) | 113 (17.2%) |
| $25,000 to $49,999 | 762 (94.3%) | 46 (5.7%) |
| $50,000 to $74,999 | 903 (85.4%) | 154 (14.6%) |
| $75,000 to $99,999 | 677 (95.9%) | 29 (4.1%) |
| $100,000 and over | 1,024 (98.1%) | 20 (1.9%) |
Public vs Private Health Insurance Coverage by Age in Holbrook
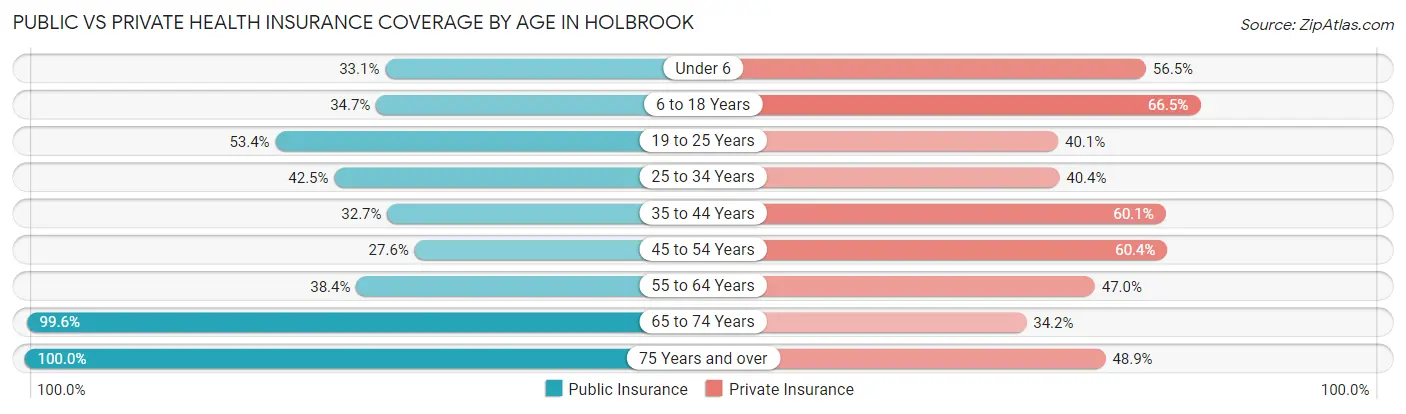
| Age Bracket | Public Insurance | Private Insurance |
| Under 6 | 82 (33.1%) | 140 (56.5%) |
| 6 to 18 Years | 361 (34.7%) | 691 (66.5%) |
| 19 to 25 Years | 225 (53.4%) | 169 (40.1%) |
| 25 to 34 Years | 139 (42.5%) | 132 (40.4%) |
| 35 to 44 Years | 212 (32.7%) | 390 (60.1%) |
| 45 to 54 Years | 175 (27.6%) | 383 (60.4%) |
| 55 to 64 Years | 221 (38.4%) | 270 (47.0%) |
| 65 to 74 Years | 256 (99.6%) | 88 (34.2%) |
| 75 Years and over | 282 (100.0%) | 138 (48.9%) |
| Total | 1,953 (44.1%) | 2,401 (54.2%) |
Disability Status by Sex by Age in Holbrook
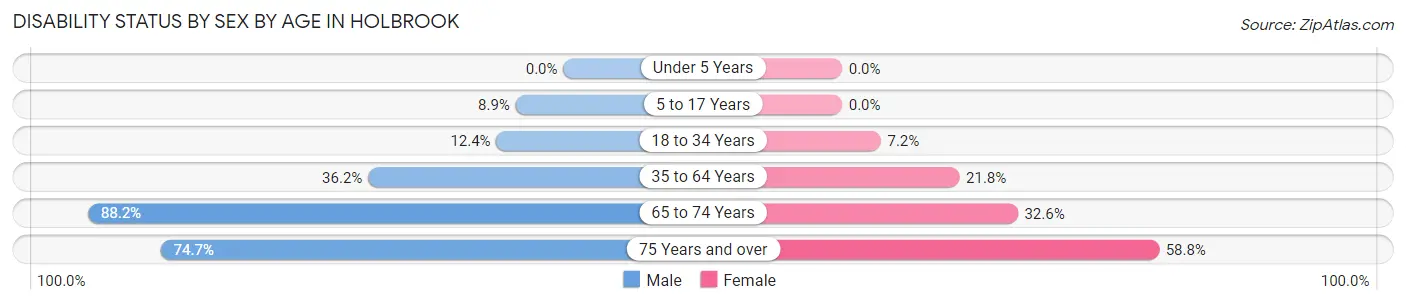
| Age Bracket | Male | Female |
| Under 5 Years | 0 (0.0%) | 0 (0.0%) |
| 5 to 17 Years | 53 (8.8%) | 0 (0.0%) |
| 18 to 34 Years | 60 (12.4%) | 22 (7.2%) |
| 35 to 64 Years | 317 (36.2%) | 214 (21.8%) |
| 65 to 74 Years | 105 (88.2%) | 45 (32.6%) |
| 75 Years and over | 71 (74.7%) | 110 (58.8%) |
Disability Class by Sex by Age in Holbrook
Disability Class: Hearing Difficulty
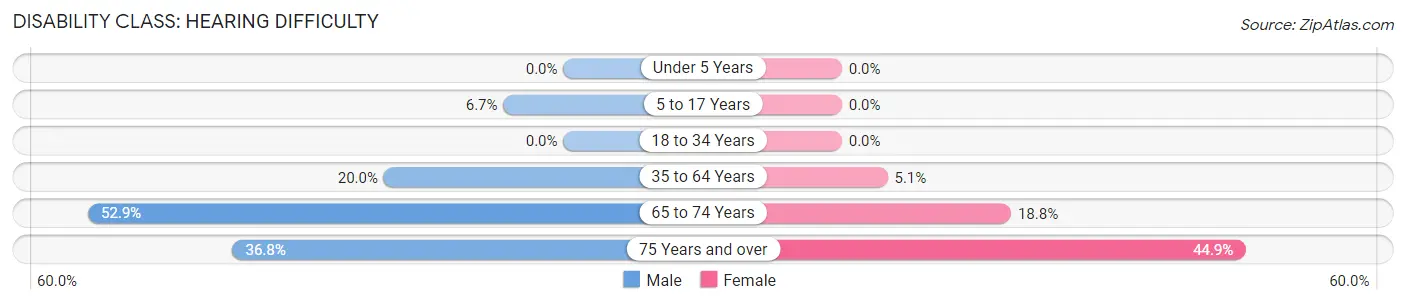
| Age Bracket | Male | Female |
| Under 5 Years | 0 (0.0%) | 0 (0.0%) |
| 5 to 17 Years | 40 (6.7%) | 0 (0.0%) |
| 18 to 34 Years | 0 (0.0%) | 0 (0.0%) |
| 35 to 64 Years | 175 (20.0%) | 50 (5.1%) |
| 65 to 74 Years | 63 (52.9%) | 26 (18.8%) |
| 75 Years and over | 35 (36.8%) | 84 (44.9%) |
Disability Class: Vision Difficulty
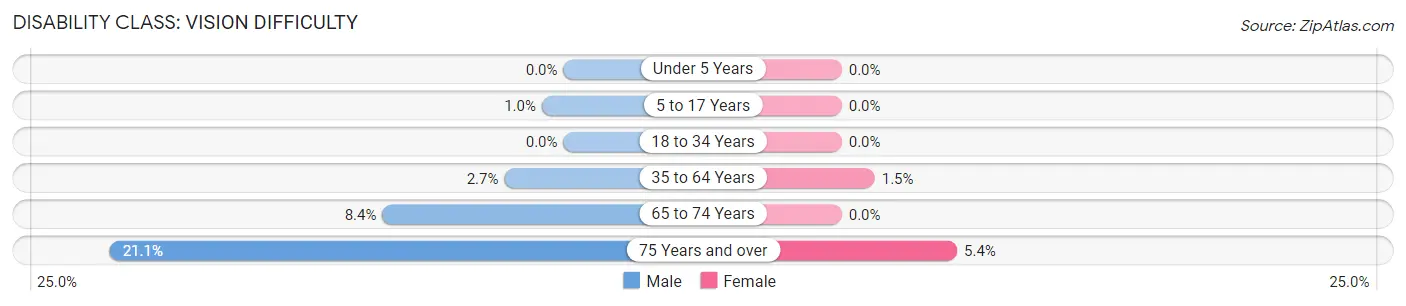
| Age Bracket | Male | Female |
| Under 5 Years | 0 (0.0%) | 0 (0.0%) |
| 5 to 17 Years | 6 (1.0%) | 0 (0.0%) |
| 18 to 34 Years | 0 (0.0%) | 0 (0.0%) |
| 35 to 64 Years | 24 (2.7%) | 15 (1.5%) |
| 65 to 74 Years | 10 (8.4%) | 0 (0.0%) |
| 75 Years and over | 20 (21.0%) | 10 (5.3%) |
Disability Class: Cognitive Difficulty
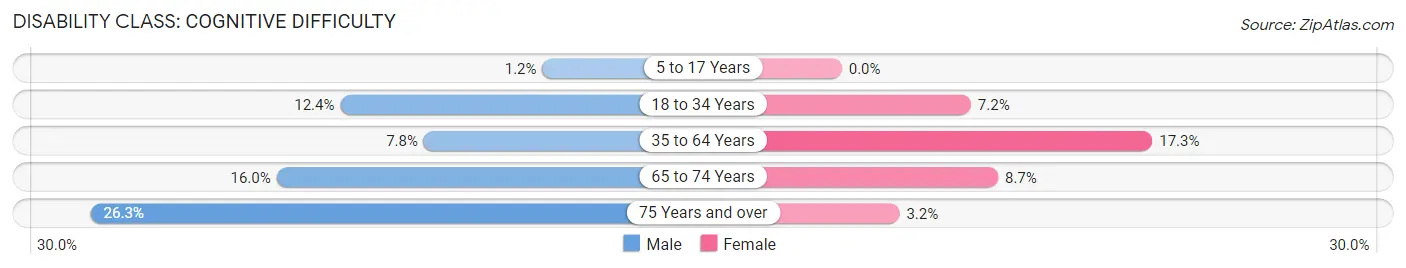
| Age Bracket | Male | Female |
| 5 to 17 Years | 7 (1.2%) | 0 (0.0%) |
| 18 to 34 Years | 60 (12.4%) | 22 (7.2%) |
| 35 to 64 Years | 68 (7.8%) | 170 (17.3%) |
| 65 to 74 Years | 19 (16.0%) | 12 (8.7%) |
| 75 Years and over | 25 (26.3%) | 6 (3.2%) |
Disability Class: Ambulatory Difficulty
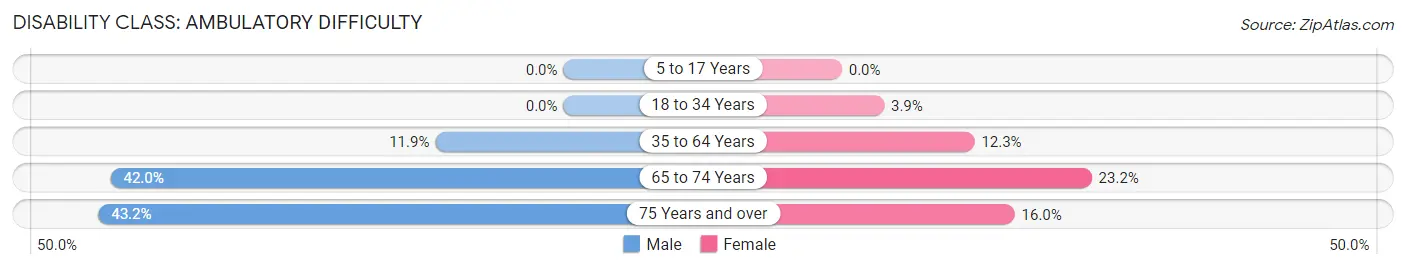
| Age Bracket | Male | Female |
| 5 to 17 Years | 0 (0.0%) | 0 (0.0%) |
| 18 to 34 Years | 0 (0.0%) | 12 (3.9%) |
| 35 to 64 Years | 104 (11.9%) | 121 (12.3%) |
| 65 to 74 Years | 50 (42.0%) | 32 (23.2%) |
| 75 Years and over | 41 (43.2%) | 30 (16.0%) |
Disability Class: Self-Care Difficulty
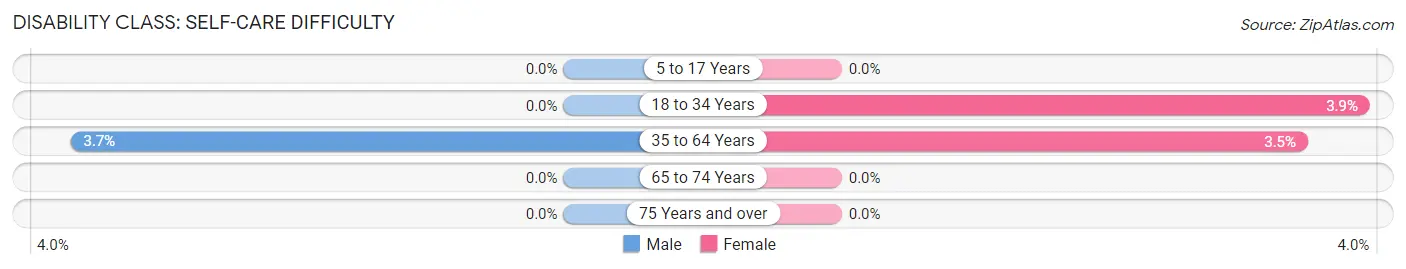
| Age Bracket | Male | Female |
| 5 to 17 Years | 0 (0.0%) | 0 (0.0%) |
| 18 to 34 Years | 0 (0.0%) | 12 (3.9%) |
| 35 to 64 Years | 32 (3.7%) | 34 (3.5%) |
| 65 to 74 Years | 0 (0.0%) | 0 (0.0%) |
| 75 Years and over | 0 (0.0%) | 0 (0.0%) |
Technology Access in Holbrook
Computing Device Access in Holbrook
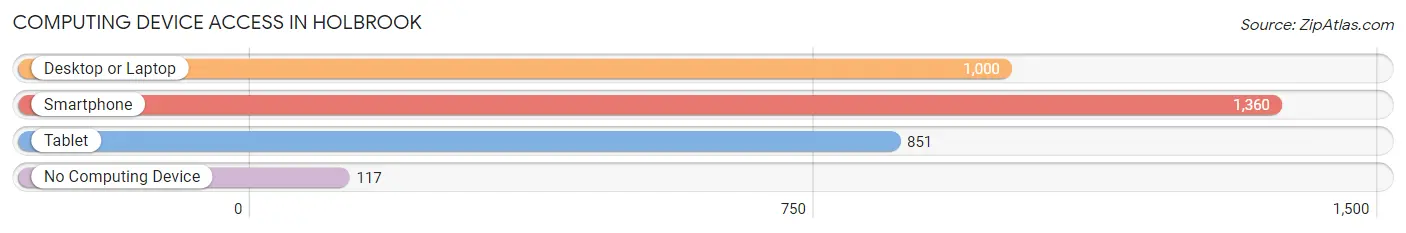
| Device Type | # Households | % Households |
| Desktop or Laptop | 1,000 | 65.4% |
| Smartphone | 1,360 | 89.0% |
| Tablet | 851 | 55.7% |
| No Computing Device | 117 | 7.7% |
| Total | 1,528 | 100.0% |
Internet Access in Holbrook
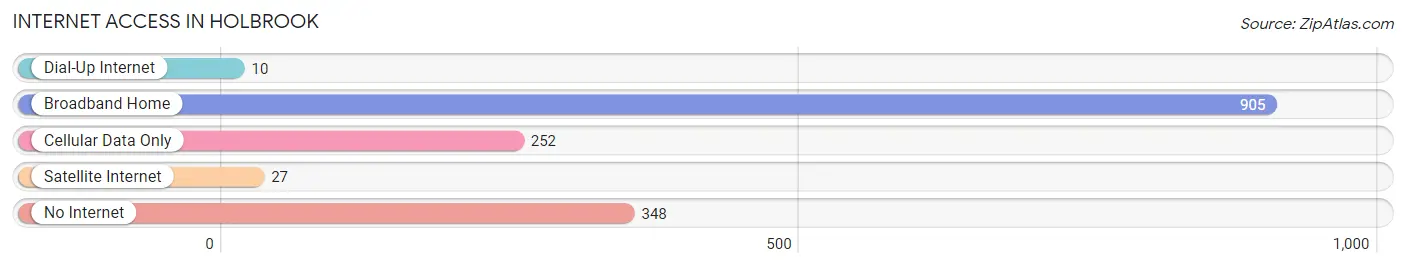
| Internet Type | # Households | % Households |
| Dial-Up Internet | 10 | 0.6% |
| Broadband Home | 905 | 59.2% |
| Cellular Data Only | 252 | 16.5% |
| Satellite Internet | 27 | 1.8% |
| No Internet | 348 | 22.8% |
| Total | 1,528 | 100.0% |
Holbrook Summary
History
The area now known as Holbrook, Arizona was first inhabited by the Anasazi people, who lived in the area from around 1000 BC to 1300 AD. The Anasazi were a nomadic people who lived in small villages and hunted and gathered for food. They left behind many artifacts, including pottery and petroglyphs, which can still be seen in the area today.
In the late 1800s, the area was settled by Mormon pioneers who established a small farming community. The town was originally called "Holbrook City" after the first postmaster, William Holbrook. The town was officially incorporated in 1917 and the name was changed to Holbrook.
The town grew slowly but steadily over the years, and by the 1950s it had become a popular stop for travelers on Route 66. The town was also home to a number of businesses, including a hotel, a movie theater, and a number of restaurants.
Geography
Holbrook is located in Navajo County, Arizona, in the northeastern part of the state. It is situated at an elevation of 5,000 feet and is surrounded by the White Mountains. The town is located on the Little Colorado River, which flows through the area.
The climate in Holbrook is semi-arid, with hot summers and mild winters. The average annual temperature is around 60 degrees Fahrenheit, and the average annual precipitation is around 10 inches.
Economy
The economy of Holbrook is largely based on tourism, as the town is located on the historic Route 66. The town is also home to a number of businesses, including restaurants, hotels, and retail stores.
The town is also home to a number of manufacturing companies, including a furniture factory and a plastics factory. The town is also home to a number of agricultural operations, including cattle ranches and farms.
Demographics
As of the 2010 census, the population of Holbrook was 5,053. The racial makeup of the town was 75.3% White, 0.9% African American, 1.3% Native American, 0.3% Asian, 0.1% Pacific Islander, 19.2% from other races, and 3.0% from two or more races. Hispanic or Latino of any race were 37.2% of the population.
The median household income in Holbrook was $35,938, and the median family income was $41,944. The per capita income was $17,845. About 17.2% of families and 21.3% of the population were below the poverty line, including 28.3% of those under age 18 and 11.2% of those age 65 or over.
Common Questions
What is Per Capita Income in Holbrook?
Per Capita income in Holbrook is $22,268.
What is the Median Family Income in Holbrook?
Median Family Income in Holbrook is $68,077.
What is the Median Household income in Holbrook?
Median Household Income in Holbrook is $58,856.
What is Income or Wage Gap in Holbrook?
Income or Wage Gap in Holbrook is 30.0%.
Women in Holbrook earn 70.0 cents for every dollar earned by a man.
What is Inequality or Gini Index in Holbrook?
Inequality or Gini Index in Holbrook is 0.41.
What is the Total Population of Holbrook?
Total Population of Holbrook is 4,842.
What is the Total Male Population of Holbrook?
Total Male Population of Holbrook is 2,783.
What is the Total Female Population of Holbrook?
Total Female Population of Holbrook is 2,059.
What is the Ratio of Males per 100 Females in Holbrook?
There are 135.16 Males per 100 Females in Holbrook.
What is the Ratio of Females per 100 Males in Holbrook?
There are 73.98 Females per 100 Males in Holbrook.
What is the Median Population Age in Holbrook?
Median Population Age in Holbrook is 38.2 Years.
What is the Average Family Size in Holbrook
Average Family Size in Holbrook is 3.2 People.
What is the Average Household Size in Holbrook
Average Household Size in Holbrook is 2.8 People.
How Large is the Labor Force in Holbrook?
There are 1,661 People in the Labor Forcein in Holbrook.
What is the Percentage of People in the Labor Force in Holbrook?
44.5% of People are in the Labor Force in Holbrook.
What is the Unemployment Rate in Holbrook?
Unemployment Rate in Holbrook is 3.9%.