Golden Shores, AZ Map & Demographics
Golden Shores Map
Golden Shores Overview
$36,993
PER CAPITA INCOME
0.32
INEQUALITY / GINI INDEX
772
TOTAL POPULATION
486
MALE POPULATION
286
FEMALE POPULATION
169.93
MALES / 100 FEMALES
58.85
FEMALES / 100 MALES
71.0
MEDIAN AGE
1.7
AVG FAMILY SIZE
1.3
AVG HOUSEHOLD SIZE
188
LABOR FORCE [ PEOPLE ]
24.4%
PERCENT IN LABOR FORCE
Income in Golden Shores
Income Overview in Golden Shores
| Characteristic | Number | Measure |
| Per Capita Income | 772 | $36,993 |
| Median Family Income | 260 | $0 |
| Mean Family Income | 260 | $0 |
| Median Household Income | 584 | $0 |
| Mean Household Income | 584 | $53,423 |
| Income Deficit | 260 | $0 |
| Wage / Income Gap (%) | 772 | 0.00% |
| Wage / Income Gap ($) | 772 | 100.00¢ per $1 |
| Gini / Inequality Index | 772 | 0.32 |
Earnings by Sex in Golden Shores
| Sex | Number | Average Earnings |
| Male | 74 (28.2%) | $0 |
| Female | 188 (71.8%) | $0 |
| Total | 262 (100.0%) | $0 |
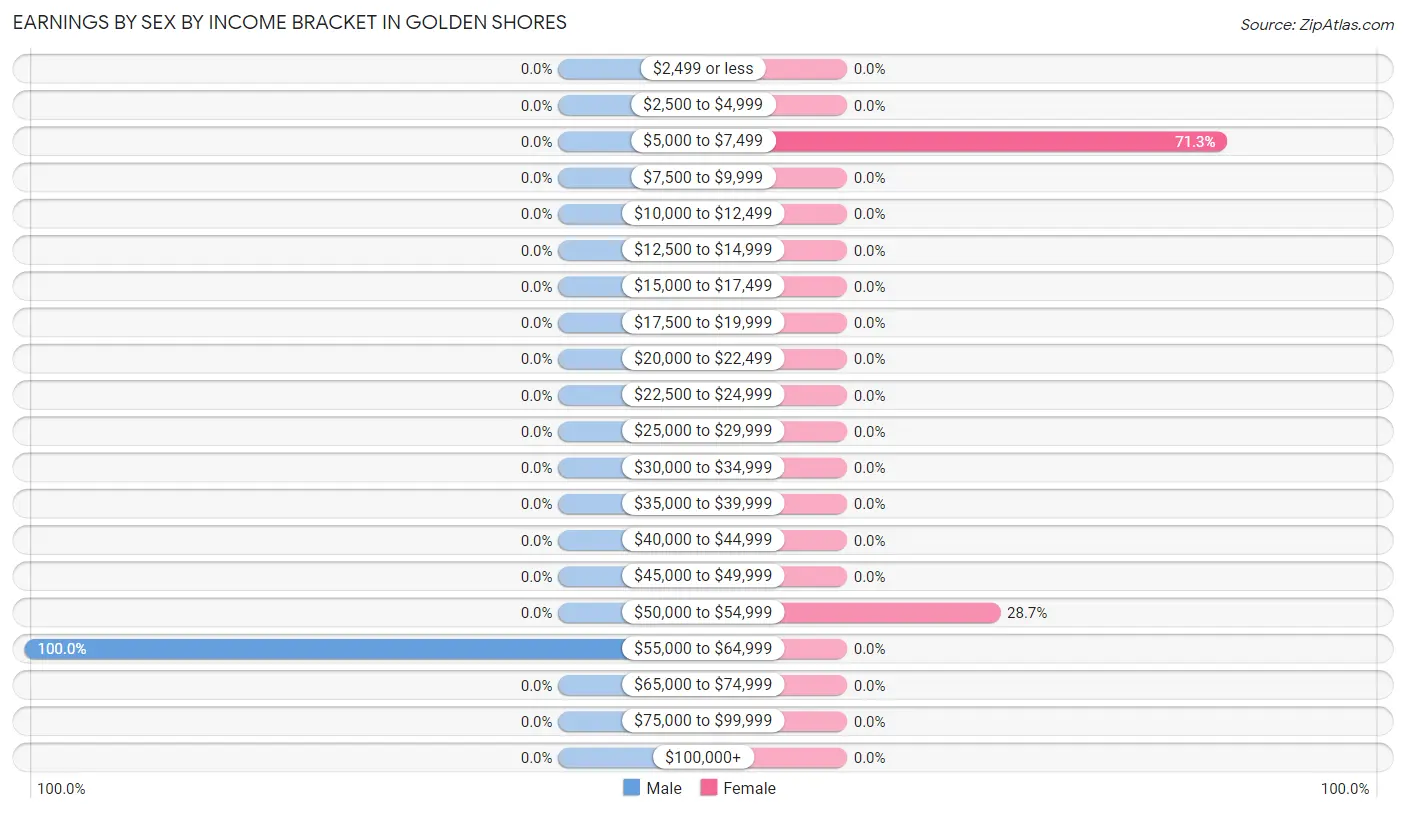
Earnings by Sex by Income Bracket in Golden Shores
The most common earnings brackets in Golden Shores are $55,000 to $64,999 for men (74 | 100.0%) and $5,000 to $7,499 for women (134 | 71.3%).
| Income | Male | Female |
| $2,499 or less | 0 (0.0%) | 0 (0.0%) |
| $2,500 to $4,999 | 0 (0.0%) | 0 (0.0%) |
| $5,000 to $7,499 | 0 (0.0%) | 134 (71.3%) |
| $7,500 to $9,999 | 0 (0.0%) | 0 (0.0%) |
| $10,000 to $12,499 | 0 (0.0%) | 0 (0.0%) |
| $12,500 to $14,999 | 0 (0.0%) | 0 (0.0%) |
| $15,000 to $17,499 | 0 (0.0%) | 0 (0.0%) |
| $17,500 to $19,999 | 0 (0.0%) | 0 (0.0%) |
| $20,000 to $22,499 | 0 (0.0%) | 0 (0.0%) |
| $22,500 to $24,999 | 0 (0.0%) | 0 (0.0%) |
| $25,000 to $29,999 | 0 (0.0%) | 0 (0.0%) |
| $30,000 to $34,999 | 0 (0.0%) | 0 (0.0%) |
| $35,000 to $39,999 | 0 (0.0%) | 0 (0.0%) |
| $40,000 to $44,999 | 0 (0.0%) | 0 (0.0%) |
| $45,000 to $49,999 | 0 (0.0%) | 0 (0.0%) |
| $50,000 to $54,999 | 0 (0.0%) | 54 (28.7%) |
| $55,000 to $64,999 | 74 (100.0%) | 0 (0.0%) |
| $65,000 to $74,999 | 0 (0.0%) | 0 (0.0%) |
| $75,000 to $99,999 | 0 (0.0%) | 0 (0.0%) |
| $100,000+ | 0 (0.0%) | 0 (0.0%) |
| Total | 74 (100.0%) | 188 (100.0%) |
Earnings by Sex by Educational Attainment in Golden Shores
| Educational Attainment | Male Income | Female Income |
| Less than High School | - | - |
| High School Diploma | - | - |
| College or Associate's Degree | - | - |
| Bachelor's Degree | - | - |
| Graduate Degree | - | - |
| Total | - | - |
Family Income in Golden Shores
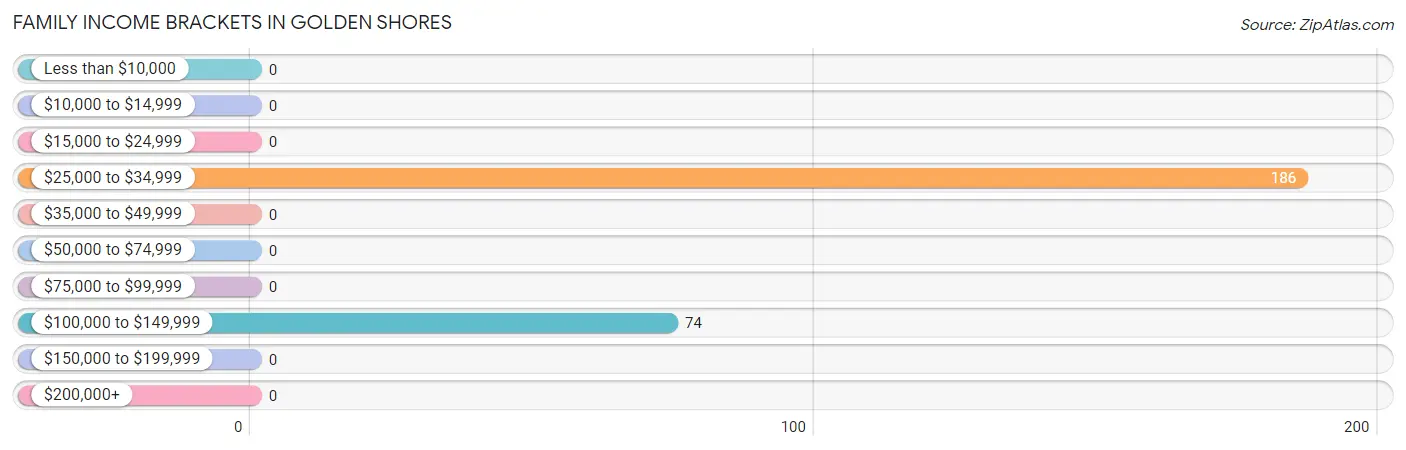
Family Income Brackets in Golden Shores
According to the Golden Shores family income data, there are 186 families falling into the $25,000 to $34,999 income range, which is the most common income bracket and makes up 71.5% of all families.
| Income Bracket | # Families | % Families |
| Less than $10,000 | 0 | 0.0% |
| $10,000 to $14,999 | 0 | 0.0% |
| $15,000 to $24,999 | 0 | 0.0% |
| $25,000 to $34,999 | 186 | 71.5% |
| $35,000 to $49,999 | 0 | 0.0% |
| $50,000 to $74,999 | 0 | 0.0% |
| $75,000 to $99,999 | 0 | 0.0% |
| $100,000 to $149,999 | 74 | 28.5% |
| $150,000 to $199,999 | 0 | 0.0% |
| $200,000+ | 0 | 0.0% |
Family Income by Famaliy Size in Golden Shores
| Income Bracket | # Families | Median Income |
| 2-Person Families | 260 (100.0%) | $0 |
| 3-Person Families | 0 (0.0%) | $0 |
| 4-Person Families | 0 (0.0%) | $0 |
| 5-Person Families | 0 (0.0%) | $0 |
| 6-Person Families | 0 (0.0%) | $0 |
| 7+ Person Families | 0 (0.0%) | $0 |
| Total | 260 (100.0%) | $0 |
Family Income by Number of Earners in Golden Shores
| Number of Earners | # Families | Median Income |
| No Earners | 0 (0.0%) | $0 |
| 1 Earner | 186 (71.5%) | $0 |
| 2 Earners | 74 (28.5%) | $0 |
| 3+ Earners | 0 (0.0%) | $0 |
| Total | 260 (100.0%) | $0 |
Household Income in Golden Shores
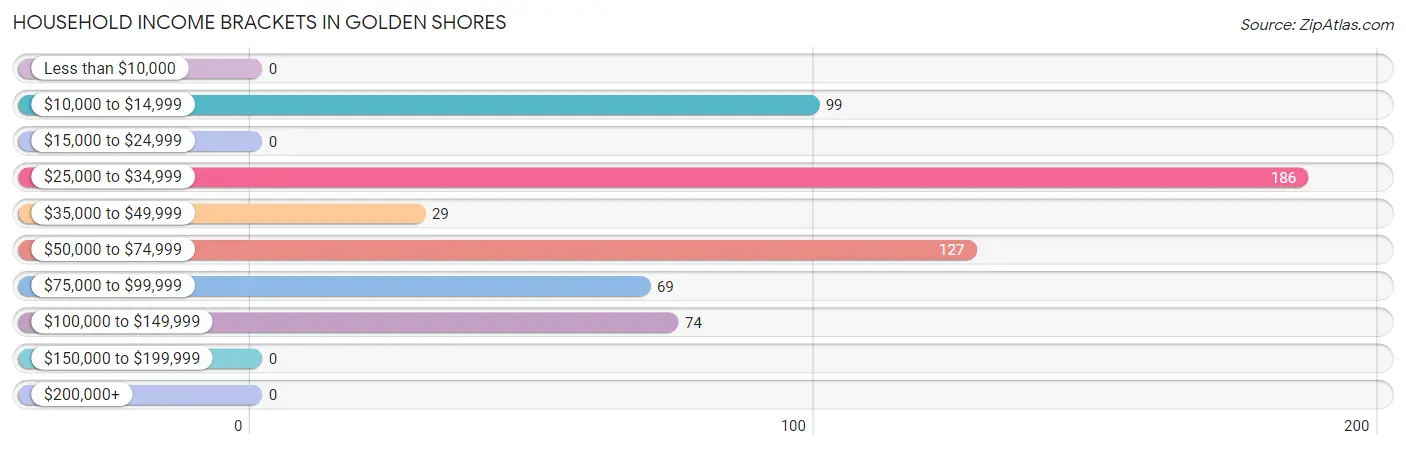
Household Income Brackets in Golden Shores
With 186 households falling in the category, the $25,000 to $34,999 income range is the most frequent in Golden Shores, accounting for 31.9% of all households.
| Income Bracket | # Households | % Households |
| Less than $10,000 | 0 | 0.0% |
| $10,000 to $14,999 | 99 | 17.0% |
| $15,000 to $24,999 | 0 | 0.0% |
| $25,000 to $34,999 | 186 | 31.8% |
| $35,000 to $49,999 | 29 | 5.0% |
| $50,000 to $74,999 | 127 | 21.7% |
| $75,000 to $99,999 | 69 | 11.8% |
| $100,000 to $149,999 | 74 | 12.7% |
| $150,000 to $199,999 | 0 | 0.0% |
| $200,000+ | 0 | 0.0% |
Household Income by Householder Age in Golden Shores
| Income Bracket | # Households | Median Income |
| 15 to 24 Years | 0 (0.0%) | $0 |
| 25 to 44 Years | 0 (0.0%) | $0 |
| 45 to 64 Years | 74 (12.7%) | $0 |
| 65+ Years | 510 (87.3%) | $0 |
| Total | 584 (100.0%) | $0 |
Poverty in Golden Shores
Income Below Poverty by Sex and Age in Golden Shores
| Age Bracket | Male | Female |
| Under 5 Years | 0 (0.0%) | 0 (0.0%) |
| 5 Years | 0 (0.0%) | 0 (0.0%) |
| 6 to 11 Years | 0 (0.0%) | 0 (0.0%) |
| 12 to 14 Years | 0 (0.0%) | 0 (0.0%) |
| 15 Years | 0 (0.0%) | 0 (0.0%) |
| 16 and 17 Years | 0 (0.0%) | 0 (0.0%) |
| 18 to 24 Years | 0 (0.0%) | 0 (0.0%) |
| 25 to 34 Years | 0 (0.0%) | 0 (0.0%) |
| 35 to 44 Years | 0 (0.0%) | 0 (0.0%) |
| 45 to 54 Years | 0 (0.0%) | 0 (0.0%) |
| 55 to 64 Years | 0 (0.0%) | 0 (0.0%) |
| 65 to 74 Years | 0 (0.0%) | 0 (0.0%) |
| 75 Years and over | 0 (0.0%) | 0 (0.0%) |
| Total | 0 (0.0%) | 0 (0.0%) |
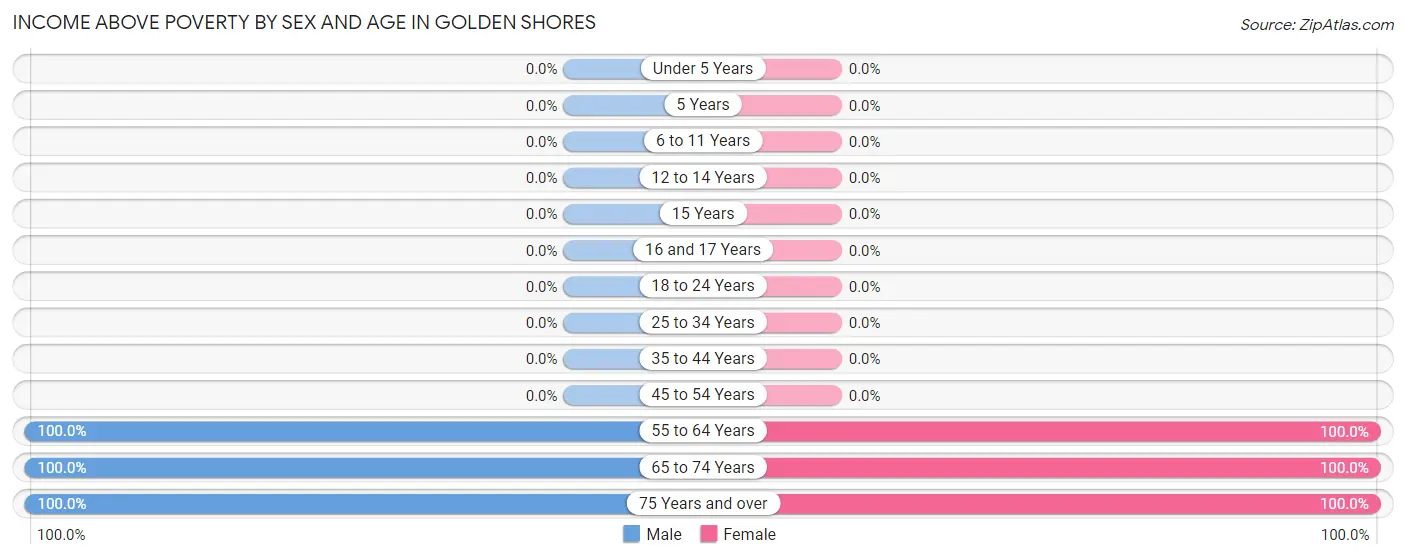
Income Above Poverty by Sex and Age in Golden Shores
According to the poverty statistics in Golden Shores, males aged 55 to 64 years and females aged 55 to 64 years are the age groups that are most secure financially, with 100.0% of males and 100.0% of females in these age groups living above the poverty line.
| Age Bracket | Male | Female |
| Under 5 Years | 0 (0.0%) | 0 (0.0%) |
| 5 Years | 0 (0.0%) | 0 (0.0%) |
| 6 to 11 Years | 0 (0.0%) | 0 (0.0%) |
| 12 to 14 Years | 0 (0.0%) | 0 (0.0%) |
| 15 Years | 0 (0.0%) | 0 (0.0%) |
| 16 and 17 Years | 0 (0.0%) | 0 (0.0%) |
| 18 to 24 Years | 0 (0.0%) | 0 (0.0%) |
| 25 to 34 Years | 0 (0.0%) | 0 (0.0%) |
| 35 to 44 Years | 0 (0.0%) | 0 (0.0%) |
| 45 to 54 Years | 0 (0.0%) | 0 (0.0%) |
| 55 to 64 Years | 74 (100.0%) | 188 (100.0%) |
| 65 to 74 Years | 313 (100.0%) | 69 (100.0%) |
| 75 Years and over | 99 (100.0%) | 29 (100.0%) |
| Total | 486 (100.0%) | 286 (100.0%) |
Income Below Poverty Among Married-Couple Families in Golden Shores
| Children | Above Poverty | Below Poverty |
| No Children | 260 (100.0%) | 0 (0.0%) |
| 1 or 2 Children | 0 (0.0%) | 0 (0.0%) |
| 3 or 4 Children | 0 (0.0%) | 0 (0.0%) |
| 5 or more Children | 0 (0.0%) | 0 (0.0%) |
| Total | 260 (100.0%) | 0 (0.0%) |
Income Below Poverty Among Single-Parent Households in Golden Shores
| Children | Single Father | Single Mother |
| No Children | 0 (0.0%) | 0 (0.0%) |
| 1 or 2 Children | 0 (0.0%) | 0 (0.0%) |
| 3 or 4 Children | 0 (0.0%) | 0 (0.0%) |
| 5 or more Children | 0 (0.0%) | 0 (0.0%) |
| Total | 0 (0.0%) | 0 (0.0%) |
Income Below Poverty Among Married-Couple vs Single-Parent Households in Golden Shores
| Children | Married-Couple Families | Single-Parent Households |
| No Children | 0 (0.0%) | 0 (0.0%) |
| 1 or 2 Children | 0 (0.0%) | 0 (0.0%) |
| 3 or 4 Children | 0 (0.0%) | 0 (0.0%) |
| 5 or more Children | 0 (0.0%) | 0 (0.0%) |
| Total | 0 (0.0%) | 0 (0.0%) |
Race in Golden Shores
The most populous races in Golden Shores are White / Caucasian (743 | 96.2%), Hispanic or Latino (64 | 8.3%), and Native / Alaskan (29 | 3.8%).
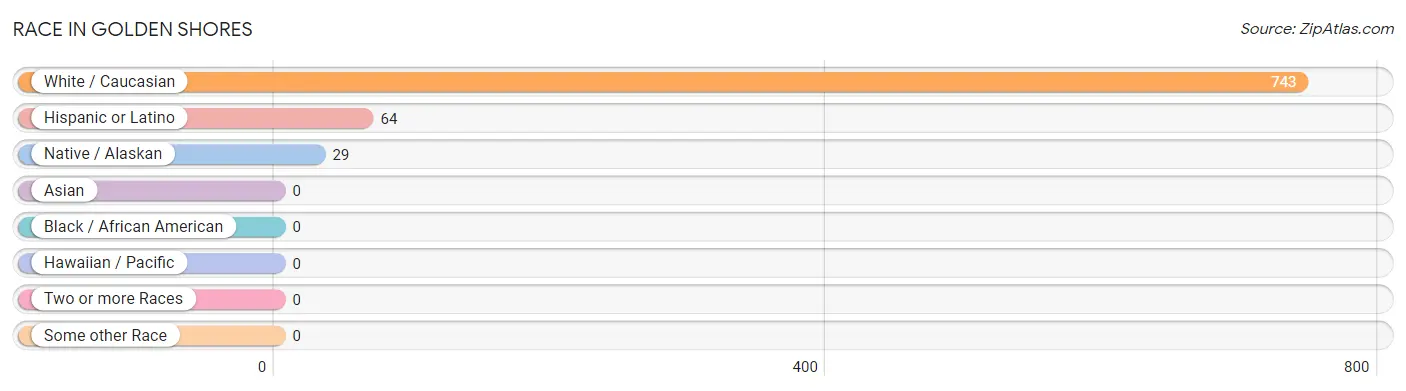
| Race | # Population | % Population |
| Asian | 0 | 0.0% |
| Black / African American | 0 | 0.0% |
| Hawaiian / Pacific | 0 | 0.0% |
| Hispanic or Latino | 64 | 8.3% |
| Native / Alaskan | 29 | 3.8% |
| White / Caucasian | 743 | 96.2% |
| Two or more Races | 0 | 0.0% |
| Some other Race | 0 | 0.0% |
| Total | 772 | 100.0% |
Ancestry in Golden Shores
The most populous ancestries reported in Golden Shores are English (203 | 26.3%), Welsh (74 | 9.6%), Cuban (64 | 8.3%), German (63 | 8.2%), and Irish (63 | 8.2%), together accounting for 60.5% of all Golden Shores residents.
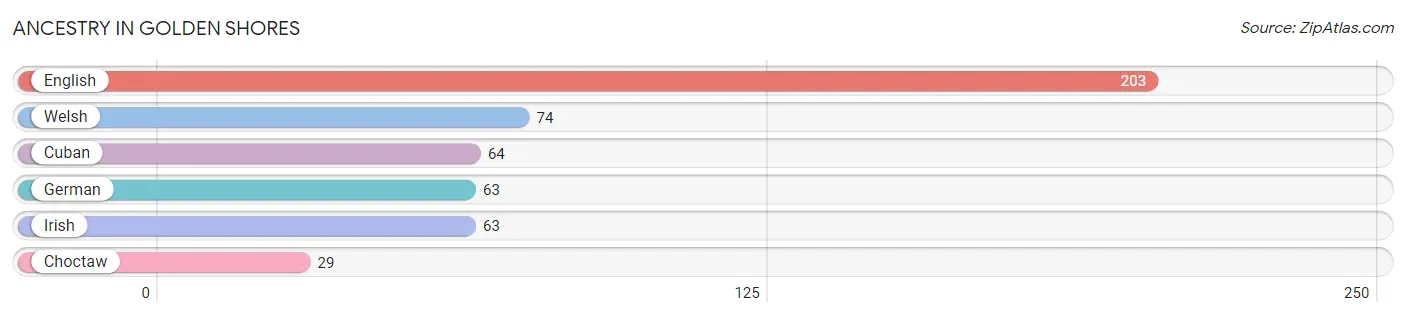
| Ancestry | # Population | % Population |
| Choctaw | 29 | 3.8% |
| Cuban | 64 | 8.3% |
| English | 203 | 26.3% |
| German | 63 | 8.2% |
| Irish | 63 | 8.2% |
| Welsh | 74 | 9.6% | View All 6 Rows |
Immigrants in Golden Shores

| Immigration Origin | # Population | % Population | View All 0 Rows |
Sex and Age in Golden Shores
Sex and Age in Golden Shores
The most populous age groups in Golden Shores are 70 to 74 Years (250 | 51.4%) for men and 60 to 64 Years (134 | 46.9%) for women.
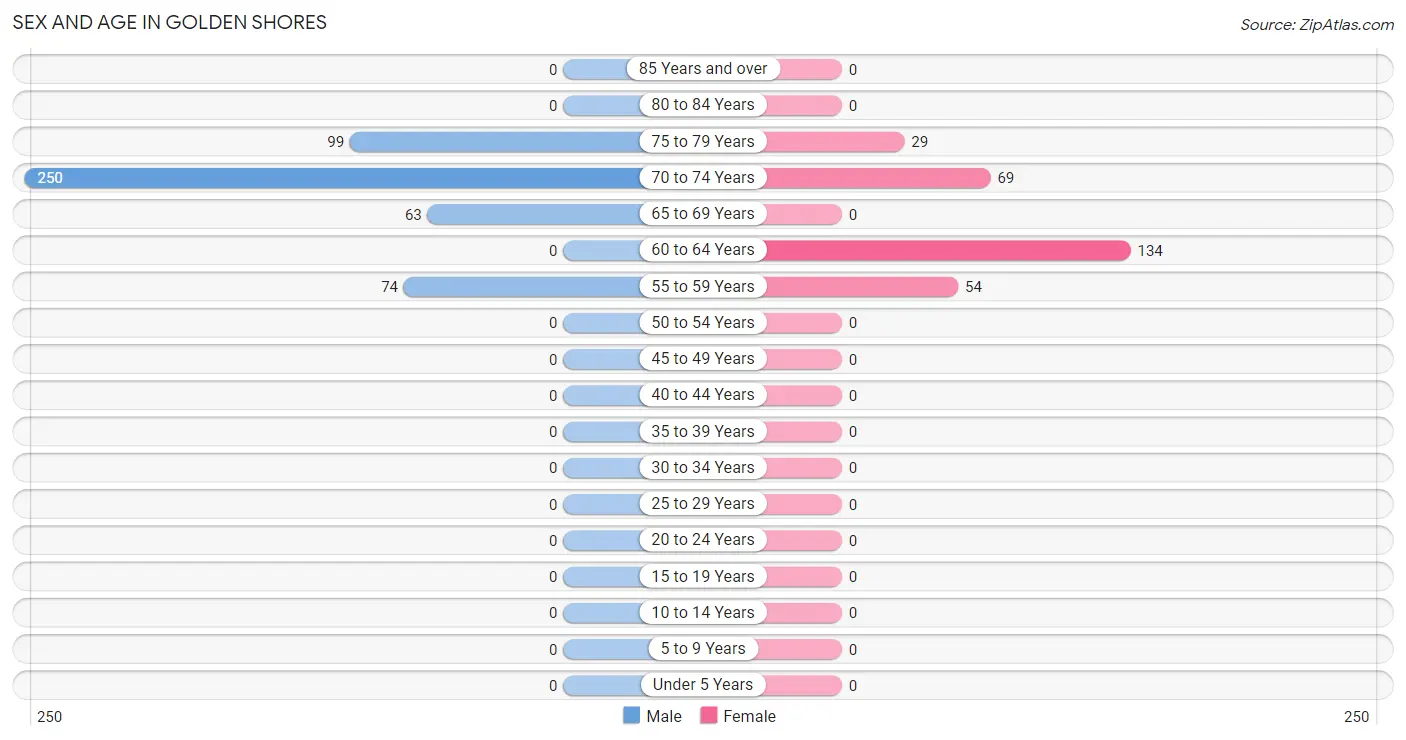
| Age Bracket | Male | Female |
| Under 5 Years | 0 (0.0%) | 0 (0.0%) |
| 5 to 9 Years | 0 (0.0%) | 0 (0.0%) |
| 10 to 14 Years | 0 (0.0%) | 0 (0.0%) |
| 15 to 19 Years | 0 (0.0%) | 0 (0.0%) |
| 20 to 24 Years | 0 (0.0%) | 0 (0.0%) |
| 25 to 29 Years | 0 (0.0%) | 0 (0.0%) |
| 30 to 34 Years | 0 (0.0%) | 0 (0.0%) |
| 35 to 39 Years | 0 (0.0%) | 0 (0.0%) |
| 40 to 44 Years | 0 (0.0%) | 0 (0.0%) |
| 45 to 49 Years | 0 (0.0%) | 0 (0.0%) |
| 50 to 54 Years | 0 (0.0%) | 0 (0.0%) |
| 55 to 59 Years | 74 (15.2%) | 54 (18.9%) |
| 60 to 64 Years | 0 (0.0%) | 134 (46.9%) |
| 65 to 69 Years | 63 (13.0%) | 0 (0.0%) |
| 70 to 74 Years | 250 (51.4%) | 69 (24.1%) |
| 75 to 79 Years | 99 (20.4%) | 29 (10.1%) |
| 80 to 84 Years | 0 (0.0%) | 0 (0.0%) |
| 85 Years and over | 0 (0.0%) | 0 (0.0%) |
| Total | 486 (100.0%) | 286 (100.0%) |
Families and Households in Golden Shores
Median Family Size in Golden Shores
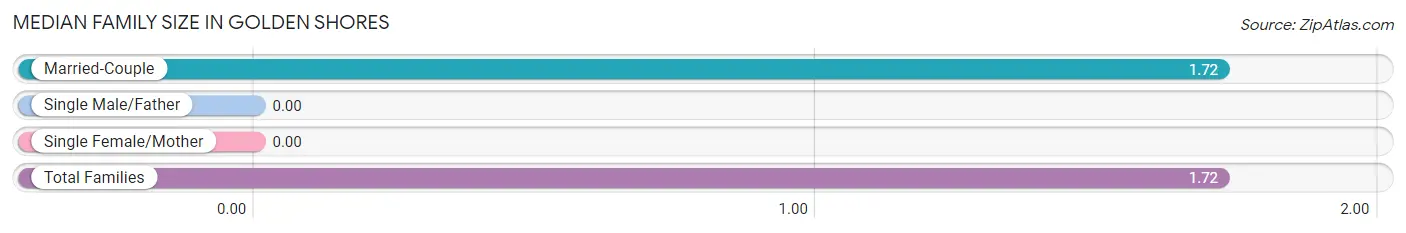
| Family Type | # Families | Family Size |
| Married-Couple | 260 (100.0%) | 1.72 |
| Single Male/Father | 0 (0.0%) | - |
| Single Female/Mother | 0 (0.0%) | - |
| Total Families | 260 (100.0%) | 1.72 |
Median Household Size in Golden Shores
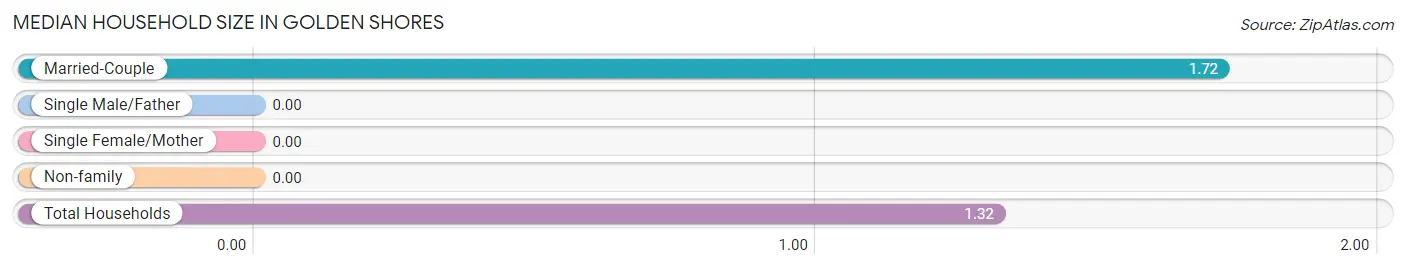
| Household Type | # Households | Household Size |
| Married-Couple | 260 (44.5%) | 1.72 |
| Single Male/Father | 0 (0.0%) | - |
| Single Female/Mother | 0 (0.0%) | - |
| Non-family | 324 (55.5%) | - |
| Total Households | 584 (100.0%) | 1.32 |
Household Size by Marriage Status in Golden Shores
Out of a total of 584 households in Golden Shores, 260 (44.5%) are family households, while 324 (55.5%) are nonfamily households. The most numerous type of family households are 2-person households, comprising 260, and the most common type of nonfamily households are 1-person households, comprising 324.
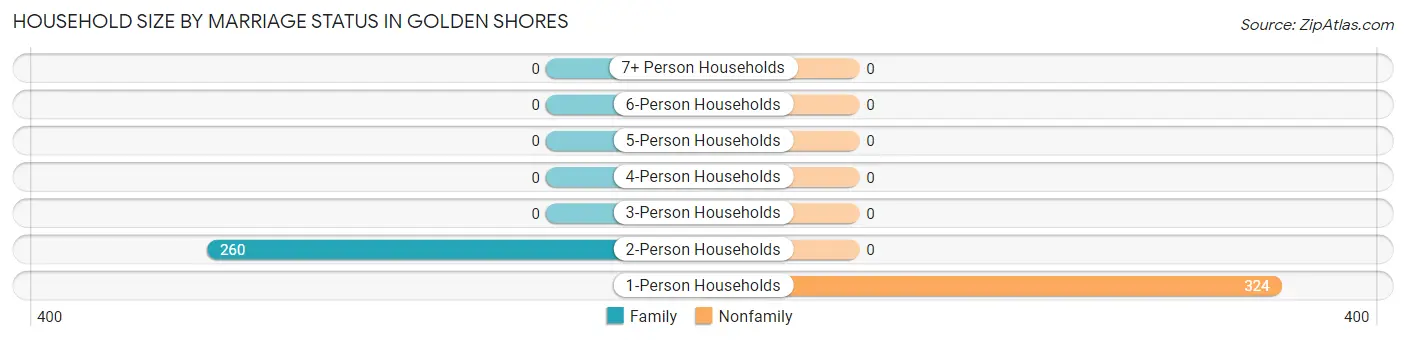
| Household Size | Family Households | Nonfamily Households |
| 1-Person Households | - | 324 (55.5%) |
| 2-Person Households | 260 (44.5%) | 0 (0.0%) |
| 3-Person Households | 0 (0.0%) | 0 (0.0%) |
| 4-Person Households | 0 (0.0%) | 0 (0.0%) |
| 5-Person Households | 0 (0.0%) | 0 (0.0%) |
| 6-Person Households | 0 (0.0%) | 0 (0.0%) |
| 7+ Person Households | 0 (0.0%) | 0 (0.0%) |
| Total | 260 (44.5%) | 324 (55.5%) |
Female Fertility in Golden Shores
Fertility by Age in Golden Shores
| Age Bracket | Women with Births | Births / 1,000 Women |
| 15 to 19 years | 0 (0.0%) | 0.0 |
| 20 to 34 years | 0 (0.0%) | 0.0 |
| 35 to 50 years | 0 (0.0%) | 0.0 |
| Total | 0 (0.0%) | 0.0 |
Fertility by Age by Marriage Status in Golden Shores
| Age Bracket | Married | Unmarried |
| 15 to 19 years | 0 (0.0%) | 0 (0.0%) |
| 20 to 34 years | 0 (0.0%) | 0 (0.0%) |
| 35 to 50 years | 0 (0.0%) | 0 (0.0%) |
| Total | 0 (0.0%) | 0 (0.0%) |
Fertility by Education in Golden Shores
| Educational Attainment | Women with Births | Births / 1,000 Women |
| Less than High School | 0 (0.0%) | 0.0 |
| High School Diploma | 0 (0.0%) | 0.0 |
| College or Associate's Degree | 0 (0.0%) | 0.0 |
| Bachelor's Degree | 0 (0.0%) | 0.0 |
| Graduate Degree | 0 (0.0%) | 0.0 |
| Total | 0 (0.0%) | 0.0 |
Fertility by Education by Marriage Status in Golden Shores
| Educational Attainment | Married | Unmarried |
| Less than High School | 0 (0.0%) | 0 (0.0%) |
| High School Diploma | 0 (0.0%) | 0 (0.0%) |
| College or Associate's Degree | 0 (0.0%) | 0 (0.0%) |
| Bachelor's Degree | 0 (0.0%) | 0 (0.0%) |
| Graduate Degree | 0 (0.0%) | 0 (0.0%) |
| Total | 0 (0.0%) | 0 (0.0%) |
Employment Characteristics in Golden Shores
Employment by Class of Employer in Golden Shores
Among the 188 employed individuals in Golden Shores, , and private company employees (188 | 100.0%) make up the most common classes of employment.
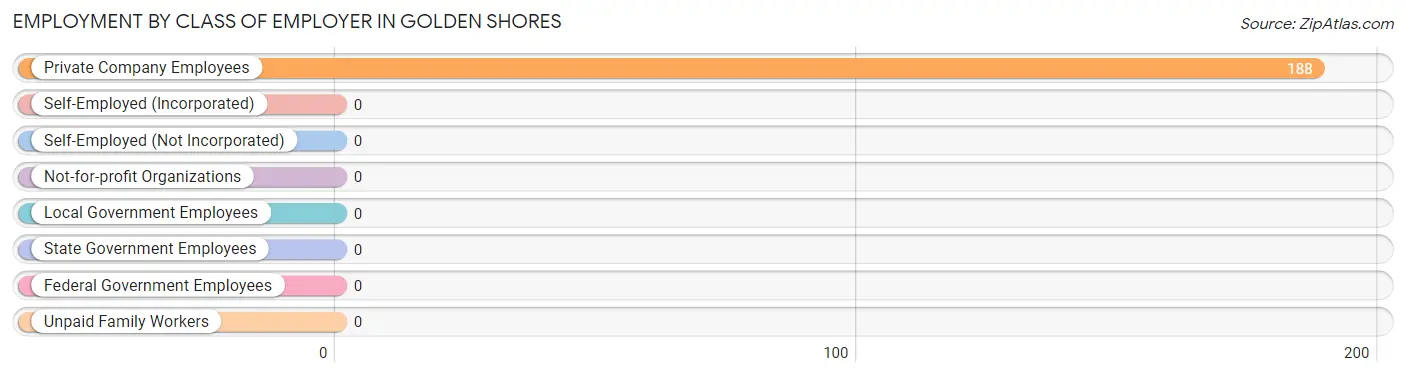
| Employer Class | # Employees | % Employees |
| Private Company Employees | 188 | 100.0% |
| Self-Employed (Incorporated) | 0 | 0.0% |
| Self-Employed (Not Incorporated) | 0 | 0.0% |
| Not-for-profit Organizations | 0 | 0.0% |
| Local Government Employees | 0 | 0.0% |
| State Government Employees | 0 | 0.0% |
| Federal Government Employees | 0 | 0.0% |
| Unpaid Family Workers | 0 | 0.0% |
| Total | 188 | 100.0% |
Employment Status by Age in Golden Shores
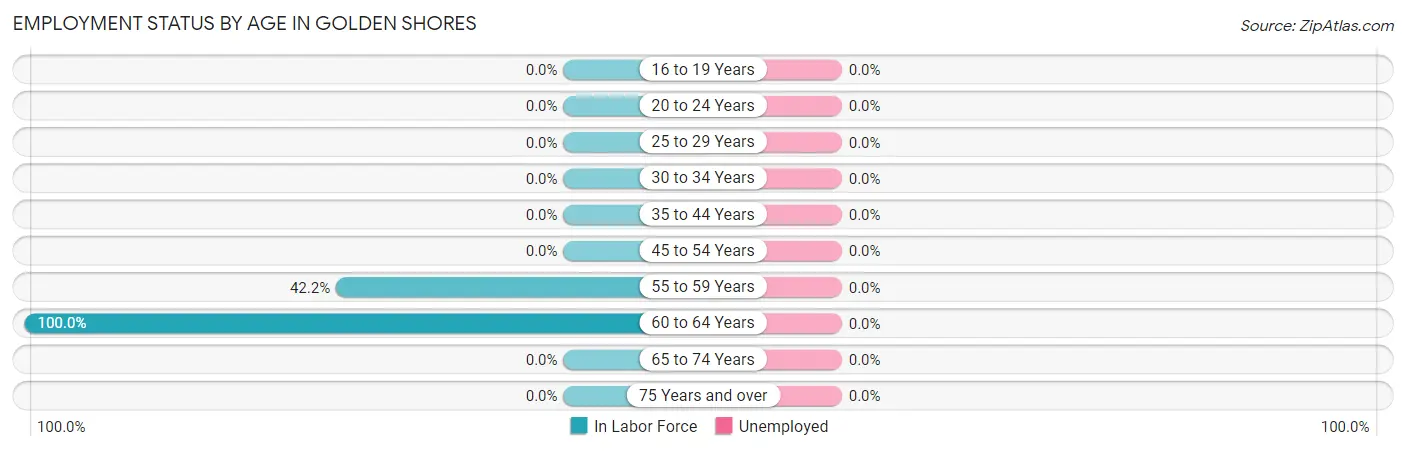
| Age Bracket | In Labor Force | Unemployed |
| 16 to 19 Years | 0 (0.0%) | 0 (0.0%) |
| 20 to 24 Years | 0 (0.0%) | 0 (0.0%) |
| 25 to 29 Years | 0 (0.0%) | 0 (0.0%) |
| 30 to 34 Years | 0 (0.0%) | 0 (0.0%) |
| 35 to 44 Years | 0 (0.0%) | 0 (0.0%) |
| 45 to 54 Years | 0 (0.0%) | 0 (0.0%) |
| 55 to 59 Years | 54 (42.2%) | 0 (0.0%) |
| 60 to 64 Years | 134 (100.0%) | 0 (0.0%) |
| 65 to 74 Years | 0 (0.0%) | 0 (0.0%) |
| 75 Years and over | 0 (0.0%) | 0 (0.0%) |
| Total | 188 (24.4%) | 0 (0.0%) |
Employment Status by Educational Attainment in Golden Shores
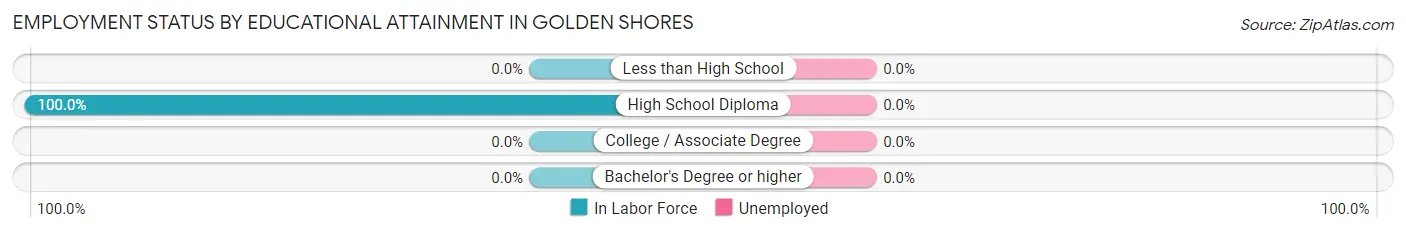
| Educational Attainment | In Labor Force | Unemployed |
| Less than High School | 0 (0.0%) | 0 (0.0%) |
| High School Diploma | 188 (100.0%) | 0 (0.0%) |
| College / Associate Degree | 0 (0.0%) | 0 (0.0%) |
| Bachelor's Degree or higher | 0 (0.0%) | 0 (0.0%) |
| Total | 188 (71.8%) | 0 (0.0%) |
Employment Occupations by Sex in Golden Shores
Management, Business, Science and Arts Occupations
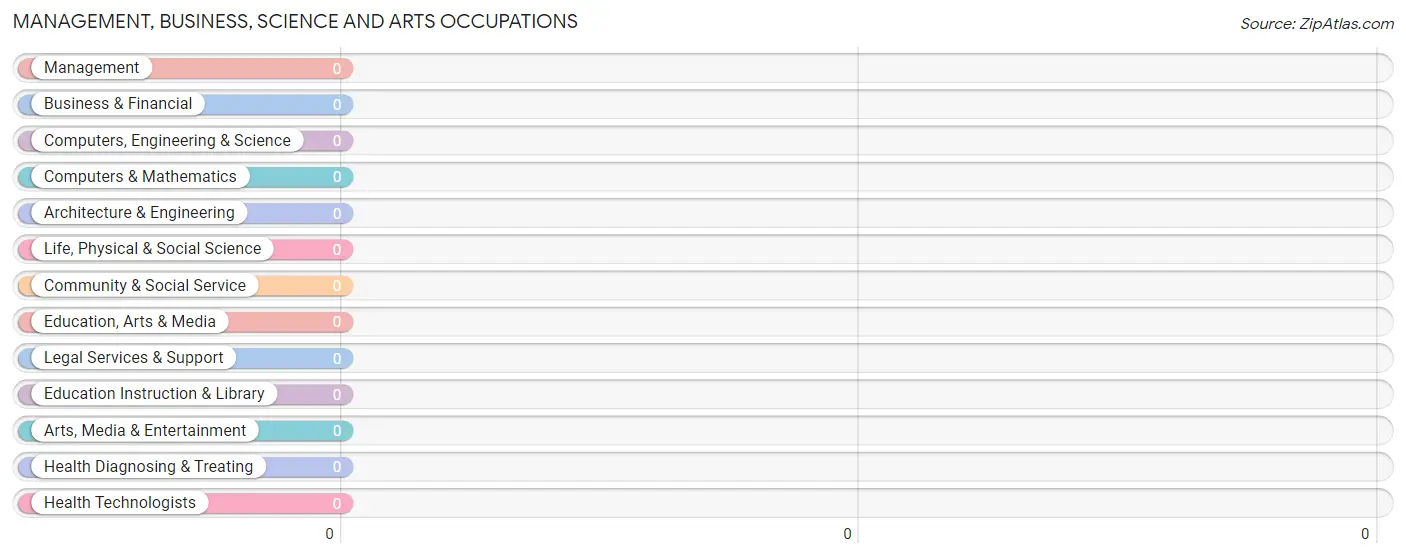
Management, Business, Science and Arts Occupations by Sex
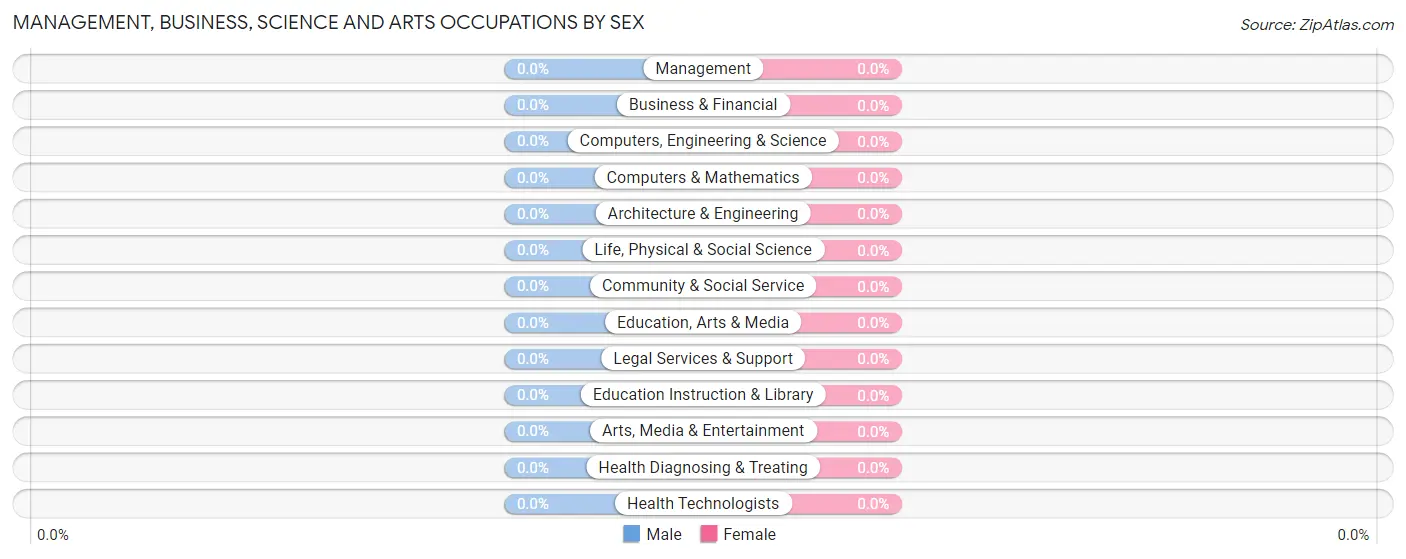
| Occupation | Male | Female |
| Management | 0 (0.0%) | 0 (0.0%) |
| Business & Financial | 0 (0.0%) | 0 (0.0%) |
| Computers, Engineering & Science | 0 (0.0%) | 0 (0.0%) |
| Computers & Mathematics | 0 (0.0%) | 0 (0.0%) |
| Architecture & Engineering | 0 (0.0%) | 0 (0.0%) |
| Life, Physical & Social Science | 0 (0.0%) | 0 (0.0%) |
| Community & Social Service | 0 (0.0%) | 0 (0.0%) |
| Education, Arts & Media | 0 (0.0%) | 0 (0.0%) |
| Legal Services & Support | 0 (0.0%) | 0 (0.0%) |
| Education Instruction & Library | 0 (0.0%) | 0 (0.0%) |
| Arts, Media & Entertainment | 0 (0.0%) | 0 (0.0%) |
| Health Diagnosing & Treating | 0 (0.0%) | 0 (0.0%) |
| Health Technologists | 0 (0.0%) | 0 (0.0%) |
| Total (Category) | 0 (0.0%) | 0 (0.0%) |
| Total (Overall) | 0 (0.0%) | 188 (100.0%) |
Services Occupations
The most common Services occupations in Golden Shores are , and Food Preparation & Serving (134 | 71.3%).
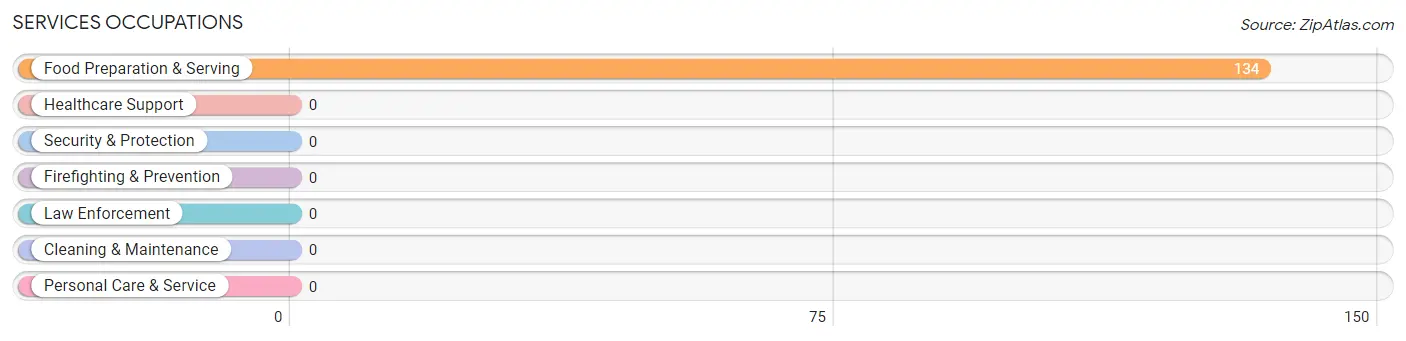
Services Occupations by Sex
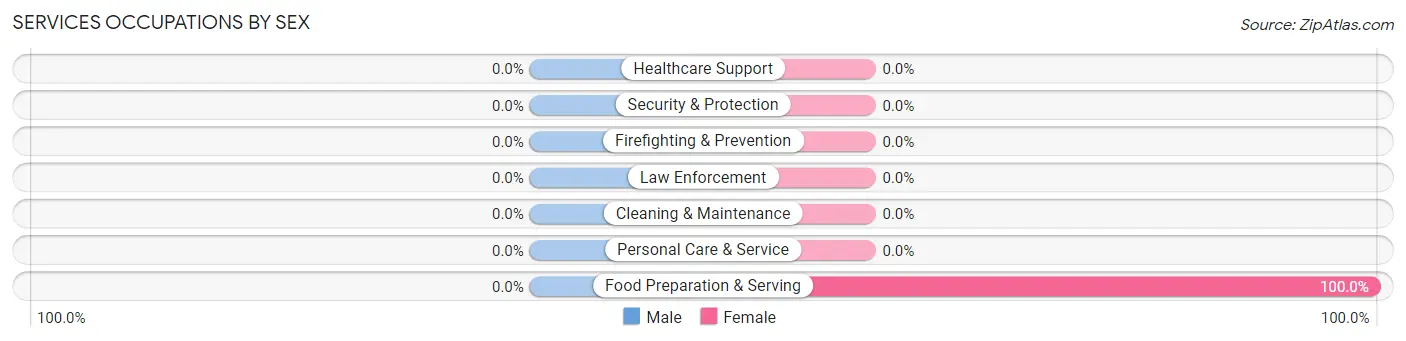
| Occupation | Male | Female |
| Healthcare Support | 0 (0.0%) | 0 (0.0%) |
| Security & Protection | 0 (0.0%) | 0 (0.0%) |
| Firefighting & Prevention | 0 (0.0%) | 0 (0.0%) |
| Law Enforcement | 0 (0.0%) | 0 (0.0%) |
| Food Preparation & Serving | 0 (0.0%) | 134 (100.0%) |
| Cleaning & Maintenance | 0 (0.0%) | 0 (0.0%) |
| Personal Care & Service | 0 (0.0%) | 0 (0.0%) |
| Total (Category) | 0 (0.0%) | 134 (100.0%) |
| Total (Overall) | 0 (0.0%) | 188 (100.0%) |
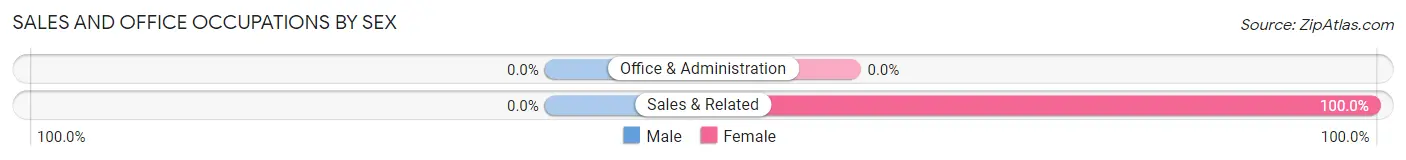
Sales and Office Occupations
The most common Sales and Office occupations in Golden Shores are , and Sales & Related (54 | 28.7%).
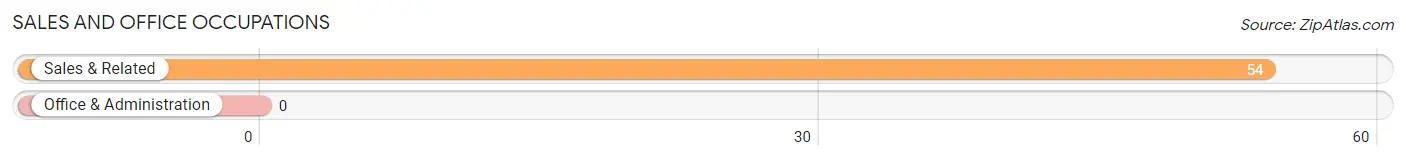
Sales and Office Occupations by Sex
| Occupation | Male | Female |
| Sales & Related | 0 (0.0%) | 54 (100.0%) |
| Office & Administration | 0 (0.0%) | 0 (0.0%) |
| Total (Category) | 0 (0.0%) | 54 (100.0%) |
| Total (Overall) | 0 (0.0%) | 188 (100.0%) |
Natural Resources, Construction and Maintenance Occupations
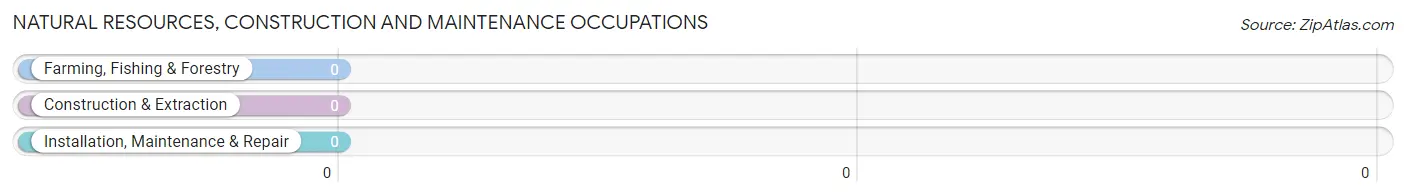
Natural Resources, Construction and Maintenance Occupations by Sex
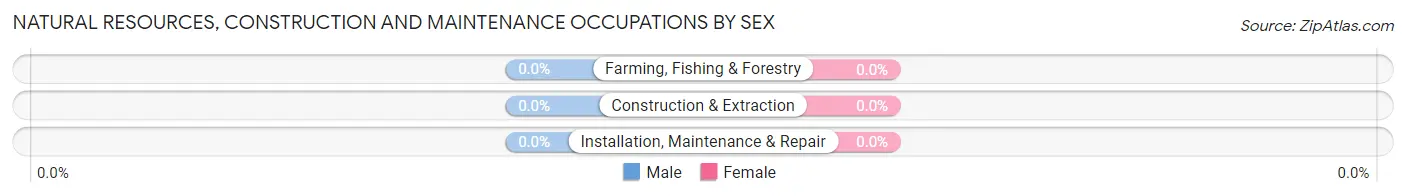
| Occupation | Male | Female |
| Farming, Fishing & Forestry | 0 (0.0%) | 0 (0.0%) |
| Construction & Extraction | 0 (0.0%) | 0 (0.0%) |
| Installation, Maintenance & Repair | 0 (0.0%) | 0 (0.0%) |
| Total (Category) | 0 (0.0%) | 0 (0.0%) |
| Total (Overall) | 0 (0.0%) | 188 (100.0%) |
Production, Transportation and Moving Occupations
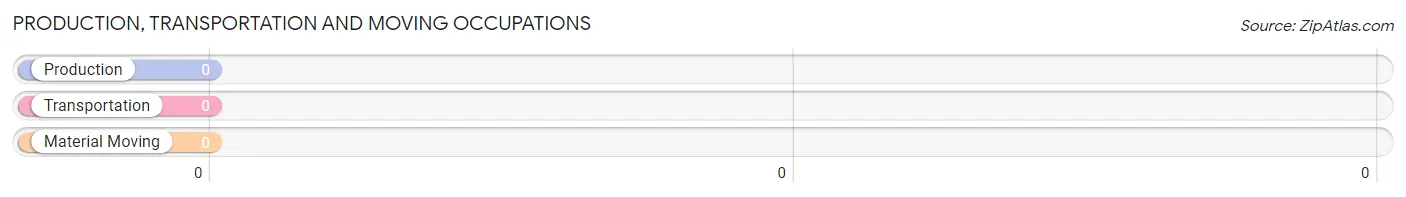
Production, Transportation and Moving Occupations by Sex
| Occupation | Male | Female |
| Production | 0 (0.0%) | 0 (0.0%) |
| Transportation | 0 (0.0%) | 0 (0.0%) |
| Material Moving | 0 (0.0%) | 0 (0.0%) |
| Total (Category) | 0 (0.0%) | 0 (0.0%) |
| Total (Overall) | 0 (0.0%) | 188 (100.0%) |
Employment Industries by Sex in Golden Shores
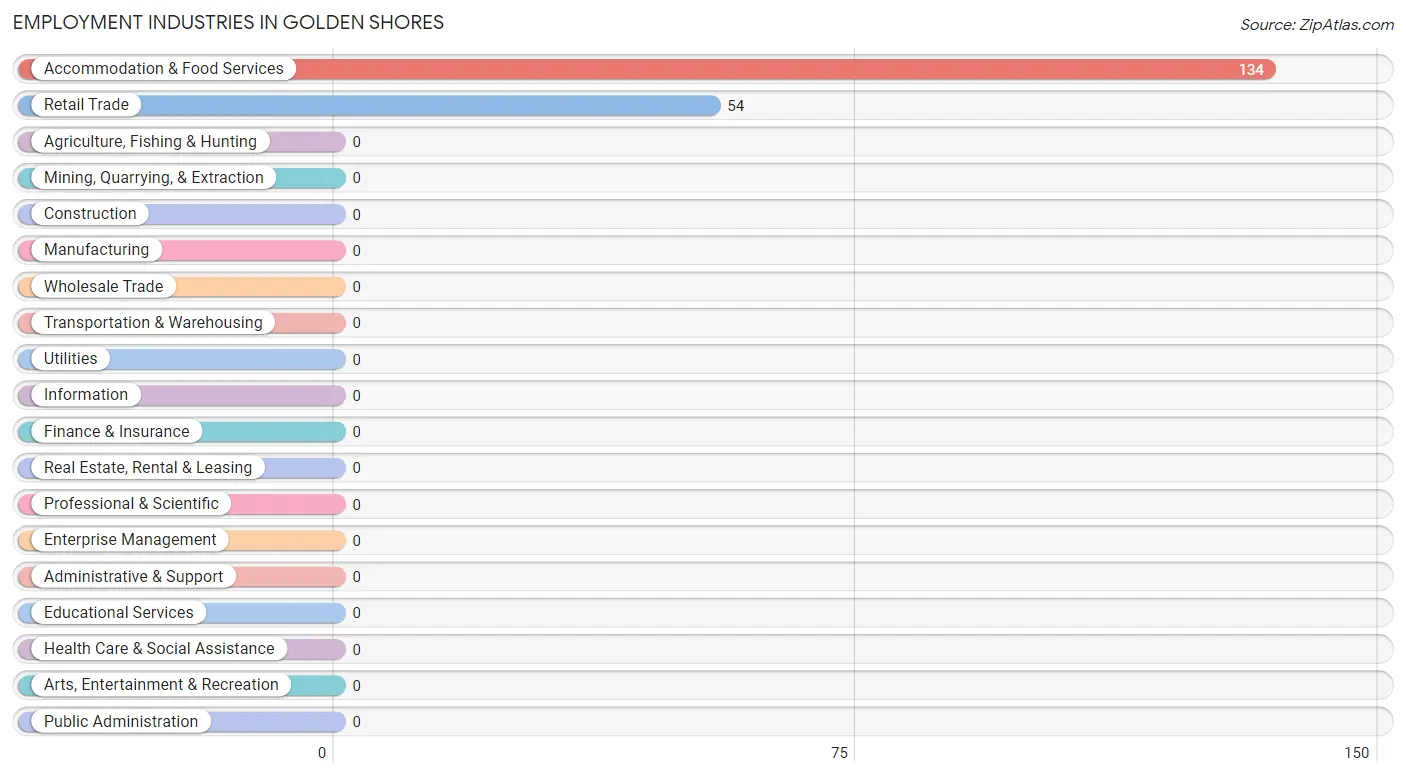
Employment Industries in Golden Shores
The major employment industries in Golden Shores include Accommodation & Food Services (134 | 71.3%), and Retail Trade (54 | 28.7%).
Employment Industries by Sex in Golden Shores
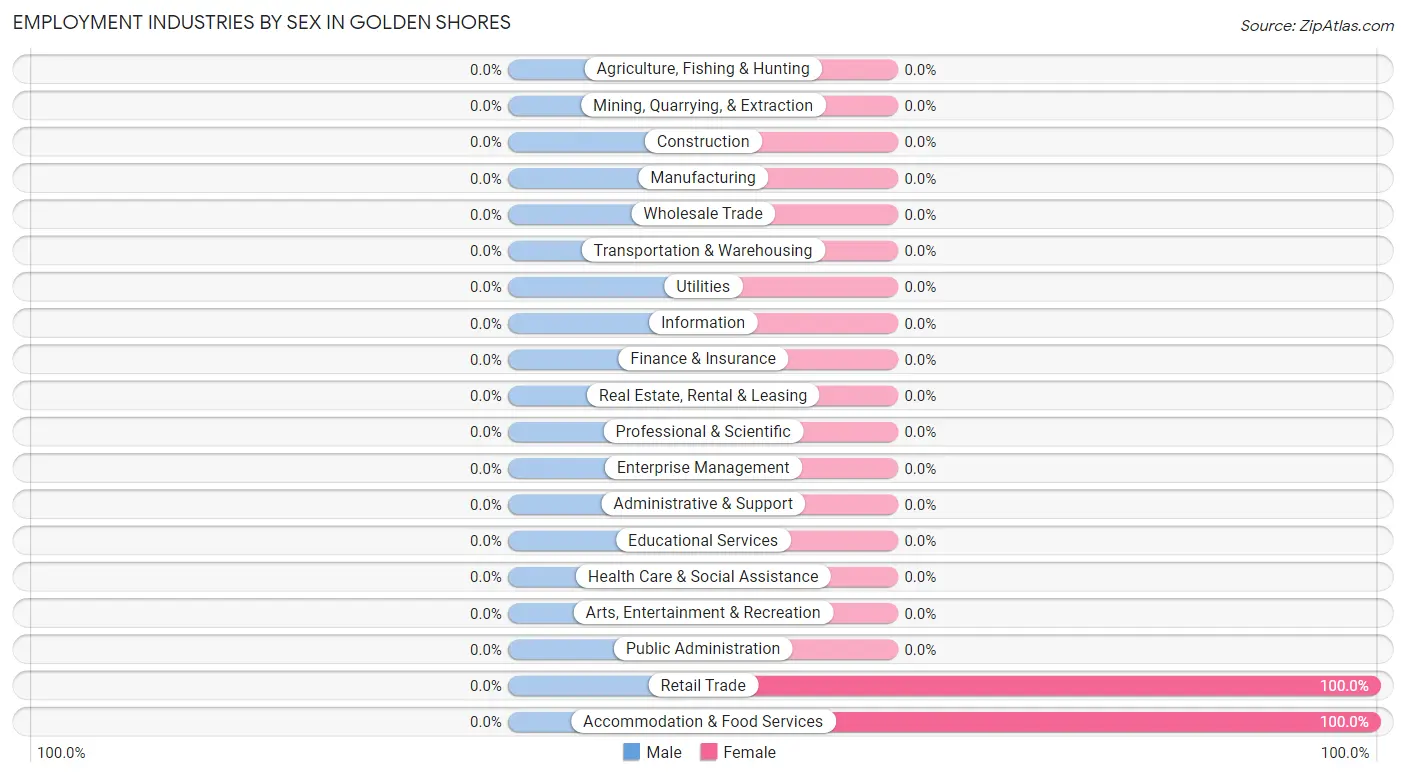
| Industry | Male | Female |
| Agriculture, Fishing & Hunting | 0 (0.0%) | 0 (0.0%) |
| Mining, Quarrying, & Extraction | 0 (0.0%) | 0 (0.0%) |
| Construction | 0 (0.0%) | 0 (0.0%) |
| Manufacturing | 0 (0.0%) | 0 (0.0%) |
| Wholesale Trade | 0 (0.0%) | 0 (0.0%) |
| Retail Trade | 0 (0.0%) | 54 (100.0%) |
| Transportation & Warehousing | 0 (0.0%) | 0 (0.0%) |
| Utilities | 0 (0.0%) | 0 (0.0%) |
| Information | 0 (0.0%) | 0 (0.0%) |
| Finance & Insurance | 0 (0.0%) | 0 (0.0%) |
| Real Estate, Rental & Leasing | 0 (0.0%) | 0 (0.0%) |
| Professional & Scientific | 0 (0.0%) | 0 (0.0%) |
| Enterprise Management | 0 (0.0%) | 0 (0.0%) |
| Administrative & Support | 0 (0.0%) | 0 (0.0%) |
| Educational Services | 0 (0.0%) | 0 (0.0%) |
| Health Care & Social Assistance | 0 (0.0%) | 0 (0.0%) |
| Arts, Entertainment & Recreation | 0 (0.0%) | 0 (0.0%) |
| Accommodation & Food Services | 0 (0.0%) | 134 (100.0%) |
| Public Administration | 0 (0.0%) | 0 (0.0%) |
| Total | 0 (0.0%) | 188 (100.0%) |
Education in Golden Shores
School Enrollment in Golden Shores
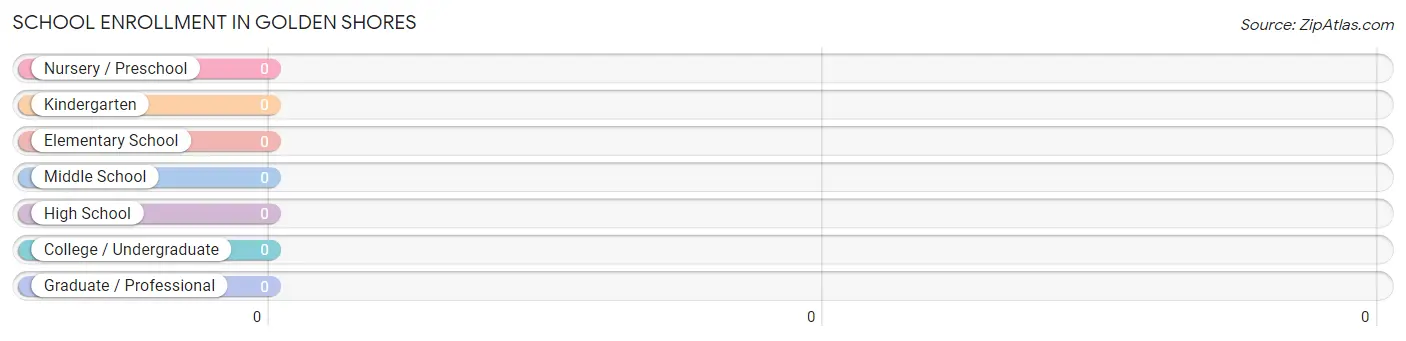
| School Level | # Students | % Students |
| Nursery / Preschool | 0 | 0.0% |
| Kindergarten | 0 | 0.0% |
| Elementary School | 0 | 0.0% |
| Middle School | 0 | 0.0% |
| High School | 0 | 0.0% |
| College / Undergraduate | 0 | 0.0% |
| Graduate / Professional | 0 | 0.0% |
| Total | 0 | 0.0% |
School Enrollment by Age by Funding Source in Golden Shores
| Age Bracket | Public School | Private School |
| 3 to 4 Year Olds | 0 (0.0%) | 0 (0.0%) |
| 5 to 9 Year Old | 0 (0.0%) | 0 (0.0%) |
| 10 to 14 Year Olds | 0 (0.0%) | 0 (0.0%) |
| 15 to 17 Year Olds | 0 (0.0%) | 0 (0.0%) |
| 18 to 19 Year Olds | 0 (0.0%) | 0 (0.0%) |
| 20 to 24 Year Olds | 0 (0.0%) | 0 (0.0%) |
| 25 to 34 Year Olds | 0 (0.0%) | 0 (0.0%) |
| 35 Years and over | 0 (0.0%) | 0 (0.0%) |
| Total | 0 (0.0%) | 0 (0.0%) |
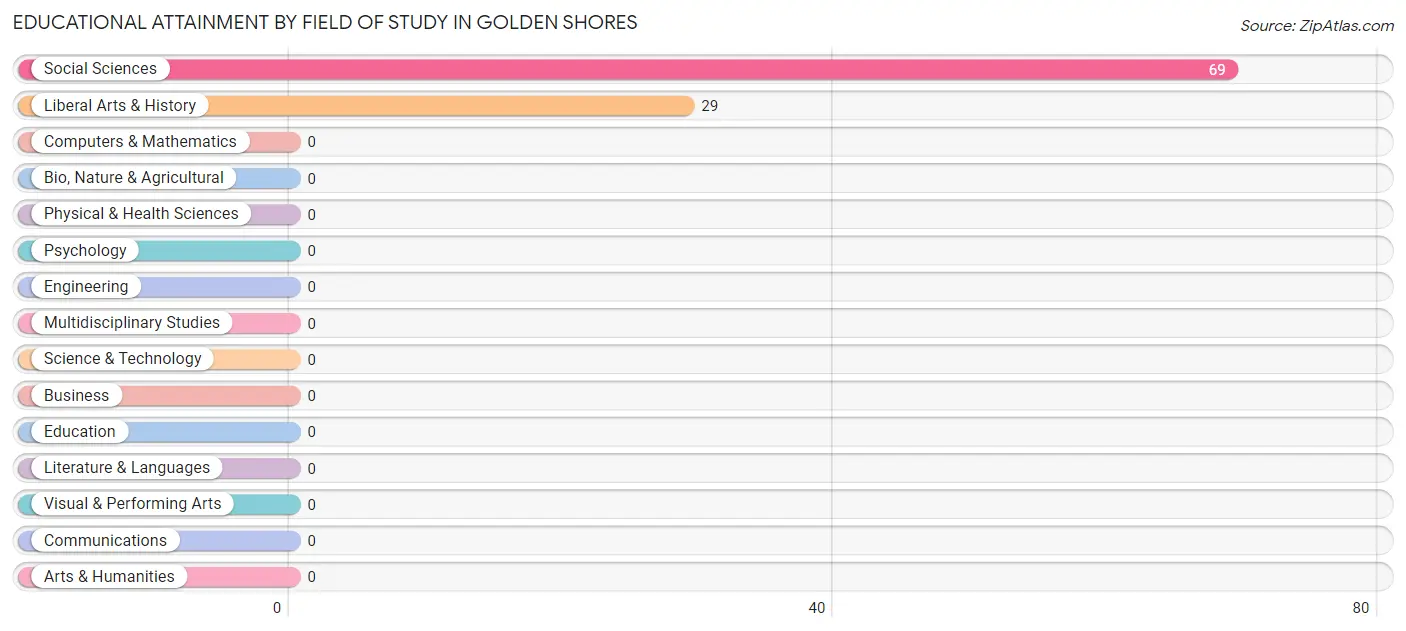
Educational Attainment by Field of Study in Golden Shores
Social sciences (69 | 70.4%), and liberal arts & history (29 | 29.6%) are the most common fields of study among 98 individuals in Golden Shores who have obtained a bachelor's degree or higher.
| Field of Study | # Graduates | % Graduates |
| Computers & Mathematics | 0 | 0.0% |
| Bio, Nature & Agricultural | 0 | 0.0% |
| Physical & Health Sciences | 0 | 0.0% |
| Psychology | 0 | 0.0% |
| Social Sciences | 69 | 70.4% |
| Engineering | 0 | 0.0% |
| Multidisciplinary Studies | 0 | 0.0% |
| Science & Technology | 0 | 0.0% |
| Business | 0 | 0.0% |
| Education | 0 | 0.0% |
| Literature & Languages | 0 | 0.0% |
| Liberal Arts & History | 29 | 29.6% |
| Visual & Performing Arts | 0 | 0.0% |
| Communications | 0 | 0.0% |
| Arts & Humanities | 0 | 0.0% |
| Total | 98 | 100.0% |
Transportation & Commute in Golden Shores
Vehicle Availability by Sex in Golden Shores
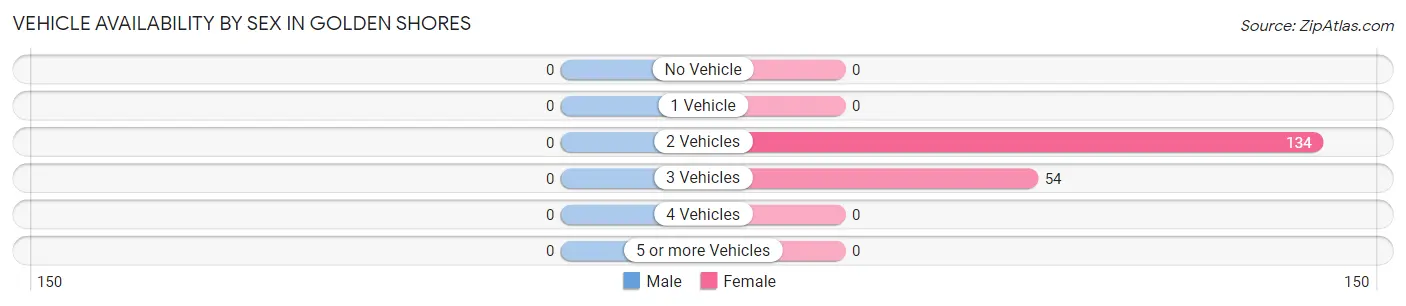
| Vehicles Available | Male | Female |
| No Vehicle | 0 (0.0%) | 0 (0.0%) |
| 1 Vehicle | 0 (0.0%) | 0 (0.0%) |
| 2 Vehicles | 0 (0.0%) | 134 (71.3%) |
| 3 Vehicles | 0 (0.0%) | 54 (28.7%) |
| 4 Vehicles | 0 (0.0%) | 0 (0.0%) |
| 5 or more Vehicles | 0 (0.0%) | 0 (0.0%) |
| Total | 0 (0.0%) | 188 (100.0%) |
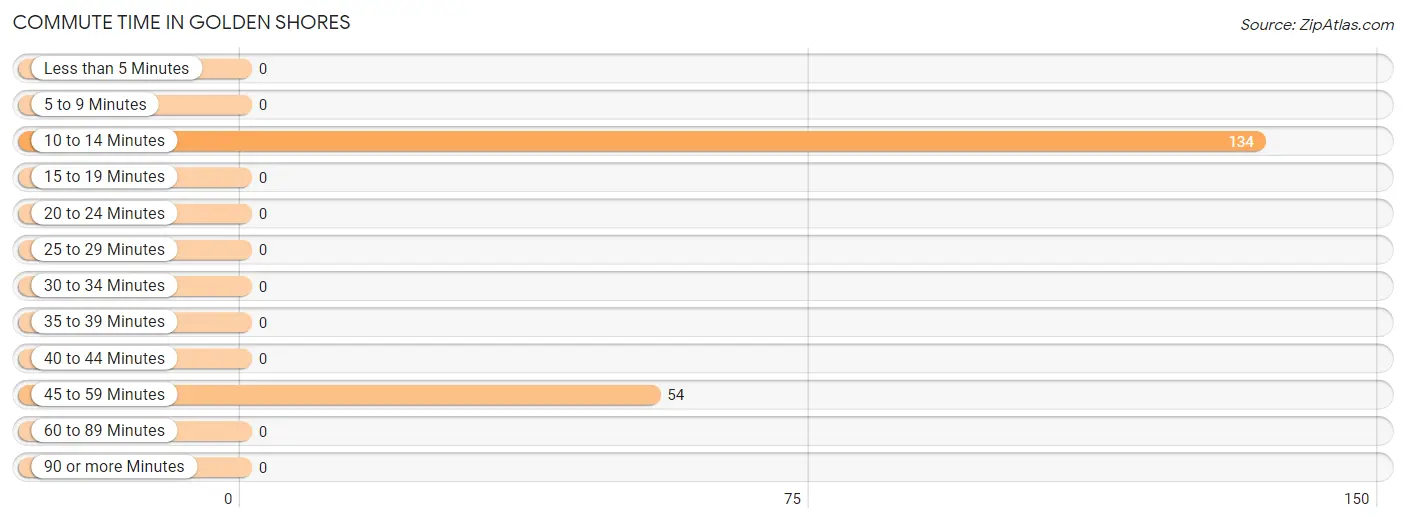
Commute Time in Golden Shores
The most frequently occuring commute durations in Golden Shores are 10 to 14 minutes (134 commuters, 71.3%), 45 to 59 minutes (54 commuters, 28.7%), and less than 5 minutes (0 commuters, 0.0%).
| Commute Time | # Commuters | % Commuters |
| Less than 5 Minutes | 0 | 0.0% |
| 5 to 9 Minutes | 0 | 0.0% |
| 10 to 14 Minutes | 134 | 71.3% |
| 15 to 19 Minutes | 0 | 0.0% |
| 20 to 24 Minutes | 0 | 0.0% |
| 25 to 29 Minutes | 0 | 0.0% |
| 30 to 34 Minutes | 0 | 0.0% |
| 35 to 39 Minutes | 0 | 0.0% |
| 40 to 44 Minutes | 0 | 0.0% |
| 45 to 59 Minutes | 54 | 28.7% |
| 60 to 89 Minutes | 0 | 0.0% |
| 90 or more Minutes | 0 | 0.0% |
Commute Time by Sex in Golden Shores
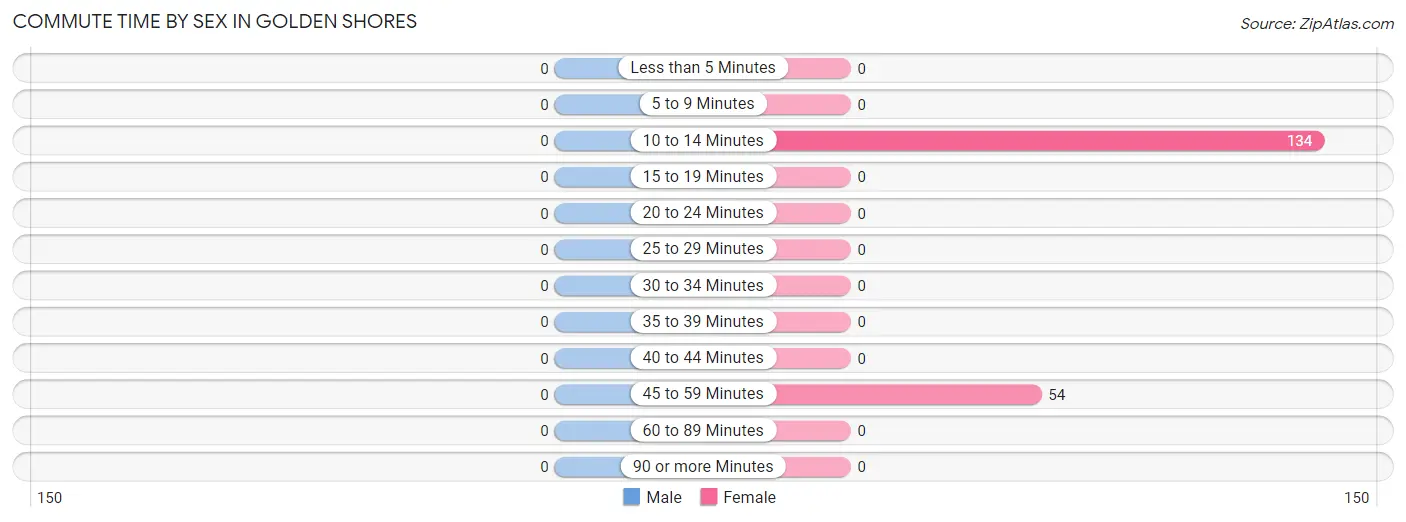
| Commute Time | Male | Female |
| Less than 5 Minutes | 0 (0.0%) | 0 (0.0%) |
| 5 to 9 Minutes | 0 (0.0%) | 0 (0.0%) |
| 10 to 14 Minutes | 0 (0.0%) | 134 (71.3%) |
| 15 to 19 Minutes | 0 (0.0%) | 0 (0.0%) |
| 20 to 24 Minutes | 0 (0.0%) | 0 (0.0%) |
| 25 to 29 Minutes | 0 (0.0%) | 0 (0.0%) |
| 30 to 34 Minutes | 0 (0.0%) | 0 (0.0%) |
| 35 to 39 Minutes | 0 (0.0%) | 0 (0.0%) |
| 40 to 44 Minutes | 0 (0.0%) | 0 (0.0%) |
| 45 to 59 Minutes | 0 (0.0%) | 54 (28.7%) |
| 60 to 89 Minutes | 0 (0.0%) | 0 (0.0%) |
| 90 or more Minutes | 0 (0.0%) | 0 (0.0%) |
Time of Departure to Work by Sex in Golden Shores
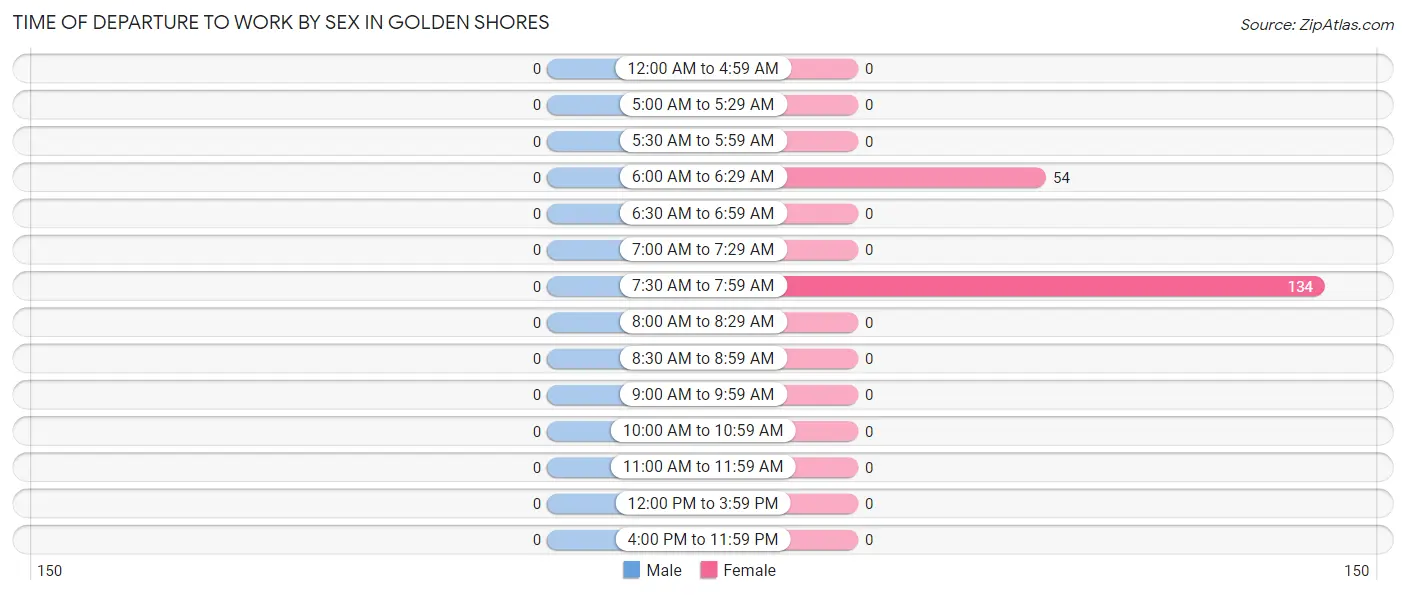
| Time of Departure | Male | Female |
| 12:00 AM to 4:59 AM | 0 (0.0%) | 0 (0.0%) |
| 5:00 AM to 5:29 AM | 0 (0.0%) | 0 (0.0%) |
| 5:30 AM to 5:59 AM | 0 (0.0%) | 0 (0.0%) |
| 6:00 AM to 6:29 AM | 0 (0.0%) | 54 (28.7%) |
| 6:30 AM to 6:59 AM | 0 (0.0%) | 0 (0.0%) |
| 7:00 AM to 7:29 AM | 0 (0.0%) | 0 (0.0%) |
| 7:30 AM to 7:59 AM | 0 (0.0%) | 134 (71.3%) |
| 8:00 AM to 8:29 AM | 0 (0.0%) | 0 (0.0%) |
| 8:30 AM to 8:59 AM | 0 (0.0%) | 0 (0.0%) |
| 9:00 AM to 9:59 AM | 0 (0.0%) | 0 (0.0%) |
| 10:00 AM to 10:59 AM | 0 (0.0%) | 0 (0.0%) |
| 11:00 AM to 11:59 AM | 0 (0.0%) | 0 (0.0%) |
| 12:00 PM to 3:59 PM | 0 (0.0%) | 0 (0.0%) |
| 4:00 PM to 11:59 PM | 0 (0.0%) | 0 (0.0%) |
| Total | 0 (0.0%) | 188 (100.0%) |
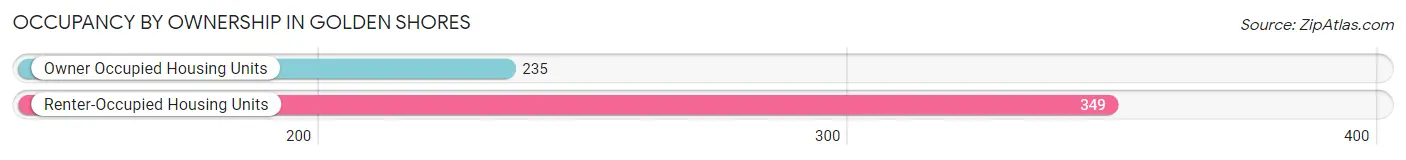
Housing Occupancy in Golden Shores
Occupancy by Ownership in Golden Shores
Of the total 584 dwellings in Golden Shores, owner-occupied units account for 235 (40.2%), while renter-occupied units make up 349 (59.8%).
| Occupancy | # Housing Units | % Housing Units |
| Owner Occupied Housing Units | 235 | 40.2% |
| Renter-Occupied Housing Units | 349 | 59.8% |
| Total Occupied Housing Units | 584 | 100.0% |
Occupancy by Household Size in Golden Shores
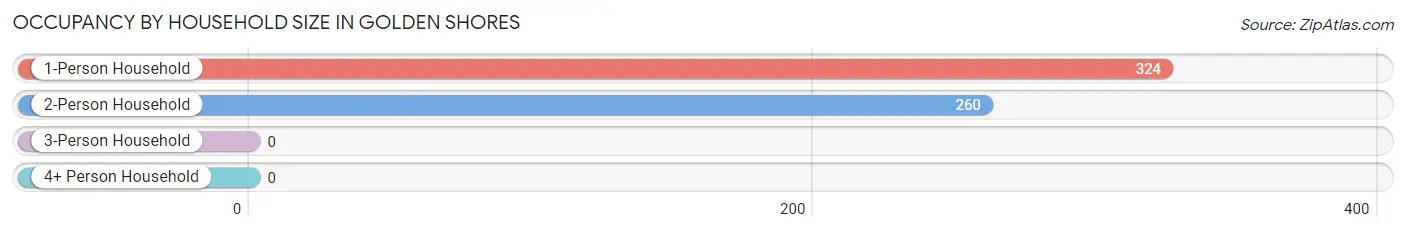
| Household Size | # Housing Units | % Housing Units |
| 1-Person Household | 324 | 55.5% |
| 2-Person Household | 260 | 44.5% |
| 3-Person Household | 0 | 0.0% |
| 4+ Person Household | 0 | 0.0% |
| Total Housing Units | 584 | 100.0% |
Occupancy by Ownership by Household Size in Golden Shores
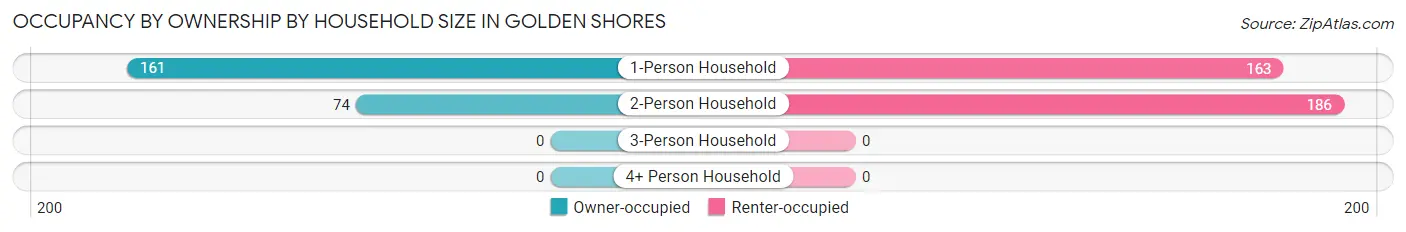
| Household Size | Owner-occupied | Renter-occupied |
| 1-Person Household | 161 (49.7%) | 163 (50.3%) |
| 2-Person Household | 74 (28.5%) | 186 (71.5%) |
| 3-Person Household | 0 (0.0%) | 0 (0.0%) |
| 4+ Person Household | 0 (0.0%) | 0 (0.0%) |
| Total Housing Units | 235 (40.2%) | 349 (59.8%) |
Occupancy by Educational Attainment in Golden Shores
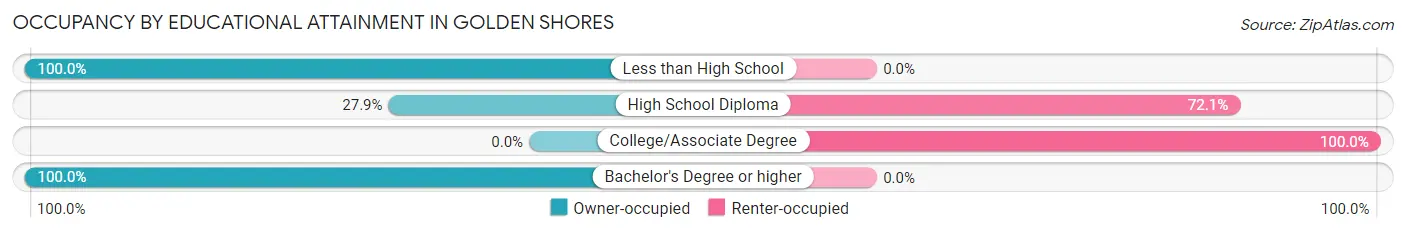
| Household Size | Owner-occupied | Renter-occupied |
| Less than High School | 74 (100.0%) | 0 (0.0%) |
| High School Diploma | 63 (27.9%) | 163 (72.1%) |
| College/Associate Degree | 0 (0.0%) | 186 (100.0%) |
| Bachelor's Degree or higher | 98 (100.0%) | 0 (0.0%) |
Occupancy by Age of Householder in Golden Shores
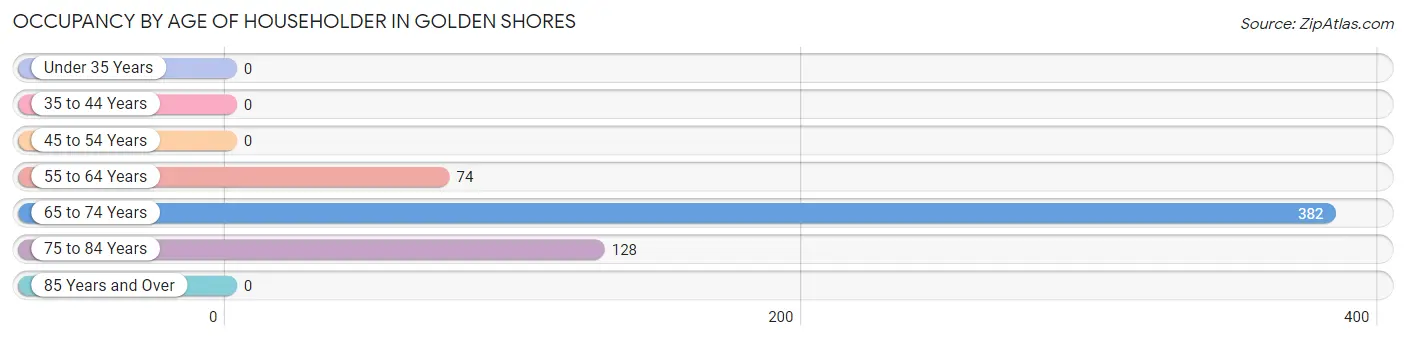
| Age Bracket | # Households | % Households |
| Under 35 Years | 0 | 0.0% |
| 35 to 44 Years | 0 | 0.0% |
| 45 to 54 Years | 0 | 0.0% |
| 55 to 64 Years | 74 | 12.7% |
| 65 to 74 Years | 382 | 65.4% |
| 75 to 84 Years | 128 | 21.9% |
| 85 Years and Over | 0 | 0.0% |
| Total | 584 | 100.0% |
Housing Finances in Golden Shores
Median Income by Occupancy in Golden Shores
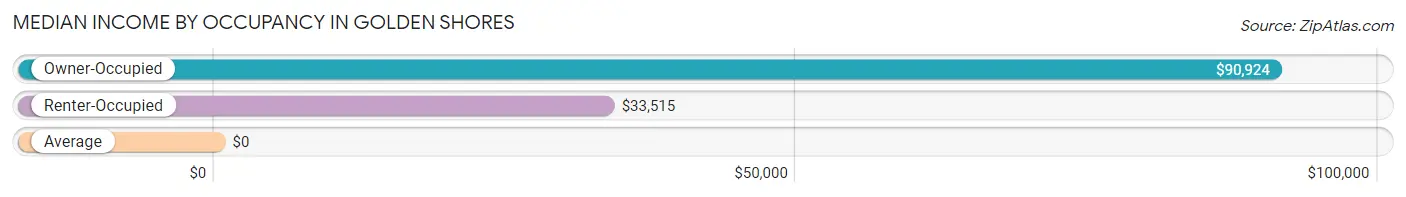
| Occupancy Type | # Households | Median Income |
| Owner-Occupied | 235 (40.2%) | $90,924 |
| Renter-Occupied | 349 (59.8%) | $33,515 |
| Average | 584 (100.0%) | $0 |
Occupancy by Householder Income Bracket in Golden Shores
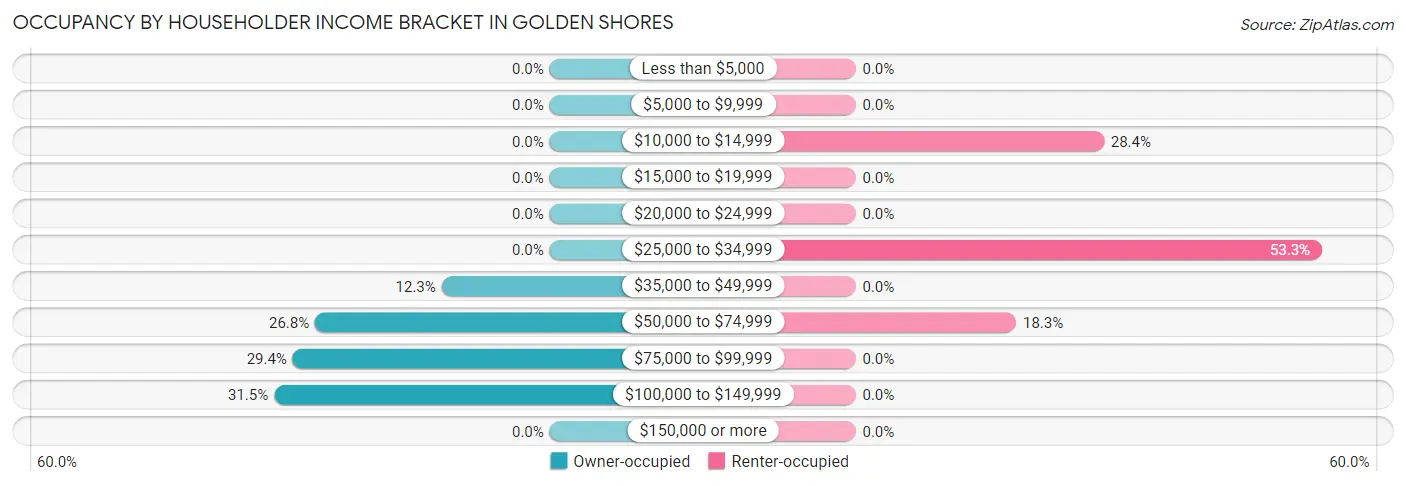
| Income Bracket | Owner-occupied | Renter-occupied |
| Less than $5,000 | 0 (0.0%) | 0 (0.0%) |
| $5,000 to $9,999 | 0 (0.0%) | 0 (0.0%) |
| $10,000 to $14,999 | 0 (0.0%) | 99 (28.4%) |
| $15,000 to $19,999 | 0 (0.0%) | 0 (0.0%) |
| $20,000 to $24,999 | 0 (0.0%) | 0 (0.0%) |
| $25,000 to $34,999 | 0 (0.0%) | 186 (53.3%) |
| $35,000 to $49,999 | 29 (12.3%) | 0 (0.0%) |
| $50,000 to $74,999 | 63 (26.8%) | 64 (18.3%) |
| $75,000 to $99,999 | 69 (29.4%) | 0 (0.0%) |
| $100,000 to $149,999 | 74 (31.5%) | 0 (0.0%) |
| $150,000 or more | 0 (0.0%) | 0 (0.0%) |
| Total | 235 (100.0%) | 349 (100.0%) |
Monthly Housing Cost Tiers in Golden Shores
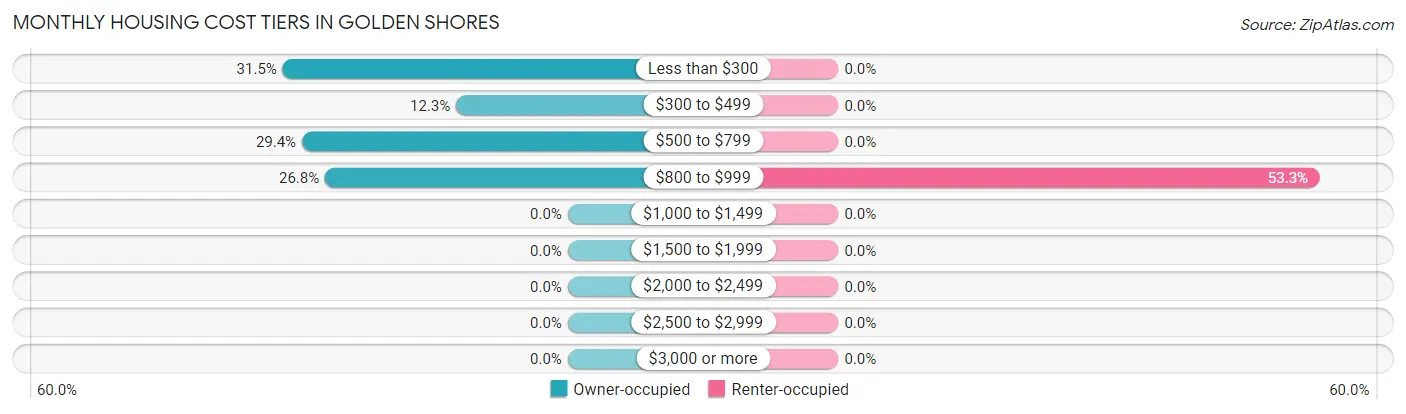
| Monthly Cost | Owner-occupied | Renter-occupied |
| Less than $300 | 74 (31.5%) | 0 (0.0%) |
| $300 to $499 | 29 (12.3%) | 0 (0.0%) |
| $500 to $799 | 69 (29.4%) | 0 (0.0%) |
| $800 to $999 | 63 (26.8%) | 186 (53.3%) |
| $1,000 to $1,499 | 0 (0.0%) | 0 (0.0%) |
| $1,500 to $1,999 | 0 (0.0%) | 0 (0.0%) |
| $2,000 to $2,499 | 0 (0.0%) | 0 (0.0%) |
| $2,500 to $2,999 | 0 (0.0%) | 0 (0.0%) |
| $3,000 or more | 0 (0.0%) | 0 (0.0%) |
| Total | 235 (100.0%) | 349 (100.0%) |
Physical Housing Characteristics in Golden Shores
Housing Structures in Golden Shores
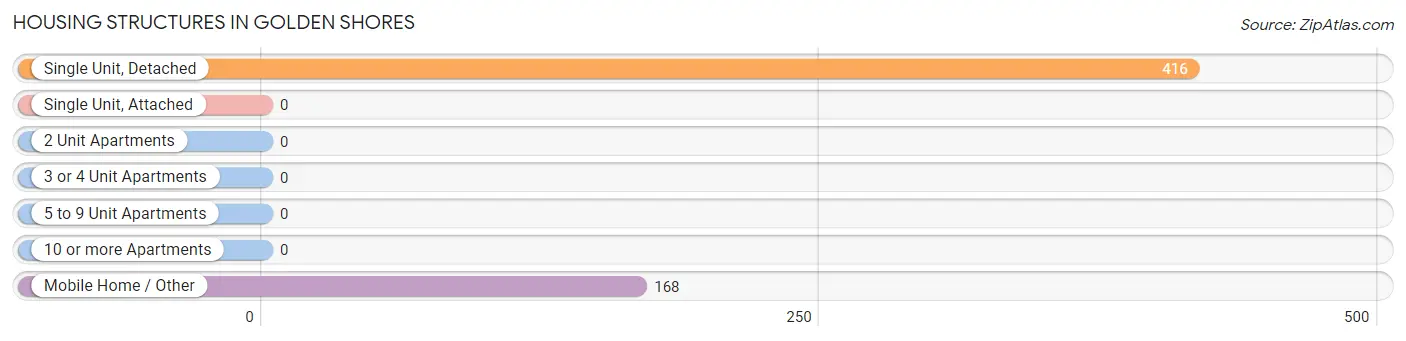
| Structure Type | # Housing Units | % Housing Units |
| Single Unit, Detached | 416 | 71.2% |
| Single Unit, Attached | 0 | 0.0% |
| 2 Unit Apartments | 0 | 0.0% |
| 3 or 4 Unit Apartments | 0 | 0.0% |
| 5 to 9 Unit Apartments | 0 | 0.0% |
| 10 or more Apartments | 0 | 0.0% |
| Mobile Home / Other | 168 | 28.8% |
| Total | 584 | 100.0% |
Housing Structures by Occupancy in Golden Shores
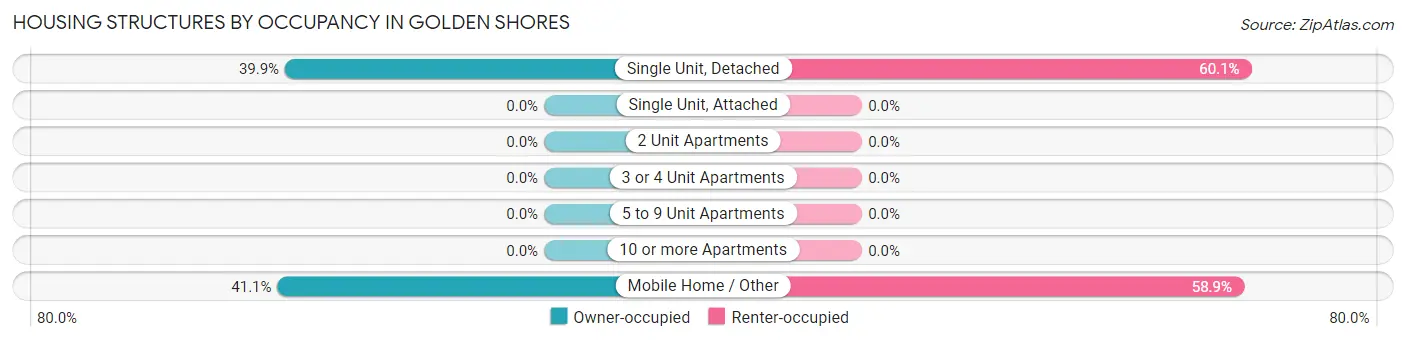
| Structure Type | Owner-occupied | Renter-occupied |
| Single Unit, Detached | 166 (39.9%) | 250 (60.1%) |
| Single Unit, Attached | 0 (0.0%) | 0 (0.0%) |
| 2 Unit Apartments | 0 (0.0%) | 0 (0.0%) |
| 3 or 4 Unit Apartments | 0 (0.0%) | 0 (0.0%) |
| 5 to 9 Unit Apartments | 0 (0.0%) | 0 (0.0%) |
| 10 or more Apartments | 0 (0.0%) | 0 (0.0%) |
| Mobile Home / Other | 69 (41.1%) | 99 (58.9%) |
| Total | 235 (40.2%) | 349 (59.8%) |
Housing Structures by Number of Rooms in Golden Shores
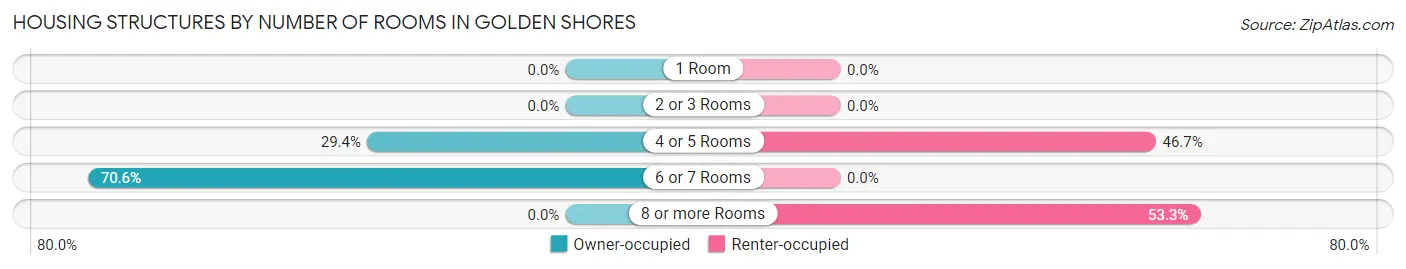
| Number of Rooms | Owner-occupied | Renter-occupied |
| 1 Room | 0 (0.0%) | 0 (0.0%) |
| 2 or 3 Rooms | 0 (0.0%) | 0 (0.0%) |
| 4 or 5 Rooms | 69 (29.4%) | 163 (46.7%) |
| 6 or 7 Rooms | 166 (70.6%) | 0 (0.0%) |
| 8 or more Rooms | 0 (0.0%) | 186 (53.3%) |
| Total | 235 (100.0%) | 349 (100.0%) |
Housing Structure by Heating Type in Golden Shores
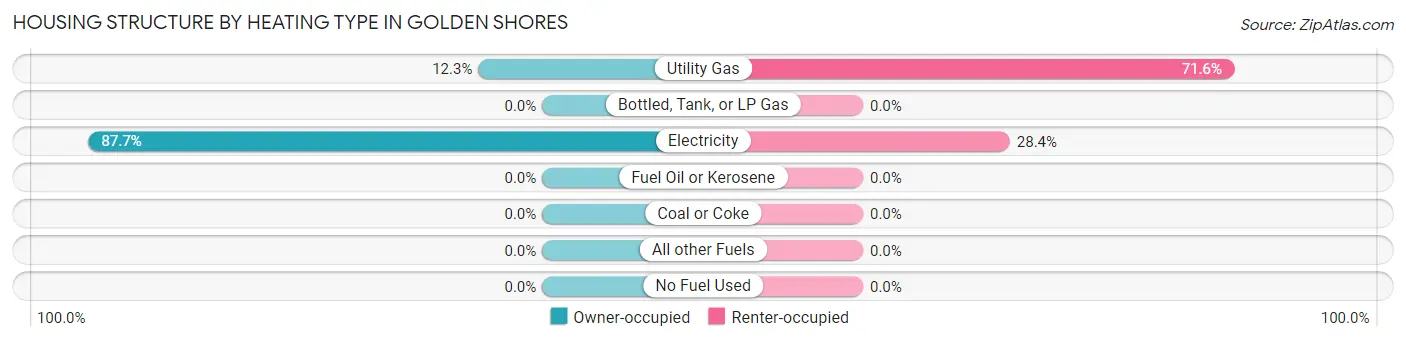
| Heating Type | Owner-occupied | Renter-occupied |
| Utility Gas | 29 (12.3%) | 250 (71.6%) |
| Bottled, Tank, or LP Gas | 0 (0.0%) | 0 (0.0%) |
| Electricity | 206 (87.7%) | 99 (28.4%) |
| Fuel Oil or Kerosene | 0 (0.0%) | 0 (0.0%) |
| Coal or Coke | 0 (0.0%) | 0 (0.0%) |
| All other Fuels | 0 (0.0%) | 0 (0.0%) |
| No Fuel Used | 0 (0.0%) | 0 (0.0%) |
| Total | 235 (100.0%) | 349 (100.0%) |
Household Vehicle Usage in Golden Shores
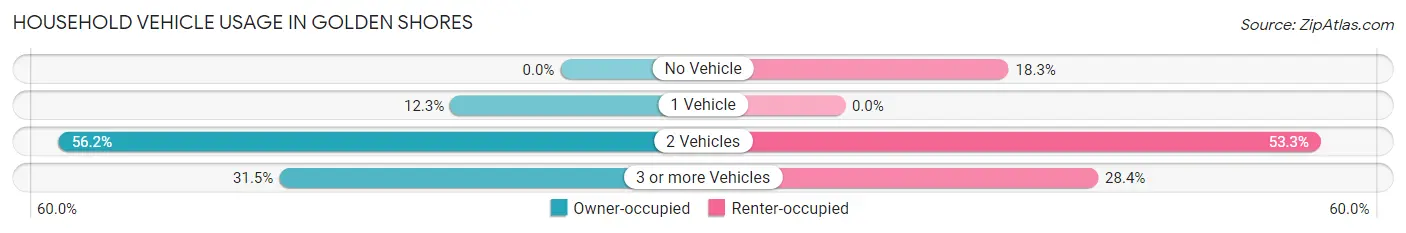
| Vehicles per Household | Owner-occupied | Renter-occupied |
| No Vehicle | 0 (0.0%) | 64 (18.3%) |
| 1 Vehicle | 29 (12.3%) | 0 (0.0%) |
| 2 Vehicles | 132 (56.2%) | 186 (53.3%) |
| 3 or more Vehicles | 74 (31.5%) | 99 (28.4%) |
| Total | 235 (100.0%) | 349 (100.0%) |
Real Estate & Mortgages in Golden Shores
Real Estate and Mortgage Overview in Golden Shores
| Characteristic | Without Mortgage | With Mortgage |
| Housing Units | 103 | 132 |
| Median Property Value | - | - |
| Median Household Income | - | - |
| Monthly Housing Costs | - | - |
| Real Estate Taxes | - | - |
Property Value by Mortgage Status in Golden Shores
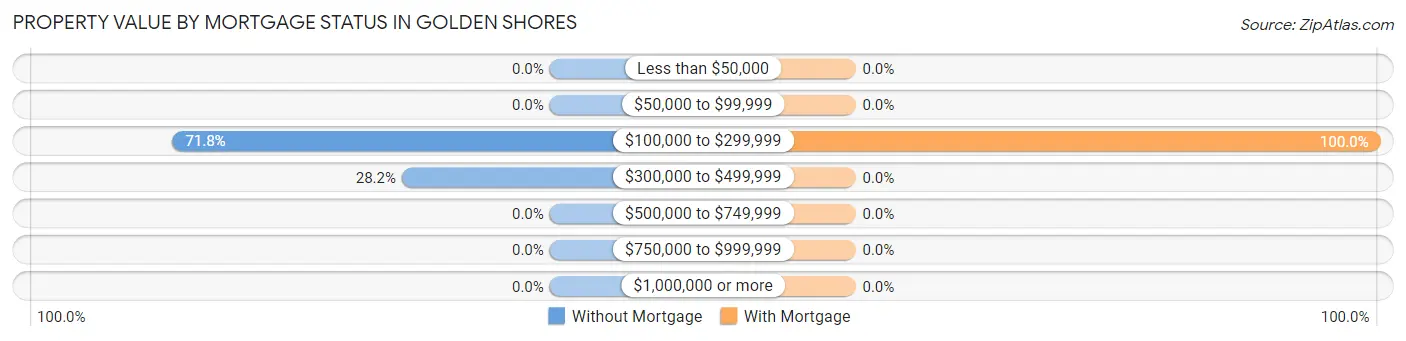
| Property Value | Without Mortgage | With Mortgage |
| Less than $50,000 | 0 (0.0%) | 0 (0.0%) |
| $50,000 to $99,999 | 0 (0.0%) | 0 (0.0%) |
| $100,000 to $299,999 | 74 (71.8%) | 132 (100.0%) |
| $300,000 to $499,999 | 29 (28.2%) | 0 (0.0%) |
| $500,000 to $749,999 | 0 (0.0%) | 0 (0.0%) |
| $750,000 to $999,999 | 0 (0.0%) | 0 (0.0%) |
| $1,000,000 or more | 0 (0.0%) | 0 (0.0%) |
| Total | 103 (100.0%) | 132 (100.0%) |
Household Income by Mortgage Status in Golden Shores
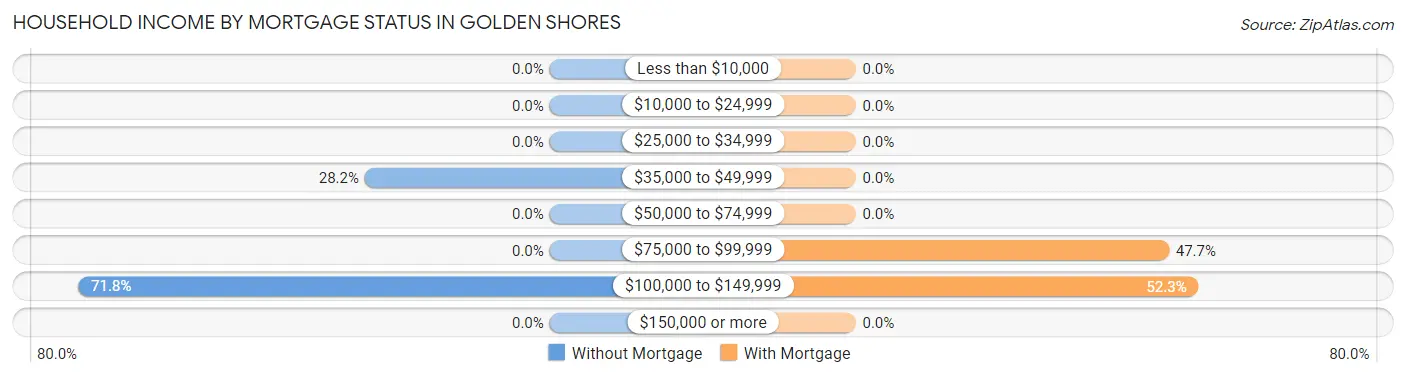
| Household Income | Without Mortgage | With Mortgage |
| Less than $10,000 | 0 (0.0%) | 0 (0.0%) |
| $10,000 to $24,999 | 0 (0.0%) | 0 (0.0%) |
| $25,000 to $34,999 | 0 (0.0%) | 0 (0.0%) |
| $35,000 to $49,999 | 29 (28.2%) | 0 (0.0%) |
| $50,000 to $74,999 | 0 (0.0%) | 0 (0.0%) |
| $75,000 to $99,999 | 0 (0.0%) | 63 (47.7%) |
| $100,000 to $149,999 | 74 (71.8%) | 69 (52.3%) |
| $150,000 or more | 0 (0.0%) | 0 (0.0%) |
| Total | 103 (100.0%) | 132 (100.0%) |
Property Value to Household Income Ratio in Golden Shores
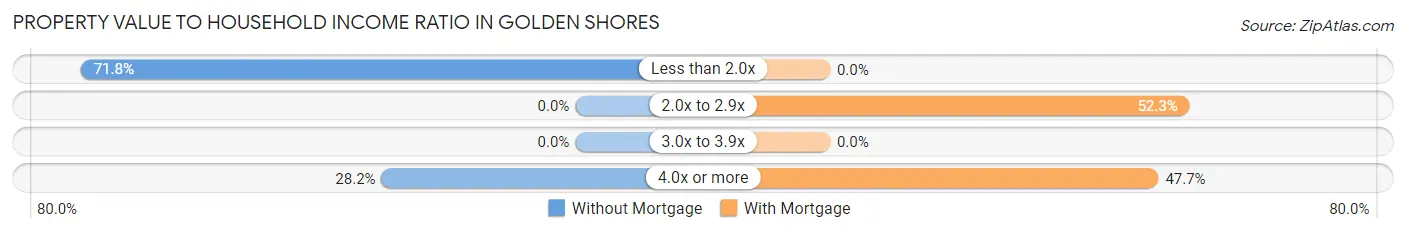
| Value-to-Income Ratio | Without Mortgage | With Mortgage |
| Less than 2.0x | 74 (71.8%) | 0 (0.0%) |
| 2.0x to 2.9x | 0 (0.0%) | 69 (52.3%) |
| 3.0x to 3.9x | 0 (0.0%) | 0 (0.0%) |
| 4.0x or more | 29 (28.2%) | 63 (47.7%) |
| Total | 103 (100.0%) | 132 (100.0%) |
Real Estate Taxes by Mortgage Status in Golden Shores
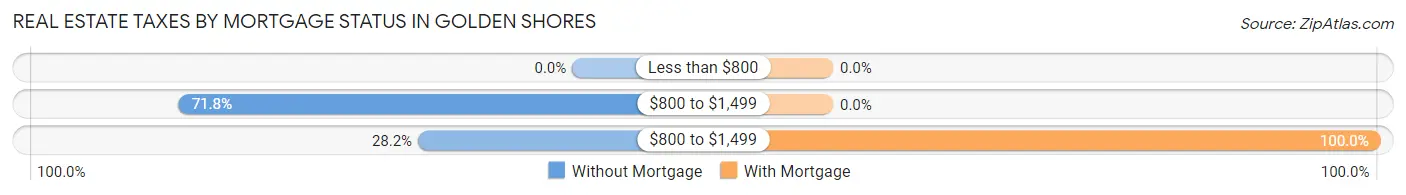
| Property Taxes | Without Mortgage | With Mortgage |
| Less than $800 | 0 (0.0%) | 0 (0.0%) |
| $800 to $1,499 | 74 (71.8%) | 0 (0.0%) |
| $800 to $1,499 | 29 (28.2%) | 132 (100.0%) |
| Total | 103 (100.0%) | 132 (100.0%) |
Health & Disability in Golden Shores
Health Insurance Coverage by Age in Golden Shores
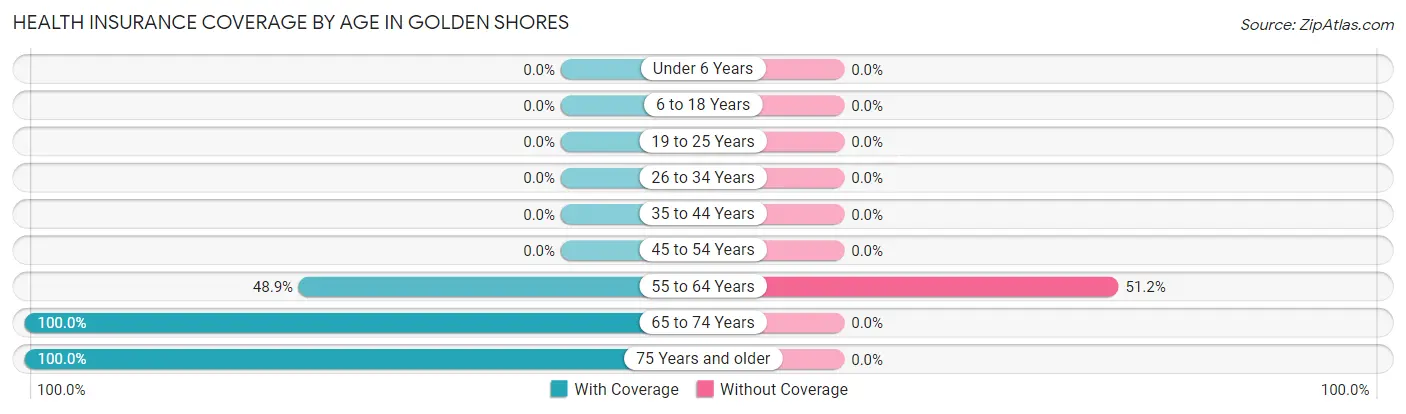
| Age Bracket | With Coverage | Without Coverage |
| Under 6 Years | 0 (0.0%) | 0 (0.0%) |
| 6 to 18 Years | 0 (0.0%) | 0 (0.0%) |
| 19 to 25 Years | 0 (0.0%) | 0 (0.0%) |
| 26 to 34 Years | 0 (0.0%) | 0 (0.0%) |
| 35 to 44 Years | 0 (0.0%) | 0 (0.0%) |
| 45 to 54 Years | 0 (0.0%) | 0 (0.0%) |
| 55 to 64 Years | 128 (48.8%) | 134 (51.1%) |
| 65 to 74 Years | 382 (100.0%) | 0 (0.0%) |
| 75 Years and older | 128 (100.0%) | 0 (0.0%) |
| Total | 638 (82.6%) | 134 (17.4%) |
Health Insurance Coverage by Citizenship Status in Golden Shores
| Citizenship Status | With Coverage | Without Coverage |
| Native Born | 0 (0.0%) | 0 (0.0%) |
| Foreign Born, Citizen | 0 (0.0%) | 0 (0.0%) |
| Foreign Born, not a Citizen | 0 (0.0%) | 0 (0.0%) |
Health Insurance Coverage by Household Income in Golden Shores
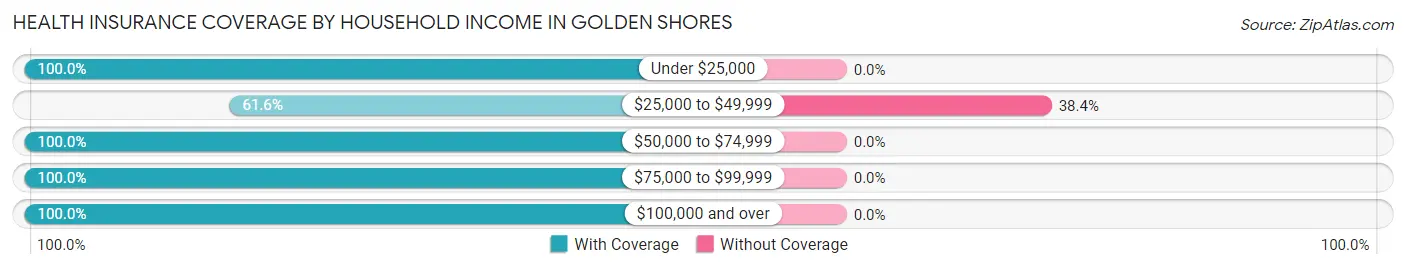
| Household Income | With Coverage | Without Coverage |
| Under $25,000 | 99 (100.0%) | 0 (0.0%) |
| $25,000 to $49,999 | 215 (61.6%) | 134 (38.4%) |
| $50,000 to $74,999 | 127 (100.0%) | 0 (0.0%) |
| $75,000 to $99,999 | 69 (100.0%) | 0 (0.0%) |
| $100,000 and over | 128 (100.0%) | 0 (0.0%) |
Public vs Private Health Insurance Coverage by Age in Golden Shores
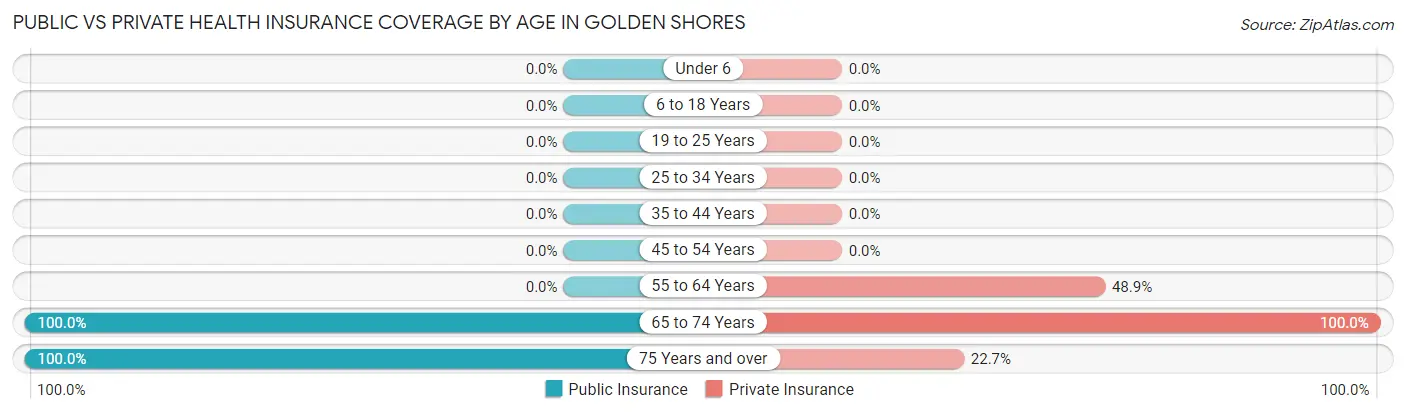
| Age Bracket | Public Insurance | Private Insurance |
| Under 6 | 0 (0.0%) | 0 (0.0%) |
| 6 to 18 Years | 0 (0.0%) | 0 (0.0%) |
| 19 to 25 Years | 0 (0.0%) | 0 (0.0%) |
| 25 to 34 Years | 0 (0.0%) | 0 (0.0%) |
| 35 to 44 Years | 0 (0.0%) | 0 (0.0%) |
| 45 to 54 Years | 0 (0.0%) | 0 (0.0%) |
| 55 to 64 Years | 0 (0.0%) | 128 (48.8%) |
| 65 to 74 Years | 382 (100.0%) | 382 (100.0%) |
| 75 Years and over | 128 (100.0%) | 29 (22.7%) |
| Total | 510 (66.1%) | 539 (69.8%) |
Disability Status by Sex by Age in Golden Shores
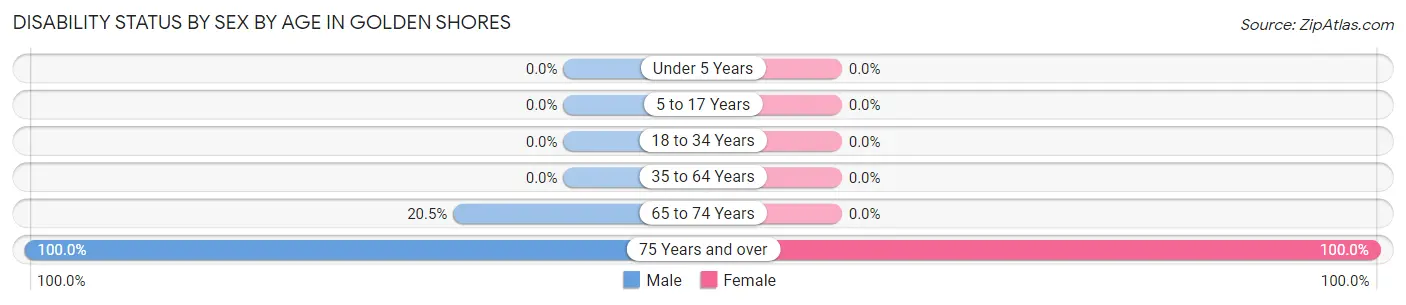
| Age Bracket | Male | Female |
| Under 5 Years | 0 (0.0%) | 0 (0.0%) |
| 5 to 17 Years | 0 (0.0%) | 0 (0.0%) |
| 18 to 34 Years | 0 (0.0%) | 0 (0.0%) |
| 35 to 64 Years | 0 (0.0%) | 0 (0.0%) |
| 65 to 74 Years | 64 (20.4%) | 0 (0.0%) |
| 75 Years and over | 99 (100.0%) | 29 (100.0%) |
Disability Class by Sex by Age in Golden Shores
Disability Class: Hearing Difficulty
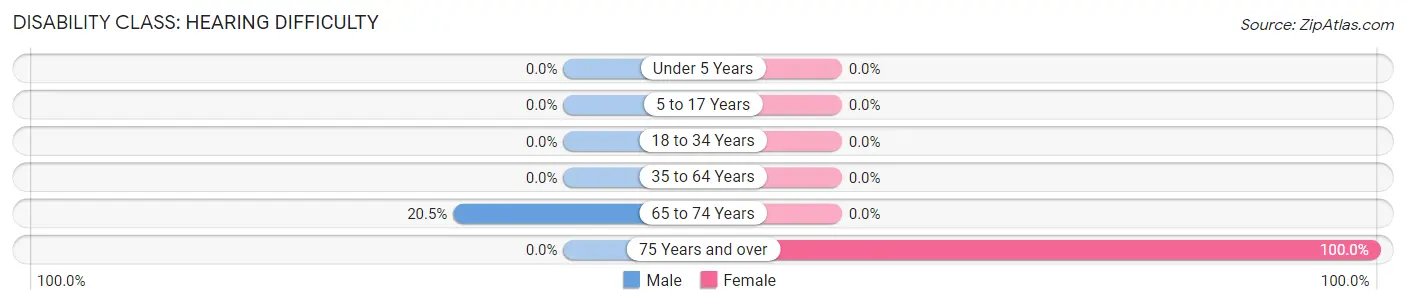
| Age Bracket | Male | Female |
| Under 5 Years | 0 (0.0%) | 0 (0.0%) |
| 5 to 17 Years | 0 (0.0%) | 0 (0.0%) |
| 18 to 34 Years | 0 (0.0%) | 0 (0.0%) |
| 35 to 64 Years | 0 (0.0%) | 0 (0.0%) |
| 65 to 74 Years | 64 (20.4%) | 0 (0.0%) |
| 75 Years and over | 0 (0.0%) | 29 (100.0%) |
Disability Class: Vision Difficulty
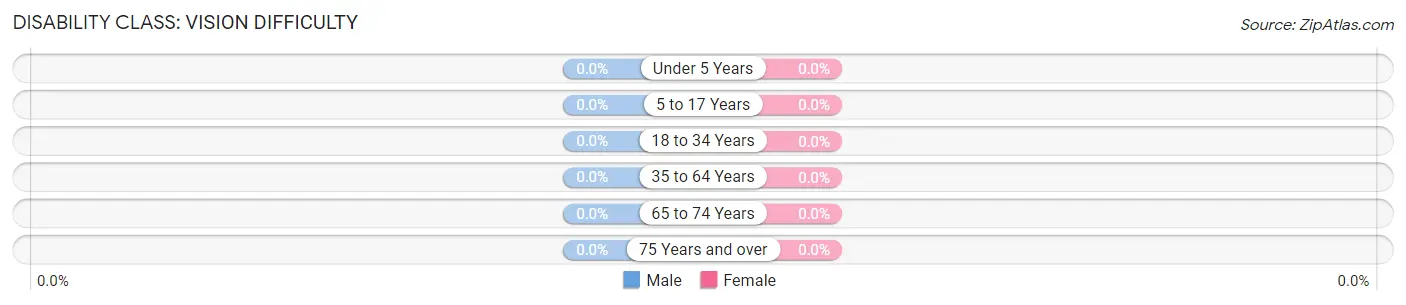
| Age Bracket | Male | Female |
| Under 5 Years | 0 (0.0%) | 0 (0.0%) |
| 5 to 17 Years | 0 (0.0%) | 0 (0.0%) |
| 18 to 34 Years | 0 (0.0%) | 0 (0.0%) |
| 35 to 64 Years | 0 (0.0%) | 0 (0.0%) |
| 65 to 74 Years | 0 (0.0%) | 0 (0.0%) |
| 75 Years and over | 0 (0.0%) | 0 (0.0%) |
Disability Class: Cognitive Difficulty
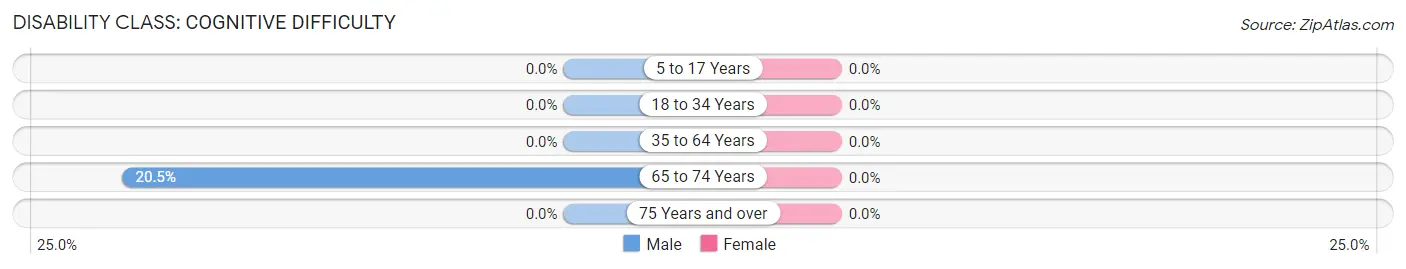
| Age Bracket | Male | Female |
| 5 to 17 Years | 0 (0.0%) | 0 (0.0%) |
| 18 to 34 Years | 0 (0.0%) | 0 (0.0%) |
| 35 to 64 Years | 0 (0.0%) | 0 (0.0%) |
| 65 to 74 Years | 64 (20.4%) | 0 (0.0%) |
| 75 Years and over | 0 (0.0%) | 0 (0.0%) |
Disability Class: Ambulatory Difficulty
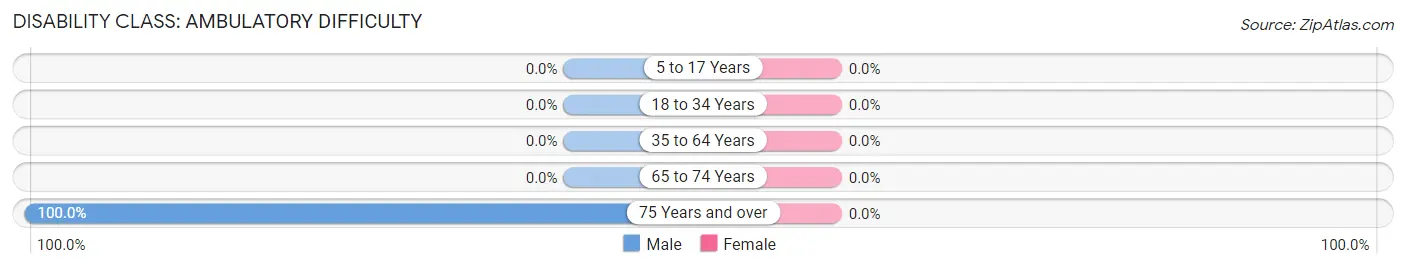
| Age Bracket | Male | Female |
| 5 to 17 Years | 0 (0.0%) | 0 (0.0%) |
| 18 to 34 Years | 0 (0.0%) | 0 (0.0%) |
| 35 to 64 Years | 0 (0.0%) | 0 (0.0%) |
| 65 to 74 Years | 0 (0.0%) | 0 (0.0%) |
| 75 Years and over | 99 (100.0%) | 0 (0.0%) |
Disability Class: Self-Care Difficulty
| Age Bracket | Male | Female |
| 5 to 17 Years | 0 (0.0%) | 0 (0.0%) |
| 18 to 34 Years | 0 (0.0%) | 0 (0.0%) |
| 35 to 64 Years | 0 (0.0%) | 0 (0.0%) |
| 65 to 74 Years | 0 (0.0%) | 0 (0.0%) |
| 75 Years and over | 0 (0.0%) | 0 (0.0%) |
Technology Access in Golden Shores
Computing Device Access in Golden Shores
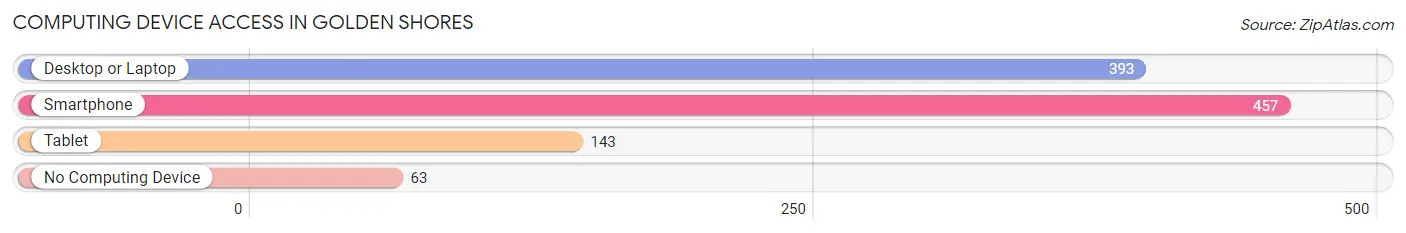
| Device Type | # Households | % Households |
| Desktop or Laptop | 393 | 67.3% |
| Smartphone | 457 | 78.2% |
| Tablet | 143 | 24.5% |
| No Computing Device | 63 | 10.8% |
| Total | 584 | 100.0% |
Internet Access in Golden Shores
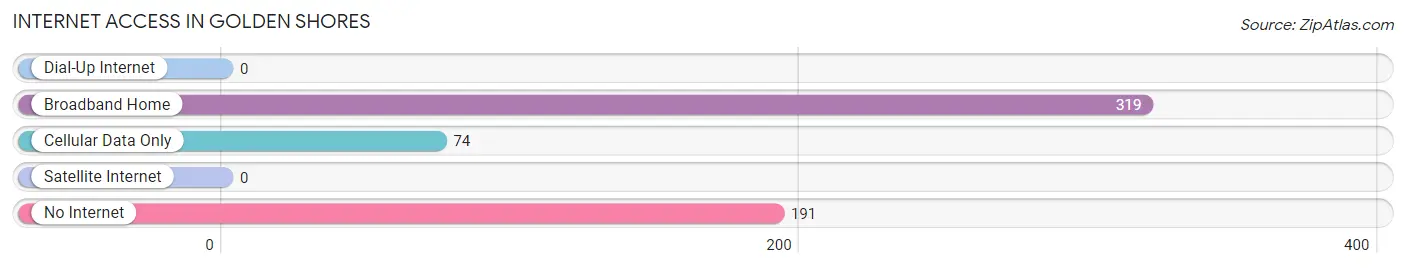
| Internet Type | # Households | % Households |
| Dial-Up Internet | 0 | 0.0% |
| Broadband Home | 319 | 54.6% |
| Cellular Data Only | 74 | 12.7% |
| Satellite Internet | 0 | 0.0% |
| No Internet | 191 | 32.7% |
| Total | 584 | 100.0% |
Golden Shores Summary
Golden Shores, Arizona is a small town located in the western part of the state, near the border of California. It is situated in the Colorado River Valley, and is surrounded by the Sonoran Desert. The town has a population of just over 1,000 people, and is known for its small-town charm and laid-back atmosphere.
History
The area that is now Golden Shores was first settled by the Yavapai people, who lived in the area for centuries before the arrival of Europeans. The first Europeans to arrive in the area were Spanish explorers, who arrived in the late 1700s. The area was later claimed by Mexico, and then by the United States after the Mexican-American War.
In the late 1800s, the area was settled by ranchers and farmers, who established small towns and settlements. The town of Golden Shores was founded in the early 1900s, and was named after the nearby Colorado River. The town quickly grew, and by the 1920s it had become a popular tourist destination.
Geography
Golden Shores is located in the western part of Arizona, near the border of California. It is situated in the Colorado River Valley, and is surrounded by the Sonoran Desert. The town is located at an elevation of 1,400 feet, and has a semi-arid climate with hot summers and mild winters.
The town is located near several national parks and monuments, including the Grand Canyon, Saguaro National Park, and the Petrified Forest National Park. The town is also located near several lakes, including Lake Havasu and Lake Mead.
Economy
The economy of Golden Shores is largely based on tourism. The town is a popular destination for visitors from all over the world, and is known for its small-town charm and laid-back atmosphere. The town is also home to several businesses, including restaurants, hotels, and retail stores.
The town is also home to several manufacturing companies, including a furniture factory and a plastics factory. The town is also home to several agricultural operations, including cattle ranches and farms.
Demographics
As of the 2010 census, the population of Golden Shores was 1,072. The town is predominantly white, with a population that is 94.3% white, 2.2% Hispanic, 1.2% Native American, and 0.7% Asian. The median household income in the town is $41,250, and the median home value is $127,000.
Conclusion
Golden Shores, Arizona is a small town located in the western part of the state, near the border of California. It is situated in the Colorado River Valley, and is surrounded by the Sonoran Desert. The town has a population of just over 1,000 people, and is known for its small-town charm and laid-back atmosphere. The economy of Golden Shores is largely based on tourism, and the town is home to several businesses, manufacturing companies, and agricultural operations. The population of Golden Shores is predominantly white, with a median household income of $41,250 and a median home value of $127,000.
Common Questions
What is Per Capita Income in Golden Shores?
Per Capita income in Golden Shores is $36,993.
What is Inequality or Gini Index in Golden Shores?
Inequality or Gini Index in Golden Shores is 0.32.
What is the Total Population of Golden Shores?
Total Population of Golden Shores is 772.
What is the Total Male Population of Golden Shores?
Total Male Population of Golden Shores is 486.
What is the Total Female Population of Golden Shores?
Total Female Population of Golden Shores is 286.
What is the Ratio of Males per 100 Females in Golden Shores?
There are 169.93 Males per 100 Females in Golden Shores.
What is the Ratio of Females per 100 Males in Golden Shores?
There are 58.85 Females per 100 Males in Golden Shores.
What is the Median Population Age in Golden Shores?
Median Population Age in Golden Shores is 71.0 Years.
What is the Average Family Size in Golden Shores
Average Family Size in Golden Shores is 1.7 People.
What is the Average Household Size in Golden Shores
Average Household Size in Golden Shores is 1.3 People.
How Large is the Labor Force in Golden Shores?
There are 188 People in the Labor Forcein in Golden Shores.
What is the Percentage of People in the Labor Force in Golden Shores?
24.4% of People are in the Labor Force in Golden Shores.