Fort Thomas, AZ Map & Demographics
Fort Thomas Map
Fort Thomas Overview
$32,641
PER CAPITA INCOME
$100,000
AVG FAMILY INCOME
$68,295
AVG HOUSEHOLD INCOME
0.27
INEQUALITY / GINI INDEX
340
TOTAL POPULATION
179
MALE POPULATION
161
FEMALE POPULATION
111.18
MALES / 100 FEMALES
89.94
FEMALES / 100 MALES
42.2
MEDIAN AGE
2.7
AVG FAMILY SIZE
2.3
AVG HOUSEHOLD SIZE
121
LABOR FORCE [ PEOPLE ]
46.9%
PERCENT IN LABOR FORCE
2.5%
UNEMPLOYMENT RATE
Fort Thomas Zip Codes
Fort Thomas Area Codes
Income in Fort Thomas
Income Overview in Fort Thomas
Per Capita Income in Fort Thomas is $32,641, while median incomes of families and households are $100,000 and $68,295 respectively.
| Characteristic | Number | Measure |
| Per Capita Income | 340 | $32,641 |
| Median Family Income | 90 | $100,000 |
| Mean Family Income | 90 | $85,573 |
| Median Household Income | 146 | $68,295 |
| Mean Household Income | 146 | $78,277 |
| Income Deficit | 90 | $0 |
| Wage / Income Gap (%) | 340 | 0.00% |
| Wage / Income Gap ($) | 340 | 100.00¢ per $1 |
| Gini / Inequality Index | 340 | 0.27 |
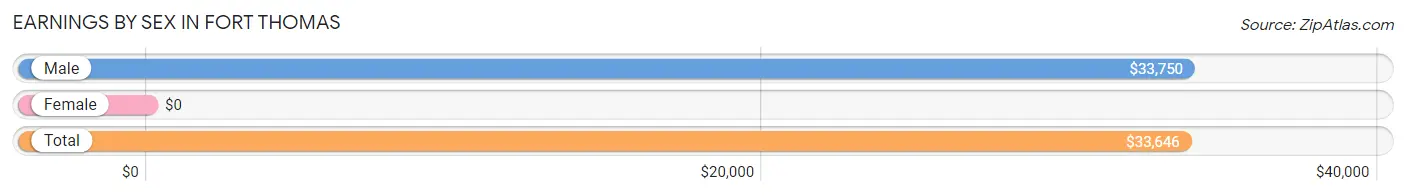
Earnings by Sex in Fort Thomas
| Sex | Number | Average Earnings |
| Male | 86 (54.8%) | $33,750 |
| Female | 71 (45.2%) | $0 |
| Total | 157 (100.0%) | $33,646 |
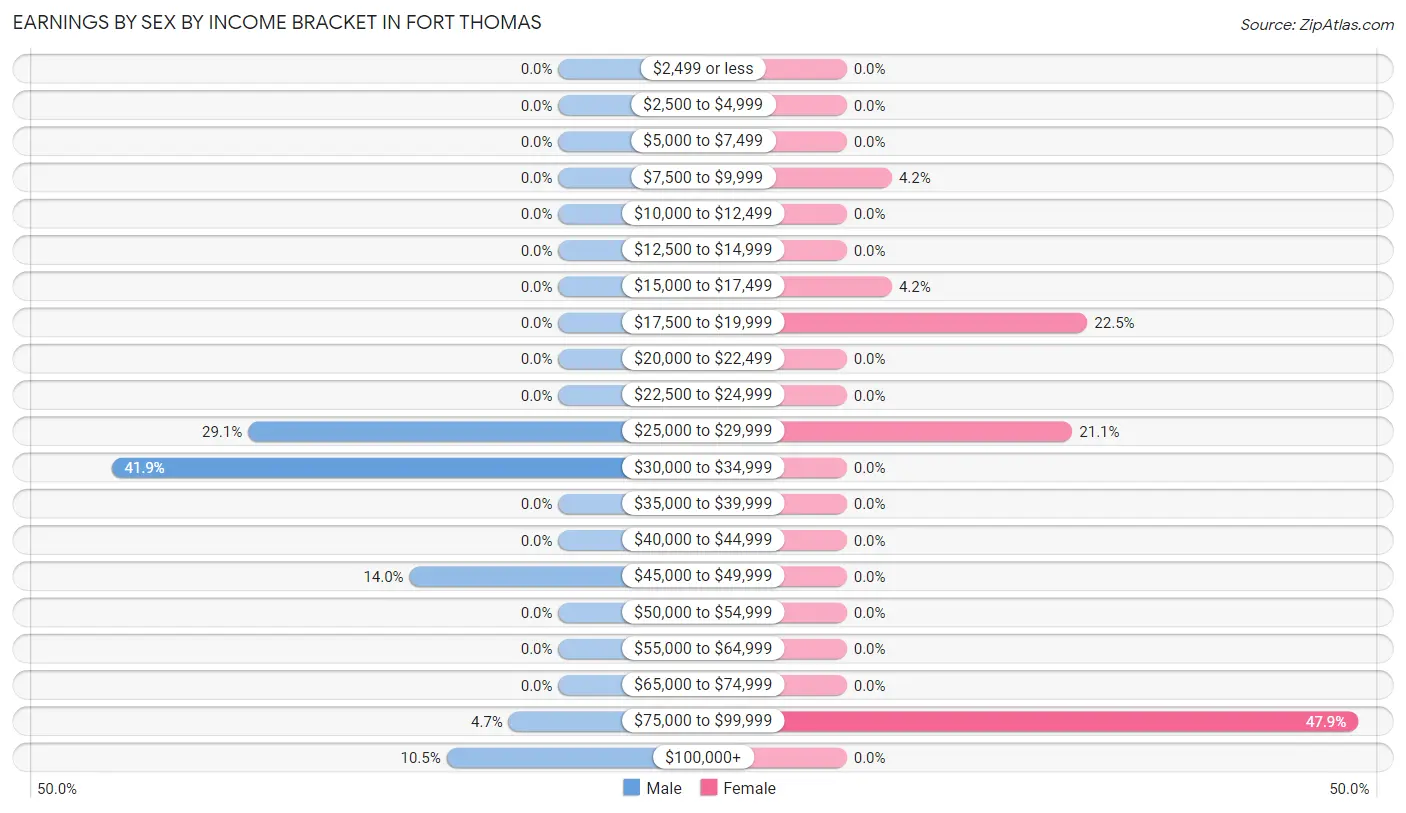
Earnings by Sex by Income Bracket in Fort Thomas
The most common earnings brackets in Fort Thomas are $30,000 to $34,999 for men (36 | 41.9%) and $75,000 to $99,999 for women (34 | 47.9%).
| Income | Male | Female |
| $2,499 or less | 0 (0.0%) | 0 (0.0%) |
| $2,500 to $4,999 | 0 (0.0%) | 0 (0.0%) |
| $5,000 to $7,499 | 0 (0.0%) | 0 (0.0%) |
| $7,500 to $9,999 | 0 (0.0%) | 3 (4.2%) |
| $10,000 to $12,499 | 0 (0.0%) | 0 (0.0%) |
| $12,500 to $14,999 | 0 (0.0%) | 0 (0.0%) |
| $15,000 to $17,499 | 0 (0.0%) | 3 (4.2%) |
| $17,500 to $19,999 | 0 (0.0%) | 16 (22.5%) |
| $20,000 to $22,499 | 0 (0.0%) | 0 (0.0%) |
| $22,500 to $24,999 | 0 (0.0%) | 0 (0.0%) |
| $25,000 to $29,999 | 25 (29.1%) | 15 (21.1%) |
| $30,000 to $34,999 | 36 (41.9%) | 0 (0.0%) |
| $35,000 to $39,999 | 0 (0.0%) | 0 (0.0%) |
| $40,000 to $44,999 | 0 (0.0%) | 0 (0.0%) |
| $45,000 to $49,999 | 12 (14.0%) | 0 (0.0%) |
| $50,000 to $54,999 | 0 (0.0%) | 0 (0.0%) |
| $55,000 to $64,999 | 0 (0.0%) | 0 (0.0%) |
| $65,000 to $74,999 | 0 (0.0%) | 0 (0.0%) |
| $75,000 to $99,999 | 4 (4.6%) | 34 (47.9%) |
| $100,000+ | 9 (10.5%) | 0 (0.0%) |
| Total | 86 (100.0%) | 71 (100.0%) |
Earnings by Sex by Educational Attainment in Fort Thomas
| Educational Attainment | Male Income | Female Income |
| Less than High School | - | - |
| High School Diploma | - | - |
| College or Associate's Degree | - | - |
| Bachelor's Degree | - | - |
| Graduate Degree | - | - |
| Total | $33,750 | $0 |
Family Income in Fort Thomas
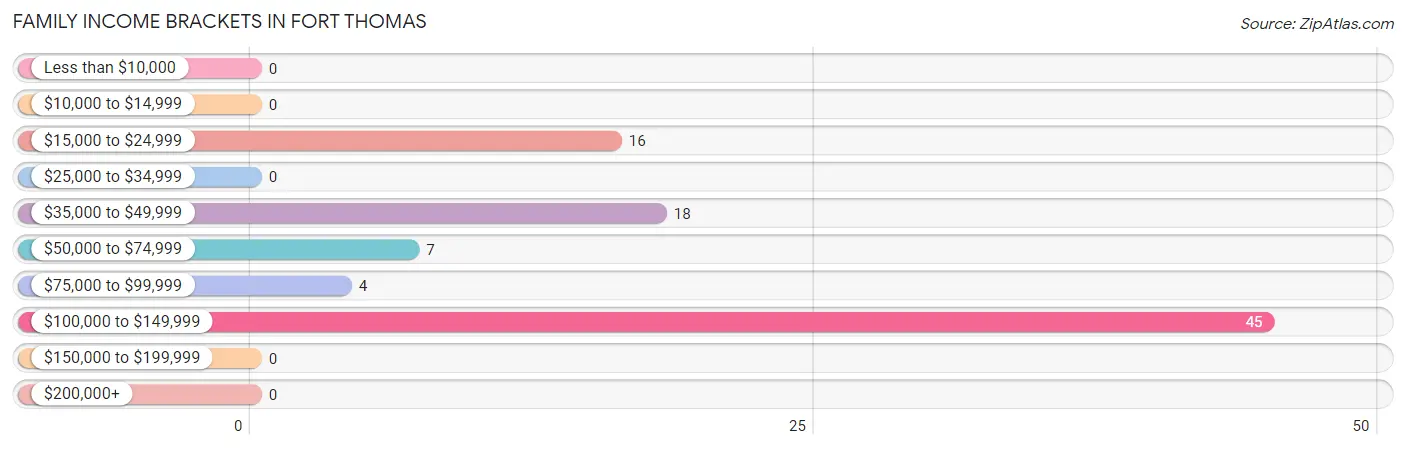
Family Income Brackets in Fort Thomas
According to the Fort Thomas family income data, there are 45 families falling into the $100,000 to $149,999 income range, which is the most common income bracket and makes up 50.0% of all families.
| Income Bracket | # Families | % Families |
| Less than $10,000 | 0 | 0.0% |
| $10,000 to $14,999 | 0 | 0.0% |
| $15,000 to $24,999 | 16 | 17.8% |
| $25,000 to $34,999 | 0 | 0.0% |
| $35,000 to $49,999 | 18 | 20.0% |
| $50,000 to $74,999 | 7 | 7.8% |
| $75,000 to $99,999 | 4 | 4.4% |
| $100,000 to $149,999 | 45 | 50.0% |
| $150,000 to $199,999 | 0 | 0.0% |
| $200,000+ | 0 | 0.0% |
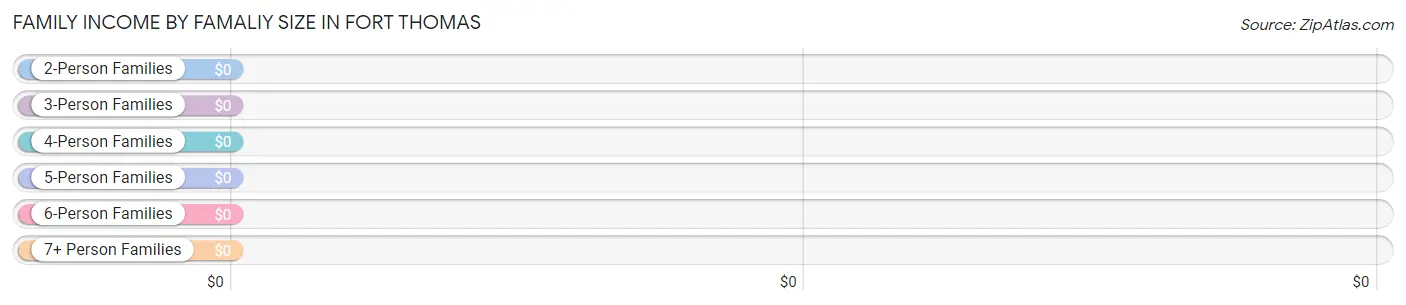
Family Income by Famaliy Size in Fort Thomas
| Income Bracket | # Families | Median Income |
| 2-Person Families | 32 (35.6%) | $0 |
| 3-Person Families | 11 (12.2%) | $0 |
| 4-Person Families | 36 (40.0%) | $0 |
| 5-Person Families | 11 (12.2%) | $0 |
| 6-Person Families | 0 (0.0%) | $0 |
| 7+ Person Families | 0 (0.0%) | $0 |
| Total | 90 (100.0%) | $100,000 |
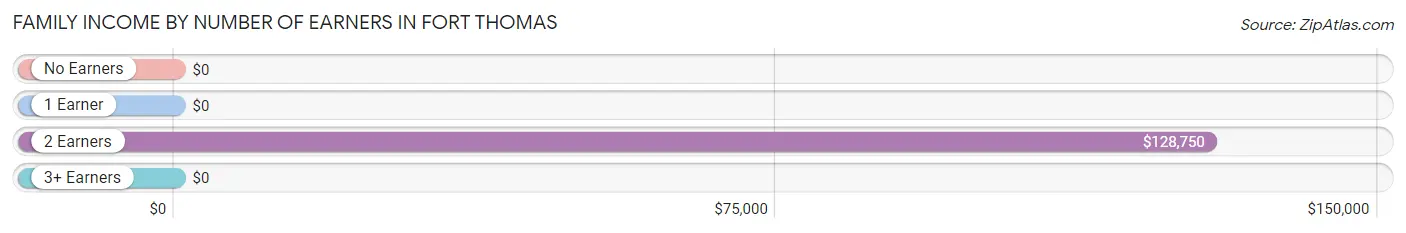
Family Income by Number of Earners in Fort Thomas
| Number of Earners | # Families | Median Income |
| No Earners | 14 (15.6%) | $0 |
| 1 Earner | 32 (35.6%) | $0 |
| 2 Earners | 44 (48.9%) | $128,750 |
| 3+ Earners | 0 (0.0%) | $0 |
| Total | 90 (100.0%) | $100,000 |
Household Income in Fort Thomas
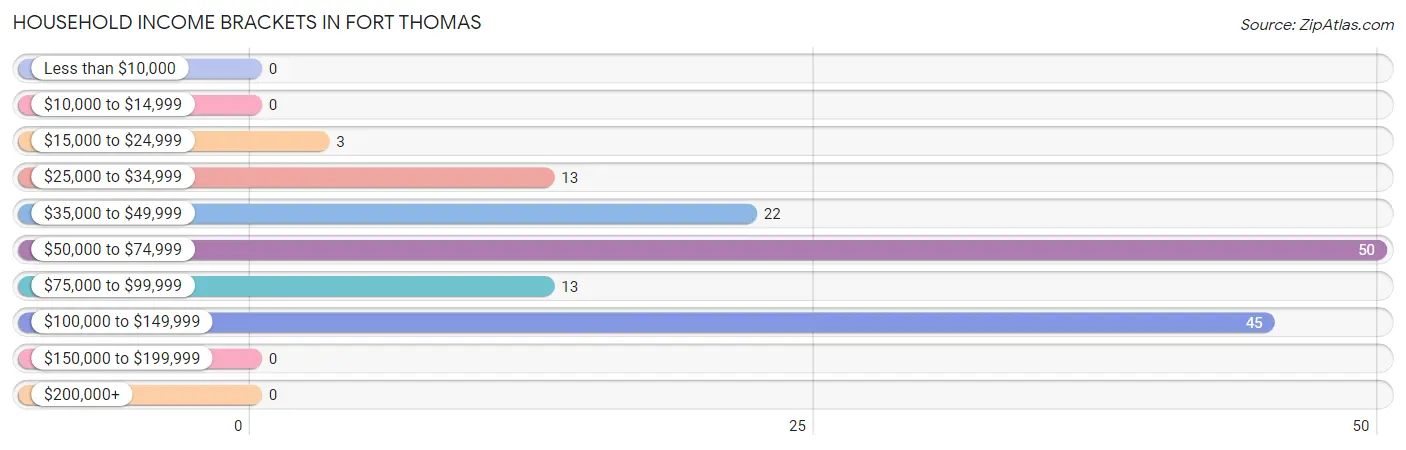
Household Income Brackets in Fort Thomas
With 50 households falling in the category, the $50,000 to $74,999 income range is the most frequent in Fort Thomas, accounting for 34.3% of all households.
| Income Bracket | # Households | % Households |
| Less than $10,000 | 0 | 0.0% |
| $10,000 to $14,999 | 0 | 0.0% |
| $15,000 to $24,999 | 3 | 2.1% |
| $25,000 to $34,999 | 13 | 8.9% |
| $35,000 to $49,999 | 22 | 15.1% |
| $50,000 to $74,999 | 50 | 34.2% |
| $75,000 to $99,999 | 13 | 8.9% |
| $100,000 to $149,999 | 45 | 30.8% |
| $150,000 to $199,999 | 0 | 0.0% |
| $200,000+ | 0 | 0.0% |
Household Income by Householder Age in Fort Thomas
The median household income in Fort Thomas is $68,295, with the highest median household income of $68,167 found in the 45 to 64 years age bracket for the primary householder. A total of 40 households (27.4%) fall into this category.
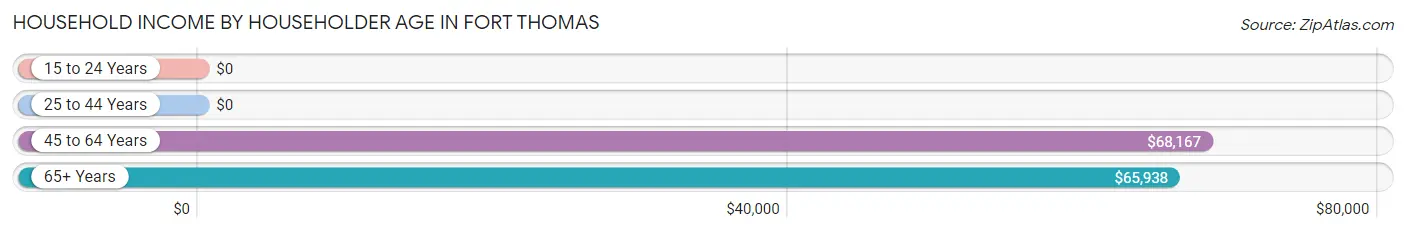
| Income Bracket | # Households | Median Income |
| 15 to 24 Years | 0 (0.0%) | $0 |
| 25 to 44 Years | 64 (43.8%) | $0 |
| 45 to 64 Years | 40 (27.4%) | $68,167 |
| 65+ Years | 42 (28.8%) | $65,938 |
| Total | 146 (100.0%) | $68,295 |
Poverty in Fort Thomas
Income Below Poverty by Sex and Age in Fort Thomas
With 2.2% poverty level for males and 6.8% for females among the residents of Fort Thomas, 55 to 64 year old males and 65 to 74 year old females are the most vulnerable to poverty, with 4 males (30.8%) and 11 females (61.1%) in their respective age groups living below the poverty level.
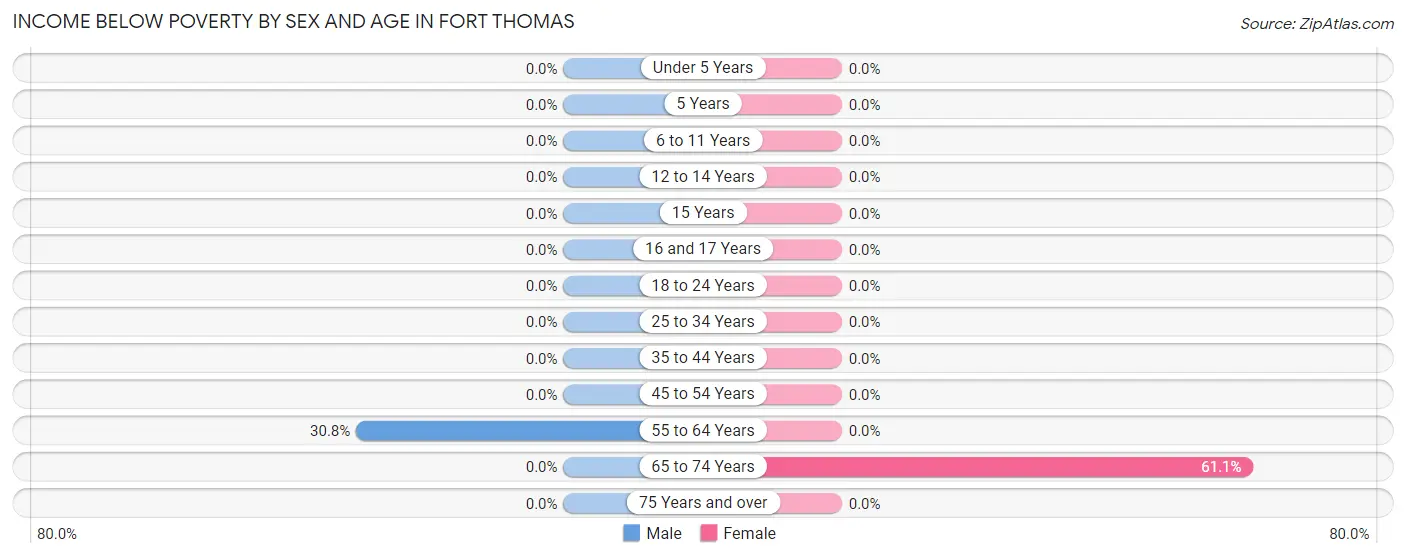
| Age Bracket | Male | Female |
| Under 5 Years | 0 (0.0%) | 0 (0.0%) |
| 5 Years | 0 (0.0%) | 0 (0.0%) |
| 6 to 11 Years | 0 (0.0%) | 0 (0.0%) |
| 12 to 14 Years | 0 (0.0%) | 0 (0.0%) |
| 15 Years | 0 (0.0%) | 0 (0.0%) |
| 16 and 17 Years | 0 (0.0%) | 0 (0.0%) |
| 18 to 24 Years | 0 (0.0%) | 0 (0.0%) |
| 25 to 34 Years | 0 (0.0%) | 0 (0.0%) |
| 35 to 44 Years | 0 (0.0%) | 0 (0.0%) |
| 45 to 54 Years | 0 (0.0%) | 0 (0.0%) |
| 55 to 64 Years | 4 (30.8%) | 0 (0.0%) |
| 65 to 74 Years | 0 (0.0%) | 11 (61.1%) |
| 75 Years and over | 0 (0.0%) | 0 (0.0%) |
| Total | 4 (2.2%) | 11 (6.8%) |
Income Above Poverty by Sex and Age in Fort Thomas
According to the poverty statistics in Fort Thomas, males aged 5 years and females aged 6 to 11 years are the age groups that are most secure financially, with 100.0% of males and 100.0% of females in these age groups living above the poverty line.
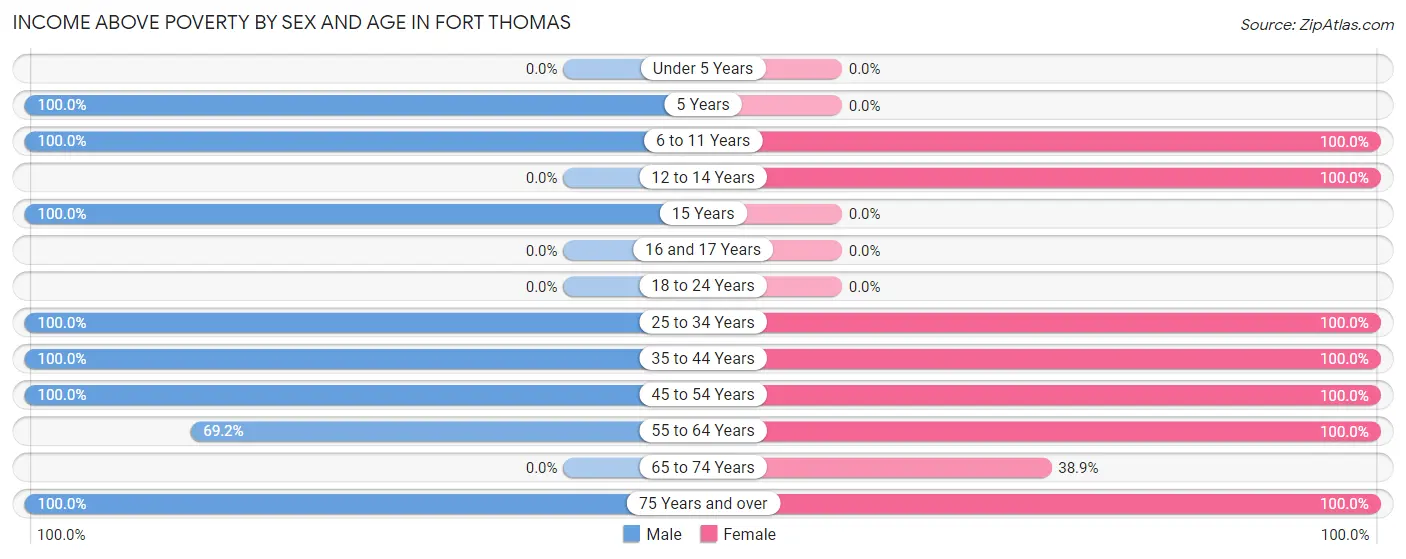
| Age Bracket | Male | Female |
| Under 5 Years | 0 (0.0%) | 0 (0.0%) |
| 5 Years | 11 (100.0%) | 0 (0.0%) |
| 6 to 11 Years | 31 (100.0%) | 26 (100.0%) |
| 12 to 14 Years | 0 (0.0%) | 9 (100.0%) |
| 15 Years | 5 (100.0%) | 0 (0.0%) |
| 16 and 17 Years | 0 (0.0%) | 0 (0.0%) |
| 18 to 24 Years | 0 (0.0%) | 0 (0.0%) |
| 25 to 34 Years | 13 (100.0%) | 3 (100.0%) |
| 35 to 44 Years | 52 (100.0%) | 56 (100.0%) |
| 45 to 54 Years | 16 (100.0%) | 16 (100.0%) |
| 55 to 64 Years | 9 (69.2%) | 18 (100.0%) |
| 65 to 74 Years | 0 (0.0%) | 7 (38.9%) |
| 75 Years and over | 38 (100.0%) | 15 (100.0%) |
| Total | 175 (97.8%) | 150 (93.2%) |
Income Below Poverty Among Married-Couple Families in Fort Thomas
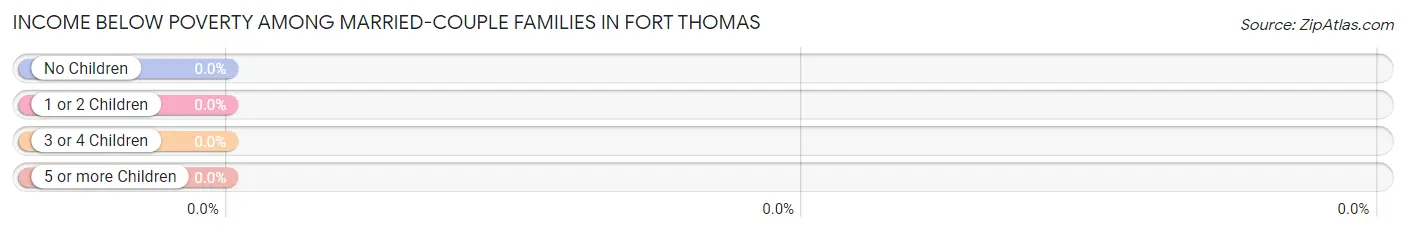
| Children | Above Poverty | Below Poverty |
| No Children | 16 (100.0%) | 0 (0.0%) |
| 1 or 2 Children | 40 (100.0%) | 0 (0.0%) |
| 3 or 4 Children | 11 (100.0%) | 0 (0.0%) |
| 5 or more Children | 0 (0.0%) | 0 (0.0%) |
| Total | 67 (100.0%) | 0 (0.0%) |
Income Below Poverty Among Single-Parent Households in Fort Thomas
| Children | Single Father | Single Mother |
| No Children | 0 (0.0%) | 0 (0.0%) |
| 1 or 2 Children | 0 (0.0%) | 0 (0.0%) |
| 3 or 4 Children | 0 (0.0%) | 0 (0.0%) |
| 5 or more Children | 0 (0.0%) | 0 (0.0%) |
| Total | 0 (0.0%) | 0 (0.0%) |
Income Below Poverty Among Married-Couple vs Single-Parent Households in Fort Thomas
| Children | Married-Couple Families | Single-Parent Households |
| No Children | 0 (0.0%) | 0 (0.0%) |
| 1 or 2 Children | 0 (0.0%) | 0 (0.0%) |
| 3 or 4 Children | 0 (0.0%) | 0 (0.0%) |
| 5 or more Children | 0 (0.0%) | 0 (0.0%) |
| Total | 0 (0.0%) | 0 (0.0%) |
Race in Fort Thomas
The most populous races in Fort Thomas are White / Caucasian (340 | 100.0%), and Hispanic or Latino (4 | 1.2%).
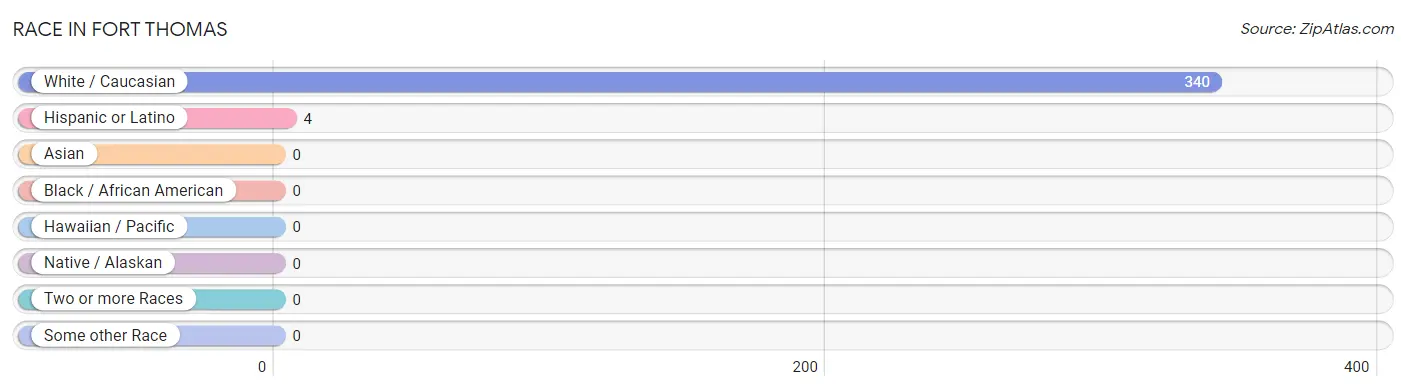
| Race | # Population | % Population |
| Asian | 0 | 0.0% |
| Black / African American | 0 | 0.0% |
| Hawaiian / Pacific | 0 | 0.0% |
| Hispanic or Latino | 4 | 1.2% |
| Native / Alaskan | 0 | 0.0% |
| White / Caucasian | 340 | 100.0% |
| Two or more Races | 0 | 0.0% |
| Some other Race | 0 | 0.0% |
| Total | 340 | 100.0% |
Ancestry in Fort Thomas
The most populous ancestries reported in Fort Thomas are German (89 | 26.2%), English (29 | 8.5%), American (12 | 3.5%), British (8 | 2.4%), and Welsh (8 | 2.4%), together accounting for 42.9% of all Fort Thomas residents.
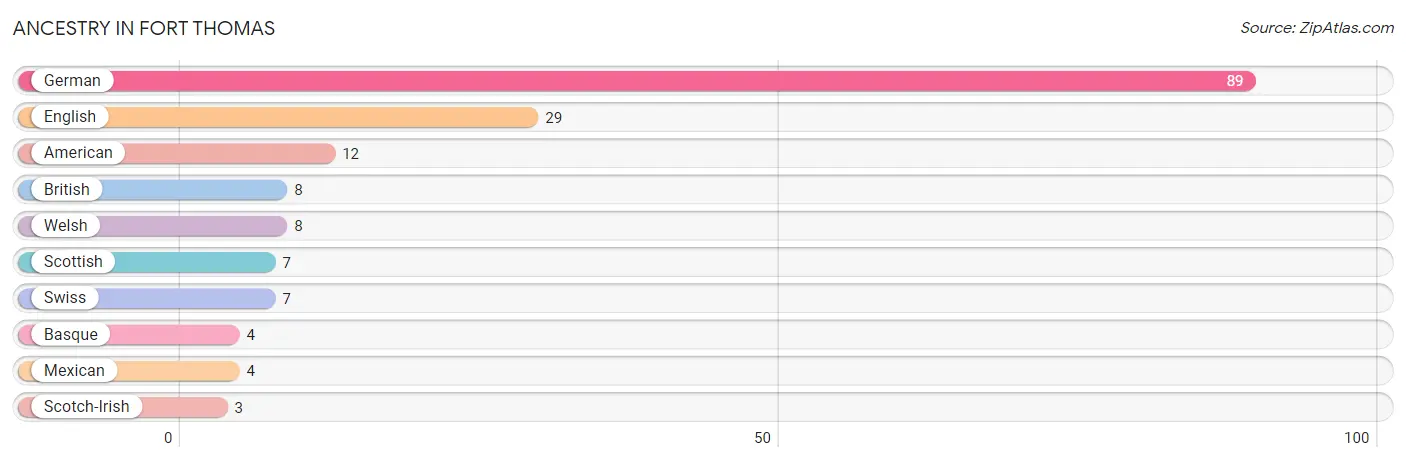
| Ancestry | # Population | % Population |
| American | 12 | 3.5% |
| Basque | 4 | 1.2% |
| British | 8 | 2.4% |
| English | 29 | 8.5% |
| German | 89 | 26.2% |
| Mexican | 4 | 1.2% |
| Scotch-Irish | 3 | 0.9% |
| Scottish | 7 | 2.1% |
| Swiss | 7 | 2.1% |
| Welsh | 8 | 2.4% | View All 10 Rows |
Immigrants in Fort Thomas

| Immigration Origin | # Population | % Population | View All 0 Rows |
Sex and Age in Fort Thomas
Sex and Age in Fort Thomas
The most populous age groups in Fort Thomas are 40 to 44 Years (36 | 20.1%) for men and 35 to 39 Years (48 | 29.8%) for women.
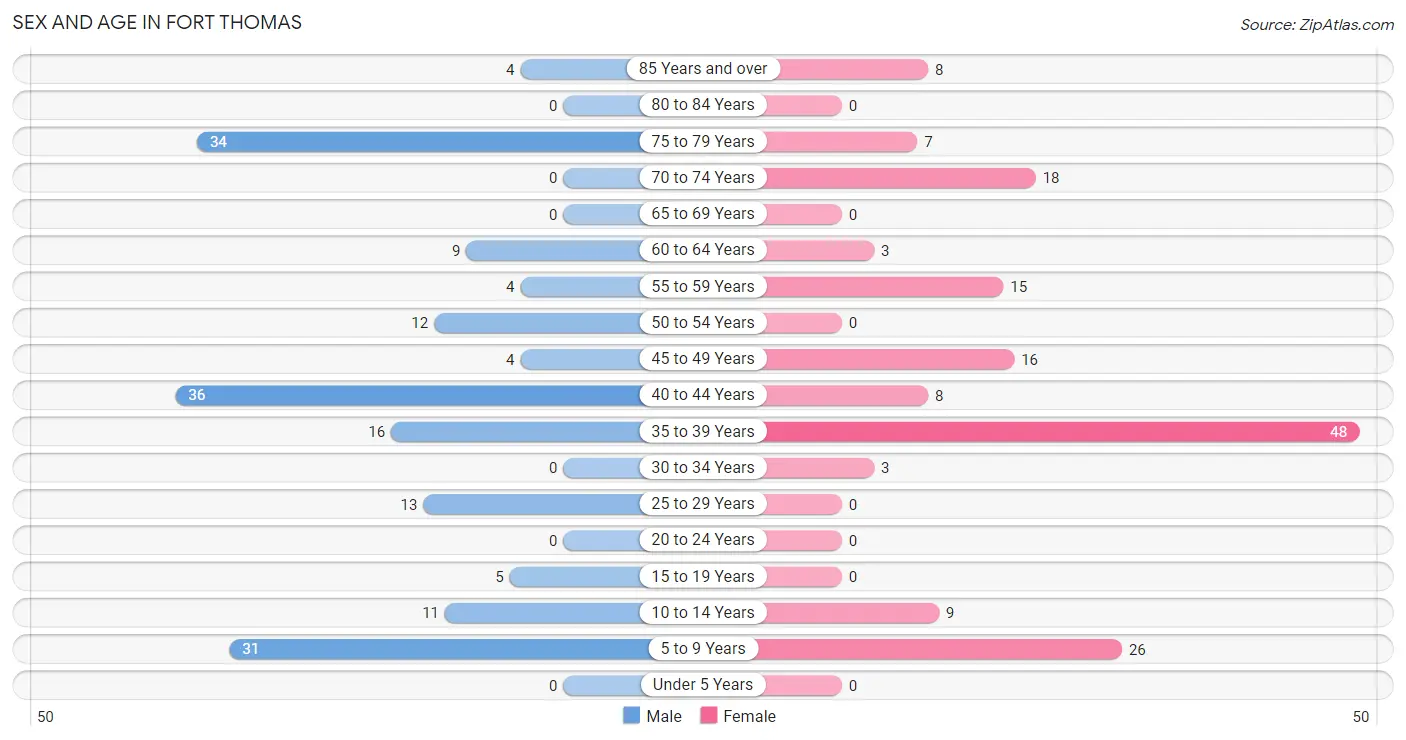
| Age Bracket | Male | Female |
| Under 5 Years | 0 (0.0%) | 0 (0.0%) |
| 5 to 9 Years | 31 (17.3%) | 26 (16.2%) |
| 10 to 14 Years | 11 (6.1%) | 9 (5.6%) |
| 15 to 19 Years | 5 (2.8%) | 0 (0.0%) |
| 20 to 24 Years | 0 (0.0%) | 0 (0.0%) |
| 25 to 29 Years | 13 (7.3%) | 0 (0.0%) |
| 30 to 34 Years | 0 (0.0%) | 3 (1.9%) |
| 35 to 39 Years | 16 (8.9%) | 48 (29.8%) |
| 40 to 44 Years | 36 (20.1%) | 8 (5.0%) |
| 45 to 49 Years | 4 (2.2%) | 16 (9.9%) |
| 50 to 54 Years | 12 (6.7%) | 0 (0.0%) |
| 55 to 59 Years | 4 (2.2%) | 15 (9.3%) |
| 60 to 64 Years | 9 (5.0%) | 3 (1.9%) |
| 65 to 69 Years | 0 (0.0%) | 0 (0.0%) |
| 70 to 74 Years | 0 (0.0%) | 18 (11.2%) |
| 75 to 79 Years | 34 (19.0%) | 7 (4.3%) |
| 80 to 84 Years | 0 (0.0%) | 0 (0.0%) |
| 85 Years and over | 4 (2.2%) | 8 (5.0%) |
| Total | 179 (100.0%) | 161 (100.0%) |
Families and Households in Fort Thomas
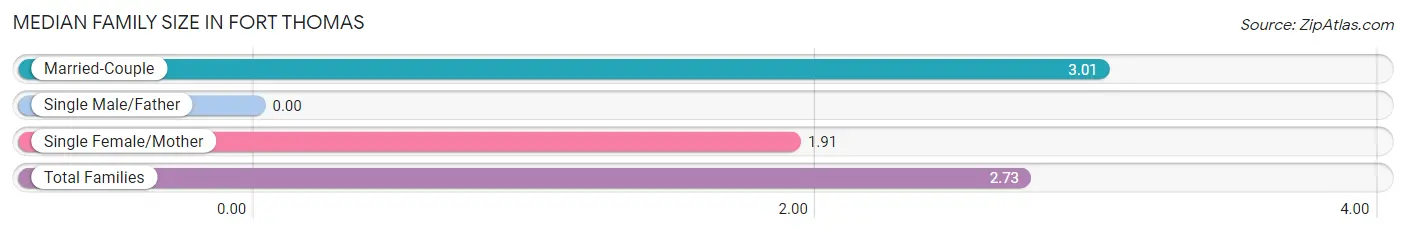
Median Family Size in Fort Thomas
| Family Type | # Families | Family Size |
| Married-Couple | 67 (74.4%) | 3.01 |
| Single Male/Father | 0 (0.0%) | - |
| Single Female/Mother | 23 (25.6%) | 1.91 |
| Total Families | 90 (100.0%) | 2.73 |
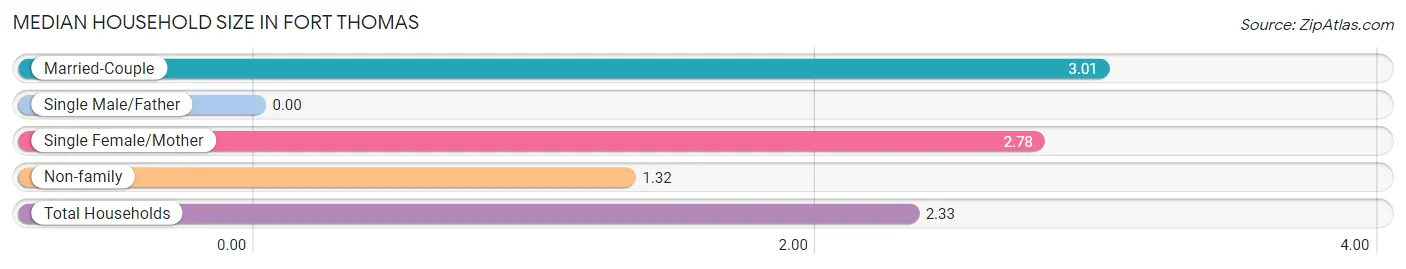
Median Household Size in Fort Thomas
| Household Type | # Households | Household Size |
| Married-Couple | 67 (45.9%) | 3.01 |
| Single Male/Father | 0 (0.0%) | - |
| Single Female/Mother | 23 (15.8%) | 2.78 |
| Non-family | 56 (38.4%) | 1.32 |
| Total Households | 146 (100.0%) | 2.33 |
Household Size by Marriage Status in Fort Thomas
Out of a total of 146 households in Fort Thomas, 90 (61.6%) are family households, while 56 (38.4%) are nonfamily households. The most numerous type of family households are 4-person households, comprising 52, and the most common type of nonfamily households are 1-person households, comprising 38.
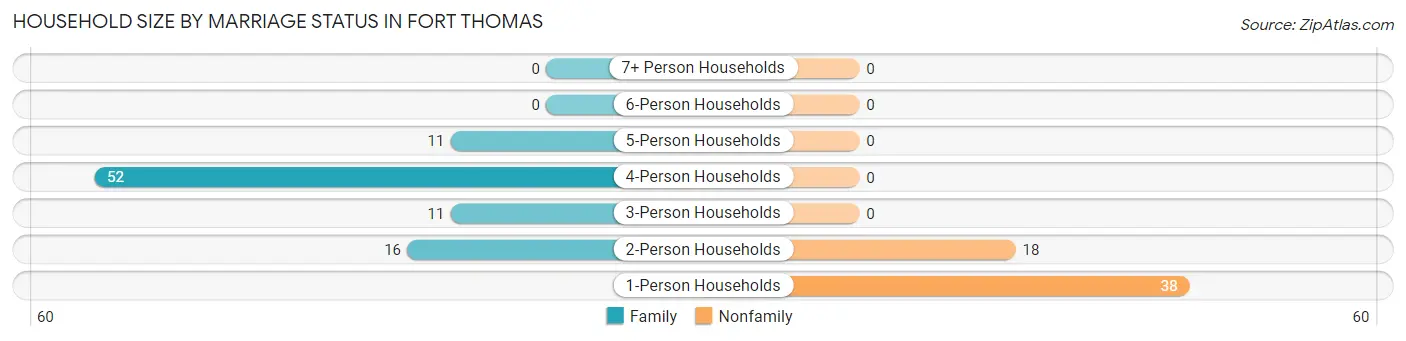
| Household Size | Family Households | Nonfamily Households |
| 1-Person Households | - | 38 (26.0%) |
| 2-Person Households | 16 (11.0%) | 18 (12.3%) |
| 3-Person Households | 11 (7.5%) | 0 (0.0%) |
| 4-Person Households | 52 (35.6%) | 0 (0.0%) |
| 5-Person Households | 11 (7.5%) | 0 (0.0%) |
| 6-Person Households | 0 (0.0%) | 0 (0.0%) |
| 7+ Person Households | 0 (0.0%) | 0 (0.0%) |
| Total | 90 (61.6%) | 56 (38.4%) |
Female Fertility in Fort Thomas
Fertility by Age in Fort Thomas
| Age Bracket | Women with Births | Births / 1,000 Women |
| 15 to 19 years | 0 (0.0%) | 0.0 |
| 20 to 34 years | 0 (0.0%) | 0.0 |
| 35 to 50 years | 0 (0.0%) | 0.0 |
| Total | 0 (0.0%) | 0.0 |
Fertility by Age by Marriage Status in Fort Thomas
| Age Bracket | Married | Unmarried |
| 15 to 19 years | 0 (0.0%) | 0 (0.0%) |
| 20 to 34 years | 0 (0.0%) | 0 (0.0%) |
| 35 to 50 years | 0 (0.0%) | 0 (0.0%) |
| Total | 0 (0.0%) | 0 (0.0%) |
Fertility by Education in Fort Thomas
| Educational Attainment | Women with Births | Births / 1,000 Women |
| Less than High School | 0 (0.0%) | 0.0 |
| High School Diploma | 0 (0.0%) | 0.0 |
| College or Associate's Degree | 0 (0.0%) | 0.0 |
| Bachelor's Degree | 0 (0.0%) | 0.0 |
| Graduate Degree | 0 (0.0%) | 0.0 |
| Total | 0 (0.0%) | 0.0 |
Fertility by Education by Marriage Status in Fort Thomas
| Educational Attainment | Married | Unmarried |
| Less than High School | 0 (0.0%) | 0 (0.0%) |
| High School Diploma | 0 (0.0%) | 0 (0.0%) |
| College or Associate's Degree | 0 (0.0%) | 0 (0.0%) |
| Bachelor's Degree | 0 (0.0%) | 0 (0.0%) |
| Graduate Degree | 0 (0.0%) | 0 (0.0%) |
| Total | 0 (0.0%) | 0 (0.0%) |
Employment Characteristics in Fort Thomas
Employment by Class of Employer in Fort Thomas
Among the 118 employed individuals in Fort Thomas, private company employees (66 | 55.9%), unpaid family workers (28 | 23.7%), and not-for-profit organizations (12 | 10.2%) make up the most common classes of employment.
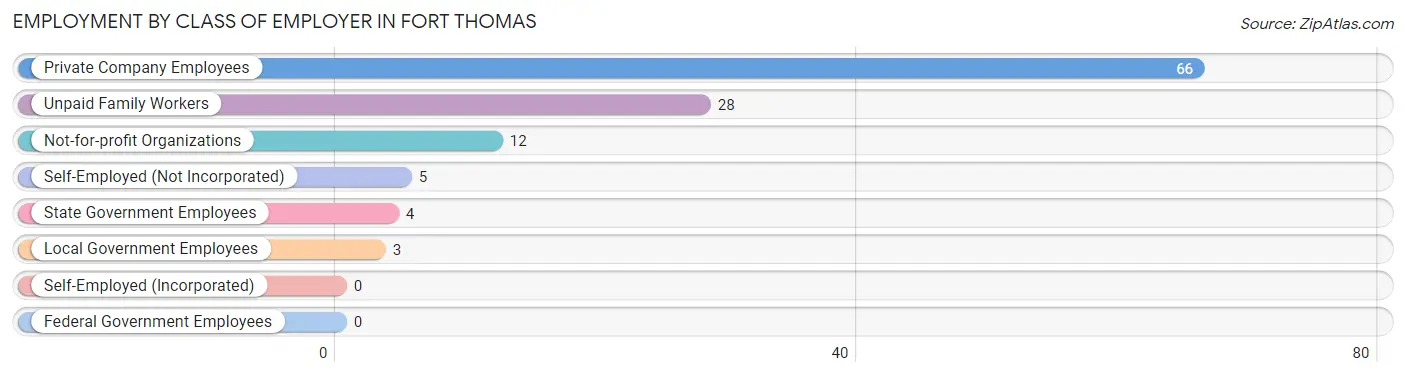
| Employer Class | # Employees | % Employees |
| Private Company Employees | 66 | 55.9% |
| Self-Employed (Incorporated) | 0 | 0.0% |
| Self-Employed (Not Incorporated) | 5 | 4.2% |
| Not-for-profit Organizations | 12 | 10.2% |
| Local Government Employees | 3 | 2.5% |
| State Government Employees | 4 | 3.4% |
| Federal Government Employees | 0 | 0.0% |
| Unpaid Family Workers | 28 | 23.7% |
| Total | 118 | 100.0% |
Employment Status by Age in Fort Thomas
According to the labor force statistics for Fort Thomas, out of the total population over 16 years of age (258), 46.9% or 121 individuals are in the labor force, with 2.5% or 3 of them unemployed. The age group with the highest labor force participation rate is 25 to 29 years, with 100.0% or 13 individuals in the labor force. Within the labor force, the 30 to 34 years age range has the highest percentage of unemployed individuals, with 100.0% or 3 of them being unemployed.
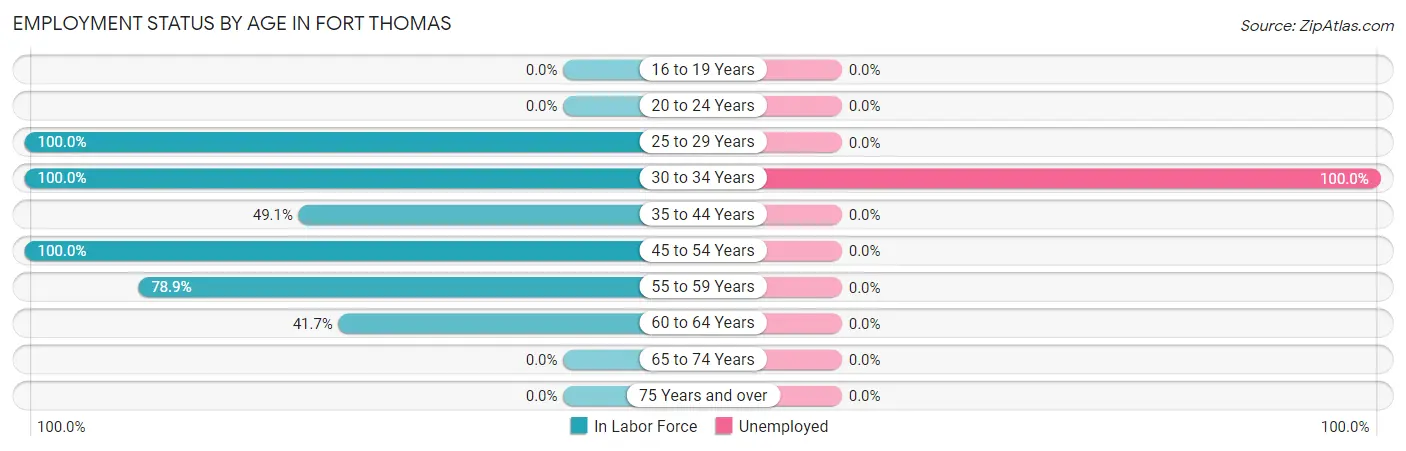
| Age Bracket | In Labor Force | Unemployed |
| 16 to 19 Years | 0 (0.0%) | 0 (0.0%) |
| 20 to 24 Years | 0 (0.0%) | 0 (0.0%) |
| 25 to 29 Years | 13 (100.0%) | 0 (0.0%) |
| 30 to 34 Years | 3 (100.0%) | 3 (100.0%) |
| 35 to 44 Years | 53 (49.1%) | 0 (0.0%) |
| 45 to 54 Years | 32 (100.0%) | 0 (0.0%) |
| 55 to 59 Years | 15 (78.9%) | 0 (0.0%) |
| 60 to 64 Years | 5 (41.7%) | 0 (0.0%) |
| 65 to 74 Years | 0 (0.0%) | 0 (0.0%) |
| 75 Years and over | 0 (0.0%) | 0 (0.0%) |
| Total | 121 (46.9%) | 3 (2.5%) |
Employment Status by Educational Attainment in Fort Thomas
According to labor force statistics for Fort Thomas, 64.7% of individuals (121) out of the total population between 25 and 64 years of age (187) are in the labor force, with 2.5% or 3 of them being unemployed. The group with the highest labor force participation rate are those with the educational attainment of college / associate degree, with 100.0% or 23 individuals in the labor force. Within the labor force, individuals with high school diploma education have the highest percentage of unemployment, with 4.1% or 3 of them being unemployed.
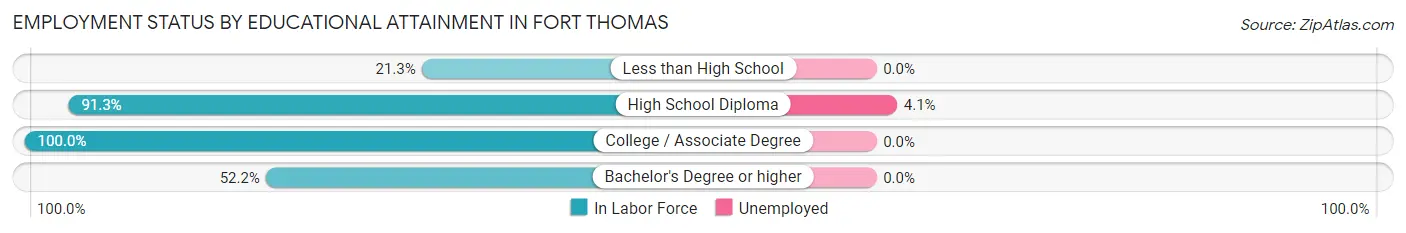
| Educational Attainment | In Labor Force | Unemployed |
| Less than High School | 13 (21.3%) | 0 (0.0%) |
| High School Diploma | 73 (91.3%) | 3 (4.1%) |
| College / Associate Degree | 23 (100.0%) | 0 (0.0%) |
| Bachelor's Degree or higher | 12 (52.2%) | 0 (0.0%) |
| Total | 121 (64.7%) | 5 (2.5%) |
Employment Occupations by Sex in Fort Thomas
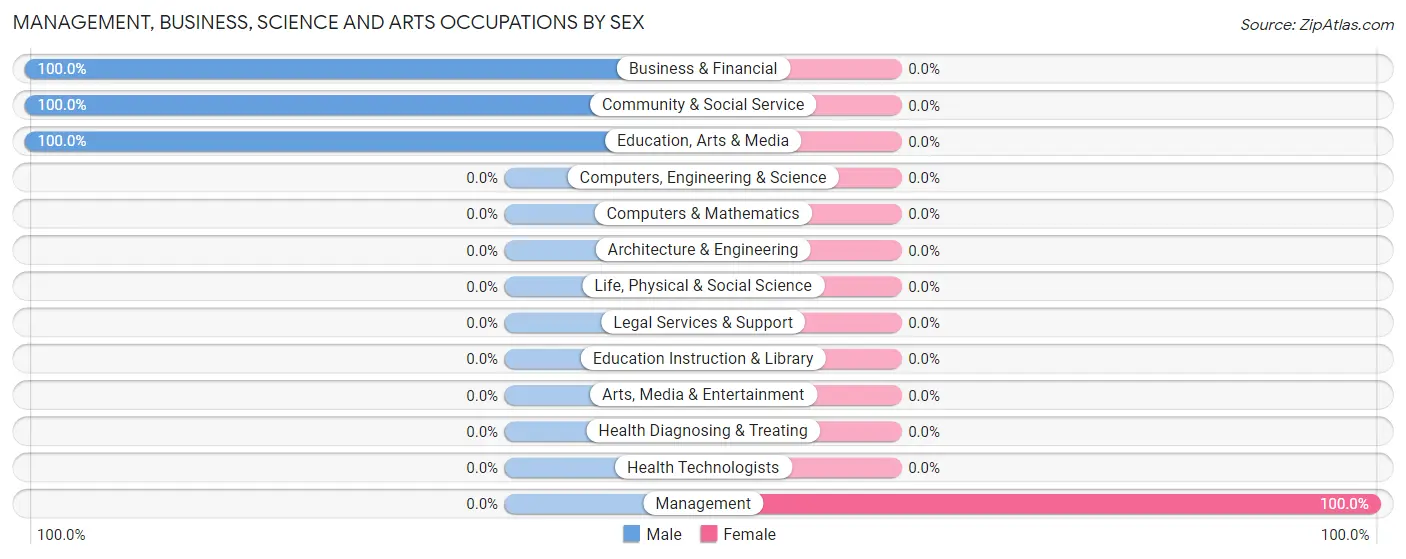
Management, Business, Science and Arts Occupations
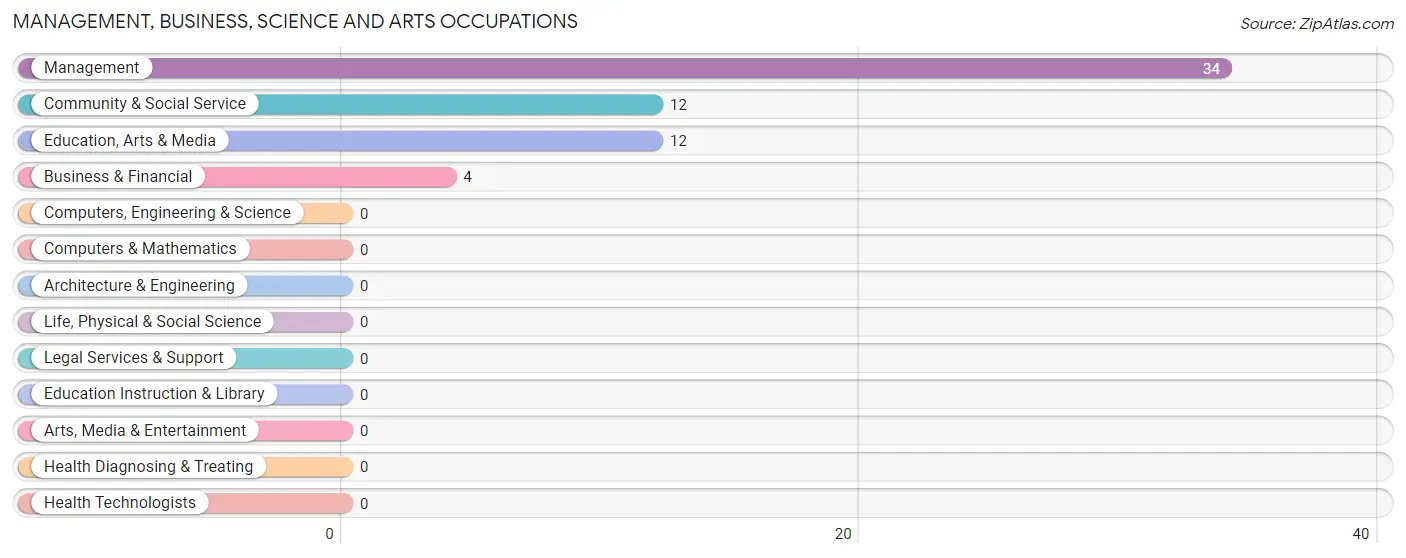
The most common Management, Business, Science and Arts occupations in Fort Thomas are Management (34 | 28.8%), Community & Social Service (12 | 10.2%), Education, Arts & Media (12 | 10.2%), and Business & Financial (4 | 3.4%).
Management, Business, Science and Arts Occupations by Sex
| Occupation | Male | Female |
| Management | 0 (0.0%) | 34 (100.0%) |
| Business & Financial | 4 (100.0%) | 0 (0.0%) |
| Computers, Engineering & Science | 0 (0.0%) | 0 (0.0%) |
| Computers & Mathematics | 0 (0.0%) | 0 (0.0%) |
| Architecture & Engineering | 0 (0.0%) | 0 (0.0%) |
| Life, Physical & Social Science | 0 (0.0%) | 0 (0.0%) |
| Community & Social Service | 12 (100.0%) | 0 (0.0%) |
| Education, Arts & Media | 12 (100.0%) | 0 (0.0%) |
| Legal Services & Support | 0 (0.0%) | 0 (0.0%) |
| Education Instruction & Library | 0 (0.0%) | 0 (0.0%) |
| Arts, Media & Entertainment | 0 (0.0%) | 0 (0.0%) |
| Health Diagnosing & Treating | 0 (0.0%) | 0 (0.0%) |
| Health Technologists | 0 (0.0%) | 0 (0.0%) |
| Total (Category) | 16 (32.0%) | 34 (68.0%) |
| Total (Overall) | 50 (42.4%) | 68 (57.6%) |
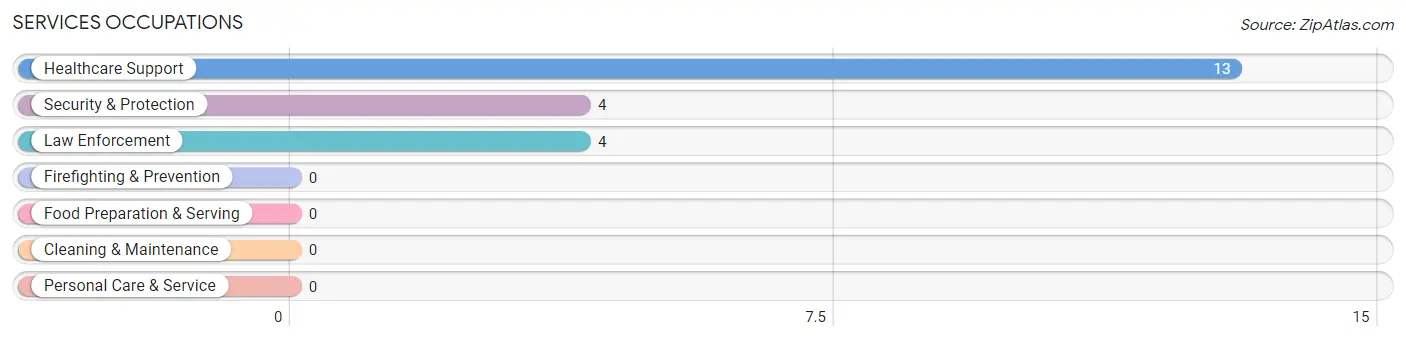
Services Occupations
The most common Services occupations in Fort Thomas are Healthcare Support (13 | 11.0%), Security & Protection (4 | 3.4%), and Law Enforcement (4 | 3.4%).
Services Occupations by Sex
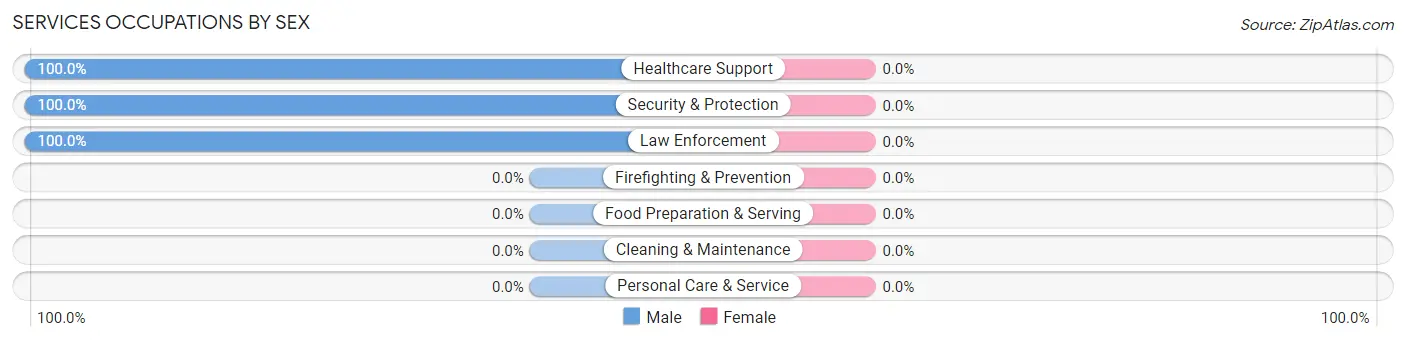
| Occupation | Male | Female |
| Healthcare Support | 13 (100.0%) | 0 (0.0%) |
| Security & Protection | 4 (100.0%) | 0 (0.0%) |
| Firefighting & Prevention | 0 (0.0%) | 0 (0.0%) |
| Law Enforcement | 4 (100.0%) | 0 (0.0%) |
| Food Preparation & Serving | 0 (0.0%) | 0 (0.0%) |
| Cleaning & Maintenance | 0 (0.0%) | 0 (0.0%) |
| Personal Care & Service | 0 (0.0%) | 0 (0.0%) |
| Total (Category) | 17 (100.0%) | 0 (0.0%) |
| Total (Overall) | 50 (42.4%) | 68 (57.6%) |
Sales and Office Occupations
The most common Sales and Office occupations in Fort Thomas are , and Office & Administration (15 | 12.7%).
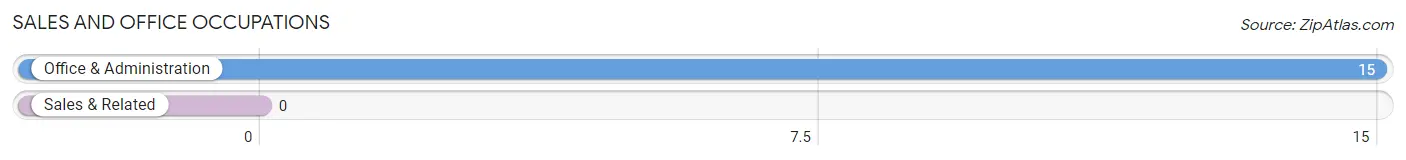
Sales and Office Occupations by Sex
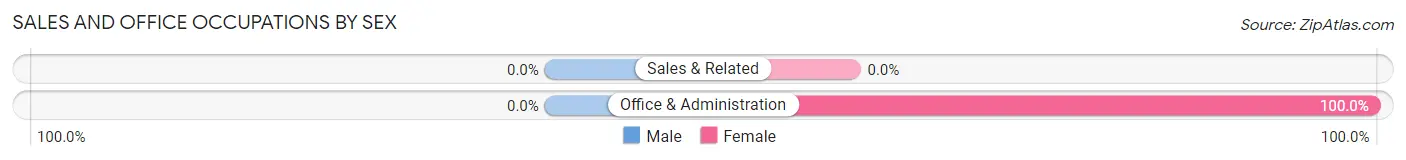
| Occupation | Male | Female |
| Sales & Related | 0 (0.0%) | 0 (0.0%) |
| Office & Administration | 0 (0.0%) | 15 (100.0%) |
| Total (Category) | 0 (0.0%) | 15 (100.0%) |
| Total (Overall) | 50 (42.4%) | 68 (57.6%) |
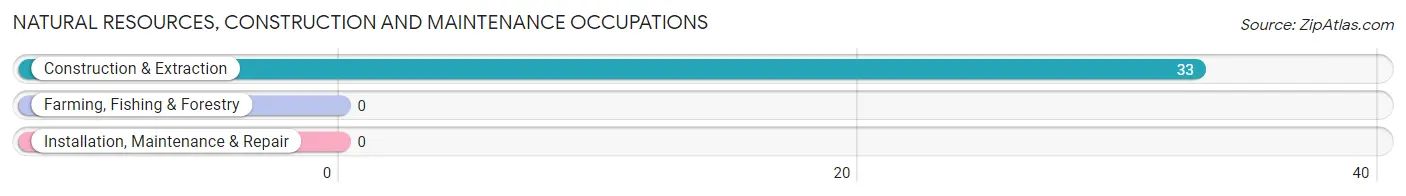
Natural Resources, Construction and Maintenance Occupations
The most common Natural Resources, Construction and Maintenance occupations in Fort Thomas are , and Construction & Extraction (33 | 28.0%).
Natural Resources, Construction and Maintenance Occupations by Sex
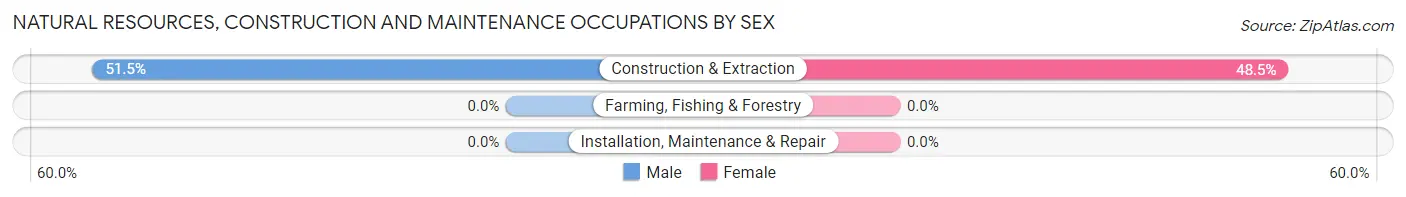
| Occupation | Male | Female |
| Farming, Fishing & Forestry | 0 (0.0%) | 0 (0.0%) |
| Construction & Extraction | 17 (51.5%) | 16 (48.5%) |
| Installation, Maintenance & Repair | 0 (0.0%) | 0 (0.0%) |
| Total (Category) | 17 (51.5%) | 16 (48.5%) |
| Total (Overall) | 50 (42.4%) | 68 (57.6%) |
Production, Transportation and Moving Occupations
The most common Production, Transportation and Moving occupations in Fort Thomas are , and Transportation (3 | 2.5%).
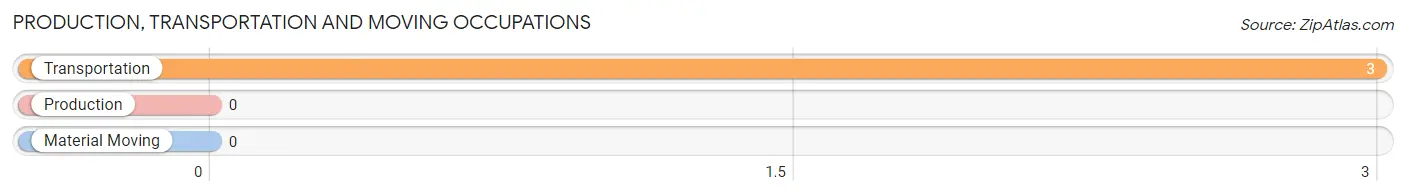
Production, Transportation and Moving Occupations by Sex
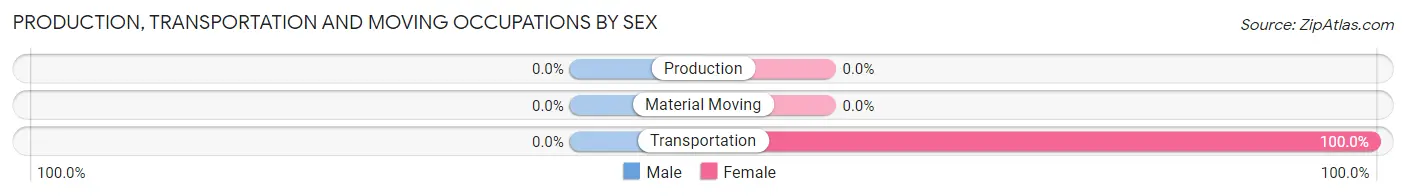
| Occupation | Male | Female |
| Production | 0 (0.0%) | 0 (0.0%) |
| Transportation | 0 (0.0%) | 3 (100.0%) |
| Material Moving | 0 (0.0%) | 0 (0.0%) |
| Total (Category) | 0 (0.0%) | 3 (100.0%) |
| Total (Overall) | 50 (42.4%) | 68 (57.6%) |
Employment Industries by Sex in Fort Thomas
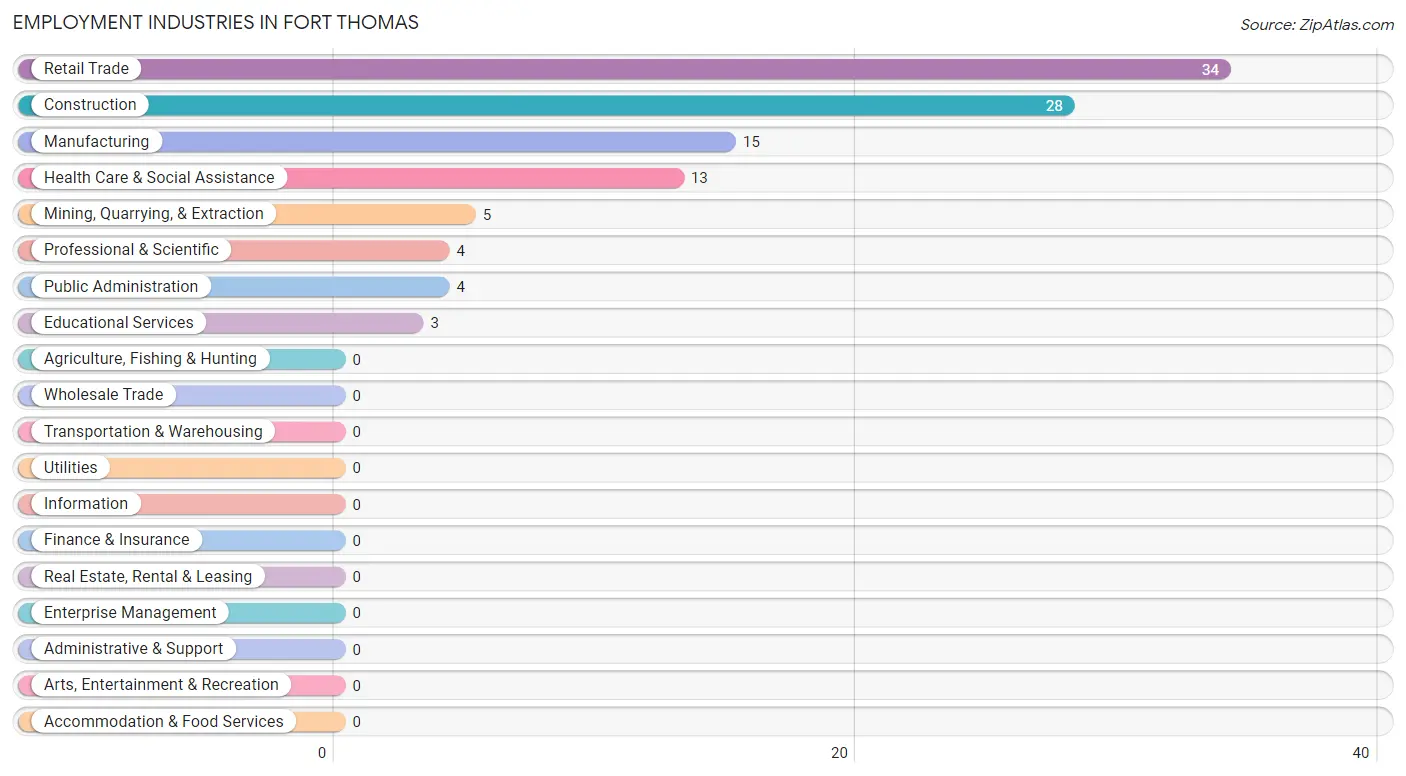
Employment Industries in Fort Thomas
The major employment industries in Fort Thomas include Retail Trade (34 | 28.8%), Construction (28 | 23.7%), Manufacturing (15 | 12.7%), Health Care & Social Assistance (13 | 11.0%), and Mining, Quarrying, & Extraction (5 | 4.2%).
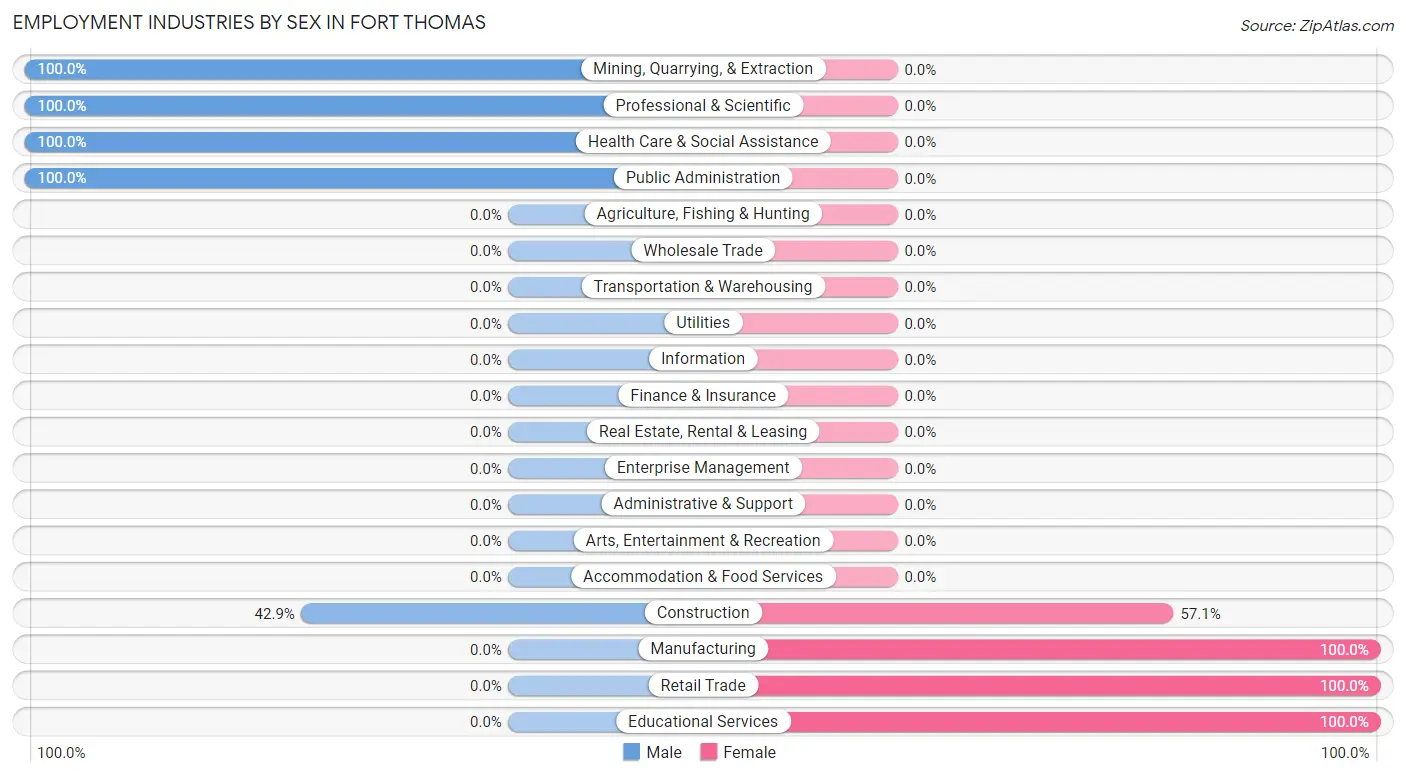
Employment Industries by Sex in Fort Thomas
The Fort Thomas industries that see more men than women are Mining, Quarrying, & Extraction (100.0%), Professional & Scientific (100.0%), and Health Care & Social Assistance (100.0%), whereas the industries that tend to have a higher number of women are Manufacturing (100.0%), Retail Trade (100.0%), and Educational Services (100.0%).
| Industry | Male | Female |
| Agriculture, Fishing & Hunting | 0 (0.0%) | 0 (0.0%) |
| Mining, Quarrying, & Extraction | 5 (100.0%) | 0 (0.0%) |
| Construction | 12 (42.9%) | 16 (57.1%) |
| Manufacturing | 0 (0.0%) | 15 (100.0%) |
| Wholesale Trade | 0 (0.0%) | 0 (0.0%) |
| Retail Trade | 0 (0.0%) | 34 (100.0%) |
| Transportation & Warehousing | 0 (0.0%) | 0 (0.0%) |
| Utilities | 0 (0.0%) | 0 (0.0%) |
| Information | 0 (0.0%) | 0 (0.0%) |
| Finance & Insurance | 0 (0.0%) | 0 (0.0%) |
| Real Estate, Rental & Leasing | 0 (0.0%) | 0 (0.0%) |
| Professional & Scientific | 4 (100.0%) | 0 (0.0%) |
| Enterprise Management | 0 (0.0%) | 0 (0.0%) |
| Administrative & Support | 0 (0.0%) | 0 (0.0%) |
| Educational Services | 0 (0.0%) | 3 (100.0%) |
| Health Care & Social Assistance | 13 (100.0%) | 0 (0.0%) |
| Arts, Entertainment & Recreation | 0 (0.0%) | 0 (0.0%) |
| Accommodation & Food Services | 0 (0.0%) | 0 (0.0%) |
| Public Administration | 4 (100.0%) | 0 (0.0%) |
| Total | 50 (42.4%) | 68 (57.6%) |
Education in Fort Thomas
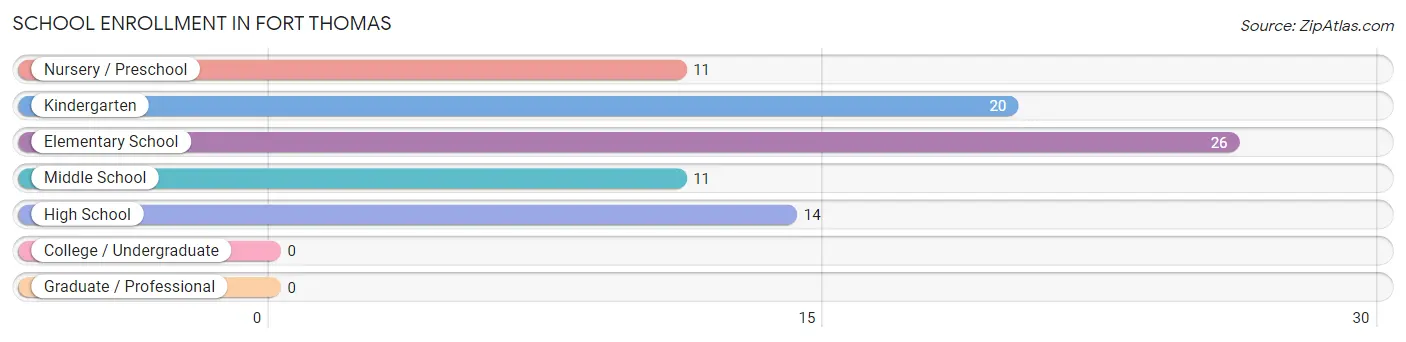
School Enrollment in Fort Thomas
The most common levels of schooling among the 82 students in Fort Thomas are elementary school (26 | 31.7%), kindergarten (20 | 24.4%), and high school (14 | 17.1%).
| School Level | # Students | % Students |
| Nursery / Preschool | 11 | 13.4% |
| Kindergarten | 20 | 24.4% |
| Elementary School | 26 | 31.7% |
| Middle School | 11 | 13.4% |
| High School | 14 | 17.1% |
| College / Undergraduate | 0 | 0.0% |
| Graduate / Professional | 0 | 0.0% |
| Total | 82 | 100.0% |
School Enrollment by Age by Funding Source in Fort Thomas
Out of a total of 82 students who are enrolled in schools in Fort Thomas, 34 (41.5%) attend a private institution, while the remaining 48 (58.5%) are enrolled in public schools. The age group of 10 to 14 year olds has the highest likelihood of being enrolled in private schools, with 11 (55.0% in the age bracket) enrolled. Conversely, the age group of 15 to 17 year olds has the lowest likelihood of being enrolled in a private school, with 5 (100.0% in the age bracket) attending a public institution.
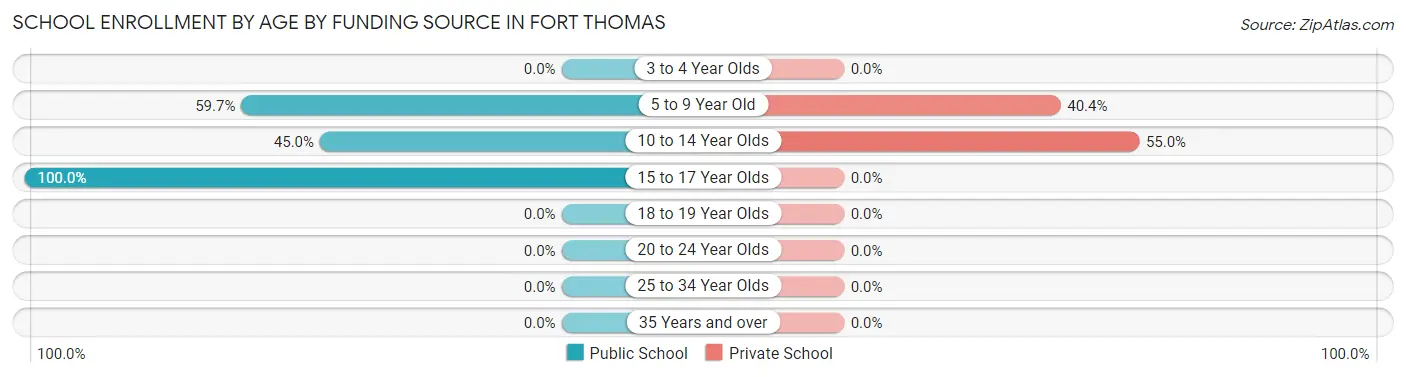
| Age Bracket | Public School | Private School |
| 3 to 4 Year Olds | 0 (0.0%) | 0 (0.0%) |
| 5 to 9 Year Old | 34 (59.7%) | 23 (40.4%) |
| 10 to 14 Year Olds | 9 (45.0%) | 11 (55.0%) |
| 15 to 17 Year Olds | 5 (100.0%) | 0 (0.0%) |
| 18 to 19 Year Olds | 0 (0.0%) | 0 (0.0%) |
| 20 to 24 Year Olds | 0 (0.0%) | 0 (0.0%) |
| 25 to 34 Year Olds | 0 (0.0%) | 0 (0.0%) |
| 35 Years and over | 0 (0.0%) | 0 (0.0%) |
| Total | 48 (58.5%) | 34 (41.5%) |
Educational Attainment by Field of Study in Fort Thomas
Education (19 | 43.2%), bio, nature & agricultural (14 | 31.8%), and visual & performing arts (11 | 25.0%) are the most common fields of study among 44 individuals in Fort Thomas who have obtained a bachelor's degree or higher.
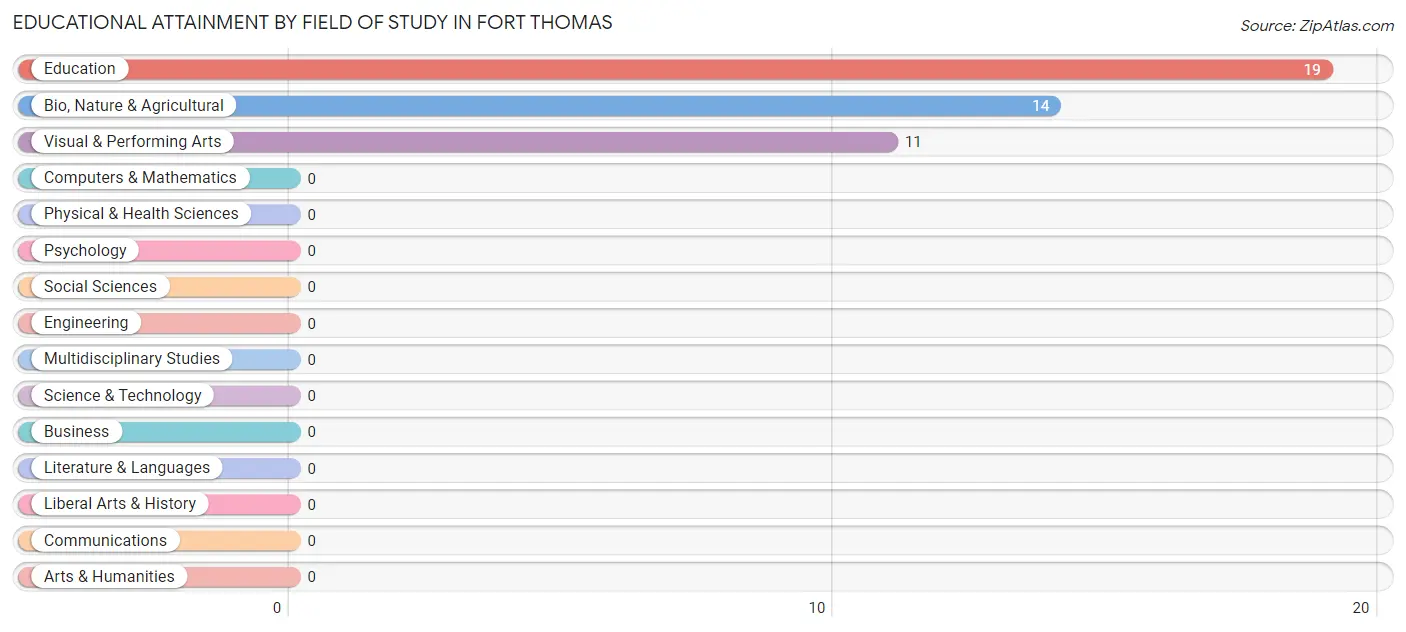
| Field of Study | # Graduates | % Graduates |
| Computers & Mathematics | 0 | 0.0% |
| Bio, Nature & Agricultural | 14 | 31.8% |
| Physical & Health Sciences | 0 | 0.0% |
| Psychology | 0 | 0.0% |
| Social Sciences | 0 | 0.0% |
| Engineering | 0 | 0.0% |
| Multidisciplinary Studies | 0 | 0.0% |
| Science & Technology | 0 | 0.0% |
| Business | 0 | 0.0% |
| Education | 19 | 43.2% |
| Literature & Languages | 0 | 0.0% |
| Liberal Arts & History | 0 | 0.0% |
| Visual & Performing Arts | 11 | 25.0% |
| Communications | 0 | 0.0% |
| Arts & Humanities | 0 | 0.0% |
| Total | 44 | 100.0% |
Transportation & Commute in Fort Thomas
Vehicle Availability by Sex in Fort Thomas
The most prevalent vehicle ownership categories in Fort Thomas are males with 1 vehicle (17, accounting for 34.0%) and females with 1 vehicle (0, making up 25.0%).
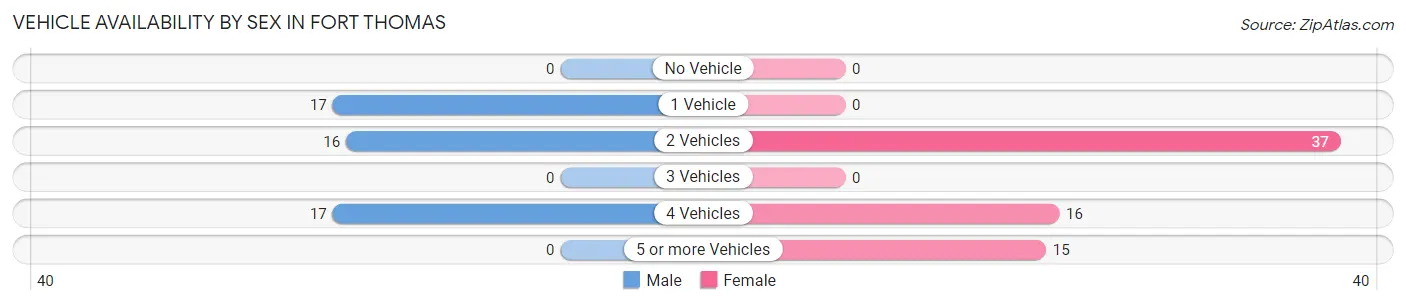
| Vehicles Available | Male | Female |
| No Vehicle | 0 (0.0%) | 0 (0.0%) |
| 1 Vehicle | 17 (34.0%) | 0 (0.0%) |
| 2 Vehicles | 16 (32.0%) | 37 (54.4%) |
| 3 Vehicles | 0 (0.0%) | 0 (0.0%) |
| 4 Vehicles | 17 (34.0%) | 16 (23.5%) |
| 5 or more Vehicles | 0 (0.0%) | 15 (22.1%) |
| Total | 50 (100.0%) | 68 (100.0%) |
Commute Time in Fort Thomas
The most frequently occuring commute durations in Fort Thomas are 20 to 24 minutes (34 commuters, 33.0%), 15 to 19 minutes (25 commuters, 24.3%), and 90 or more minutes (16 commuters, 15.5%).
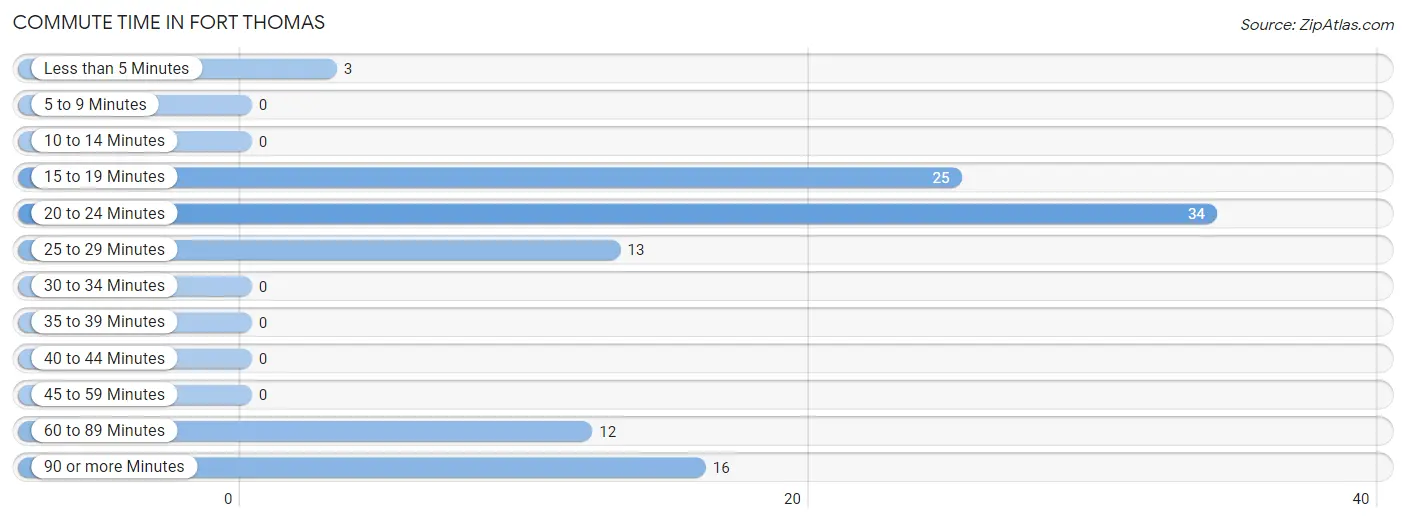
| Commute Time | # Commuters | % Commuters |
| Less than 5 Minutes | 3 | 2.9% |
| 5 to 9 Minutes | 0 | 0.0% |
| 10 to 14 Minutes | 0 | 0.0% |
| 15 to 19 Minutes | 25 | 24.3% |
| 20 to 24 Minutes | 34 | 33.0% |
| 25 to 29 Minutes | 13 | 12.6% |
| 30 to 34 Minutes | 0 | 0.0% |
| 35 to 39 Minutes | 0 | 0.0% |
| 40 to 44 Minutes | 0 | 0.0% |
| 45 to 59 Minutes | 0 | 0.0% |
| 60 to 89 Minutes | 12 | 11.7% |
| 90 or more Minutes | 16 | 15.5% |
Commute Time by Sex in Fort Thomas
The most common commute times in Fort Thomas are 15 to 19 minutes (25 commuters, 50.0%) for males and 20 to 24 minutes (34 commuters, 64.1%) for females.
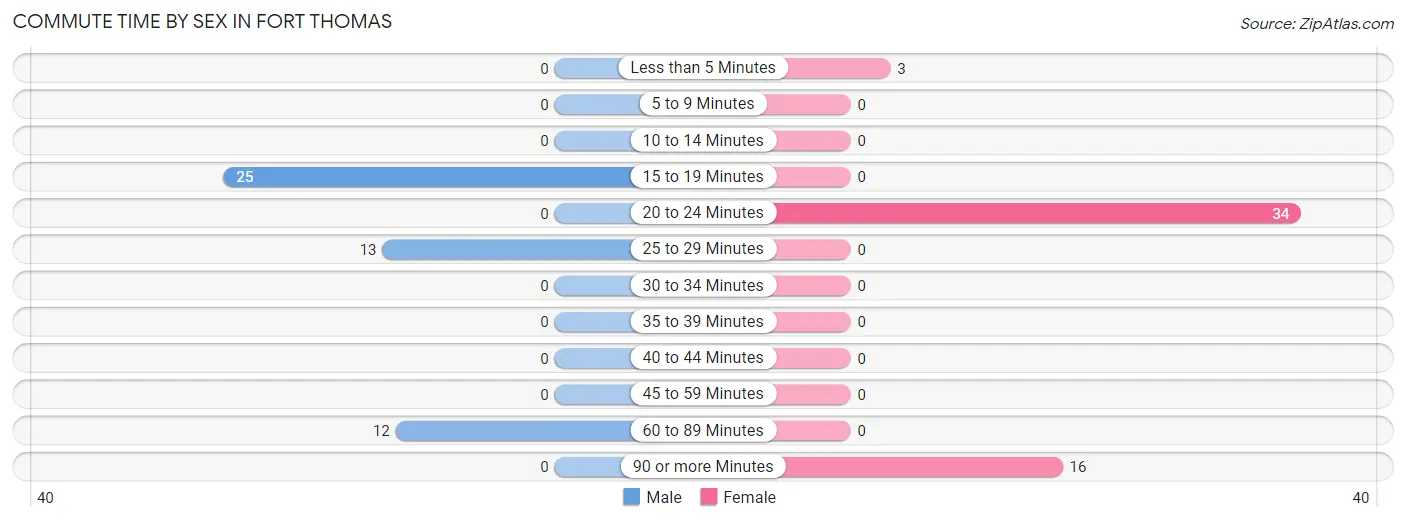
| Commute Time | Male | Female |
| Less than 5 Minutes | 0 (0.0%) | 3 (5.7%) |
| 5 to 9 Minutes | 0 (0.0%) | 0 (0.0%) |
| 10 to 14 Minutes | 0 (0.0%) | 0 (0.0%) |
| 15 to 19 Minutes | 25 (50.0%) | 0 (0.0%) |
| 20 to 24 Minutes | 0 (0.0%) | 34 (64.1%) |
| 25 to 29 Minutes | 13 (26.0%) | 0 (0.0%) |
| 30 to 34 Minutes | 0 (0.0%) | 0 (0.0%) |
| 35 to 39 Minutes | 0 (0.0%) | 0 (0.0%) |
| 40 to 44 Minutes | 0 (0.0%) | 0 (0.0%) |
| 45 to 59 Minutes | 0 (0.0%) | 0 (0.0%) |
| 60 to 89 Minutes | 12 (24.0%) | 0 (0.0%) |
| 90 or more Minutes | 0 (0.0%) | 16 (30.2%) |
Time of Departure to Work by Sex in Fort Thomas
The most frequent times of departure to work in Fort Thomas are 12:00 AM to 4:59 AM (13, 26.0%) for males and 5:30 AM to 5:59 AM (34, 64.1%) for females.
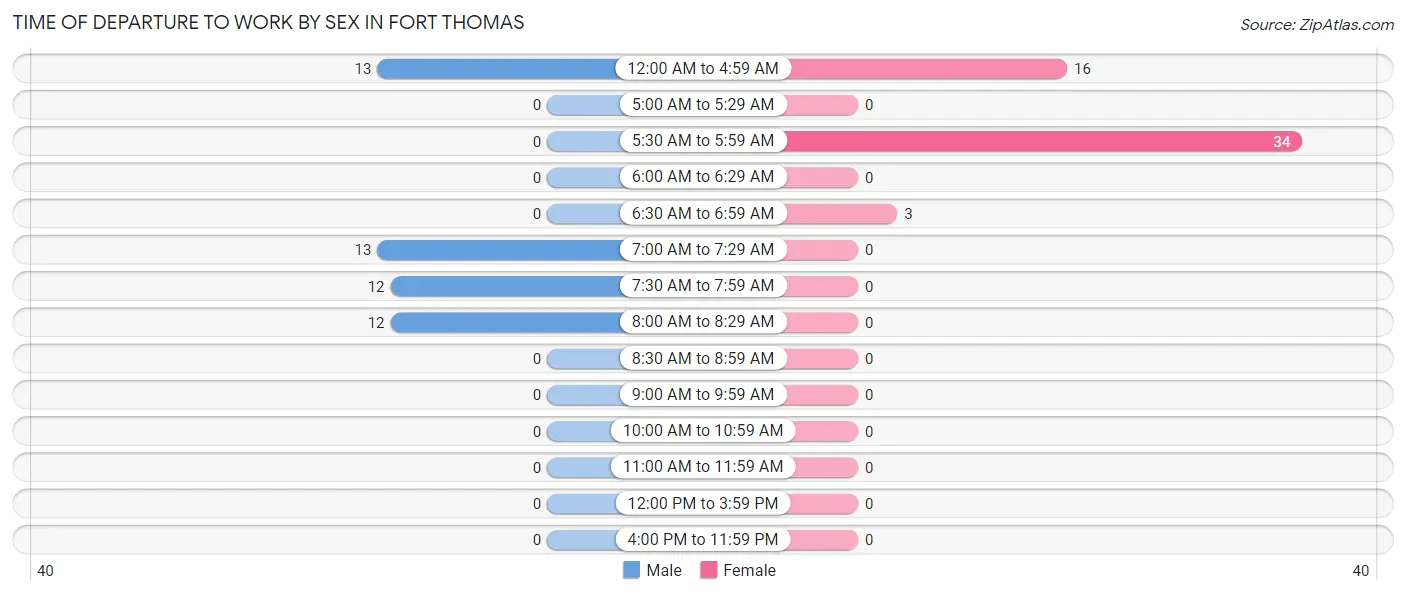
| Time of Departure | Male | Female |
| 12:00 AM to 4:59 AM | 13 (26.0%) | 16 (30.2%) |
| 5:00 AM to 5:29 AM | 0 (0.0%) | 0 (0.0%) |
| 5:30 AM to 5:59 AM | 0 (0.0%) | 34 (64.1%) |
| 6:00 AM to 6:29 AM | 0 (0.0%) | 0 (0.0%) |
| 6:30 AM to 6:59 AM | 0 (0.0%) | 3 (5.7%) |
| 7:00 AM to 7:29 AM | 13 (26.0%) | 0 (0.0%) |
| 7:30 AM to 7:59 AM | 12 (24.0%) | 0 (0.0%) |
| 8:00 AM to 8:29 AM | 12 (24.0%) | 0 (0.0%) |
| 8:30 AM to 8:59 AM | 0 (0.0%) | 0 (0.0%) |
| 9:00 AM to 9:59 AM | 0 (0.0%) | 0 (0.0%) |
| 10:00 AM to 10:59 AM | 0 (0.0%) | 0 (0.0%) |
| 11:00 AM to 11:59 AM | 0 (0.0%) | 0 (0.0%) |
| 12:00 PM to 3:59 PM | 0 (0.0%) | 0 (0.0%) |
| 4:00 PM to 11:59 PM | 0 (0.0%) | 0 (0.0%) |
| Total | 50 (100.0%) | 53 (100.0%) |
Housing Occupancy in Fort Thomas
Occupancy by Ownership in Fort Thomas
Of the total 146 dwellings in Fort Thomas, owner-occupied units account for 109 (74.7%), while renter-occupied units make up 37 (25.3%).
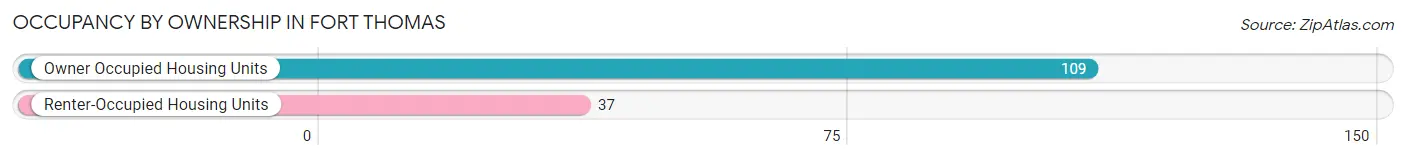
| Occupancy | # Housing Units | % Housing Units |
| Owner Occupied Housing Units | 109 | 74.7% |
| Renter-Occupied Housing Units | 37 | 25.3% |
| Total Occupied Housing Units | 146 | 100.0% |
Occupancy by Household Size in Fort Thomas
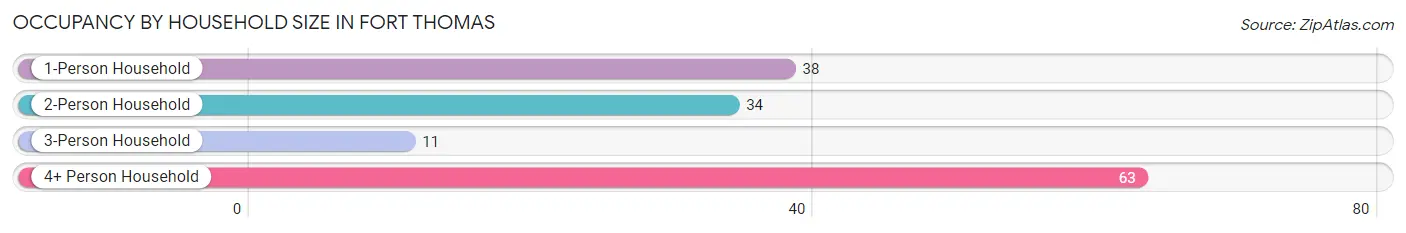
| Household Size | # Housing Units | % Housing Units |
| 1-Person Household | 38 | 26.0% |
| 2-Person Household | 34 | 23.3% |
| 3-Person Household | 11 | 7.5% |
| 4+ Person Household | 63 | 43.1% |
| Total Housing Units | 146 | 100.0% |
Occupancy by Ownership by Household Size in Fort Thomas
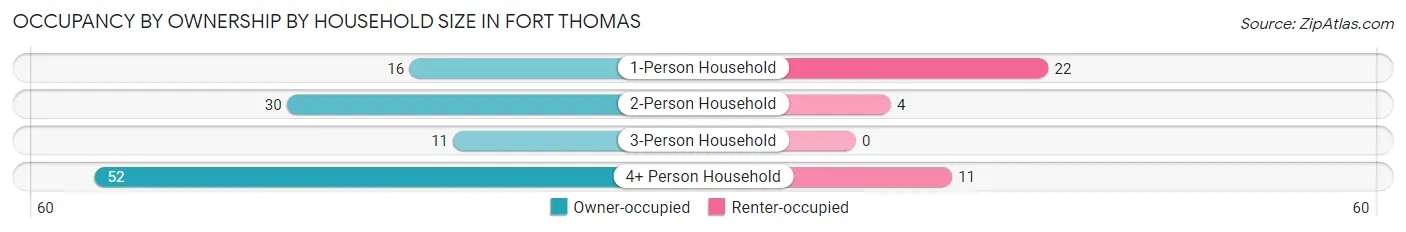
| Household Size | Owner-occupied | Renter-occupied |
| 1-Person Household | 16 (42.1%) | 22 (57.9%) |
| 2-Person Household | 30 (88.2%) | 4 (11.8%) |
| 3-Person Household | 11 (100.0%) | 0 (0.0%) |
| 4+ Person Household | 52 (82.5%) | 11 (17.5%) |
| Total Housing Units | 109 (74.7%) | 37 (25.3%) |
Occupancy by Educational Attainment in Fort Thomas
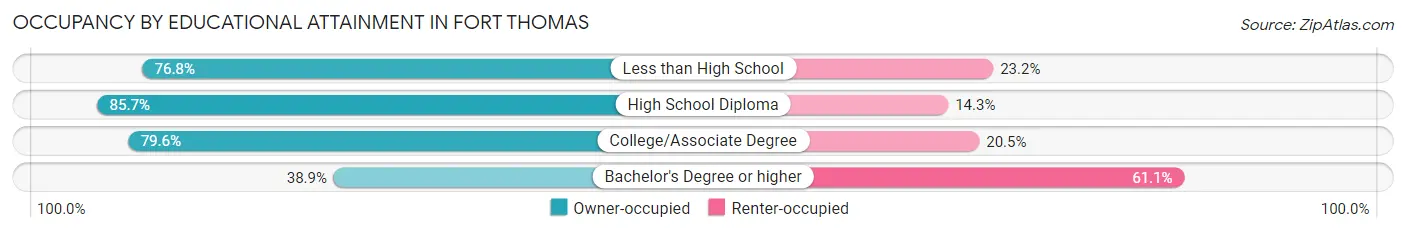
| Household Size | Owner-occupied | Renter-occupied |
| Less than High School | 43 (76.8%) | 13 (23.2%) |
| High School Diploma | 24 (85.7%) | 4 (14.3%) |
| College/Associate Degree | 35 (79.5%) | 9 (20.4%) |
| Bachelor's Degree or higher | 7 (38.9%) | 11 (61.1%) |
Occupancy by Age of Householder in Fort Thomas
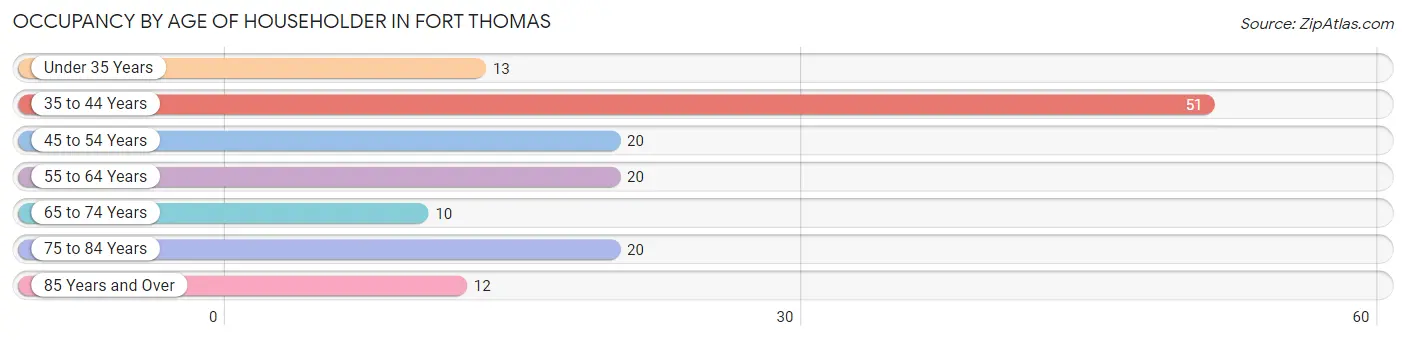
| Age Bracket | # Households | % Households |
| Under 35 Years | 13 | 8.9% |
| 35 to 44 Years | 51 | 34.9% |
| 45 to 54 Years | 20 | 13.7% |
| 55 to 64 Years | 20 | 13.7% |
| 65 to 74 Years | 10 | 6.9% |
| 75 to 84 Years | 20 | 13.7% |
| 85 Years and Over | 12 | 8.2% |
| Total | 146 | 100.0% |
Housing Finances in Fort Thomas
Median Income by Occupancy in Fort Thomas
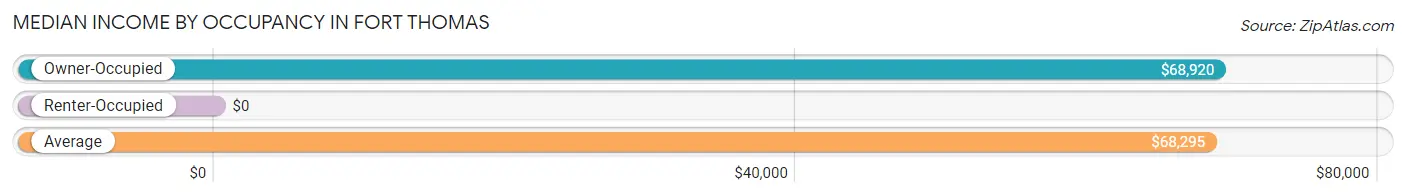
| Occupancy Type | # Households | Median Income |
| Owner-Occupied | 109 (74.7%) | $68,920 |
| Renter-Occupied | 37 (25.3%) | $0 |
| Average | 146 (100.0%) | $68,295 |
Occupancy by Householder Income Bracket in Fort Thomas
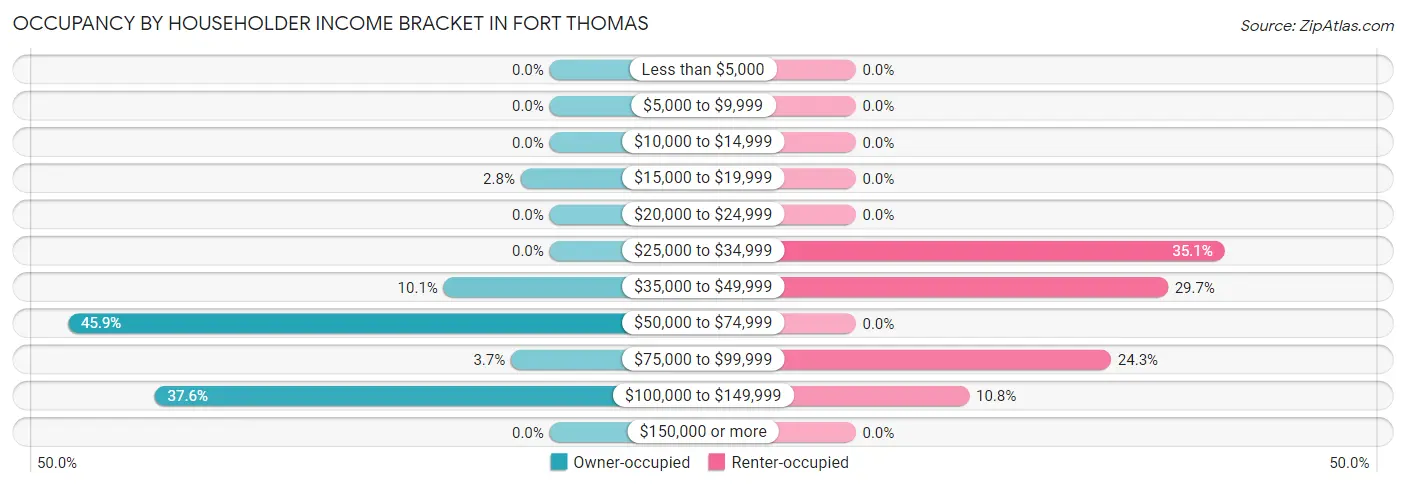
| Income Bracket | Owner-occupied | Renter-occupied |
| Less than $5,000 | 0 (0.0%) | 0 (0.0%) |
| $5,000 to $9,999 | 0 (0.0%) | 0 (0.0%) |
| $10,000 to $14,999 | 0 (0.0%) | 0 (0.0%) |
| $15,000 to $19,999 | 3 (2.8%) | 0 (0.0%) |
| $20,000 to $24,999 | 0 (0.0%) | 0 (0.0%) |
| $25,000 to $34,999 | 0 (0.0%) | 13 (35.1%) |
| $35,000 to $49,999 | 11 (10.1%) | 11 (29.7%) |
| $50,000 to $74,999 | 50 (45.9%) | 0 (0.0%) |
| $75,000 to $99,999 | 4 (3.7%) | 9 (24.3%) |
| $100,000 to $149,999 | 41 (37.6%) | 4 (10.8%) |
| $150,000 or more | 0 (0.0%) | 0 (0.0%) |
| Total | 109 (100.0%) | 37 (100.0%) |
Monthly Housing Cost Tiers in Fort Thomas
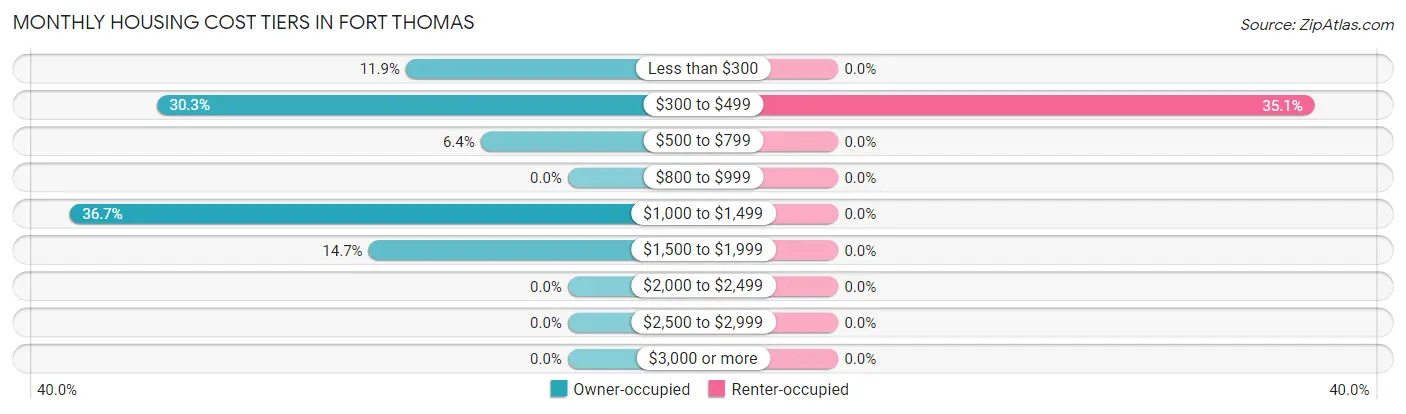
| Monthly Cost | Owner-occupied | Renter-occupied |
| Less than $300 | 13 (11.9%) | 0 (0.0%) |
| $300 to $499 | 33 (30.3%) | 13 (35.1%) |
| $500 to $799 | 7 (6.4%) | 0 (0.0%) |
| $800 to $999 | 0 (0.0%) | 0 (0.0%) |
| $1,000 to $1,499 | 40 (36.7%) | 0 (0.0%) |
| $1,500 to $1,999 | 16 (14.7%) | 0 (0.0%) |
| $2,000 to $2,499 | 0 (0.0%) | 0 (0.0%) |
| $2,500 to $2,999 | 0 (0.0%) | 0 (0.0%) |
| $3,000 or more | 0 (0.0%) | 0 (0.0%) |
| Total | 109 (100.0%) | 37 (100.0%) |
Physical Housing Characteristics in Fort Thomas
Housing Structures in Fort Thomas
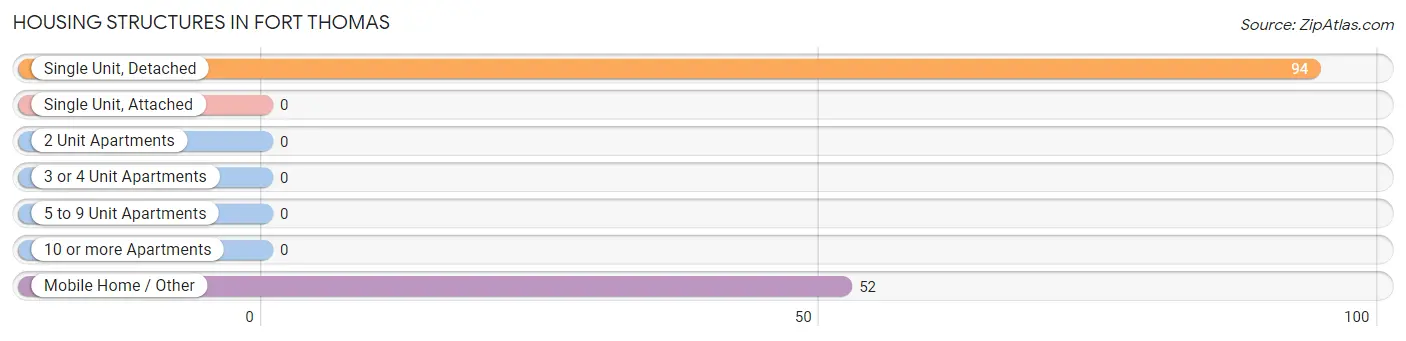
| Structure Type | # Housing Units | % Housing Units |
| Single Unit, Detached | 94 | 64.4% |
| Single Unit, Attached | 0 | 0.0% |
| 2 Unit Apartments | 0 | 0.0% |
| 3 or 4 Unit Apartments | 0 | 0.0% |
| 5 to 9 Unit Apartments | 0 | 0.0% |
| 10 or more Apartments | 0 | 0.0% |
| Mobile Home / Other | 52 | 35.6% |
| Total | 146 | 100.0% |
Housing Structures by Occupancy in Fort Thomas

| Structure Type | Owner-occupied | Renter-occupied |
| Single Unit, Detached | 70 (74.5%) | 24 (25.5%) |
| Single Unit, Attached | 0 (0.0%) | 0 (0.0%) |
| 2 Unit Apartments | 0 (0.0%) | 0 (0.0%) |
| 3 or 4 Unit Apartments | 0 (0.0%) | 0 (0.0%) |
| 5 to 9 Unit Apartments | 0 (0.0%) | 0 (0.0%) |
| 10 or more Apartments | 0 (0.0%) | 0 (0.0%) |
| Mobile Home / Other | 39 (75.0%) | 13 (25.0%) |
| Total | 109 (74.7%) | 37 (25.3%) |
Housing Structures by Number of Rooms in Fort Thomas
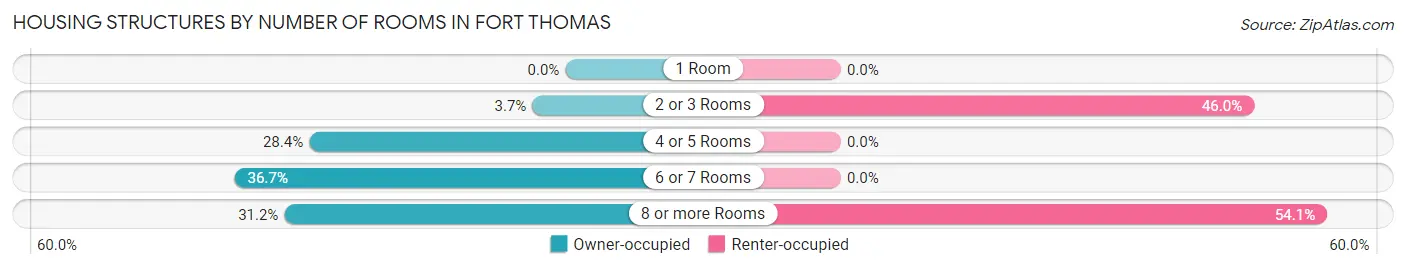
| Number of Rooms | Owner-occupied | Renter-occupied |
| 1 Room | 0 (0.0%) | 0 (0.0%) |
| 2 or 3 Rooms | 4 (3.7%) | 17 (46.0%) |
| 4 or 5 Rooms | 31 (28.4%) | 0 (0.0%) |
| 6 or 7 Rooms | 40 (36.7%) | 0 (0.0%) |
| 8 or more Rooms | 34 (31.2%) | 20 (54.0%) |
| Total | 109 (100.0%) | 37 (100.0%) |
Housing Structure by Heating Type in Fort Thomas
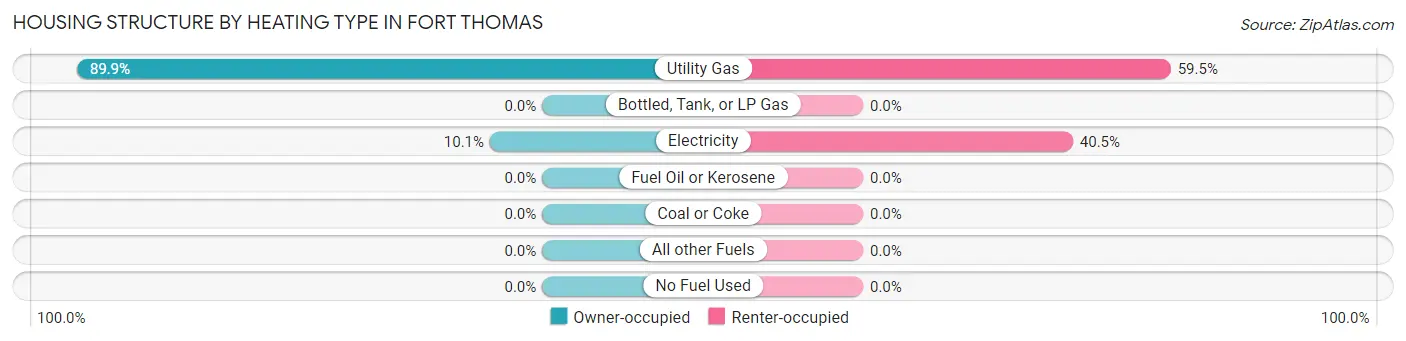
| Heating Type | Owner-occupied | Renter-occupied |
| Utility Gas | 98 (89.9%) | 22 (59.5%) |
| Bottled, Tank, or LP Gas | 0 (0.0%) | 0 (0.0%) |
| Electricity | 11 (10.1%) | 15 (40.5%) |
| Fuel Oil or Kerosene | 0 (0.0%) | 0 (0.0%) |
| Coal or Coke | 0 (0.0%) | 0 (0.0%) |
| All other Fuels | 0 (0.0%) | 0 (0.0%) |
| No Fuel Used | 0 (0.0%) | 0 (0.0%) |
| Total | 109 (100.0%) | 37 (100.0%) |
Household Vehicle Usage in Fort Thomas
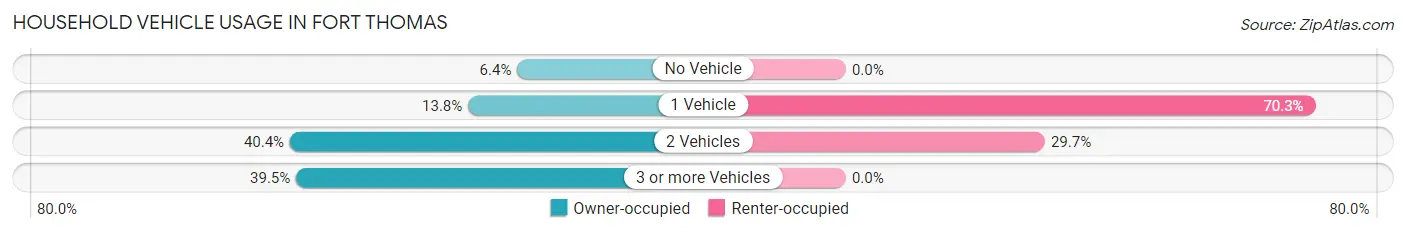
| Vehicles per Household | Owner-occupied | Renter-occupied |
| No Vehicle | 7 (6.4%) | 0 (0.0%) |
| 1 Vehicle | 15 (13.8%) | 26 (70.3%) |
| 2 Vehicles | 44 (40.4%) | 11 (29.7%) |
| 3 or more Vehicles | 43 (39.5%) | 0 (0.0%) |
| Total | 109 (100.0%) | 37 (100.0%) |
Real Estate & Mortgages in Fort Thomas
Real Estate and Mortgage Overview in Fort Thomas
| Characteristic | Without Mortgage | With Mortgage |
| Housing Units | 53 | 56 |
| Median Property Value | - | - |
| Median Household Income | $67,557 | $0 |
| Monthly Housing Costs | $435 | $0 |
| Real Estate Taxes | - | - |
Property Value by Mortgage Status in Fort Thomas
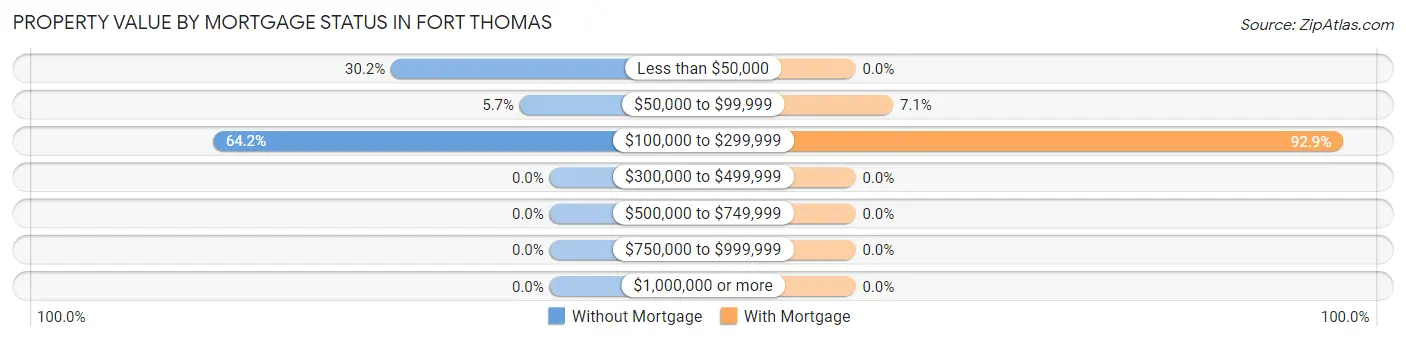
| Property Value | Without Mortgage | With Mortgage |
| Less than $50,000 | 16 (30.2%) | 0 (0.0%) |
| $50,000 to $99,999 | 3 (5.7%) | 4 (7.1%) |
| $100,000 to $299,999 | 34 (64.1%) | 52 (92.9%) |
| $300,000 to $499,999 | 0 (0.0%) | 0 (0.0%) |
| $500,000 to $749,999 | 0 (0.0%) | 0 (0.0%) |
| $750,000 to $999,999 | 0 (0.0%) | 0 (0.0%) |
| $1,000,000 or more | 0 (0.0%) | 0 (0.0%) |
| Total | 53 (100.0%) | 56 (100.0%) |
Household Income by Mortgage Status in Fort Thomas
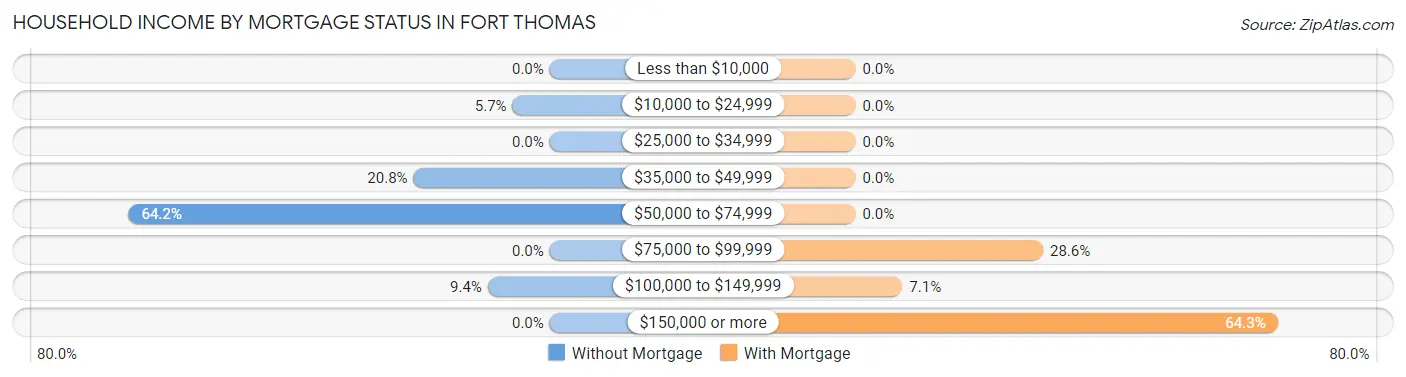
| Household Income | Without Mortgage | With Mortgage |
| Less than $10,000 | 0 (0.0%) | 0 (0.0%) |
| $10,000 to $24,999 | 3 (5.7%) | 0 (0.0%) |
| $25,000 to $34,999 | 0 (0.0%) | 0 (0.0%) |
| $35,000 to $49,999 | 11 (20.7%) | 0 (0.0%) |
| $50,000 to $74,999 | 34 (64.1%) | 0 (0.0%) |
| $75,000 to $99,999 | 0 (0.0%) | 16 (28.6%) |
| $100,000 to $149,999 | 5 (9.4%) | 4 (7.1%) |
| $150,000 or more | 0 (0.0%) | 36 (64.3%) |
| Total | 53 (100.0%) | 56 (100.0%) |
Property Value to Household Income Ratio in Fort Thomas
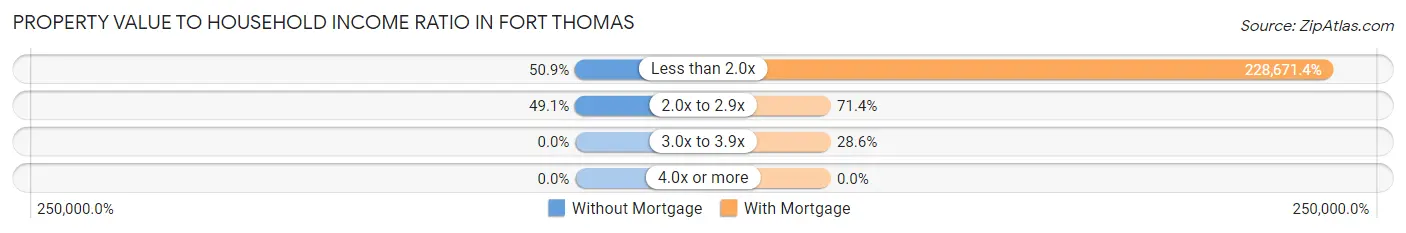
| Value-to-Income Ratio | Without Mortgage | With Mortgage |
| Less than 2.0x | 27 (50.9%) | 128,056 (228,671.4%) |
| 2.0x to 2.9x | 26 (49.1%) | 40 (71.4%) |
| 3.0x to 3.9x | 0 (0.0%) | 16 (28.6%) |
| 4.0x or more | 0 (0.0%) | 0 (0.0%) |
| Total | 53 (100.0%) | 56 (100.0%) |
Real Estate Taxes by Mortgage Status in Fort Thomas
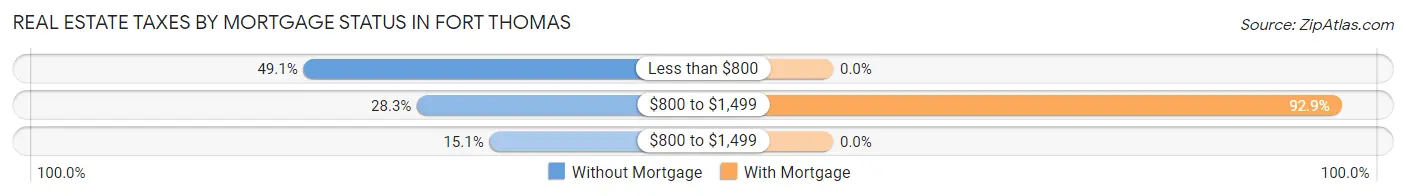
| Property Taxes | Without Mortgage | With Mortgage |
| Less than $800 | 26 (49.1%) | 0 (0.0%) |
| $800 to $1,499 | 15 (28.3%) | 52 (92.9%) |
| $800 to $1,499 | 8 (15.1%) | 0 (0.0%) |
| Total | 53 (100.0%) | 56 (100.0%) |
Health & Disability in Fort Thomas
Health Insurance Coverage by Age in Fort Thomas
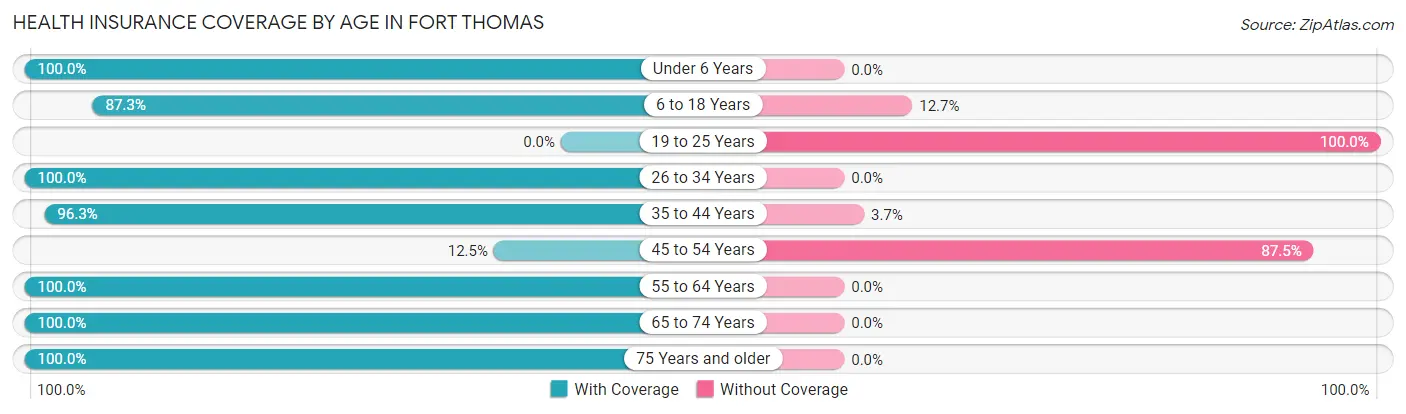
| Age Bracket | With Coverage | Without Coverage |
| Under 6 Years | 11 (100.0%) | 0 (0.0%) |
| 6 to 18 Years | 62 (87.3%) | 9 (12.7%) |
| 19 to 25 Years | 0 (0.0%) | 13 (100.0%) |
| 26 to 34 Years | 3 (100.0%) | 0 (0.0%) |
| 35 to 44 Years | 104 (96.3%) | 4 (3.7%) |
| 45 to 54 Years | 4 (12.5%) | 28 (87.5%) |
| 55 to 64 Years | 31 (100.0%) | 0 (0.0%) |
| 65 to 74 Years | 18 (100.0%) | 0 (0.0%) |
| 75 Years and older | 53 (100.0%) | 0 (0.0%) |
| Total | 286 (84.1%) | 54 (15.9%) |
Health Insurance Coverage by Citizenship Status in Fort Thomas
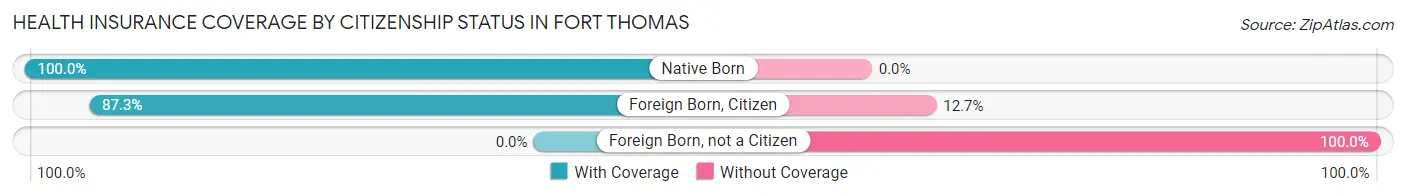
| Citizenship Status | With Coverage | Without Coverage |
| Native Born | 11 (100.0%) | 0 (0.0%) |
| Foreign Born, Citizen | 62 (87.3%) | 9 (12.7%) |
| Foreign Born, not a Citizen | 0 (0.0%) | 13 (100.0%) |
Health Insurance Coverage by Household Income in Fort Thomas
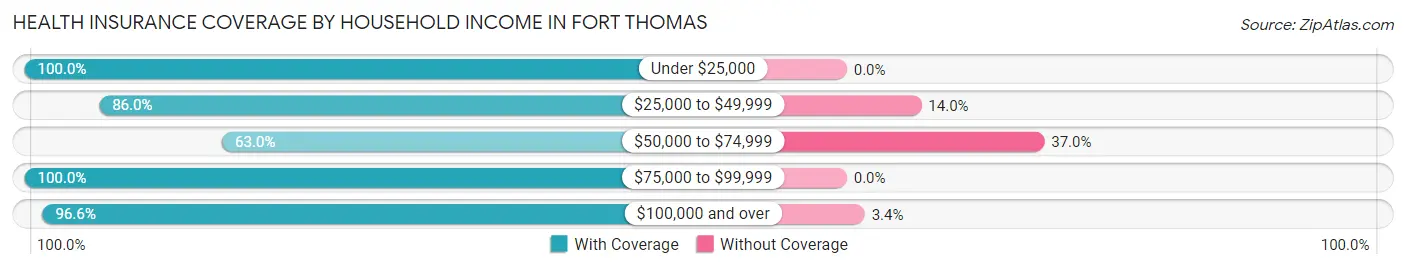
| Household Income | With Coverage | Without Coverage |
| Under $25,000 | 7 (100.0%) | 0 (0.0%) |
| $25,000 to $49,999 | 80 (86.0%) | 13 (14.0%) |
| $50,000 to $74,999 | 63 (63.0%) | 37 (37.0%) |
| $75,000 to $99,999 | 21 (100.0%) | 0 (0.0%) |
| $100,000 and over | 115 (96.6%) | 4 (3.4%) |
Public vs Private Health Insurance Coverage by Age in Fort Thomas
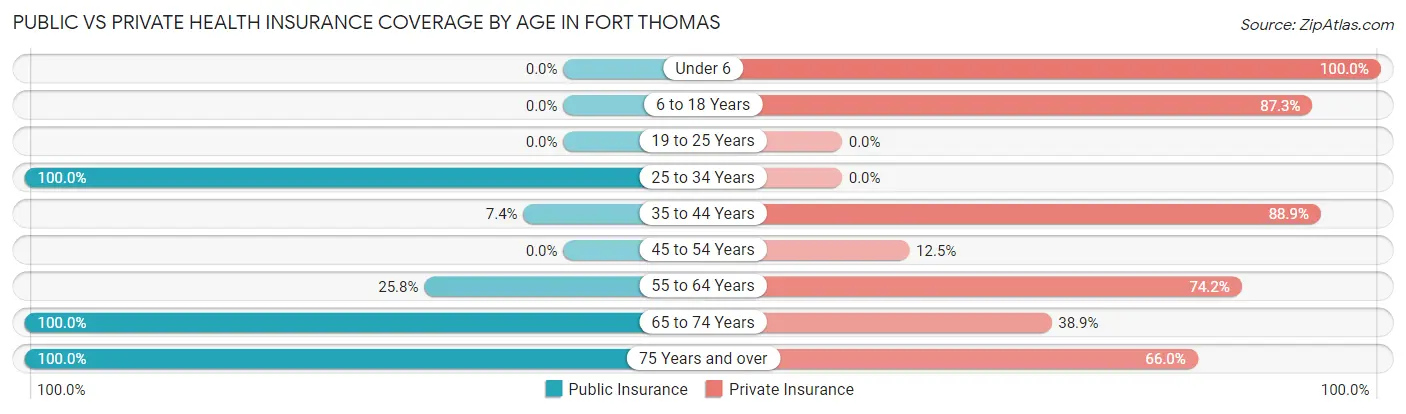
| Age Bracket | Public Insurance | Private Insurance |
| Under 6 | 0 (0.0%) | 11 (100.0%) |
| 6 to 18 Years | 0 (0.0%) | 62 (87.3%) |
| 19 to 25 Years | 0 (0.0%) | 0 (0.0%) |
| 25 to 34 Years | 3 (100.0%) | 0 (0.0%) |
| 35 to 44 Years | 8 (7.4%) | 96 (88.9%) |
| 45 to 54 Years | 0 (0.0%) | 4 (12.5%) |
| 55 to 64 Years | 8 (25.8%) | 23 (74.2%) |
| 65 to 74 Years | 18 (100.0%) | 7 (38.9%) |
| 75 Years and over | 53 (100.0%) | 35 (66.0%) |
| Total | 90 (26.5%) | 238 (70.0%) |
Disability Status by Sex by Age in Fort Thomas
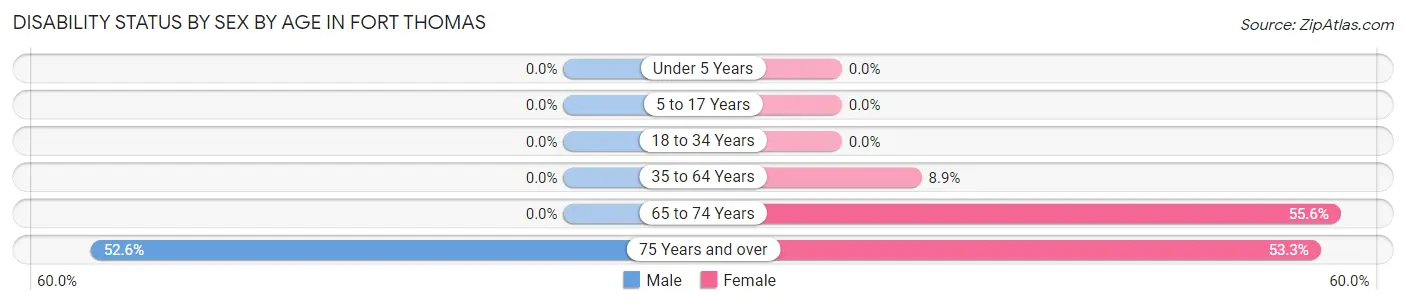
| Age Bracket | Male | Female |
| Under 5 Years | 0 (0.0%) | 0 (0.0%) |
| 5 to 17 Years | 0 (0.0%) | 0 (0.0%) |
| 18 to 34 Years | 0 (0.0%) | 0 (0.0%) |
| 35 to 64 Years | 0 (0.0%) | 8 (8.9%) |
| 65 to 74 Years | 0 (0.0%) | 10 (55.6%) |
| 75 Years and over | 20 (52.6%) | 8 (53.3%) |
Disability Class by Sex by Age in Fort Thomas
Disability Class: Hearing Difficulty
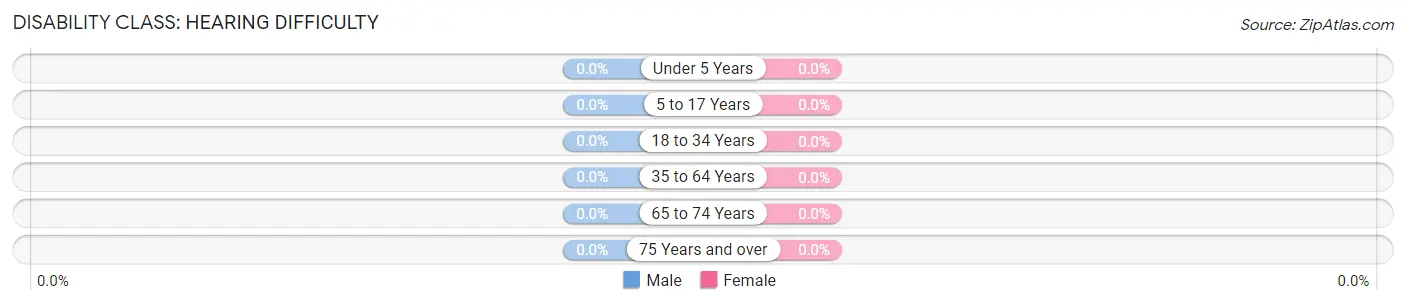
| Age Bracket | Male | Female |
| Under 5 Years | 0 (0.0%) | 0 (0.0%) |
| 5 to 17 Years | 0 (0.0%) | 0 (0.0%) |
| 18 to 34 Years | 0 (0.0%) | 0 (0.0%) |
| 35 to 64 Years | 0 (0.0%) | 0 (0.0%) |
| 65 to 74 Years | 0 (0.0%) | 0 (0.0%) |
| 75 Years and over | 0 (0.0%) | 0 (0.0%) |
Disability Class: Vision Difficulty
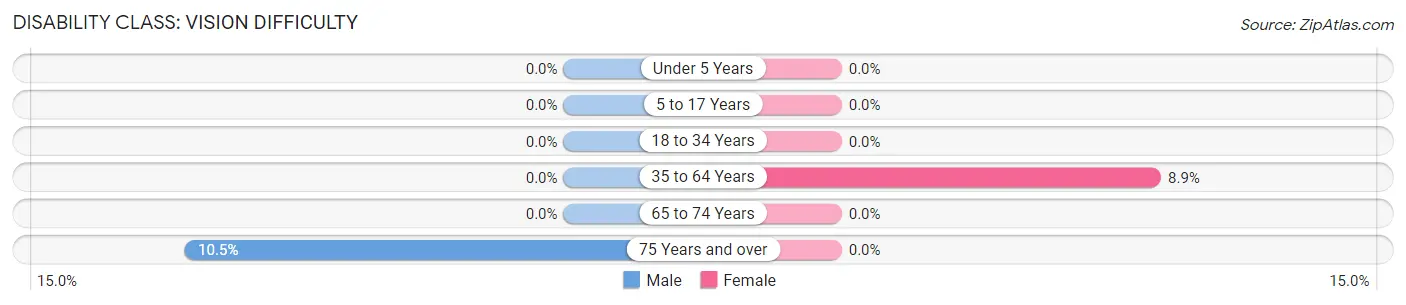
| Age Bracket | Male | Female |
| Under 5 Years | 0 (0.0%) | 0 (0.0%) |
| 5 to 17 Years | 0 (0.0%) | 0 (0.0%) |
| 18 to 34 Years | 0 (0.0%) | 0 (0.0%) |
| 35 to 64 Years | 0 (0.0%) | 8 (8.9%) |
| 65 to 74 Years | 0 (0.0%) | 0 (0.0%) |
| 75 Years and over | 4 (10.5%) | 0 (0.0%) |
Disability Class: Cognitive Difficulty
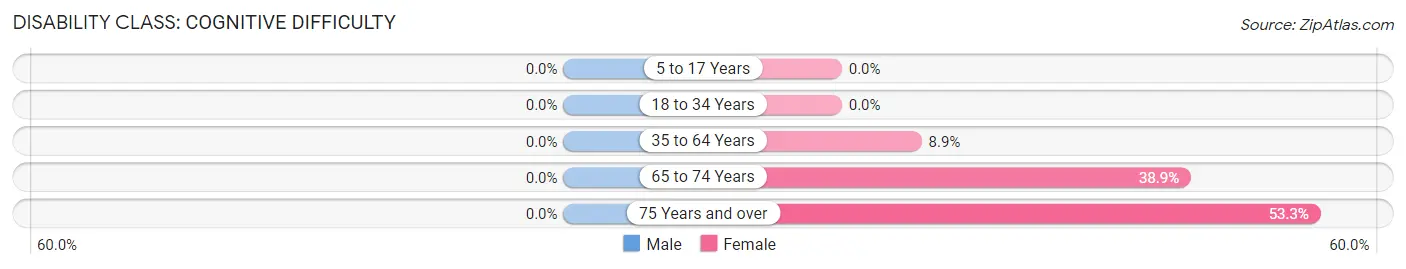
| Age Bracket | Male | Female |
| 5 to 17 Years | 0 (0.0%) | 0 (0.0%) |
| 18 to 34 Years | 0 (0.0%) | 0 (0.0%) |
| 35 to 64 Years | 0 (0.0%) | 8 (8.9%) |
| 65 to 74 Years | 0 (0.0%) | 7 (38.9%) |
| 75 Years and over | 0 (0.0%) | 8 (53.3%) |
Disability Class: Ambulatory Difficulty
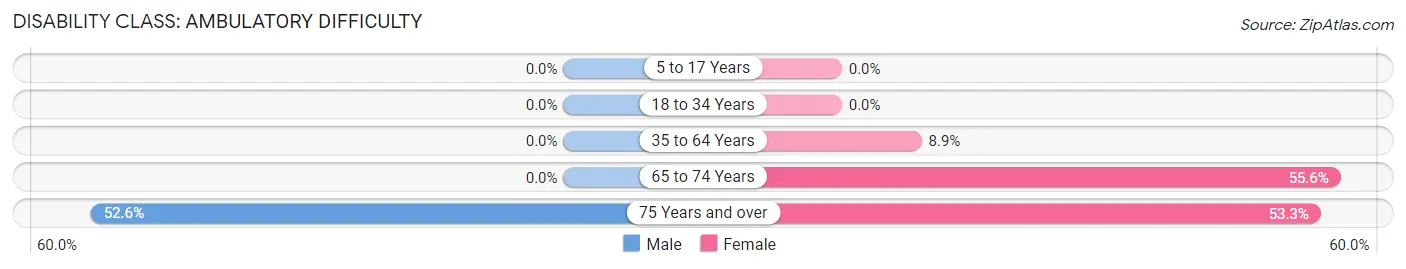
| Age Bracket | Male | Female |
| 5 to 17 Years | 0 (0.0%) | 0 (0.0%) |
| 18 to 34 Years | 0 (0.0%) | 0 (0.0%) |
| 35 to 64 Years | 0 (0.0%) | 8 (8.9%) |
| 65 to 74 Years | 0 (0.0%) | 10 (55.6%) |
| 75 Years and over | 20 (52.6%) | 8 (53.3%) |
Disability Class: Self-Care Difficulty
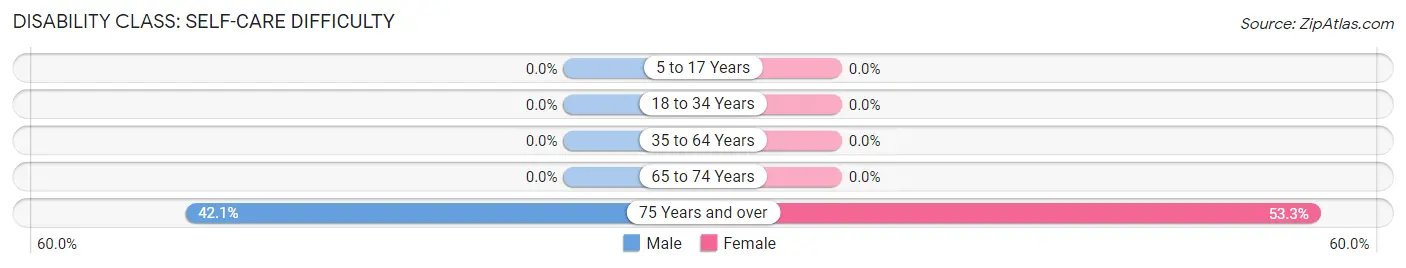
| Age Bracket | Male | Female |
| 5 to 17 Years | 0 (0.0%) | 0 (0.0%) |
| 18 to 34 Years | 0 (0.0%) | 0 (0.0%) |
| 35 to 64 Years | 0 (0.0%) | 0 (0.0%) |
| 65 to 74 Years | 0 (0.0%) | 0 (0.0%) |
| 75 Years and over | 16 (42.1%) | 8 (53.3%) |
Technology Access in Fort Thomas
Computing Device Access in Fort Thomas
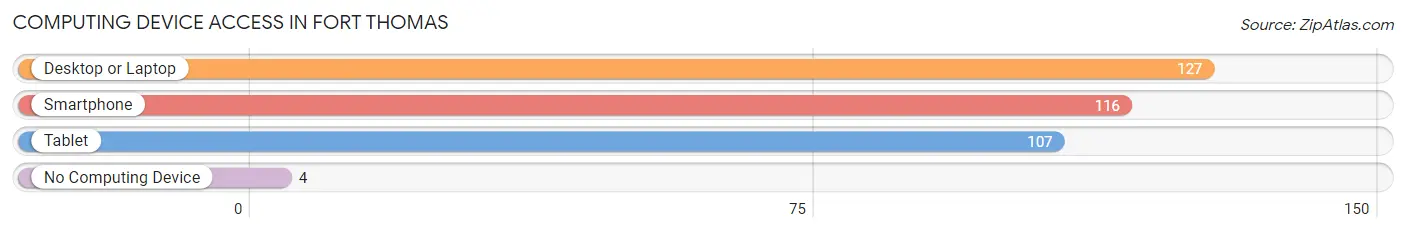
| Device Type | # Households | % Households |
| Desktop or Laptop | 127 | 87.0% |
| Smartphone | 116 | 79.4% |
| Tablet | 107 | 73.3% |
| No Computing Device | 4 | 2.7% |
| Total | 146 | 100.0% |
Internet Access in Fort Thomas
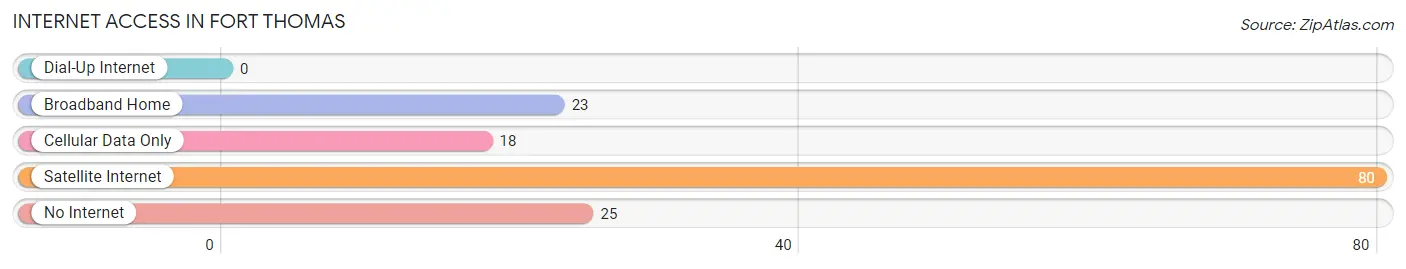
| Internet Type | # Households | % Households |
| Dial-Up Internet | 0 | 0.0% |
| Broadband Home | 23 | 15.8% |
| Cellular Data Only | 18 | 12.3% |
| Satellite Internet | 80 | 54.8% |
| No Internet | 25 | 17.1% |
| Total | 146 | 100.0% |
Fort Thomas Summary
Fort Thomas is a small town located in the Gila Valley of Arizona. It is situated in the southeastern corner of the state, about 40 miles east of Safford and about 60 miles south of Globe. The town is located in Graham County and is part of the Safford Micropolitan Statistical Area. As of the 2010 census, the population of Fort Thomas was 545.
History
Fort Thomas was founded in 1876 by a group of settlers from the nearby town of Safford. The settlers were looking for a place to establish a fort to protect the area from Apache raids. The fort was named after Thomas F. McMillan, a former Arizona territorial governor. The fort was built on a hill overlooking the Gila River and was surrounded by a wall of adobe bricks.
The fort served as a military outpost for the U.S. Army until 1891, when it was abandoned. After the fort was abandoned, the town of Fort Thomas was established. The town was incorporated in 1912 and has remained a small, rural community ever since.
Geography
Fort Thomas is located in the Gila Valley of Arizona. It is situated in the southeastern corner of the state, about 40 miles east of Safford and about 60 miles south of Globe. The town is located in Graham County and is part of the Safford Micropolitan Statistical Area.
The town is situated at an elevation of 3,845 feet and is surrounded by the Coronado National Forest. The Gila River runs through the town and is a popular spot for fishing and camping. The town is also home to several small lakes, including Lake Roberts and Lake Gila.
Economy
The economy of Fort Thomas is largely based on agriculture. The town is home to several farms and ranches, which produce a variety of crops, including alfalfa, cotton, and wheat. The town is also home to several small businesses, including a grocery store, a hardware store, and a restaurant.
Demographics
As of the 2010 census, the population of Fort Thomas was 545. The racial makeup of the town was 94.2% White, 0.2% African American, 0.7% Native American, 0.2% Asian, 0.2% Pacific Islander, 2.7% from other races, and 1.9% from two or more races. Hispanic or Latino of any race were 6.2% of the population.
The median household income in Fort Thomas was $31,250, and the median family income was $35,417. The per capita income for the town was $14,845. About 16.2% of families and 19.2% of the population were below the poverty line, including 25.2% of those under age 18 and 10.3% of those age 65 or over.
Common Questions
What is Per Capita Income in Fort Thomas?
Per Capita income in Fort Thomas is $32,641.
What is the Median Family Income in Fort Thomas?
Median Family Income in Fort Thomas is $100,000.
What is the Median Household income in Fort Thomas?
Median Household Income in Fort Thomas is $68,295.
What is Inequality or Gini Index in Fort Thomas?
Inequality or Gini Index in Fort Thomas is 0.27.
What is the Total Population of Fort Thomas?
Total Population of Fort Thomas is 340.
What is the Total Male Population of Fort Thomas?
Total Male Population of Fort Thomas is 179.
What is the Total Female Population of Fort Thomas?
Total Female Population of Fort Thomas is 161.
What is the Ratio of Males per 100 Females in Fort Thomas?
There are 111.18 Males per 100 Females in Fort Thomas.
What is the Ratio of Females per 100 Males in Fort Thomas?
There are 89.94 Females per 100 Males in Fort Thomas.
What is the Median Population Age in Fort Thomas?
Median Population Age in Fort Thomas is 42.2 Years.
What is the Average Family Size in Fort Thomas
Average Family Size in Fort Thomas is 2.7 People.
What is the Average Household Size in Fort Thomas
Average Household Size in Fort Thomas is 2.3 People.
How Large is the Labor Force in Fort Thomas?
There are 121 People in the Labor Forcein in Fort Thomas.
What is the Percentage of People in the Labor Force in Fort Thomas?
46.9% of People are in the Labor Force in Fort Thomas.
What is the Unemployment Rate in Fort Thomas?
Unemployment Rate in Fort Thomas is 2.5%.