Zip Codes with the Highest Percentage of Population with a Degree in Science and Engineering in Flagstaff, AZ

RELATED REPORTS & OPTIONS

Science and Engineering
Population
Families and Households
Female Fertility
Female Fertility (Unmarried)
Race (Community Size)
Race (Percentage)
Ancestry (Community Size)
AfghanAfricanAlaska NativeAlaskan AthabascanAmericanApacheArabArmenianAustrianBasqueBelgianBhutaneseBlackfeetBrazilianBritishBurmeseCanadianCentral AmericanCherokeeChileanChippewaChoctawColombianCreekCroatianCubanCzechCzechoslovakianDanishDutchEastern EuropeanEnglishEuropeanFinnishFrenchFrench CanadianGermanGreekGuamanian / ChamorroGuatemalanHopiHungarianIndian (Asian)IranianIrishIroquoisIsraeliItalianJamaicanJordanianKoreanLaotianLatvianLebaneseLithuanianMexicanNative HawaiianNavajoNorthern EuropeanNorwegianPakistaniPanamanianPeruvianPolishPortuguesePuerto RicanRomanianRussianSalvadoranSamoanScandinavianScotch-IrishScottishSiouxSlavicSlovakSouth AfricanSouth AmericanSpaniardSpanishSri LankanSubsaharan AfricanSwedishSwissThaiTohono O'OdhamUkrainianVenezuelanWelshWest IndianYaquiYugoslavianYuman
Ancestry (Percentage)
AfghanAfricanAlaska NativeAlaskan AthabascanAmericanApacheArabArmenianAustrianBasqueBelgianBhutaneseBlackfeetBrazilianBritishBurmeseCanadianCentral AmericanCherokeeChileanChippewaChoctawColombianCreekCroatianCubanCzechCzechoslovakianDanishDutchEastern EuropeanEnglishEuropeanFinnishFrenchFrench CanadianGermanGreekGuamanian / ChamorroGuatemalanHopiHungarianIndian (Asian)IranianIrishIroquoisIsraeliItalianJamaicanJordanianKoreanLaotianLatvianLebaneseLithuanianMexicanNative HawaiianNavajoNorthern EuropeanNorwegianPakistaniPanamanianPeruvianPolishPortuguesePuerto RicanRomanianRussianSalvadoranSamoanScandinavianScotch-IrishScottishSiouxSlavicSlovakSouth AfricanSouth AmericanSpaniardSpanishSri LankanSubsaharan AfricanSwedishSwissThaiTohono O'OdhamUkrainianVenezuelanWelshWest IndianYaquiYugoslavianYuman
Immigrant Origin (Total)
Immigrant Origin (Percentage)
Income
Income (Families)
Income (Households)
Poverty
Poverty (Families)
Unemployment
Employment Occupations
Employment Industries
Employer Class
Commute Time
Commute Means
School Enrollment
Education by Degree Field
Occupancy
Finances
Physical Characteristics
Flagstaff
Compare Zip Codes
Comparison Subject

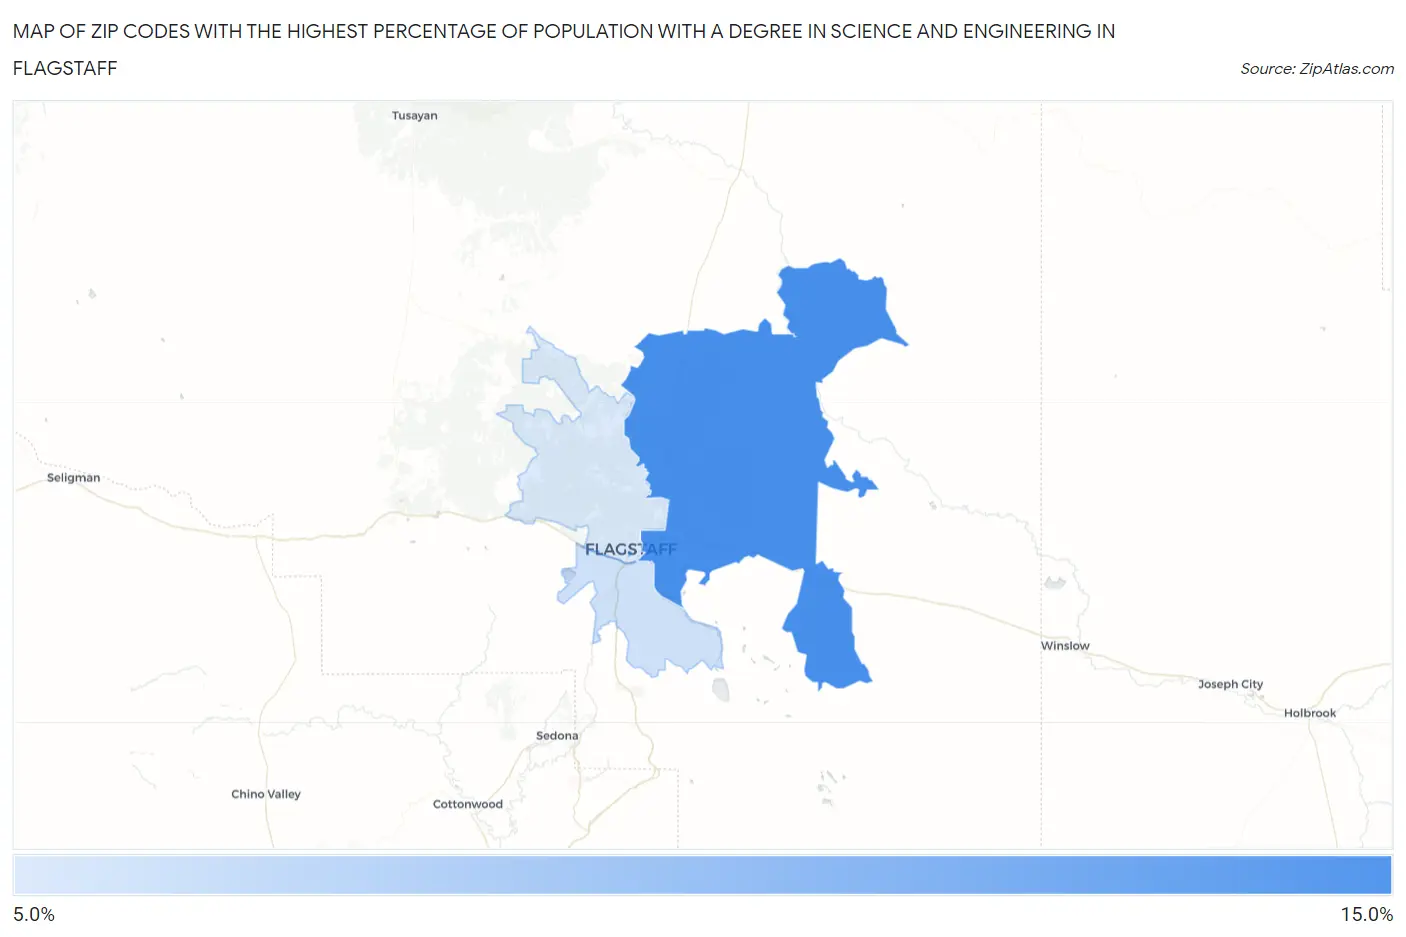
Map of Zip Codes with the Highest Percentage of Population with a Degree in Science and Engineering in Flagstaff

0.0%
15.0%
Zip Codes with the Highest Percentage of Population with a Degree in Science and Engineering in Flagstaff Map

Zip Codes with the Highest Percentage of Population with a Degree in Science and Engineering in Flagstaff, AZ

Zip Code % Graduates vs State vs National
1.8600411.1%10.2%(+0.903)#1329.8%(+1.31)#12,693
2.860059.9%10.2%(-0.300)#1809.8%(+0.105)#15,297
3.860019.8%10.2%(-0.425)#1849.8%(-0.020)#15,549

Common Questions

What are the Top 3 Zip Codes with the Highest Percentage of Population with a Degree in Science and Engineering in Flagstaff, AZ?
Top 3 Zip Codes with the Highest Percentage of Population with a Degree in Science and Engineering in Flagstaff, AZ are:
#1
11.1%
#2
9.9%
#3
9.8%
What zip code has the Highest Percentage of Population with a Degree in Science and Engineering in Flagstaff, AZ?
86004 has the Highest Percentage of Population with a Degree in Science and Engineering in Flagstaff, AZ with 11.1%.
What is the Percentage of Population with a Degree in Science and Engineering in Flagstaff, AZ?
Percentage of Population with a Degree in Science and Engineering in Flagstaff is 10.5%.
What is the Percentage of Population with a Degree in Science and Engineering in Arizona?
Percentage of Population with a Degree in Science and Engineering in Arizona is 10.2%.
What is the Percentage of Population with a Degree in Science and Engineering in the United States?
Percentage of Population with a Degree in Science and Engineering in the United States is 9.8%.