Duncan, AZ Map & Demographics
Duncan Map
Duncan Overview
$19,804
PER CAPITA INCOME
$48,056
AVG FAMILY INCOME
$42,969
AVG HOUSEHOLD INCOME
0.40
INEQUALITY / GINI INDEX
879
TOTAL POPULATION
396
MALE POPULATION
483
FEMALE POPULATION
81.99
MALES / 100 FEMALES
121.97
FEMALES / 100 MALES
31.4
MEDIAN AGE
3.8
AVG FAMILY SIZE
2.7
AVG HOUSEHOLD SIZE
230
LABOR FORCE [ PEOPLE ]
35.7%
PERCENT IN LABOR FORCE
8.7%
UNEMPLOYMENT RATE
Duncan Zip Codes
Duncan Area Codes
Income in Duncan
Income Overview in Duncan
Per Capita Income in Duncan is $19,804, while median incomes of families and households are $48,056 and $42,969 respectively.
| Characteristic | Number | Measure |
| Per Capita Income | 879 | $19,804 |
| Median Family Income | 190 | $48,056 |
| Mean Family Income | 190 | $48,076 |
| Median Household Income | 331 | $42,969 |
| Mean Household Income | 331 | $50,266 |
| Income Deficit | 190 | $0 |
| Wage / Income Gap (%) | 879 | 0.00% |
| Wage / Income Gap ($) | 879 | 100.00¢ per $1 |
| Gini / Inequality Index | 879 | 0.40 |
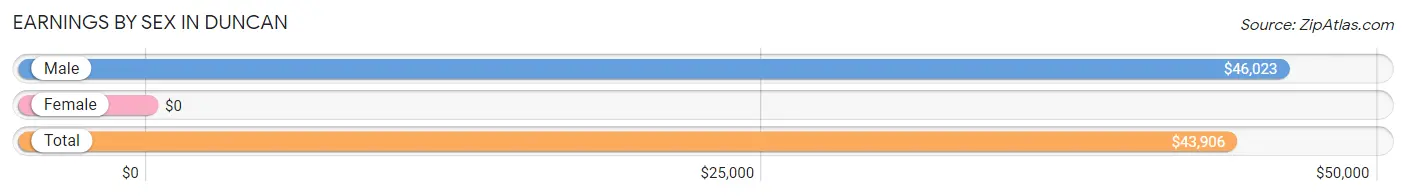
Earnings by Sex in Duncan
| Sex | Number | Average Earnings |
| Male | 121 (50.2%) | $46,023 |
| Female | 120 (49.8%) | $0 |
| Total | 241 (100.0%) | $43,906 |
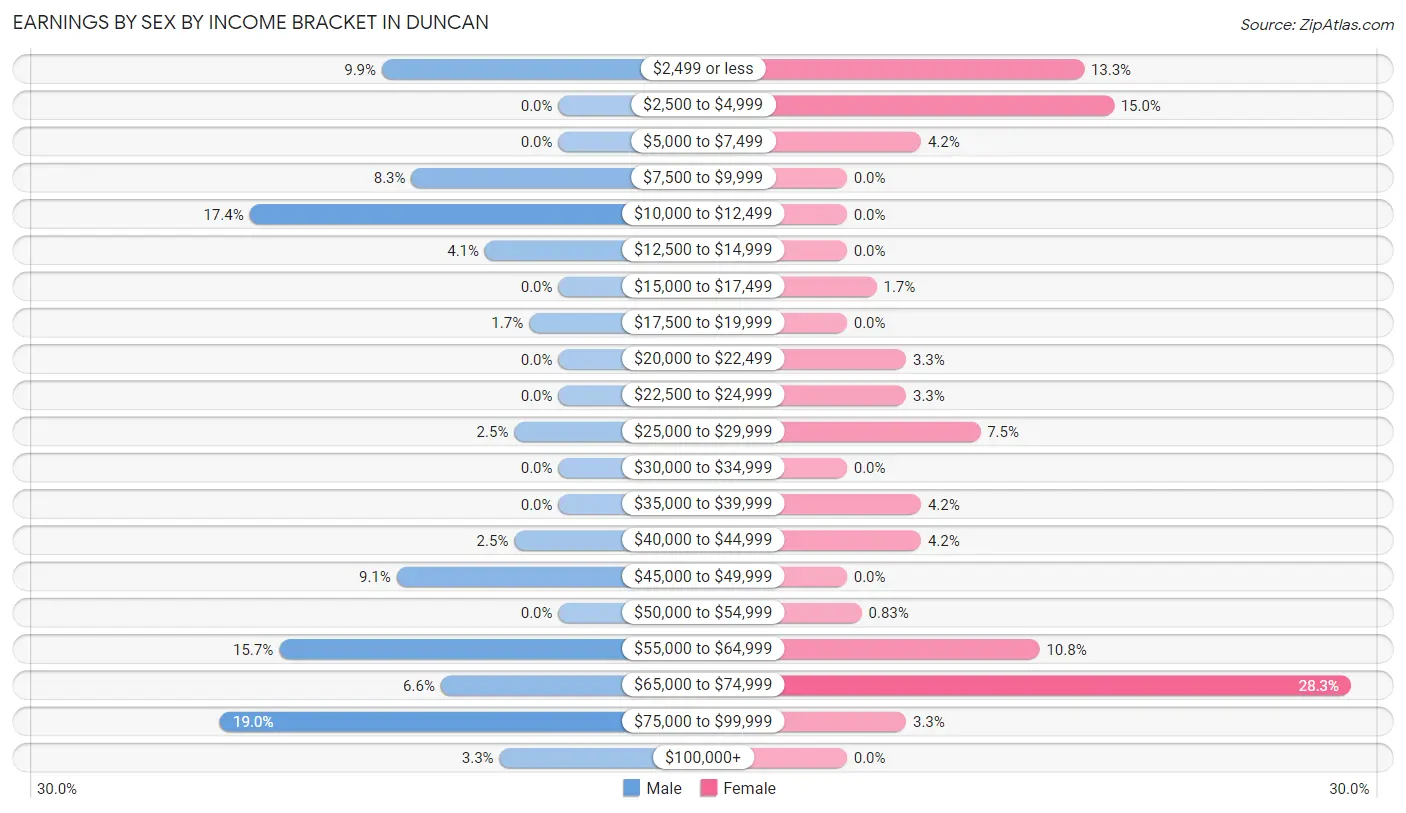
Earnings by Sex by Income Bracket in Duncan
The most common earnings brackets in Duncan are $75,000 to $99,999 for men (23 | 19.0%) and $65,000 to $74,999 for women (34 | 28.3%).
| Income | Male | Female |
| $2,499 or less | 12 (9.9%) | 16 (13.3%) |
| $2,500 to $4,999 | 0 (0.0%) | 18 (15.0%) |
| $5,000 to $7,499 | 0 (0.0%) | 5 (4.2%) |
| $7,500 to $9,999 | 10 (8.3%) | 0 (0.0%) |
| $10,000 to $12,499 | 21 (17.4%) | 0 (0.0%) |
| $12,500 to $14,999 | 5 (4.1%) | 0 (0.0%) |
| $15,000 to $17,499 | 0 (0.0%) | 2 (1.7%) |
| $17,500 to $19,999 | 2 (1.7%) | 0 (0.0%) |
| $20,000 to $22,499 | 0 (0.0%) | 4 (3.3%) |
| $22,500 to $24,999 | 0 (0.0%) | 4 (3.3%) |
| $25,000 to $29,999 | 3 (2.5%) | 9 (7.5%) |
| $30,000 to $34,999 | 0 (0.0%) | 0 (0.0%) |
| $35,000 to $39,999 | 0 (0.0%) | 5 (4.2%) |
| $40,000 to $44,999 | 3 (2.5%) | 5 (4.2%) |
| $45,000 to $49,999 | 11 (9.1%) | 0 (0.0%) |
| $50,000 to $54,999 | 0 (0.0%) | 1 (0.8%) |
| $55,000 to $64,999 | 19 (15.7%) | 13 (10.8%) |
| $65,000 to $74,999 | 8 (6.6%) | 34 (28.3%) |
| $75,000 to $99,999 | 23 (19.0%) | 4 (3.3%) |
| $100,000+ | 4 (3.3%) | 0 (0.0%) |
| Total | 121 (100.0%) | 120 (100.0%) |
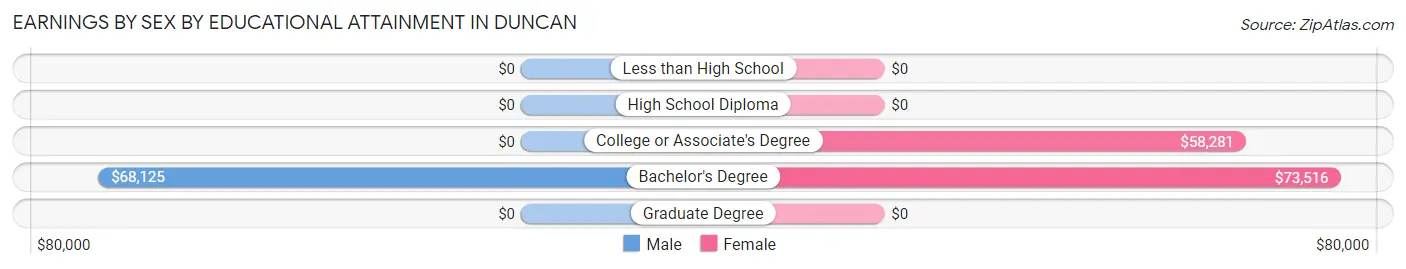
Earnings by Sex by Educational Attainment in Duncan
Average earnings in Duncan are $47,159 for men and $56,250 for women, a difference of 16.2%. Men with an educational attainment of bachelor's degree enjoy the highest average annual earnings of $68,125, while those with bachelor's degree education earn the least with $68,125. Women with an educational attainment of bachelor's degree earn the most with the average annual earnings of $73,516, while those with college or associate's degree education have the smallest earnings of $58,281.
| Educational Attainment | Male Income | Female Income |
| Less than High School | - | - |
| High School Diploma | - | - |
| College or Associate's Degree | - | - |
| Bachelor's Degree | $68,125 | $73,516 |
| Graduate Degree | - | - |
| Total | $47,159 | $56,250 |
Family Income in Duncan
Family Income Brackets in Duncan
According to the Duncan family income data, there are 50 families falling into the $50,000 to $74,999 income range, which is the most common income bracket and makes up 26.3% of all families.
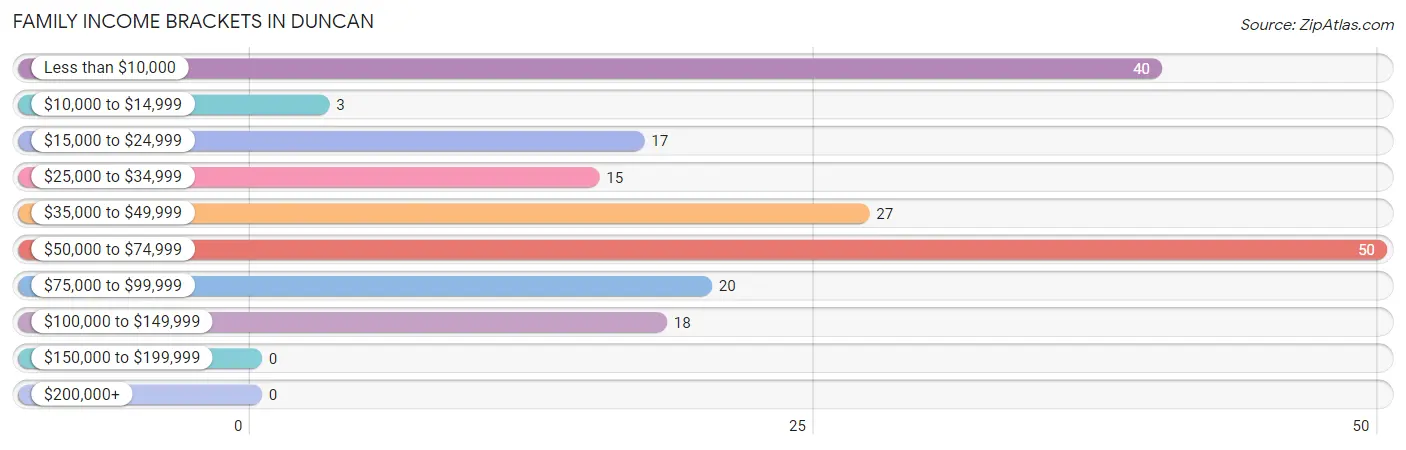
| Income Bracket | # Families | % Families |
| Less than $10,000 | 40 | 21.1% |
| $10,000 to $14,999 | 3 | 1.6% |
| $15,000 to $24,999 | 17 | 8.9% |
| $25,000 to $34,999 | 15 | 7.9% |
| $35,000 to $49,999 | 27 | 14.2% |
| $50,000 to $74,999 | 50 | 26.3% |
| $75,000 to $99,999 | 20 | 10.5% |
| $100,000 to $149,999 | 18 | 9.5% |
| $150,000 to $199,999 | 0 | 0.0% |
| $200,000+ | 0 | 0.0% |
Family Income by Famaliy Size in Duncan
6-person families (21 | 11.1%) account for the highest median family income in Duncan with $77,019 per family, while 2-person families (103 | 54.2%) have the highest median income of $28,312 per family member.
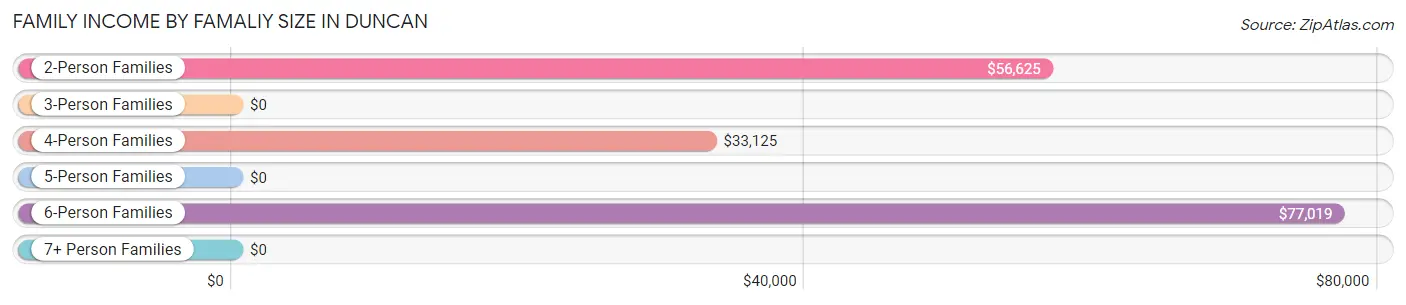
| Income Bracket | # Families | Median Income |
| 2-Person Families | 103 (54.2%) | $56,625 |
| 3-Person Families | 34 (17.9%) | $0 |
| 4-Person Families | 17 (8.9%) | $33,125 |
| 5-Person Families | 0 (0.0%) | $0 |
| 6-Person Families | 21 (11.1%) | $77,019 |
| 7+ Person Families | 15 (7.9%) | $0 |
| Total | 190 (100.0%) | $48,056 |
Family Income by Number of Earners in Duncan
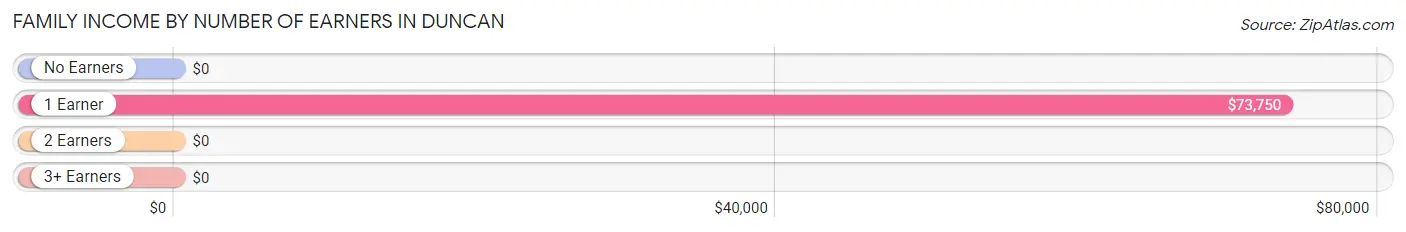
| Number of Earners | # Families | Median Income |
| No Earners | 79 (41.6%) | $0 |
| 1 Earner | 84 (44.2%) | $73,750 |
| 2 Earners | 11 (5.8%) | $0 |
| 3+ Earners | 16 (8.4%) | $0 |
| Total | 190 (100.0%) | $48,056 |
Household Income in Duncan
Household Income Brackets in Duncan
With 65 households falling in the category, the $50,000 to $74,999 income range is the most frequent in Duncan, accounting for 19.6% of all households.
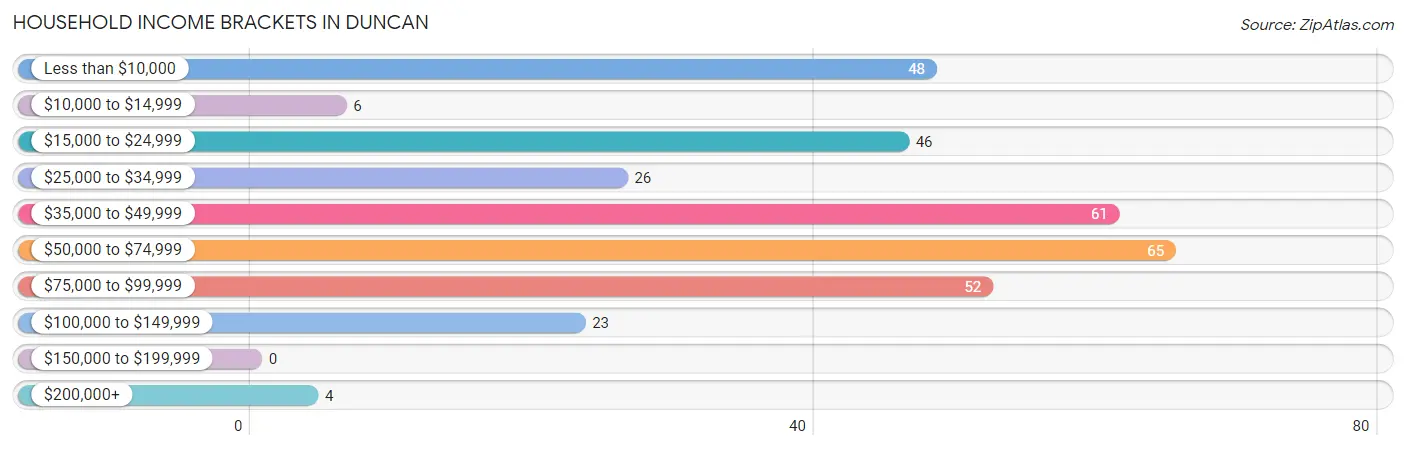
| Income Bracket | # Households | % Households |
| Less than $10,000 | 48 | 14.5% |
| $10,000 to $14,999 | 6 | 1.8% |
| $15,000 to $24,999 | 46 | 13.9% |
| $25,000 to $34,999 | 26 | 7.9% |
| $35,000 to $49,999 | 61 | 18.4% |
| $50,000 to $74,999 | 65 | 19.6% |
| $75,000 to $99,999 | 52 | 15.7% |
| $100,000 to $149,999 | 23 | 6.9% |
| $150,000 to $199,999 | 0 | 0.0% |
| $200,000+ | 4 | 1.2% |
Household Income by Householder Age in Duncan
The median household income in Duncan is $42,969, with the highest median household income of $73,438 found in the 25 to 44 years age bracket for the primary householder. A total of 110 households (33.2%) fall into this category.
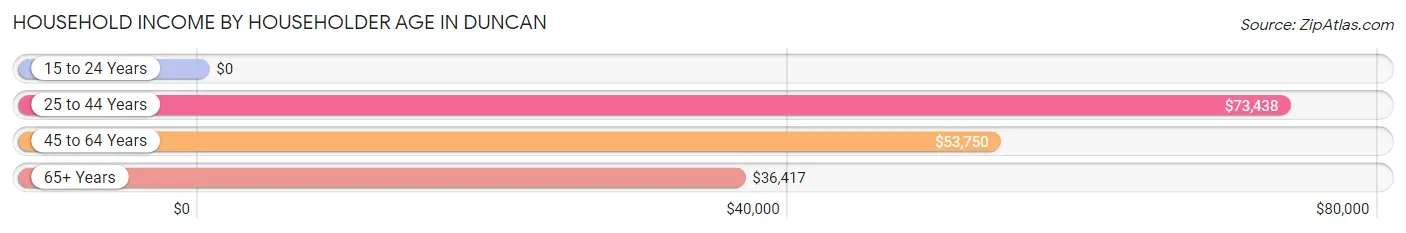
| Income Bracket | # Households | Median Income |
| 15 to 24 Years | 0 (0.0%) | $0 |
| 25 to 44 Years | 110 (33.2%) | $73,438 |
| 45 to 64 Years | 117 (35.3%) | $53,750 |
| 65+ Years | 104 (31.4%) | $36,417 |
| Total | 331 (100.0%) | $42,969 |
Poverty in Duncan
Income Below Poverty by Sex and Age in Duncan
With 30.3% poverty level for males and 38.1% for females among the residents of Duncan, 12 to 14 year old males and 16 and 17 year old females are the most vulnerable to poverty, with 42 males (100.0%) and 13 females (81.2%) in their respective age groups living below the poverty level.
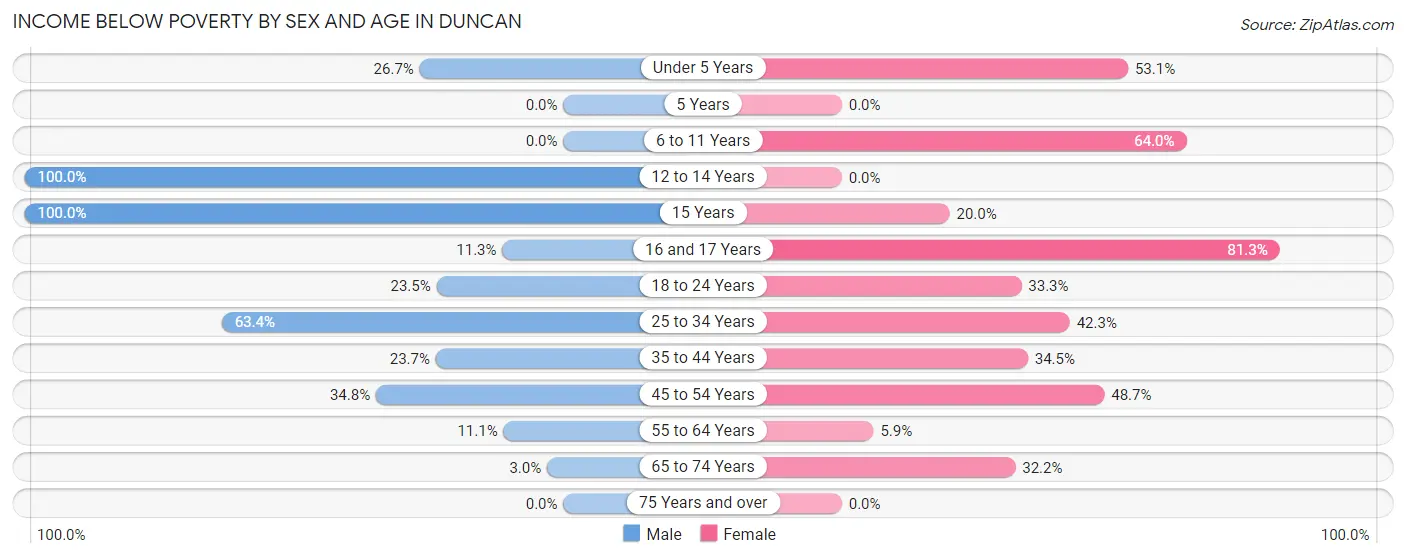
| Age Bracket | Male | Female |
| Under 5 Years | 12 (26.7%) | 17 (53.1%) |
| 5 Years | 0 (0.0%) | 0 (0.0%) |
| 6 to 11 Years | 0 (0.0%) | 55 (63.9%) |
| 12 to 14 Years | 42 (100.0%) | 0 (0.0%) |
| 15 Years | 3 (100.0%) | 1 (20.0%) |
| 16 and 17 Years | 6 (11.3%) | 13 (81.2%) |
| 18 to 24 Years | 8 (23.5%) | 18 (33.3%) |
| 25 to 34 Years | 26 (63.4%) | 11 (42.3%) |
| 35 to 44 Years | 9 (23.7%) | 29 (34.5%) |
| 45 to 54 Years | 8 (34.8%) | 19 (48.7%) |
| 55 to 64 Years | 5 (11.1%) | 2 (5.9%) |
| 65 to 74 Years | 1 (3.0%) | 19 (32.2%) |
| 75 Years and over | 0 (0.0%) | 0 (0.0%) |
| Total | 120 (30.3%) | 184 (38.1%) |
Income Above Poverty by Sex and Age in Duncan
According to the poverty statistics in Duncan, males aged 6 to 11 years and females aged 12 to 14 years are the age groups that are most secure financially, with 100.0% of males and 100.0% of females in these age groups living above the poverty line.
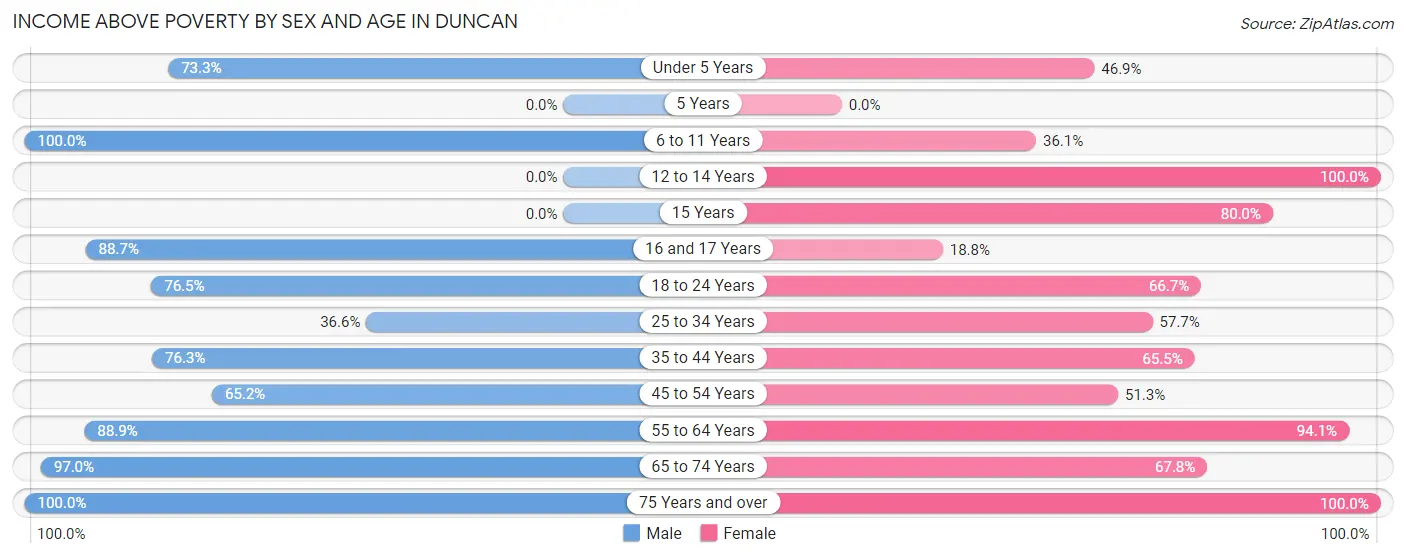
| Age Bracket | Male | Female |
| Under 5 Years | 33 (73.3%) | 15 (46.9%) |
| 5 Years | 0 (0.0%) | 0 (0.0%) |
| 6 to 11 Years | 5 (100.0%) | 31 (36.0%) |
| 12 to 14 Years | 0 (0.0%) | 16 (100.0%) |
| 15 Years | 0 (0.0%) | 4 (80.0%) |
| 16 and 17 Years | 47 (88.7%) | 3 (18.8%) |
| 18 to 24 Years | 26 (76.5%) | 36 (66.7%) |
| 25 to 34 Years | 15 (36.6%) | 15 (57.7%) |
| 35 to 44 Years | 29 (76.3%) | 55 (65.5%) |
| 45 to 54 Years | 15 (65.2%) | 20 (51.3%) |
| 55 to 64 Years | 40 (88.9%) | 32 (94.1%) |
| 65 to 74 Years | 32 (97.0%) | 40 (67.8%) |
| 75 Years and over | 34 (100.0%) | 32 (100.0%) |
| Total | 276 (69.7%) | 299 (61.9%) |
Income Below Poverty Among Married-Couple Families in Duncan
The poverty statistics for married-couple families in Duncan show that 28.2% or 29 of the total 103 families live below the poverty line. Families with 5 or more children have the highest poverty rate of 100.0%, comprising of 14 families. On the other hand, families with 3 or 4 children have the lowest poverty rate of 0.0%, which includes 0 families.
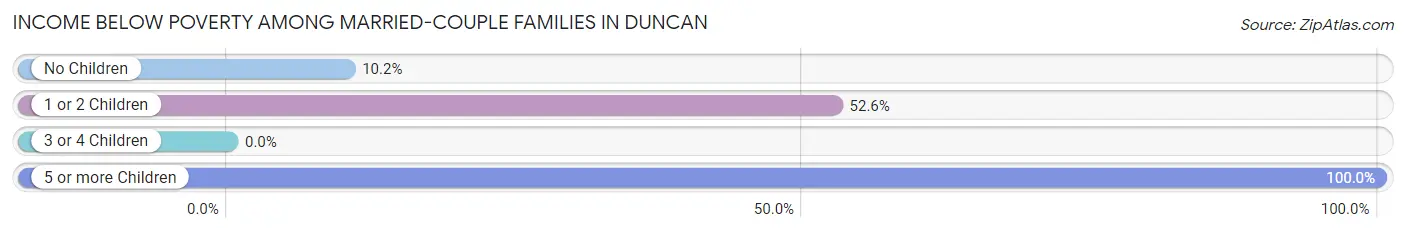
| Children | Above Poverty | Below Poverty |
| No Children | 44 (89.8%) | 5 (10.2%) |
| 1 or 2 Children | 9 (47.4%) | 10 (52.6%) |
| 3 or 4 Children | 21 (100.0%) | 0 (0.0%) |
| 5 or more Children | 0 (0.0%) | 14 (100.0%) |
| Total | 74 (71.8%) | 29 (28.2%) |
Income Below Poverty Among Single-Parent Households in Duncan
According to the poverty data in Duncan, 33.3% or 3 single-father households and 34.6% or 27 single-mother households are living below the poverty line. Among single-father households, those with 1 or 2 children have the highest poverty rate, with 3 households (42.9%) experiencing poverty. Likewise, among single-mother households, those with 5 or more children have the highest poverty rate, with 1 households (100.0%) falling below the poverty line.
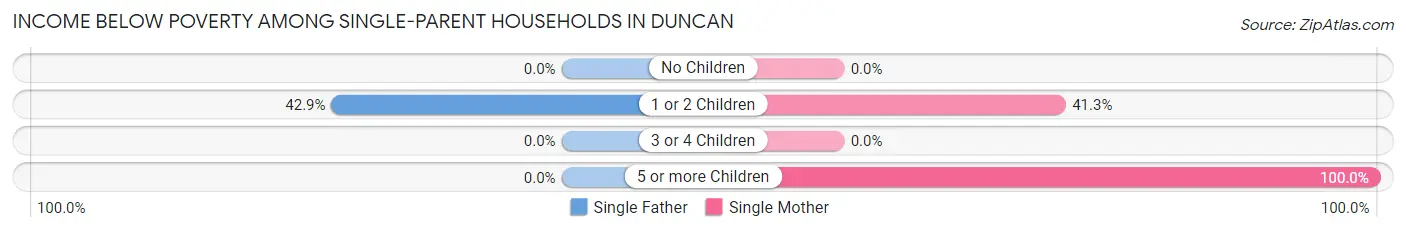
| Children | Single Father | Single Mother |
| No Children | 0 (0.0%) | 0 (0.0%) |
| 1 or 2 Children | 3 (42.9%) | 26 (41.3%) |
| 3 or 4 Children | 0 (0.0%) | 0 (0.0%) |
| 5 or more Children | 0 (0.0%) | 1 (100.0%) |
| Total | 3 (33.3%) | 27 (34.6%) |
Income Below Poverty Among Married-Couple vs Single-Parent Households in Duncan
The poverty data for Duncan shows that 29 of the married-couple family households (28.2%) and 30 of the single-parent households (34.5%) are living below the poverty level. Within the married-couple family households, those with 5 or more children have the highest poverty rate, with 14 households (100.0%) falling below the poverty line. Among the single-parent households, those with 5 or more children have the highest poverty rate, with 1 household (100.0%) living below poverty.
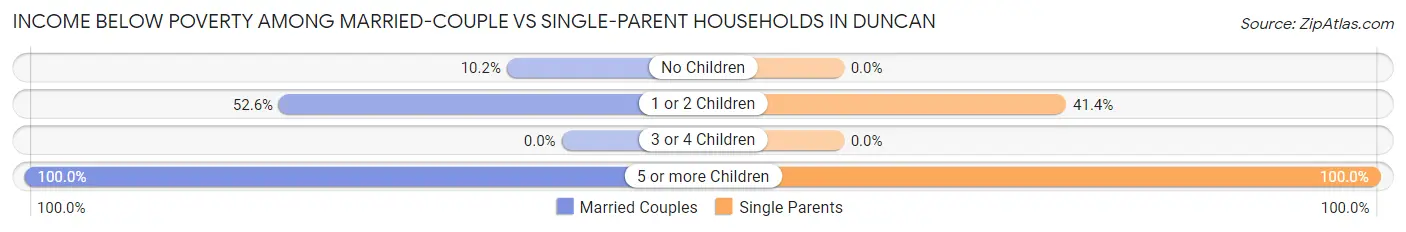
| Children | Married-Couple Families | Single-Parent Households |
| No Children | 5 (10.2%) | 0 (0.0%) |
| 1 or 2 Children | 10 (52.6%) | 29 (41.4%) |
| 3 or 4 Children | 0 (0.0%) | 0 (0.0%) |
| 5 or more Children | 14 (100.0%) | 1 (100.0%) |
| Total | 29 (28.2%) | 30 (34.5%) |
Race in Duncan
The most populous races in Duncan are White / Caucasian (654 | 74.4%), Hispanic or Latino (287 | 32.7%), and Two or more Races (184 | 20.9%).
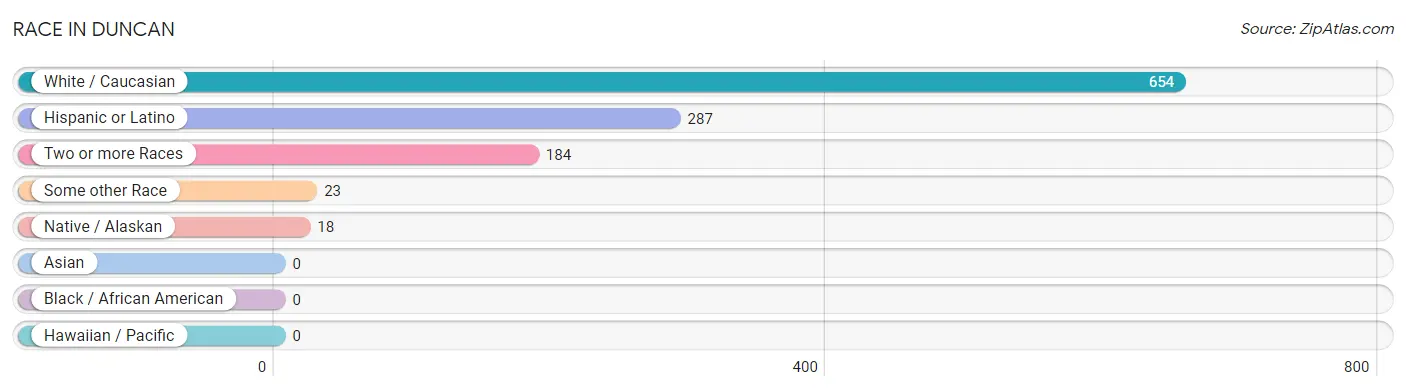
| Race | # Population | % Population |
| Asian | 0 | 0.0% |
| Black / African American | 0 | 0.0% |
| Hawaiian / Pacific | 0 | 0.0% |
| Hispanic or Latino | 287 | 32.7% |
| Native / Alaskan | 18 | 2.1% |
| White / Caucasian | 654 | 74.4% |
| Two or more Races | 184 | 20.9% |
| Some other Race | 23 | 2.6% |
| Total | 879 | 100.0% |
Ancestry in Duncan
The most populous ancestries reported in Duncan are Mexican (281 | 32.0%), English (98 | 11.2%), Irish (43 | 4.9%), Scottish (33 | 3.7%), and American (16 | 1.8%), together accounting for 53.6% of all Duncan residents.
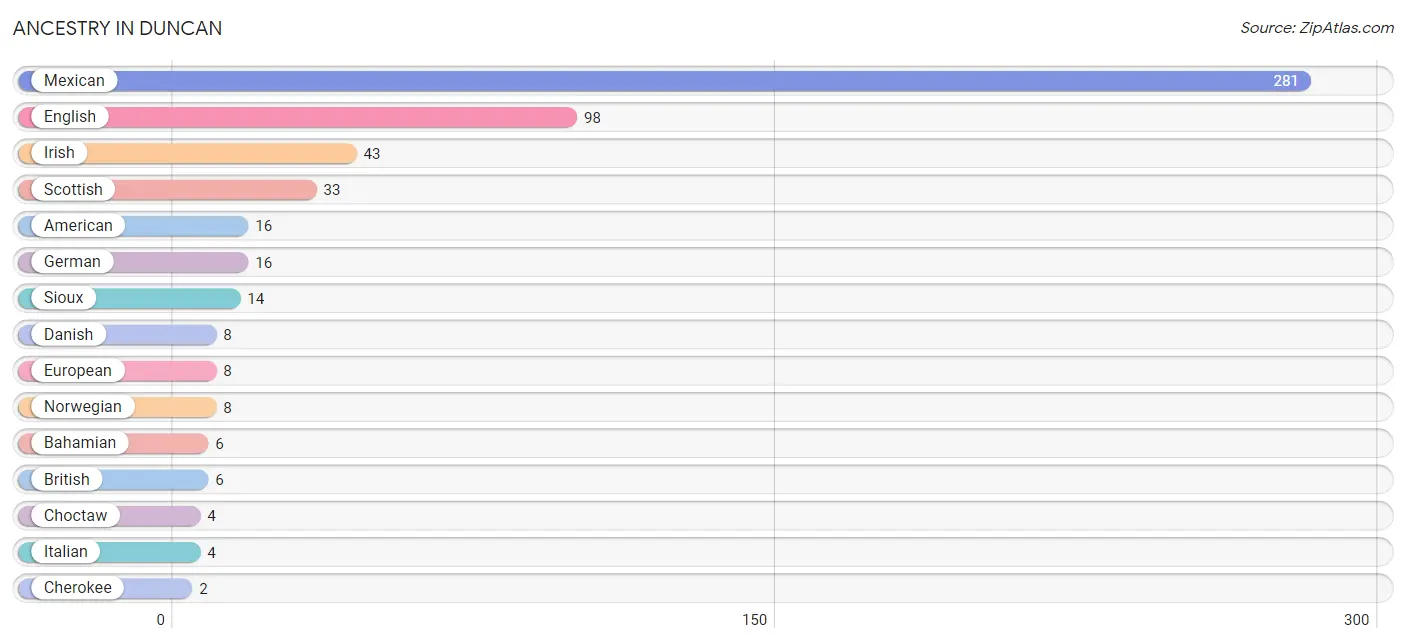
| Ancestry | # Population | % Population |
| American | 16 | 1.8% |
| Arab | 1 | 0.1% |
| Bahamian | 6 | 0.7% |
| British | 6 | 0.7% |
| Cherokee | 2 | 0.2% |
| Choctaw | 4 | 0.5% |
| Danish | 8 | 0.9% |
| Dutch | 2 | 0.2% |
| English | 98 | 11.2% |
| European | 8 | 0.9% |
| German | 16 | 1.8% |
| Irish | 43 | 4.9% |
| Italian | 4 | 0.5% |
| Lebanese | 1 | 0.1% |
| Mexican | 281 | 32.0% |
| Norwegian | 8 | 0.9% |
| Scotch-Irish | 1 | 0.1% |
| Scottish | 33 | 3.7% |
| Sioux | 14 | 1.6% | View All 19 Rows |
Immigrants in Duncan

| Immigration Origin | # Population | % Population | View All 0 Rows |
Sex and Age in Duncan
Sex and Age in Duncan
The most populous age groups in Duncan are 15 to 19 Years (76 | 19.2%) for men and 10 to 14 Years (67 | 13.9%) for women.
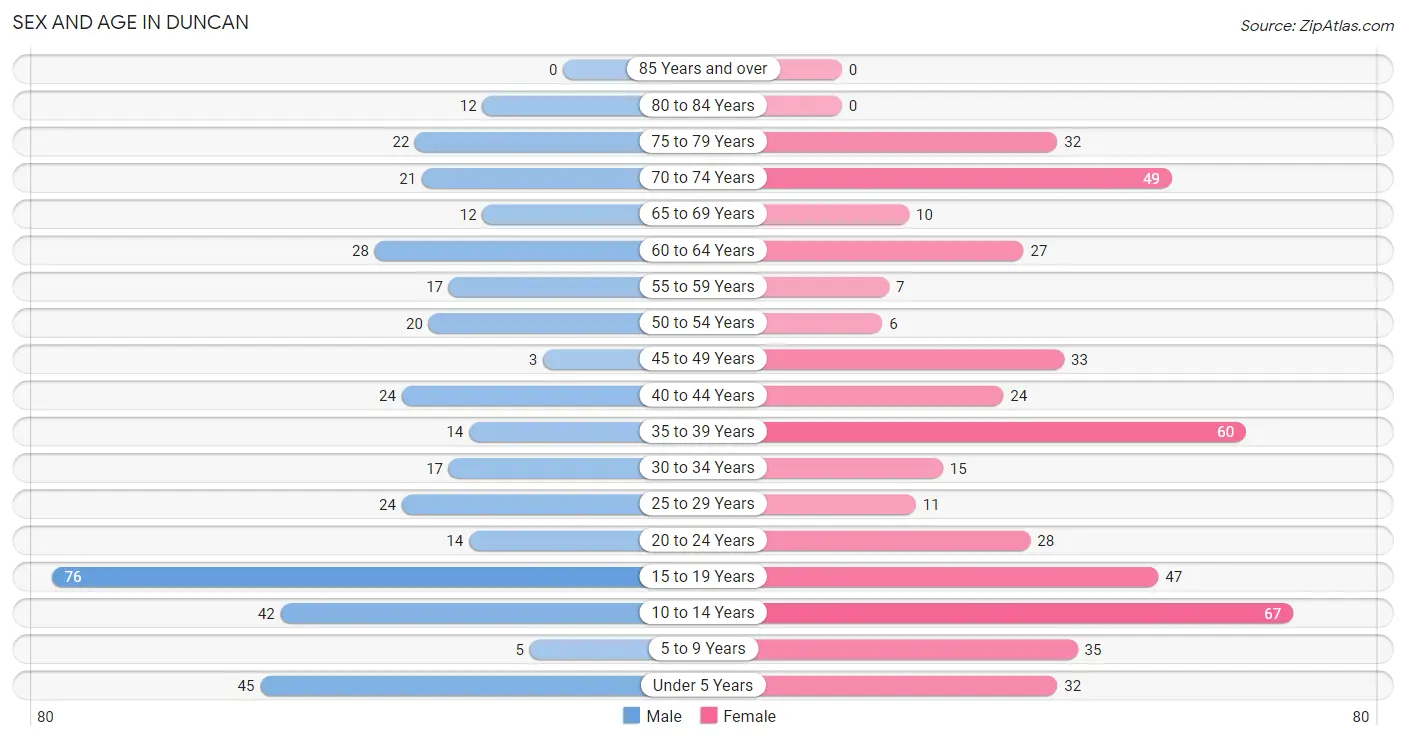
| Age Bracket | Male | Female |
| Under 5 Years | 45 (11.4%) | 32 (6.6%) |
| 5 to 9 Years | 5 (1.3%) | 35 (7.2%) |
| 10 to 14 Years | 42 (10.6%) | 67 (13.9%) |
| 15 to 19 Years | 76 (19.2%) | 47 (9.7%) |
| 20 to 24 Years | 14 (3.5%) | 28 (5.8%) |
| 25 to 29 Years | 24 (6.1%) | 11 (2.3%) |
| 30 to 34 Years | 17 (4.3%) | 15 (3.1%) |
| 35 to 39 Years | 14 (3.5%) | 60 (12.4%) |
| 40 to 44 Years | 24 (6.1%) | 24 (5.0%) |
| 45 to 49 Years | 3 (0.8%) | 33 (6.8%) |
| 50 to 54 Years | 20 (5.1%) | 6 (1.2%) |
| 55 to 59 Years | 17 (4.3%) | 7 (1.5%) |
| 60 to 64 Years | 28 (7.1%) | 27 (5.6%) |
| 65 to 69 Years | 12 (3.0%) | 10 (2.1%) |
| 70 to 74 Years | 21 (5.3%) | 49 (10.1%) |
| 75 to 79 Years | 22 (5.6%) | 32 (6.6%) |
| 80 to 84 Years | 12 (3.0%) | 0 (0.0%) |
| 85 Years and over | 0 (0.0%) | 0 (0.0%) |
| Total | 396 (100.0%) | 483 (100.0%) |
Families and Households in Duncan
Median Family Size in Duncan
The median family size in Duncan is 3.77 persons per family, with married-couple families (103 | 54.2%) accounting for the largest median family size of 4.61 persons per family. On the other hand, single female/mother families (78 | 41.0%) represent the smallest median family size with 2.56 persons per family.
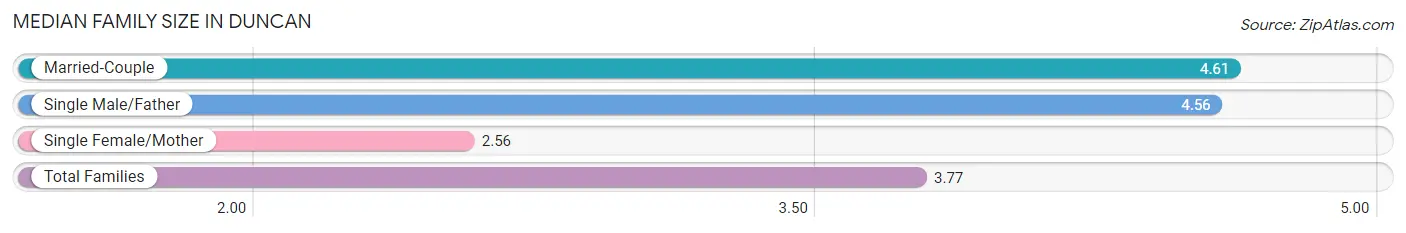
| Family Type | # Families | Family Size |
| Married-Couple | 103 (54.2%) | 4.61 |
| Single Male/Father | 9 (4.7%) | 4.56 |
| Single Female/Mother | 78 (41.0%) | 2.56 |
| Total Families | 190 (100.0%) | 3.77 |
Median Household Size in Duncan
The median household size in Duncan is 2.66 persons per household, with single male/father households (9 | 2.7%) accounting for the largest median household size of 5.56 persons per household. non-family households (141 | 42.6%) represent the smallest median household size with 1.05 persons per household.
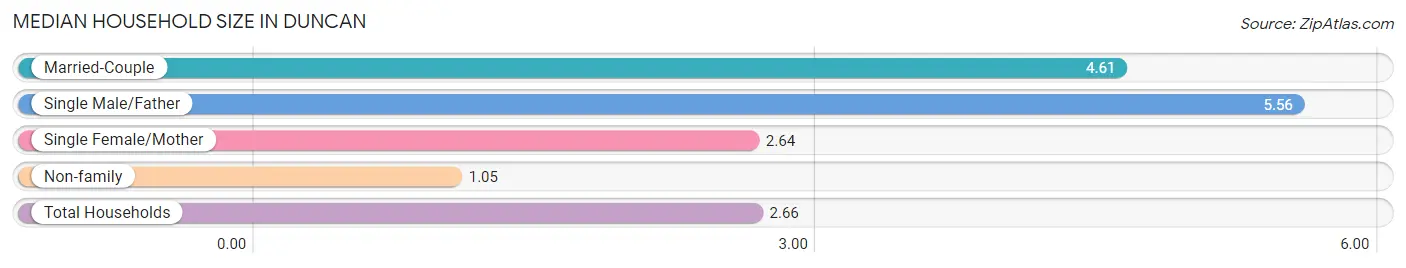
| Household Type | # Households | Household Size |
| Married-Couple | 103 (31.1%) | 4.61 |
| Single Male/Father | 9 (2.7%) | 5.56 |
| Single Female/Mother | 78 (23.6%) | 2.64 |
| Non-family | 141 (42.6%) | 1.05 |
| Total Households | 331 (100.0%) | 2.66 |
Household Size by Marriage Status in Duncan
Out of a total of 331 households in Duncan, 190 (57.4%) are family households, while 141 (42.6%) are nonfamily households. The most numerous type of family households are 2-person households, comprising 99, and the most common type of nonfamily households are 1-person households, comprising 132.
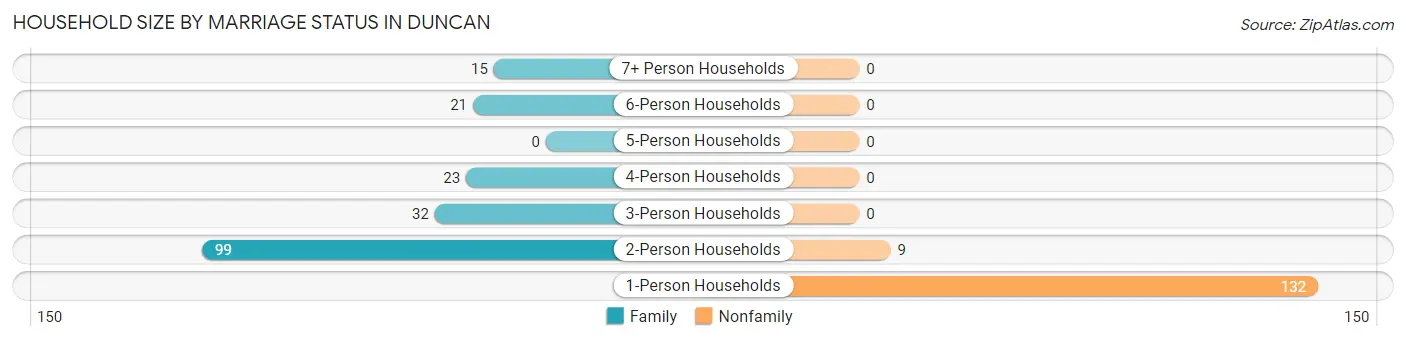
| Household Size | Family Households | Nonfamily Households |
| 1-Person Households | - | 132 (39.9%) |
| 2-Person Households | 99 (29.9%) | 9 (2.7%) |
| 3-Person Households | 32 (9.7%) | 0 (0.0%) |
| 4-Person Households | 23 (7.0%) | 0 (0.0%) |
| 5-Person Households | 0 (0.0%) | 0 (0.0%) |
| 6-Person Households | 21 (6.3%) | 0 (0.0%) |
| 7+ Person Households | 15 (4.5%) | 0 (0.0%) |
| Total | 190 (57.4%) | 141 (42.6%) |
Female Fertility in Duncan
Fertility by Age in Duncan
Average fertility rate in Duncan is 37.0 births per 1,000 women. Women in the age bracket of 20 to 34 years have the highest fertility rate with 148.0 births per 1,000 women. Women in the age bracket of 20 to 34 years acount for 100.0% of all women with births.
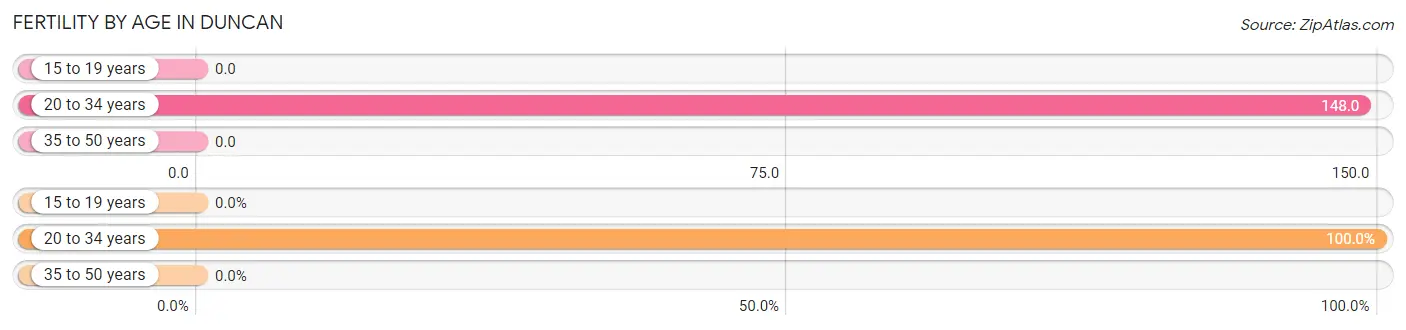
| Age Bracket | Women with Births | Births / 1,000 Women |
| 15 to 19 years | 0 (0.0%) | 0.0 |
| 20 to 34 years | 8 (100.0%) | 148.0 |
| 35 to 50 years | 0 (0.0%) | 0.0 |
| Total | 8 (100.0%) | 37.0 |
Fertility by Age by Marriage Status in Duncan
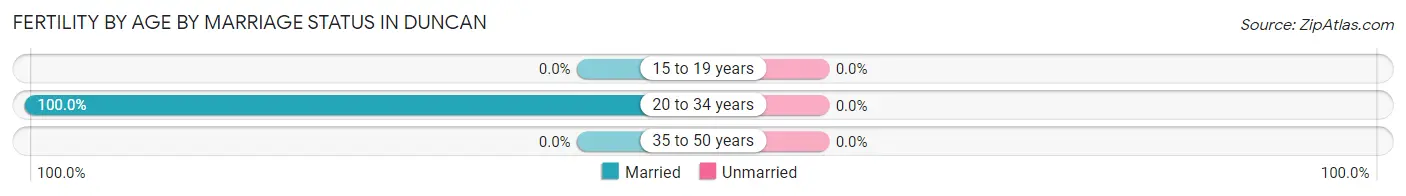
| Age Bracket | Married | Unmarried |
| 15 to 19 years | 0 (0.0%) | 0 (0.0%) |
| 20 to 34 years | 8 (100.0%) | 0 (0.0%) |
| 35 to 50 years | 0 (0.0%) | 0 (0.0%) |
| Total | 8 (100.0%) | 0 (0.0%) |
Fertility by Education in Duncan
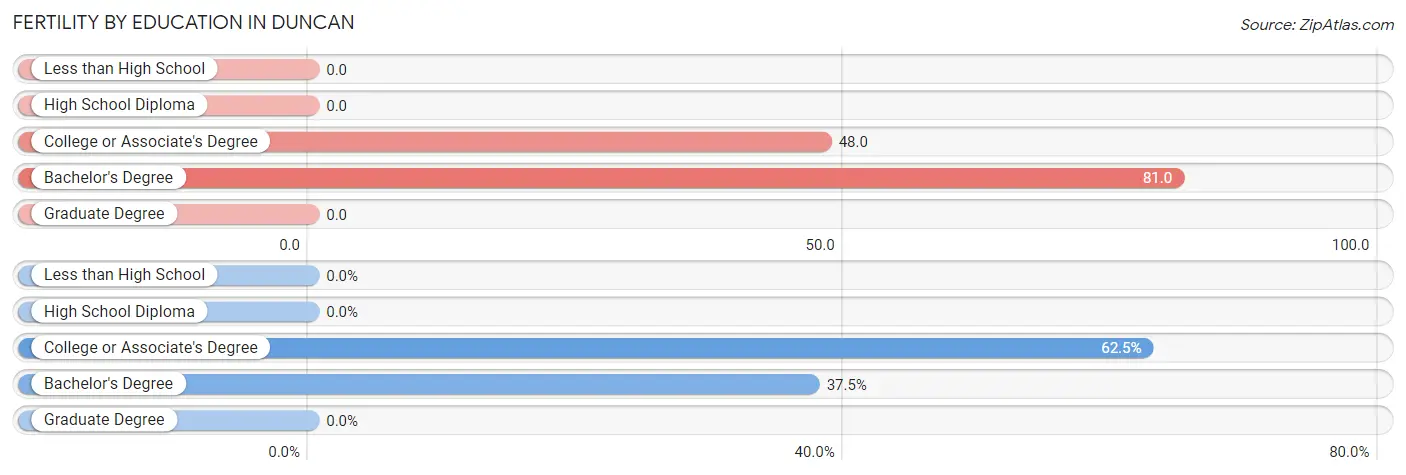
| Educational Attainment | Women with Births | Births / 1,000 Women |
| Less than High School | 0 (0.0%) | 0.0 |
| High School Diploma | 0 (0.0%) | 0.0 |
| College or Associate's Degree | 5 (62.5%) | 48.0 |
| Bachelor's Degree | 3 (37.5%) | 81.0 |
| Graduate Degree | 0 (0.0%) | 0.0 |
| Total | 8 (100.0%) | 37.0 |
Fertility by Education by Marriage Status in Duncan
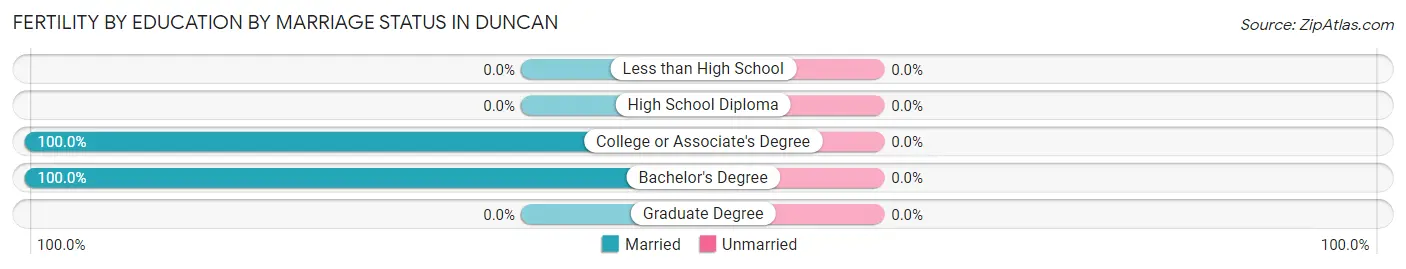
| Educational Attainment | Married | Unmarried |
| Less than High School | 0 (0.0%) | 0 (0.0%) |
| High School Diploma | 0 (0.0%) | 0 (0.0%) |
| College or Associate's Degree | 5 (100.0%) | 0 (0.0%) |
| Bachelor's Degree | 3 (100.0%) | 0 (0.0%) |
| Graduate Degree | 0 (0.0%) | 0 (0.0%) |
| Total | 8 (100.0%) | 0 (0.0%) |
Employment Characteristics in Duncan
Employment by Class of Employer in Duncan
Among the 210 employed individuals in Duncan, private company employees (90 | 42.9%), not-for-profit organizations (50 | 23.8%), and state government employees (25 | 11.9%) make up the most common classes of employment.
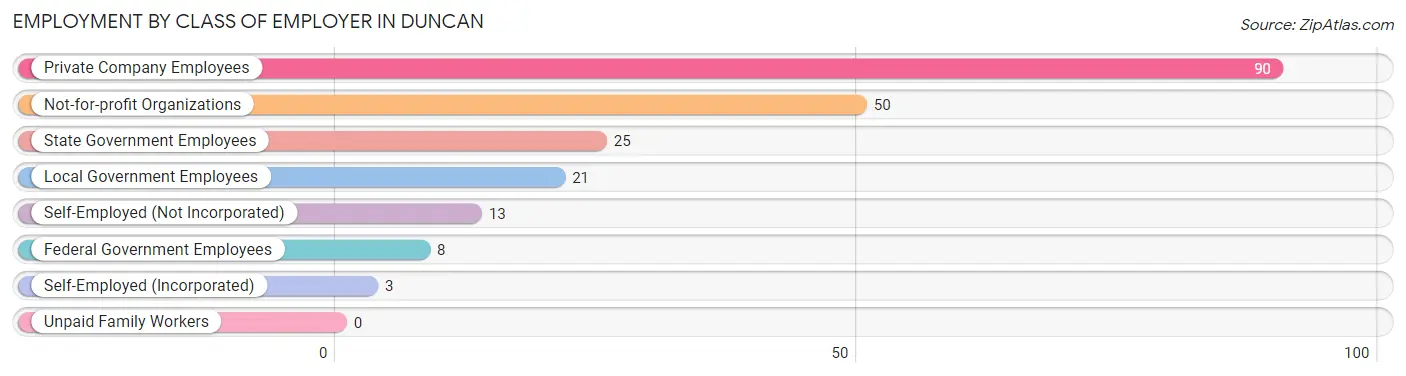
| Employer Class | # Employees | % Employees |
| Private Company Employees | 90 | 42.9% |
| Self-Employed (Incorporated) | 3 | 1.4% |
| Self-Employed (Not Incorporated) | 13 | 6.2% |
| Not-for-profit Organizations | 50 | 23.8% |
| Local Government Employees | 21 | 10.0% |
| State Government Employees | 25 | 11.9% |
| Federal Government Employees | 8 | 3.8% |
| Unpaid Family Workers | 0 | 0.0% |
| Total | 210 | 100.0% |
Employment Status by Age in Duncan
According to the labor force statistics for Duncan, out of the total population over 16 years of age (645), 35.7% or 230 individuals are in the labor force, with 8.7% or 20 of them unemployed. The age group with the highest labor force participation rate is 30 to 34 years, with 78.1% or 25 individuals in the labor force. Within the labor force, the 55 to 59 years age range has the highest percentage of unemployed individuals, with 22.2% or 4 of them being unemployed.
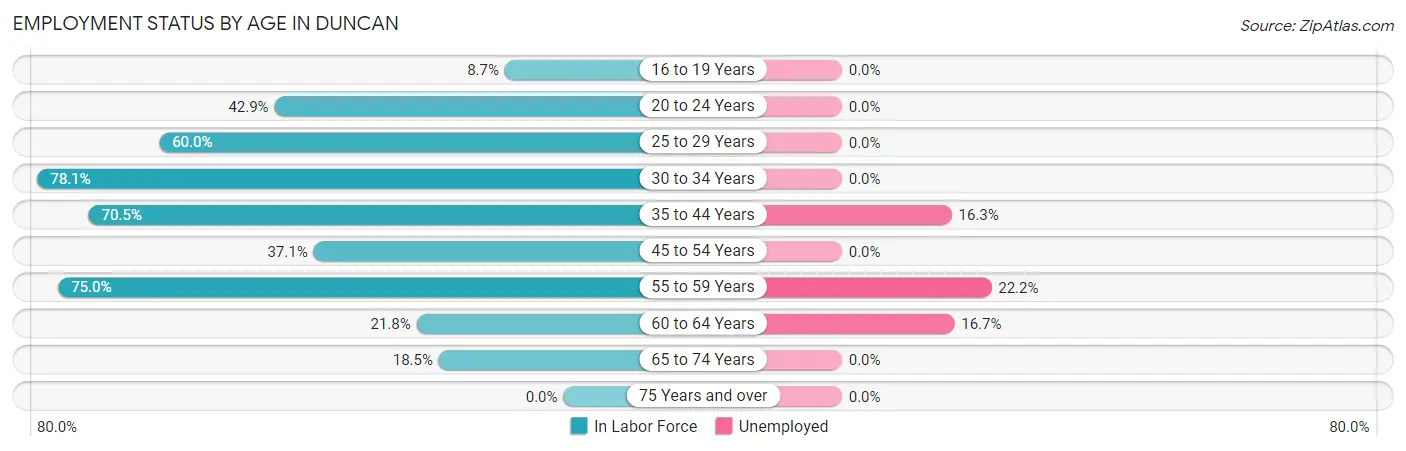
| Age Bracket | In Labor Force | Unemployed |
| 16 to 19 Years | 10 (8.7%) | 0 (0.0%) |
| 20 to 24 Years | 18 (42.9%) | 0 (0.0%) |
| 25 to 29 Years | 21 (60.0%) | 0 (0.0%) |
| 30 to 34 Years | 25 (78.1%) | 0 (0.0%) |
| 35 to 44 Years | 86 (70.5%) | 14 (16.3%) |
| 45 to 54 Years | 23 (37.1%) | 0 (0.0%) |
| 55 to 59 Years | 18 (75.0%) | 4 (22.2%) |
| 60 to 64 Years | 12 (21.8%) | 2 (16.7%) |
| 65 to 74 Years | 17 (18.5%) | 0 (0.0%) |
| 75 Years and over | 0 (0.0%) | 0 (0.0%) |
| Total | 230 (35.7%) | 20 (8.7%) |
Employment Status by Educational Attainment in Duncan
According to labor force statistics for Duncan, 56.1% of individuals (185) out of the total population between 25 and 64 years of age (330) are in the labor force, with 10.8% or 20 of them being unemployed. The group with the highest labor force participation rate are those with the educational attainment of bachelor's degree or higher, with 82.4% or 56 individuals in the labor force. Within the labor force, individuals with less than high school education have the highest percentage of unemployment, with 72.0% or 18 of them being unemployed.
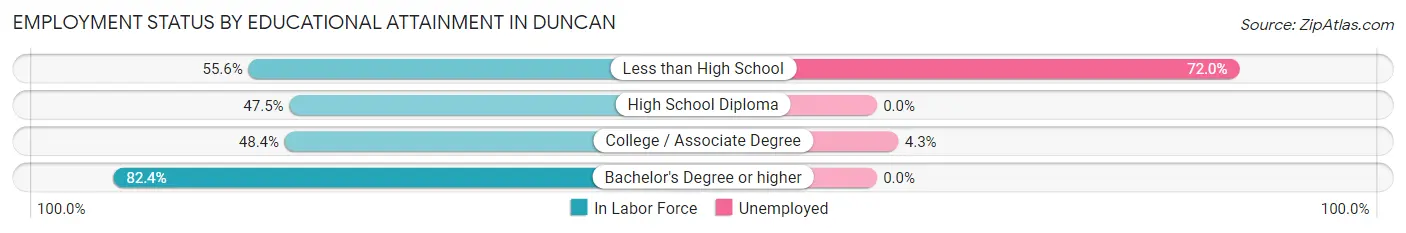
| Educational Attainment | In Labor Force | Unemployed |
| Less than High School | 25 (55.6%) | 32 (72.0%) |
| High School Diploma | 58 (47.5%) | 0 (0.0%) |
| College / Associate Degree | 46 (48.4%) | 4 (4.3%) |
| Bachelor's Degree or higher | 56 (82.4%) | 0 (0.0%) |
| Total | 185 (56.1%) | 36 (10.8%) |
Employment Occupations by Sex in Duncan
Management, Business, Science and Arts Occupations
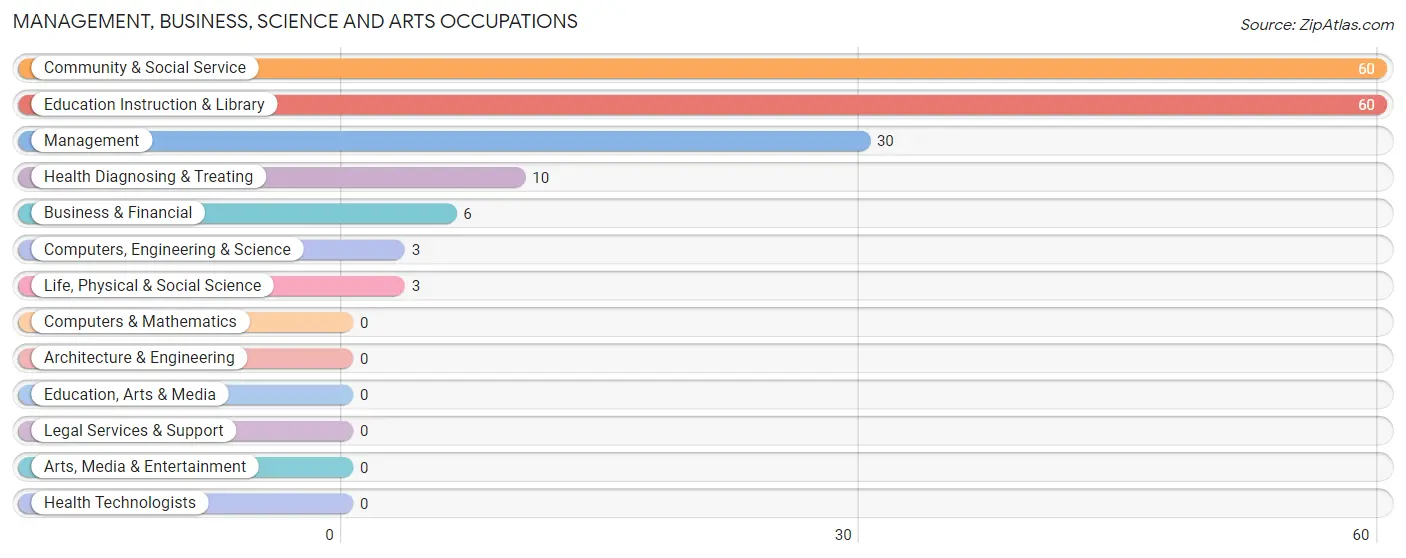
The most common Management, Business, Science and Arts occupations in Duncan are Community & Social Service (60 | 28.6%), Education Instruction & Library (60 | 28.6%), Management (30 | 14.3%), Health Diagnosing & Treating (10 | 4.8%), and Business & Financial (6 | 2.9%).
Management, Business, Science and Arts Occupations by Sex
Within the Management, Business, Science and Arts occupations in Duncan, the most male-oriented occupations are Health Diagnosing & Treating (100.0%), Management (66.7%), and Business & Financial (33.3%), while the most female-oriented occupations are Computers, Engineering & Science (100.0%), Life, Physical & Social Science (100.0%), and Community & Social Service (96.7%).
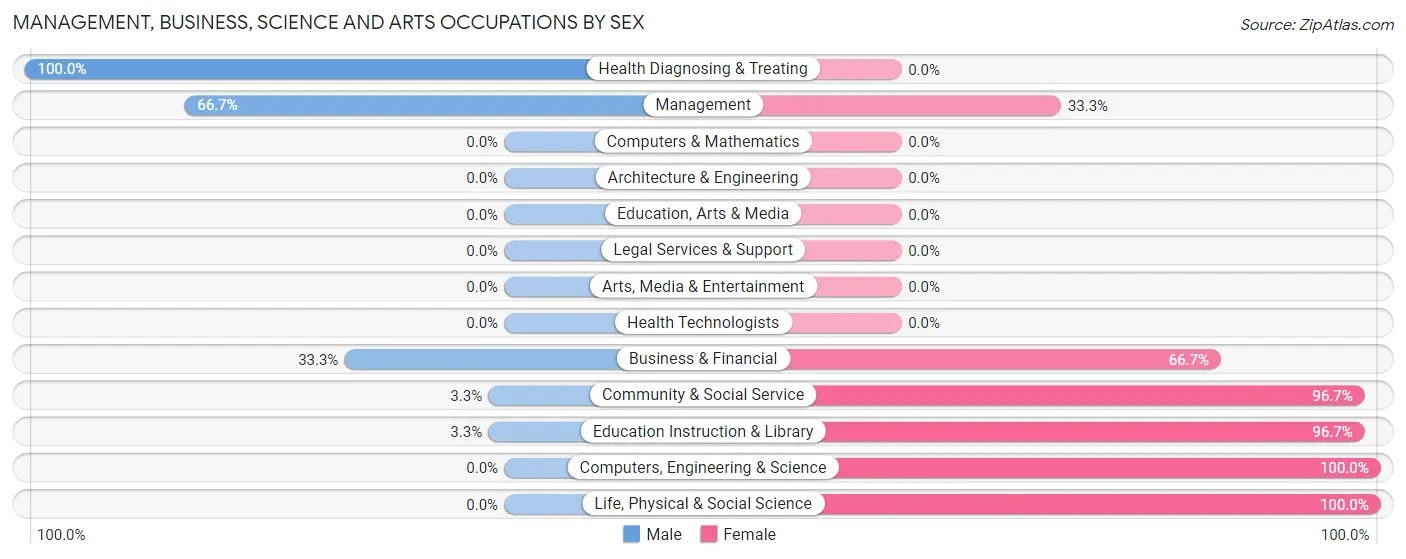
| Occupation | Male | Female |
| Management | 20 (66.7%) | 10 (33.3%) |
| Business & Financial | 2 (33.3%) | 4 (66.7%) |
| Computers, Engineering & Science | 0 (0.0%) | 3 (100.0%) |
| Computers & Mathematics | 0 (0.0%) | 0 (0.0%) |
| Architecture & Engineering | 0 (0.0%) | 0 (0.0%) |
| Life, Physical & Social Science | 0 (0.0%) | 3 (100.0%) |
| Community & Social Service | 2 (3.3%) | 58 (96.7%) |
| Education, Arts & Media | 0 (0.0%) | 0 (0.0%) |
| Legal Services & Support | 0 (0.0%) | 0 (0.0%) |
| Education Instruction & Library | 2 (3.3%) | 58 (96.7%) |
| Arts, Media & Entertainment | 0 (0.0%) | 0 (0.0%) |
| Health Diagnosing & Treating | 10 (100.0%) | 0 (0.0%) |
| Health Technologists | 0 (0.0%) | 0 (0.0%) |
| Total (Category) | 34 (31.2%) | 75 (68.8%) |
| Total (Overall) | 108 (51.4%) | 102 (48.6%) |
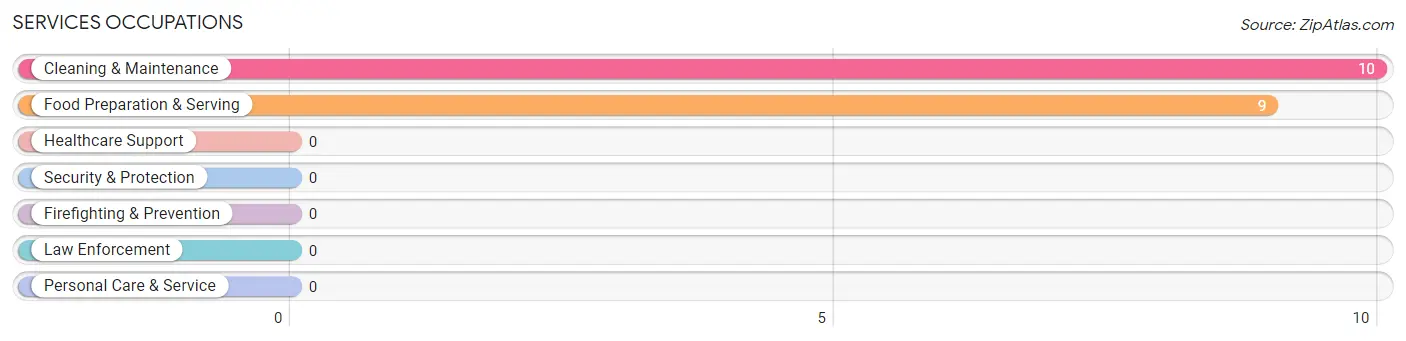
Services Occupations
The most common Services occupations in Duncan are Cleaning & Maintenance (10 | 4.8%), and Food Preparation & Serving (9 | 4.3%).
Services Occupations by Sex
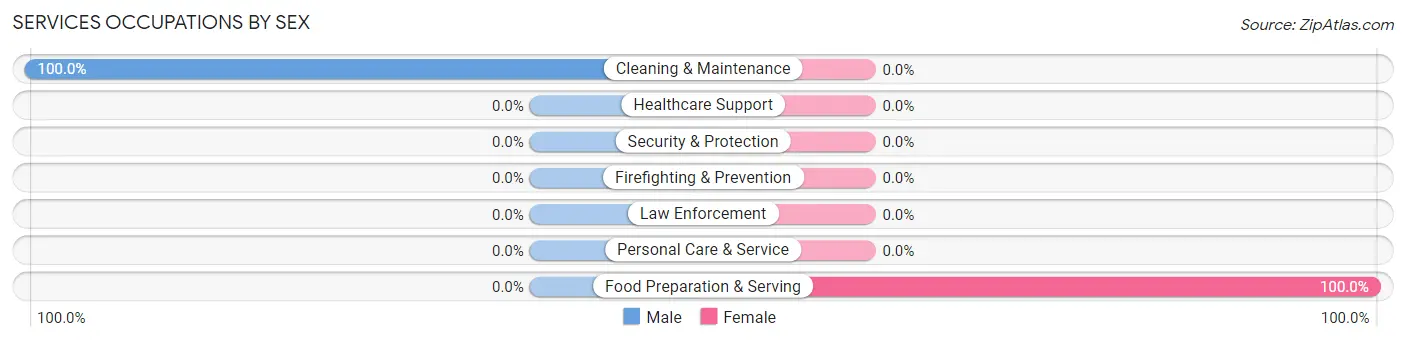
| Occupation | Male | Female |
| Healthcare Support | 0 (0.0%) | 0 (0.0%) |
| Security & Protection | 0 (0.0%) | 0 (0.0%) |
| Firefighting & Prevention | 0 (0.0%) | 0 (0.0%) |
| Law Enforcement | 0 (0.0%) | 0 (0.0%) |
| Food Preparation & Serving | 0 (0.0%) | 9 (100.0%) |
| Cleaning & Maintenance | 10 (100.0%) | 0 (0.0%) |
| Personal Care & Service | 0 (0.0%) | 0 (0.0%) |
| Total (Category) | 10 (52.6%) | 9 (47.4%) |
| Total (Overall) | 108 (51.4%) | 102 (48.6%) |
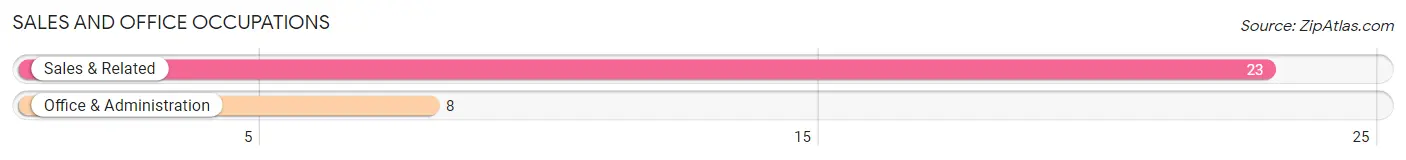
Sales and Office Occupations
The most common Sales and Office occupations in Duncan are Sales & Related (23 | 11.0%), and Office & Administration (8 | 3.8%).
Sales and Office Occupations by Sex
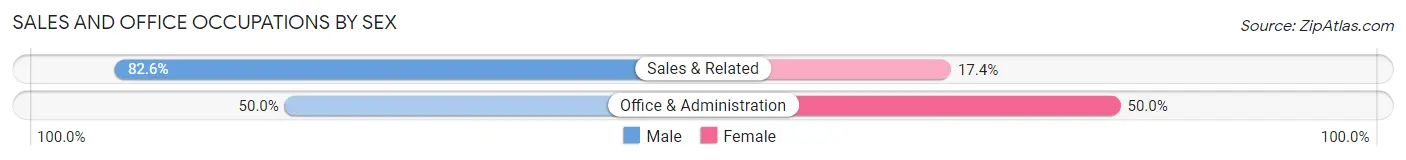
| Occupation | Male | Female |
| Sales & Related | 19 (82.6%) | 4 (17.4%) |
| Office & Administration | 4 (50.0%) | 4 (50.0%) |
| Total (Category) | 23 (74.2%) | 8 (25.8%) |
| Total (Overall) | 108 (51.4%) | 102 (48.6%) |
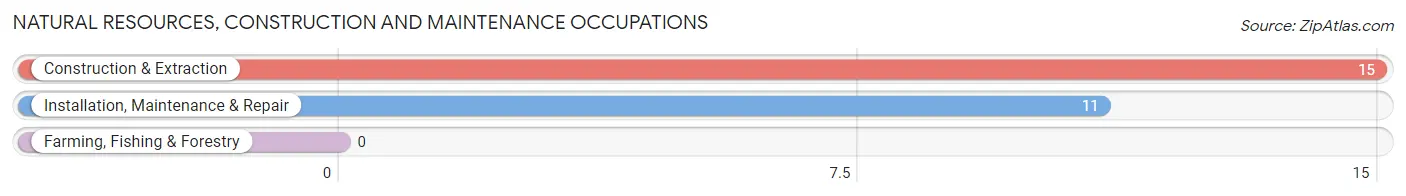
Natural Resources, Construction and Maintenance Occupations
The most common Natural Resources, Construction and Maintenance occupations in Duncan are Construction & Extraction (15 | 7.1%), and Installation, Maintenance & Repair (11 | 5.2%).
Natural Resources, Construction and Maintenance Occupations by Sex
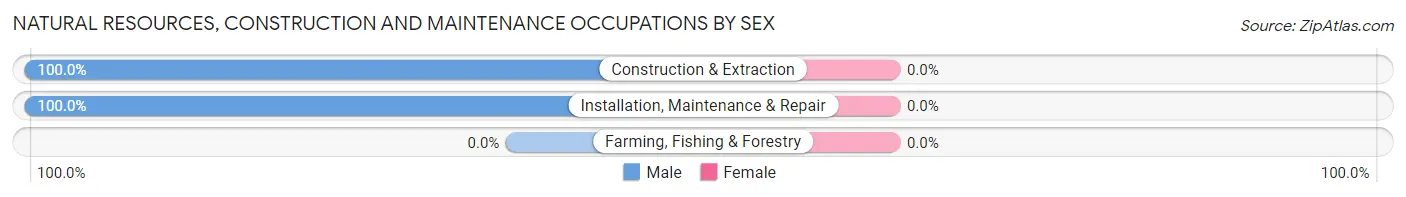
| Occupation | Male | Female |
| Farming, Fishing & Forestry | 0 (0.0%) | 0 (0.0%) |
| Construction & Extraction | 15 (100.0%) | 0 (0.0%) |
| Installation, Maintenance & Repair | 11 (100.0%) | 0 (0.0%) |
| Total (Category) | 26 (100.0%) | 0 (0.0%) |
| Total (Overall) | 108 (51.4%) | 102 (48.6%) |
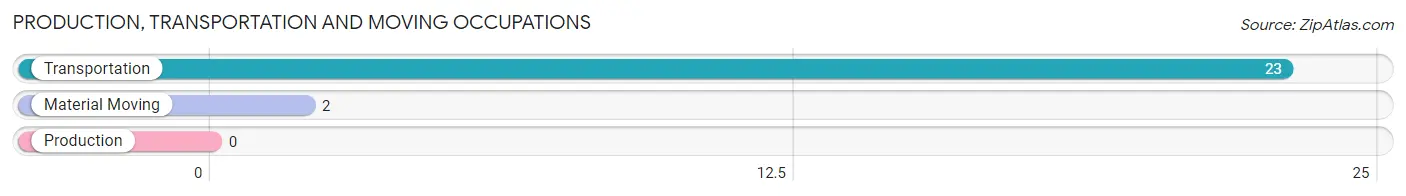
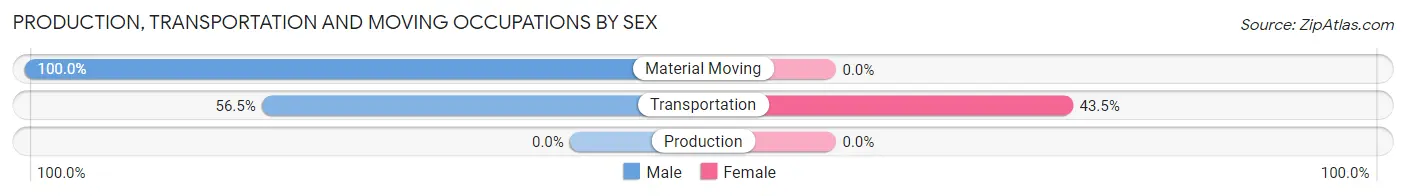
Production, Transportation and Moving Occupations
The most common Production, Transportation and Moving occupations in Duncan are Transportation (23 | 11.0%), and Material Moving (2 | 0.9%).
Production, Transportation and Moving Occupations by Sex
| Occupation | Male | Female |
| Production | 0 (0.0%) | 0 (0.0%) |
| Transportation | 13 (56.5%) | 10 (43.5%) |
| Material Moving | 2 (100.0%) | 0 (0.0%) |
| Total (Category) | 15 (60.0%) | 10 (40.0%) |
| Total (Overall) | 108 (51.4%) | 102 (48.6%) |
Employment Industries by Sex in Duncan
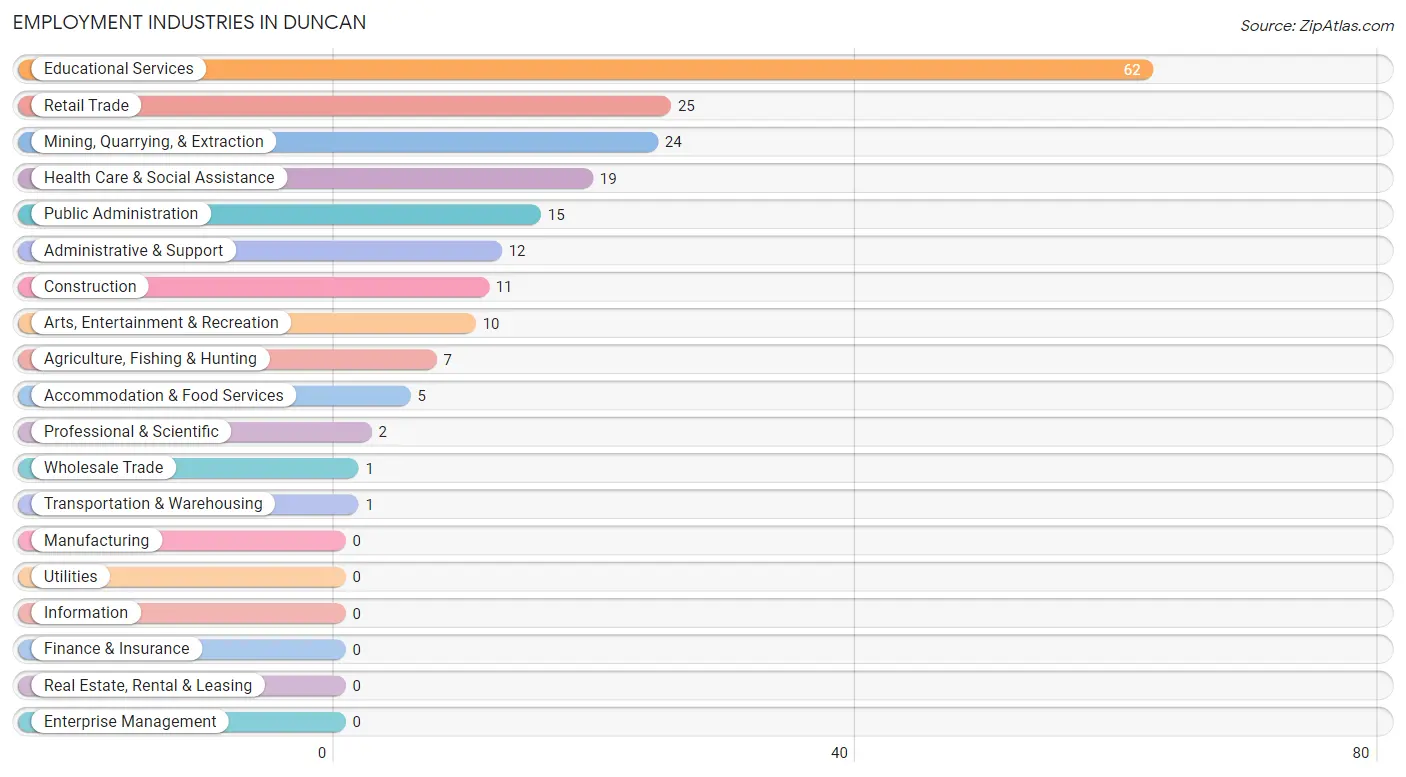
Employment Industries in Duncan
The major employment industries in Duncan include Educational Services (62 | 29.5%), Retail Trade (25 | 11.9%), Mining, Quarrying, & Extraction (24 | 11.4%), Health Care & Social Assistance (19 | 9.0%), and Public Administration (15 | 7.1%).
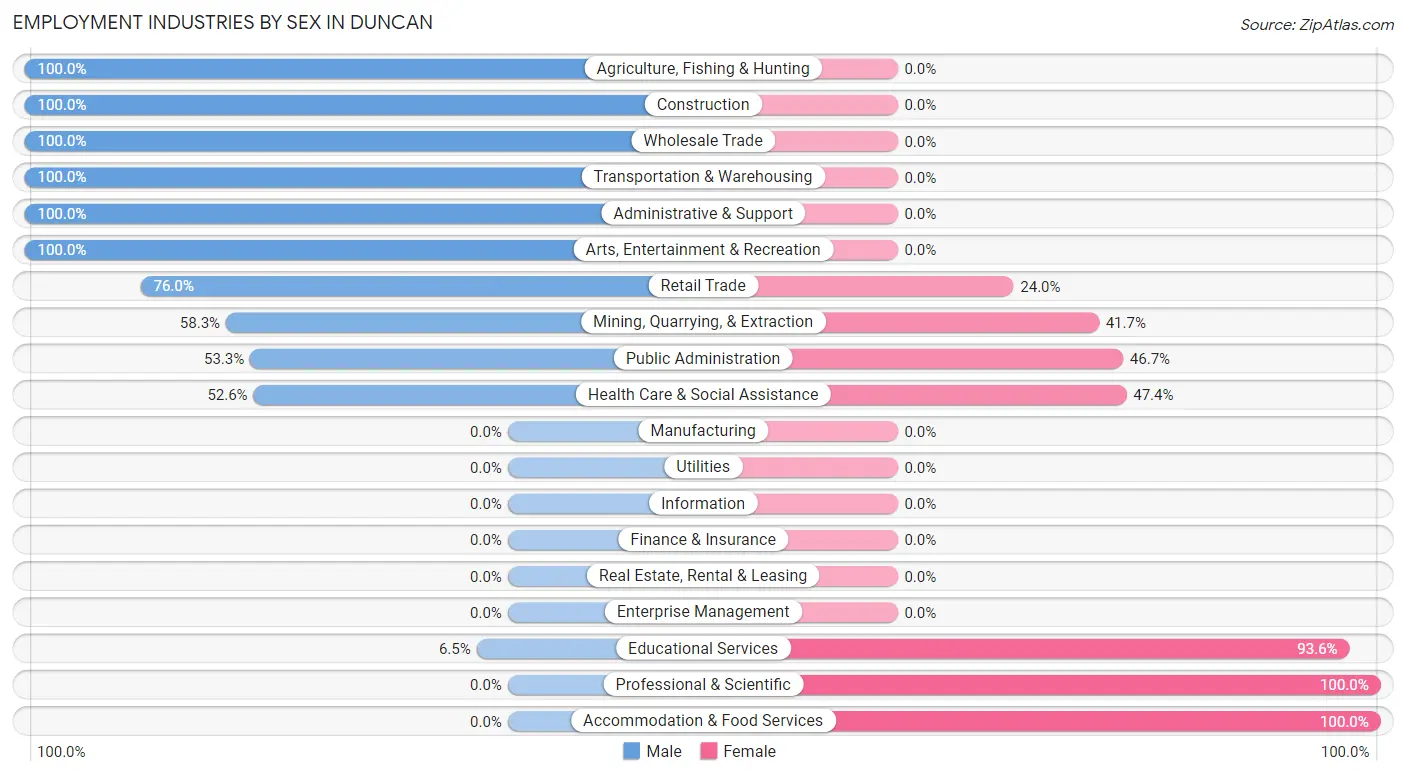
Employment Industries by Sex in Duncan
The Duncan industries that see more men than women are Agriculture, Fishing & Hunting (100.0%), Construction (100.0%), and Wholesale Trade (100.0%), whereas the industries that tend to have a higher number of women are Professional & Scientific (100.0%), Accommodation & Food Services (100.0%), and Educational Services (93.5%).
| Industry | Male | Female |
| Agriculture, Fishing & Hunting | 7 (100.0%) | 0 (0.0%) |
| Mining, Quarrying, & Extraction | 14 (58.3%) | 10 (41.7%) |
| Construction | 11 (100.0%) | 0 (0.0%) |
| Manufacturing | 0 (0.0%) | 0 (0.0%) |
| Wholesale Trade | 1 (100.0%) | 0 (0.0%) |
| Retail Trade | 19 (76.0%) | 6 (24.0%) |
| Transportation & Warehousing | 1 (100.0%) | 0 (0.0%) |
| Utilities | 0 (0.0%) | 0 (0.0%) |
| Information | 0 (0.0%) | 0 (0.0%) |
| Finance & Insurance | 0 (0.0%) | 0 (0.0%) |
| Real Estate, Rental & Leasing | 0 (0.0%) | 0 (0.0%) |
| Professional & Scientific | 0 (0.0%) | 2 (100.0%) |
| Enterprise Management | 0 (0.0%) | 0 (0.0%) |
| Administrative & Support | 12 (100.0%) | 0 (0.0%) |
| Educational Services | 4 (6.5%) | 58 (93.5%) |
| Health Care & Social Assistance | 10 (52.6%) | 9 (47.4%) |
| Arts, Entertainment & Recreation | 10 (100.0%) | 0 (0.0%) |
| Accommodation & Food Services | 0 (0.0%) | 5 (100.0%) |
| Public Administration | 8 (53.3%) | 7 (46.7%) |
| Total | 108 (51.4%) | 102 (48.6%) |
Education in Duncan
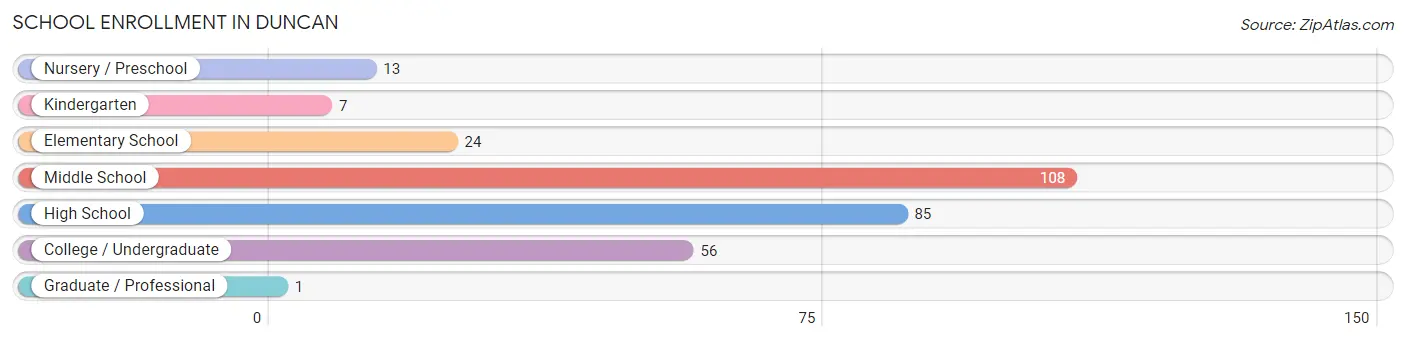
School Enrollment in Duncan
The most common levels of schooling among the 294 students in Duncan are middle school (108 | 36.7%), high school (85 | 28.9%), and college / undergraduate (56 | 19.1%).
| School Level | # Students | % Students |
| Nursery / Preschool | 13 | 4.4% |
| Kindergarten | 7 | 2.4% |
| Elementary School | 24 | 8.2% |
| Middle School | 108 | 36.7% |
| High School | 85 | 28.9% |
| College / Undergraduate | 56 | 19.1% |
| Graduate / Professional | 1 | 0.3% |
| Total | 294 | 100.0% |
School Enrollment by Age by Funding Source in Duncan
Out of a total of 294 students who are enrolled in schools in Duncan, 20 (6.8%) attend a private institution, while the remaining 274 (93.2%) are enrolled in public schools. The age group of 10 to 14 year olds has the highest likelihood of being enrolled in private schools, with 20 (18.3% in the age bracket) enrolled. Conversely, the age group of 3 to 4 year olds has the lowest likelihood of being enrolled in a private school, with 20 (100.0% in the age bracket) attending a public institution.
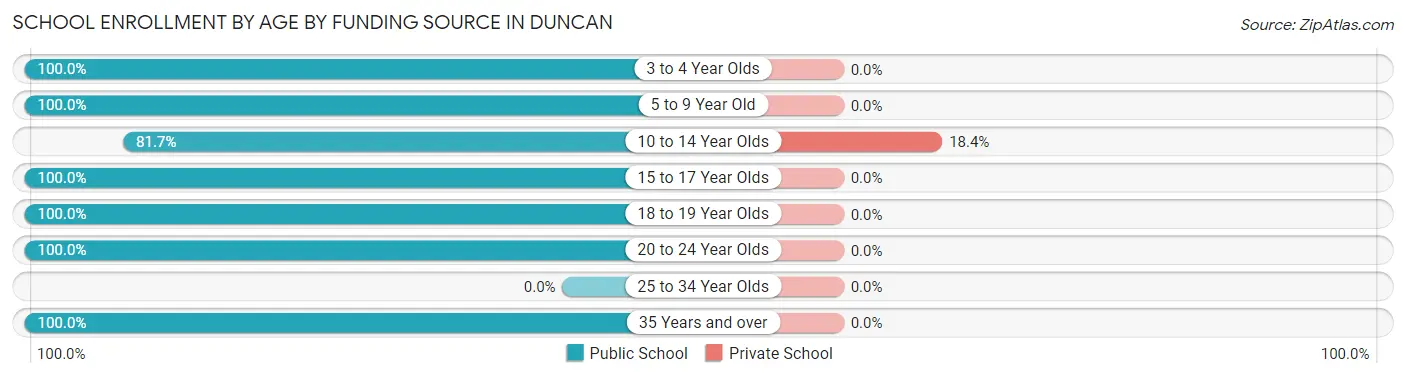
| Age Bracket | Public School | Private School |
| 3 to 4 Year Olds | 20 (100.0%) | 0 (0.0%) |
| 5 to 9 Year Old | 23 (100.0%) | 0 (0.0%) |
| 10 to 14 Year Olds | 89 (81.7%) | 20 (18.3%) |
| 15 to 17 Year Olds | 77 (100.0%) | 0 (0.0%) |
| 18 to 19 Year Olds | 34 (100.0%) | 0 (0.0%) |
| 20 to 24 Year Olds | 28 (100.0%) | 0 (0.0%) |
| 25 to 34 Year Olds | 0 (0.0%) | 0 (0.0%) |
| 35 Years and over | 3 (100.0%) | 0 (0.0%) |
| Total | 274 (93.2%) | 20 (6.8%) |
Educational Attainment by Field of Study in Duncan
Liberal arts & history (32 | 38.6%), business (16 | 19.3%), education (12 | 14.5%), science & technology (11 | 13.3%), and bio, nature & agricultural (4 | 4.8%) are the most common fields of study among 83 individuals in Duncan who have obtained a bachelor's degree or higher.
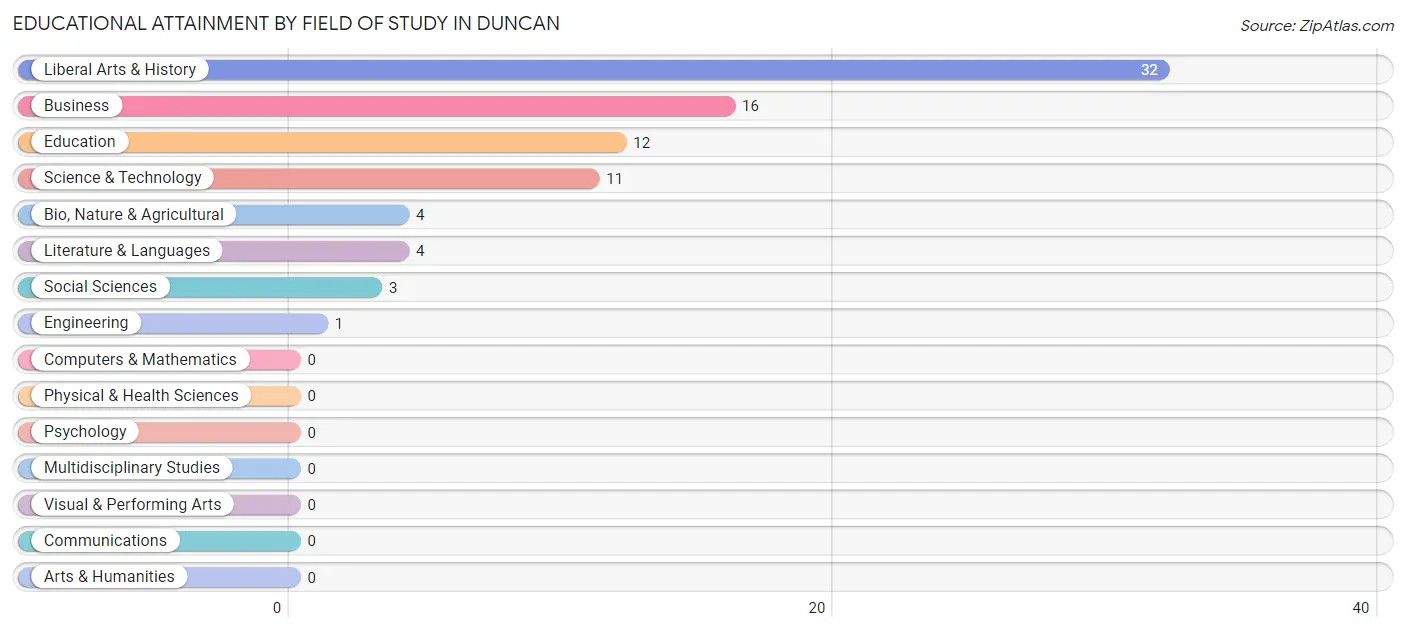
| Field of Study | # Graduates | % Graduates |
| Computers & Mathematics | 0 | 0.0% |
| Bio, Nature & Agricultural | 4 | 4.8% |
| Physical & Health Sciences | 0 | 0.0% |
| Psychology | 0 | 0.0% |
| Social Sciences | 3 | 3.6% |
| Engineering | 1 | 1.2% |
| Multidisciplinary Studies | 0 | 0.0% |
| Science & Technology | 11 | 13.3% |
| Business | 16 | 19.3% |
| Education | 12 | 14.5% |
| Literature & Languages | 4 | 4.8% |
| Liberal Arts & History | 32 | 38.6% |
| Visual & Performing Arts | 0 | 0.0% |
| Communications | 0 | 0.0% |
| Arts & Humanities | 0 | 0.0% |
| Total | 83 | 100.0% |
Transportation & Commute in Duncan
Vehicle Availability by Sex in Duncan
The most prevalent vehicle ownership categories in Duncan are males with 3 vehicles (65, accounting for 60.2%) and females with 3 vehicles (28, making up 63.7%).
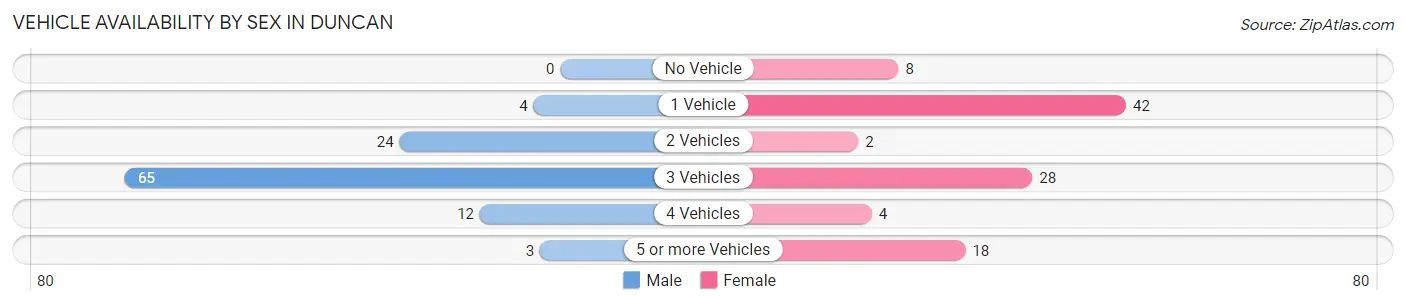
| Vehicles Available | Male | Female |
| No Vehicle | 0 (0.0%) | 8 (7.8%) |
| 1 Vehicle | 4 (3.7%) | 42 (41.2%) |
| 2 Vehicles | 24 (22.2%) | 2 (2.0%) |
| 3 Vehicles | 65 (60.2%) | 28 (27.5%) |
| 4 Vehicles | 12 (11.1%) | 4 (3.9%) |
| 5 or more Vehicles | 3 (2.8%) | 18 (17.6%) |
| Total | 108 (100.0%) | 102 (100.0%) |
Commute Time in Duncan
The most frequently occuring commute durations in Duncan are 30 to 34 minutes (48 commuters, 24.4%), 45 to 59 minutes (36 commuters, 18.3%), and 15 to 19 minutes (26 commuters, 13.2%).
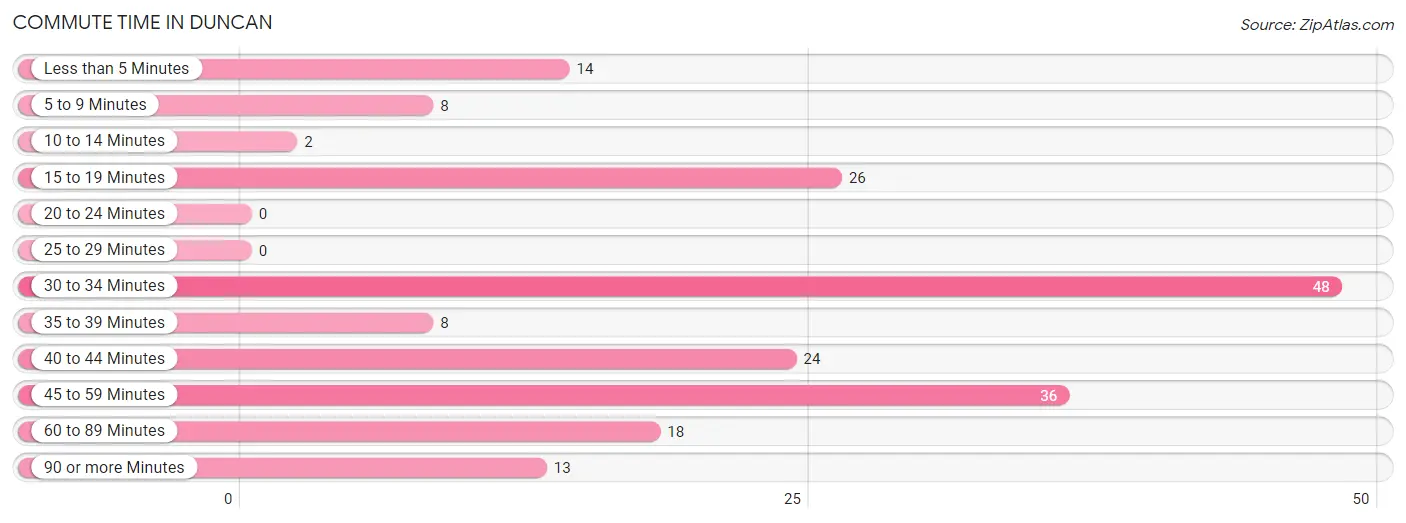
| Commute Time | # Commuters | % Commuters |
| Less than 5 Minutes | 14 | 7.1% |
| 5 to 9 Minutes | 8 | 4.1% |
| 10 to 14 Minutes | 2 | 1.0% |
| 15 to 19 Minutes | 26 | 13.2% |
| 20 to 24 Minutes | 0 | 0.0% |
| 25 to 29 Minutes | 0 | 0.0% |
| 30 to 34 Minutes | 48 | 24.4% |
| 35 to 39 Minutes | 8 | 4.1% |
| 40 to 44 Minutes | 24 | 12.2% |
| 45 to 59 Minutes | 36 | 18.3% |
| 60 to 89 Minutes | 18 | 9.1% |
| 90 or more Minutes | 13 | 6.6% |
Commute Time by Sex in Duncan
The most common commute times in Duncan are 40 to 44 minutes (23 commuters, 23.5%) for males and 30 to 34 minutes (47 commuters, 47.5%) for females.
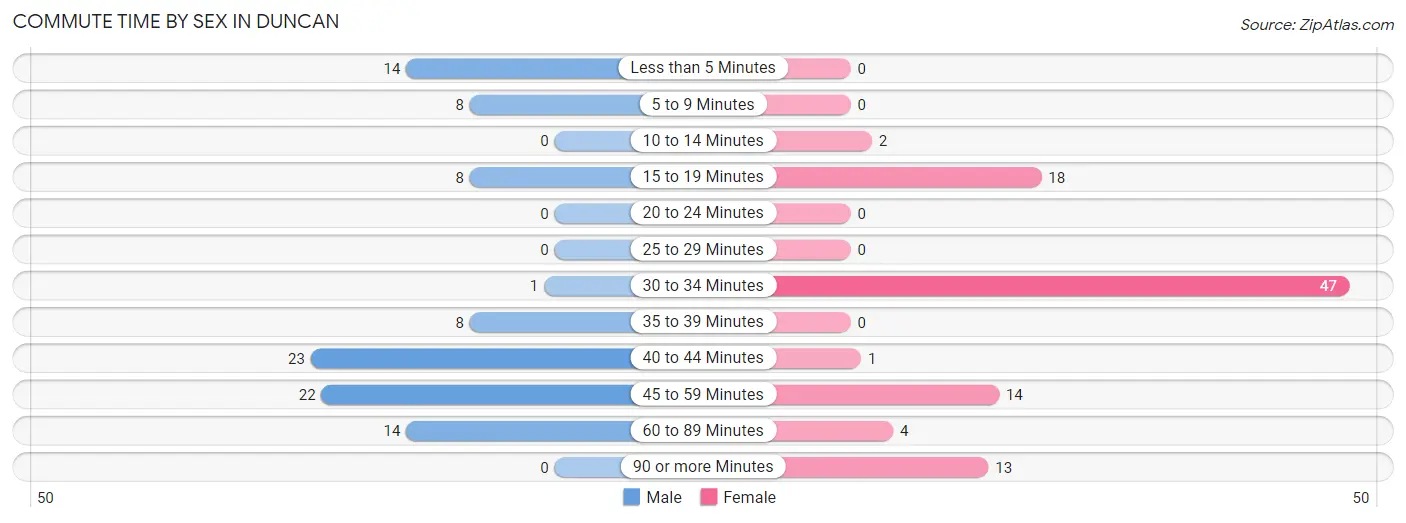
| Commute Time | Male | Female |
| Less than 5 Minutes | 14 (14.3%) | 0 (0.0%) |
| 5 to 9 Minutes | 8 (8.2%) | 0 (0.0%) |
| 10 to 14 Minutes | 0 (0.0%) | 2 (2.0%) |
| 15 to 19 Minutes | 8 (8.2%) | 18 (18.2%) |
| 20 to 24 Minutes | 0 (0.0%) | 0 (0.0%) |
| 25 to 29 Minutes | 0 (0.0%) | 0 (0.0%) |
| 30 to 34 Minutes | 1 (1.0%) | 47 (47.5%) |
| 35 to 39 Minutes | 8 (8.2%) | 0 (0.0%) |
| 40 to 44 Minutes | 23 (23.5%) | 1 (1.0%) |
| 45 to 59 Minutes | 22 (22.5%) | 14 (14.1%) |
| 60 to 89 Minutes | 14 (14.3%) | 4 (4.0%) |
| 90 or more Minutes | 0 (0.0%) | 13 (13.1%) |
Time of Departure to Work by Sex in Duncan
The most frequent times of departure to work in Duncan are 12:00 AM to 4:59 AM (41, 41.8%) for males and 7:00 AM to 7:29 AM (52, 52.5%) for females.
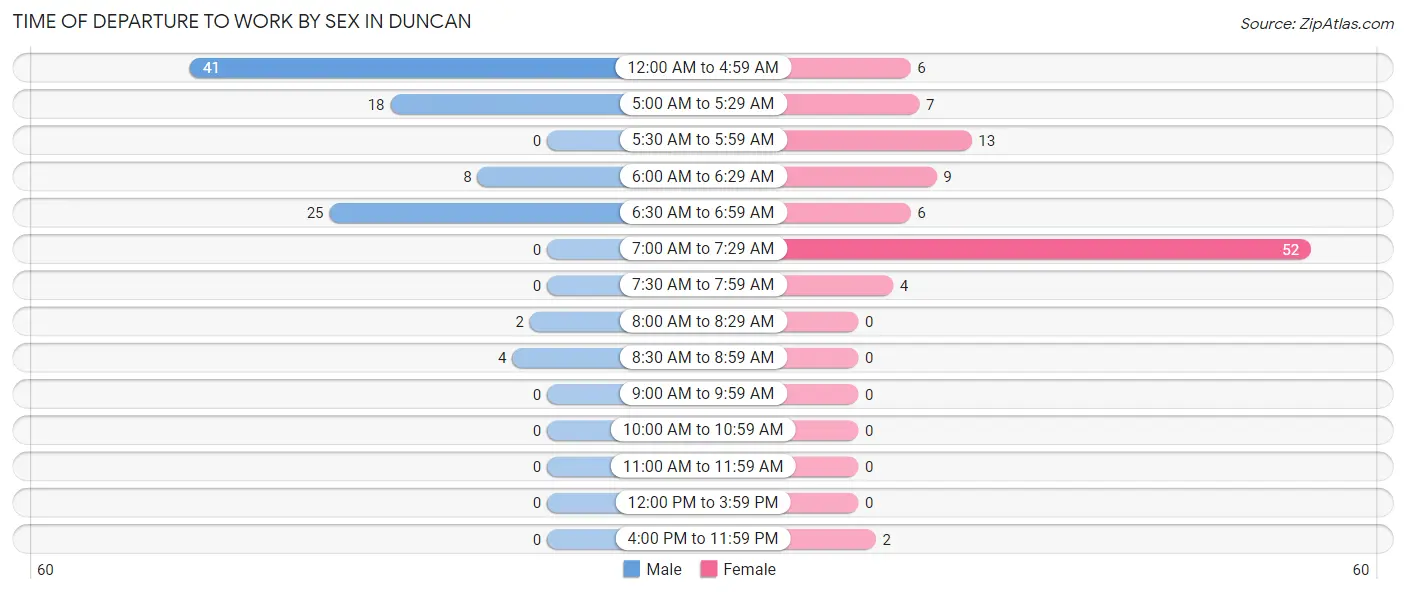
| Time of Departure | Male | Female |
| 12:00 AM to 4:59 AM | 41 (41.8%) | 6 (6.1%) |
| 5:00 AM to 5:29 AM | 18 (18.4%) | 7 (7.1%) |
| 5:30 AM to 5:59 AM | 0 (0.0%) | 13 (13.1%) |
| 6:00 AM to 6:29 AM | 8 (8.2%) | 9 (9.1%) |
| 6:30 AM to 6:59 AM | 25 (25.5%) | 6 (6.1%) |
| 7:00 AM to 7:29 AM | 0 (0.0%) | 52 (52.5%) |
| 7:30 AM to 7:59 AM | 0 (0.0%) | 4 (4.0%) |
| 8:00 AM to 8:29 AM | 2 (2.0%) | 0 (0.0%) |
| 8:30 AM to 8:59 AM | 4 (4.1%) | 0 (0.0%) |
| 9:00 AM to 9:59 AM | 0 (0.0%) | 0 (0.0%) |
| 10:00 AM to 10:59 AM | 0 (0.0%) | 0 (0.0%) |
| 11:00 AM to 11:59 AM | 0 (0.0%) | 0 (0.0%) |
| 12:00 PM to 3:59 PM | 0 (0.0%) | 0 (0.0%) |
| 4:00 PM to 11:59 PM | 0 (0.0%) | 2 (2.0%) |
| Total | 98 (100.0%) | 99 (100.0%) |
Housing Occupancy in Duncan
Occupancy by Ownership in Duncan
Of the total 331 dwellings in Duncan, owner-occupied units account for 223 (67.4%), while renter-occupied units make up 108 (32.6%).
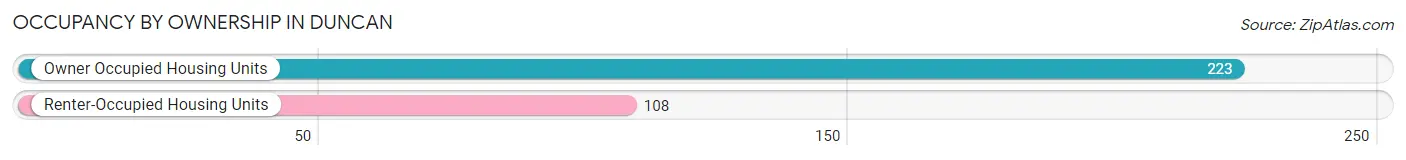
| Occupancy | # Housing Units | % Housing Units |
| Owner Occupied Housing Units | 223 | 67.4% |
| Renter-Occupied Housing Units | 108 | 32.6% |
| Total Occupied Housing Units | 331 | 100.0% |
Occupancy by Household Size in Duncan
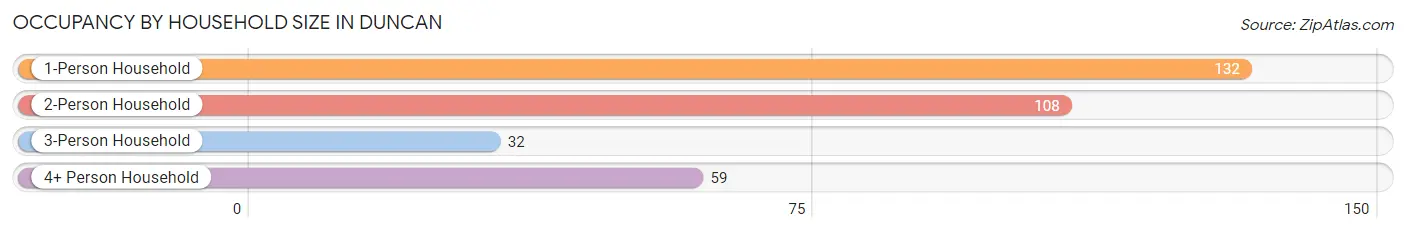
| Household Size | # Housing Units | % Housing Units |
| 1-Person Household | 132 | 39.9% |
| 2-Person Household | 108 | 32.6% |
| 3-Person Household | 32 | 9.7% |
| 4+ Person Household | 59 | 17.8% |
| Total Housing Units | 331 | 100.0% |
Occupancy by Ownership by Household Size in Duncan
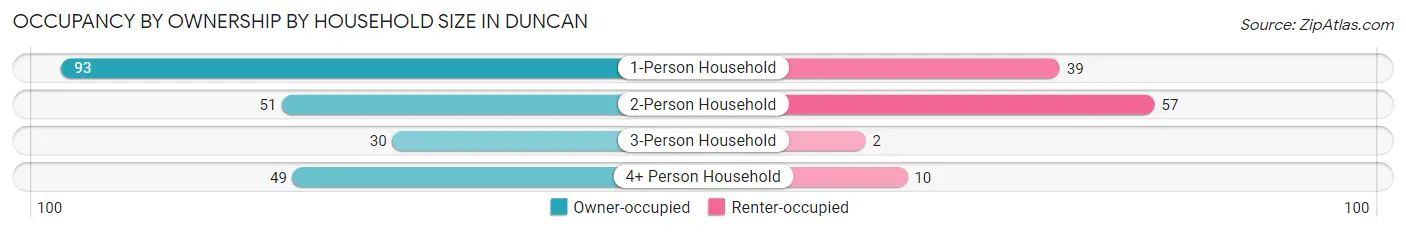
| Household Size | Owner-occupied | Renter-occupied |
| 1-Person Household | 93 (70.5%) | 39 (29.5%) |
| 2-Person Household | 51 (47.2%) | 57 (52.8%) |
| 3-Person Household | 30 (93.8%) | 2 (6.2%) |
| 4+ Person Household | 49 (83.1%) | 10 (17.0%) |
| Total Housing Units | 223 (67.4%) | 108 (32.6%) |
Occupancy by Educational Attainment in Duncan
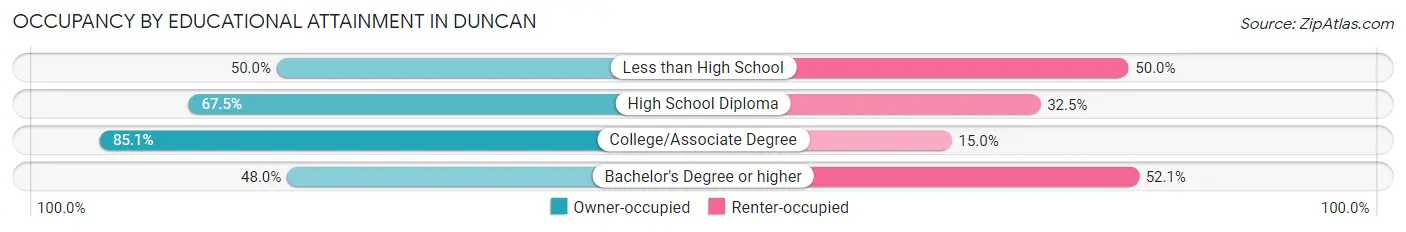
| Household Size | Owner-occupied | Renter-occupied |
| Less than High School | 14 (50.0%) | 14 (50.0%) |
| High School Diploma | 83 (67.5%) | 40 (32.5%) |
| College/Associate Degree | 91 (85.1%) | 16 (14.9%) |
| Bachelor's Degree or higher | 35 (47.9%) | 38 (52.0%) |
Occupancy by Age of Householder in Duncan
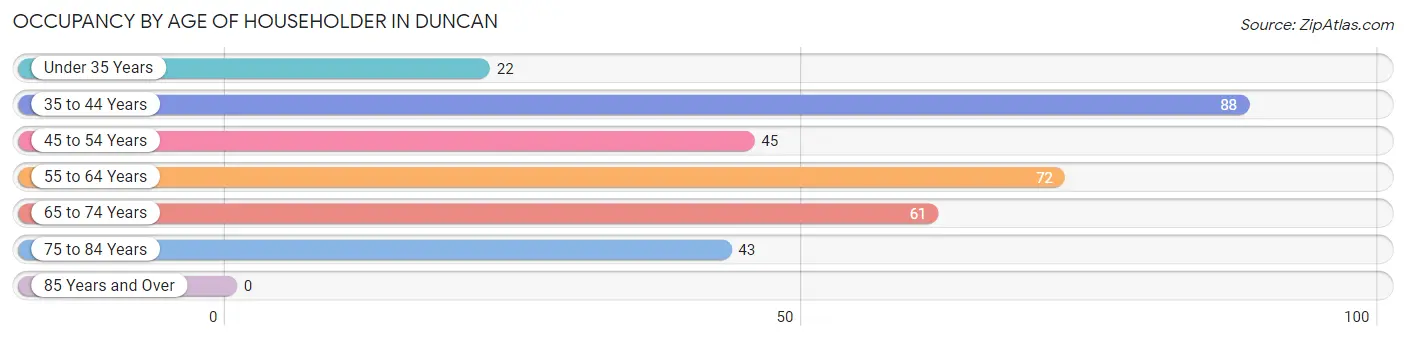
| Age Bracket | # Households | % Households |
| Under 35 Years | 22 | 6.7% |
| 35 to 44 Years | 88 | 26.6% |
| 45 to 54 Years | 45 | 13.6% |
| 55 to 64 Years | 72 | 21.7% |
| 65 to 74 Years | 61 | 18.4% |
| 75 to 84 Years | 43 | 13.0% |
| 85 Years and Over | 0 | 0.0% |
| Total | 331 | 100.0% |
Housing Finances in Duncan
Median Income by Occupancy in Duncan
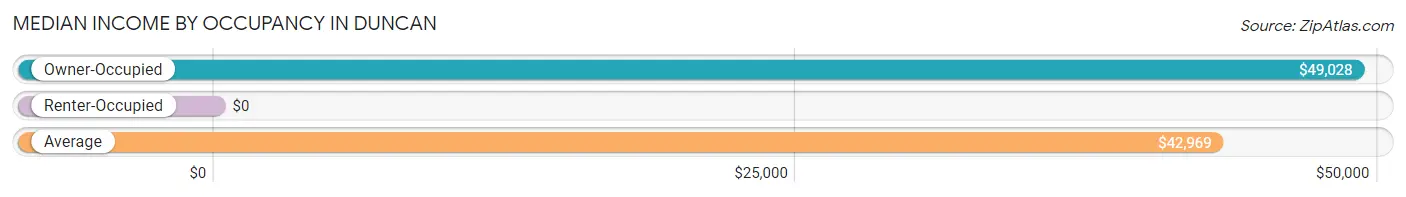
| Occupancy Type | # Households | Median Income |
| Owner-Occupied | 223 (67.4%) | $49,028 |
| Renter-Occupied | 108 (32.6%) | $0 |
| Average | 331 (100.0%) | $42,969 |
Occupancy by Householder Income Bracket in Duncan
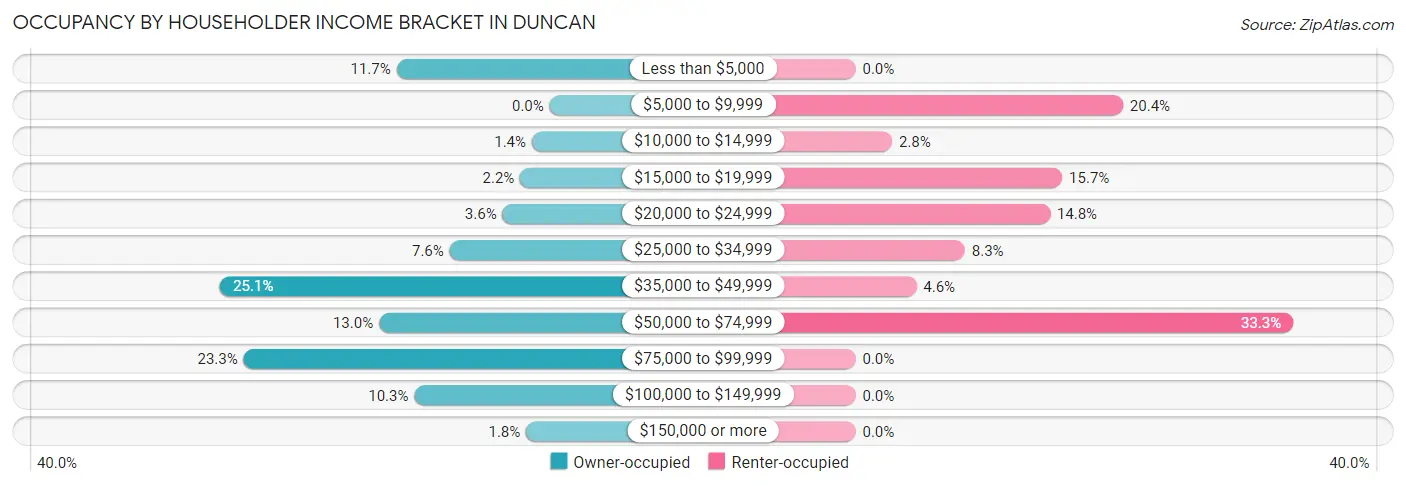
| Income Bracket | Owner-occupied | Renter-occupied |
| Less than $5,000 | 26 (11.7%) | 0 (0.0%) |
| $5,000 to $9,999 | 0 (0.0%) | 22 (20.4%) |
| $10,000 to $14,999 | 3 (1.3%) | 3 (2.8%) |
| $15,000 to $19,999 | 5 (2.2%) | 17 (15.7%) |
| $20,000 to $24,999 | 8 (3.6%) | 16 (14.8%) |
| $25,000 to $34,999 | 17 (7.6%) | 9 (8.3%) |
| $35,000 to $49,999 | 56 (25.1%) | 5 (4.6%) |
| $50,000 to $74,999 | 29 (13.0%) | 36 (33.3%) |
| $75,000 to $99,999 | 52 (23.3%) | 0 (0.0%) |
| $100,000 to $149,999 | 23 (10.3%) | 0 (0.0%) |
| $150,000 or more | 4 (1.8%) | 0 (0.0%) |
| Total | 223 (100.0%) | 108 (100.0%) |
Monthly Housing Cost Tiers in Duncan
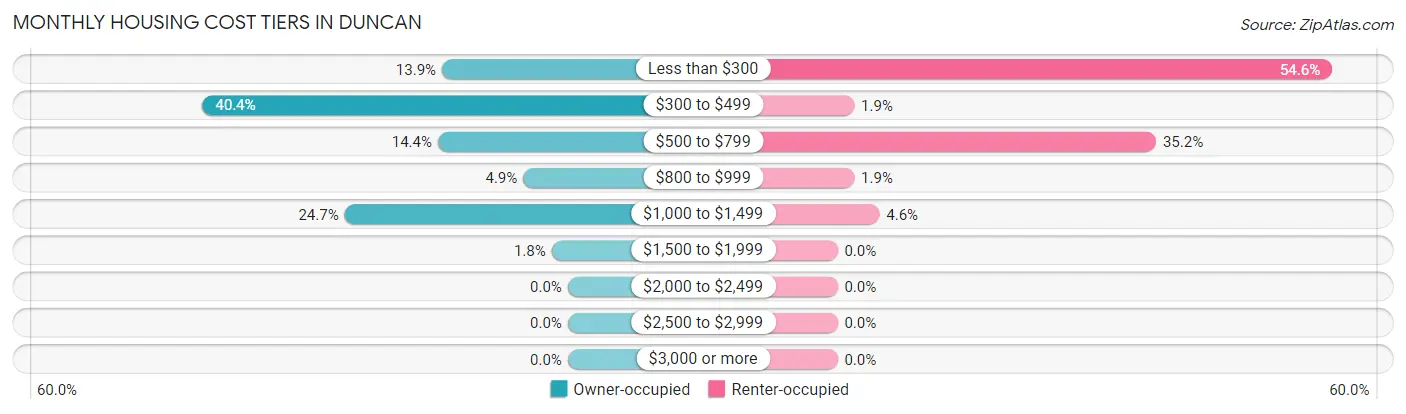
| Monthly Cost | Owner-occupied | Renter-occupied |
| Less than $300 | 31 (13.9%) | 59 (54.6%) |
| $300 to $499 | 90 (40.4%) | 2 (1.8%) |
| $500 to $799 | 32 (14.3%) | 38 (35.2%) |
| $800 to $999 | 11 (4.9%) | 2 (1.8%) |
| $1,000 to $1,499 | 55 (24.7%) | 5 (4.6%) |
| $1,500 to $1,999 | 4 (1.8%) | 0 (0.0%) |
| $2,000 to $2,499 | 0 (0.0%) | 0 (0.0%) |
| $2,500 to $2,999 | 0 (0.0%) | 0 (0.0%) |
| $3,000 or more | 0 (0.0%) | 0 (0.0%) |
| Total | 223 (100.0%) | 108 (100.0%) |
Physical Housing Characteristics in Duncan
Housing Structures in Duncan
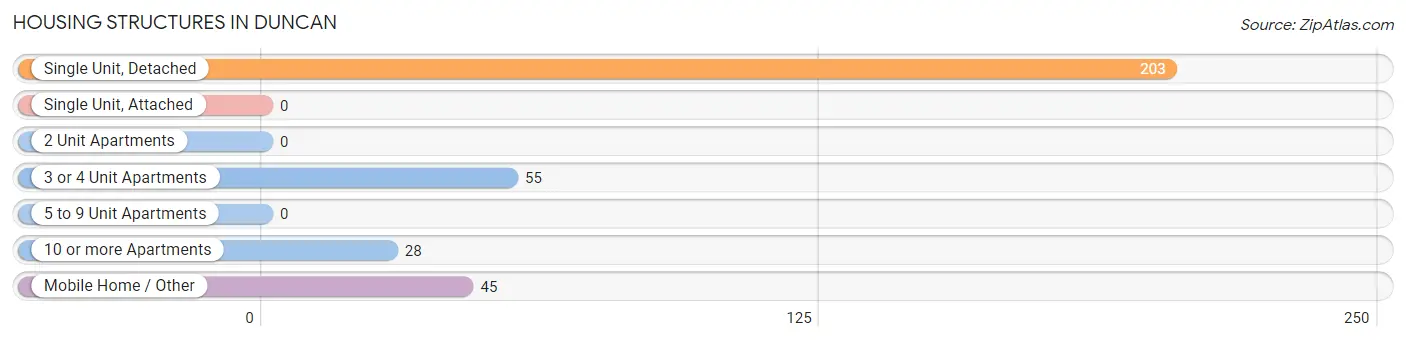
| Structure Type | # Housing Units | % Housing Units |
| Single Unit, Detached | 203 | 61.3% |
| Single Unit, Attached | 0 | 0.0% |
| 2 Unit Apartments | 0 | 0.0% |
| 3 or 4 Unit Apartments | 55 | 16.6% |
| 5 to 9 Unit Apartments | 0 | 0.0% |
| 10 or more Apartments | 28 | 8.5% |
| Mobile Home / Other | 45 | 13.6% |
| Total | 331 | 100.0% |
Housing Structures by Occupancy in Duncan
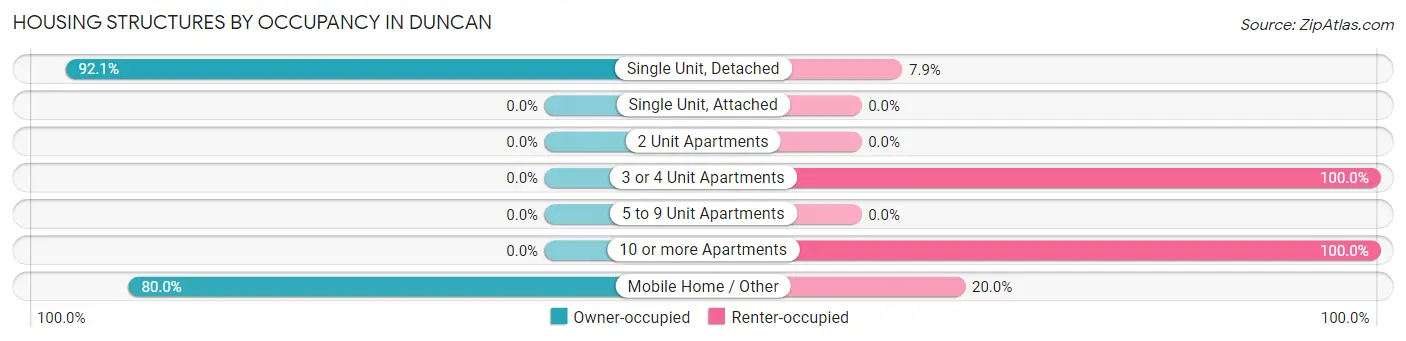
| Structure Type | Owner-occupied | Renter-occupied |
| Single Unit, Detached | 187 (92.1%) | 16 (7.9%) |
| Single Unit, Attached | 0 (0.0%) | 0 (0.0%) |
| 2 Unit Apartments | 0 (0.0%) | 0 (0.0%) |
| 3 or 4 Unit Apartments | 0 (0.0%) | 55 (100.0%) |
| 5 to 9 Unit Apartments | 0 (0.0%) | 0 (0.0%) |
| 10 or more Apartments | 0 (0.0%) | 28 (100.0%) |
| Mobile Home / Other | 36 (80.0%) | 9 (20.0%) |
| Total | 223 (67.4%) | 108 (32.6%) |
Housing Structures by Number of Rooms in Duncan
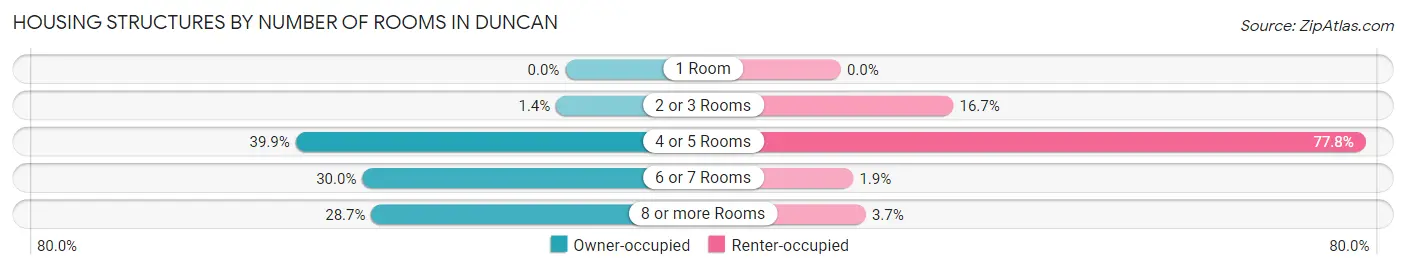
| Number of Rooms | Owner-occupied | Renter-occupied |
| 1 Room | 0 (0.0%) | 0 (0.0%) |
| 2 or 3 Rooms | 3 (1.3%) | 18 (16.7%) |
| 4 or 5 Rooms | 89 (39.9%) | 84 (77.8%) |
| 6 or 7 Rooms | 67 (30.0%) | 2 (1.8%) |
| 8 or more Rooms | 64 (28.7%) | 4 (3.7%) |
| Total | 223 (100.0%) | 108 (100.0%) |
Housing Structure by Heating Type in Duncan
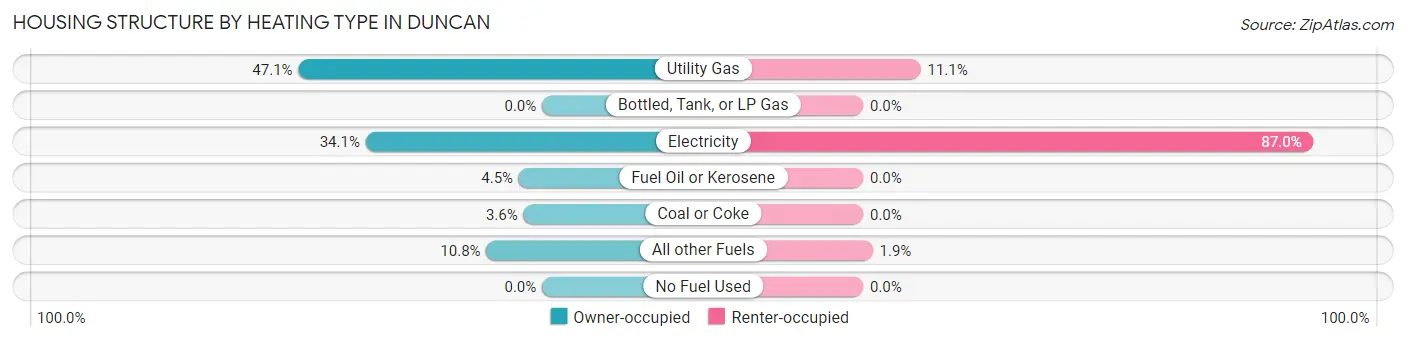
| Heating Type | Owner-occupied | Renter-occupied |
| Utility Gas | 105 (47.1%) | 12 (11.1%) |
| Bottled, Tank, or LP Gas | 0 (0.0%) | 0 (0.0%) |
| Electricity | 76 (34.1%) | 94 (87.0%) |
| Fuel Oil or Kerosene | 10 (4.5%) | 0 (0.0%) |
| Coal or Coke | 8 (3.6%) | 0 (0.0%) |
| All other Fuels | 24 (10.8%) | 2 (1.8%) |
| No Fuel Used | 0 (0.0%) | 0 (0.0%) |
| Total | 223 (100.0%) | 108 (100.0%) |
Household Vehicle Usage in Duncan
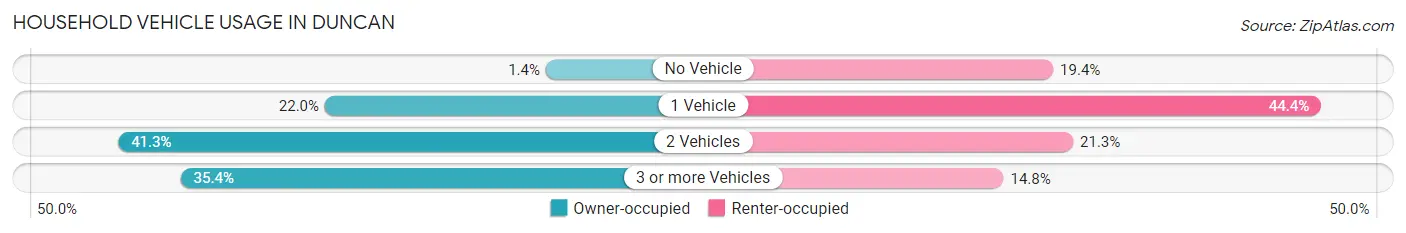
| Vehicles per Household | Owner-occupied | Renter-occupied |
| No Vehicle | 3 (1.3%) | 21 (19.4%) |
| 1 Vehicle | 49 (22.0%) | 48 (44.4%) |
| 2 Vehicles | 92 (41.3%) | 23 (21.3%) |
| 3 or more Vehicles | 79 (35.4%) | 16 (14.8%) |
| Total | 223 (100.0%) | 108 (100.0%) |
Real Estate & Mortgages in Duncan
Real Estate and Mortgage Overview in Duncan
| Characteristic | Without Mortgage | With Mortgage |
| Housing Units | 134 | 89 |
| Median Property Value | - | - |
| Median Household Income | $43,500 | $4 |
| Monthly Housing Costs | $336 | $0 |
| Real Estate Taxes | $439 | $6 |
Property Value by Mortgage Status in Duncan
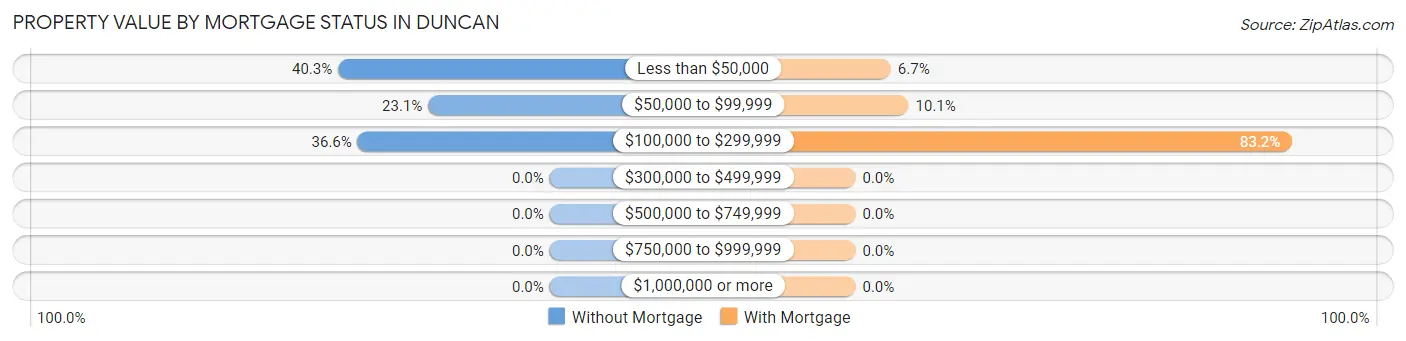
| Property Value | Without Mortgage | With Mortgage |
| Less than $50,000 | 54 (40.3%) | 6 (6.7%) |
| $50,000 to $99,999 | 31 (23.1%) | 9 (10.1%) |
| $100,000 to $299,999 | 49 (36.6%) | 74 (83.2%) |
| $300,000 to $499,999 | 0 (0.0%) | 0 (0.0%) |
| $500,000 to $749,999 | 0 (0.0%) | 0 (0.0%) |
| $750,000 to $999,999 | 0 (0.0%) | 0 (0.0%) |
| $1,000,000 or more | 0 (0.0%) | 0 (0.0%) |
| Total | 134 (100.0%) | 89 (100.0%) |
Household Income by Mortgage Status in Duncan
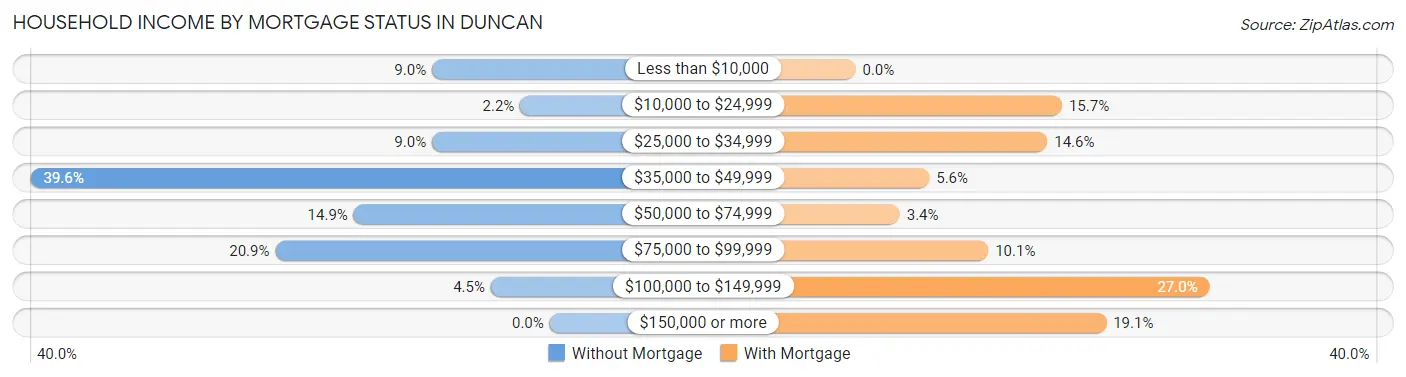
| Household Income | Without Mortgage | With Mortgage |
| Less than $10,000 | 12 (9.0%) | 0 (0.0%) |
| $10,000 to $24,999 | 3 (2.2%) | 14 (15.7%) |
| $25,000 to $34,999 | 12 (9.0%) | 13 (14.6%) |
| $35,000 to $49,999 | 53 (39.6%) | 5 (5.6%) |
| $50,000 to $74,999 | 20 (14.9%) | 3 (3.4%) |
| $75,000 to $99,999 | 28 (20.9%) | 9 (10.1%) |
| $100,000 to $149,999 | 6 (4.5%) | 24 (27.0%) |
| $150,000 or more | 0 (0.0%) | 17 (19.1%) |
| Total | 134 (100.0%) | 89 (100.0%) |
Property Value to Household Income Ratio in Duncan
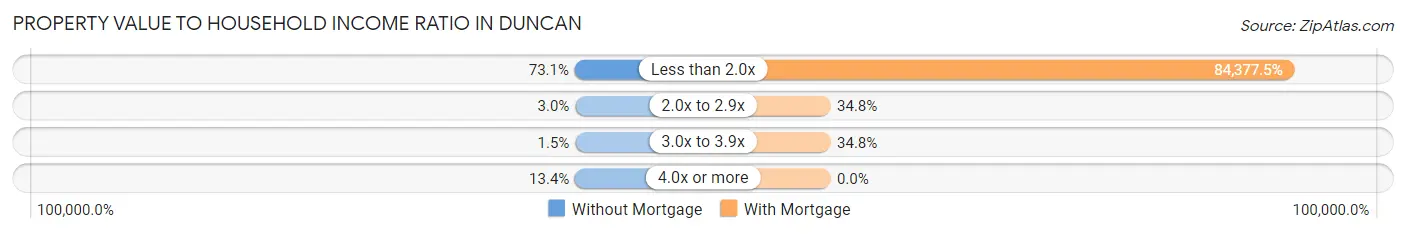
| Value-to-Income Ratio | Without Mortgage | With Mortgage |
| Less than 2.0x | 98 (73.1%) | 75,096 (84,377.5%) |
| 2.0x to 2.9x | 4 (3.0%) | 31 (34.8%) |
| 3.0x to 3.9x | 2 (1.5%) | 31 (34.8%) |
| 4.0x or more | 18 (13.4%) | 0 (0.0%) |
| Total | 134 (100.0%) | 89 (100.0%) |
Real Estate Taxes by Mortgage Status in Duncan
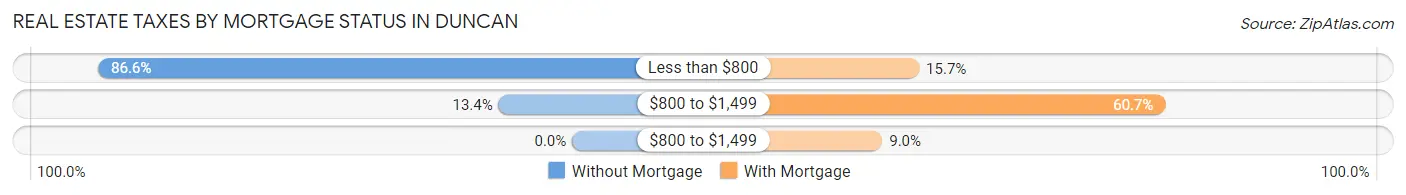
| Property Taxes | Without Mortgage | With Mortgage |
| Less than $800 | 116 (86.6%) | 14 (15.7%) |
| $800 to $1,499 | 18 (13.4%) | 54 (60.7%) |
| $800 to $1,499 | 0 (0.0%) | 8 (9.0%) |
| Total | 134 (100.0%) | 89 (100.0%) |
Health & Disability in Duncan
Health Insurance Coverage by Age in Duncan
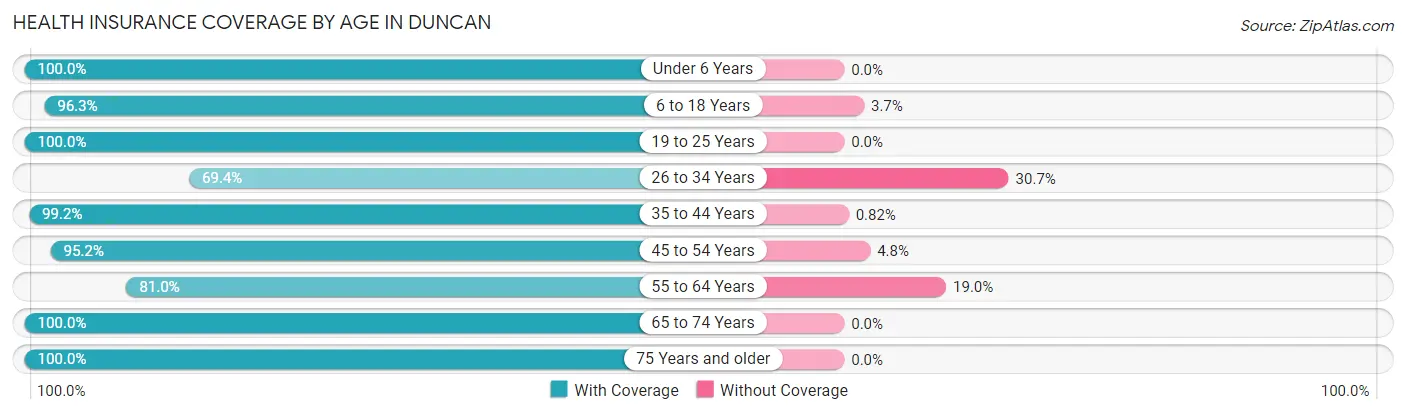
| Age Bracket | With Coverage | Without Coverage |
| Under 6 Years | 77 (100.0%) | 0 (0.0%) |
| 6 to 18 Years | 262 (96.3%) | 10 (3.7%) |
| 19 to 25 Years | 47 (100.0%) | 0 (0.0%) |
| 26 to 34 Years | 43 (69.4%) | 19 (30.6%) |
| 35 to 44 Years | 121 (99.2%) | 1 (0.8%) |
| 45 to 54 Years | 59 (95.2%) | 3 (4.8%) |
| 55 to 64 Years | 64 (81.0%) | 15 (19.0%) |
| 65 to 74 Years | 92 (100.0%) | 0 (0.0%) |
| 75 Years and older | 66 (100.0%) | 0 (0.0%) |
| Total | 831 (94.5%) | 48 (5.5%) |
Health Insurance Coverage by Citizenship Status in Duncan
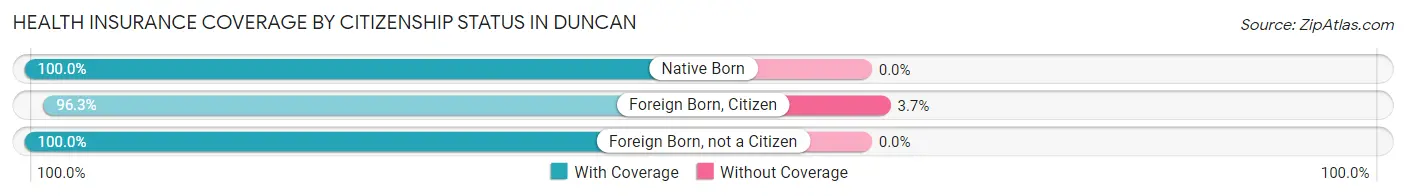
| Citizenship Status | With Coverage | Without Coverage |
| Native Born | 77 (100.0%) | 0 (0.0%) |
| Foreign Born, Citizen | 262 (96.3%) | 10 (3.7%) |
| Foreign Born, not a Citizen | 47 (100.0%) | 0 (0.0%) |
Health Insurance Coverage by Household Income in Duncan
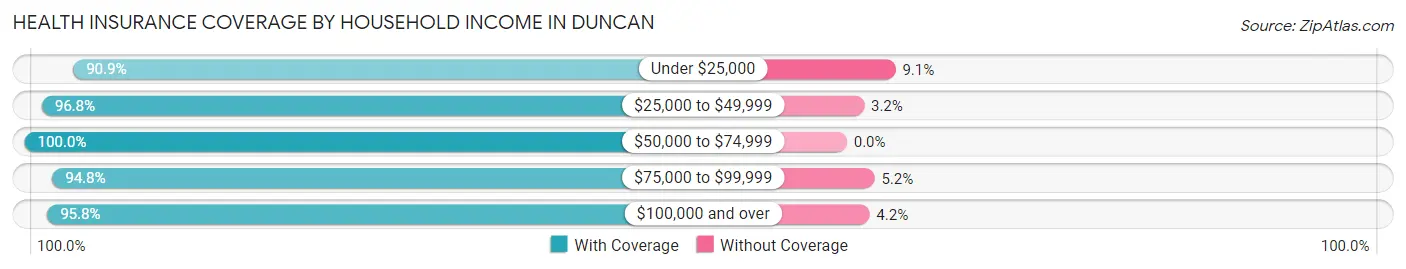
| Household Income | With Coverage | Without Coverage |
| Under $25,000 | 289 (90.9%) | 29 (9.1%) |
| $25,000 to $49,999 | 180 (96.8%) | 6 (3.2%) |
| $50,000 to $74,999 | 103 (100.0%) | 0 (0.0%) |
| $75,000 to $99,999 | 146 (94.8%) | 8 (5.2%) |
| $100,000 and over | 113 (95.8%) | 5 (4.2%) |
Public vs Private Health Insurance Coverage by Age in Duncan
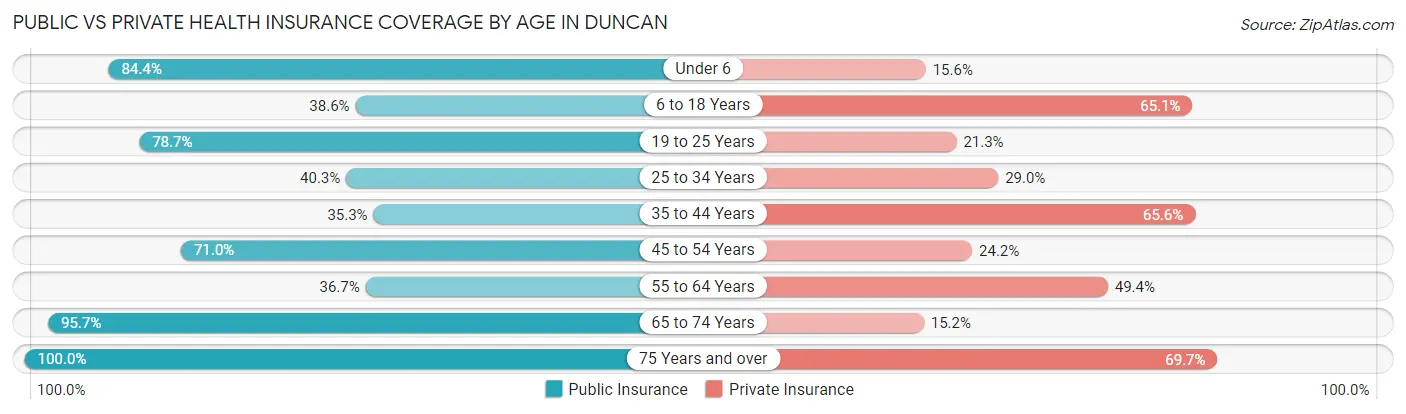
| Age Bracket | Public Insurance | Private Insurance |
| Under 6 | 65 (84.4%) | 12 (15.6%) |
| 6 to 18 Years | 105 (38.6%) | 177 (65.1%) |
| 19 to 25 Years | 37 (78.7%) | 10 (21.3%) |
| 25 to 34 Years | 25 (40.3%) | 18 (29.0%) |
| 35 to 44 Years | 43 (35.2%) | 80 (65.6%) |
| 45 to 54 Years | 44 (71.0%) | 15 (24.2%) |
| 55 to 64 Years | 29 (36.7%) | 39 (49.4%) |
| 65 to 74 Years | 88 (95.7%) | 14 (15.2%) |
| 75 Years and over | 66 (100.0%) | 46 (69.7%) |
| Total | 502 (57.1%) | 411 (46.8%) |
Disability Status by Sex by Age in Duncan
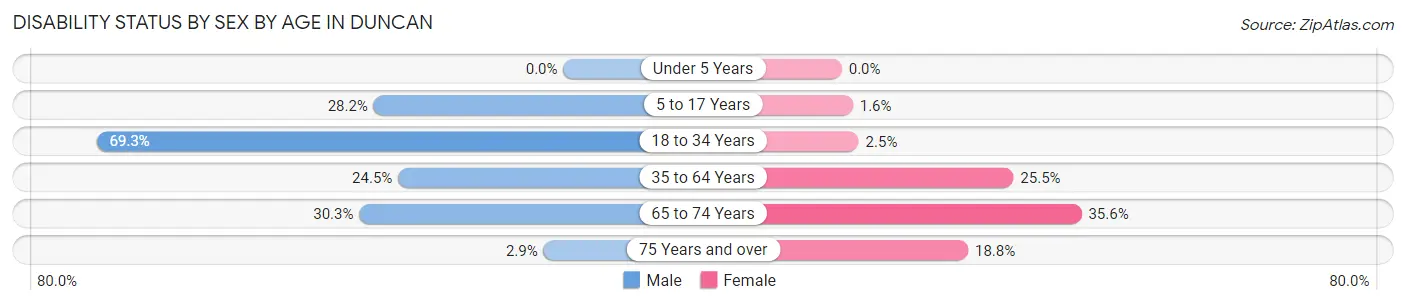
| Age Bracket | Male | Female |
| Under 5 Years | 0 (0.0%) | 0 (0.0%) |
| 5 to 17 Years | 29 (28.2%) | 2 (1.6%) |
| 18 to 34 Years | 52 (69.3%) | 2 (2.5%) |
| 35 to 64 Years | 26 (24.5%) | 40 (25.5%) |
| 65 to 74 Years | 10 (30.3%) | 21 (35.6%) |
| 75 Years and over | 1 (2.9%) | 6 (18.8%) |
Disability Class by Sex by Age in Duncan
Disability Class: Hearing Difficulty
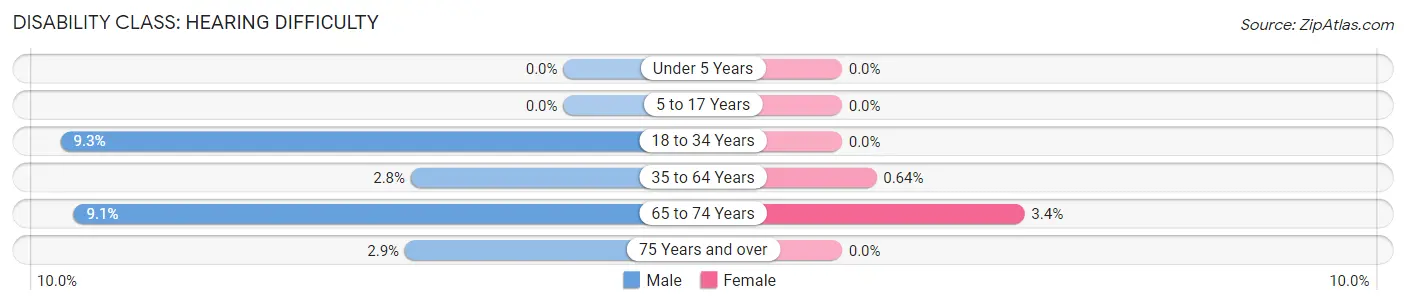
| Age Bracket | Male | Female |
| Under 5 Years | 0 (0.0%) | 0 (0.0%) |
| 5 to 17 Years | 0 (0.0%) | 0 (0.0%) |
| 18 to 34 Years | 7 (9.3%) | 0 (0.0%) |
| 35 to 64 Years | 3 (2.8%) | 1 (0.6%) |
| 65 to 74 Years | 3 (9.1%) | 2 (3.4%) |
| 75 Years and over | 1 (2.9%) | 0 (0.0%) |
Disability Class: Vision Difficulty
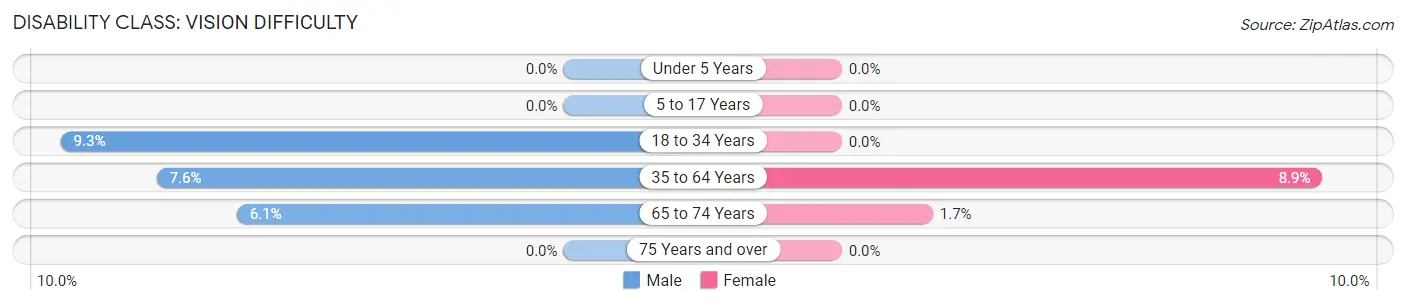
| Age Bracket | Male | Female |
| Under 5 Years | 0 (0.0%) | 0 (0.0%) |
| 5 to 17 Years | 0 (0.0%) | 0 (0.0%) |
| 18 to 34 Years | 7 (9.3%) | 0 (0.0%) |
| 35 to 64 Years | 8 (7.5%) | 14 (8.9%) |
| 65 to 74 Years | 2 (6.1%) | 1 (1.7%) |
| 75 Years and over | 0 (0.0%) | 0 (0.0%) |
Disability Class: Cognitive Difficulty
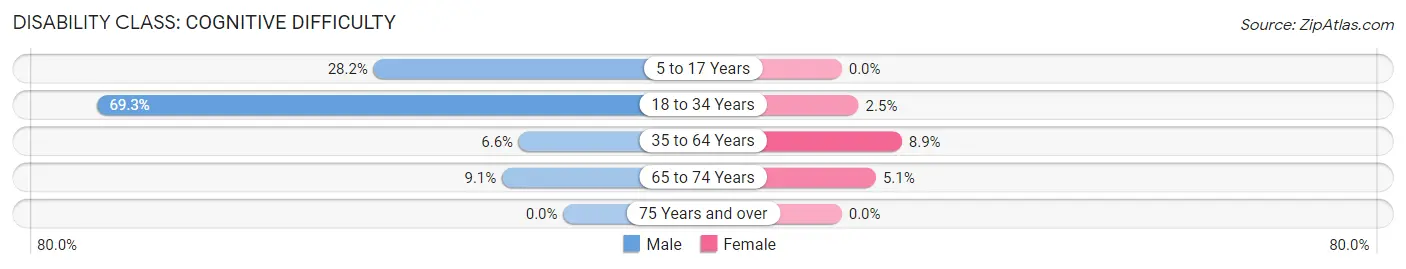
| Age Bracket | Male | Female |
| 5 to 17 Years | 29 (28.2%) | 0 (0.0%) |
| 18 to 34 Years | 52 (69.3%) | 2 (2.5%) |
| 35 to 64 Years | 7 (6.6%) | 14 (8.9%) |
| 65 to 74 Years | 3 (9.1%) | 3 (5.1%) |
| 75 Years and over | 0 (0.0%) | 0 (0.0%) |
Disability Class: Ambulatory Difficulty
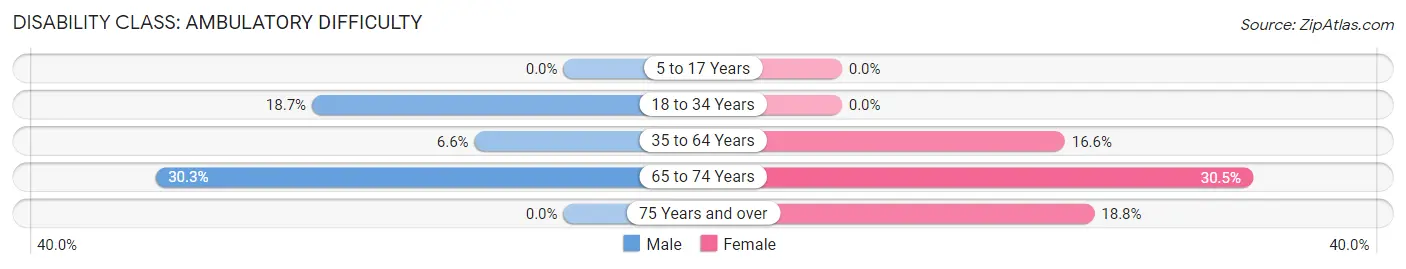
| Age Bracket | Male | Female |
| 5 to 17 Years | 0 (0.0%) | 0 (0.0%) |
| 18 to 34 Years | 14 (18.7%) | 0 (0.0%) |
| 35 to 64 Years | 7 (6.6%) | 26 (16.6%) |
| 65 to 74 Years | 10 (30.3%) | 18 (30.5%) |
| 75 Years and over | 0 (0.0%) | 6 (18.8%) |
Disability Class: Self-Care Difficulty
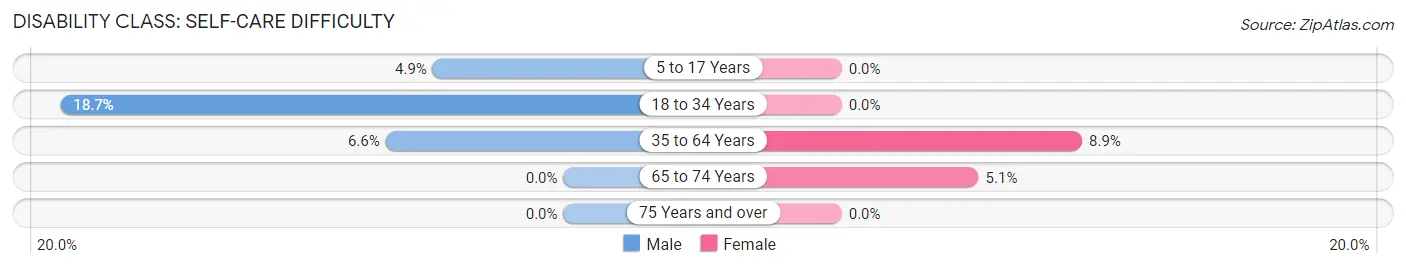
| Age Bracket | Male | Female |
| 5 to 17 Years | 5 (4.9%) | 0 (0.0%) |
| 18 to 34 Years | 14 (18.7%) | 0 (0.0%) |
| 35 to 64 Years | 7 (6.6%) | 14 (8.9%) |
| 65 to 74 Years | 0 (0.0%) | 3 (5.1%) |
| 75 Years and over | 0 (0.0%) | 0 (0.0%) |
Technology Access in Duncan
Computing Device Access in Duncan
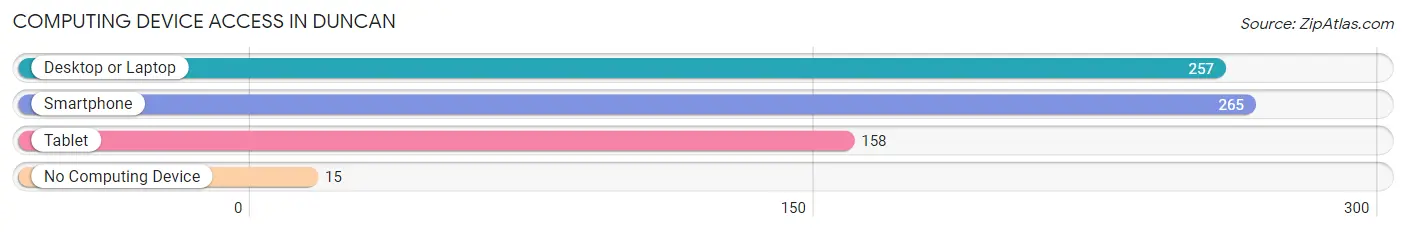
| Device Type | # Households | % Households |
| Desktop or Laptop | 257 | 77.6% |
| Smartphone | 265 | 80.1% |
| Tablet | 158 | 47.7% |
| No Computing Device | 15 | 4.5% |
| Total | 331 | 100.0% |
Internet Access in Duncan
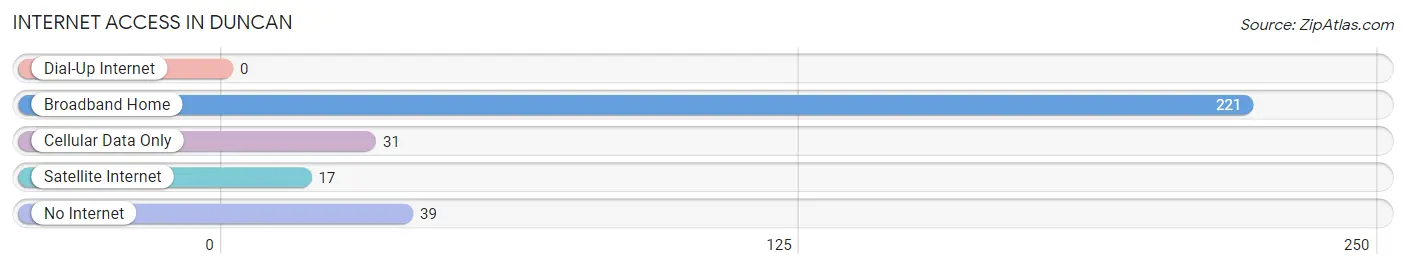
| Internet Type | # Households | % Households |
| Dial-Up Internet | 0 | 0.0% |
| Broadband Home | 221 | 66.8% |
| Cellular Data Only | 31 | 9.4% |
| Satellite Internet | 17 | 5.1% |
| No Internet | 39 | 11.8% |
| Total | 331 | 100.0% |
Duncan Summary
Duncan, Arizona is a small town located in Greenlee County in the southeastern corner of the state. It is situated at an elevation of 4,719 feet and is surrounded by the Coronado National Forest. The town was founded in 1881 by ranchers and miners and was named after James Duncan, a local rancher. The population of Duncan was 1,719 in the 2010 census.
Geography
Duncan is located in the southeastern corner of Arizona, near the New Mexico border. It is situated in the Gila River Valley, at an elevation of 4,719 feet. The town is surrounded by the Coronado National Forest, which provides a variety of recreational activities such as camping, hiking, and fishing. The town is also close to the Gila River, which is a popular spot for kayaking and rafting.
Climate
Duncan has a semi-arid climate, with hot summers and mild winters. The average high temperature in July is 95°F, and the average low temperature in January is 28°F. The town receives an average of 11 inches of precipitation per year, with most of it falling in the summer months.
Economy
The economy of Duncan is largely based on agriculture and ranching. The town is home to several large cattle ranches, as well as a number of smaller farms. The town also has a small manufacturing sector, with several small businesses producing a variety of products.
Demographics
As of the 2010 census, the population of Duncan was 1,719. The racial makeup of the town was 94.3% White, 0.7% African American, 0.7% Native American, 0.3% Asian, 0.1% Pacific Islander, 2.2% from other races, and 1.9% from two or more races. Hispanic or Latino of any race were 6.2% of the population.
The median income for a household in Duncan was $31,250, and the median income for a family was $35,417. The per capita income for the town was $15,945. About 16.2% of families and 19.2% of the population were below the poverty line, including 25.2% of those under age 18 and 10.2% of those age 65 or over.
Conclusion
Duncan, Arizona is a small town located in Greenlee County in the southeastern corner of the state. It is situated at an elevation of 4,719 feet and is surrounded by the Coronado National Forest. The town was founded in 1881 by ranchers and miners and was named after James Duncan, a local rancher. The economy of Duncan is largely based on agriculture and ranching, and the town has a population of 1,719 as of the 2010 census. The town has a semi-arid climate, with hot summers and mild winters, and receives an average of 11 inches of precipitation per year.
Common Questions
What is Per Capita Income in Duncan?
Per Capita income in Duncan is $19,804.
What is the Median Family Income in Duncan?
Median Family Income in Duncan is $48,056.
What is the Median Household income in Duncan?
Median Household Income in Duncan is $42,969.
What is Inequality or Gini Index in Duncan?
Inequality or Gini Index in Duncan is 0.40.
What is the Total Population of Duncan?
Total Population of Duncan is 879.
What is the Total Male Population of Duncan?
Total Male Population of Duncan is 396.
What is the Total Female Population of Duncan?
Total Female Population of Duncan is 483.
What is the Ratio of Males per 100 Females in Duncan?
There are 81.99 Males per 100 Females in Duncan.
What is the Ratio of Females per 100 Males in Duncan?
There are 121.97 Females per 100 Males in Duncan.
What is the Median Population Age in Duncan?
Median Population Age in Duncan is 31.4 Years.
What is the Average Family Size in Duncan
Average Family Size in Duncan is 3.8 People.
What is the Average Household Size in Duncan
Average Household Size in Duncan is 2.7 People.
How Large is the Labor Force in Duncan?
There are 230 People in the Labor Forcein in Duncan.
What is the Percentage of People in the Labor Force in Duncan?
35.7% of People are in the Labor Force in Duncan.
What is the Unemployment Rate in Duncan?
Unemployment Rate in Duncan is 8.7%.