Dennehotso, AZ Map & Demographics
Dennehotso Map
Dennehotso Overview
$11,628
PER CAPITA INCOME
$44,583
AVG FAMILY INCOME
$19,688
AVG HOUSEHOLD INCOME
36.3%
WAGE / INCOME GAP [ % ]
63.7¢/ $1
WAGE / INCOME GAP [ $ ]
0.54
INEQUALITY / GINI INDEX
560
TOTAL POPULATION
336
MALE POPULATION
224
FEMALE POPULATION
150.00
MALES / 100 FEMALES
66.67
FEMALES / 100 MALES
39.3
MEDIAN AGE
6.3
AVG FAMILY SIZE
4.3
AVG HOUSEHOLD SIZE
169
LABOR FORCE [ PEOPLE ]
34.8%
PERCENT IN LABOR FORCE
16.6%
UNEMPLOYMENT RATE
Dennehotso Zip Codes
Dennehotso Area Codes
Income in Dennehotso
Income Overview in Dennehotso
Per Capita Income in Dennehotso is $11,628, while median incomes of families and households are $44,583 and $19,688 respectively.
| Characteristic | Number | Measure |
| Per Capita Income | 560 | $11,628 |
| Median Family Income | 78 | $44,583 |
| Mean Family Income | 78 | $51,919 |
| Median Household Income | 130 | $19,688 |
| Mean Household Income | 130 | $38,147 |
| Income Deficit | 78 | $0 |
| Wage / Income Gap (%) | 560 | 36.32% |
| Wage / Income Gap ($) | 560 | 63.68¢ per $1 |
| Gini / Inequality Index | 560 | 0.54 |
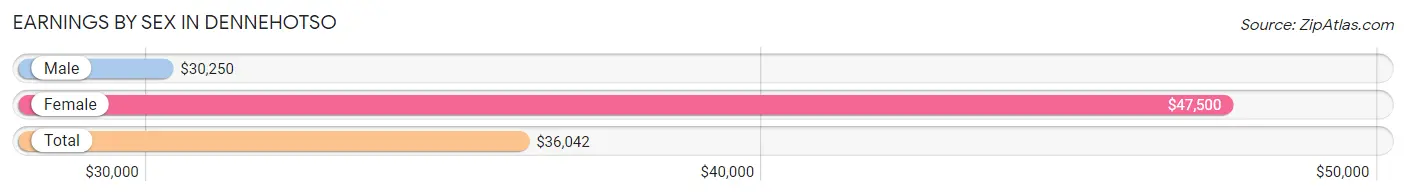
Earnings by Sex in Dennehotso
Average Earnings in Dennehotso are $36,042, $30,250 for men and $47,500 for women, a difference of 36.3%.
| Sex | Number | Average Earnings |
| Male | 81 (57.5%) | $30,250 |
| Female | 60 (42.5%) | $47,500 |
| Total | 141 (100.0%) | $36,042 |
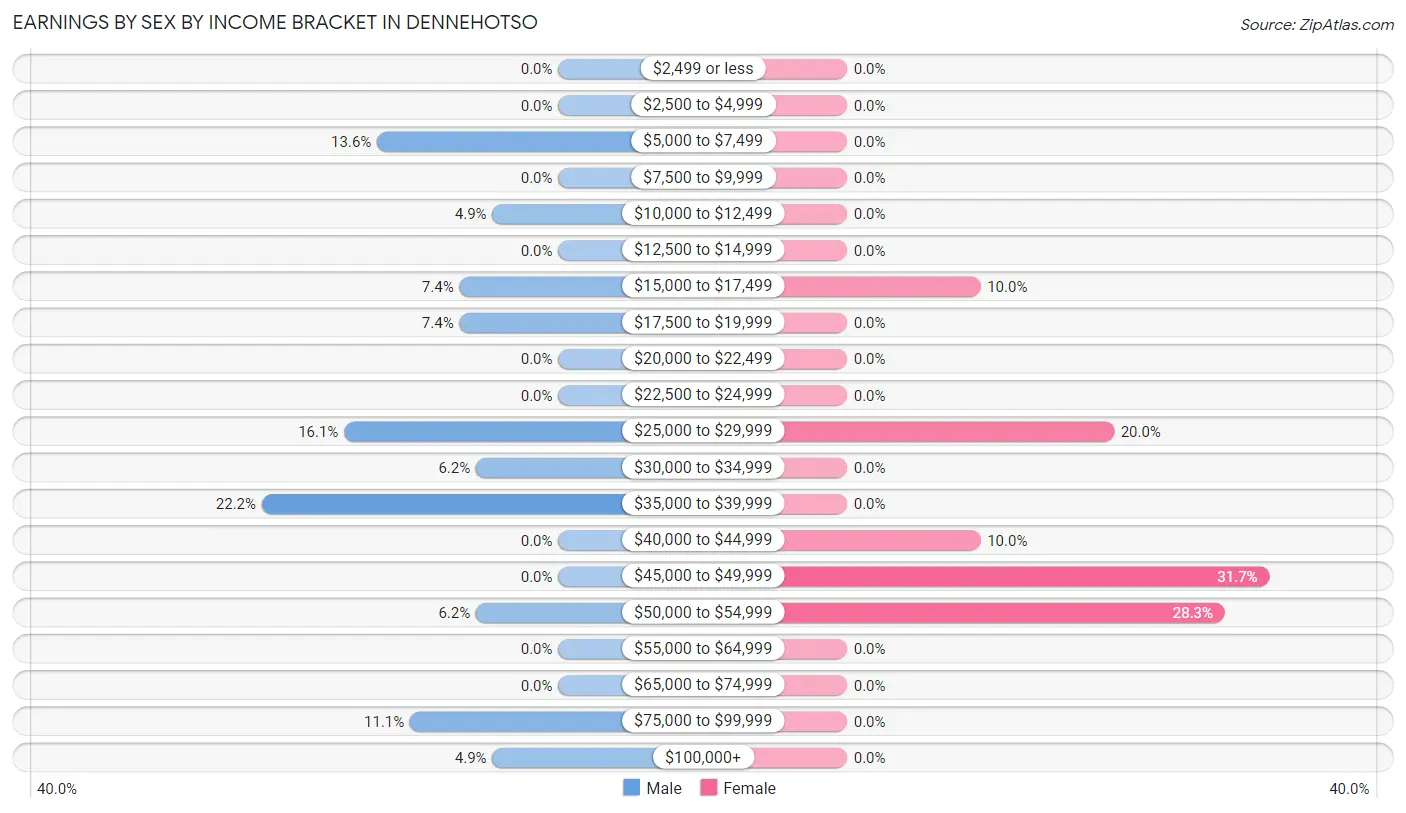
Earnings by Sex by Income Bracket in Dennehotso
The most common earnings brackets in Dennehotso are $35,000 to $39,999 for men (18 | 22.2%) and $45,000 to $49,999 for women (19 | 31.7%).
| Income | Male | Female |
| $2,499 or less | 0 (0.0%) | 0 (0.0%) |
| $2,500 to $4,999 | 0 (0.0%) | 0 (0.0%) |
| $5,000 to $7,499 | 11 (13.6%) | 0 (0.0%) |
| $7,500 to $9,999 | 0 (0.0%) | 0 (0.0%) |
| $10,000 to $12,499 | 4 (4.9%) | 0 (0.0%) |
| $12,500 to $14,999 | 0 (0.0%) | 0 (0.0%) |
| $15,000 to $17,499 | 6 (7.4%) | 6 (10.0%) |
| $17,500 to $19,999 | 6 (7.4%) | 0 (0.0%) |
| $20,000 to $22,499 | 0 (0.0%) | 0 (0.0%) |
| $22,500 to $24,999 | 0 (0.0%) | 0 (0.0%) |
| $25,000 to $29,999 | 13 (16.1%) | 12 (20.0%) |
| $30,000 to $34,999 | 5 (6.2%) | 0 (0.0%) |
| $35,000 to $39,999 | 18 (22.2%) | 0 (0.0%) |
| $40,000 to $44,999 | 0 (0.0%) | 6 (10.0%) |
| $45,000 to $49,999 | 0 (0.0%) | 19 (31.7%) |
| $50,000 to $54,999 | 5 (6.2%) | 17 (28.3%) |
| $55,000 to $64,999 | 0 (0.0%) | 0 (0.0%) |
| $65,000 to $74,999 | 0 (0.0%) | 0 (0.0%) |
| $75,000 to $99,999 | 9 (11.1%) | 0 (0.0%) |
| $100,000+ | 4 (4.9%) | 0 (0.0%) |
| Total | 81 (100.0%) | 60 (100.0%) |
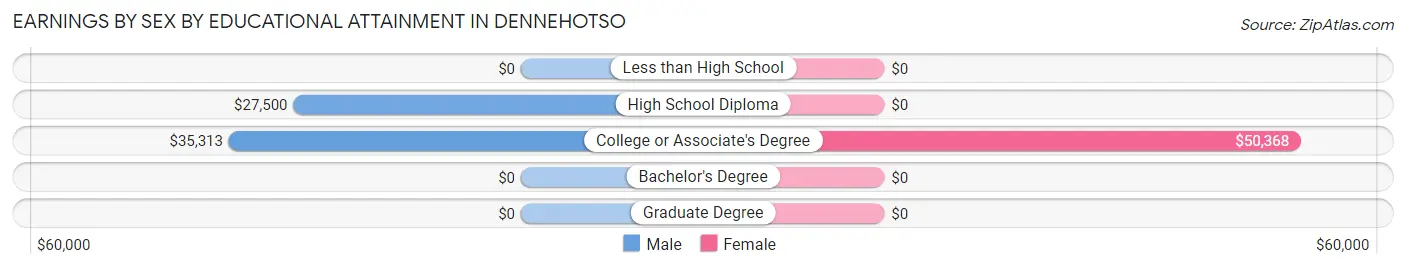
Earnings by Sex by Educational Attainment in Dennehotso
Average earnings in Dennehotso are $33,750 for men and $47,500 for women, a difference of 28.9%. Men with an educational attainment of college or associate's degree enjoy the highest average annual earnings of $35,313, while those with high school diploma education earn the least with $27,500. Women with an educational attainment of college or associate's degree earn the most with the average annual earnings of $50,368, while those with college or associate's degree education have the smallest earnings of $50,368.
| Educational Attainment | Male Income | Female Income |
| Less than High School | - | - |
| High School Diploma | $27,500 | $0 |
| College or Associate's Degree | $35,313 | $50,368 |
| Bachelor's Degree | - | - |
| Graduate Degree | - | - |
| Total | $33,750 | $47,500 |
Family Income in Dennehotso
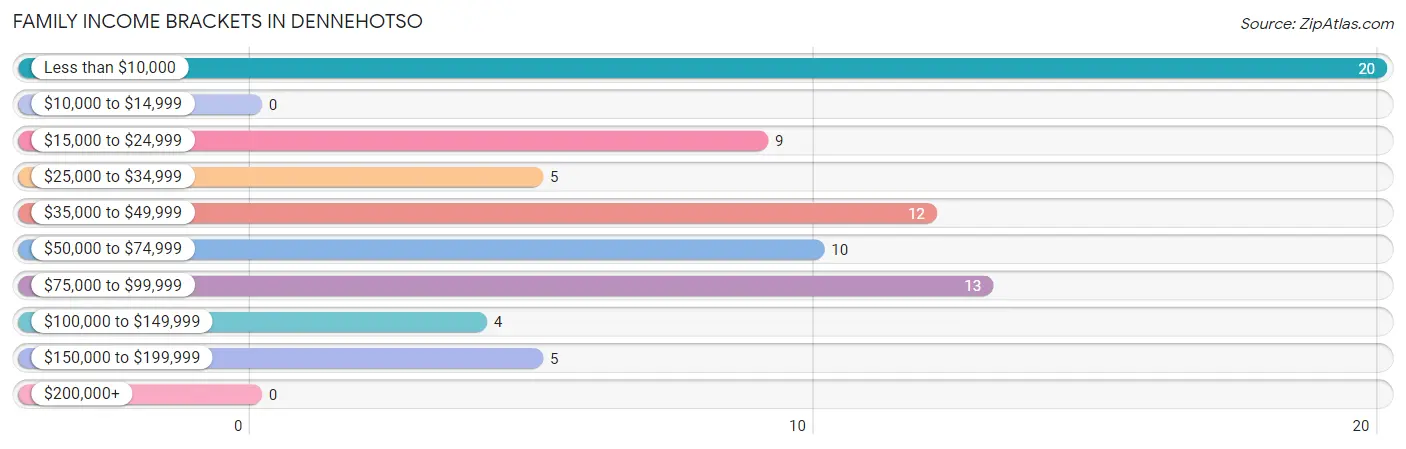
Family Income Brackets in Dennehotso
According to the Dennehotso family income data, there are 20 families falling into the less than $10,000 income range, which is the most common income bracket and makes up 25.6% of all families.
| Income Bracket | # Families | % Families |
| Less than $10,000 | 20 | 25.6% |
| $10,000 to $14,999 | 0 | 0.0% |
| $15,000 to $24,999 | 9 | 11.5% |
| $25,000 to $34,999 | 5 | 6.4% |
| $35,000 to $49,999 | 12 | 15.4% |
| $50,000 to $74,999 | 10 | 12.8% |
| $75,000 to $99,999 | 13 | 16.7% |
| $100,000 to $149,999 | 4 | 5.1% |
| $150,000 to $199,999 | 5 | 6.4% |
| $200,000+ | 0 | 0.0% |
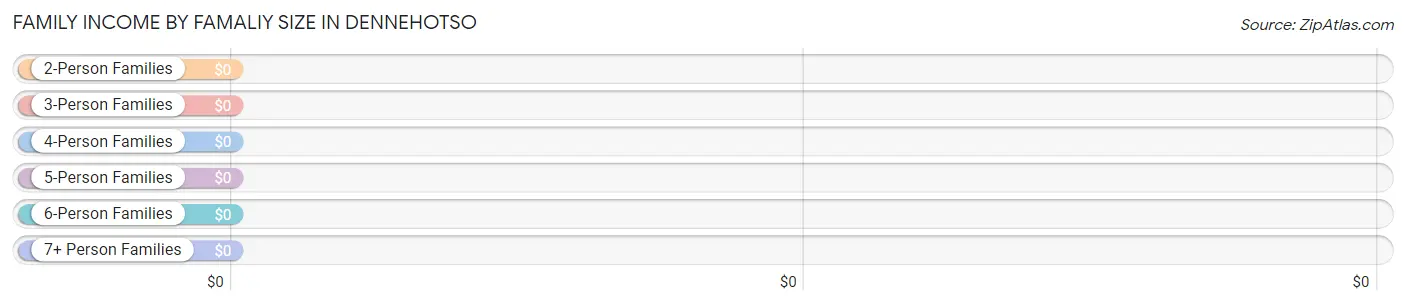
Family Income by Famaliy Size in Dennehotso
| Income Bracket | # Families | Median Income |
| 2-Person Families | 21 (26.9%) | $0 |
| 3-Person Families | 21 (26.9%) | $0 |
| 4-Person Families | 10 (12.8%) | $0 |
| 5-Person Families | 4 (5.1%) | $0 |
| 6-Person Families | 16 (20.5%) | $0 |
| 7+ Person Families | 6 (7.7%) | $0 |
| Total | 78 (100.0%) | $44,583 |
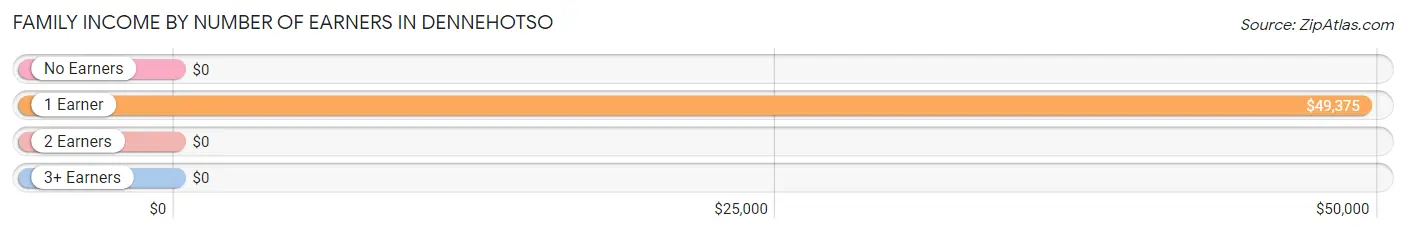
Family Income by Number of Earners in Dennehotso
| Number of Earners | # Families | Median Income |
| No Earners | 29 (37.2%) | $0 |
| 1 Earner | 31 (39.7%) | $49,375 |
| 2 Earners | 7 (9.0%) | $0 |
| 3+ Earners | 11 (14.1%) | $0 |
| Total | 78 (100.0%) | $44,583 |
Household Income in Dennehotso
Household Income Brackets in Dennehotso
With 29 households falling in the category, the less than $10,000 income range is the most frequent in Dennehotso, accounting for 22.3% of all households.
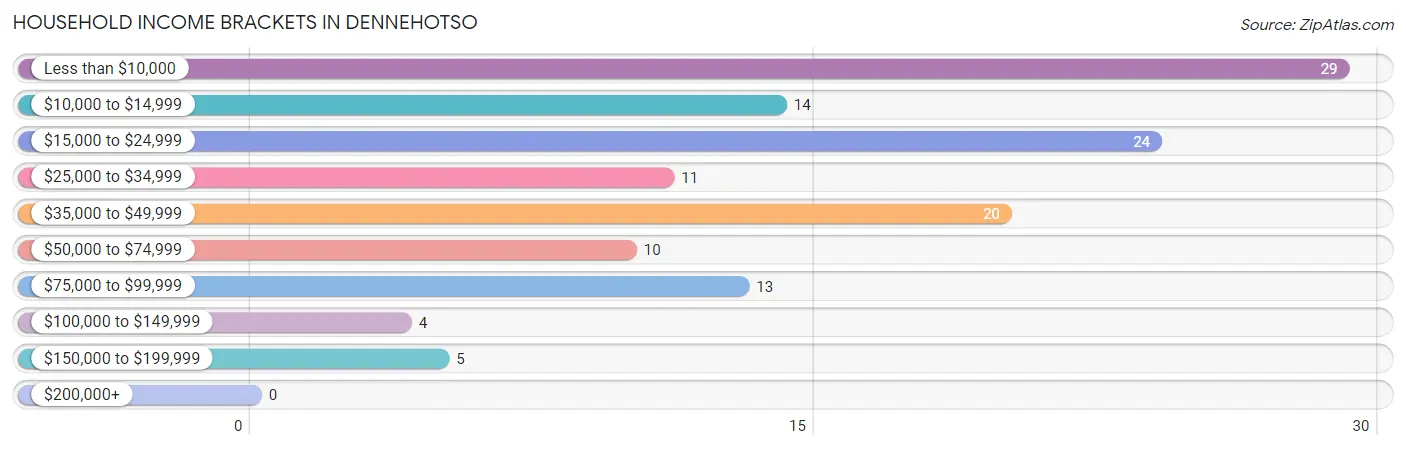
| Income Bracket | # Households | % Households |
| Less than $10,000 | 29 | 22.3% |
| $10,000 to $14,999 | 14 | 10.8% |
| $15,000 to $24,999 | 24 | 18.5% |
| $25,000 to $34,999 | 11 | 8.5% |
| $35,000 to $49,999 | 20 | 15.4% |
| $50,000 to $74,999 | 10 | 7.7% |
| $75,000 to $99,999 | 13 | 10.0% |
| $100,000 to $149,999 | 4 | 3.1% |
| $150,000 to $199,999 | 5 | 3.8% |
| $200,000+ | 0 | 0.0% |
Household Income by Householder Age in Dennehotso
The median household income in Dennehotso is $19,688, with the highest median household income of $18,750 found in the 45 to 64 years age bracket for the primary householder. A total of 90 households (69.2%) fall into this category.
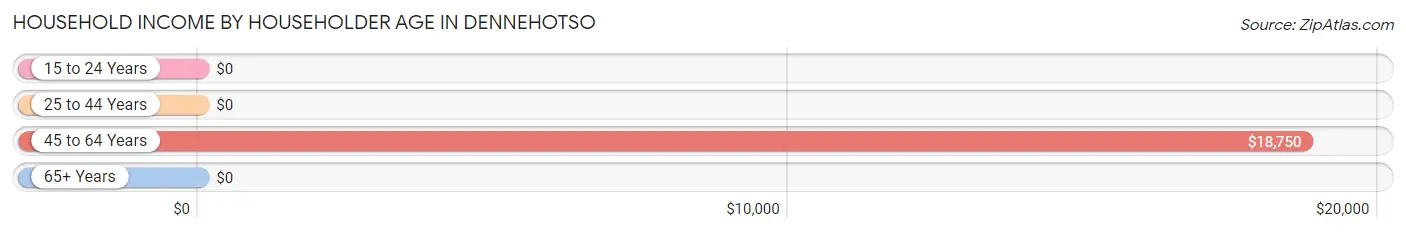
| Income Bracket | # Households | Median Income |
| 15 to 24 Years | 0 (0.0%) | $0 |
| 25 to 44 Years | 10 (7.7%) | $0 |
| 45 to 64 Years | 90 (69.2%) | $18,750 |
| 65+ Years | 30 (23.1%) | $0 |
| Total | 130 (100.0%) | $19,688 |
Poverty in Dennehotso
Income Below Poverty by Sex and Age in Dennehotso
With 34.2% poverty level for males and 34.8% for females among the residents of Dennehotso, under 5 year old males and 75 year old and over females are the most vulnerable to poverty, with 7 males (100.0%) and 4 females (100.0%) in their respective age groups living below the poverty level.
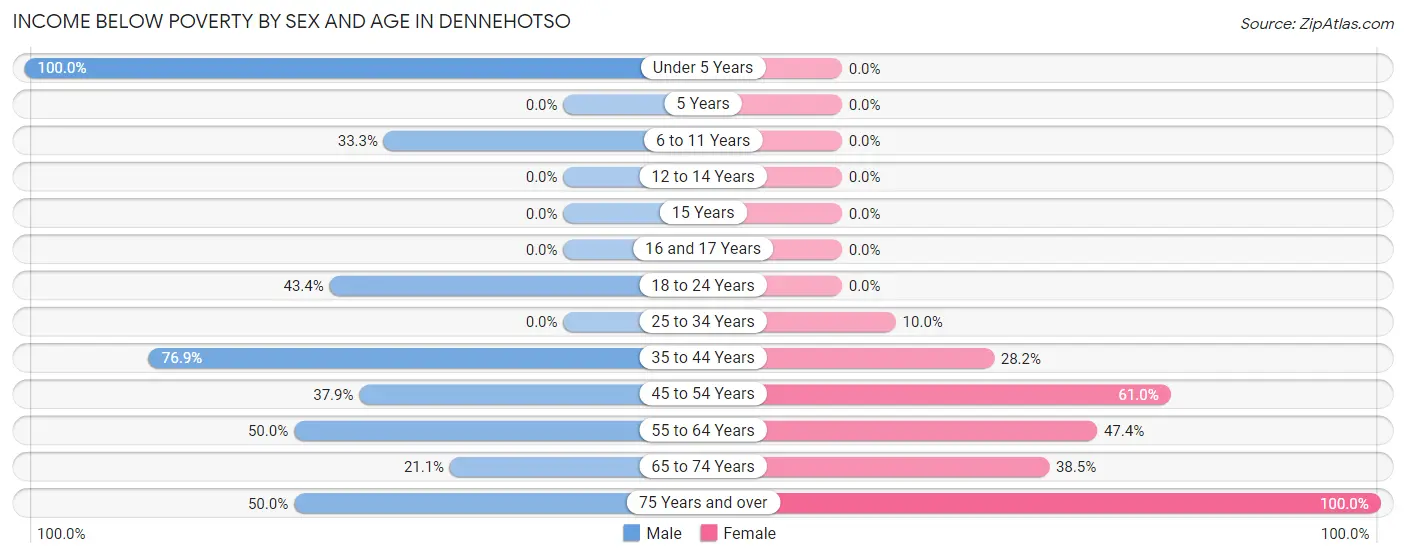
| Age Bracket | Male | Female |
| Under 5 Years | 7 (100.0%) | 0 (0.0%) |
| 5 Years | 0 (0.0%) | 0 (0.0%) |
| 6 to 11 Years | 8 (33.3%) | 0 (0.0%) |
| 12 to 14 Years | 0 (0.0%) | 0 (0.0%) |
| 15 Years | 0 (0.0%) | 0 (0.0%) |
| 16 and 17 Years | 0 (0.0%) | 0 (0.0%) |
| 18 to 24 Years | 23 (43.4%) | 0 (0.0%) |
| 25 to 34 Years | 0 (0.0%) | 4 (10.0%) |
| 35 to 44 Years | 20 (76.9%) | 11 (28.2%) |
| 45 to 54 Years | 25 (37.9%) | 36 (61.0%) |
| 55 to 64 Years | 24 (50.0%) | 18 (47.4%) |
| 65 to 74 Years | 4 (21.0%) | 5 (38.5%) |
| 75 Years and over | 4 (50.0%) | 4 (100.0%) |
| Total | 115 (34.2%) | 78 (34.8%) |
Income Above Poverty by Sex and Age in Dennehotso
According to the poverty statistics in Dennehotso, males aged 12 to 14 years and females aged under 5 years are the age groups that are most secure financially, with 100.0% of males and 100.0% of females in these age groups living above the poverty line.
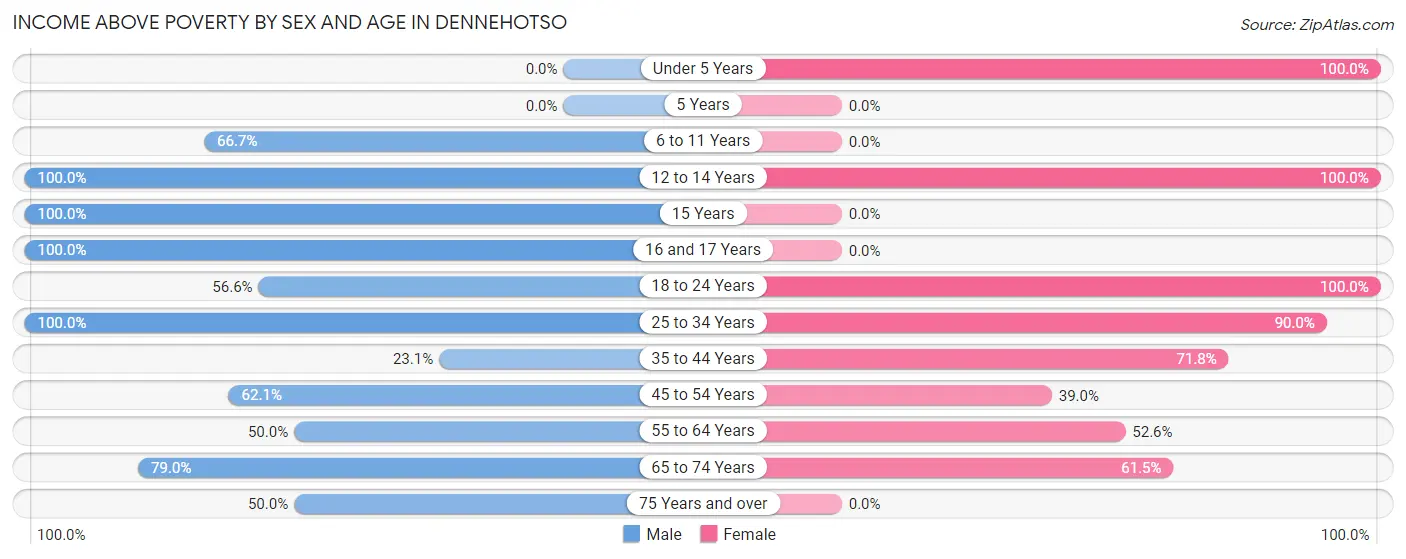
| Age Bracket | Male | Female |
| Under 5 Years | 0 (0.0%) | 11 (100.0%) |
| 5 Years | 0 (0.0%) | 0 (0.0%) |
| 6 to 11 Years | 16 (66.7%) | 0 (0.0%) |
| 12 to 14 Years | 16 (100.0%) | 9 (100.0%) |
| 15 Years | 7 (100.0%) | 0 (0.0%) |
| 16 and 17 Years | 18 (100.0%) | 0 (0.0%) |
| 18 to 24 Years | 30 (56.6%) | 11 (100.0%) |
| 25 to 34 Years | 44 (100.0%) | 36 (90.0%) |
| 35 to 44 Years | 6 (23.1%) | 28 (71.8%) |
| 45 to 54 Years | 41 (62.1%) | 23 (39.0%) |
| 55 to 64 Years | 24 (50.0%) | 20 (52.6%) |
| 65 to 74 Years | 15 (78.9%) | 8 (61.5%) |
| 75 Years and over | 4 (50.0%) | 0 (0.0%) |
| Total | 221 (65.8%) | 146 (65.2%) |
Income Below Poverty Among Married-Couple Families in Dennehotso
The poverty statistics for married-couple families in Dennehotso show that 42.2% or 19 of the total 45 families live below the poverty line. Families with no children have the highest poverty rate of 56.0%, comprising of 14 families. On the other hand, families with 3 or 4 children have the lowest poverty rate of 0.0%, which includes 0 families.
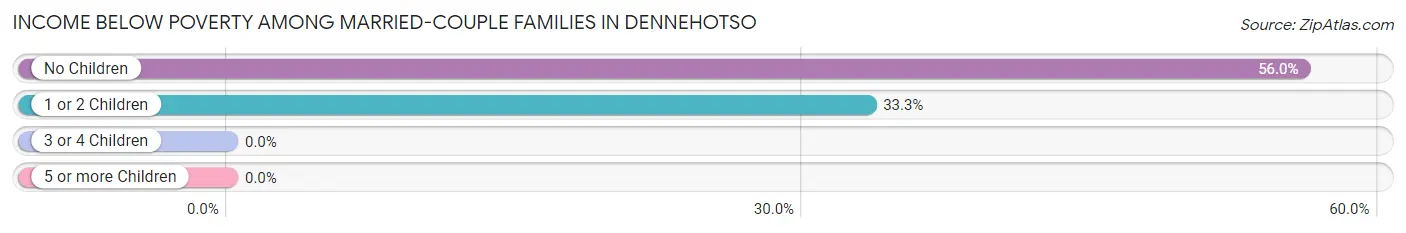
| Children | Above Poverty | Below Poverty |
| No Children | 11 (44.0%) | 14 (56.0%) |
| 1 or 2 Children | 10 (66.7%) | 5 (33.3%) |
| 3 or 4 Children | 5 (100.0%) | 0 (0.0%) |
| 5 or more Children | 0 (0.0%) | 0 (0.0%) |
| Total | 26 (57.8%) | 19 (42.2%) |
Income Below Poverty Among Single-Parent Households in Dennehotso
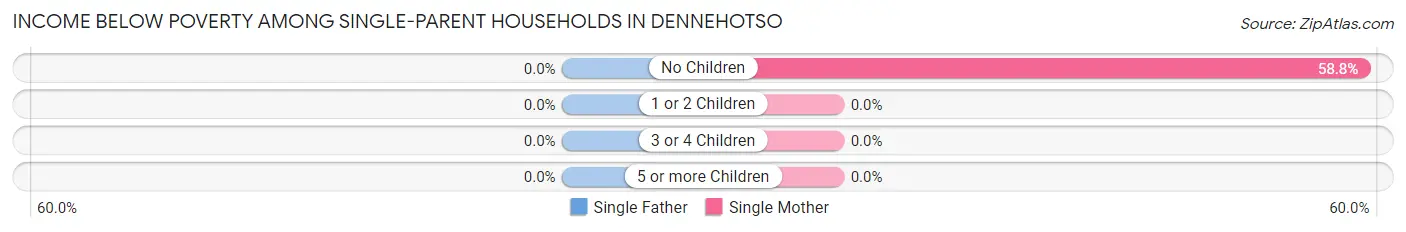
| Children | Single Father | Single Mother |
| No Children | 0 (0.0%) | 10 (58.8%) |
| 1 or 2 Children | 0 (0.0%) | 0 (0.0%) |
| 3 or 4 Children | 0 (0.0%) | 0 (0.0%) |
| 5 or more Children | 0 (0.0%) | 0 (0.0%) |
| Total | 0 (0.0%) | 10 (43.5%) |
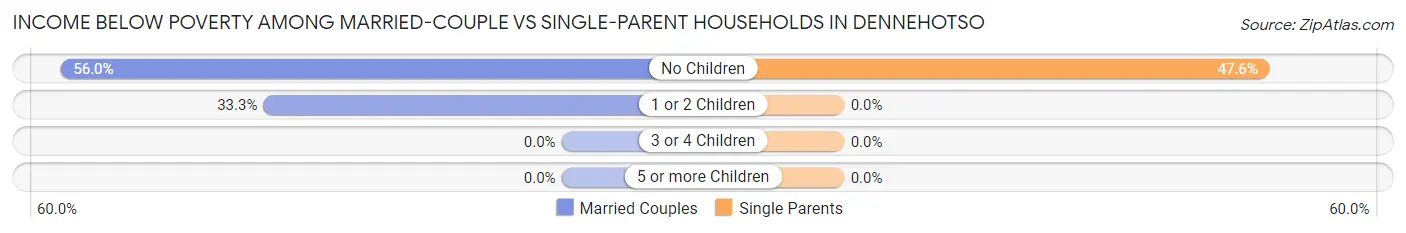
Income Below Poverty Among Married-Couple vs Single-Parent Households in Dennehotso
The poverty data for Dennehotso shows that 19 of the married-couple family households (42.2%) and 10 of the single-parent households (30.3%) are living below the poverty level. Within the married-couple family households, those with no children have the highest poverty rate, with 14 households (56.0%) falling below the poverty line. Among the single-parent households, those with no children have the highest poverty rate, with 10 household (47.6%) living below poverty.
| Children | Married-Couple Families | Single-Parent Households |
| No Children | 14 (56.0%) | 10 (47.6%) |
| 1 or 2 Children | 5 (33.3%) | 0 (0.0%) |
| 3 or 4 Children | 0 (0.0%) | 0 (0.0%) |
| 5 or more Children | 0 (0.0%) | 0 (0.0%) |
| Total | 19 (42.2%) | 10 (30.3%) |
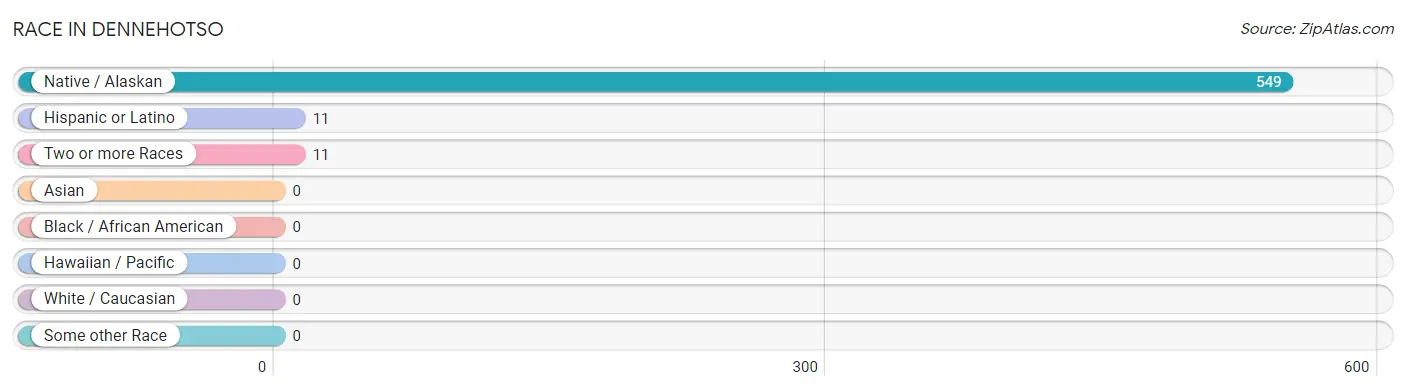
Race in Dennehotso
The most populous races in Dennehotso are Native / Alaskan (549 | 98.0%), Hispanic or Latino (11 | 2.0%), and Two or more Races (11 | 2.0%).
| Race | # Population | % Population |
| Asian | 0 | 0.0% |
| Black / African American | 0 | 0.0% |
| Hawaiian / Pacific | 0 | 0.0% |
| Hispanic or Latino | 11 | 2.0% |
| Native / Alaskan | 549 | 98.0% |
| White / Caucasian | 0 | 0.0% |
| Two or more Races | 11 | 2.0% |
| Some other Race | 0 | 0.0% |
| Total | 560 | 100.0% |
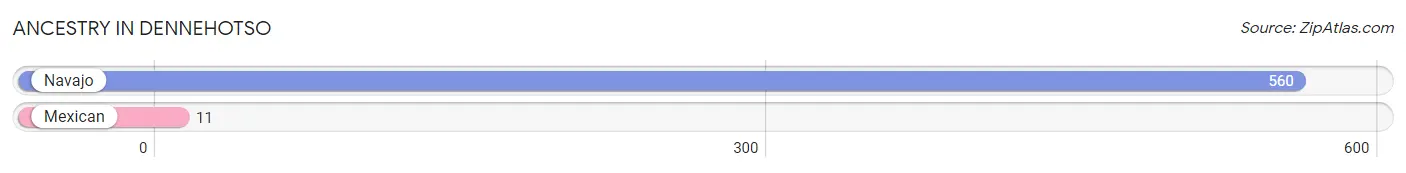
Ancestry in Dennehotso
The most populous ancestries reported in Dennehotso are Navajo (560 | 100.0%), and Mexican (11 | 2.0%), together accounting for 102.0% of all Dennehotso residents.
| Ancestry | # Population | % Population |
| Mexican | 11 | 2.0% |
| Navajo | 560 | 100.0% | View All 2 Rows |
Immigrants in Dennehotso

| Immigration Origin | # Population | % Population | View All 0 Rows |
Sex and Age in Dennehotso
Sex and Age in Dennehotso
The most populous age groups in Dennehotso are 20 to 24 Years (44 | 13.1%) for men and 50 to 54 Years (30 | 13.4%) for women.
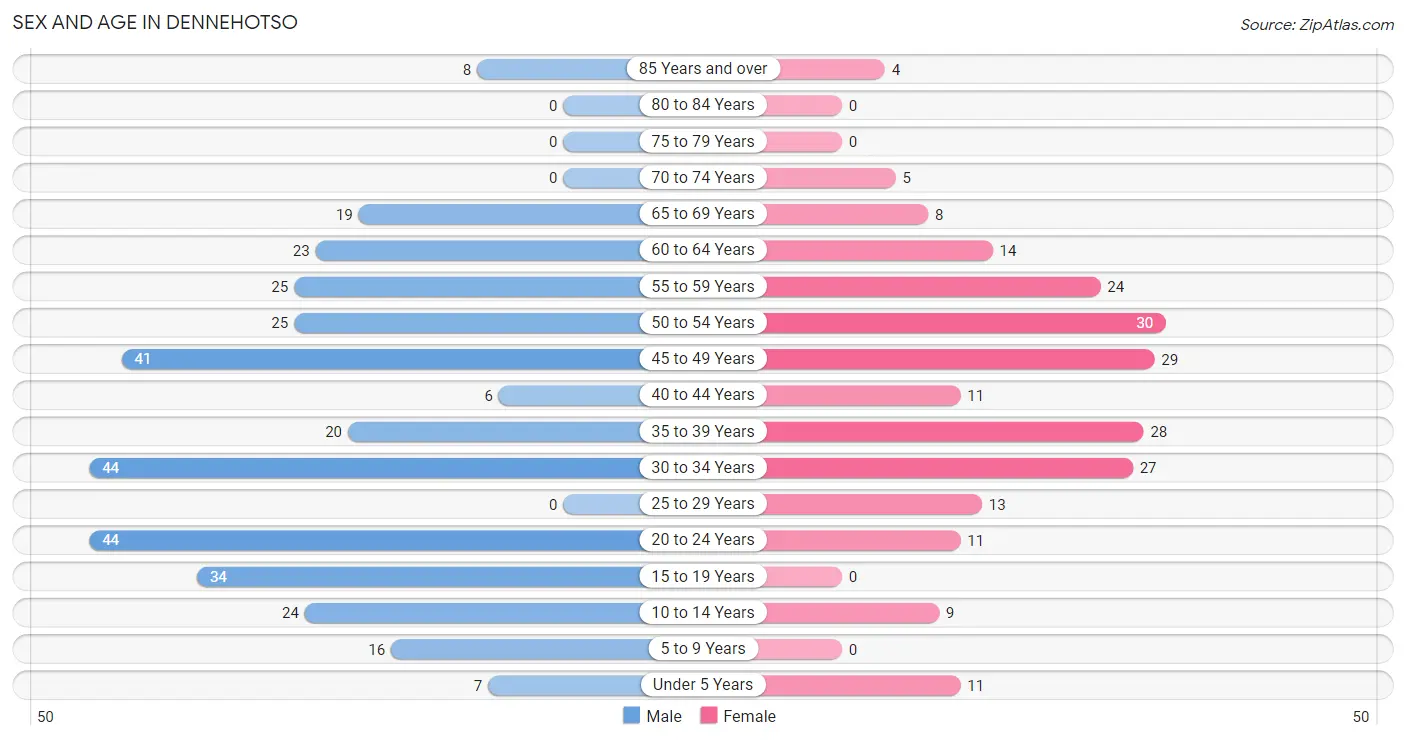
| Age Bracket | Male | Female |
| Under 5 Years | 7 (2.1%) | 11 (4.9%) |
| 5 to 9 Years | 16 (4.8%) | 0 (0.0%) |
| 10 to 14 Years | 24 (7.1%) | 9 (4.0%) |
| 15 to 19 Years | 34 (10.1%) | 0 (0.0%) |
| 20 to 24 Years | 44 (13.1%) | 11 (4.9%) |
| 25 to 29 Years | 0 (0.0%) | 13 (5.8%) |
| 30 to 34 Years | 44 (13.1%) | 27 (12.0%) |
| 35 to 39 Years | 20 (5.9%) | 28 (12.5%) |
| 40 to 44 Years | 6 (1.8%) | 11 (4.9%) |
| 45 to 49 Years | 41 (12.2%) | 29 (13.0%) |
| 50 to 54 Years | 25 (7.4%) | 30 (13.4%) |
| 55 to 59 Years | 25 (7.4%) | 24 (10.7%) |
| 60 to 64 Years | 23 (6.9%) | 14 (6.2%) |
| 65 to 69 Years | 19 (5.7%) | 8 (3.6%) |
| 70 to 74 Years | 0 (0.0%) | 5 (2.2%) |
| 75 to 79 Years | 0 (0.0%) | 0 (0.0%) |
| 80 to 84 Years | 0 (0.0%) | 0 (0.0%) |
| 85 Years and over | 8 (2.4%) | 4 (1.8%) |
| Total | 336 (100.0%) | 224 (100.0%) |
Families and Households in Dennehotso
Median Family Size in Dennehotso
The median family size in Dennehotso is 6.29 persons per family, with single male/father families (10 | 12.8%) accounting for the largest median family size of 12.2 persons per family. On the other hand, single female/mother families (23 | 29.5%) represent the smallest median family size with 4.30 persons per family.
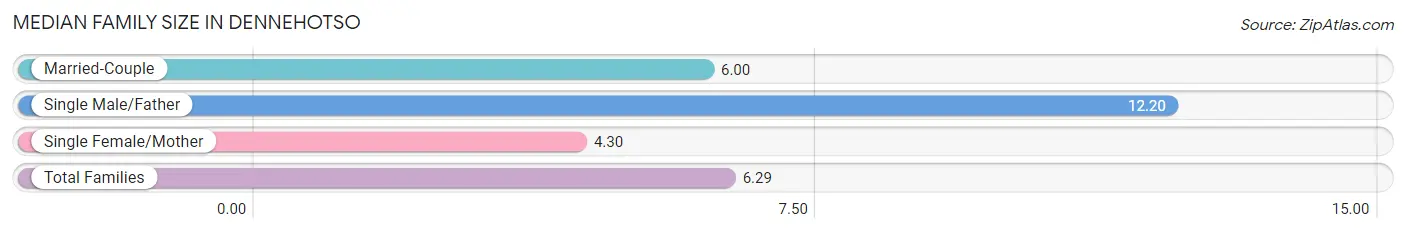
| Family Type | # Families | Family Size |
| Married-Couple | 45 (57.7%) | 6.00 |
| Single Male/Father | 10 (12.8%) | 12.20 |
| Single Female/Mother | 23 (29.5%) | 4.30 |
| Total Families | 78 (100.0%) | 6.29 |
Median Household Size in Dennehotso
The median household size in Dennehotso is 4.31 persons per household, with single male/father households (10 | 7.7%) accounting for the largest median household size of 12.2 persons per household. non-family households (52 | 40.0%) represent the smallest median household size with 1.21 persons per household.
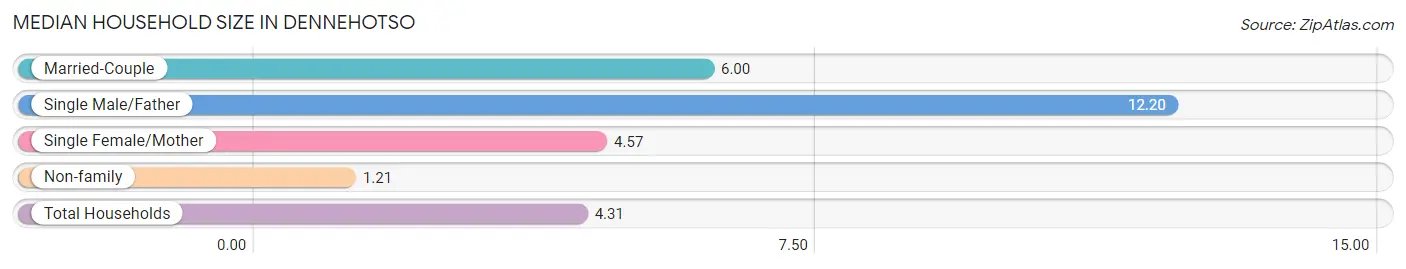
| Household Type | # Households | Household Size |
| Married-Couple | 45 (34.6%) | 6.00 |
| Single Male/Father | 10 (7.7%) | 12.20 |
| Single Female/Mother | 23 (17.7%) | 4.57 |
| Non-family | 52 (40.0%) | 1.21 |
| Total Households | 130 (100.0%) | 4.31 |
Household Size by Marriage Status in Dennehotso
Out of a total of 130 households in Dennehotso, 78 (60.0%) are family households, while 52 (40.0%) are nonfamily households. The most numerous type of family households are 3-person households, comprising 27, and the most common type of nonfamily households are 1-person households, comprising 40.
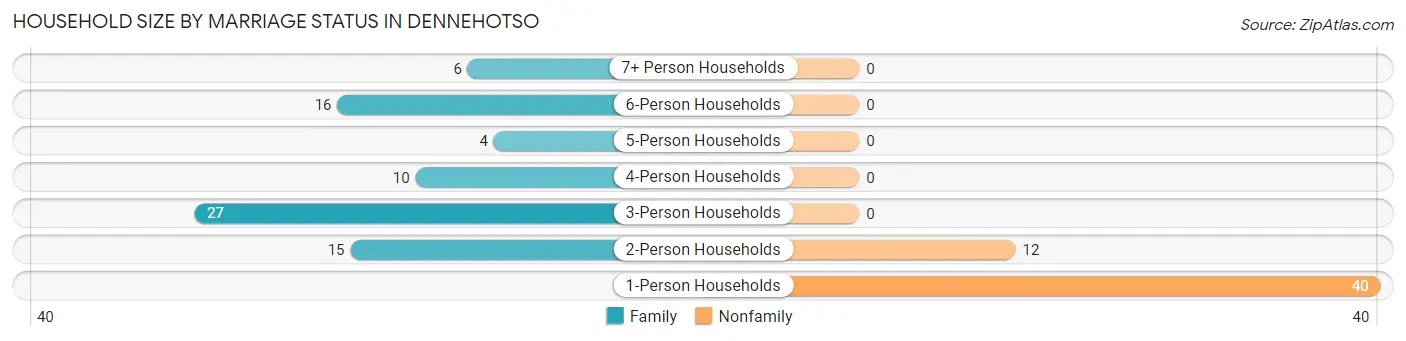
| Household Size | Family Households | Nonfamily Households |
| 1-Person Households | - | 40 (30.8%) |
| 2-Person Households | 15 (11.5%) | 12 (9.2%) |
| 3-Person Households | 27 (20.8%) | 0 (0.0%) |
| 4-Person Households | 10 (7.7%) | 0 (0.0%) |
| 5-Person Households | 4 (3.1%) | 0 (0.0%) |
| 6-Person Households | 16 (12.3%) | 0 (0.0%) |
| 7+ Person Households | 6 (4.6%) | 0 (0.0%) |
| Total | 78 (60.0%) | 52 (40.0%) |
Female Fertility in Dennehotso
Fertility by Age in Dennehotso
| Age Bracket | Women with Births | Births / 1,000 Women |
| 15 to 19 years | 0 (0.0%) | 0.0 |
| 20 to 34 years | 0 (0.0%) | 0.0 |
| 35 to 50 years | 0 (0.0%) | 0.0 |
| Total | 0 (0.0%) | 0.0 |
Fertility by Age by Marriage Status in Dennehotso
| Age Bracket | Married | Unmarried |
| 15 to 19 years | 0 (0.0%) | 0 (0.0%) |
| 20 to 34 years | 0 (0.0%) | 0 (0.0%) |
| 35 to 50 years | 0 (0.0%) | 0 (0.0%) |
| Total | 0 (0.0%) | 0 (0.0%) |
Fertility by Education in Dennehotso
| Educational Attainment | Women with Births | Births / 1,000 Women |
| Less than High School | 0 (0.0%) | 0.0 |
| High School Diploma | 0 (0.0%) | 0.0 |
| College or Associate's Degree | 0 (0.0%) | 0.0 |
| Bachelor's Degree | 0 (0.0%) | 0.0 |
| Graduate Degree | 0 (0.0%) | 0.0 |
| Total | 0 (0.0%) | 0.0 |
Fertility by Education by Marriage Status in Dennehotso
| Educational Attainment | Married | Unmarried |
| Less than High School | 0 (0.0%) | 0 (0.0%) |
| High School Diploma | 0 (0.0%) | 0 (0.0%) |
| College or Associate's Degree | 0 (0.0%) | 0 (0.0%) |
| Bachelor's Degree | 0 (0.0%) | 0 (0.0%) |
| Graduate Degree | 0 (0.0%) | 0 (0.0%) |
| Total | 0 (0.0%) | 0 (0.0%) |
Employment Characteristics in Dennehotso
Employment by Class of Employer in Dennehotso
Among the 141 employed individuals in Dennehotso, private company employees (74 | 52.5%), local government employees (21 | 14.9%), and federal government employees (19 | 13.5%) make up the most common classes of employment.
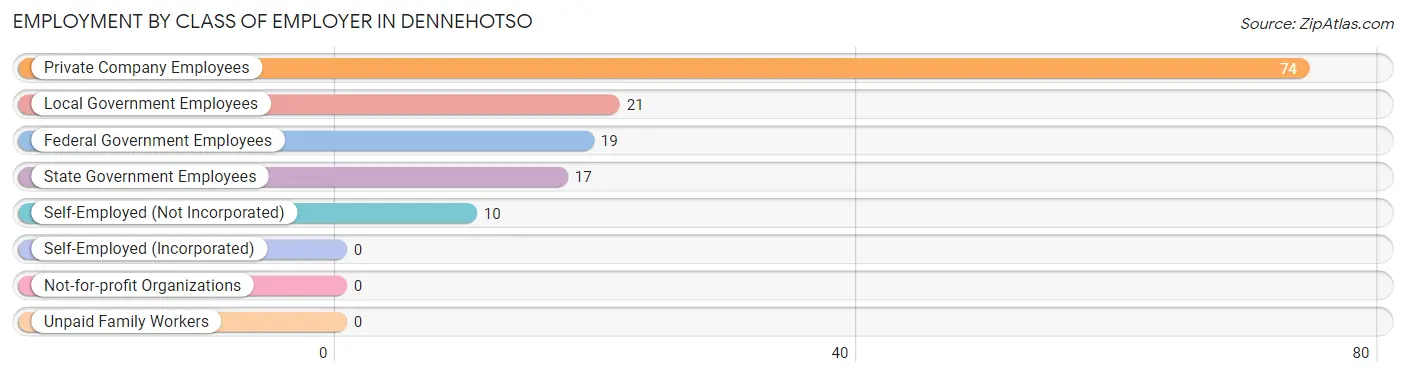
| Employer Class | # Employees | % Employees |
| Private Company Employees | 74 | 52.5% |
| Self-Employed (Incorporated) | 0 | 0.0% |
| Self-Employed (Not Incorporated) | 10 | 7.1% |
| Not-for-profit Organizations | 0 | 0.0% |
| Local Government Employees | 21 | 14.9% |
| State Government Employees | 17 | 12.1% |
| Federal Government Employees | 19 | 13.5% |
| Unpaid Family Workers | 0 | 0.0% |
| Total | 141 | 100.0% |
Employment Status by Age in Dennehotso
According to the labor force statistics for Dennehotso, out of the total population over 16 years of age (486), 34.8% or 169 individuals are in the labor force, with 16.6% or 28 of them unemployed. The age group with the highest labor force participation rate is 16 to 19 years, with 59.3% or 16 individuals in the labor force. Within the labor force, the 30 to 34 years age range has the highest percentage of unemployed individuals, with 64.7% or 22 of them being unemployed.
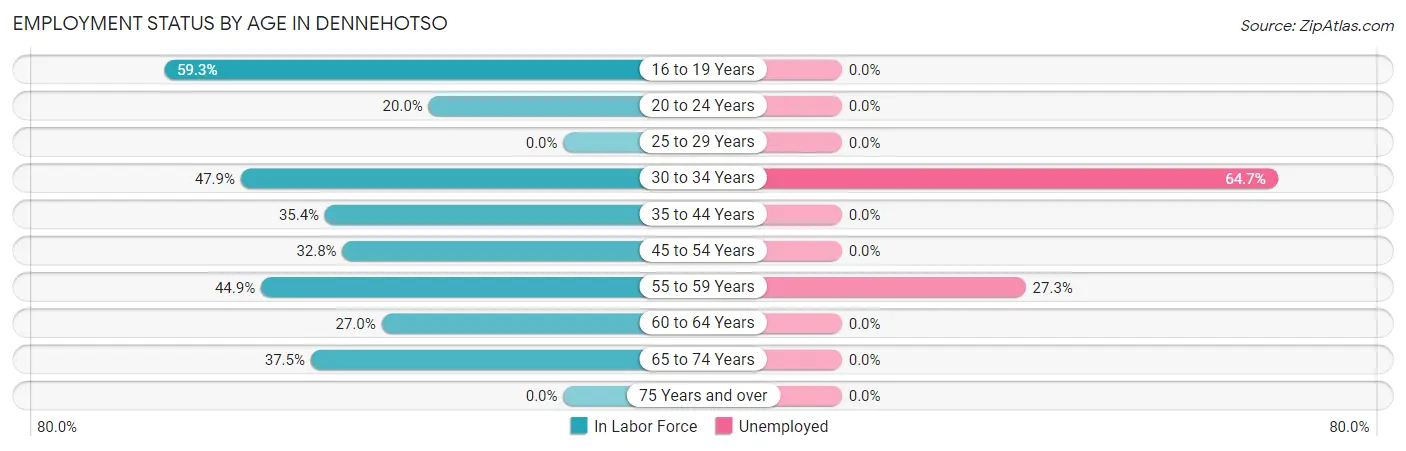
| Age Bracket | In Labor Force | Unemployed |
| 16 to 19 Years | 16 (59.3%) | 0 (0.0%) |
| 20 to 24 Years | 11 (20.0%) | 0 (0.0%) |
| 25 to 29 Years | 0 (0.0%) | 0 (0.0%) |
| 30 to 34 Years | 34 (47.9%) | 22 (64.7%) |
| 35 to 44 Years | 23 (35.4%) | 0 (0.0%) |
| 45 to 54 Years | 41 (32.8%) | 0 (0.0%) |
| 55 to 59 Years | 22 (44.9%) | 6 (27.3%) |
| 60 to 64 Years | 10 (27.0%) | 0 (0.0%) |
| 65 to 74 Years | 12 (37.5%) | 0 (0.0%) |
| 75 Years and over | 0 (0.0%) | 0 (0.0%) |
| Total | 169 (34.8%) | 28 (16.6%) |
Employment Status by Educational Attainment in Dennehotso
According to labor force statistics for Dennehotso, 36.1% of individuals (130) out of the total population between 25 and 64 years of age (360) are in the labor force, with 21.5% or 28 of them being unemployed. The group with the highest labor force participation rate are those with the educational attainment of bachelor's degree or higher, with 100.0% or 10 individuals in the labor force. Within the labor force, individuals with college / associate degree education have the highest percentage of unemployment, with 26.2% or 17 of them being unemployed.
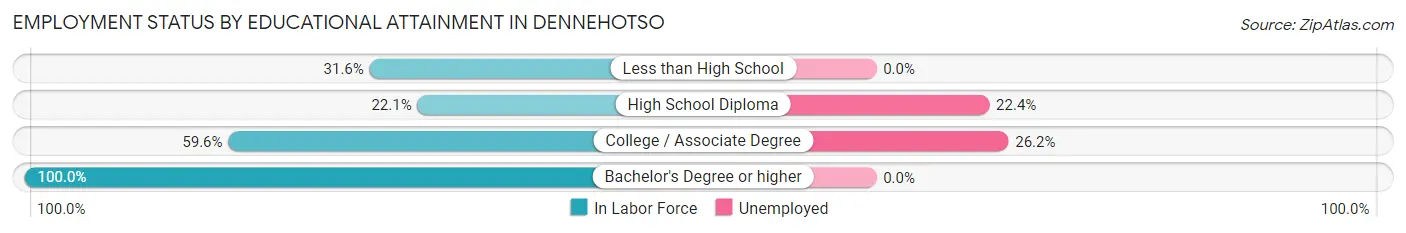
| Educational Attainment | In Labor Force | Unemployed |
| Less than High School | 6 (31.6%) | 0 (0.0%) |
| High School Diploma | 49 (22.1%) | 50 (22.4%) |
| College / Associate Degree | 65 (59.6%) | 29 (26.2%) |
| Bachelor's Degree or higher | 10 (100.0%) | 0 (0.0%) |
| Total | 130 (36.1%) | 77 (21.5%) |
Employment Occupations by Sex in Dennehotso
Management, Business, Science and Arts Occupations
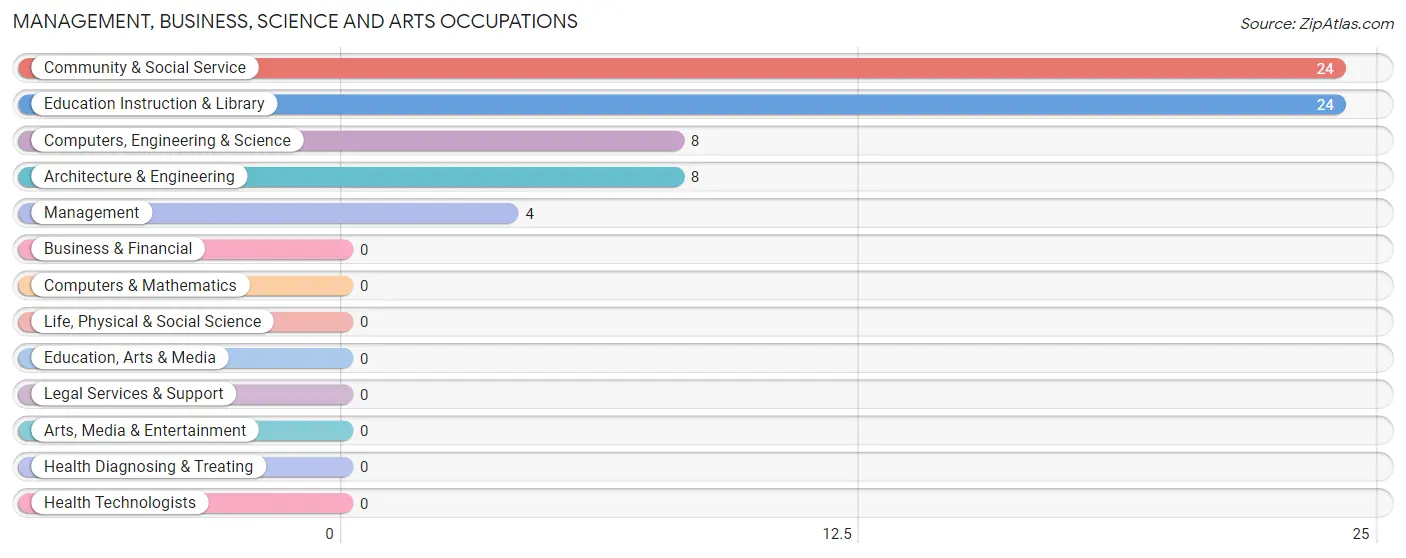
The most common Management, Business, Science and Arts occupations in Dennehotso are Community & Social Service (24 | 17.0%), Education Instruction & Library (24 | 17.0%), Computers, Engineering & Science (8 | 5.7%), Architecture & Engineering (8 | 5.7%), and Management (4 | 2.8%).
Management, Business, Science and Arts Occupations by Sex
Within the Management, Business, Science and Arts occupations in Dennehotso, the most male-oriented occupations are Management (100.0%), Computers, Engineering & Science (100.0%), and Architecture & Engineering (100.0%), while the most female-oriented occupations are Community & Social Service (100.0%), and Education Instruction & Library (100.0%).
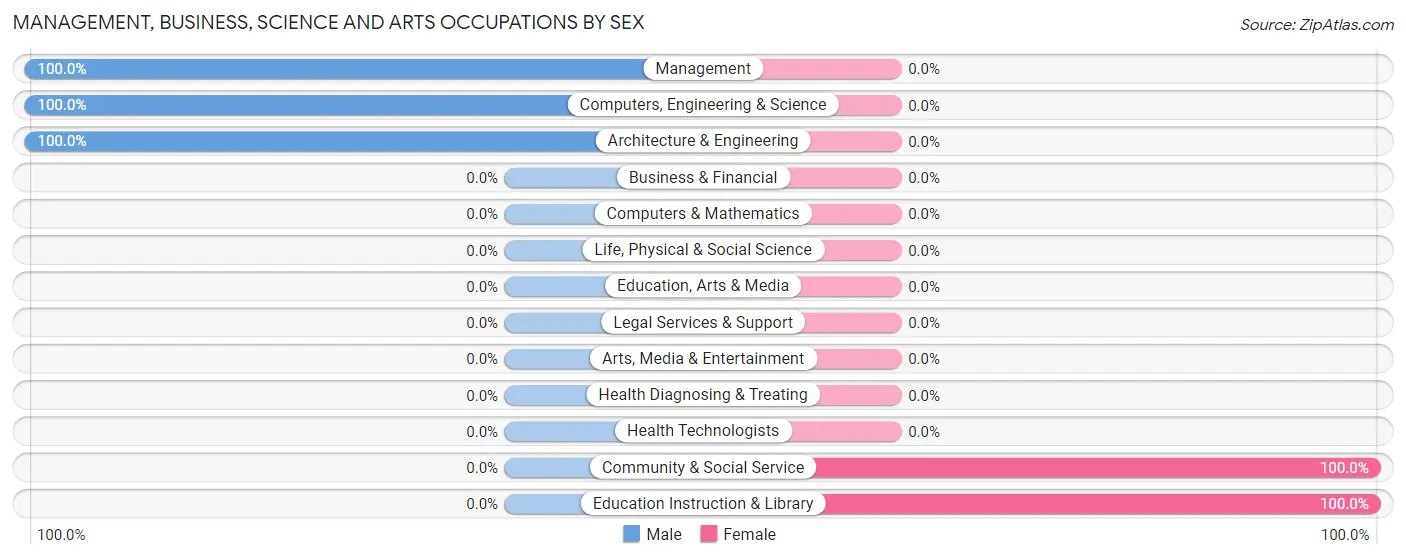
| Occupation | Male | Female |
| Management | 4 (100.0%) | 0 (0.0%) |
| Business & Financial | 0 (0.0%) | 0 (0.0%) |
| Computers, Engineering & Science | 8 (100.0%) | 0 (0.0%) |
| Computers & Mathematics | 0 (0.0%) | 0 (0.0%) |
| Architecture & Engineering | 8 (100.0%) | 0 (0.0%) |
| Life, Physical & Social Science | 0 (0.0%) | 0 (0.0%) |
| Community & Social Service | 0 (0.0%) | 24 (100.0%) |
| Education, Arts & Media | 0 (0.0%) | 0 (0.0%) |
| Legal Services & Support | 0 (0.0%) | 0 (0.0%) |
| Education Instruction & Library | 0 (0.0%) | 24 (100.0%) |
| Arts, Media & Entertainment | 0 (0.0%) | 0 (0.0%) |
| Health Diagnosing & Treating | 0 (0.0%) | 0 (0.0%) |
| Health Technologists | 0 (0.0%) | 0 (0.0%) |
| Total (Category) | 12 (33.3%) | 24 (66.7%) |
| Total (Overall) | 81 (57.5%) | 60 (42.5%) |
Services Occupations
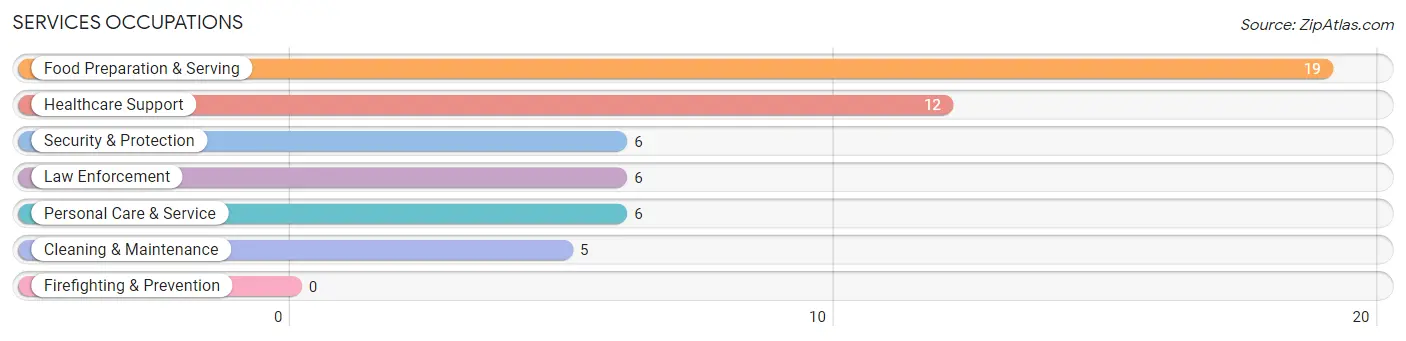
The most common Services occupations in Dennehotso are Food Preparation & Serving (19 | 13.5%), Healthcare Support (12 | 8.5%), Security & Protection (6 | 4.3%), Law Enforcement (6 | 4.3%), and Personal Care & Service (6 | 4.3%).
Services Occupations by Sex
Within the Services occupations in Dennehotso, the most male-oriented occupations are Security & Protection (100.0%), Law Enforcement (100.0%), and Cleaning & Maintenance (100.0%), while the most female-oriented occupations are Healthcare Support (100.0%), Personal Care & Service (100.0%), and Food Preparation & Serving (63.2%).
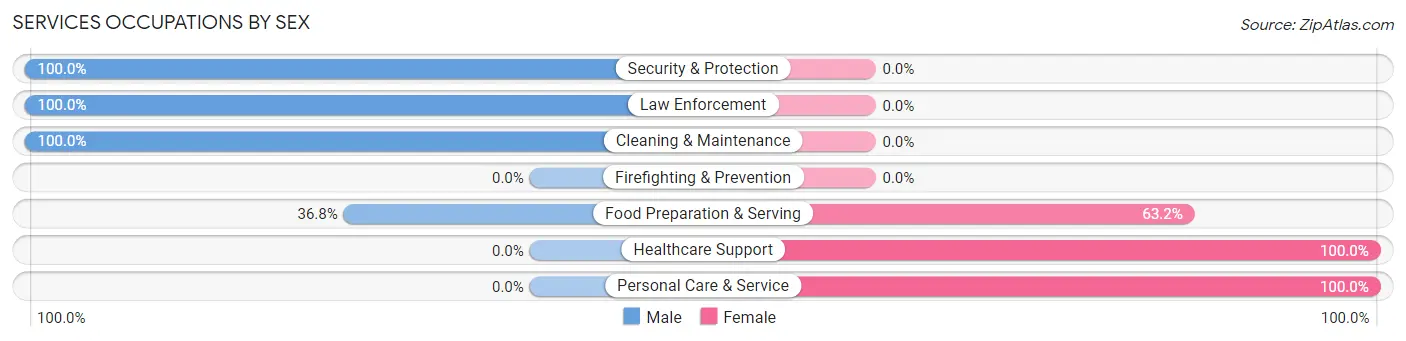
| Occupation | Male | Female |
| Healthcare Support | 0 (0.0%) | 12 (100.0%) |
| Security & Protection | 6 (100.0%) | 0 (0.0%) |
| Firefighting & Prevention | 0 (0.0%) | 0 (0.0%) |
| Law Enforcement | 6 (100.0%) | 0 (0.0%) |
| Food Preparation & Serving | 7 (36.8%) | 12 (63.2%) |
| Cleaning & Maintenance | 5 (100.0%) | 0 (0.0%) |
| Personal Care & Service | 0 (0.0%) | 6 (100.0%) |
| Total (Category) | 18 (37.5%) | 30 (62.5%) |
| Total (Overall) | 81 (57.5%) | 60 (42.5%) |
Sales and Office Occupations
The most common Sales and Office occupations in Dennehotso are , and Sales & Related (10 | 7.1%).
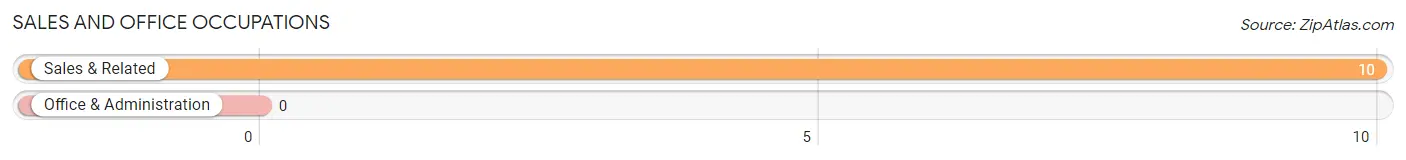
Sales and Office Occupations by Sex
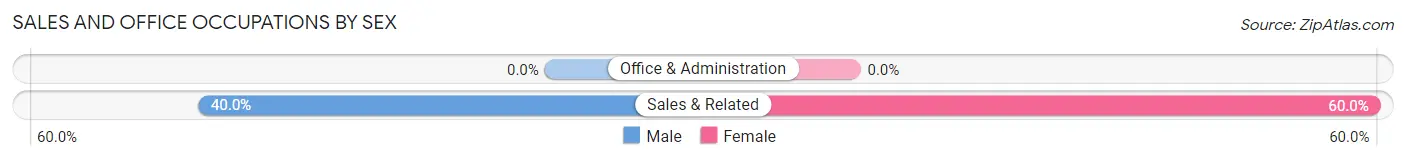
| Occupation | Male | Female |
| Sales & Related | 4 (40.0%) | 6 (60.0%) |
| Office & Administration | 0 (0.0%) | 0 (0.0%) |
| Total (Category) | 4 (40.0%) | 6 (60.0%) |
| Total (Overall) | 81 (57.5%) | 60 (42.5%) |
Natural Resources, Construction and Maintenance Occupations
The most common Natural Resources, Construction and Maintenance occupations in Dennehotso are , and Construction & Extraction (30 | 21.3%).
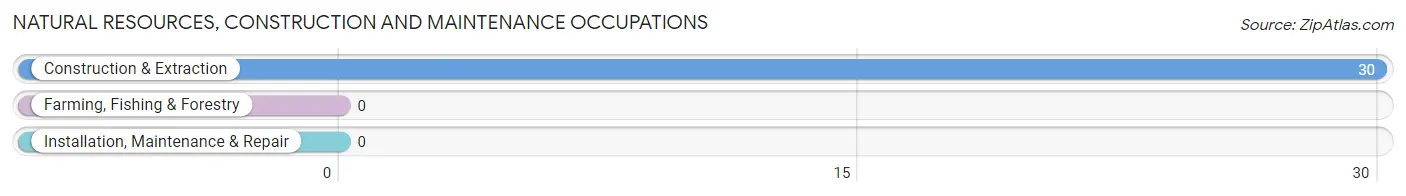
Natural Resources, Construction and Maintenance Occupations by Sex
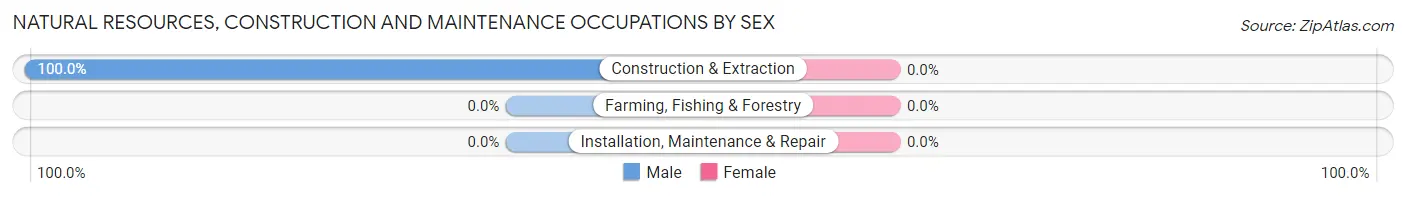
| Occupation | Male | Female |
| Farming, Fishing & Forestry | 0 (0.0%) | 0 (0.0%) |
| Construction & Extraction | 30 (100.0%) | 0 (0.0%) |
| Installation, Maintenance & Repair | 0 (0.0%) | 0 (0.0%) |
| Total (Category) | 30 (100.0%) | 0 (0.0%) |
| Total (Overall) | 81 (57.5%) | 60 (42.5%) |
Production, Transportation and Moving Occupations
The most common Production, Transportation and Moving occupations in Dennehotso are Production (11 | 7.8%), and Transportation (6 | 4.3%).
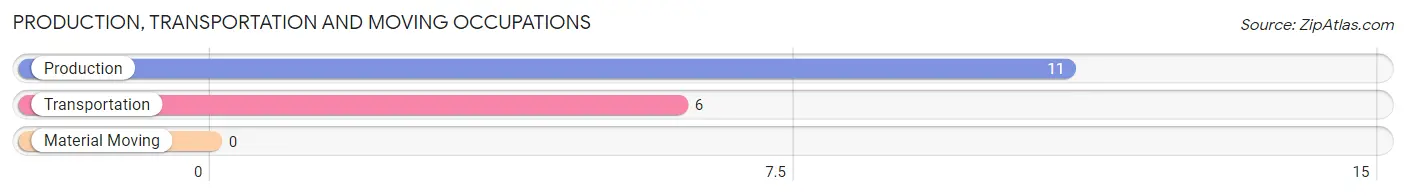
Production, Transportation and Moving Occupations by Sex
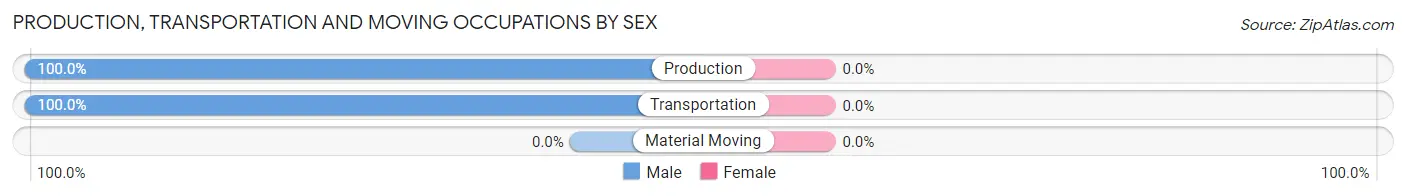
| Occupation | Male | Female |
| Production | 11 (100.0%) | 0 (0.0%) |
| Transportation | 6 (100.0%) | 0 (0.0%) |
| Material Moving | 0 (0.0%) | 0 (0.0%) |
| Total (Category) | 17 (100.0%) | 0 (0.0%) |
| Total (Overall) | 81 (57.5%) | 60 (42.5%) |
Employment Industries by Sex in Dennehotso
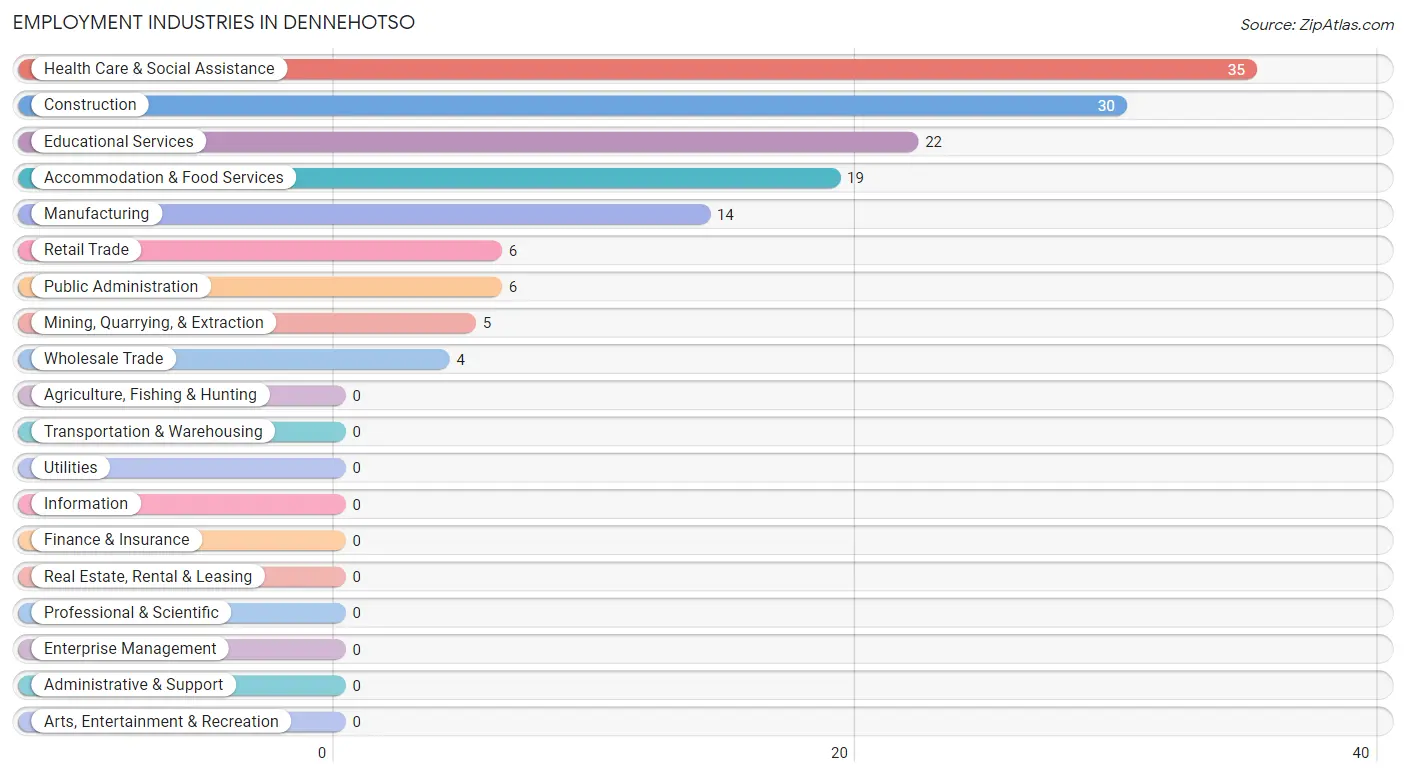
Employment Industries in Dennehotso
The major employment industries in Dennehotso include Health Care & Social Assistance (35 | 24.8%), Construction (30 | 21.3%), Educational Services (22 | 15.6%), Accommodation & Food Services (19 | 13.5%), and Manufacturing (14 | 9.9%).
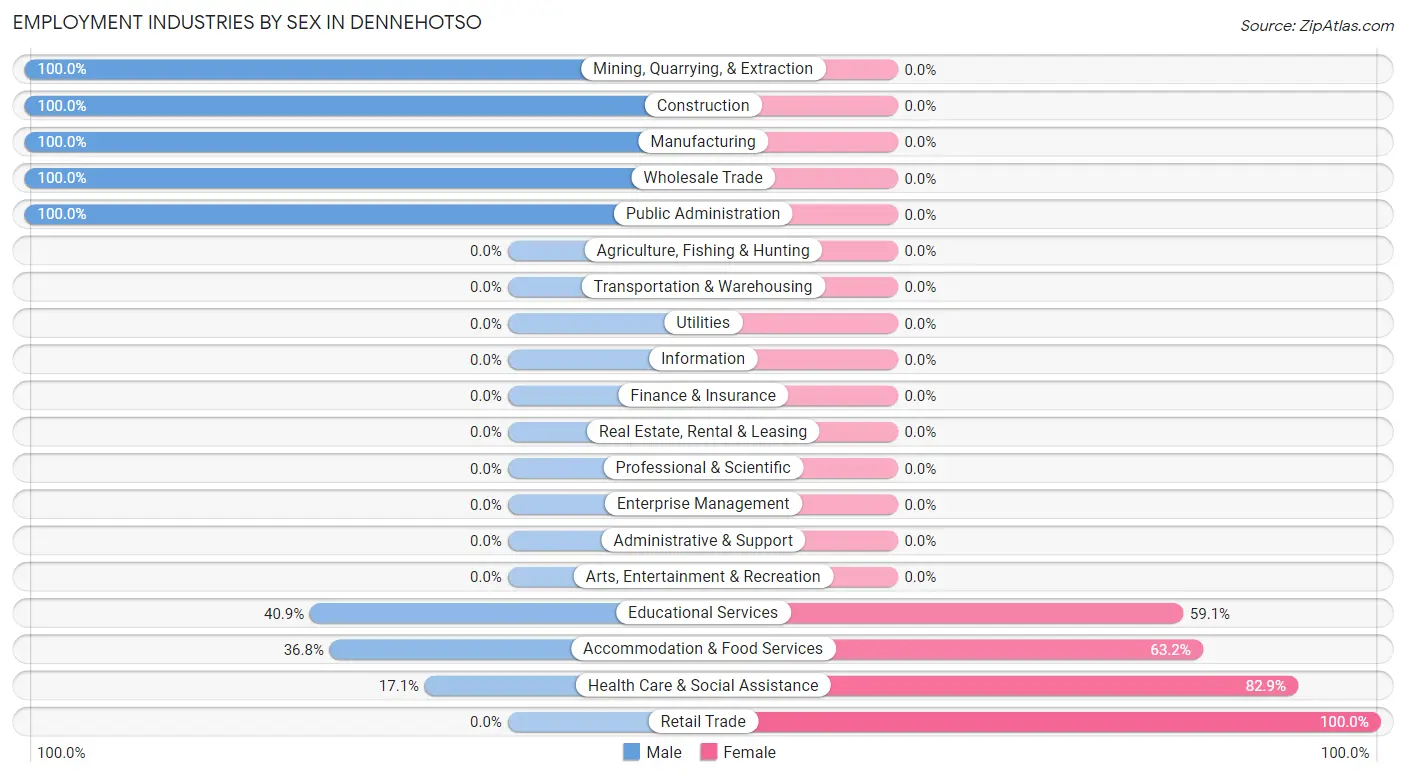
Employment Industries by Sex in Dennehotso
The Dennehotso industries that see more men than women are Mining, Quarrying, & Extraction (100.0%), Construction (100.0%), and Manufacturing (100.0%), whereas the industries that tend to have a higher number of women are Retail Trade (100.0%), Health Care & Social Assistance (82.9%), and Accommodation & Food Services (63.2%).
| Industry | Male | Female |
| Agriculture, Fishing & Hunting | 0 (0.0%) | 0 (0.0%) |
| Mining, Quarrying, & Extraction | 5 (100.0%) | 0 (0.0%) |
| Construction | 30 (100.0%) | 0 (0.0%) |
| Manufacturing | 14 (100.0%) | 0 (0.0%) |
| Wholesale Trade | 4 (100.0%) | 0 (0.0%) |
| Retail Trade | 0 (0.0%) | 6 (100.0%) |
| Transportation & Warehousing | 0 (0.0%) | 0 (0.0%) |
| Utilities | 0 (0.0%) | 0 (0.0%) |
| Information | 0 (0.0%) | 0 (0.0%) |
| Finance & Insurance | 0 (0.0%) | 0 (0.0%) |
| Real Estate, Rental & Leasing | 0 (0.0%) | 0 (0.0%) |
| Professional & Scientific | 0 (0.0%) | 0 (0.0%) |
| Enterprise Management | 0 (0.0%) | 0 (0.0%) |
| Administrative & Support | 0 (0.0%) | 0 (0.0%) |
| Educational Services | 9 (40.9%) | 13 (59.1%) |
| Health Care & Social Assistance | 6 (17.1%) | 29 (82.9%) |
| Arts, Entertainment & Recreation | 0 (0.0%) | 0 (0.0%) |
| Accommodation & Food Services | 7 (36.8%) | 12 (63.2%) |
| Public Administration | 6 (100.0%) | 0 (0.0%) |
| Total | 81 (57.5%) | 60 (42.5%) |
Education in Dennehotso
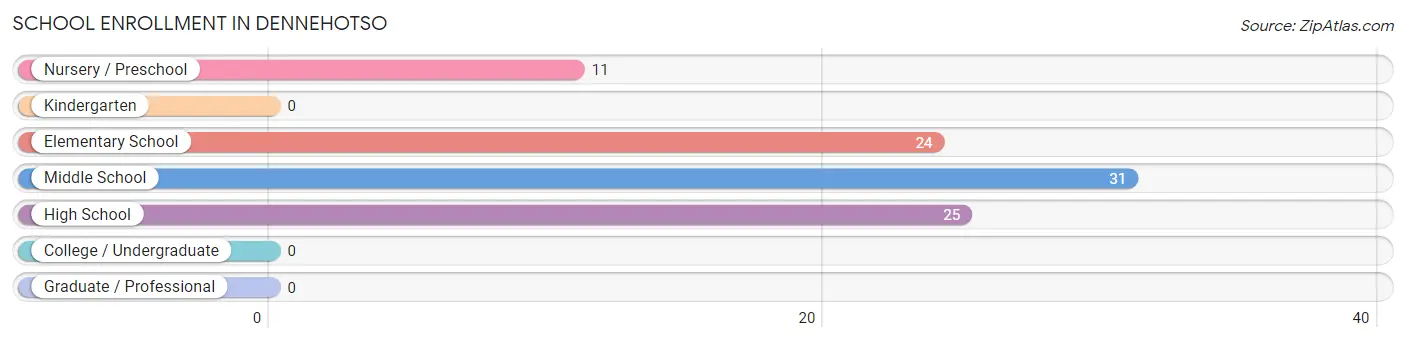
School Enrollment in Dennehotso
The most common levels of schooling among the 91 students in Dennehotso are middle school (31 | 34.1%), high school (25 | 27.5%), and elementary school (24 | 26.4%).
| School Level | # Students | % Students |
| Nursery / Preschool | 11 | 12.1% |
| Kindergarten | 0 | 0.0% |
| Elementary School | 24 | 26.4% |
| Middle School | 31 | 34.1% |
| High School | 25 | 27.5% |
| College / Undergraduate | 0 | 0.0% |
| Graduate / Professional | 0 | 0.0% |
| Total | 91 | 100.0% |
School Enrollment by Age by Funding Source in Dennehotso
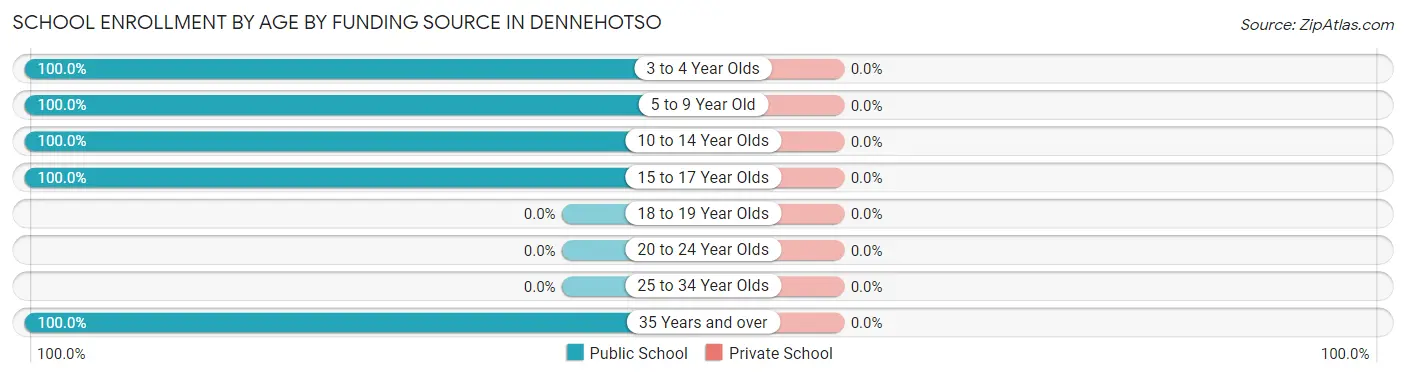
| Age Bracket | Public School | Private School |
| 3 to 4 Year Olds | 11 (100.0%) | 0 (0.0%) |
| 5 to 9 Year Old | 16 (100.0%) | 0 (0.0%) |
| 10 to 14 Year Olds | 33 (100.0%) | 0 (0.0%) |
| 15 to 17 Year Olds | 25 (100.0%) | 0 (0.0%) |
| 18 to 19 Year Olds | 0 (0.0%) | 0 (0.0%) |
| 20 to 24 Year Olds | 0 (0.0%) | 0 (0.0%) |
| 25 to 34 Year Olds | 0 (0.0%) | 0 (0.0%) |
| 35 Years and over | 6 (100.0%) | 0 (0.0%) |
| Total | 91 (100.0%) | 0 (0.0%) |
Educational Attainment by Field of Study in Dennehotso
Education (11 | 64.7%), and science & technology (6 | 35.3%) are the most common fields of study among 17 individuals in Dennehotso who have obtained a bachelor's degree or higher.
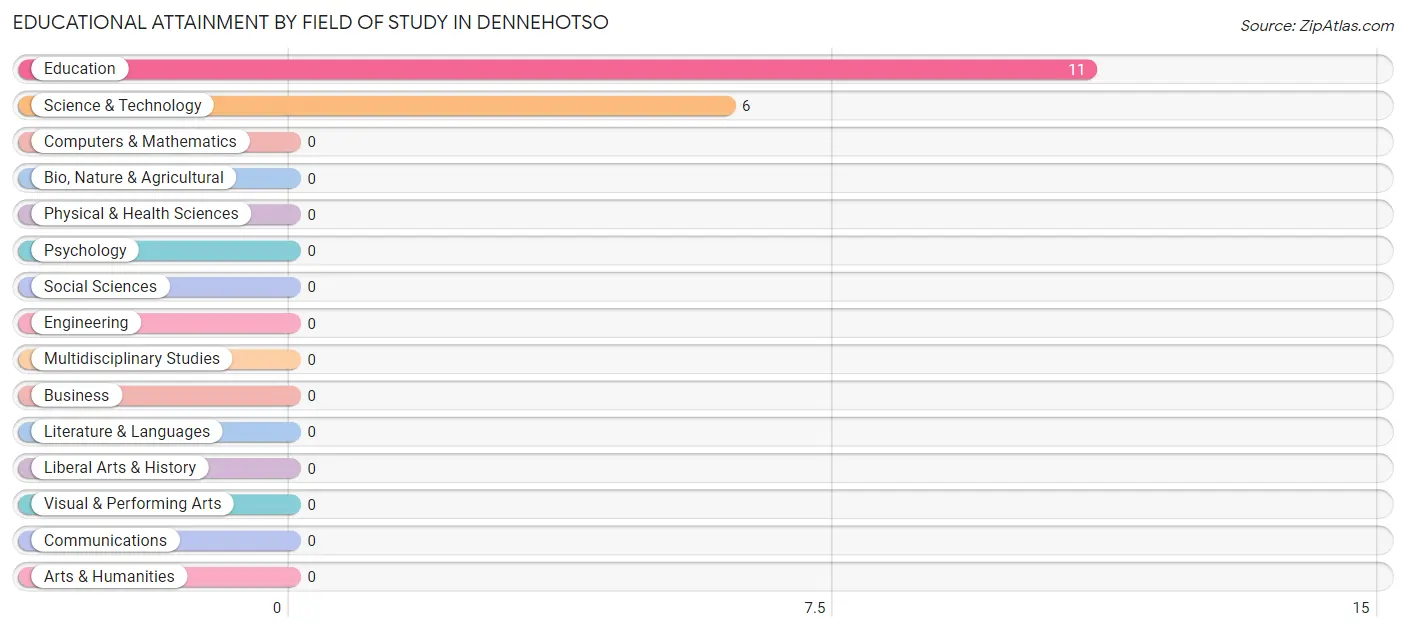
| Field of Study | # Graduates | % Graduates |
| Computers & Mathematics | 0 | 0.0% |
| Bio, Nature & Agricultural | 0 | 0.0% |
| Physical & Health Sciences | 0 | 0.0% |
| Psychology | 0 | 0.0% |
| Social Sciences | 0 | 0.0% |
| Engineering | 0 | 0.0% |
| Multidisciplinary Studies | 0 | 0.0% |
| Science & Technology | 6 | 35.3% |
| Business | 0 | 0.0% |
| Education | 11 | 64.7% |
| Literature & Languages | 0 | 0.0% |
| Liberal Arts & History | 0 | 0.0% |
| Visual & Performing Arts | 0 | 0.0% |
| Communications | 0 | 0.0% |
| Arts & Humanities | 0 | 0.0% |
| Total | 17 | 100.0% |
Transportation & Commute in Dennehotso
Vehicle Availability by Sex in Dennehotso
The most prevalent vehicle ownership categories in Dennehotso are males with 2 vehicles (58, accounting for 71.6%) and females with 2 vehicles (12, making up 96.7%).
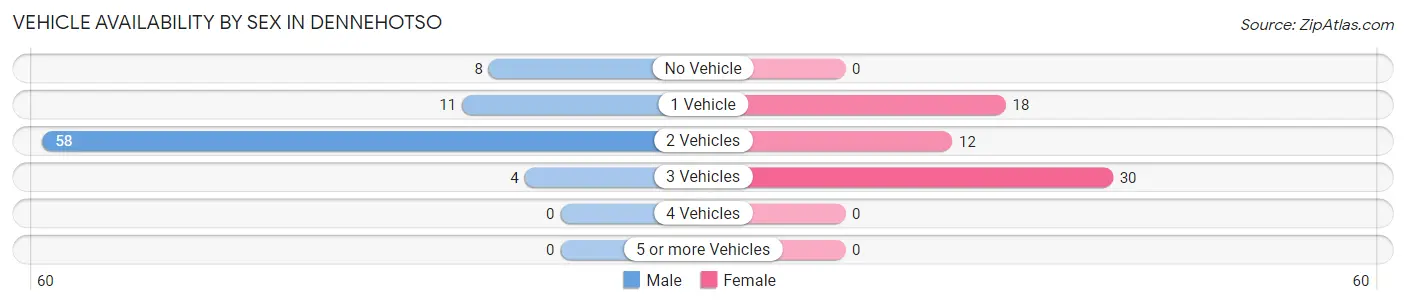
| Vehicles Available | Male | Female |
| No Vehicle | 8 (9.9%) | 0 (0.0%) |
| 1 Vehicle | 11 (13.6%) | 18 (30.0%) |
| 2 Vehicles | 58 (71.6%) | 12 (20.0%) |
| 3 Vehicles | 4 (4.9%) | 30 (50.0%) |
| 4 Vehicles | 0 (0.0%) | 0 (0.0%) |
| 5 or more Vehicles | 0 (0.0%) | 0 (0.0%) |
| Total | 81 (100.0%) | 60 (100.0%) |
Commute Time in Dennehotso
The most frequently occuring commute durations in Dennehotso are 30 to 34 minutes (56 commuters, 40.9%), 45 to 59 minutes (26 commuters, 19.0%), and 5 to 9 minutes (12 commuters, 8.8%).
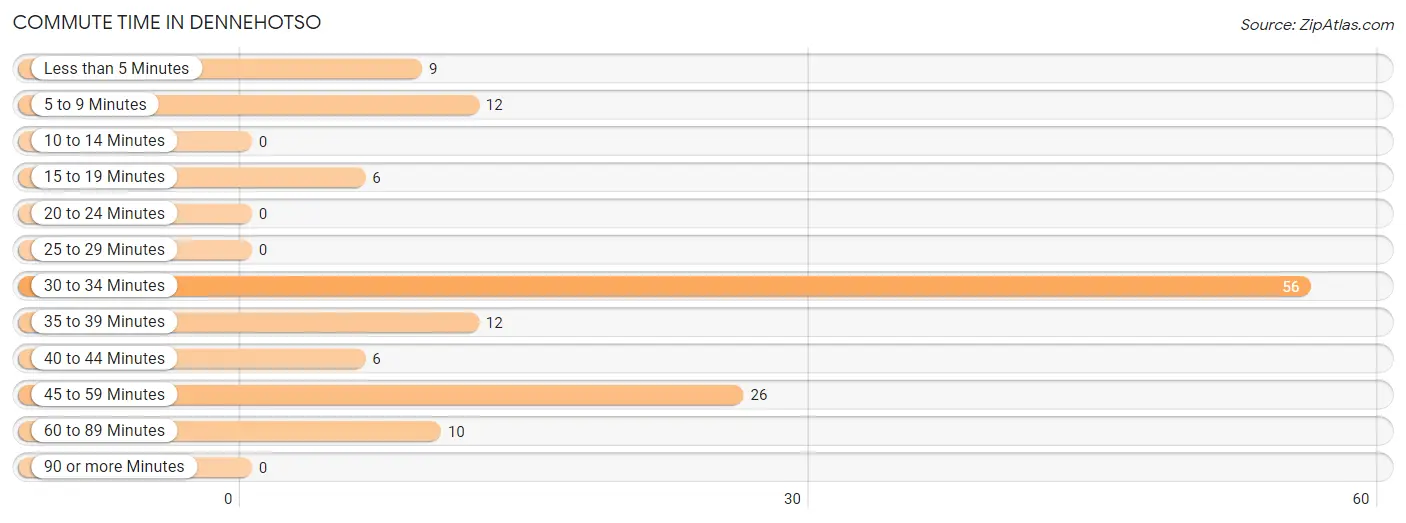
| Commute Time | # Commuters | % Commuters |
| Less than 5 Minutes | 9 | 6.6% |
| 5 to 9 Minutes | 12 | 8.8% |
| 10 to 14 Minutes | 0 | 0.0% |
| 15 to 19 Minutes | 6 | 4.4% |
| 20 to 24 Minutes | 0 | 0.0% |
| 25 to 29 Minutes | 0 | 0.0% |
| 30 to 34 Minutes | 56 | 40.9% |
| 35 to 39 Minutes | 12 | 8.8% |
| 40 to 44 Minutes | 6 | 4.4% |
| 45 to 59 Minutes | 26 | 19.0% |
| 60 to 89 Minutes | 10 | 7.3% |
| 90 or more Minutes | 0 | 0.0% |
Commute Time by Sex in Dennehotso
The most common commute times in Dennehotso are 30 to 34 minutes (38 commuters, 49.3%) for males and 30 to 34 minutes (18 commuters, 30.0%) for females.
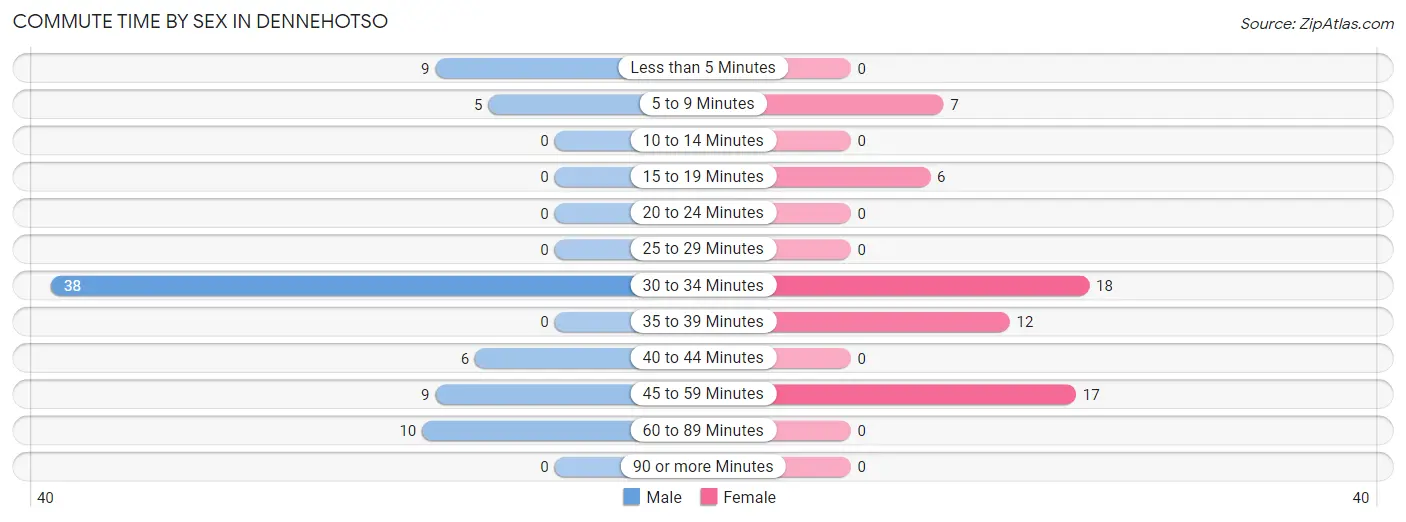
| Commute Time | Male | Female |
| Less than 5 Minutes | 9 (11.7%) | 0 (0.0%) |
| 5 to 9 Minutes | 5 (6.5%) | 7 (11.7%) |
| 10 to 14 Minutes | 0 (0.0%) | 0 (0.0%) |
| 15 to 19 Minutes | 0 (0.0%) | 6 (10.0%) |
| 20 to 24 Minutes | 0 (0.0%) | 0 (0.0%) |
| 25 to 29 Minutes | 0 (0.0%) | 0 (0.0%) |
| 30 to 34 Minutes | 38 (49.3%) | 18 (30.0%) |
| 35 to 39 Minutes | 0 (0.0%) | 12 (20.0%) |
| 40 to 44 Minutes | 6 (7.8%) | 0 (0.0%) |
| 45 to 59 Minutes | 9 (11.7%) | 17 (28.3%) |
| 60 to 89 Minutes | 10 (13.0%) | 0 (0.0%) |
| 90 or more Minutes | 0 (0.0%) | 0 (0.0%) |
Time of Departure to Work by Sex in Dennehotso
The most frequent times of departure to work in Dennehotso are 7:30 AM to 7:59 AM (29, 37.7%) for males and 7:00 AM to 7:29 AM (35, 58.3%) for females.
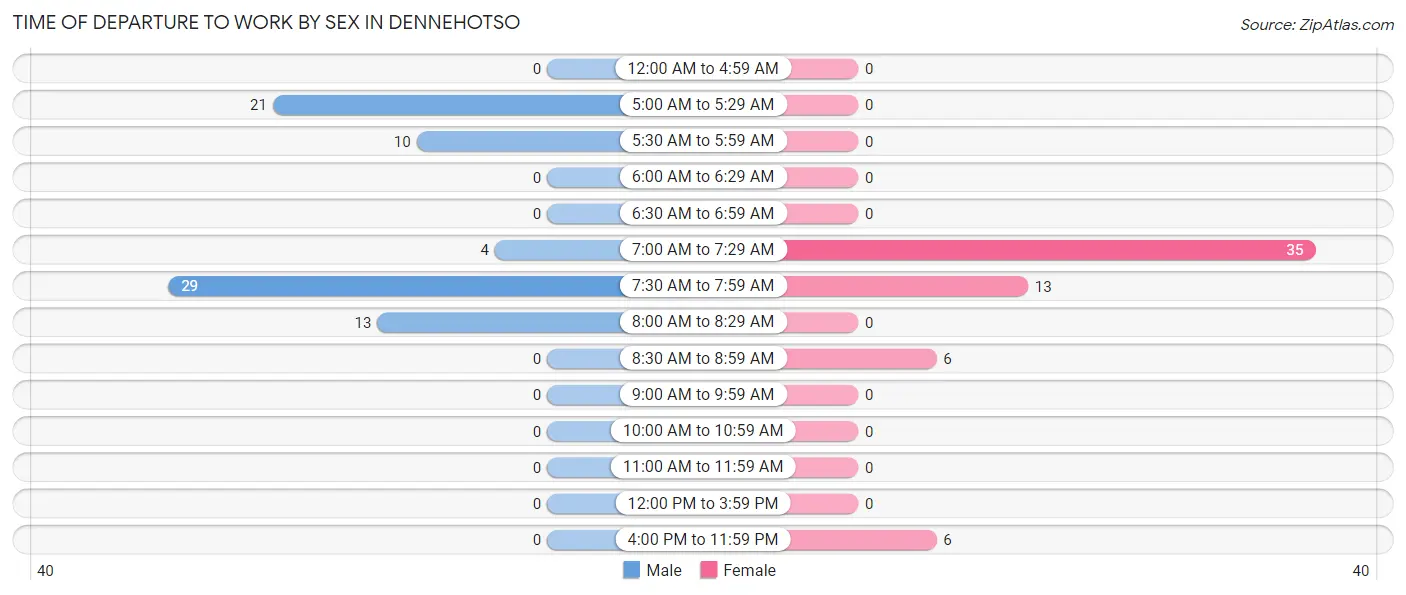
| Time of Departure | Male | Female |
| 12:00 AM to 4:59 AM | 0 (0.0%) | 0 (0.0%) |
| 5:00 AM to 5:29 AM | 21 (27.3%) | 0 (0.0%) |
| 5:30 AM to 5:59 AM | 10 (13.0%) | 0 (0.0%) |
| 6:00 AM to 6:29 AM | 0 (0.0%) | 0 (0.0%) |
| 6:30 AM to 6:59 AM | 0 (0.0%) | 0 (0.0%) |
| 7:00 AM to 7:29 AM | 4 (5.2%) | 35 (58.3%) |
| 7:30 AM to 7:59 AM | 29 (37.7%) | 13 (21.7%) |
| 8:00 AM to 8:29 AM | 13 (16.9%) | 0 (0.0%) |
| 8:30 AM to 8:59 AM | 0 (0.0%) | 6 (10.0%) |
| 9:00 AM to 9:59 AM | 0 (0.0%) | 0 (0.0%) |
| 10:00 AM to 10:59 AM | 0 (0.0%) | 0 (0.0%) |
| 11:00 AM to 11:59 AM | 0 (0.0%) | 0 (0.0%) |
| 12:00 PM to 3:59 PM | 0 (0.0%) | 0 (0.0%) |
| 4:00 PM to 11:59 PM | 0 (0.0%) | 6 (10.0%) |
| Total | 77 (100.0%) | 60 (100.0%) |
Housing Occupancy in Dennehotso
Occupancy by Ownership in Dennehotso
Of the total 130 dwellings in Dennehotso, owner-occupied units account for 122 (93.9%), while renter-occupied units make up 8 (6.1%).
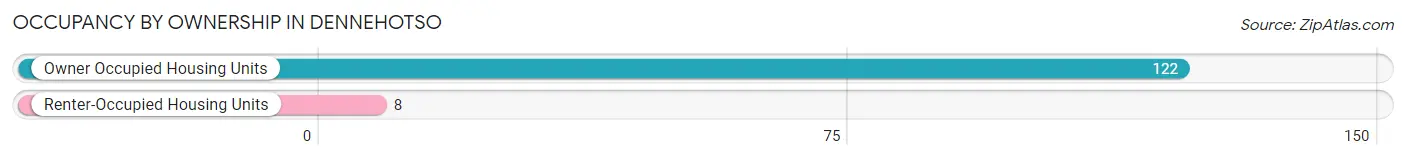
| Occupancy | # Housing Units | % Housing Units |
| Owner Occupied Housing Units | 122 | 93.9% |
| Renter-Occupied Housing Units | 8 | 6.1% |
| Total Occupied Housing Units | 130 | 100.0% |
Occupancy by Household Size in Dennehotso
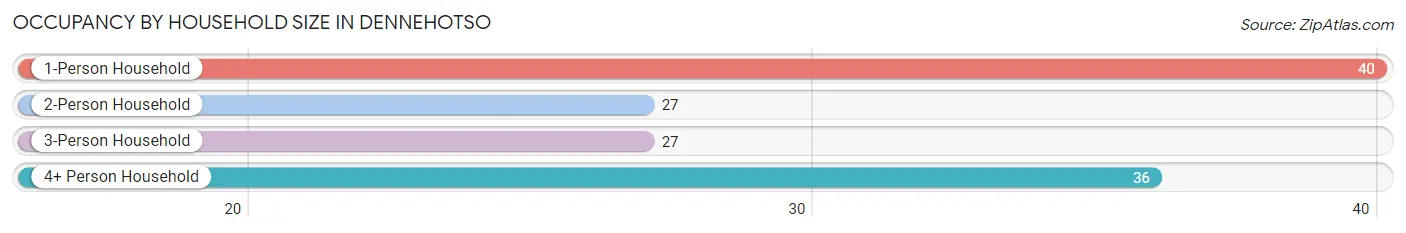
| Household Size | # Housing Units | % Housing Units |
| 1-Person Household | 40 | 30.8% |
| 2-Person Household | 27 | 20.8% |
| 3-Person Household | 27 | 20.8% |
| 4+ Person Household | 36 | 27.7% |
| Total Housing Units | 130 | 100.0% |
Occupancy by Ownership by Household Size in Dennehotso
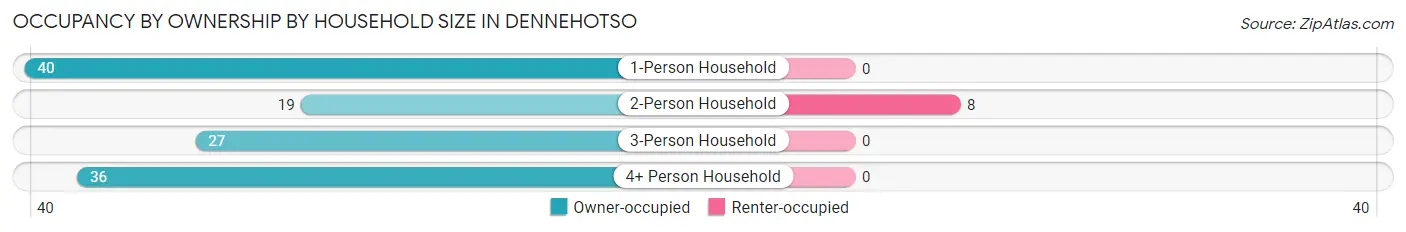
| Household Size | Owner-occupied | Renter-occupied |
| 1-Person Household | 40 (100.0%) | 0 (0.0%) |
| 2-Person Household | 19 (70.4%) | 8 (29.6%) |
| 3-Person Household | 27 (100.0%) | 0 (0.0%) |
| 4+ Person Household | 36 (100.0%) | 0 (0.0%) |
| Total Housing Units | 122 (93.9%) | 8 (6.1%) |
Occupancy by Educational Attainment in Dennehotso
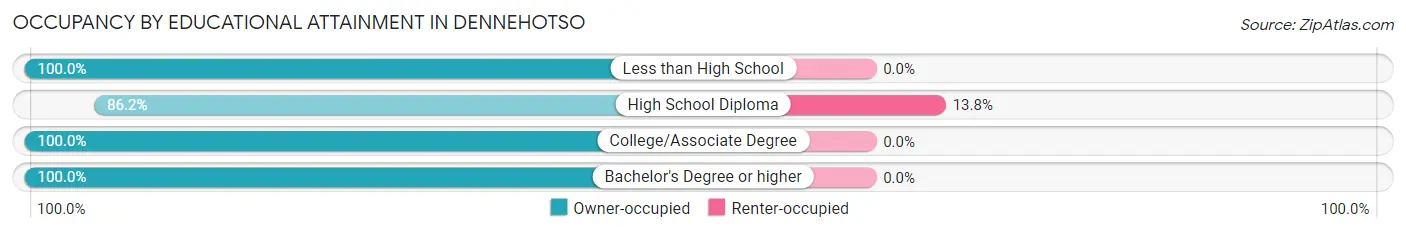
| Household Size | Owner-occupied | Renter-occupied |
| Less than High School | 22 (100.0%) | 0 (0.0%) |
| High School Diploma | 50 (86.2%) | 8 (13.8%) |
| College/Associate Degree | 39 (100.0%) | 0 (0.0%) |
| Bachelor's Degree or higher | 11 (100.0%) | 0 (0.0%) |
Occupancy by Age of Householder in Dennehotso
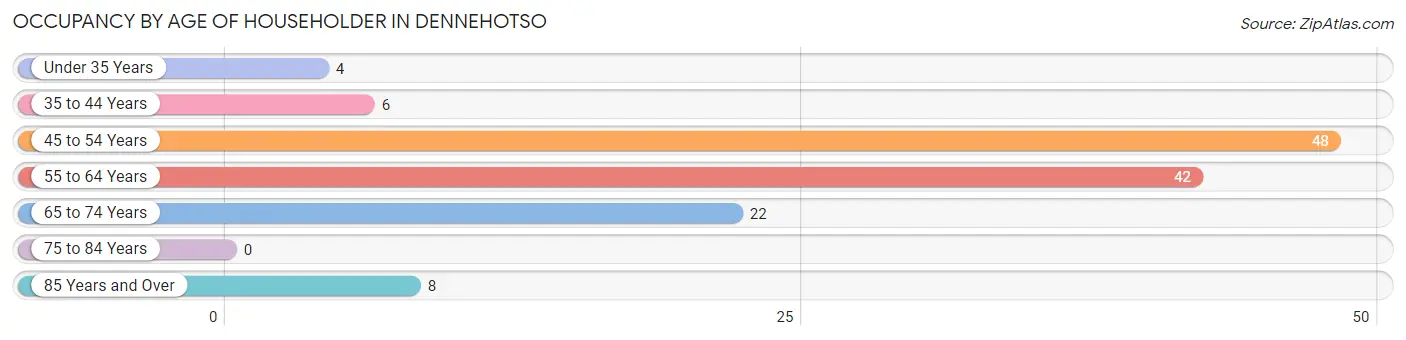
| Age Bracket | # Households | % Households |
| Under 35 Years | 4 | 3.1% |
| 35 to 44 Years | 6 | 4.6% |
| 45 to 54 Years | 48 | 36.9% |
| 55 to 64 Years | 42 | 32.3% |
| 65 to 74 Years | 22 | 16.9% |
| 75 to 84 Years | 0 | 0.0% |
| 85 Years and Over | 8 | 6.1% |
| Total | 130 | 100.0% |
Housing Finances in Dennehotso
Median Income by Occupancy in Dennehotso
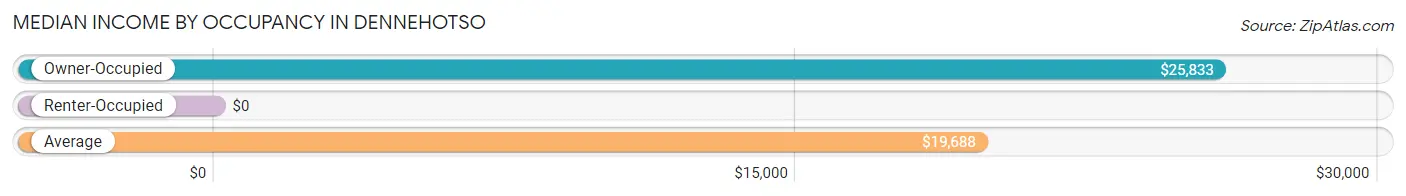
| Occupancy Type | # Households | Median Income |
| Owner-Occupied | 122 (93.9%) | $25,833 |
| Renter-Occupied | 8 (6.1%) | $0 |
| Average | 130 (100.0%) | $19,688 |
Occupancy by Householder Income Bracket in Dennehotso
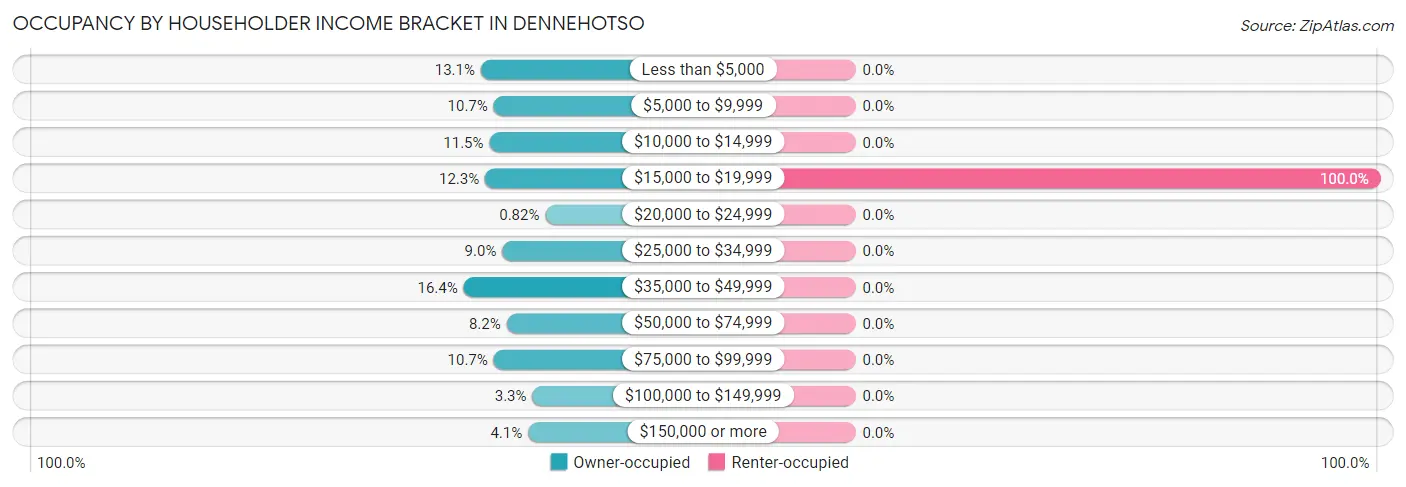
| Income Bracket | Owner-occupied | Renter-occupied |
| Less than $5,000 | 16 (13.1%) | 0 (0.0%) |
| $5,000 to $9,999 | 13 (10.7%) | 0 (0.0%) |
| $10,000 to $14,999 | 14 (11.5%) | 0 (0.0%) |
| $15,000 to $19,999 | 15 (12.3%) | 8 (100.0%) |
| $20,000 to $24,999 | 1 (0.8%) | 0 (0.0%) |
| $25,000 to $34,999 | 11 (9.0%) | 0 (0.0%) |
| $35,000 to $49,999 | 20 (16.4%) | 0 (0.0%) |
| $50,000 to $74,999 | 10 (8.2%) | 0 (0.0%) |
| $75,000 to $99,999 | 13 (10.7%) | 0 (0.0%) |
| $100,000 to $149,999 | 4 (3.3%) | 0 (0.0%) |
| $150,000 or more | 5 (4.1%) | 0 (0.0%) |
| Total | 122 (100.0%) | 8 (100.0%) |
Monthly Housing Cost Tiers in Dennehotso
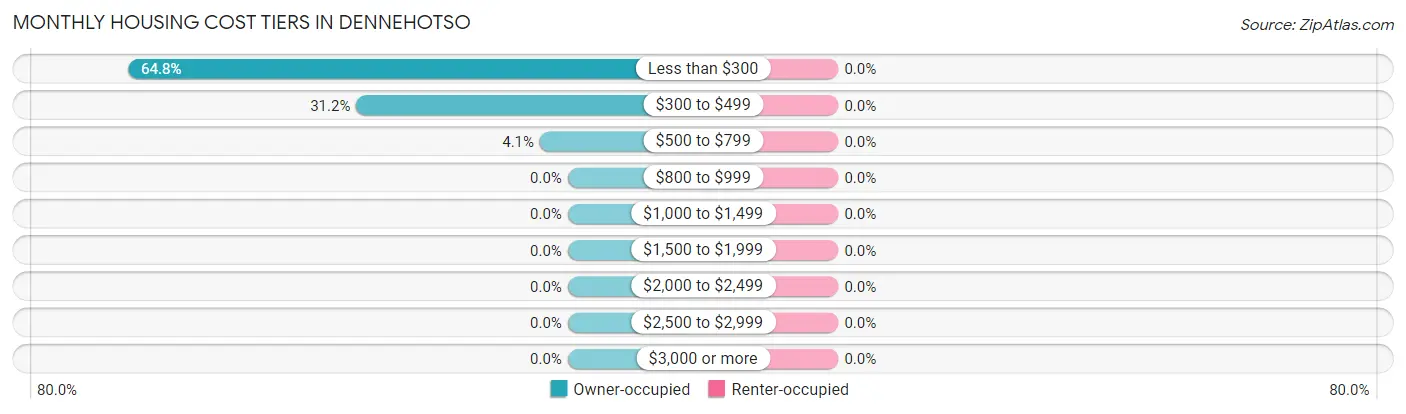
| Monthly Cost | Owner-occupied | Renter-occupied |
| Less than $300 | 79 (64.7%) | 0 (0.0%) |
| $300 to $499 | 38 (31.1%) | 0 (0.0%) |
| $500 to $799 | 5 (4.1%) | 0 (0.0%) |
| $800 to $999 | 0 (0.0%) | 0 (0.0%) |
| $1,000 to $1,499 | 0 (0.0%) | 0 (0.0%) |
| $1,500 to $1,999 | 0 (0.0%) | 0 (0.0%) |
| $2,000 to $2,499 | 0 (0.0%) | 0 (0.0%) |
| $2,500 to $2,999 | 0 (0.0%) | 0 (0.0%) |
| $3,000 or more | 0 (0.0%) | 0 (0.0%) |
| Total | 122 (100.0%) | 8 (100.0%) |
Physical Housing Characteristics in Dennehotso
Housing Structures in Dennehotso
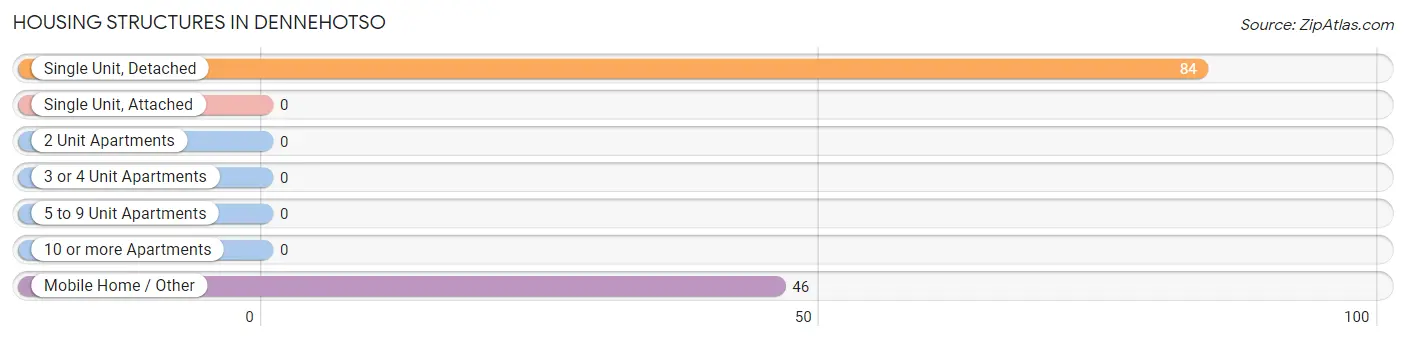
| Structure Type | # Housing Units | % Housing Units |
| Single Unit, Detached | 84 | 64.6% |
| Single Unit, Attached | 0 | 0.0% |
| 2 Unit Apartments | 0 | 0.0% |
| 3 or 4 Unit Apartments | 0 | 0.0% |
| 5 to 9 Unit Apartments | 0 | 0.0% |
| 10 or more Apartments | 0 | 0.0% |
| Mobile Home / Other | 46 | 35.4% |
| Total | 130 | 100.0% |
Housing Structures by Occupancy in Dennehotso
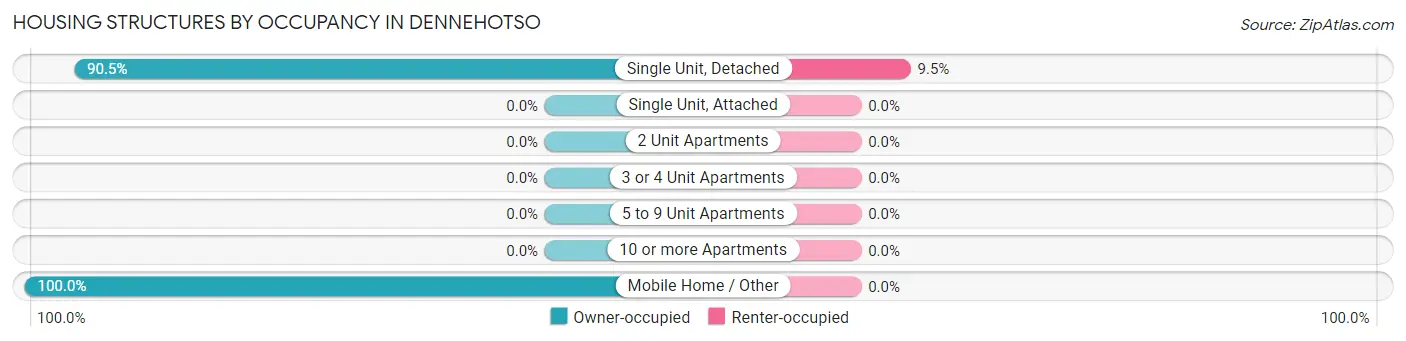
| Structure Type | Owner-occupied | Renter-occupied |
| Single Unit, Detached | 76 (90.5%) | 8 (9.5%) |
| Single Unit, Attached | 0 (0.0%) | 0 (0.0%) |
| 2 Unit Apartments | 0 (0.0%) | 0 (0.0%) |
| 3 or 4 Unit Apartments | 0 (0.0%) | 0 (0.0%) |
| 5 to 9 Unit Apartments | 0 (0.0%) | 0 (0.0%) |
| 10 or more Apartments | 0 (0.0%) | 0 (0.0%) |
| Mobile Home / Other | 46 (100.0%) | 0 (0.0%) |
| Total | 122 (93.9%) | 8 (6.1%) |
Housing Structures by Number of Rooms in Dennehotso
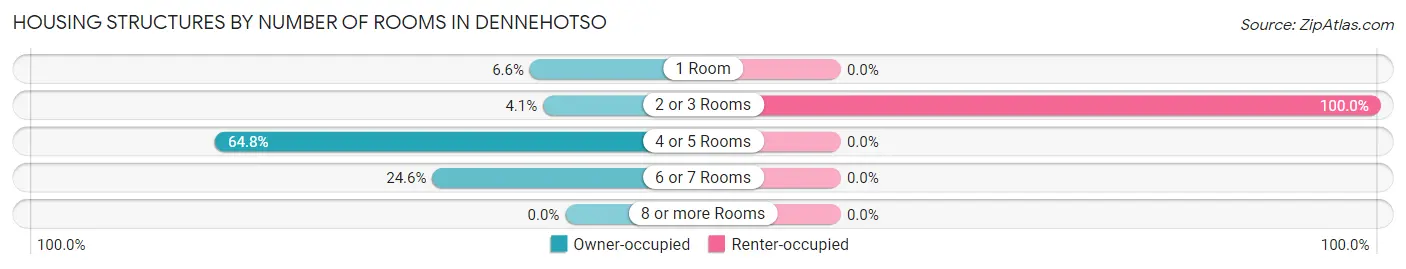
| Number of Rooms | Owner-occupied | Renter-occupied |
| 1 Room | 8 (6.6%) | 0 (0.0%) |
| 2 or 3 Rooms | 5 (4.1%) | 8 (100.0%) |
| 4 or 5 Rooms | 79 (64.7%) | 0 (0.0%) |
| 6 or 7 Rooms | 30 (24.6%) | 0 (0.0%) |
| 8 or more Rooms | 0 (0.0%) | 0 (0.0%) |
| Total | 122 (100.0%) | 8 (100.0%) |
Housing Structure by Heating Type in Dennehotso
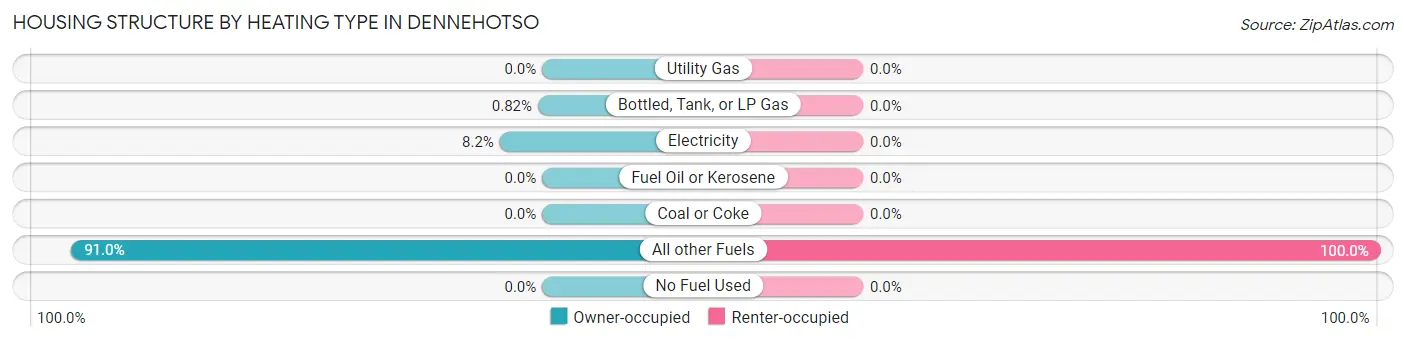
| Heating Type | Owner-occupied | Renter-occupied |
| Utility Gas | 0 (0.0%) | 0 (0.0%) |
| Bottled, Tank, or LP Gas | 1 (0.8%) | 0 (0.0%) |
| Electricity | 10 (8.2%) | 0 (0.0%) |
| Fuel Oil or Kerosene | 0 (0.0%) | 0 (0.0%) |
| Coal or Coke | 0 (0.0%) | 0 (0.0%) |
| All other Fuels | 111 (91.0%) | 8 (100.0%) |
| No Fuel Used | 0 (0.0%) | 0 (0.0%) |
| Total | 122 (100.0%) | 8 (100.0%) |
Household Vehicle Usage in Dennehotso
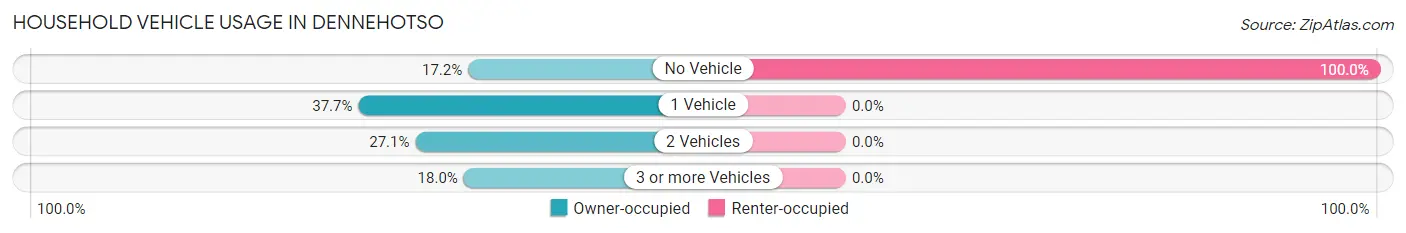
| Vehicles per Household | Owner-occupied | Renter-occupied |
| No Vehicle | 21 (17.2%) | 8 (100.0%) |
| 1 Vehicle | 46 (37.7%) | 0 (0.0%) |
| 2 Vehicles | 33 (27.1%) | 0 (0.0%) |
| 3 or more Vehicles | 22 (18.0%) | 0 (0.0%) |
| Total | 122 (100.0%) | 8 (100.0%) |
Real Estate & Mortgages in Dennehotso
Real Estate and Mortgage Overview in Dennehotso
| Characteristic | Without Mortgage | With Mortgage |
| Housing Units | 117 | 5 |
| Median Property Value | $53,100 | $0 |
| Median Household Income | $26,875 | $0 |
| Monthly Housing Costs | $244 | $0 |
| Real Estate Taxes | - | - |
Property Value by Mortgage Status in Dennehotso
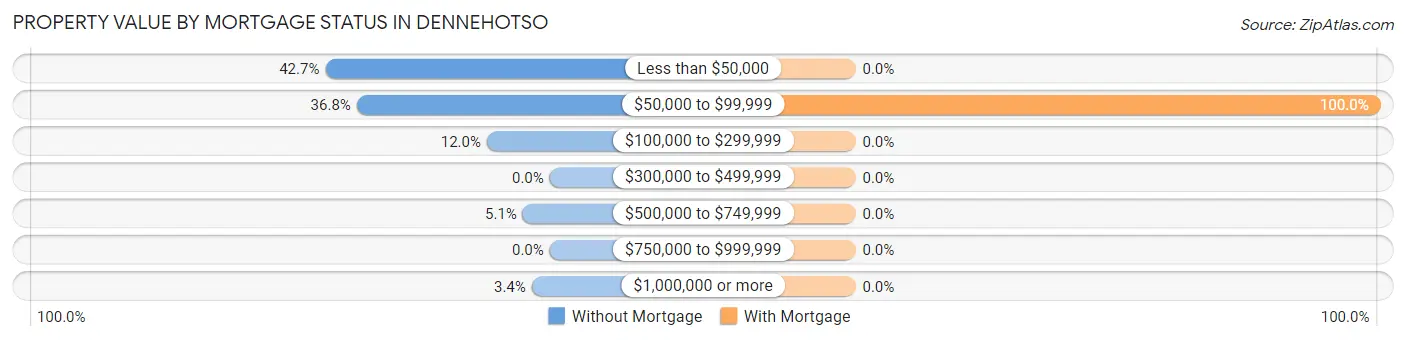
| Property Value | Without Mortgage | With Mortgage |
| Less than $50,000 | 50 (42.7%) | 0 (0.0%) |
| $50,000 to $99,999 | 43 (36.7%) | 5 (100.0%) |
| $100,000 to $299,999 | 14 (12.0%) | 0 (0.0%) |
| $300,000 to $499,999 | 0 (0.0%) | 0 (0.0%) |
| $500,000 to $749,999 | 6 (5.1%) | 0 (0.0%) |
| $750,000 to $999,999 | 0 (0.0%) | 0 (0.0%) |
| $1,000,000 or more | 4 (3.4%) | 0 (0.0%) |
| Total | 117 (100.0%) | 5 (100.0%) |
Household Income by Mortgage Status in Dennehotso
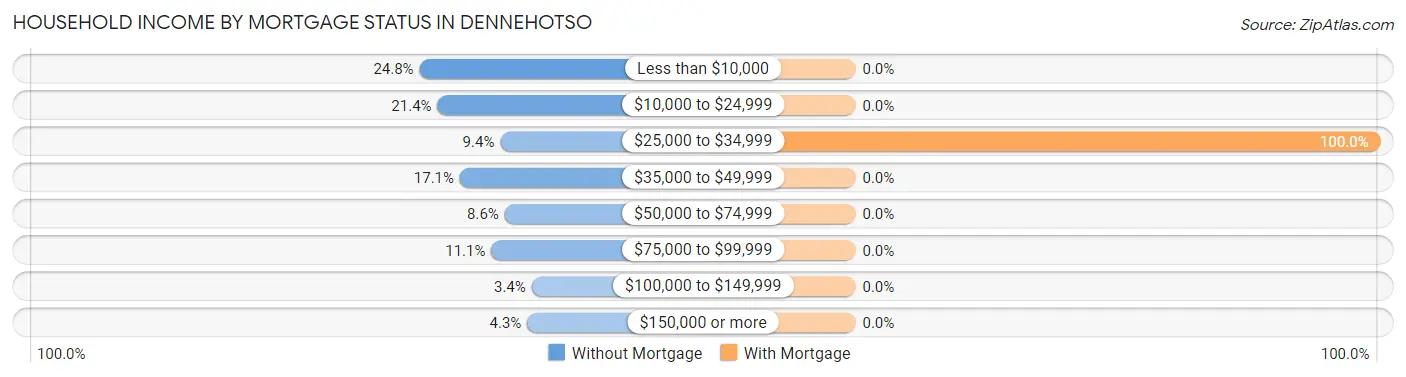
| Household Income | Without Mortgage | With Mortgage |
| Less than $10,000 | 29 (24.8%) | 0 (0.0%) |
| $10,000 to $24,999 | 25 (21.4%) | 0 (0.0%) |
| $25,000 to $34,999 | 11 (9.4%) | 5 (100.0%) |
| $35,000 to $49,999 | 20 (17.1%) | 0 (0.0%) |
| $50,000 to $74,999 | 10 (8.6%) | 0 (0.0%) |
| $75,000 to $99,999 | 13 (11.1%) | 0 (0.0%) |
| $100,000 to $149,999 | 4 (3.4%) | 0 (0.0%) |
| $150,000 or more | 5 (4.3%) | 0 (0.0%) |
| Total | 117 (100.0%) | 5 (100.0%) |
Property Value to Household Income Ratio in Dennehotso
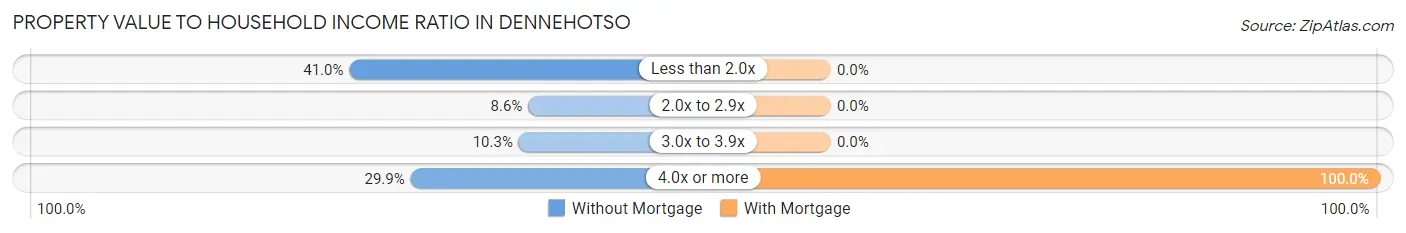
| Value-to-Income Ratio | Without Mortgage | With Mortgage |
| Less than 2.0x | 48 (41.0%) | 0 (0.0%) |
| 2.0x to 2.9x | 10 (8.6%) | 0 (0.0%) |
| 3.0x to 3.9x | 12 (10.3%) | 0 (0.0%) |
| 4.0x or more | 35 (29.9%) | 5 (100.0%) |
| Total | 117 (100.0%) | 5 (100.0%) |
Real Estate Taxes by Mortgage Status in Dennehotso
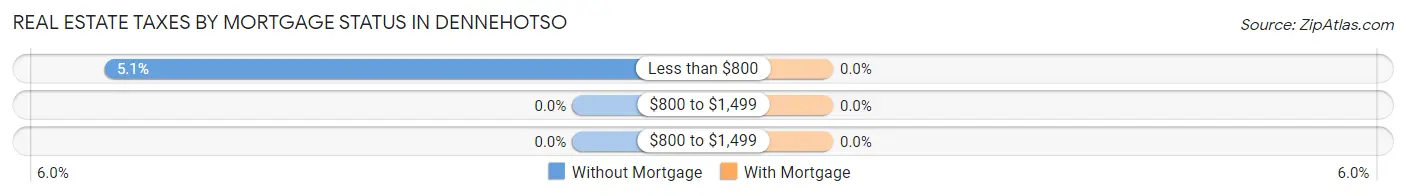
| Property Taxes | Without Mortgage | With Mortgage |
| Less than $800 | 6 (5.1%) | 0 (0.0%) |
| $800 to $1,499 | 0 (0.0%) | 0 (0.0%) |
| $800 to $1,499 | 0 (0.0%) | 0 (0.0%) |
| Total | 117 (100.0%) | 5 (100.0%) |
Health & Disability in Dennehotso
Health Insurance Coverage by Age in Dennehotso
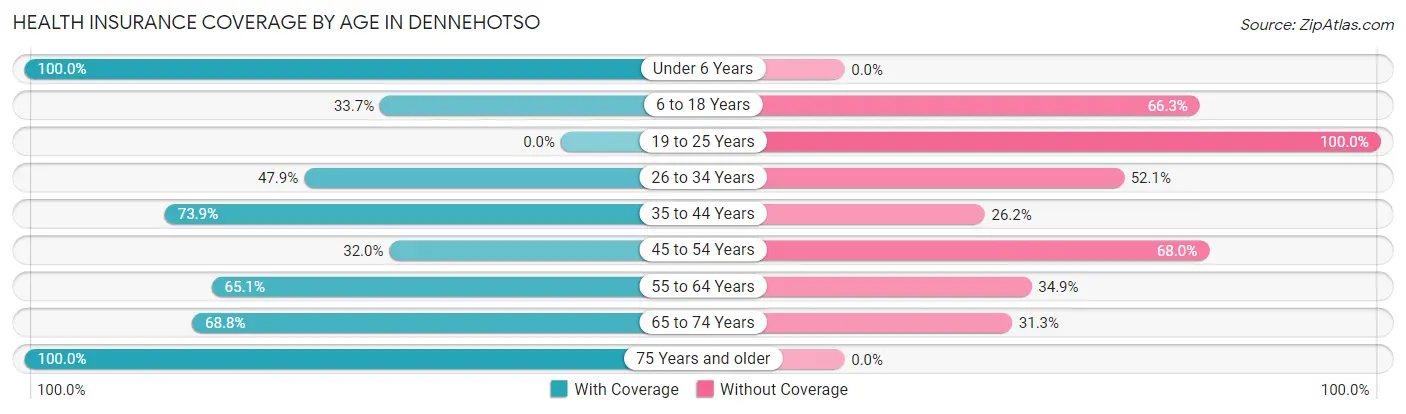
| Age Bracket | With Coverage | Without Coverage |
| Under 6 Years | 18 (100.0%) | 0 (0.0%) |
| 6 to 18 Years | 28 (33.7%) | 55 (66.3%) |
| 19 to 25 Years | 0 (0.0%) | 68 (100.0%) |
| 26 to 34 Years | 34 (47.9%) | 37 (52.1%) |
| 35 to 44 Years | 48 (73.9%) | 17 (26.2%) |
| 45 to 54 Years | 40 (32.0%) | 85 (68.0%) |
| 55 to 64 Years | 56 (65.1%) | 30 (34.9%) |
| 65 to 74 Years | 22 (68.8%) | 10 (31.2%) |
| 75 Years and older | 12 (100.0%) | 0 (0.0%) |
| Total | 258 (46.1%) | 302 (53.9%) |
Health Insurance Coverage by Citizenship Status in Dennehotso
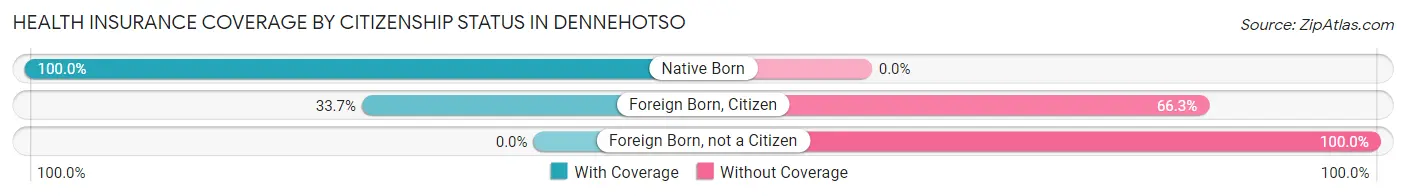
| Citizenship Status | With Coverage | Without Coverage |
| Native Born | 18 (100.0%) | 0 (0.0%) |
| Foreign Born, Citizen | 28 (33.7%) | 55 (66.3%) |
| Foreign Born, not a Citizen | 0 (0.0%) | 68 (100.0%) |
Health Insurance Coverage by Household Income in Dennehotso
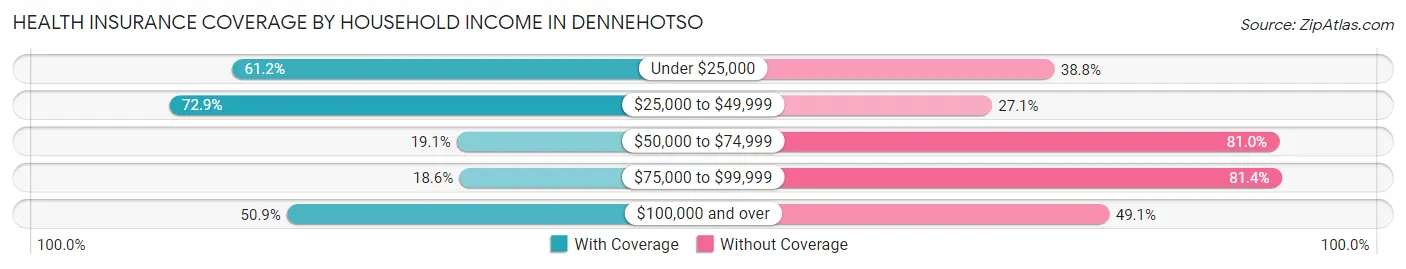
| Household Income | With Coverage | Without Coverage |
| Under $25,000 | 120 (61.2%) | 76 (38.8%) |
| $25,000 to $49,999 | 70 (72.9%) | 26 (27.1%) |
| $50,000 to $74,999 | 16 (19.1%) | 68 (80.9%) |
| $75,000 to $99,999 | 24 (18.6%) | 105 (81.4%) |
| $100,000 and over | 28 (50.9%) | 27 (49.1%) |
Public vs Private Health Insurance Coverage by Age in Dennehotso
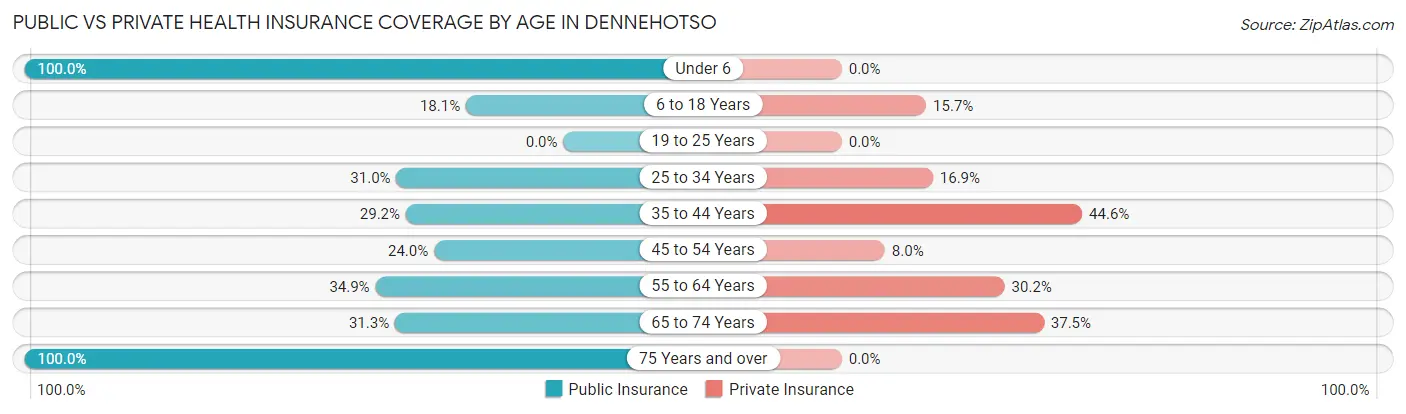
| Age Bracket | Public Insurance | Private Insurance |
| Under 6 | 18 (100.0%) | 0 (0.0%) |
| 6 to 18 Years | 15 (18.1%) | 13 (15.7%) |
| 19 to 25 Years | 0 (0.0%) | 0 (0.0%) |
| 25 to 34 Years | 22 (31.0%) | 12 (16.9%) |
| 35 to 44 Years | 19 (29.2%) | 29 (44.6%) |
| 45 to 54 Years | 30 (24.0%) | 10 (8.0%) |
| 55 to 64 Years | 30 (34.9%) | 26 (30.2%) |
| 65 to 74 Years | 10 (31.2%) | 12 (37.5%) |
| 75 Years and over | 12 (100.0%) | 0 (0.0%) |
| Total | 156 (27.9%) | 102 (18.2%) |
Disability Status by Sex by Age in Dennehotso
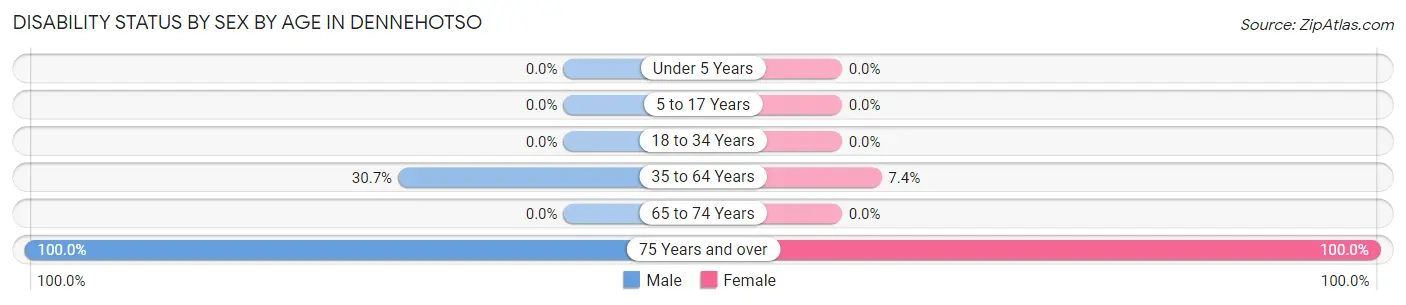
| Age Bracket | Male | Female |
| Under 5 Years | 0 (0.0%) | 0 (0.0%) |
| 5 to 17 Years | 0 (0.0%) | 0 (0.0%) |
| 18 to 34 Years | 0 (0.0%) | 0 (0.0%) |
| 35 to 64 Years | 43 (30.7%) | 10 (7.3%) |
| 65 to 74 Years | 0 (0.0%) | 0 (0.0%) |
| 75 Years and over | 8 (100.0%) | 4 (100.0%) |
Disability Class by Sex by Age in Dennehotso
Disability Class: Hearing Difficulty
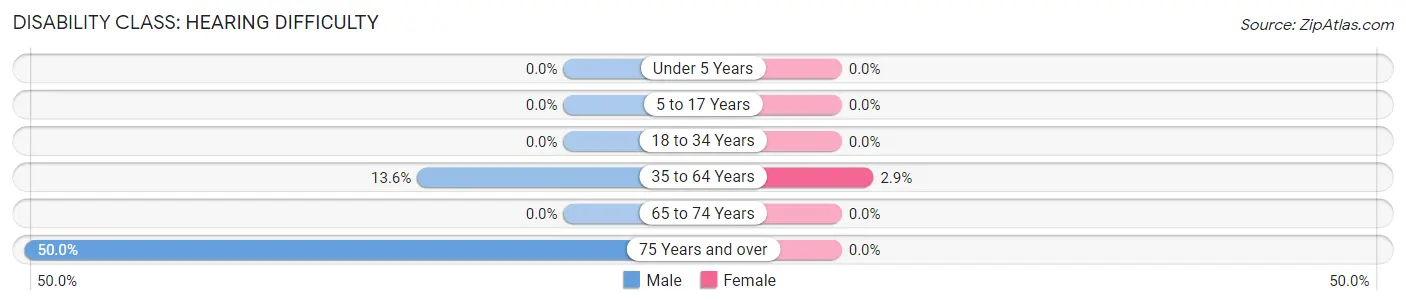
| Age Bracket | Male | Female |
| Under 5 Years | 0 (0.0%) | 0 (0.0%) |
| 5 to 17 Years | 0 (0.0%) | 0 (0.0%) |
| 18 to 34 Years | 0 (0.0%) | 0 (0.0%) |
| 35 to 64 Years | 19 (13.6%) | 4 (2.9%) |
| 65 to 74 Years | 0 (0.0%) | 0 (0.0%) |
| 75 Years and over | 4 (50.0%) | 0 (0.0%) |
Disability Class: Vision Difficulty
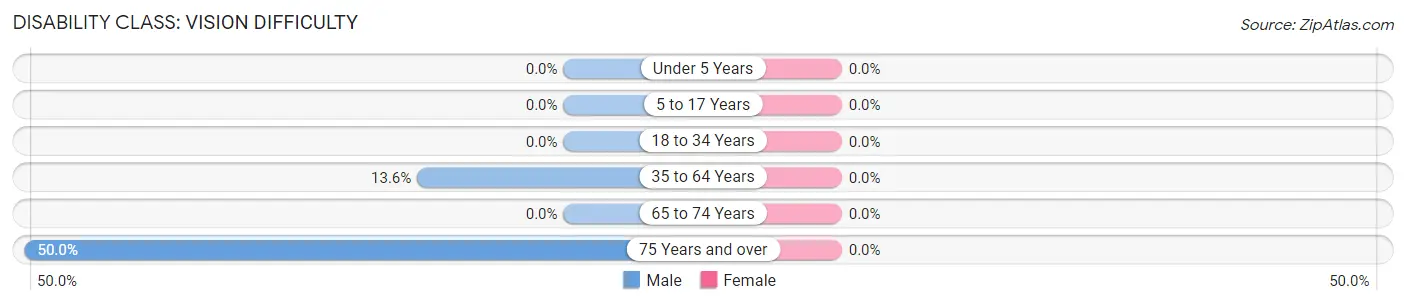
| Age Bracket | Male | Female |
| Under 5 Years | 0 (0.0%) | 0 (0.0%) |
| 5 to 17 Years | 0 (0.0%) | 0 (0.0%) |
| 18 to 34 Years | 0 (0.0%) | 0 (0.0%) |
| 35 to 64 Years | 19 (13.6%) | 0 (0.0%) |
| 65 to 74 Years | 0 (0.0%) | 0 (0.0%) |
| 75 Years and over | 4 (50.0%) | 0 (0.0%) |
Disability Class: Cognitive Difficulty
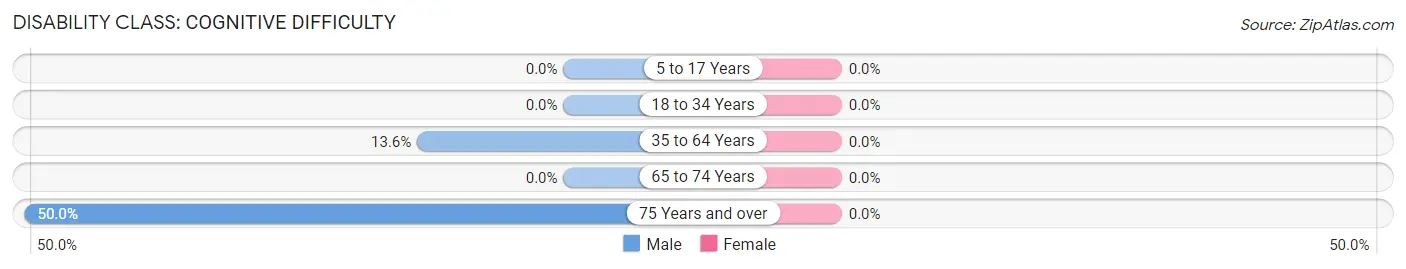
| Age Bracket | Male | Female |
| 5 to 17 Years | 0 (0.0%) | 0 (0.0%) |
| 18 to 34 Years | 0 (0.0%) | 0 (0.0%) |
| 35 to 64 Years | 19 (13.6%) | 0 (0.0%) |
| 65 to 74 Years | 0 (0.0%) | 0 (0.0%) |
| 75 Years and over | 4 (50.0%) | 0 (0.0%) |
Disability Class: Ambulatory Difficulty
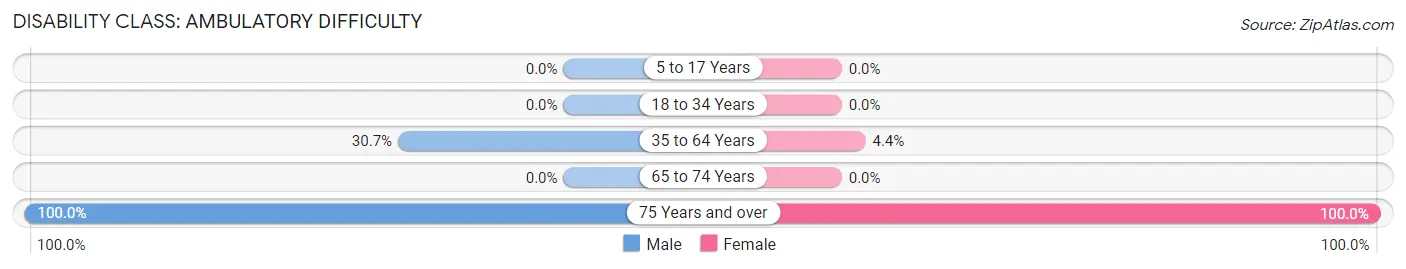
| Age Bracket | Male | Female |
| 5 to 17 Years | 0 (0.0%) | 0 (0.0%) |
| 18 to 34 Years | 0 (0.0%) | 0 (0.0%) |
| 35 to 64 Years | 43 (30.7%) | 6 (4.4%) |
| 65 to 74 Years | 0 (0.0%) | 0 (0.0%) |
| 75 Years and over | 8 (100.0%) | 4 (100.0%) |
Disability Class: Self-Care Difficulty
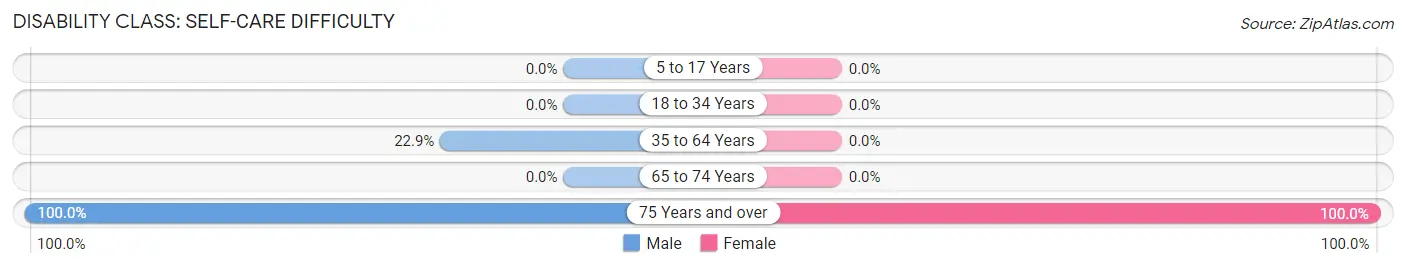
| Age Bracket | Male | Female |
| 5 to 17 Years | 0 (0.0%) | 0 (0.0%) |
| 18 to 34 Years | 0 (0.0%) | 0 (0.0%) |
| 35 to 64 Years | 32 (22.9%) | 0 (0.0%) |
| 65 to 74 Years | 0 (0.0%) | 0 (0.0%) |
| 75 Years and over | 8 (100.0%) | 4 (100.0%) |
Technology Access in Dennehotso
Computing Device Access in Dennehotso
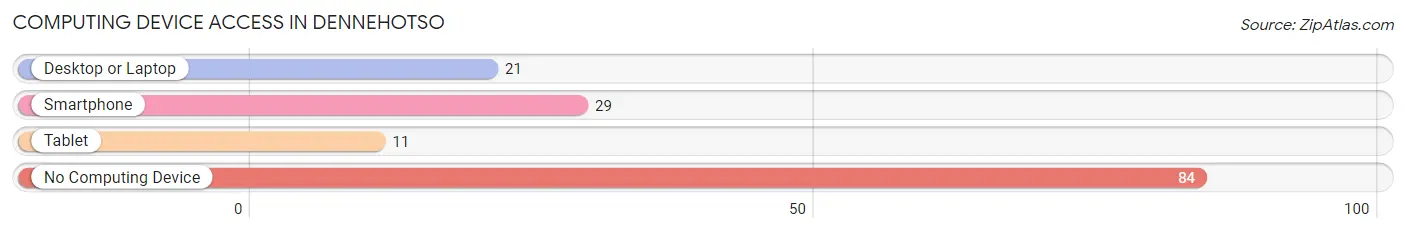
| Device Type | # Households | % Households |
| Desktop or Laptop | 21 | 16.2% |
| Smartphone | 29 | 22.3% |
| Tablet | 11 | 8.5% |
| No Computing Device | 84 | 64.6% |
| Total | 130 | 100.0% |
Internet Access in Dennehotso
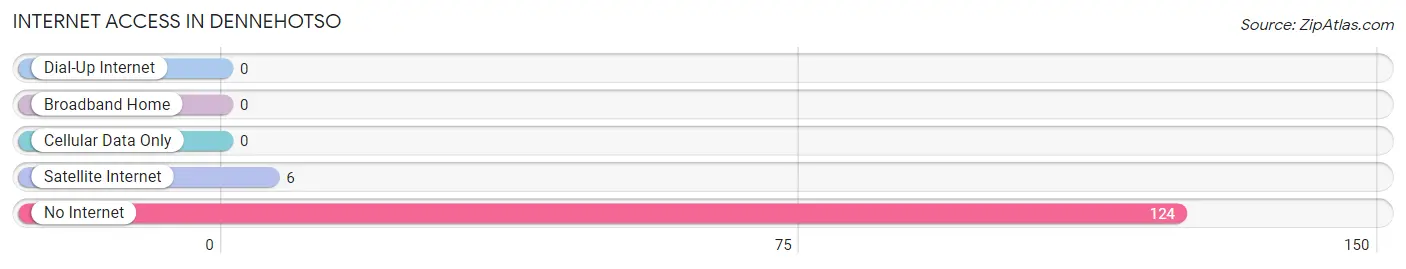
| Internet Type | # Households | % Households |
| Dial-Up Internet | 0 | 0.0% |
| Broadband Home | 0 | 0.0% |
| Cellular Data Only | 0 | 0.0% |
| Satellite Internet | 6 | 4.6% |
| No Internet | 124 | 95.4% |
| Total | 130 | 100.0% |
Dennehotso Summary
Dennehotso is a small unincorporated community located in Apache County, Arizona. It is situated on the Navajo Nation Reservation, approximately 20 miles south of the city of Kayenta. Dennehotso is a rural community with a population of approximately 1,000 people.
History
The area that is now Dennehotso was originally inhabited by the Navajo people. The Navajo Nation Reservation was established in 1868, and the area was officially recognized as a community in the early 1900s. The name Dennehotso is derived from the Navajo word for “red rock”, and the area is known for its red sandstone formations.
In the early 1900s, the area was home to a number of small farms and ranches. The community was also home to a trading post, which served as a hub for local commerce. The trading post was eventually replaced by a general store, which is still in operation today.
In the 1950s, the Bureau of Indian Affairs (BIA) established a school in Dennehotso. The school was initially a one-room schoolhouse, but it has since been expanded to include a library, cafeteria, and other amenities.
Geography
Dennehotso is located in the northeastern corner of the Navajo Nation Reservation, approximately 20 miles south of the city of Kayenta. The area is characterized by its red sandstone formations, which are visible from miles away. The area is also home to a number of small creeks and streams, which provide water for the local population.
The climate in Dennehotso is arid, with hot summers and cold winters. The average annual temperature is approximately 60°F, and the average annual precipitation is approximately 8 inches.
Economy
The economy of Dennehotso is largely based on agriculture and tourism. The area is home to a number of small farms and ranches, which produce a variety of crops and livestock. The area is also home to a number of tourist attractions, including the nearby Monument Valley Navajo Tribal Park.
The local economy is also supported by a number of small businesses, including a general store, a gas station, and a restaurant. The area is also home to a number of art galleries, which feature the work of local Navajo artists.
Demographics
As of the 2010 census, the population of Dennehotso was 1,000. The population is primarily Native American, with the majority of residents being Navajo. The median household income is approximately $25,000, and the median home value is approximately $50,000.
The majority of residents are employed in the agricultural and tourism industries. The area is also home to a number of small businesses, including a general store, a gas station, and a restaurant.
Conclusion
Dennehotso is a small unincorporated community located in Apache County, Arizona. It is situated on the Navajo Nation Reservation, approximately 20 miles south of the city of Kayenta. Dennehotso is a rural community with a population of approximately 1,000 people. The area is characterized by its red sandstone formations, and the local economy is largely based on agriculture and tourism. The majority of residents are Native American, with the majority of residents being Navajo. The median household income is approximately $25,000, and the median home value is approximately $50,000.
Common Questions
What is Per Capita Income in Dennehotso?
Per Capita income in Dennehotso is $11,628.
What is the Median Family Income in Dennehotso?
Median Family Income in Dennehotso is $44,583.
What is the Median Household income in Dennehotso?
Median Household Income in Dennehotso is $19,688.
What is Income or Wage Gap in Dennehotso?
Income or Wage Gap in Dennehotso is 36.3%.
Women in Dennehotso earn 63.7 cents for every dollar earned by a man.
What is Inequality or Gini Index in Dennehotso?
Inequality or Gini Index in Dennehotso is 0.54.
What is the Total Population of Dennehotso?
Total Population of Dennehotso is 560.
What is the Total Male Population of Dennehotso?
Total Male Population of Dennehotso is 336.
What is the Total Female Population of Dennehotso?
Total Female Population of Dennehotso is 224.
What is the Ratio of Males per 100 Females in Dennehotso?
There are 150.00 Males per 100 Females in Dennehotso.
What is the Ratio of Females per 100 Males in Dennehotso?
There are 66.67 Females per 100 Males in Dennehotso.
What is the Median Population Age in Dennehotso?
Median Population Age in Dennehotso is 39.3 Years.
What is the Average Family Size in Dennehotso
Average Family Size in Dennehotso is 6.3 People.
What is the Average Household Size in Dennehotso
Average Household Size in Dennehotso is 4.3 People.
How Large is the Labor Force in Dennehotso?
There are 169 People in the Labor Forcein in Dennehotso.
What is the Percentage of People in the Labor Force in Dennehotso?
34.8% of People are in the Labor Force in Dennehotso.
What is the Unemployment Rate in Dennehotso?
Unemployment Rate in Dennehotso is 16.6%.