Colorado City, AZ Map & Demographics
Colorado City Map
Colorado City Overview
$11,117
PER CAPITA INCOME
47.1%
WAGE / INCOME GAP [ % ]
52.9¢/ $1
WAGE / INCOME GAP [ $ ]
0.52
INEQUALITY / GINI INDEX
2,628
TOTAL POPULATION
1,253
MALE POPULATION
1,375
FEMALE POPULATION
91.13
MALES / 100 FEMALES
109.74
FEMALES / 100 MALES
18.6
MEDIAN AGE
5.5
AVG FAMILY SIZE
5.3
AVG HOUSEHOLD SIZE
891
LABOR FORCE [ PEOPLE ]
56.4%
PERCENT IN LABOR FORCE
8.1%
UNEMPLOYMENT RATE
Colorado City Zip Codes
Income in Colorado City
Income Overview in Colorado City
| Characteristic | Number | Measure |
| Per Capita Income | 2,628 | $11,117 |
| Median Family Income | 449 | $0 |
| Mean Family Income | 449 | $59,934 |
| Median Household Income | 500 | $0 |
| Mean Household Income | 500 | $59,391 |
| Income Deficit | 449 | $0 |
| Wage / Income Gap (%) | 2,628 | 47.07% |
| Wage / Income Gap ($) | 2,628 | 52.93¢ per $1 |
| Gini / Inequality Index | 2,628 | 0.52 |
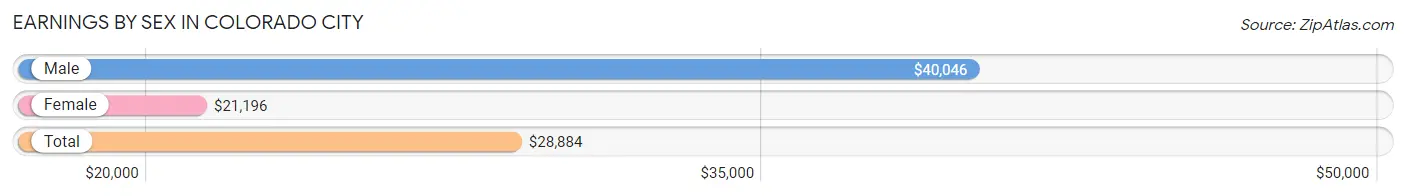
Earnings by Sex in Colorado City
Average Earnings in Colorado City are $28,884, $40,046 for men and $21,196 for women, a difference of 47.1%.
| Sex | Number | Average Earnings |
| Male | 442 (47.6%) | $40,046 |
| Female | 486 (52.4%) | $21,196 |
| Total | 928 (100.0%) | $28,884 |
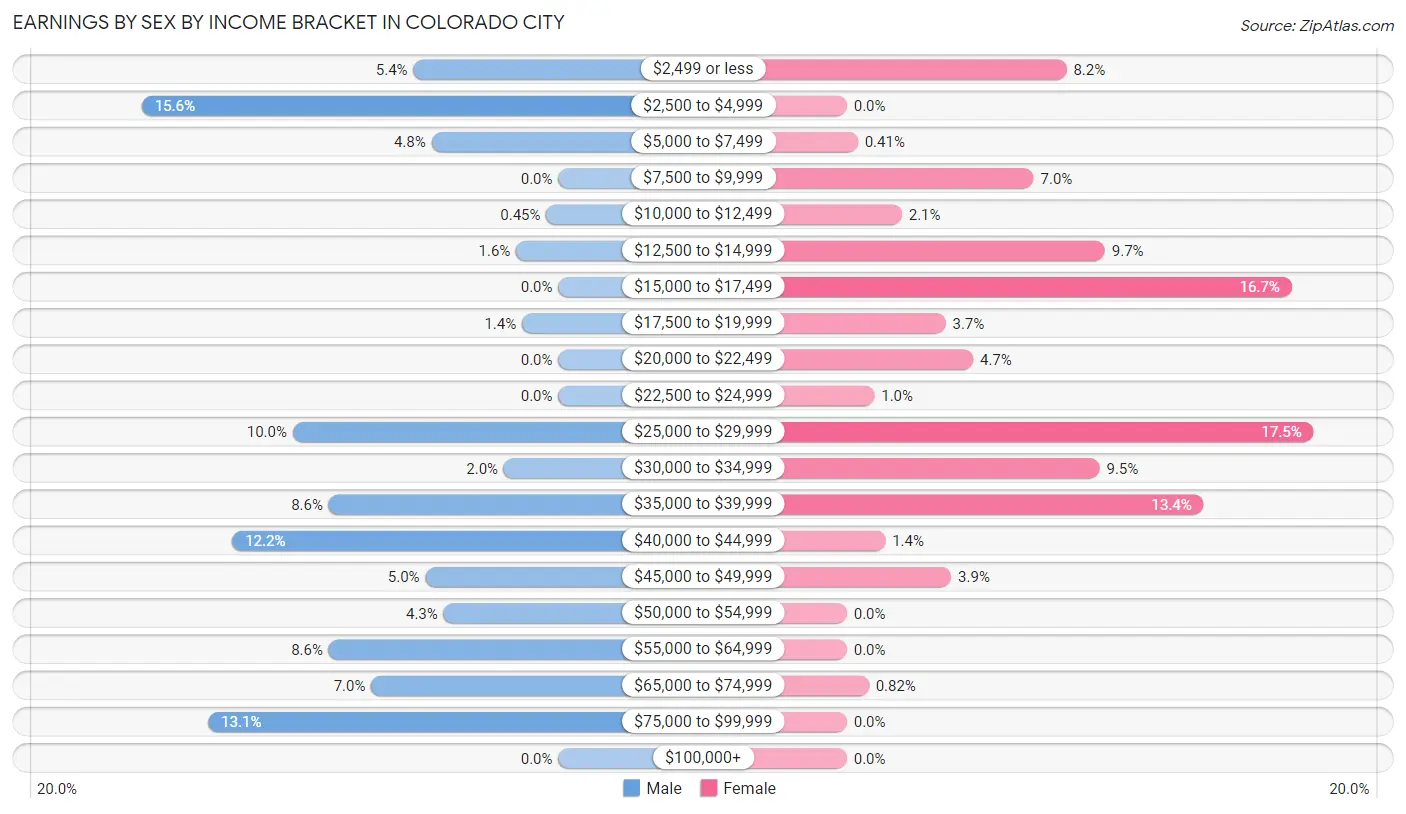
Earnings by Sex by Income Bracket in Colorado City
The most common earnings brackets in Colorado City are $2,500 to $4,999 for men (69 | 15.6%) and $25,000 to $29,999 for women (85 | 17.5%).
| Income | Male | Female |
| $2,499 or less | 24 (5.4%) | 40 (8.2%) |
| $2,500 to $4,999 | 69 (15.6%) | 0 (0.0%) |
| $5,000 to $7,499 | 21 (4.8%) | 2 (0.4%) |
| $7,500 to $9,999 | 0 (0.0%) | 34 (7.0%) |
| $10,000 to $12,499 | 2 (0.4%) | 10 (2.1%) |
| $12,500 to $14,999 | 7 (1.6%) | 47 (9.7%) |
| $15,000 to $17,499 | 0 (0.0%) | 81 (16.7%) |
| $17,500 to $19,999 | 6 (1.4%) | 18 (3.7%) |
| $20,000 to $22,499 | 0 (0.0%) | 23 (4.7%) |
| $22,500 to $24,999 | 0 (0.0%) | 5 (1.0%) |
| $25,000 to $29,999 | 44 (10.0%) | 85 (17.5%) |
| $30,000 to $34,999 | 9 (2.0%) | 46 (9.5%) |
| $35,000 to $39,999 | 38 (8.6%) | 65 (13.4%) |
| $40,000 to $44,999 | 54 (12.2%) | 7 (1.4%) |
| $45,000 to $49,999 | 22 (5.0%) | 19 (3.9%) |
| $50,000 to $54,999 | 19 (4.3%) | 0 (0.0%) |
| $55,000 to $64,999 | 38 (8.6%) | 0 (0.0%) |
| $65,000 to $74,999 | 31 (7.0%) | 4 (0.8%) |
| $75,000 to $99,999 | 58 (13.1%) | 0 (0.0%) |
| $100,000+ | 0 (0.0%) | 0 (0.0%) |
| Total | 442 (100.0%) | 486 (100.0%) |
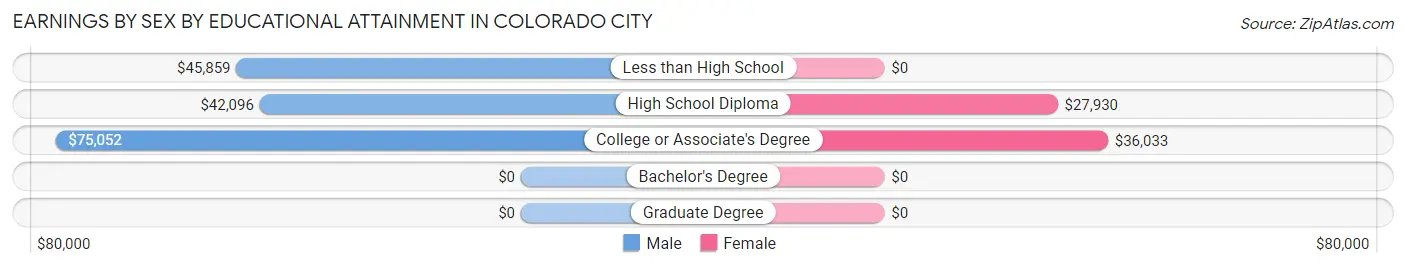
Earnings by Sex by Educational Attainment in Colorado City
Average earnings in Colorado City are $47,500 for men and $28,353 for women, a difference of 40.3%. Men with an educational attainment of college or associate's degree enjoy the highest average annual earnings of $75,052, while those with high school diploma education earn the least with $42,096. Women with an educational attainment of college or associate's degree earn the most with the average annual earnings of $36,033, while those with high school diploma education have the smallest earnings of $27,930.
| Educational Attainment | Male Income | Female Income |
| Less than High School | $45,859 | $0 |
| High School Diploma | $42,096 | $27,930 |
| College or Associate's Degree | $75,052 | $36,033 |
| Bachelor's Degree | - | - |
| Graduate Degree | - | - |
| Total | $47,500 | $28,353 |
Family Income in Colorado City
Family Income Brackets in Colorado City
According to the Colorado City family income data, there are 115 families falling into the less than $10,000 income range, which is the most common income bracket and makes up 25.6% of all families.
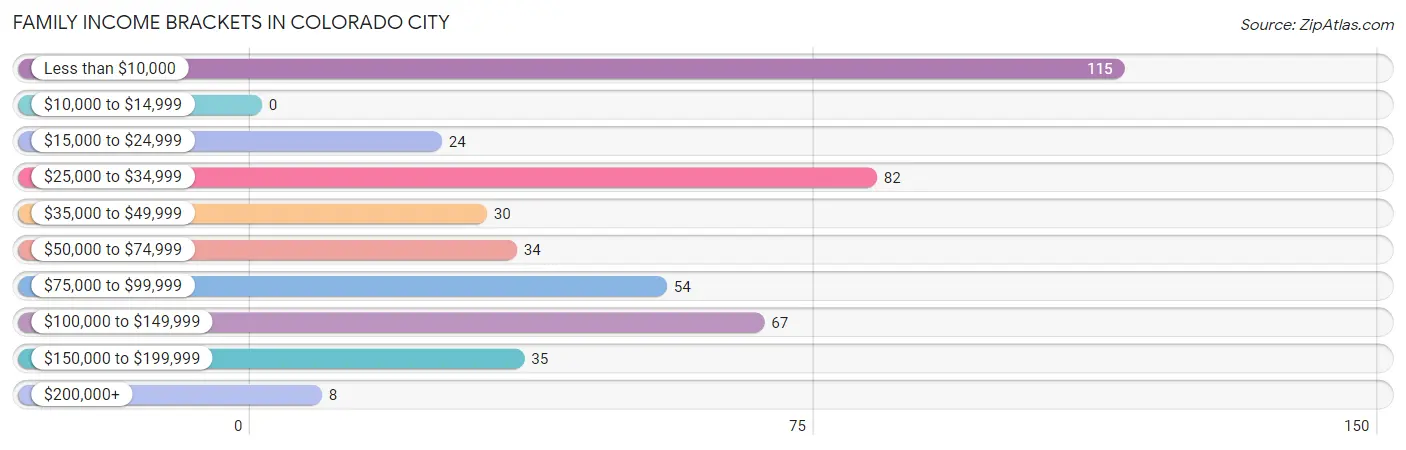
| Income Bracket | # Families | % Families |
| Less than $10,000 | 115 | 25.6% |
| $10,000 to $14,999 | 0 | 0.0% |
| $15,000 to $24,999 | 24 | 5.3% |
| $25,000 to $34,999 | 82 | 18.3% |
| $35,000 to $49,999 | 30 | 6.7% |
| $50,000 to $74,999 | 34 | 7.6% |
| $75,000 to $99,999 | 54 | 12.0% |
| $100,000 to $149,999 | 67 | 14.9% |
| $150,000 to $199,999 | 35 | 7.8% |
| $200,000+ | 8 | 1.8% |
Family Income by Famaliy Size in Colorado City
6-person families (55 | 12.2%) account for the highest median family income in Colorado City with $73,618 per family, while 6-person families (55 | 12.2%) have the highest median income of $12,270 per family member.
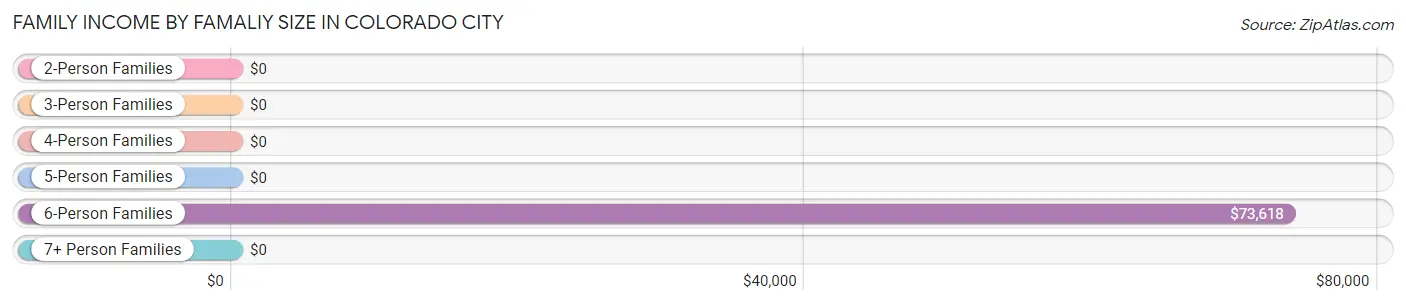
| Income Bracket | # Families | Median Income |
| 2-Person Families | 145 (32.3%) | $0 |
| 3-Person Families | 36 (8.0%) | $0 |
| 4-Person Families | 0 (0.0%) | $0 |
| 5-Person Families | 0 (0.0%) | $0 |
| 6-Person Families | 55 (12.2%) | $73,618 |
| 7+ Person Families | 213 (47.4%) | $0 |
| Total | 449 (100.0%) | $0 |
Family Income by Number of Earners in Colorado City
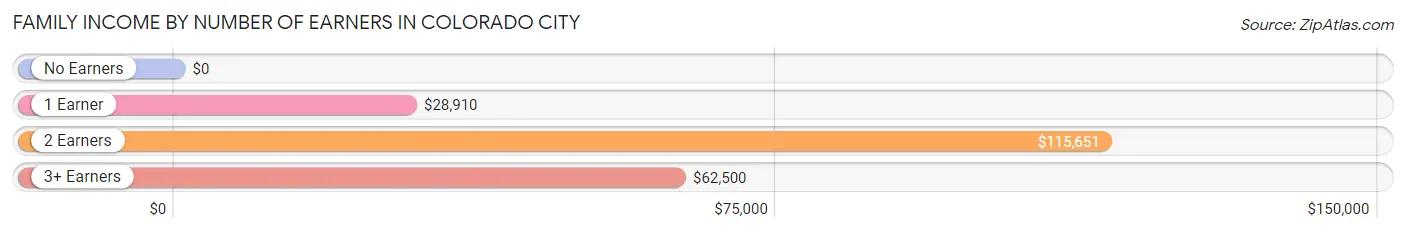
| Number of Earners | # Families | Median Income |
| No Earners | 115 (25.6%) | $0 |
| 1 Earner | 101 (22.5%) | $28,910 |
| 2 Earners | 133 (29.6%) | $115,651 |
| 3+ Earners | 100 (22.3%) | $62,500 |
| Total | 449 (100.0%) | $0 |
Household Income in Colorado City
Household Income Brackets in Colorado City
With 130 households falling in the category, the less than $10,000 income range is the most frequent in Colorado City, accounting for 26.0% of all households.
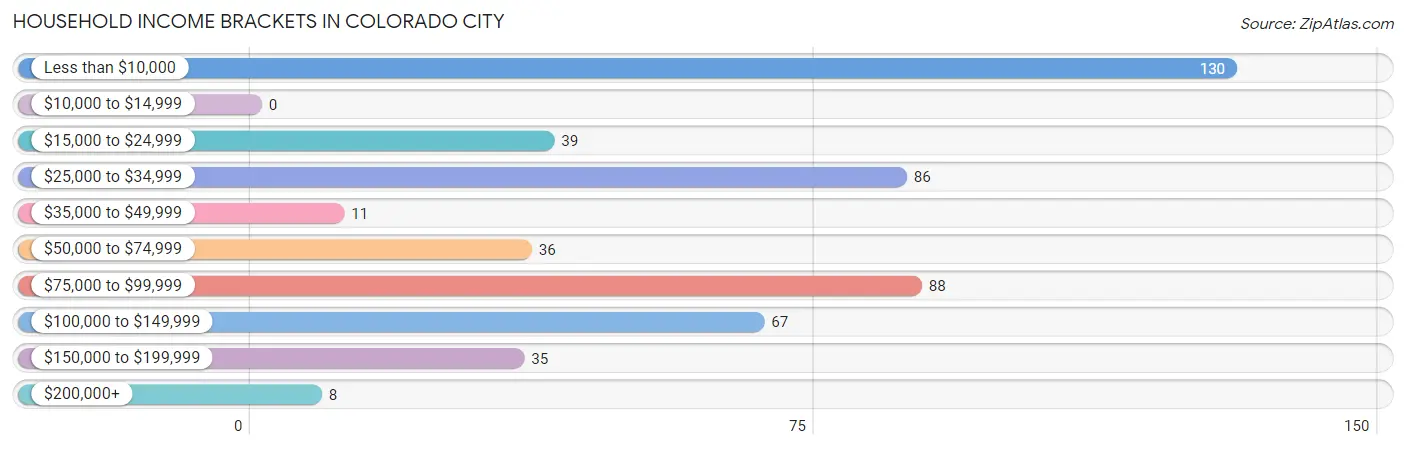
| Income Bracket | # Households | % Households |
| Less than $10,000 | 130 | 26.0% |
| $10,000 to $14,999 | 0 | 0.0% |
| $15,000 to $24,999 | 39 | 7.8% |
| $25,000 to $34,999 | 86 | 17.2% |
| $35,000 to $49,999 | 11 | 2.2% |
| $50,000 to $74,999 | 36 | 7.2% |
| $75,000 to $99,999 | 88 | 17.6% |
| $100,000 to $149,999 | 67 | 13.4% |
| $150,000 to $199,999 | 35 | 7.0% |
| $200,000+ | 8 | 1.6% |
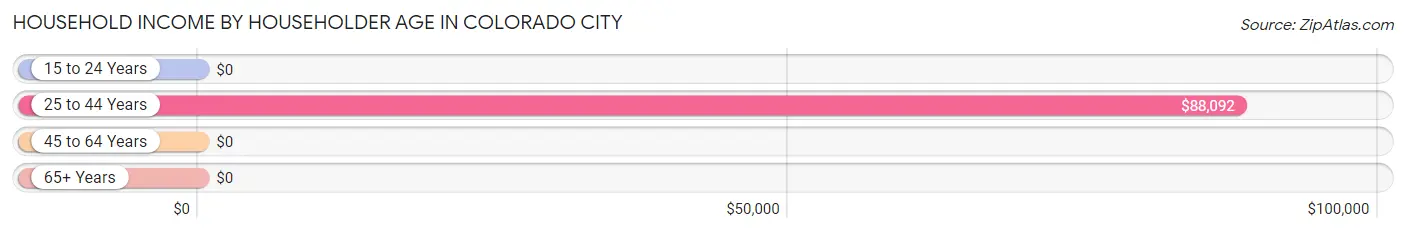
Household Income by Householder Age in Colorado City
The median household income in Colorado City is $0, with the highest median household income of $88,092 found in the 25 to 44 years age bracket for the primary householder. A total of 161 households (32.2%) fall into this category. Meanwhile, the 15 to 24 years age bracket for the primary householder has the lowest median household income of $0, with 35 households (7.0%) in this group.
| Income Bracket | # Households | Median Income |
| 15 to 24 Years | 35 (7.0%) | $0 |
| 25 to 44 Years | 161 (32.2%) | $88,092 |
| 45 to 64 Years | 304 (60.8%) | $0 |
| 65+ Years | 0 (0.0%) | $0 |
| Total | 500 (100.0%) | $0 |
Poverty in Colorado City
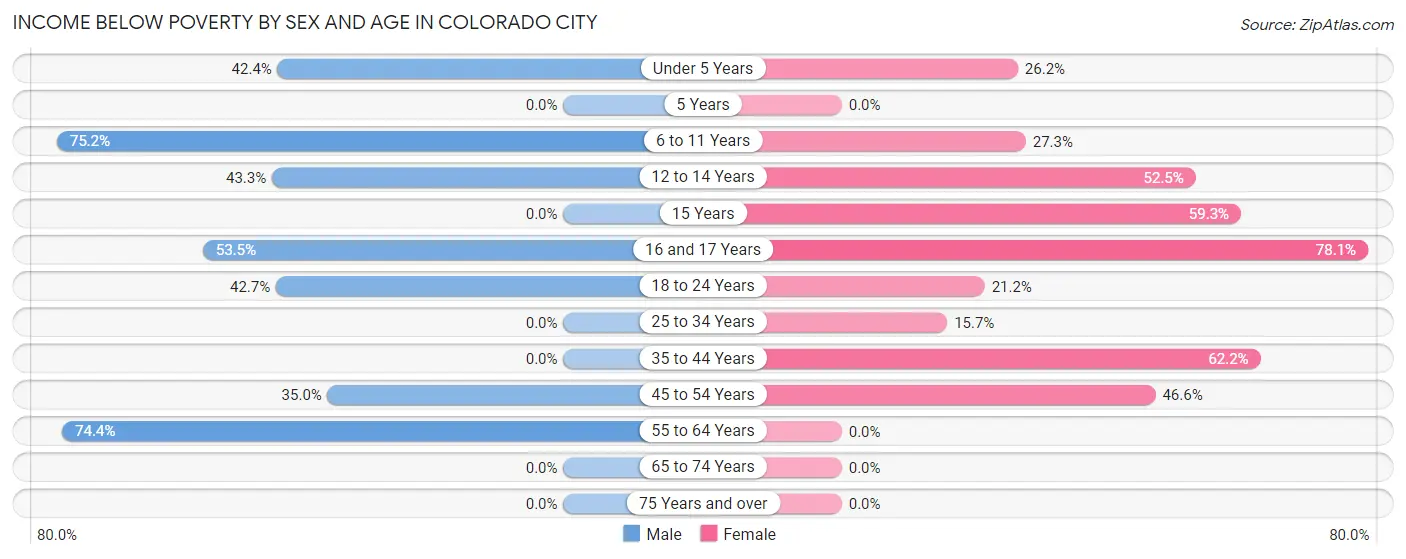
Income Below Poverty by Sex and Age in Colorado City
With 44.7% poverty level for males and 39.9% for females among the residents of Colorado City, 6 to 11 year old males and 16 and 17 year old females are the most vulnerable to poverty, with 170 males (75.2%) and 75 females (78.1%) in their respective age groups living below the poverty level.
| Age Bracket | Male | Female |
| Under 5 Years | 28 (42.4%) | 17 (26.2%) |
| 5 Years | 0 (0.0%) | 0 (0.0%) |
| 6 to 11 Years | 170 (75.2%) | 56 (27.3%) |
| 12 to 14 Years | 77 (43.3%) | 114 (52.5%) |
| 15 Years | 0 (0.0%) | 16 (59.3%) |
| 16 and 17 Years | 68 (53.5%) | 75 (78.1%) |
| 18 to 24 Years | 61 (42.7%) | 52 (21.2%) |
| 25 to 34 Years | 0 (0.0%) | 18 (15.7%) |
| 35 to 44 Years | 0 (0.0%) | 92 (62.2%) |
| 45 to 54 Years | 28 (35.0%) | 109 (46.6%) |
| 55 to 64 Years | 128 (74.4%) | 0 (0.0%) |
| 65 to 74 Years | 0 (0.0%) | 0 (0.0%) |
| 75 Years and over | 0 (0.0%) | 0 (0.0%) |
| Total | 560 (44.7%) | 549 (39.9%) |
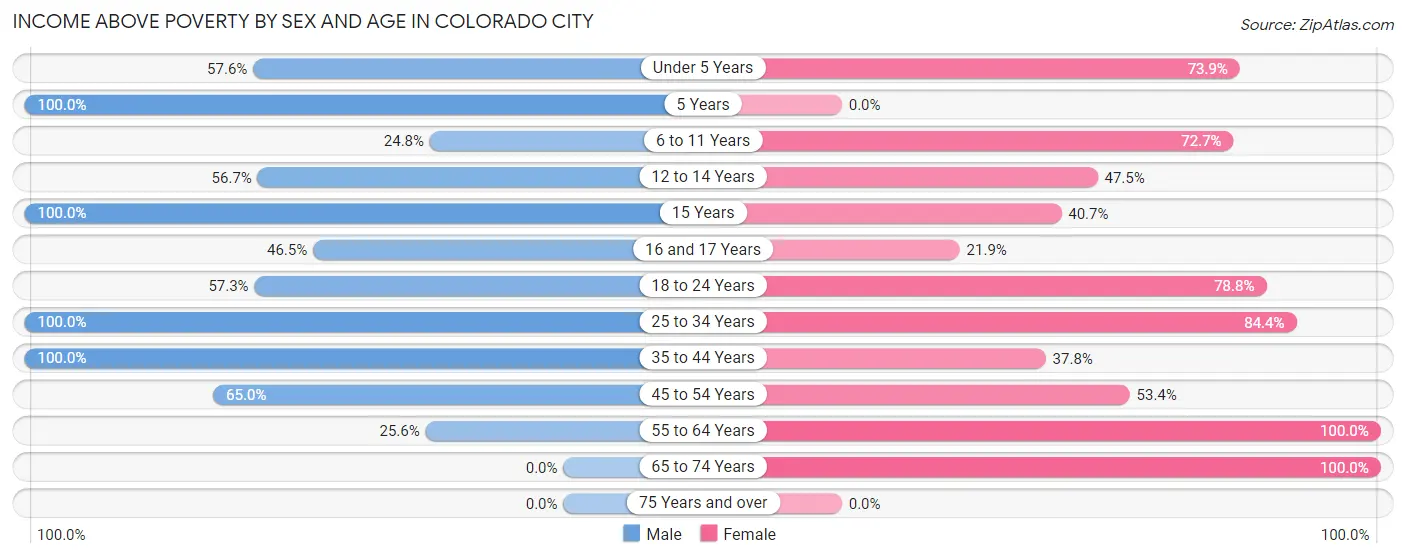
Income Above Poverty by Sex and Age in Colorado City
According to the poverty statistics in Colorado City, males aged 5 years and females aged 55 to 64 years are the age groups that are most secure financially, with 100.0% of males and 100.0% of females in these age groups living above the poverty line.
| Age Bracket | Male | Female |
| Under 5 Years | 38 (57.6%) | 48 (73.9%) |
| 5 Years | 36 (100.0%) | 0 (0.0%) |
| 6 to 11 Years | 56 (24.8%) | 149 (72.7%) |
| 12 to 14 Years | 101 (56.7%) | 103 (47.5%) |
| 15 Years | 29 (100.0%) | 11 (40.7%) |
| 16 and 17 Years | 59 (46.5%) | 21 (21.9%) |
| 18 to 24 Years | 82 (57.3%) | 193 (78.8%) |
| 25 to 34 Years | 110 (100.0%) | 97 (84.4%) |
| 35 to 44 Years | 86 (100.0%) | 56 (37.8%) |
| 45 to 54 Years | 52 (65.0%) | 125 (53.4%) |
| 55 to 64 Years | 44 (25.6%) | 9 (100.0%) |
| 65 to 74 Years | 0 (0.0%) | 14 (100.0%) |
| 75 Years and over | 0 (0.0%) | 0 (0.0%) |
| Total | 693 (55.3%) | 826 (60.1%) |
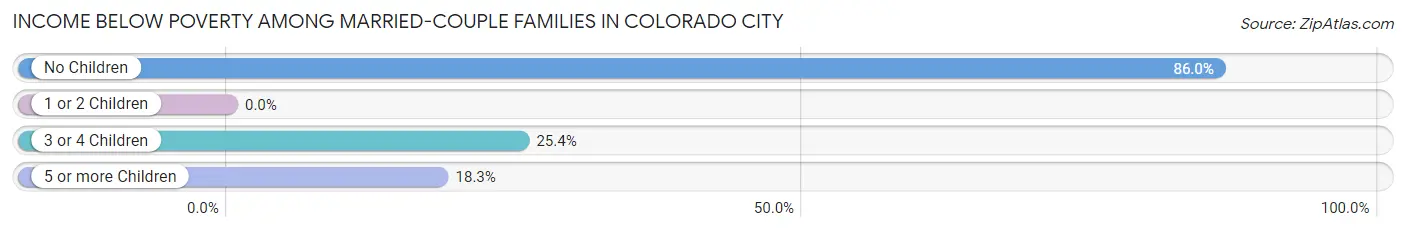
Income Below Poverty Among Married-Couple Families in Colorado City
The poverty statistics for married-couple families in Colorado City show that 48.5% or 126 of the total 260 families live below the poverty line. Families with no children have the highest poverty rate of 86.0%, comprising of 98 families. On the other hand, families with 1 or 2 children have the lowest poverty rate of 0.0%, which includes 0 families.
| Children | Above Poverty | Below Poverty |
| No Children | 16 (14.0%) | 98 (86.0%) |
| 1 or 2 Children | 19 (100.0%) | 0 (0.0%) |
| 3 or 4 Children | 50 (74.6%) | 17 (25.4%) |
| 5 or more Children | 49 (81.7%) | 11 (18.3%) |
| Total | 134 (51.5%) | 126 (48.5%) |
Income Below Poverty Among Single-Parent Households in Colorado City
According to the poverty data in Colorado City, 20.3% or 15 single-father households and 51.3% or 59 single-mother households are living below the poverty line. Among single-father households, those with 5 or more children have the highest poverty rate, with 15 households (44.1%) experiencing poverty. Likewise, among single-mother households, those with 5 or more children have the highest poverty rate, with 59 households (93.6%) falling below the poverty line.
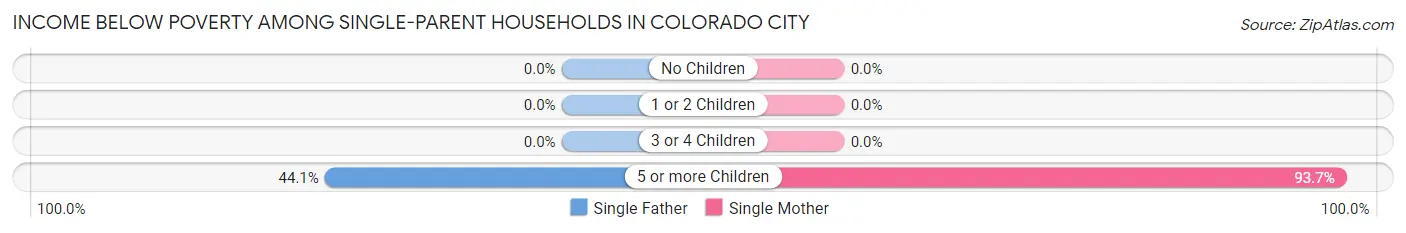
| Children | Single Father | Single Mother |
| No Children | 0 (0.0%) | 0 (0.0%) |
| 1 or 2 Children | 0 (0.0%) | 0 (0.0%) |
| 3 or 4 Children | 0 (0.0%) | 0 (0.0%) |
| 5 or more Children | 15 (44.1%) | 59 (93.6%) |
| Total | 15 (20.3%) | 59 (51.3%) |
Income Below Poverty Among Married-Couple vs Single-Parent Households in Colorado City
The poverty data for Colorado City shows that 126 of the married-couple family households (48.5%) and 74 of the single-parent households (39.2%) are living below the poverty level. Within the married-couple family households, those with no children have the highest poverty rate, with 98 households (86.0%) falling below the poverty line. Among the single-parent households, those with 5 or more children have the highest poverty rate, with 74 household (76.3%) living below poverty.
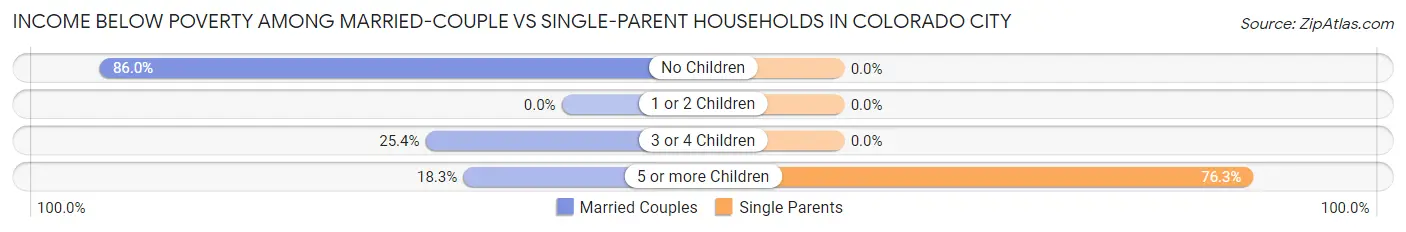
| Children | Married-Couple Families | Single-Parent Households |
| No Children | 98 (86.0%) | 0 (0.0%) |
| 1 or 2 Children | 0 (0.0%) | 0 (0.0%) |
| 3 or 4 Children | 17 (25.4%) | 0 (0.0%) |
| 5 or more Children | 11 (18.3%) | 74 (76.3%) |
| Total | 126 (48.5%) | 74 (39.2%) |
Race in Colorado City
The most populous races in Colorado City are White / Caucasian (2,628 | 100.0%), and Hispanic or Latino (4 | 0.2%).
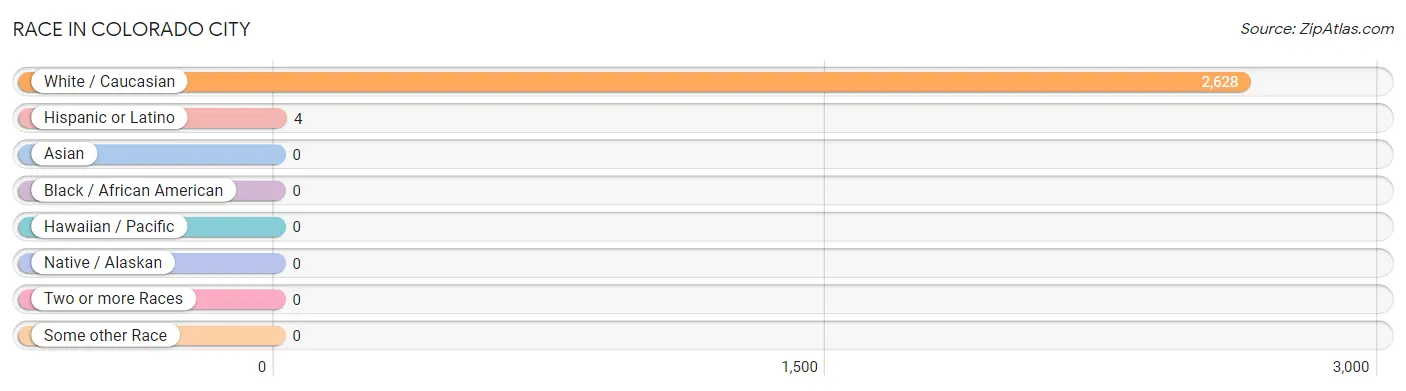
| Race | # Population | % Population |
| Asian | 0 | 0.0% |
| Black / African American | 0 | 0.0% |
| Hawaiian / Pacific | 0 | 0.0% |
| Hispanic or Latino | 4 | 0.2% |
| Native / Alaskan | 0 | 0.0% |
| White / Caucasian | 2,628 | 100.0% |
| Two or more Races | 0 | 0.0% |
| Some other Race | 0 | 0.0% |
| Total | 2,628 | 100.0% |
Ancestry in Colorado City
The most populous ancestries reported in Colorado City are English (1,189 | 45.2%), European (510 | 19.4%), German (402 | 15.3%), Danish (360 | 13.7%), and Swedish (203 | 7.7%), together accounting for 101.4% of all Colorado City residents.
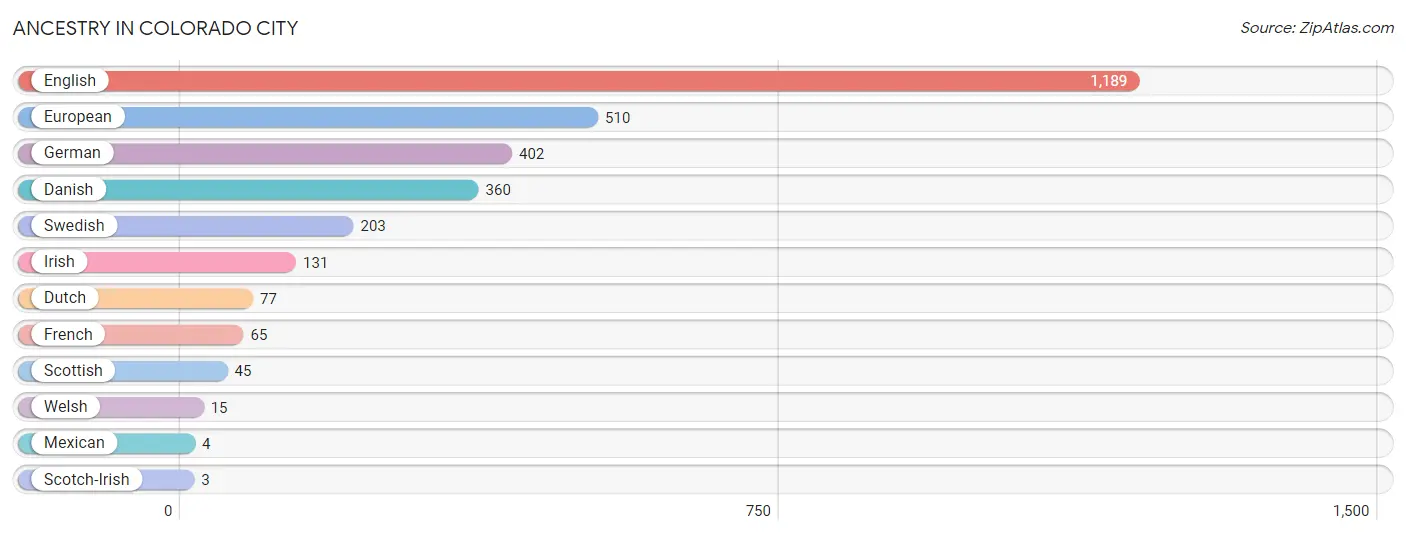
| Ancestry | # Population | % Population |
| Danish | 360 | 13.7% |
| Dutch | 77 | 2.9% |
| English | 1,189 | 45.2% |
| European | 510 | 19.4% |
| French | 65 | 2.5% |
| German | 402 | 15.3% |
| Irish | 131 | 5.0% |
| Mexican | 4 | 0.2% |
| Scotch-Irish | 3 | 0.1% |
| Scottish | 45 | 1.7% |
| Swedish | 203 | 7.7% |
| Welsh | 15 | 0.6% | View All 12 Rows |
Immigrants in Colorado City

| Immigration Origin | # Population | % Population | View All 0 Rows |
Sex and Age in Colorado City
Sex and Age in Colorado City
The most populous age groups in Colorado City are 15 to 19 Years (246 | 19.6%) for men and 10 to 14 Years (358 | 26.0%) for women.
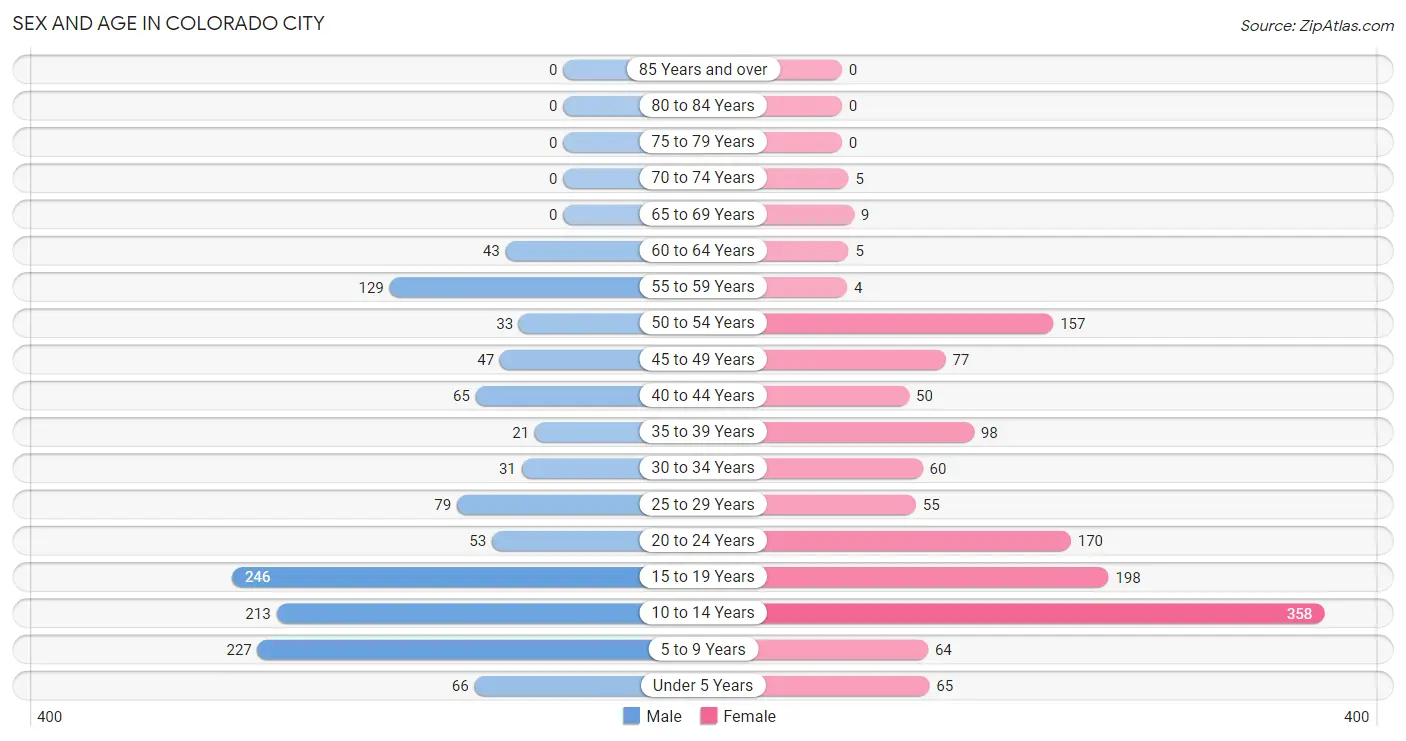
| Age Bracket | Male | Female |
| Under 5 Years | 66 (5.3%) | 65 (4.7%) |
| 5 to 9 Years | 227 (18.1%) | 64 (4.6%) |
| 10 to 14 Years | 213 (17.0%) | 358 (26.0%) |
| 15 to 19 Years | 246 (19.6%) | 198 (14.4%) |
| 20 to 24 Years | 53 (4.2%) | 170 (12.4%) |
| 25 to 29 Years | 79 (6.3%) | 55 (4.0%) |
| 30 to 34 Years | 31 (2.5%) | 60 (4.4%) |
| 35 to 39 Years | 21 (1.7%) | 98 (7.1%) |
| 40 to 44 Years | 65 (5.2%) | 50 (3.6%) |
| 45 to 49 Years | 47 (3.7%) | 77 (5.6%) |
| 50 to 54 Years | 33 (2.6%) | 157 (11.4%) |
| 55 to 59 Years | 129 (10.3%) | 4 (0.3%) |
| 60 to 64 Years | 43 (3.4%) | 5 (0.4%) |
| 65 to 69 Years | 0 (0.0%) | 9 (0.6%) |
| 70 to 74 Years | 0 (0.0%) | 5 (0.4%) |
| 75 to 79 Years | 0 (0.0%) | 0 (0.0%) |
| 80 to 84 Years | 0 (0.0%) | 0 (0.0%) |
| 85 Years and over | 0 (0.0%) | 0 (0.0%) |
| Total | 1,253 (100.0%) | 1,375 (100.0%) |
Families and Households in Colorado City
Median Family Size in Colorado City
The median family size in Colorado City is 5.54 persons per family, with single male/father families (74 | 16.5%) accounting for the largest median family size of 6.55 persons per family. On the other hand, married-couple families (260 | 57.9%) represent the smallest median family size with 4.99 persons per family.
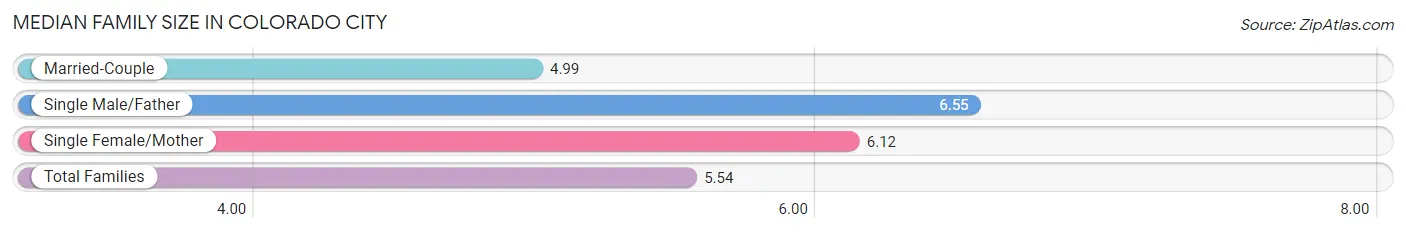
| Family Type | # Families | Family Size |
| Married-Couple | 260 (57.9%) | 4.99 |
| Single Male/Father | 74 (16.5%) | 6.55 |
| Single Female/Mother | 115 (25.6%) | 6.12 |
| Total Families | 449 (100.0%) | 5.54 |
Median Household Size in Colorado City
The median household size in Colorado City is 5.26 persons per household, with single male/father households (74 | 14.8%) accounting for the largest median household size of 7.55 persons per household. non-family households (51 | 10.2%) represent the smallest median household size with 1.33 persons per household.
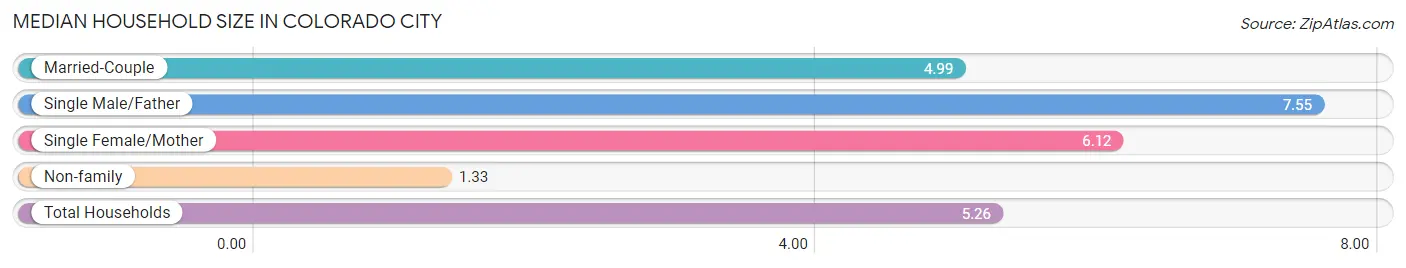
| Household Type | # Households | Household Size |
| Married-Couple | 260 (52.0%) | 4.99 |
| Single Male/Father | 74 (14.8%) | 7.55 |
| Single Female/Mother | 115 (23.0%) | 6.12 |
| Non-family | 51 (10.2%) | 1.33 |
| Total Households | 500 (100.0%) | 5.26 |
Household Size by Marriage Status in Colorado City
Out of a total of 500 households in Colorado City, 449 (89.8%) are family households, while 51 (10.2%) are nonfamily households. The most numerous type of family households are 7+ person households, comprising 249, and the most common type of nonfamily households are 1-person households, comprising 34.
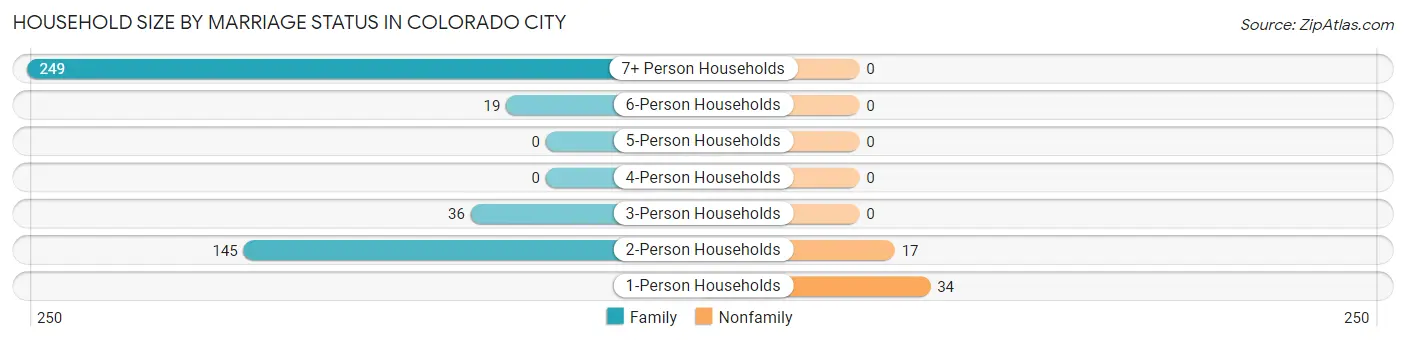
| Household Size | Family Households | Nonfamily Households |
| 1-Person Households | - | 34 (6.8%) |
| 2-Person Households | 145 (29.0%) | 17 (3.4%) |
| 3-Person Households | 36 (7.2%) | 0 (0.0%) |
| 4-Person Households | 0 (0.0%) | 0 (0.0%) |
| 5-Person Households | 0 (0.0%) | 0 (0.0%) |
| 6-Person Households | 19 (3.8%) | 0 (0.0%) |
| 7+ Person Households | 249 (49.8%) | 0 (0.0%) |
| Total | 449 (89.8%) | 51 (10.2%) |
Female Fertility in Colorado City
Fertility by Age in Colorado City
| Age Bracket | Women with Births | Births / 1,000 Women |
| 15 to 19 years | 0 (0.0%) | 0.0 |
| 20 to 34 years | 0 (0.0%) | 0.0 |
| 35 to 50 years | 0 (0.0%) | 0.0 |
| Total | 0 (0.0%) | 0.0 |
Fertility by Age by Marriage Status in Colorado City
| Age Bracket | Married | Unmarried |
| 15 to 19 years | 0 (0.0%) | 0 (0.0%) |
| 20 to 34 years | 0 (0.0%) | 0 (0.0%) |
| 35 to 50 years | 0 (0.0%) | 0 (0.0%) |
| Total | 0 (0.0%) | 0 (0.0%) |
Fertility by Education in Colorado City
| Educational Attainment | Women with Births | Births / 1,000 Women |
| Less than High School | 0 (0.0%) | 0.0 |
| High School Diploma | 0 (0.0%) | 0.0 |
| College or Associate's Degree | 0 (0.0%) | 0.0 |
| Bachelor's Degree | 0 (0.0%) | 0.0 |
| Graduate Degree | 0 (0.0%) | 0.0 |
| Total | 0 (0.0%) | 0.0 |
Fertility by Education by Marriage Status in Colorado City
| Educational Attainment | Married | Unmarried |
| Less than High School | 0 (0.0%) | 0 (0.0%) |
| High School Diploma | 0 (0.0%) | 0 (0.0%) |
| College or Associate's Degree | 0 (0.0%) | 0 (0.0%) |
| Bachelor's Degree | 0 (0.0%) | 0 (0.0%) |
| Graduate Degree | 0 (0.0%) | 0 (0.0%) |
| Total | 0 (0.0%) | 0 (0.0%) |
Employment Characteristics in Colorado City
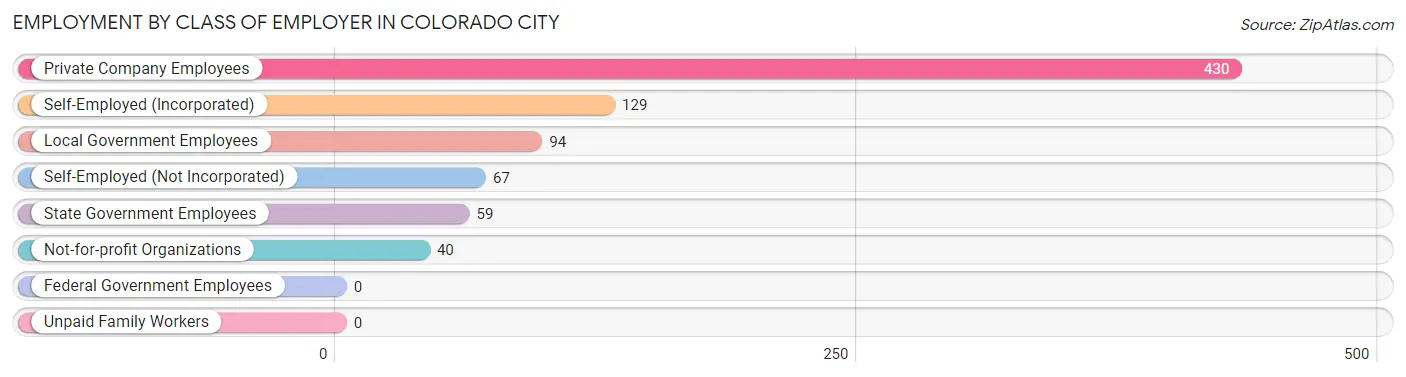
Employment by Class of Employer in Colorado City
Among the 819 employed individuals in Colorado City, private company employees (430 | 52.5%), self-employed (incorporated) (129 | 15.8%), and local government employees (94 | 11.5%) make up the most common classes of employment.
| Employer Class | # Employees | % Employees |
| Private Company Employees | 430 | 52.5% |
| Self-Employed (Incorporated) | 129 | 15.8% |
| Self-Employed (Not Incorporated) | 67 | 8.2% |
| Not-for-profit Organizations | 40 | 4.9% |
| Local Government Employees | 94 | 11.5% |
| State Government Employees | 59 | 7.2% |
| Federal Government Employees | 0 | 0.0% |
| Unpaid Family Workers | 0 | 0.0% |
| Total | 819 | 100.0% |
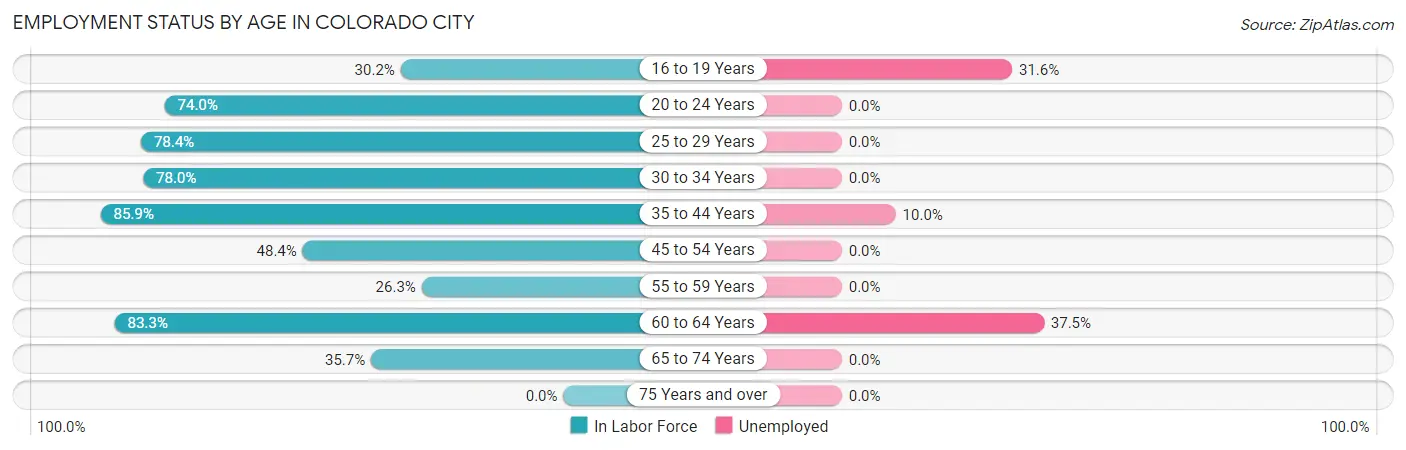
Employment Status by Age in Colorado City
According to the labor force statistics for Colorado City, out of the total population over 16 years of age (1,579), 56.4% or 891 individuals are in the labor force, with 8.1% or 72 of them unemployed. The age group with the highest labor force participation rate is 35 to 44 years, with 85.9% or 201 individuals in the labor force. Within the labor force, the 60 to 64 years age range has the highest percentage of unemployed individuals, with 37.5% or 15 of them being unemployed.
| Age Bracket | In Labor Force | Unemployed |
| 16 to 19 Years | 117 (30.2%) | 37 (31.6%) |
| 20 to 24 Years | 165 (74.0%) | 0 (0.0%) |
| 25 to 29 Years | 105 (78.4%) | 0 (0.0%) |
| 30 to 34 Years | 71 (78.0%) | 0 (0.0%) |
| 35 to 44 Years | 201 (85.9%) | 20 (10.0%) |
| 45 to 54 Years | 152 (48.4%) | 0 (0.0%) |
| 55 to 59 Years | 35 (26.3%) | 0 (0.0%) |
| 60 to 64 Years | 40 (83.3%) | 15 (37.5%) |
| 65 to 74 Years | 5 (35.7%) | 0 (0.0%) |
| 75 Years and over | 0 (0.0%) | 0 (0.0%) |
| Total | 891 (56.4%) | 72 (8.1%) |
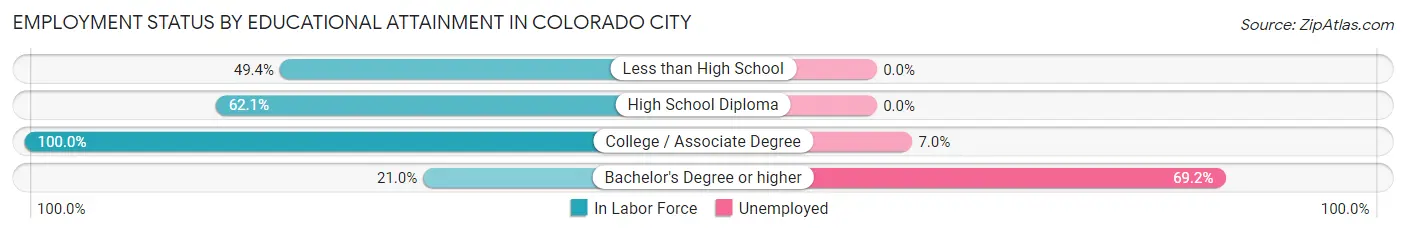
Employment Status by Educational Attainment in Colorado City
According to labor force statistics for Colorado City, 63.3% of individuals (604) out of the total population between 25 and 64 years of age (954) are in the labor force, with 5.8% or 35 of them being unemployed. The group with the highest labor force participation rate are those with the educational attainment of college / associate degree, with 100.0% or 243 individuals in the labor force. Within the labor force, individuals with bachelor's degree or higher education have the highest percentage of unemployment, with 69.2% or 18 of them being unemployed.
| Educational Attainment | In Labor Force | Unemployed |
| Less than High School | 115 (49.4%) | 0 (0.0%) |
| High School Diploma | 220 (62.1%) | 0 (0.0%) |
| College / Associate Degree | 243 (100.0%) | 17 (7.0%) |
| Bachelor's Degree or higher | 26 (21.0%) | 86 (69.2%) |
| Total | 604 (63.3%) | 55 (5.8%) |
Employment Occupations by Sex in Colorado City
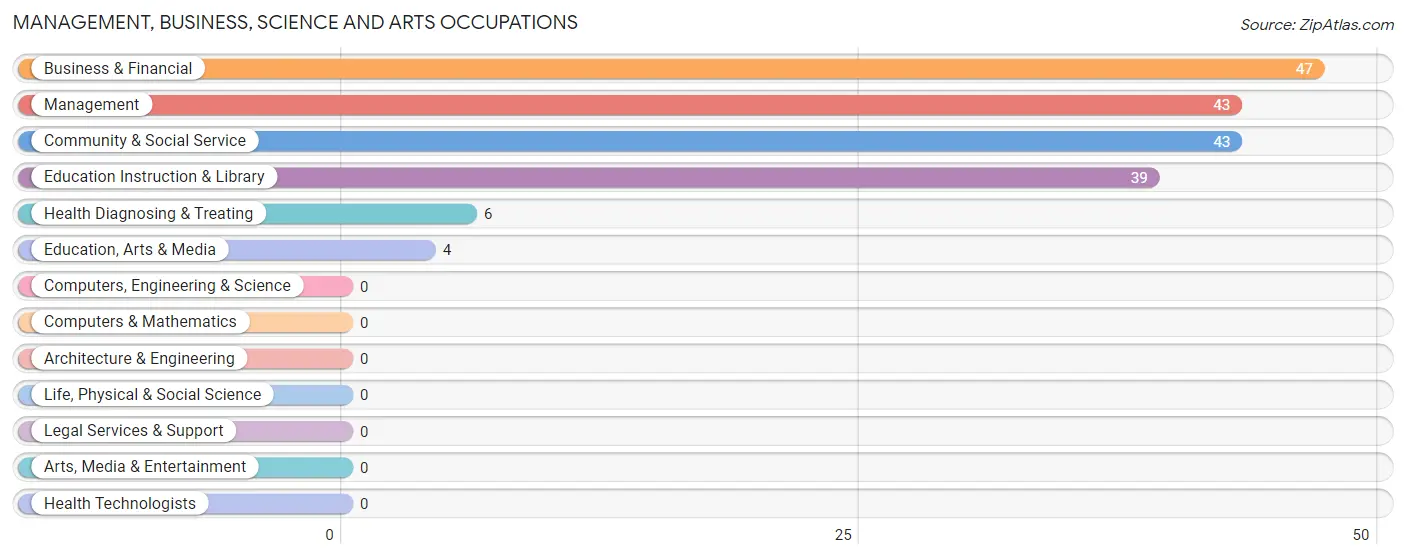
Management, Business, Science and Arts Occupations
The most common Management, Business, Science and Arts occupations in Colorado City are Business & Financial (47 | 5.7%), Management (43 | 5.2%), Community & Social Service (43 | 5.2%), Education Instruction & Library (39 | 4.8%), and Health Diagnosing & Treating (6 | 0.7%).
Management, Business, Science and Arts Occupations by Sex
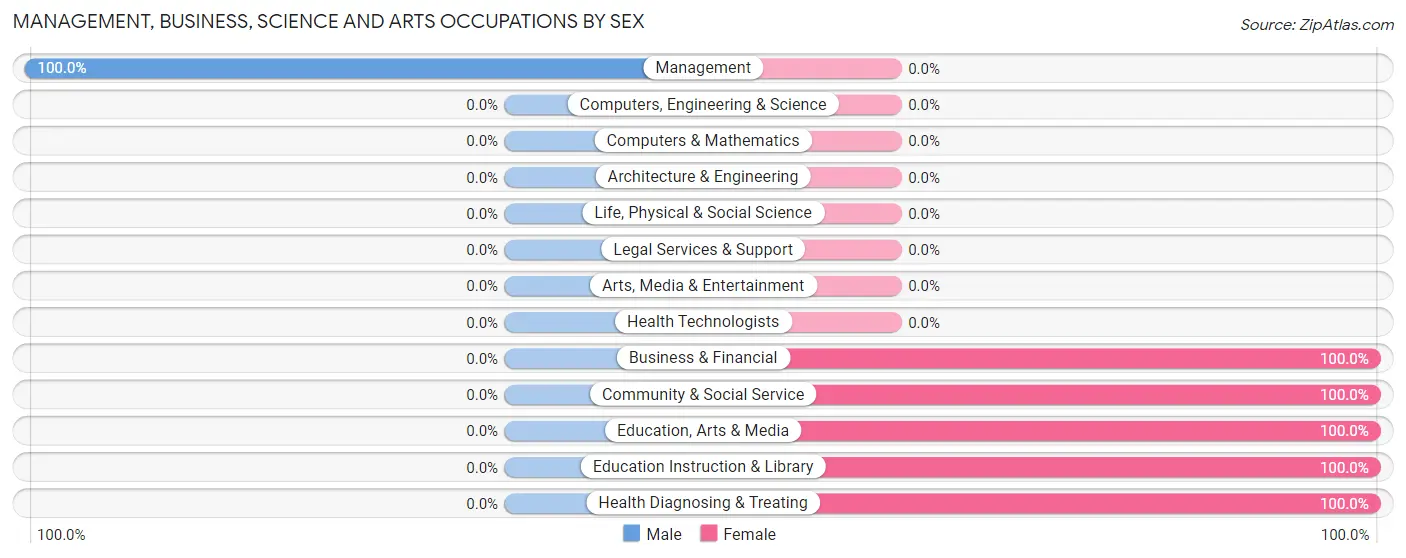
| Occupation | Male | Female |
| Management | 43 (100.0%) | 0 (0.0%) |
| Business & Financial | 0 (0.0%) | 47 (100.0%) |
| Computers, Engineering & Science | 0 (0.0%) | 0 (0.0%) |
| Computers & Mathematics | 0 (0.0%) | 0 (0.0%) |
| Architecture & Engineering | 0 (0.0%) | 0 (0.0%) |
| Life, Physical & Social Science | 0 (0.0%) | 0 (0.0%) |
| Community & Social Service | 0 (0.0%) | 43 (100.0%) |
| Education, Arts & Media | 0 (0.0%) | 4 (100.0%) |
| Legal Services & Support | 0 (0.0%) | 0 (0.0%) |
| Education Instruction & Library | 0 (0.0%) | 39 (100.0%) |
| Arts, Media & Entertainment | 0 (0.0%) | 0 (0.0%) |
| Health Diagnosing & Treating | 0 (0.0%) | 6 (100.0%) |
| Health Technologists | 0 (0.0%) | 0 (0.0%) |
| Total (Category) | 43 (30.9%) | 96 (69.1%) |
| Total (Overall) | 375 (45.8%) | 444 (54.2%) |
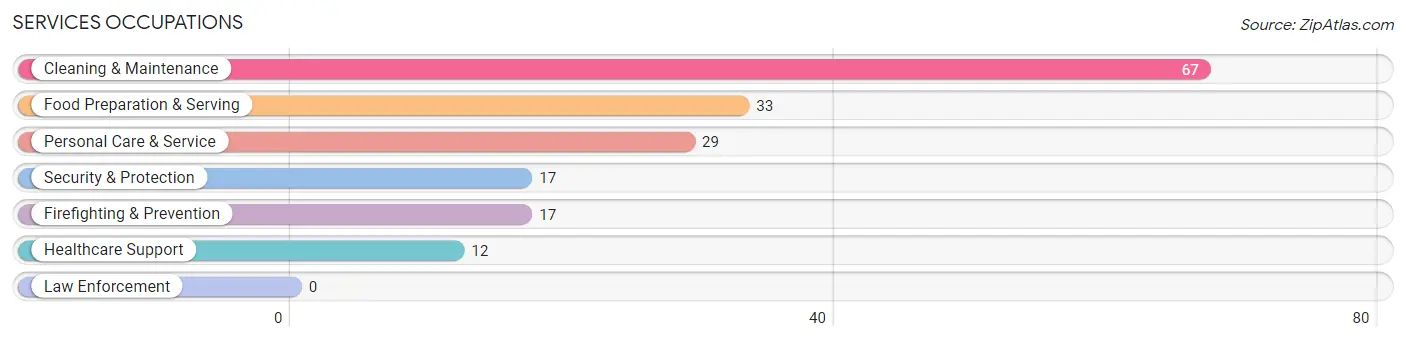
Services Occupations
The most common Services occupations in Colorado City are Cleaning & Maintenance (67 | 8.2%), Food Preparation & Serving (33 | 4.0%), Personal Care & Service (29 | 3.5%), Security & Protection (17 | 2.1%), and Firefighting & Prevention (17 | 2.1%).
Services Occupations by Sex
Within the Services occupations in Colorado City, the most male-oriented occupations are Food Preparation & Serving (30.3%), Cleaning & Maintenance (28.4%), and Healthcare Support (16.7%), while the most female-oriented occupations are Security & Protection (100.0%), Firefighting & Prevention (100.0%), and Personal Care & Service (100.0%).
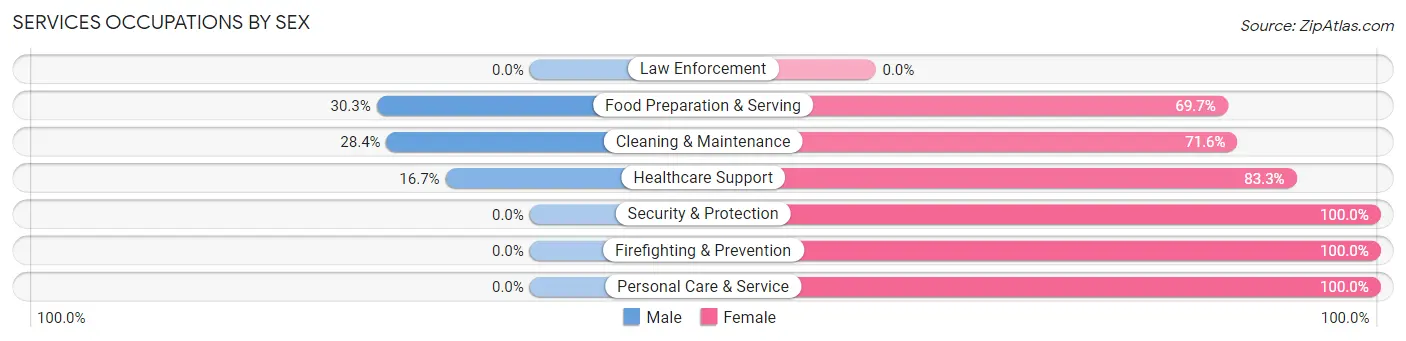
| Occupation | Male | Female |
| Healthcare Support | 2 (16.7%) | 10 (83.3%) |
| Security & Protection | 0 (0.0%) | 17 (100.0%) |
| Firefighting & Prevention | 0 (0.0%) | 17 (100.0%) |
| Law Enforcement | 0 (0.0%) | 0 (0.0%) |
| Food Preparation & Serving | 10 (30.3%) | 23 (69.7%) |
| Cleaning & Maintenance | 19 (28.4%) | 48 (71.6%) |
| Personal Care & Service | 0 (0.0%) | 29 (100.0%) |
| Total (Category) | 31 (19.6%) | 127 (80.4%) |
| Total (Overall) | 375 (45.8%) | 444 (54.2%) |
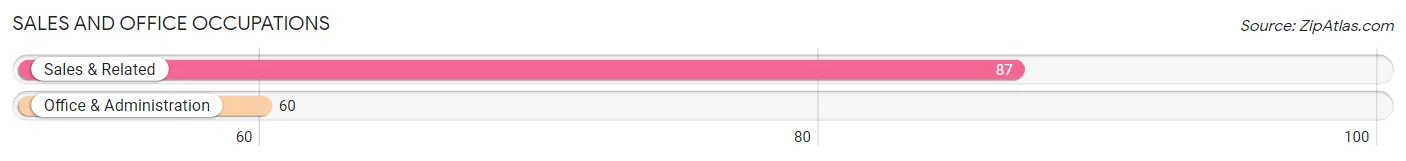
Sales and Office Occupations
The most common Sales and Office occupations in Colorado City are Sales & Related (87 | 10.6%), and Office & Administration (60 | 7.3%).
Sales and Office Occupations by Sex

| Occupation | Male | Female |
| Sales & Related | 20 (23.0%) | 67 (77.0%) |
| Office & Administration | 0 (0.0%) | 60 (100.0%) |
| Total (Category) | 20 (13.6%) | 127 (86.4%) |
| Total (Overall) | 375 (45.8%) | 444 (54.2%) |
Natural Resources, Construction and Maintenance Occupations
The most common Natural Resources, Construction and Maintenance occupations in Colorado City are Construction & Extraction (227 | 27.7%), and Installation, Maintenance & Repair (24 | 2.9%).
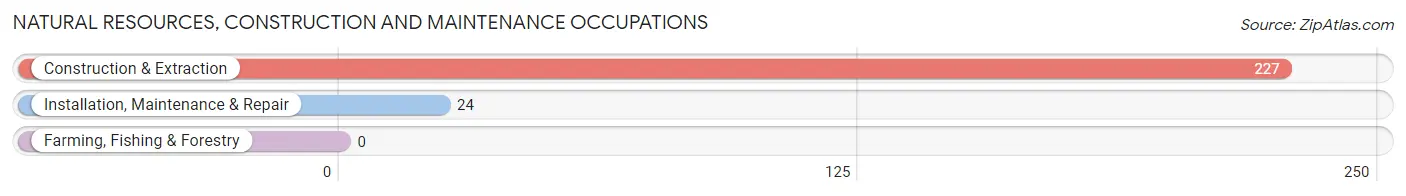
Natural Resources, Construction and Maintenance Occupations by Sex
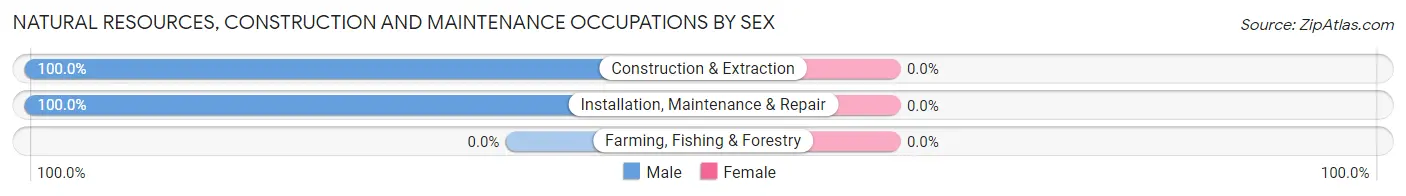
| Occupation | Male | Female |
| Farming, Fishing & Forestry | 0 (0.0%) | 0 (0.0%) |
| Construction & Extraction | 227 (100.0%) | 0 (0.0%) |
| Installation, Maintenance & Repair | 24 (100.0%) | 0 (0.0%) |
| Total (Category) | 251 (100.0%) | 0 (0.0%) |
| Total (Overall) | 375 (45.8%) | 444 (54.2%) |
Production, Transportation and Moving Occupations
The most common Production, Transportation and Moving occupations in Colorado City are Production (87 | 10.6%), and Material Moving (37 | 4.5%).
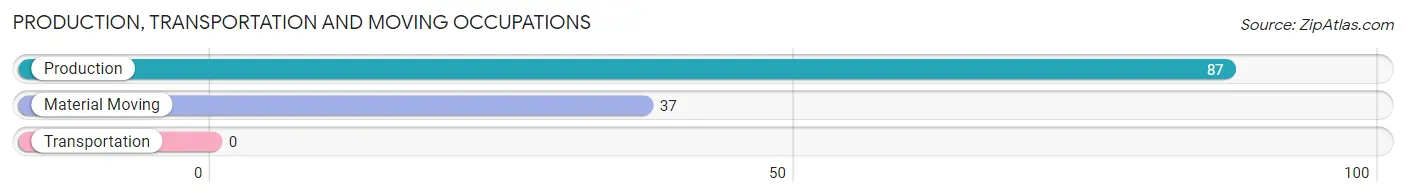
Production, Transportation and Moving Occupations by Sex
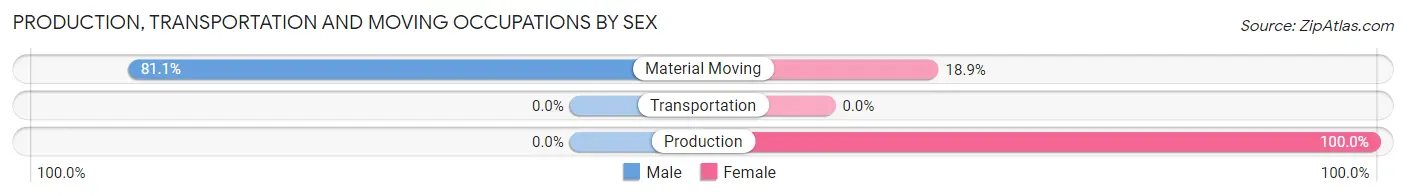
| Occupation | Male | Female |
| Production | 0 (0.0%) | 87 (100.0%) |
| Transportation | 0 (0.0%) | 0 (0.0%) |
| Material Moving | 30 (81.1%) | 7 (18.9%) |
| Total (Category) | 30 (24.2%) | 94 (75.8%) |
| Total (Overall) | 375 (45.8%) | 444 (54.2%) |
Employment Industries by Sex in Colorado City
Employment Industries in Colorado City
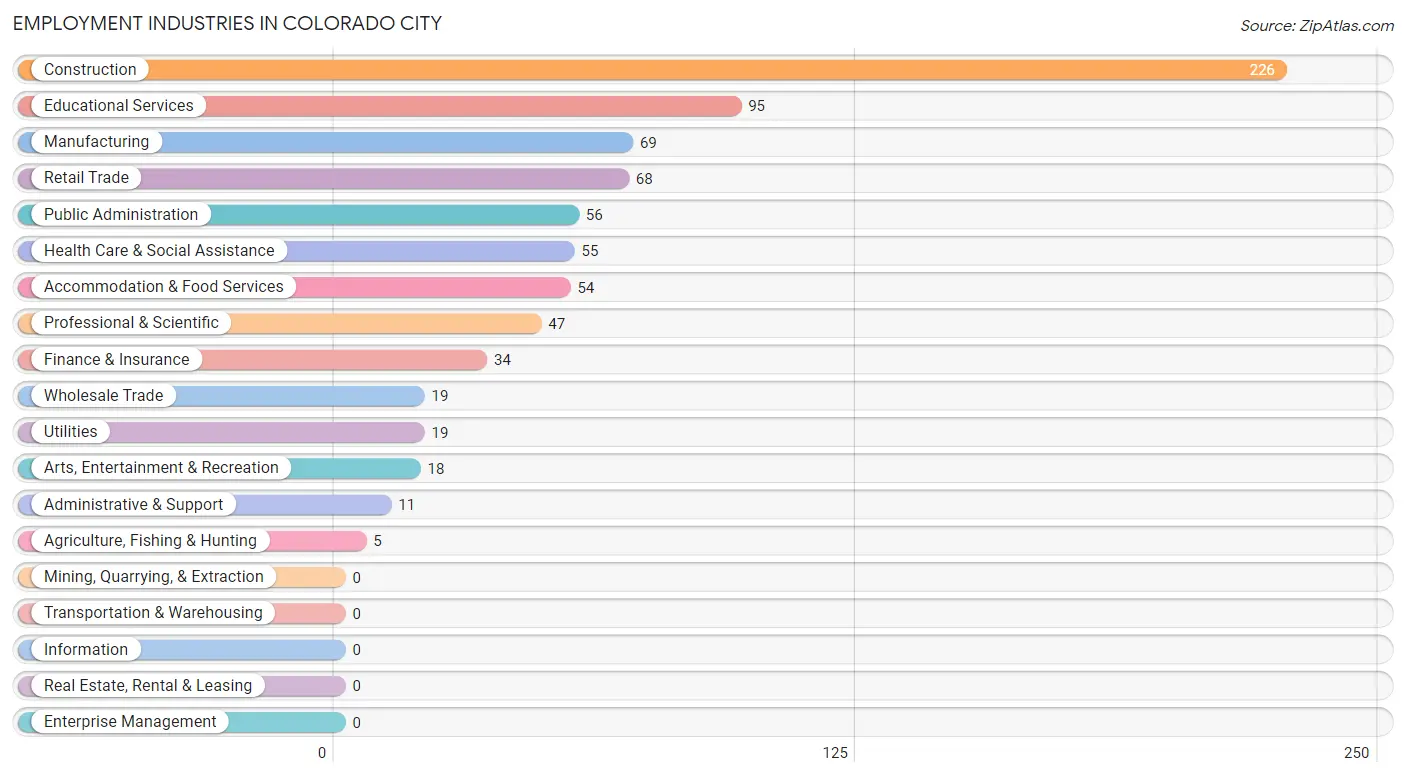
The major employment industries in Colorado City include Construction (226 | 27.6%), Educational Services (95 | 11.6%), Manufacturing (69 | 8.4%), Retail Trade (68 | 8.3%), and Public Administration (56 | 6.8%).
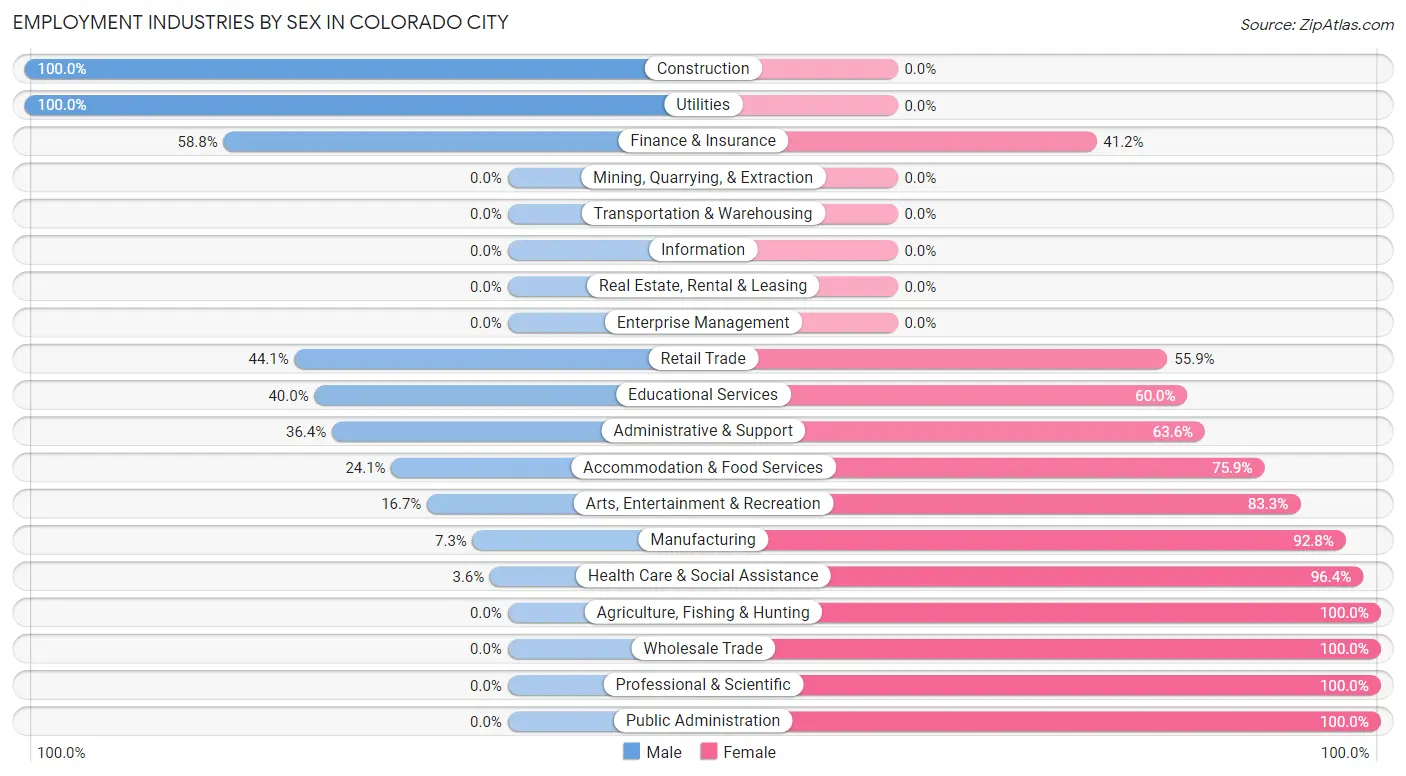
Employment Industries by Sex in Colorado City
The Colorado City industries that see more men than women are Construction (100.0%), Utilities (100.0%), and Finance & Insurance (58.8%), whereas the industries that tend to have a higher number of women are Agriculture, Fishing & Hunting (100.0%), Wholesale Trade (100.0%), and Professional & Scientific (100.0%).
| Industry | Male | Female |
| Agriculture, Fishing & Hunting | 0 (0.0%) | 5 (100.0%) |
| Mining, Quarrying, & Extraction | 0 (0.0%) | 0 (0.0%) |
| Construction | 226 (100.0%) | 0 (0.0%) |
| Manufacturing | 5 (7.2%) | 64 (92.7%) |
| Wholesale Trade | 0 (0.0%) | 19 (100.0%) |
| Retail Trade | 30 (44.1%) | 38 (55.9%) |
| Transportation & Warehousing | 0 (0.0%) | 0 (0.0%) |
| Utilities | 19 (100.0%) | 0 (0.0%) |
| Information | 0 (0.0%) | 0 (0.0%) |
| Finance & Insurance | 20 (58.8%) | 14 (41.2%) |
| Real Estate, Rental & Leasing | 0 (0.0%) | 0 (0.0%) |
| Professional & Scientific | 0 (0.0%) | 47 (100.0%) |
| Enterprise Management | 0 (0.0%) | 0 (0.0%) |
| Administrative & Support | 4 (36.4%) | 7 (63.6%) |
| Educational Services | 38 (40.0%) | 57 (60.0%) |
| Health Care & Social Assistance | 2 (3.6%) | 53 (96.4%) |
| Arts, Entertainment & Recreation | 3 (16.7%) | 15 (83.3%) |
| Accommodation & Food Services | 13 (24.1%) | 41 (75.9%) |
| Public Administration | 0 (0.0%) | 56 (100.0%) |
| Total | 375 (45.8%) | 444 (54.2%) |
Education in Colorado City
School Enrollment in Colorado City
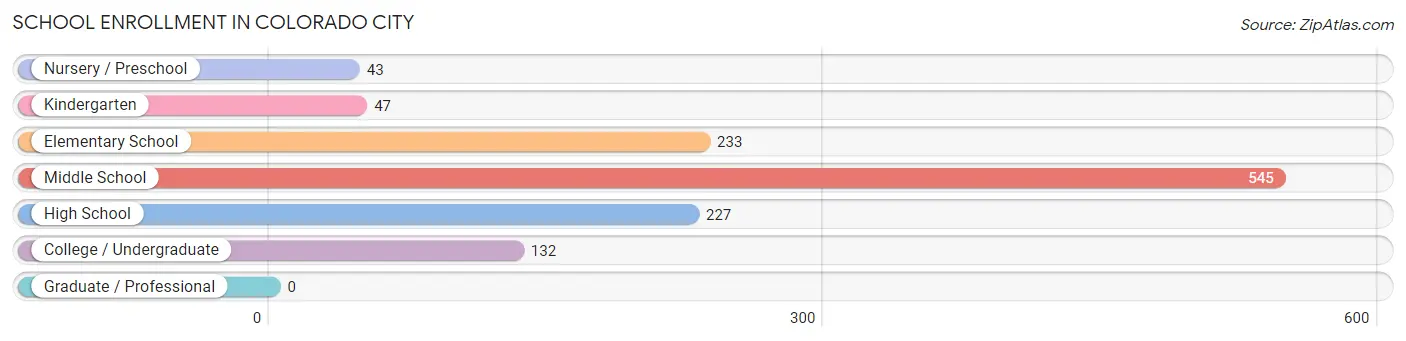
The most common levels of schooling among the 1,227 students in Colorado City are middle school (545 | 44.4%), elementary school (233 | 19.0%), and high school (227 | 18.5%).
| School Level | # Students | % Students |
| Nursery / Preschool | 43 | 3.5% |
| Kindergarten | 47 | 3.8% |
| Elementary School | 233 | 19.0% |
| Middle School | 545 | 44.4% |
| High School | 227 | 18.5% |
| College / Undergraduate | 132 | 10.8% |
| Graduate / Professional | 0 | 0.0% |
| Total | 1,227 | 100.0% |
School Enrollment by Age by Funding Source in Colorado City
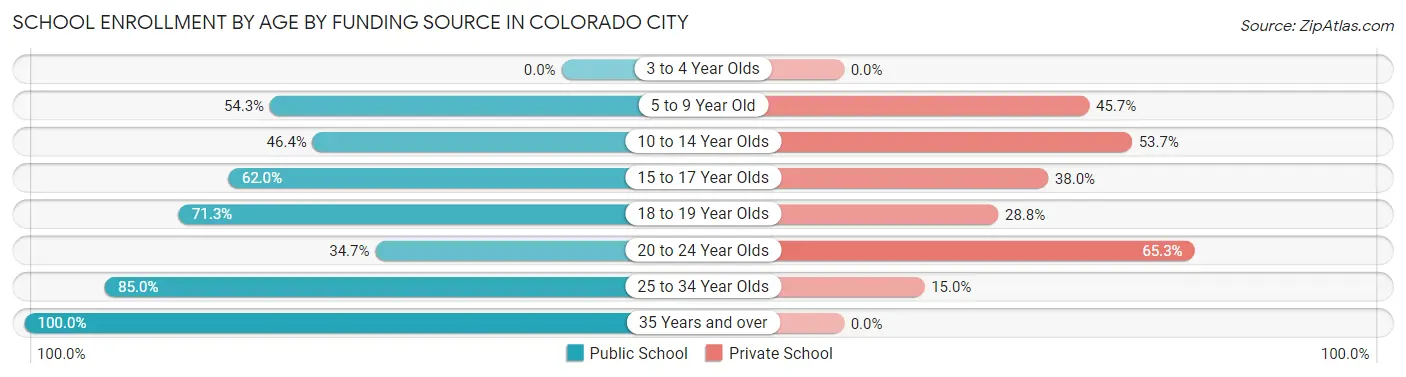
Out of a total of 1,227 students who are enrolled in schools in Colorado City, 571 (46.5%) attend a private institution, while the remaining 656 (53.5%) are enrolled in public schools. The age group of 20 to 24 year olds has the highest likelihood of being enrolled in private schools, with 49 (65.3% in the age bracket) enrolled. Conversely, the age group of 35 years and over has the lowest likelihood of being enrolled in a private school, with 37 (100.0% in the age bracket) attending a public institution.
| Age Bracket | Public School | Private School |
| 3 to 4 Year Olds | 0 (0.0%) | 0 (0.0%) |
| 5 to 9 Year Old | 158 (54.3%) | 133 (45.7%) |
| 10 to 14 Year Olds | 260 (46.4%) | 301 (53.6%) |
| 15 to 17 Year Olds | 101 (62.0%) | 62 (38.0%) |
| 18 to 19 Year Olds | 57 (71.3%) | 23 (28.7%) |
| 20 to 24 Year Olds | 26 (34.7%) | 49 (65.3%) |
| 25 to 34 Year Olds | 17 (85.0%) | 3 (15.0%) |
| 35 Years and over | 37 (100.0%) | 0 (0.0%) |
| Total | 656 (53.5%) | 571 (46.5%) |
Educational Attainment by Field of Study in Colorado City
Education (107 | 80.4%), science & technology (20 | 15.0%), bio, nature & agricultural (3 | 2.3%), and psychology (3 | 2.3%) are the most common fields of study among 133 individuals in Colorado City who have obtained a bachelor's degree or higher.
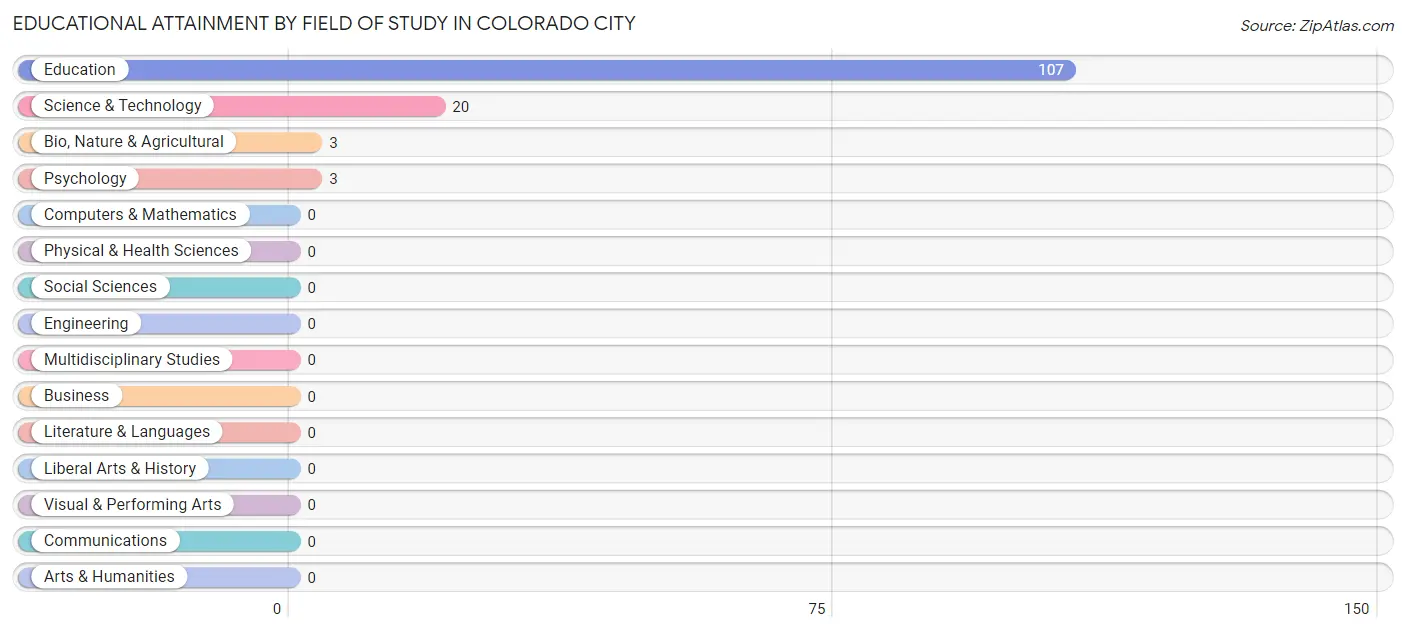
| Field of Study | # Graduates | % Graduates |
| Computers & Mathematics | 0 | 0.0% |
| Bio, Nature & Agricultural | 3 | 2.3% |
| Physical & Health Sciences | 0 | 0.0% |
| Psychology | 3 | 2.3% |
| Social Sciences | 0 | 0.0% |
| Engineering | 0 | 0.0% |
| Multidisciplinary Studies | 0 | 0.0% |
| Science & Technology | 20 | 15.0% |
| Business | 0 | 0.0% |
| Education | 107 | 80.4% |
| Literature & Languages | 0 | 0.0% |
| Liberal Arts & History | 0 | 0.0% |
| Visual & Performing Arts | 0 | 0.0% |
| Communications | 0 | 0.0% |
| Arts & Humanities | 0 | 0.0% |
| Total | 133 | 100.0% |
Transportation & Commute in Colorado City
Vehicle Availability by Sex in Colorado City
The most prevalent vehicle ownership categories in Colorado City are males with 2 vehicles (112, accounting for 29.9%) and females with 2 vehicles (89, making up 25.2%).
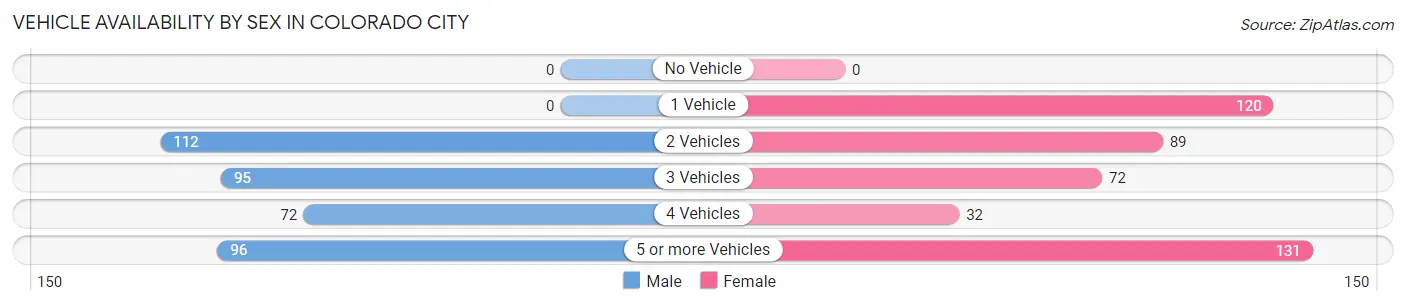
| Vehicles Available | Male | Female |
| No Vehicle | 0 (0.0%) | 0 (0.0%) |
| 1 Vehicle | 0 (0.0%) | 120 (27.0%) |
| 2 Vehicles | 112 (29.9%) | 89 (20.1%) |
| 3 Vehicles | 95 (25.3%) | 72 (16.2%) |
| 4 Vehicles | 72 (19.2%) | 32 (7.2%) |
| 5 or more Vehicles | 96 (25.6%) | 131 (29.5%) |
| Total | 375 (100.0%) | 444 (100.0%) |
Commute Time in Colorado City
The most frequently occuring commute durations in Colorado City are 5 to 9 minutes (243 commuters, 31.4%), less than 5 minutes (227 commuters, 29.3%), and 45 to 59 minutes (115 commuters, 14.8%).
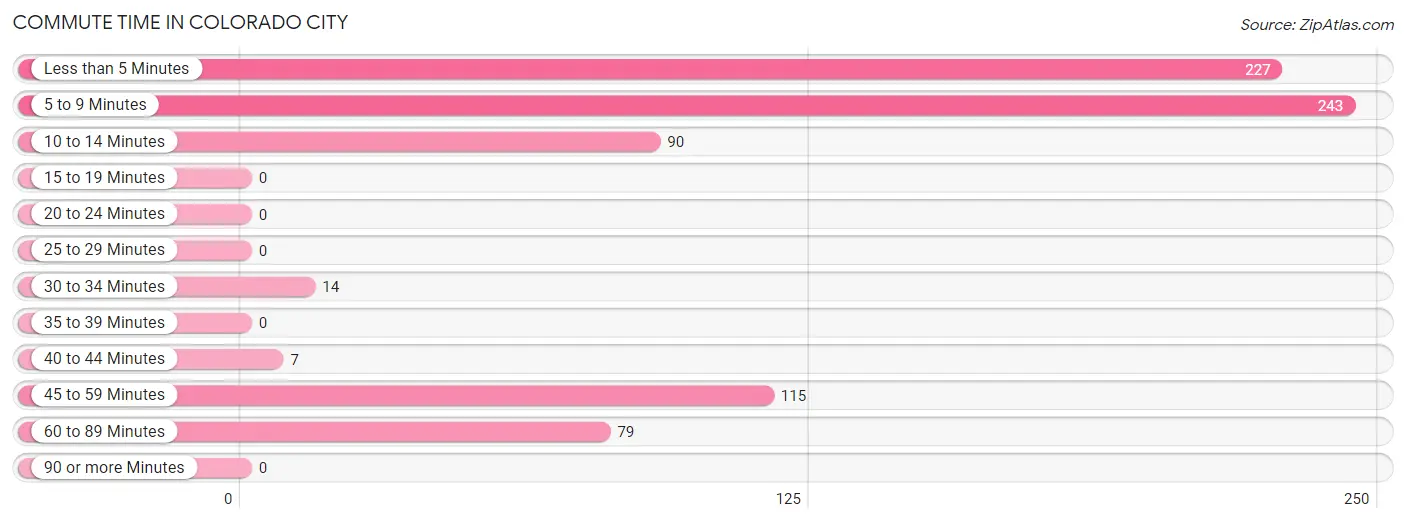
| Commute Time | # Commuters | % Commuters |
| Less than 5 Minutes | 227 | 29.3% |
| 5 to 9 Minutes | 243 | 31.4% |
| 10 to 14 Minutes | 90 | 11.6% |
| 15 to 19 Minutes | 0 | 0.0% |
| 20 to 24 Minutes | 0 | 0.0% |
| 25 to 29 Minutes | 0 | 0.0% |
| 30 to 34 Minutes | 14 | 1.8% |
| 35 to 39 Minutes | 0 | 0.0% |
| 40 to 44 Minutes | 7 | 0.9% |
| 45 to 59 Minutes | 115 | 14.8% |
| 60 to 89 Minutes | 79 | 10.2% |
| 90 or more Minutes | 0 | 0.0% |
Commute Time by Sex in Colorado City
The most common commute times in Colorado City are 5 to 9 minutes (126 commuters, 37.4%) for males and less than 5 minutes (141 commuters, 32.2%) for females.
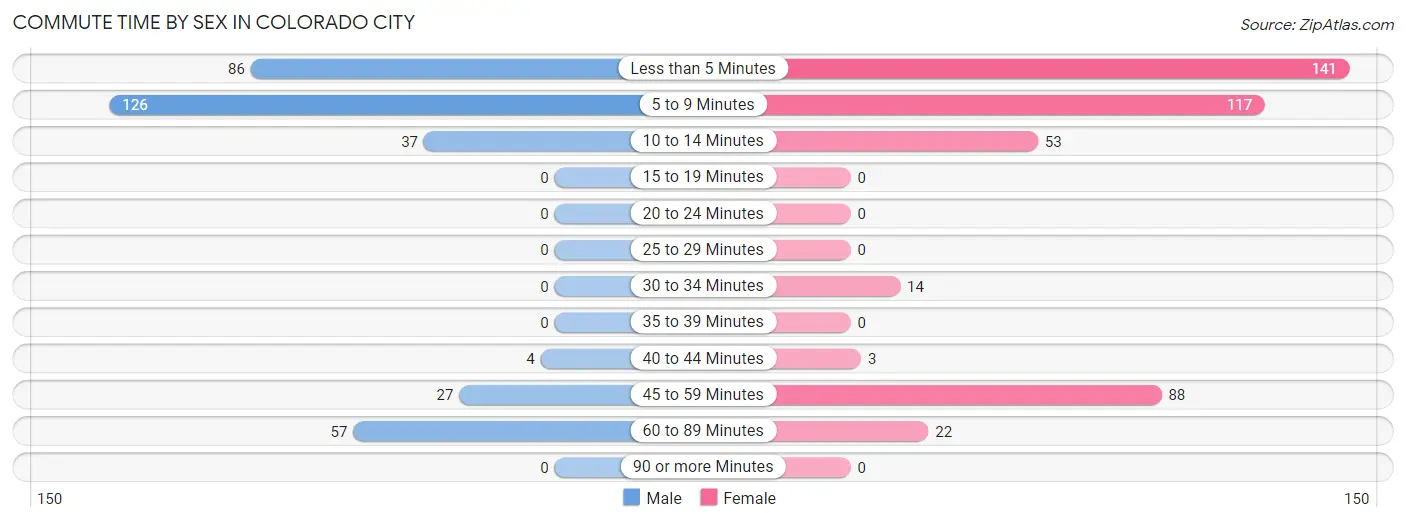
| Commute Time | Male | Female |
| Less than 5 Minutes | 86 (25.5%) | 141 (32.2%) |
| 5 to 9 Minutes | 126 (37.4%) | 117 (26.7%) |
| 10 to 14 Minutes | 37 (11.0%) | 53 (12.1%) |
| 15 to 19 Minutes | 0 (0.0%) | 0 (0.0%) |
| 20 to 24 Minutes | 0 (0.0%) | 0 (0.0%) |
| 25 to 29 Minutes | 0 (0.0%) | 0 (0.0%) |
| 30 to 34 Minutes | 0 (0.0%) | 14 (3.2%) |
| 35 to 39 Minutes | 0 (0.0%) | 0 (0.0%) |
| 40 to 44 Minutes | 4 (1.2%) | 3 (0.7%) |
| 45 to 59 Minutes | 27 (8.0%) | 88 (20.1%) |
| 60 to 89 Minutes | 57 (16.9%) | 22 (5.0%) |
| 90 or more Minutes | 0 (0.0%) | 0 (0.0%) |
Time of Departure to Work by Sex in Colorado City
The most frequent times of departure to work in Colorado City are 8:00 AM to 8:29 AM (131, 38.9%) for males and 8:00 AM to 8:29 AM (135, 30.8%) for females.
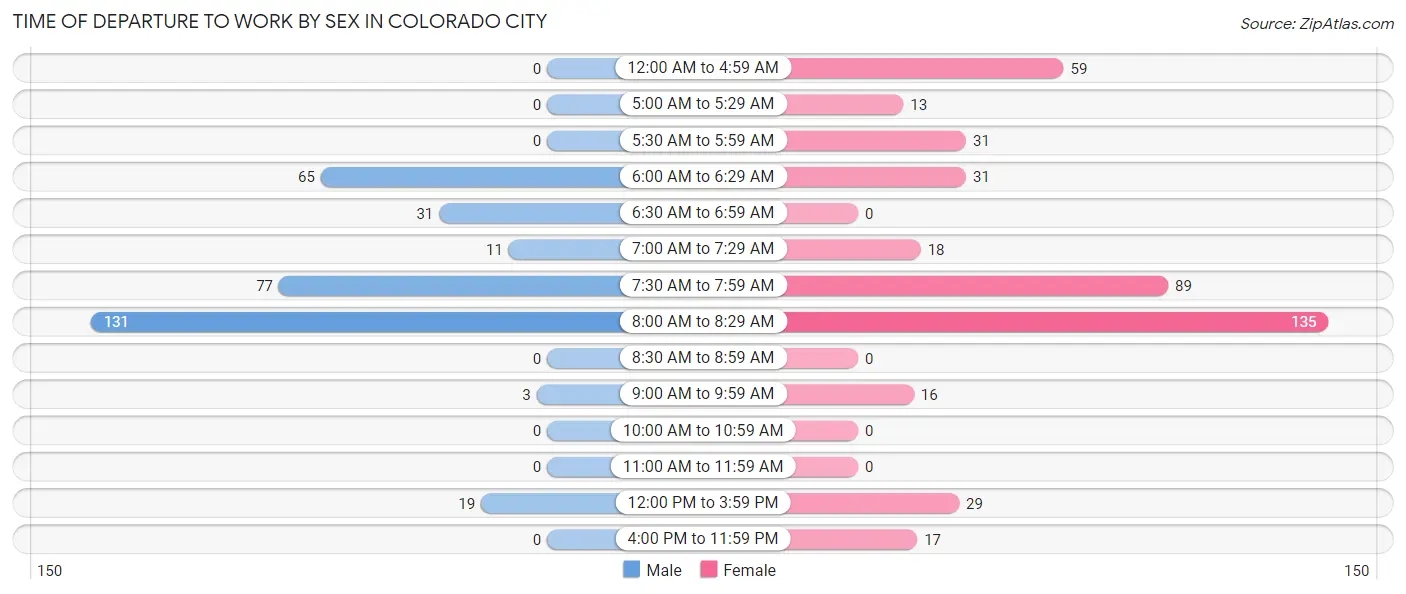
| Time of Departure | Male | Female |
| 12:00 AM to 4:59 AM | 0 (0.0%) | 59 (13.5%) |
| 5:00 AM to 5:29 AM | 0 (0.0%) | 13 (3.0%) |
| 5:30 AM to 5:59 AM | 0 (0.0%) | 31 (7.1%) |
| 6:00 AM to 6:29 AM | 65 (19.3%) | 31 (7.1%) |
| 6:30 AM to 6:59 AM | 31 (9.2%) | 0 (0.0%) |
| 7:00 AM to 7:29 AM | 11 (3.3%) | 18 (4.1%) |
| 7:30 AM to 7:59 AM | 77 (22.9%) | 89 (20.3%) |
| 8:00 AM to 8:29 AM | 131 (38.9%) | 135 (30.8%) |
| 8:30 AM to 8:59 AM | 0 (0.0%) | 0 (0.0%) |
| 9:00 AM to 9:59 AM | 3 (0.9%) | 16 (3.6%) |
| 10:00 AM to 10:59 AM | 0 (0.0%) | 0 (0.0%) |
| 11:00 AM to 11:59 AM | 0 (0.0%) | 0 (0.0%) |
| 12:00 PM to 3:59 PM | 19 (5.6%) | 29 (6.6%) |
| 4:00 PM to 11:59 PM | 0 (0.0%) | 17 (3.9%) |
| Total | 337 (100.0%) | 438 (100.0%) |
Housing Occupancy in Colorado City
Occupancy by Ownership in Colorado City
Of the total 500 dwellings in Colorado City, owner-occupied units account for 234 (46.8%), while renter-occupied units make up 266 (53.2%).
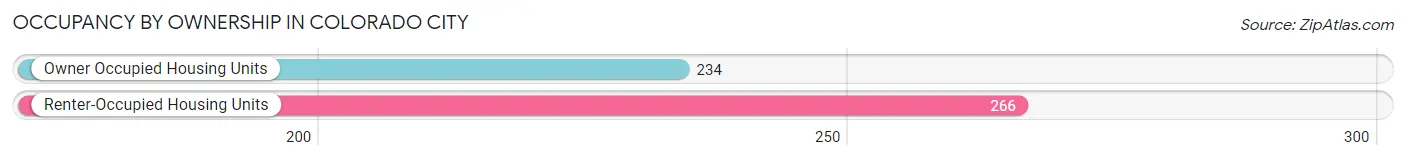
| Occupancy | # Housing Units | % Housing Units |
| Owner Occupied Housing Units | 234 | 46.8% |
| Renter-Occupied Housing Units | 266 | 53.2% |
| Total Occupied Housing Units | 500 | 100.0% |
Occupancy by Household Size in Colorado City
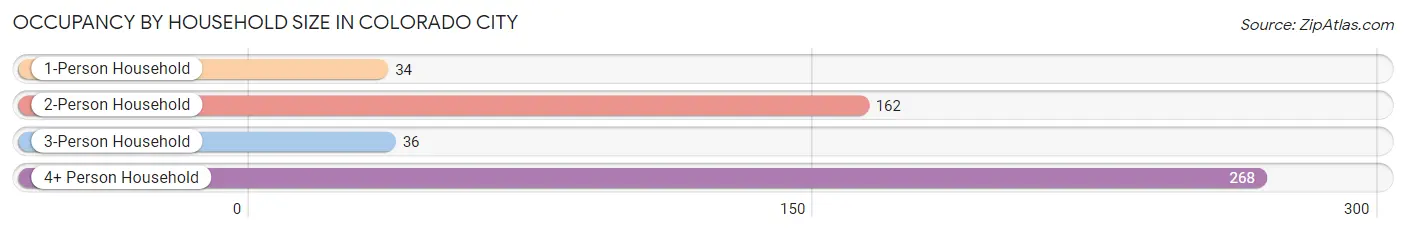
| Household Size | # Housing Units | % Housing Units |
| 1-Person Household | 34 | 6.8% |
| 2-Person Household | 162 | 32.4% |
| 3-Person Household | 36 | 7.2% |
| 4+ Person Household | 268 | 53.6% |
| Total Housing Units | 500 | 100.0% |
Occupancy by Ownership by Household Size in Colorado City
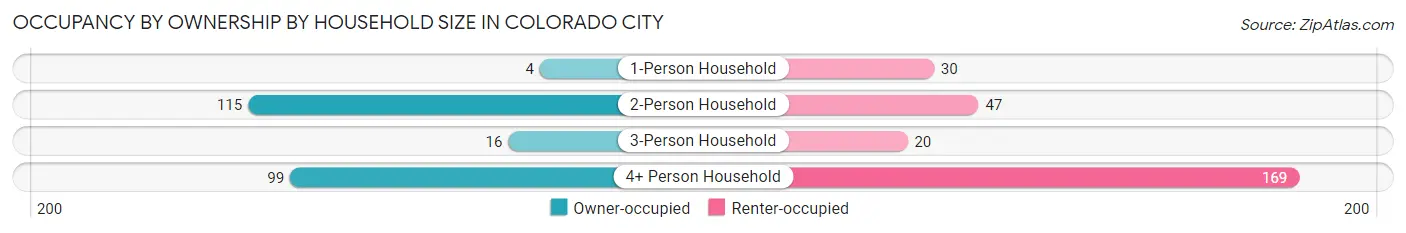
| Household Size | Owner-occupied | Renter-occupied |
| 1-Person Household | 4 (11.8%) | 30 (88.2%) |
| 2-Person Household | 115 (71.0%) | 47 (29.0%) |
| 3-Person Household | 16 (44.4%) | 20 (55.6%) |
| 4+ Person Household | 99 (36.9%) | 169 (63.1%) |
| Total Housing Units | 234 (46.8%) | 266 (53.2%) |
Occupancy by Educational Attainment in Colorado City
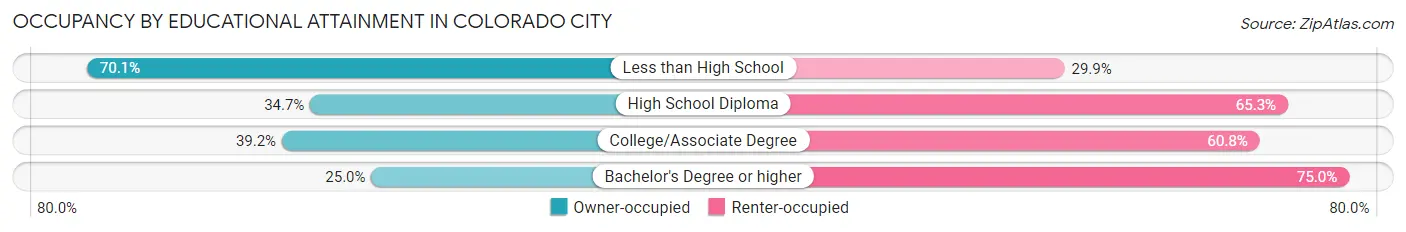
| Household Size | Owner-occupied | Renter-occupied |
| Less than High School | 115 (70.1%) | 49 (29.9%) |
| High School Diploma | 76 (34.7%) | 143 (65.3%) |
| College/Associate Degree | 38 (39.2%) | 59 (60.8%) |
| Bachelor's Degree or higher | 5 (25.0%) | 15 (75.0%) |
Occupancy by Age of Householder in Colorado City
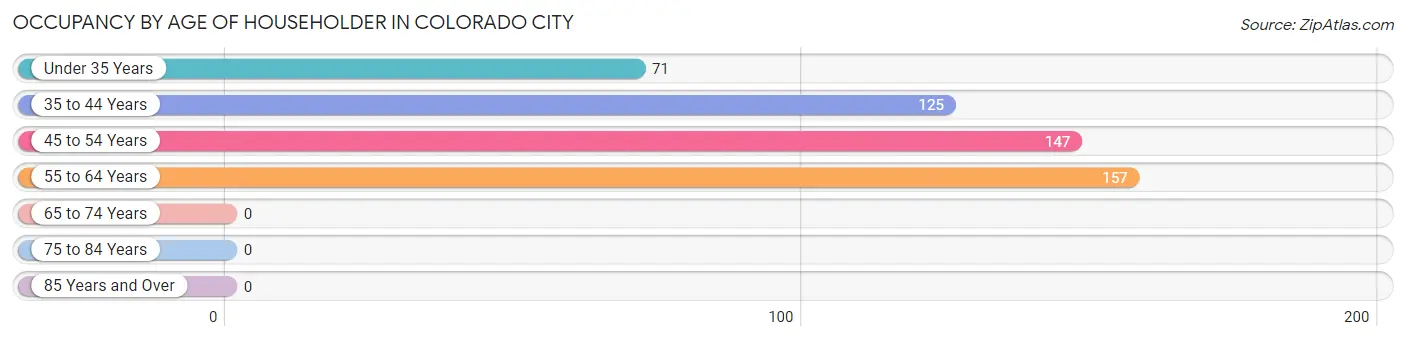
| Age Bracket | # Households | % Households |
| Under 35 Years | 71 | 14.2% |
| 35 to 44 Years | 125 | 25.0% |
| 45 to 54 Years | 147 | 29.4% |
| 55 to 64 Years | 157 | 31.4% |
| 65 to 74 Years | 0 | 0.0% |
| 75 to 84 Years | 0 | 0.0% |
| 85 Years and Over | 0 | 0.0% |
| Total | 500 | 100.0% |
Housing Finances in Colorado City
Median Income by Occupancy in Colorado City
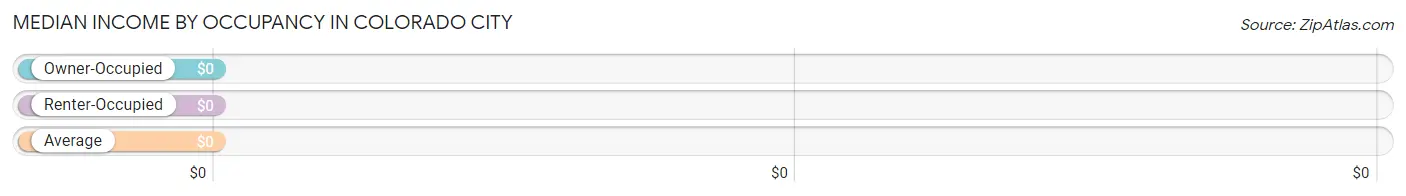
| Occupancy Type | # Households | Median Income |
| Owner-Occupied | 234 (46.8%) | $0 |
| Renter-Occupied | 266 (53.2%) | $0 |
| Average | 500 (100.0%) | $0 |
Occupancy by Householder Income Bracket in Colorado City
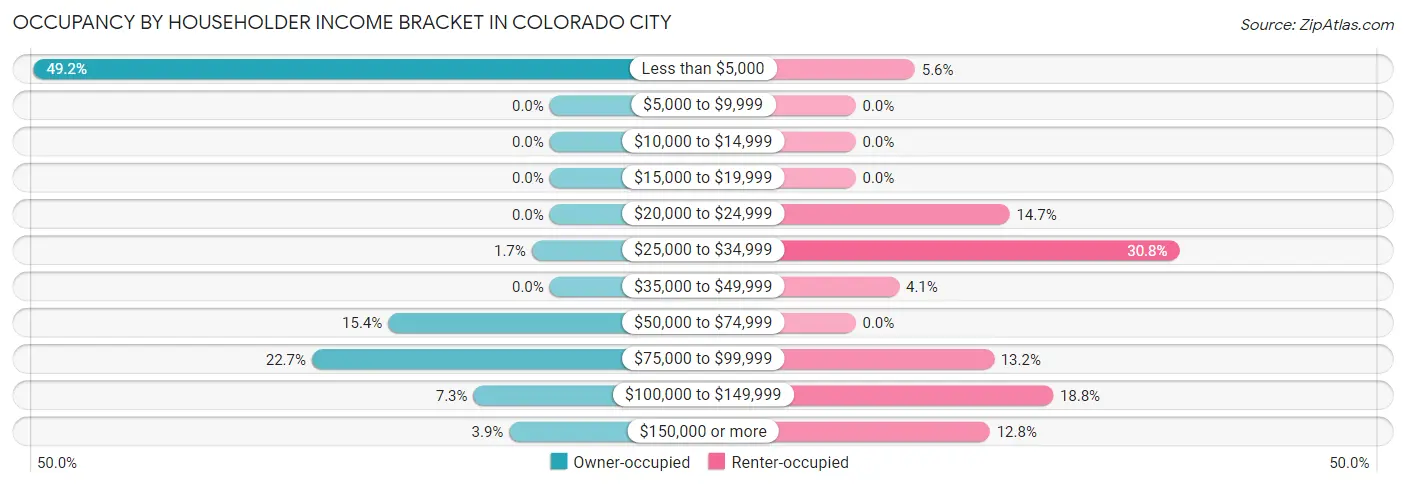
| Income Bracket | Owner-occupied | Renter-occupied |
| Less than $5,000 | 115 (49.1%) | 15 (5.6%) |
| $5,000 to $9,999 | 0 (0.0%) | 0 (0.0%) |
| $10,000 to $14,999 | 0 (0.0%) | 0 (0.0%) |
| $15,000 to $19,999 | 0 (0.0%) | 0 (0.0%) |
| $20,000 to $24,999 | 0 (0.0%) | 39 (14.7%) |
| $25,000 to $34,999 | 4 (1.7%) | 82 (30.8%) |
| $35,000 to $49,999 | 0 (0.0%) | 11 (4.1%) |
| $50,000 to $74,999 | 36 (15.4%) | 0 (0.0%) |
| $75,000 to $99,999 | 53 (22.7%) | 35 (13.2%) |
| $100,000 to $149,999 | 17 (7.3%) | 50 (18.8%) |
| $150,000 or more | 9 (3.8%) | 34 (12.8%) |
| Total | 234 (100.0%) | 266 (100.0%) |
Monthly Housing Cost Tiers in Colorado City
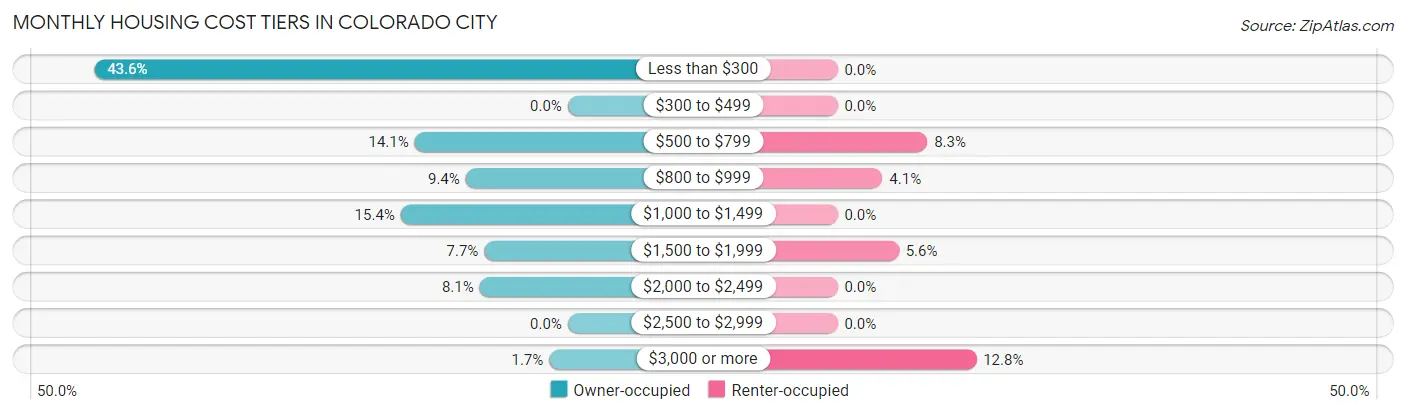
| Monthly Cost | Owner-occupied | Renter-occupied |
| Less than $300 | 102 (43.6%) | 0 (0.0%) |
| $300 to $499 | 0 (0.0%) | 0 (0.0%) |
| $500 to $799 | 33 (14.1%) | 22 (8.3%) |
| $800 to $999 | 22 (9.4%) | 11 (4.1%) |
| $1,000 to $1,499 | 36 (15.4%) | 0 (0.0%) |
| $1,500 to $1,999 | 18 (7.7%) | 15 (5.6%) |
| $2,000 to $2,499 | 19 (8.1%) | 0 (0.0%) |
| $2,500 to $2,999 | 0 (0.0%) | 0 (0.0%) |
| $3,000 or more | 4 (1.7%) | 34 (12.8%) |
| Total | 234 (100.0%) | 266 (100.0%) |
Physical Housing Characteristics in Colorado City
Housing Structures in Colorado City
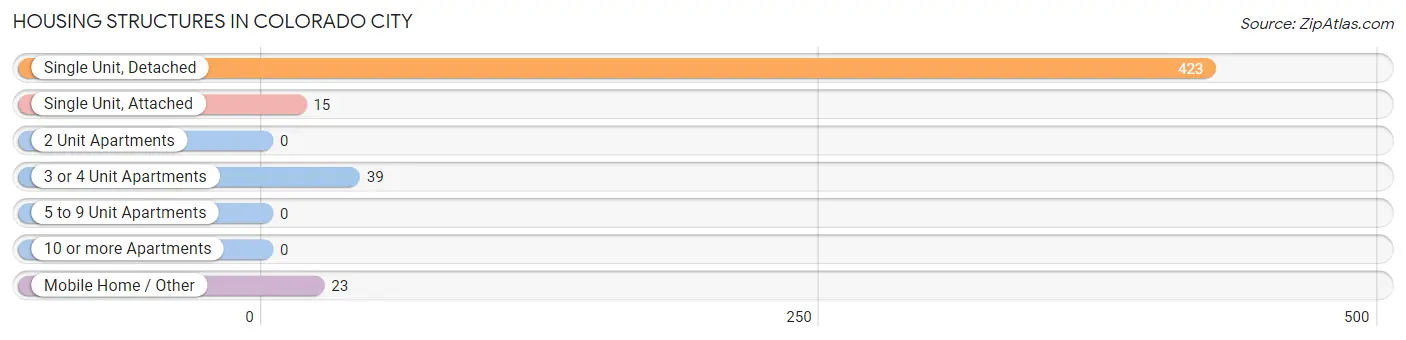
| Structure Type | # Housing Units | % Housing Units |
| Single Unit, Detached | 423 | 84.6% |
| Single Unit, Attached | 15 | 3.0% |
| 2 Unit Apartments | 0 | 0.0% |
| 3 or 4 Unit Apartments | 39 | 7.8% |
| 5 to 9 Unit Apartments | 0 | 0.0% |
| 10 or more Apartments | 0 | 0.0% |
| Mobile Home / Other | 23 | 4.6% |
| Total | 500 | 100.0% |
Housing Structures by Occupancy in Colorado City
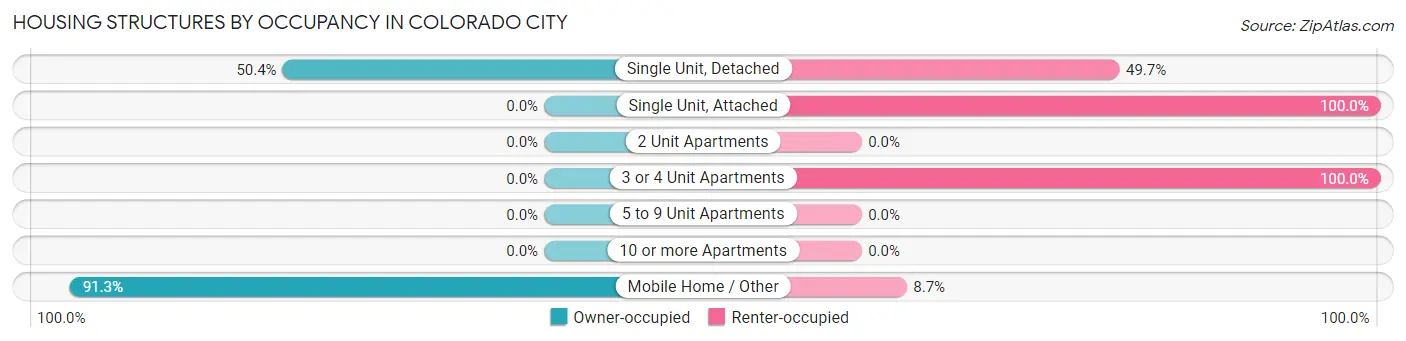
| Structure Type | Owner-occupied | Renter-occupied |
| Single Unit, Detached | 213 (50.3%) | 210 (49.6%) |
| Single Unit, Attached | 0 (0.0%) | 15 (100.0%) |
| 2 Unit Apartments | 0 (0.0%) | 0 (0.0%) |
| 3 or 4 Unit Apartments | 0 (0.0%) | 39 (100.0%) |
| 5 to 9 Unit Apartments | 0 (0.0%) | 0 (0.0%) |
| 10 or more Apartments | 0 (0.0%) | 0 (0.0%) |
| Mobile Home / Other | 21 (91.3%) | 2 (8.7%) |
| Total | 234 (46.8%) | 266 (53.2%) |
Housing Structures by Number of Rooms in Colorado City
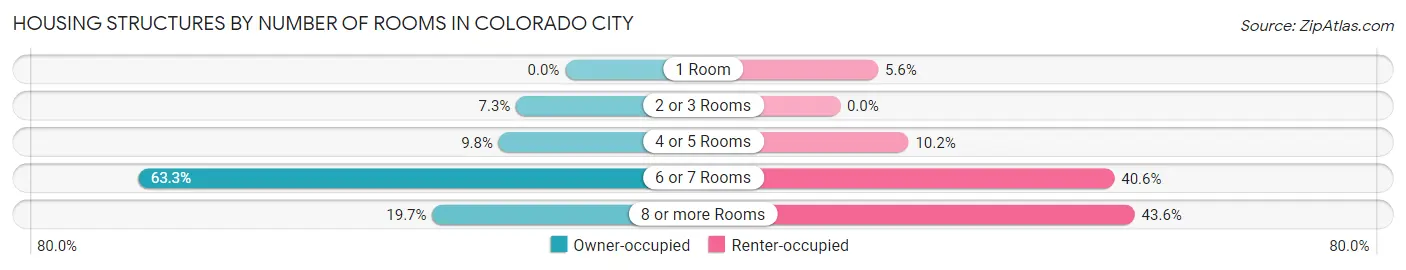
| Number of Rooms | Owner-occupied | Renter-occupied |
| 1 Room | 0 (0.0%) | 15 (5.6%) |
| 2 or 3 Rooms | 17 (7.3%) | 0 (0.0%) |
| 4 or 5 Rooms | 23 (9.8%) | 27 (10.2%) |
| 6 or 7 Rooms | 148 (63.2%) | 108 (40.6%) |
| 8 or more Rooms | 46 (19.7%) | 116 (43.6%) |
| Total | 234 (100.0%) | 266 (100.0%) |
Housing Structure by Heating Type in Colorado City
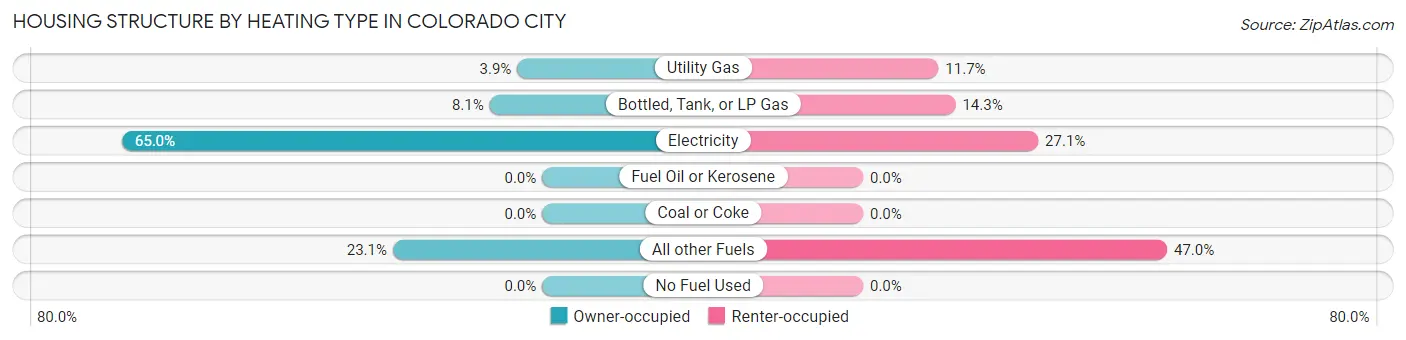
| Heating Type | Owner-occupied | Renter-occupied |
| Utility Gas | 9 (3.8%) | 31 (11.7%) |
| Bottled, Tank, or LP Gas | 19 (8.1%) | 38 (14.3%) |
| Electricity | 152 (65.0%) | 72 (27.1%) |
| Fuel Oil or Kerosene | 0 (0.0%) | 0 (0.0%) |
| Coal or Coke | 0 (0.0%) | 0 (0.0%) |
| All other Fuels | 54 (23.1%) | 125 (47.0%) |
| No Fuel Used | 0 (0.0%) | 0 (0.0%) |
| Total | 234 (100.0%) | 266 (100.0%) |
Household Vehicle Usage in Colorado City
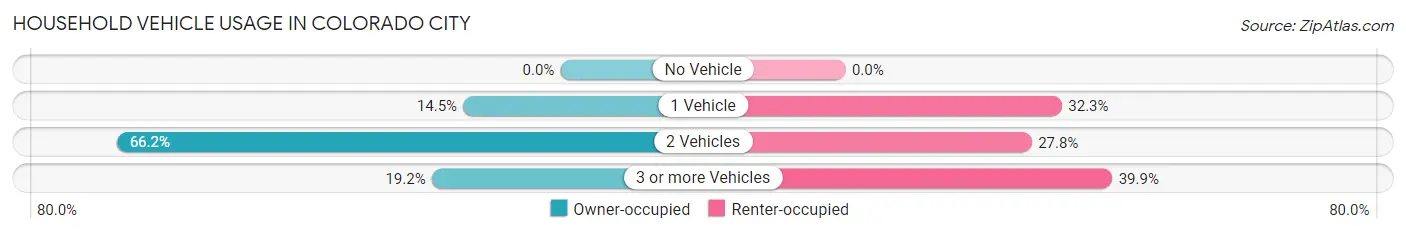
| Vehicles per Household | Owner-occupied | Renter-occupied |
| No Vehicle | 0 (0.0%) | 0 (0.0%) |
| 1 Vehicle | 34 (14.5%) | 86 (32.3%) |
| 2 Vehicles | 155 (66.2%) | 74 (27.8%) |
| 3 or more Vehicles | 45 (19.2%) | 106 (39.9%) |
| Total | 234 (100.0%) | 266 (100.0%) |
Real Estate & Mortgages in Colorado City
Real Estate and Mortgage Overview in Colorado City
| Characteristic | Without Mortgage | With Mortgage |
| Housing Units | 140 | 94 |
| Median Property Value | - | - |
| Median Household Income | $2,499 | $4 |
| Monthly Housing Costs | $284 | $4 |
| Real Estate Taxes | $515 | $0 |
Property Value by Mortgage Status in Colorado City
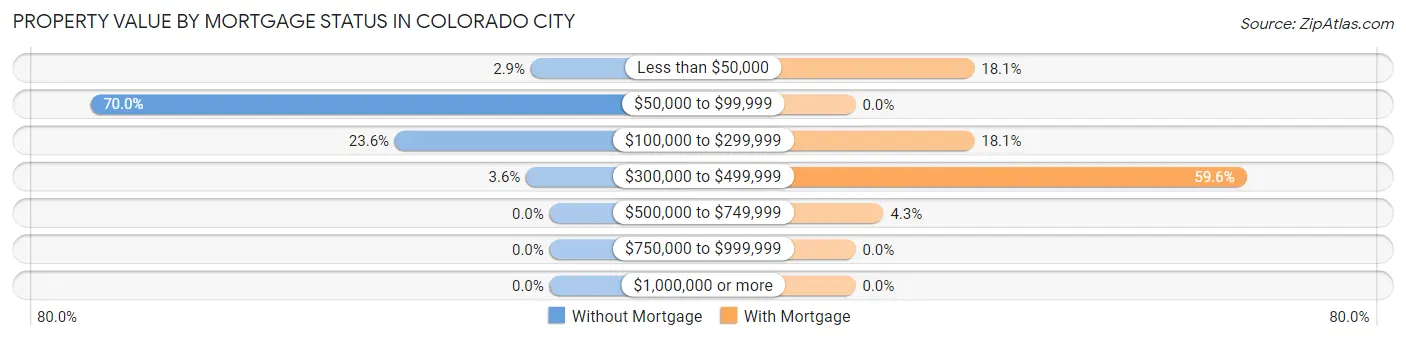
| Property Value | Without Mortgage | With Mortgage |
| Less than $50,000 | 4 (2.9%) | 17 (18.1%) |
| $50,000 to $99,999 | 98 (70.0%) | 0 (0.0%) |
| $100,000 to $299,999 | 33 (23.6%) | 17 (18.1%) |
| $300,000 to $499,999 | 5 (3.6%) | 56 (59.6%) |
| $500,000 to $749,999 | 0 (0.0%) | 4 (4.3%) |
| $750,000 to $999,999 | 0 (0.0%) | 0 (0.0%) |
| $1,000,000 or more | 0 (0.0%) | 0 (0.0%) |
| Total | 140 (100.0%) | 94 (100.0%) |
Household Income by Mortgage Status in Colorado City
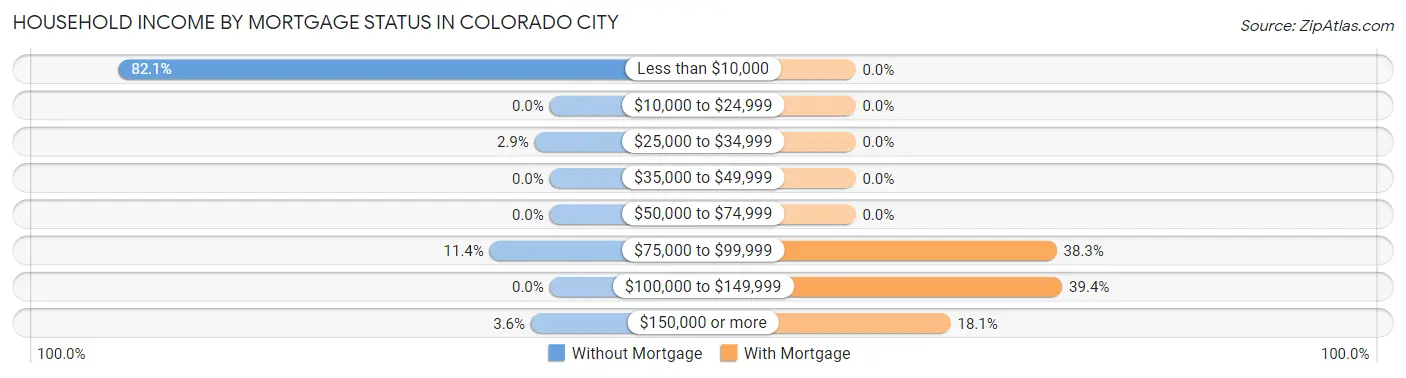
| Household Income | Without Mortgage | With Mortgage |
| Less than $10,000 | 115 (82.1%) | 0 (0.0%) |
| $10,000 to $24,999 | 0 (0.0%) | 0 (0.0%) |
| $25,000 to $34,999 | 4 (2.9%) | 0 (0.0%) |
| $35,000 to $49,999 | 0 (0.0%) | 0 (0.0%) |
| $50,000 to $74,999 | 0 (0.0%) | 0 (0.0%) |
| $75,000 to $99,999 | 16 (11.4%) | 36 (38.3%) |
| $100,000 to $149,999 | 0 (0.0%) | 37 (39.4%) |
| $150,000 or more | 5 (3.6%) | 17 (18.1%) |
| Total | 140 (100.0%) | 94 (100.0%) |
Property Value to Household Income Ratio in Colorado City
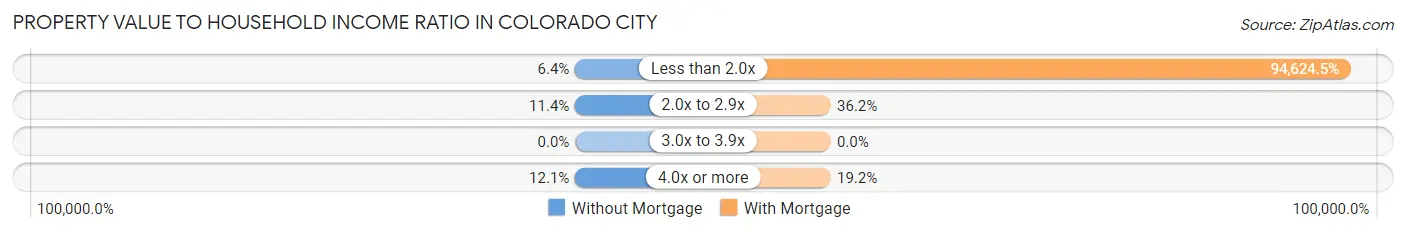
| Value-to-Income Ratio | Without Mortgage | With Mortgage |
| Less than 2.0x | 9 (6.4%) | 88,947 (94,624.5%) |
| 2.0x to 2.9x | 16 (11.4%) | 34 (36.2%) |
| 3.0x to 3.9x | 0 (0.0%) | 0 (0.0%) |
| 4.0x or more | 17 (12.1%) | 18 (19.2%) |
| Total | 140 (100.0%) | 94 (100.0%) |
Real Estate Taxes by Mortgage Status in Colorado City
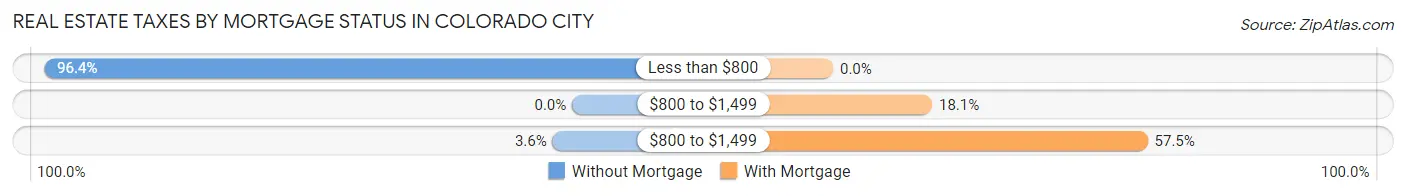
| Property Taxes | Without Mortgage | With Mortgage |
| Less than $800 | 135 (96.4%) | 0 (0.0%) |
| $800 to $1,499 | 0 (0.0%) | 17 (18.1%) |
| $800 to $1,499 | 5 (3.6%) | 54 (57.5%) |
| Total | 140 (100.0%) | 94 (100.0%) |
Health & Disability in Colorado City
Health Insurance Coverage by Age in Colorado City
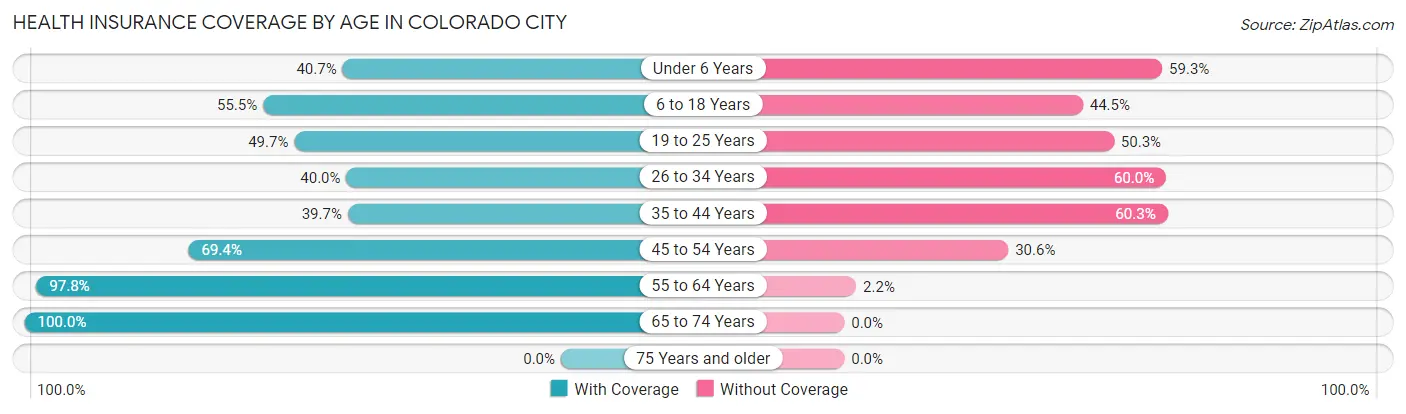
| Age Bracket | With Coverage | Without Coverage |
| Under 6 Years | 68 (40.7%) | 99 (59.3%) |
| 6 to 18 Years | 653 (55.5%) | 523 (44.5%) |
| 19 to 25 Years | 175 (49.7%) | 177 (50.3%) |
| 26 to 34 Years | 76 (40.0%) | 114 (60.0%) |
| 35 to 44 Years | 93 (39.7%) | 141 (60.3%) |
| 45 to 54 Years | 218 (69.4%) | 96 (30.6%) |
| 55 to 64 Years | 177 (97.8%) | 4 (2.2%) |
| 65 to 74 Years | 14 (100.0%) | 0 (0.0%) |
| 75 Years and older | 0 (0.0%) | 0 (0.0%) |
| Total | 1,474 (56.1%) | 1,154 (43.9%) |
Health Insurance Coverage by Citizenship Status in Colorado City
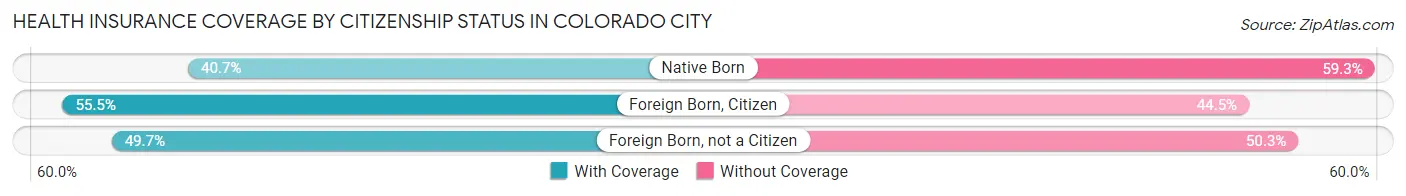
| Citizenship Status | With Coverage | Without Coverage |
| Native Born | 68 (40.7%) | 99 (59.3%) |
| Foreign Born, Citizen | 653 (55.5%) | 523 (44.5%) |
| Foreign Born, not a Citizen | 175 (49.7%) | 177 (50.3%) |
Health Insurance Coverage by Household Income in Colorado City
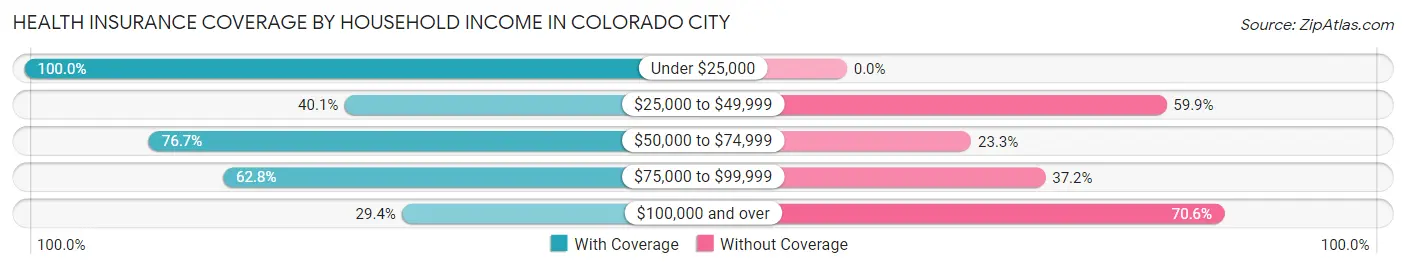
| Household Income | With Coverage | Without Coverage |
| Under $25,000 | 536 (100.0%) | 0 (0.0%) |
| $25,000 to $49,999 | 185 (40.1%) | 276 (59.9%) |
| $50,000 to $74,999 | 112 (76.7%) | 34 (23.3%) |
| $75,000 to $99,999 | 385 (62.8%) | 228 (37.2%) |
| $100,000 and over | 256 (29.4%) | 616 (70.6%) |
Public vs Private Health Insurance Coverage by Age in Colorado City
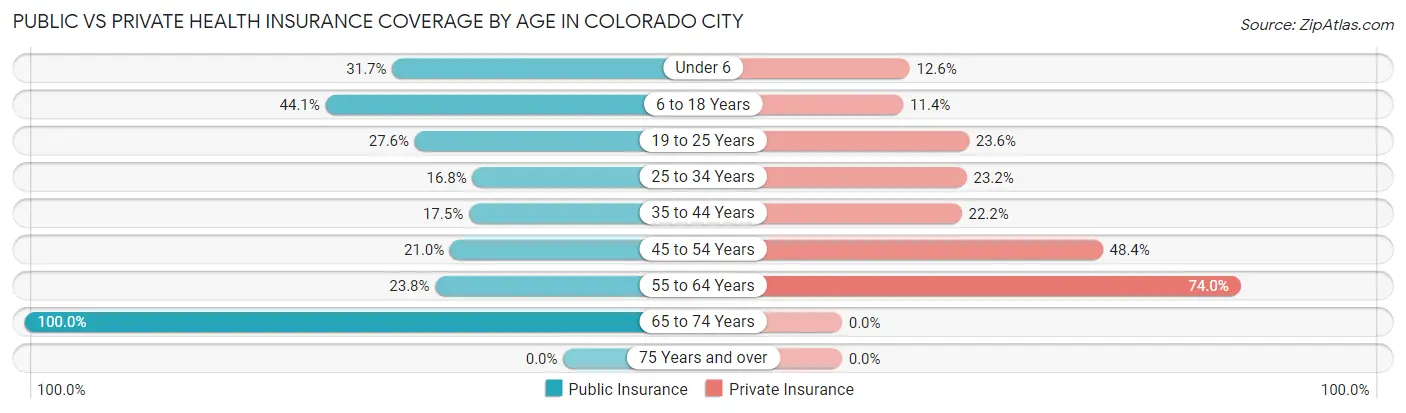
| Age Bracket | Public Insurance | Private Insurance |
| Under 6 | 53 (31.7%) | 21 (12.6%) |
| 6 to 18 Years | 519 (44.1%) | 134 (11.4%) |
| 19 to 25 Years | 97 (27.6%) | 83 (23.6%) |
| 25 to 34 Years | 32 (16.8%) | 44 (23.2%) |
| 35 to 44 Years | 41 (17.5%) | 52 (22.2%) |
| 45 to 54 Years | 66 (21.0%) | 152 (48.4%) |
| 55 to 64 Years | 43 (23.8%) | 134 (74.0%) |
| 65 to 74 Years | 14 (100.0%) | 0 (0.0%) |
| 75 Years and over | 0 (0.0%) | 0 (0.0%) |
| Total | 865 (32.9%) | 620 (23.6%) |
Disability Status by Sex by Age in Colorado City
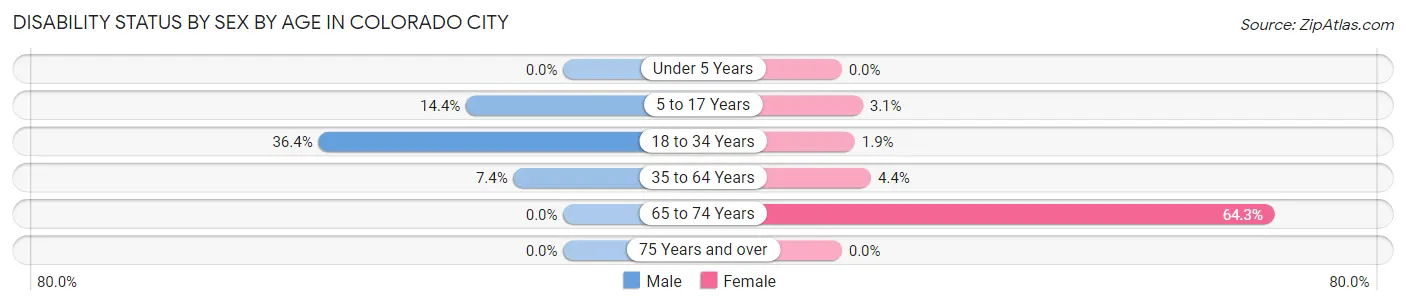
| Age Bracket | Male | Female |
| Under 5 Years | 0 (0.0%) | 0 (0.0%) |
| 5 to 17 Years | 86 (14.4%) | 17 (3.1%) |
| 18 to 34 Years | 92 (36.4%) | 7 (1.9%) |
| 35 to 64 Years | 25 (7.4%) | 17 (4.3%) |
| 65 to 74 Years | 0 (0.0%) | 9 (64.3%) |
| 75 Years and over | 0 (0.0%) | 0 (0.0%) |
Disability Class by Sex by Age in Colorado City
Disability Class: Hearing Difficulty
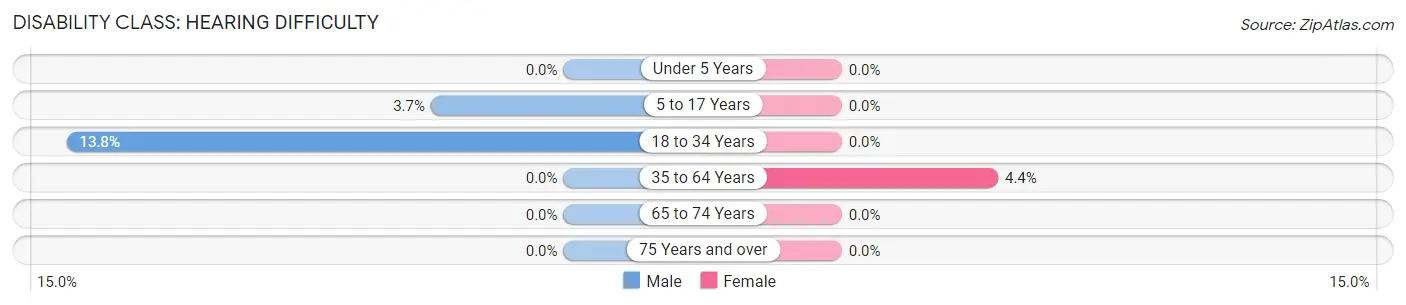
| Age Bracket | Male | Female |
| Under 5 Years | 0 (0.0%) | 0 (0.0%) |
| 5 to 17 Years | 22 (3.7%) | 0 (0.0%) |
| 18 to 34 Years | 35 (13.8%) | 0 (0.0%) |
| 35 to 64 Years | 0 (0.0%) | 17 (4.3%) |
| 65 to 74 Years | 0 (0.0%) | 0 (0.0%) |
| 75 Years and over | 0 (0.0%) | 0 (0.0%) |
Disability Class: Vision Difficulty
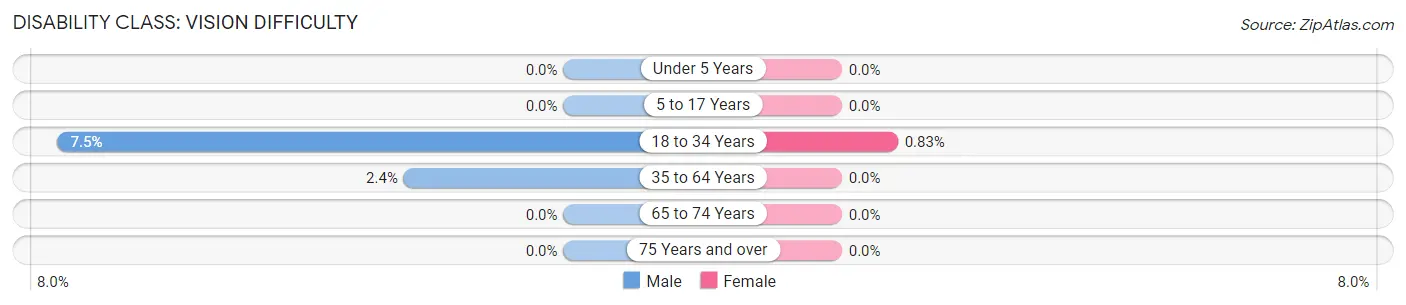
| Age Bracket | Male | Female |
| Under 5 Years | 0 (0.0%) | 0 (0.0%) |
| 5 to 17 Years | 0 (0.0%) | 0 (0.0%) |
| 18 to 34 Years | 19 (7.5%) | 3 (0.8%) |
| 35 to 64 Years | 8 (2.4%) | 0 (0.0%) |
| 65 to 74 Years | 0 (0.0%) | 0 (0.0%) |
| 75 Years and over | 0 (0.0%) | 0 (0.0%) |
Disability Class: Cognitive Difficulty
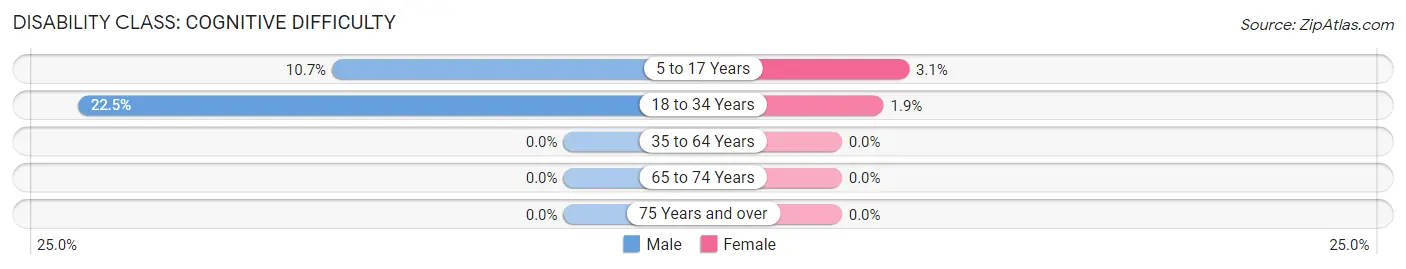
| Age Bracket | Male | Female |
| 5 to 17 Years | 64 (10.7%) | 17 (3.1%) |
| 18 to 34 Years | 57 (22.5%) | 7 (1.9%) |
| 35 to 64 Years | 0 (0.0%) | 0 (0.0%) |
| 65 to 74 Years | 0 (0.0%) | 0 (0.0%) |
| 75 Years and over | 0 (0.0%) | 0 (0.0%) |
Disability Class: Ambulatory Difficulty
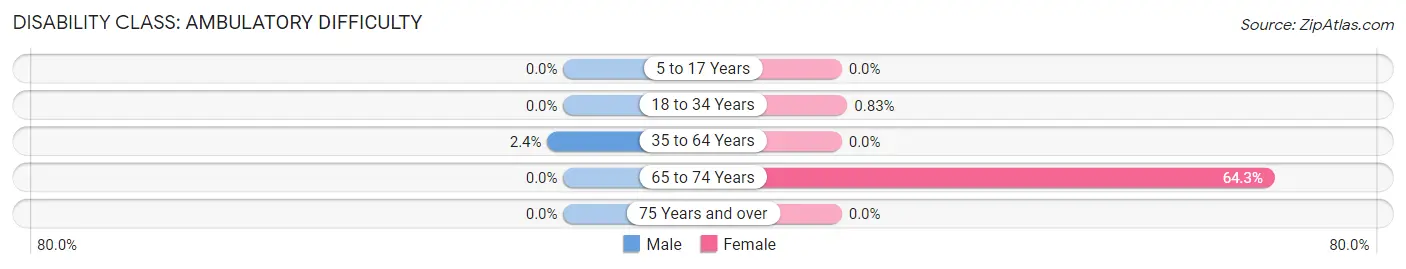
| Age Bracket | Male | Female |
| 5 to 17 Years | 0 (0.0%) | 0 (0.0%) |
| 18 to 34 Years | 0 (0.0%) | 3 (0.8%) |
| 35 to 64 Years | 8 (2.4%) | 0 (0.0%) |
| 65 to 74 Years | 0 (0.0%) | 9 (64.3%) |
| 75 Years and over | 0 (0.0%) | 0 (0.0%) |
Disability Class: Self-Care Difficulty
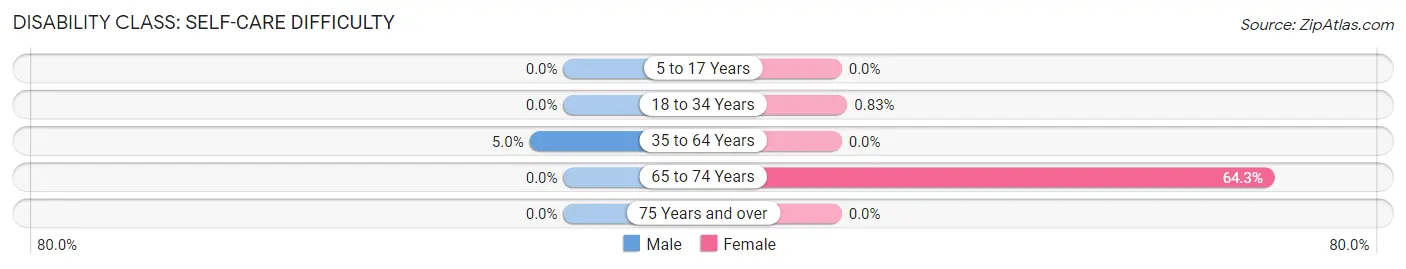
| Age Bracket | Male | Female |
| 5 to 17 Years | 0 (0.0%) | 0 (0.0%) |
| 18 to 34 Years | 0 (0.0%) | 3 (0.8%) |
| 35 to 64 Years | 17 (5.0%) | 0 (0.0%) |
| 65 to 74 Years | 0 (0.0%) | 9 (64.3%) |
| 75 Years and over | 0 (0.0%) | 0 (0.0%) |
Technology Access in Colorado City
Computing Device Access in Colorado City
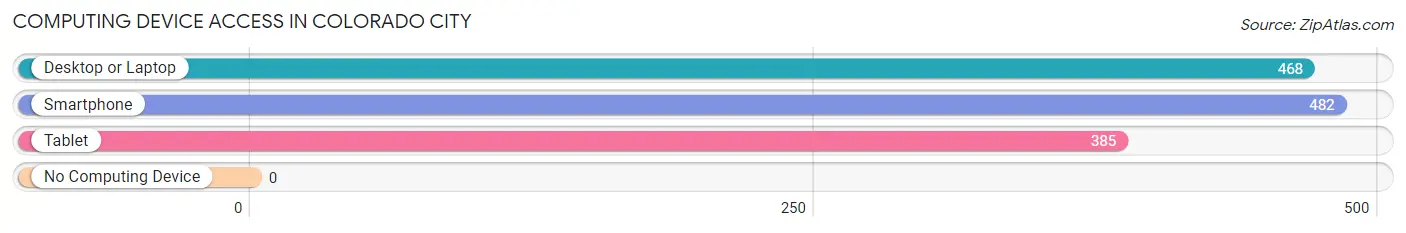
| Device Type | # Households | % Households |
| Desktop or Laptop | 468 | 93.6% |
| Smartphone | 482 | 96.4% |
| Tablet | 385 | 77.0% |
| No Computing Device | 0 | 0.0% |
| Total | 500 | 100.0% |
Internet Access in Colorado City
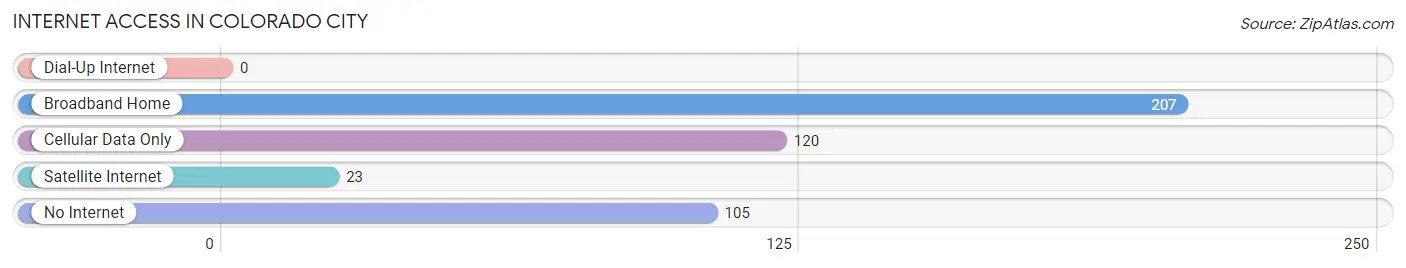
| Internet Type | # Households | % Households |
| Dial-Up Internet | 0 | 0.0% |
| Broadband Home | 207 | 41.4% |
| Cellular Data Only | 120 | 24.0% |
| Satellite Internet | 23 | 4.6% |
| No Internet | 105 | 21.0% |
| Total | 500 | 100.0% |
Colorado City Summary
City of Colorado City Arizona
History
The city of Colorado City, Arizona is located in Mohave County, Arizona, and is situated on the Arizona-Utah border. The city was founded in 1882 by members of the Church of Jesus Christ of Latter-day Saints (LDS) and was originally known as Short Creek. The city was established as a refuge for polygamists who were fleeing persecution in the United States. The city was officially incorporated in 1951 and was renamed Colorado City in 1960.
Geography
Colorado City is located in the northwest corner of Arizona, near the Utah border. The city is situated in the high desert region of the Colorado Plateau, at an elevation of 4,500 feet. The city is surrounded by the Grand Canyon, the Kaibab National Forest, and the Vermillion Cliffs. The city is located approximately 100 miles from Las Vegas, Nevada, and 200 miles from Phoenix, Arizona.
The climate in Colorado City is semi-arid, with hot summers and mild winters. The average annual temperature is 64°F, with an average high of 90°F in the summer and an average low of 37°F in the winter. The average annual precipitation is 8.5 inches, with most of the precipitation occurring in the summer months.
Economy
The economy of Colorado City is largely based on tourism and agriculture. The city is home to several tourist attractions, including the Grand Canyon, the Kaibab National Forest, and the Vermillion Cliffs. The city is also home to several farms and ranches, which produce a variety of crops, including alfalfa, hay, and wheat.
The city is also home to several businesses, including restaurants, retail stores, and service providers. The city is home to several hotels and motels, as well as a variety of recreational activities, such as camping, fishing, and hiking.
Demographics
As of the 2010 census, the population of Colorado City was 4,821. The population is predominantly white (90.2%), with a small percentage of Native American (2.2%), African American (1.2%), and Asian (0.7%) residents. The median household income is $37,917, and the median age is 33.
The city is home to a large population of members of the Church of Jesus Christ of Latter-day Saints (LDS). Approximately 70% of the population is LDS, and the city is home to several LDS churches. The city is also home to a small population of members of the Fundamentalist Church of Jesus Christ of Latter-day Saints (FLDS), a breakaway sect of the LDS church.
Conclusion
Colorado City, Arizona is a small city located in the northwest corner of Arizona, near the Utah border. The city was founded in 1882 by members of the Church of Jesus Christ of Latter-day Saints (LDS) and was originally known as Short Creek. The city is situated in the high desert region of the Colorado Plateau, at an elevation of 4,500 feet. The economy of Colorado City is largely based on tourism and agriculture, and the city is home to several tourist attractions, farms, and businesses. The population of Colorado City is predominantly white (90.2%), with a small percentage of Native American (2.2%), African American (1.2%), and Asian (0.7%) residents. The city is home to a large population of members of the Church of Jesus Christ of Latter-day Saints (LDS), and a small population of members of the Fundamentalist Church of Jesus Christ of Latter-day Saints (FLDS).
Common Questions
What is Per Capita Income in Colorado City?
Per Capita income in Colorado City is $11,117.
What is Income or Wage Gap in Colorado City?
Income or Wage Gap in Colorado City is 47.1%.
Women in Colorado City earn 52.9 cents for every dollar earned by a man.
What is Inequality or Gini Index in Colorado City?
Inequality or Gini Index in Colorado City is 0.52.
What is the Total Population of Colorado City?
Total Population of Colorado City is 2,628.
What is the Total Male Population of Colorado City?
Total Male Population of Colorado City is 1,253.
What is the Total Female Population of Colorado City?
Total Female Population of Colorado City is 1,375.
What is the Ratio of Males per 100 Females in Colorado City?
There are 91.13 Males per 100 Females in Colorado City.
What is the Ratio of Females per 100 Males in Colorado City?
There are 109.74 Females per 100 Males in Colorado City.
What is the Median Population Age in Colorado City?
Median Population Age in Colorado City is 18.6 Years.
What is the Average Family Size in Colorado City
Average Family Size in Colorado City is 5.5 People.
What is the Average Household Size in Colorado City
Average Household Size in Colorado City is 5.3 People.
How Large is the Labor Force in Colorado City?
There are 891 People in the Labor Forcein in Colorado City.
What is the Percentage of People in the Labor Force in Colorado City?
56.4% of People are in the Labor Force in Colorado City.
What is the Unemployment Rate in Colorado City?
Unemployment Rate in Colorado City is 8.1%.