Clifton, AZ Map & Demographics
Clifton Map
Clifton Overview
$26,367
PER CAPITA INCOME
$85,331
AVG FAMILY INCOME
$78,862
AVG HOUSEHOLD INCOME
52.8%
WAGE / INCOME GAP [ % ]
47.2¢/ $1
WAGE / INCOME GAP [ $ ]
0.35
INEQUALITY / GINI INDEX
3,869
TOTAL POPULATION
2,000
MALE POPULATION
1,869
FEMALE POPULATION
107.01
MALES / 100 FEMALES
93.45
FEMALES / 100 MALES
25.9
MEDIAN AGE
4.1
AVG FAMILY SIZE
3.4
AVG HOUSEHOLD SIZE
1,820
LABOR FORCE [ PEOPLE ]
68.2%
PERCENT IN LABOR FORCE
1.2%
UNEMPLOYMENT RATE
Clifton Zip Codes
Clifton Area Codes
Income in Clifton
Income Overview in Clifton
Per Capita Income in Clifton is $26,367, while median incomes of families and households are $85,331 and $78,862 respectively.
| Characteristic | Number | Measure |
| Per Capita Income | 3,869 | $26,367 |
| Median Family Income | 847 | $85,331 |
| Mean Family Income | 847 | $104,689 |
| Median Household Income | 1,113 | $78,862 |
| Mean Household Income | 1,113 | $91,683 |
| Income Deficit | 847 | $0 |
| Wage / Income Gap (%) | 3,869 | 52.77% |
| Wage / Income Gap ($) | 3,869 | 47.23¢ per $1 |
| Gini / Inequality Index | 3,869 | 0.35 |
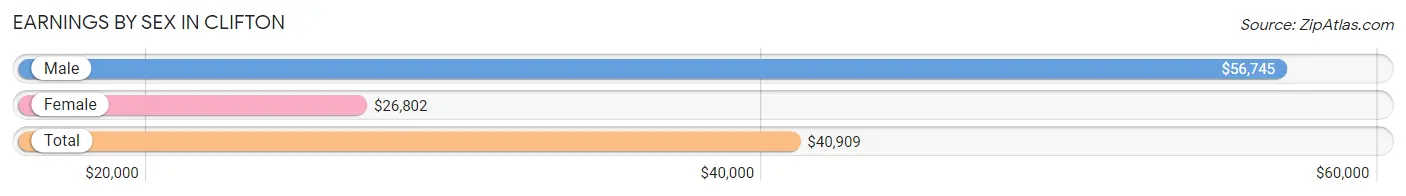
Earnings by Sex in Clifton
Average Earnings in Clifton are $40,909, $56,745 for men and $26,802 for women, a difference of 52.8%.
| Sex | Number | Average Earnings |
| Male | 1,037 (55.4%) | $56,745 |
| Female | 833 (44.6%) | $26,802 |
| Total | 1,870 (100.0%) | $40,909 |
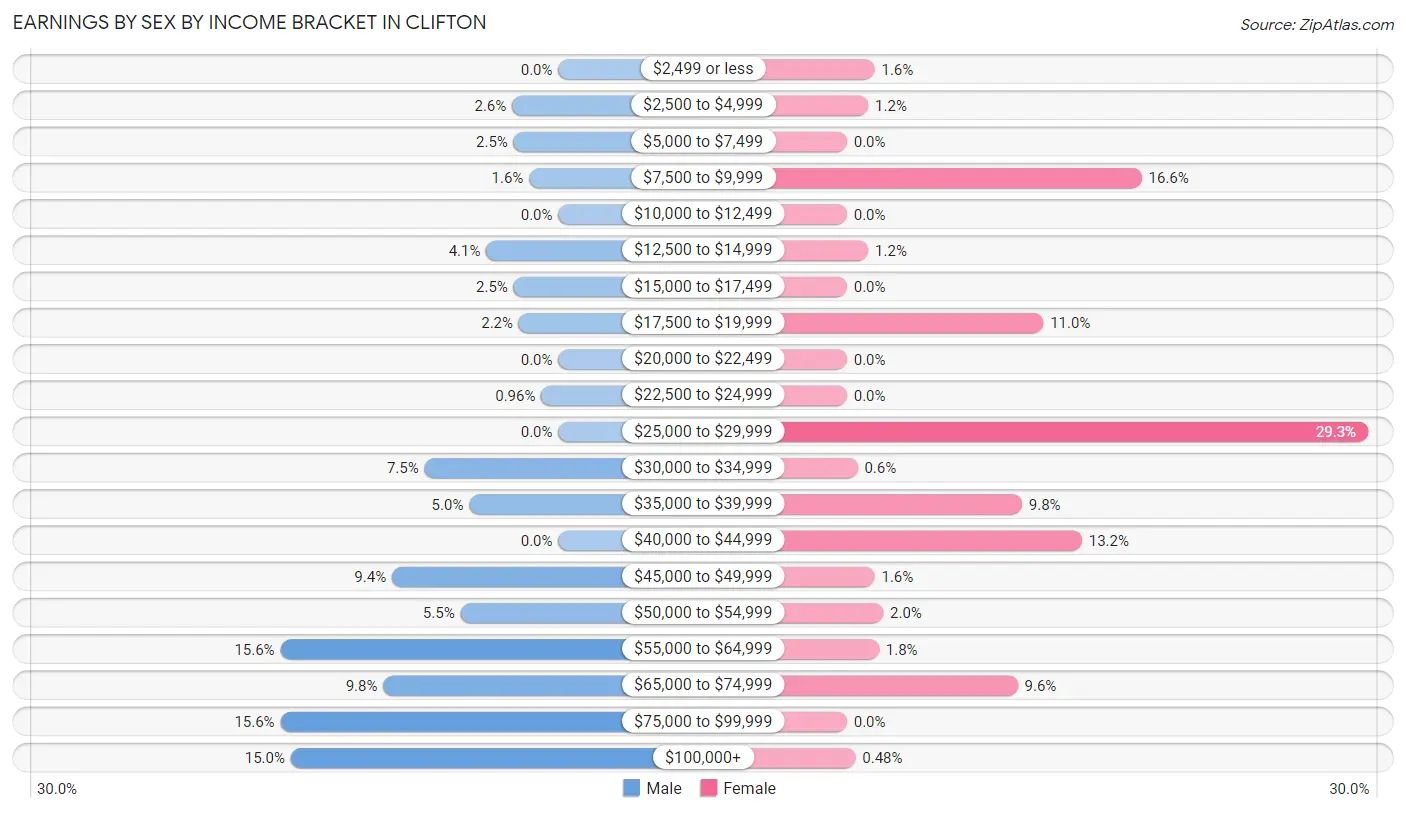
Earnings by Sex by Income Bracket in Clifton
The most common earnings brackets in Clifton are $55,000 to $64,999 for men (162 | 15.6%) and $25,000 to $29,999 for women (244 | 29.3%).
| Income | Male | Female |
| $2,499 or less | 0 (0.0%) | 13 (1.6%) |
| $2,500 to $4,999 | 27 (2.6%) | 10 (1.2%) |
| $5,000 to $7,499 | 26 (2.5%) | 0 (0.0%) |
| $7,500 to $9,999 | 17 (1.6%) | 138 (16.6%) |
| $10,000 to $12,499 | 0 (0.0%) | 0 (0.0%) |
| $12,500 to $14,999 | 42 (4.1%) | 10 (1.2%) |
| $15,000 to $17,499 | 26 (2.5%) | 0 (0.0%) |
| $17,500 to $19,999 | 23 (2.2%) | 92 (11.0%) |
| $20,000 to $22,499 | 0 (0.0%) | 0 (0.0%) |
| $22,500 to $24,999 | 10 (1.0%) | 0 (0.0%) |
| $25,000 to $29,999 | 0 (0.0%) | 244 (29.3%) |
| $30,000 to $34,999 | 78 (7.5%) | 5 (0.6%) |
| $35,000 to $39,999 | 52 (5.0%) | 82 (9.8%) |
| $40,000 to $44,999 | 0 (0.0%) | 110 (13.2%) |
| $45,000 to $49,999 | 97 (9.3%) | 13 (1.6%) |
| $50,000 to $54,999 | 57 (5.5%) | 17 (2.0%) |
| $55,000 to $64,999 | 162 (15.6%) | 15 (1.8%) |
| $65,000 to $74,999 | 102 (9.8%) | 80 (9.6%) |
| $75,000 to $99,999 | 162 (15.6%) | 0 (0.0%) |
| $100,000+ | 156 (15.0%) | 4 (0.5%) |
| Total | 1,037 (100.0%) | 833 (100.0%) |
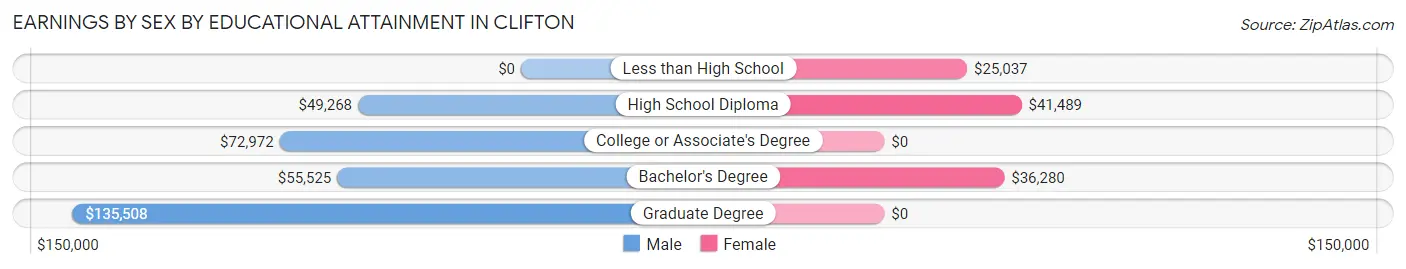
Earnings by Sex by Educational Attainment in Clifton
Average earnings in Clifton are $61,806 for men and $35,320 for women, a difference of 42.8%. Men with an educational attainment of graduate degree enjoy the highest average annual earnings of $135,508, while those with high school diploma education earn the least with $49,268. Women with an educational attainment of high school diploma earn the most with the average annual earnings of $41,489, while those with less than high school education have the smallest earnings of $25,037.
| Educational Attainment | Male Income | Female Income |
| Less than High School | - | - |
| High School Diploma | $49,268 | $41,489 |
| College or Associate's Degree | $72,972 | $0 |
| Bachelor's Degree | $55,525 | $36,280 |
| Graduate Degree | $135,508 | $0 |
| Total | $61,806 | $35,320 |
Family Income in Clifton
Family Income Brackets in Clifton
According to the Clifton family income data, there are 235 families falling into the $50,000 to $74,999 income range, which is the most common income bracket and makes up 27.7% of all families.
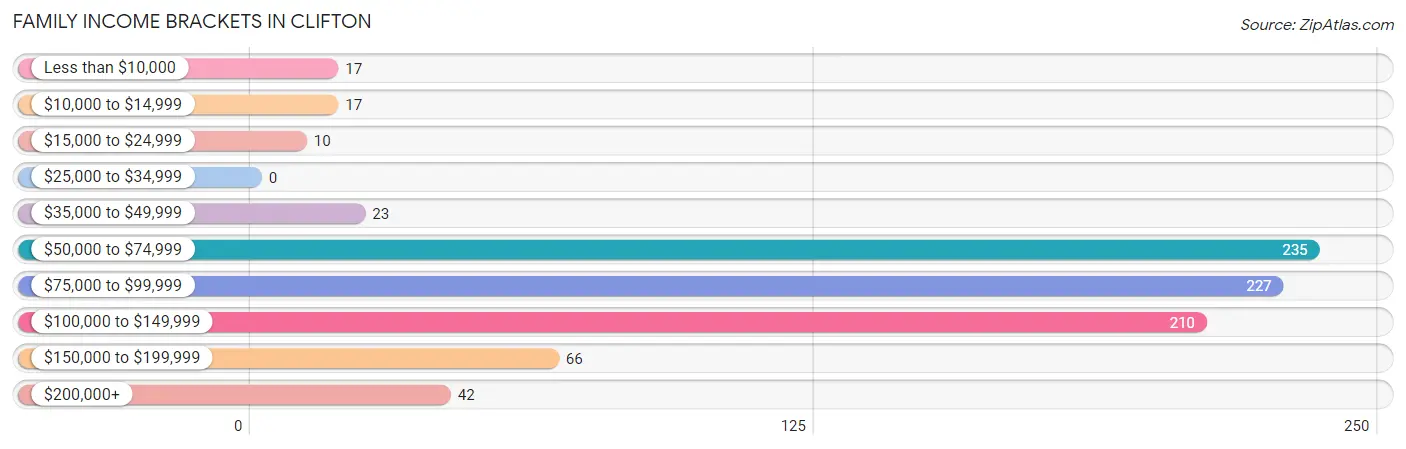
| Income Bracket | # Families | % Families |
| Less than $10,000 | 17 | 2.0% |
| $10,000 to $14,999 | 17 | 2.0% |
| $15,000 to $24,999 | 10 | 1.2% |
| $25,000 to $34,999 | 0 | 0.0% |
| $35,000 to $49,999 | 23 | 2.7% |
| $50,000 to $74,999 | 235 | 27.7% |
| $75,000 to $99,999 | 227 | 26.8% |
| $100,000 to $149,999 | 210 | 24.8% |
| $150,000 to $199,999 | 66 | 7.8% |
| $200,000+ | 42 | 5.0% |
Family Income by Famaliy Size in Clifton
5-person families (98 | 11.6%) account for the highest median family income in Clifton with $136,129 per family, while 2-person families (181 | 21.4%) have the highest median income of $36,936 per family member.
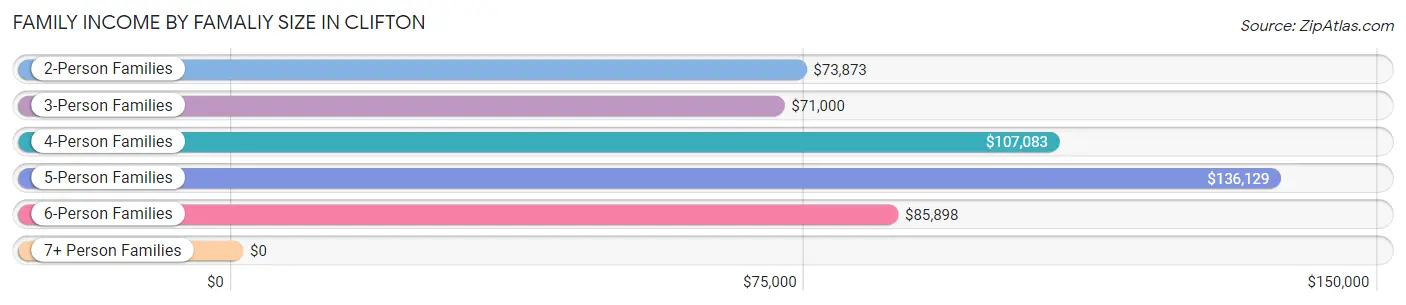
| Income Bracket | # Families | Median Income |
| 2-Person Families | 181 (21.4%) | $73,873 |
| 3-Person Families | 170 (20.1%) | $71,000 |
| 4-Person Families | 220 (26.0%) | $107,083 |
| 5-Person Families | 98 (11.6%) | $136,129 |
| 6-Person Families | 157 (18.5%) | $85,898 |
| 7+ Person Families | 21 (2.5%) | $0 |
| Total | 847 (100.0%) | $85,331 |
Family Income by Number of Earners in Clifton
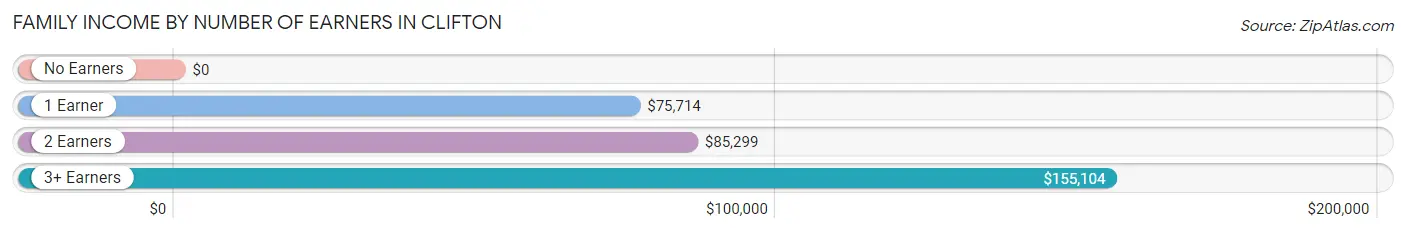
| Number of Earners | # Families | Median Income |
| No Earners | 30 (3.5%) | $0 |
| 1 Earner | 340 (40.1%) | $75,714 |
| 2 Earners | 356 (42.0%) | $85,299 |
| 3+ Earners | 121 (14.3%) | $155,104 |
| Total | 847 (100.0%) | $85,331 |
Household Income in Clifton
Household Income Brackets in Clifton
With 258 households falling in the category, the $75,000 to $99,999 income range is the most frequent in Clifton, accounting for 23.2% of all households.
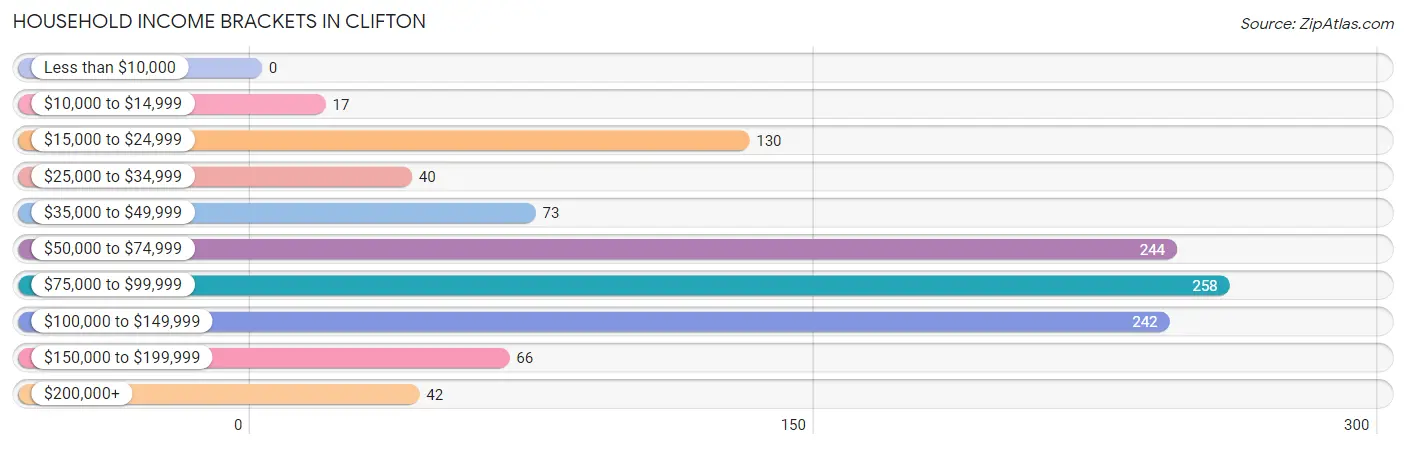
| Income Bracket | # Households | % Households |
| Less than $10,000 | 0 | 0.0% |
| $10,000 to $14,999 | 17 | 1.5% |
| $15,000 to $24,999 | 130 | 11.7% |
| $25,000 to $34,999 | 40 | 3.6% |
| $35,000 to $49,999 | 73 | 6.6% |
| $50,000 to $74,999 | 244 | 21.9% |
| $75,000 to $99,999 | 258 | 23.2% |
| $100,000 to $149,999 | 242 | 21.7% |
| $150,000 to $199,999 | 66 | 5.9% |
| $200,000+ | 42 | 3.8% |
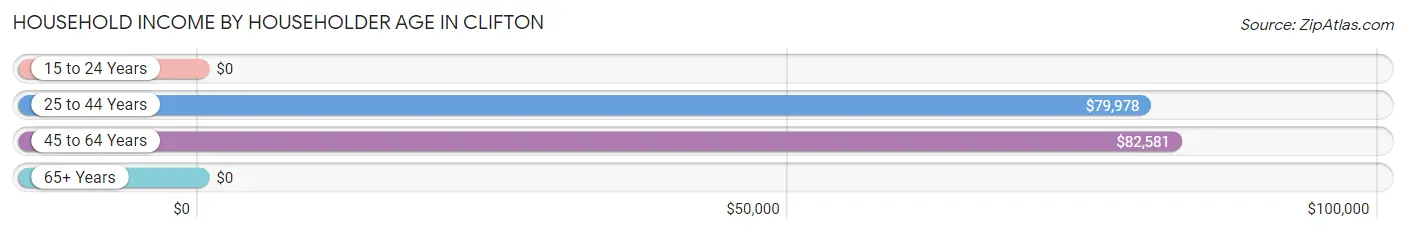
Household Income by Householder Age in Clifton
The median household income in Clifton is $78,862, with the highest median household income of $82,581 found in the 45 to 64 years age bracket for the primary householder. A total of 306 households (27.5%) fall into this category.
| Income Bracket | # Households | Median Income |
| 15 to 24 Years | 0 (0.0%) | $0 |
| 25 to 44 Years | 665 (59.8%) | $79,978 |
| 45 to 64 Years | 306 (27.5%) | $82,581 |
| 65+ Years | 142 (12.8%) | $0 |
| Total | 1,113 (100.0%) | $78,862 |
Poverty in Clifton
Income Below Poverty by Sex and Age in Clifton
With 8.0% poverty level for males and 8.5% for females among the residents of Clifton, 25 to 34 year old males and 6 to 11 year old females are the most vulnerable to poverty, with 59 males (29.9%) and 49 females (24.5%) in their respective age groups living below the poverty level.
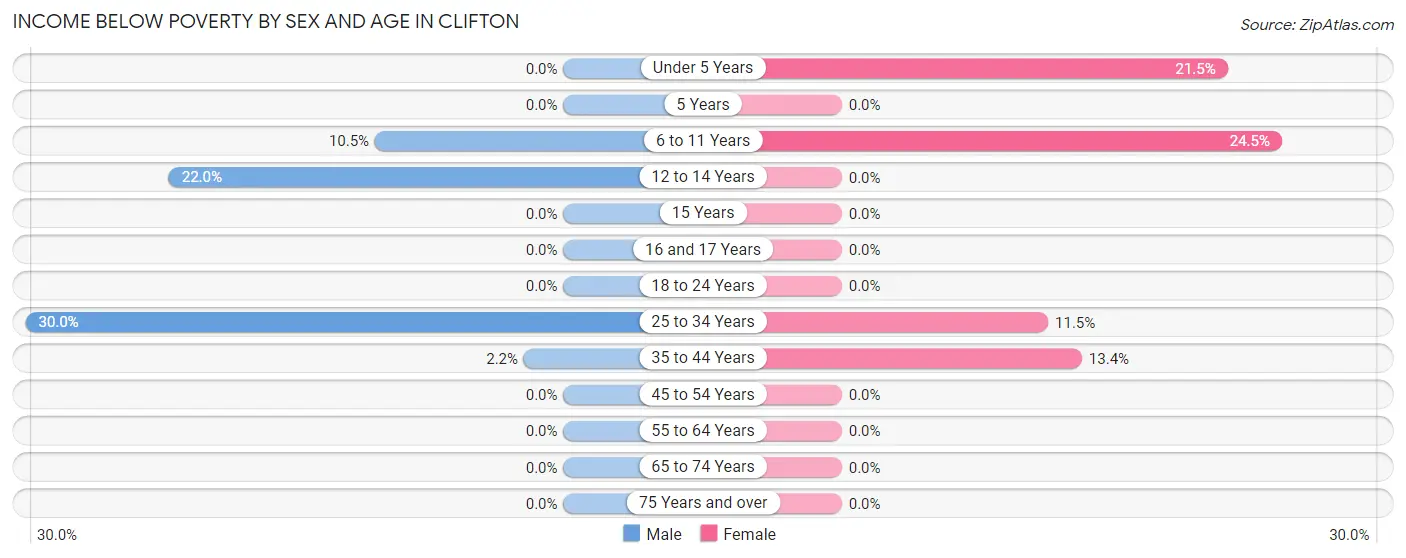
| Age Bracket | Male | Female |
| Under 5 Years | 0 (0.0%) | 29 (21.5%) |
| 5 Years | 0 (0.0%) | 0 (0.0%) |
| 6 to 11 Years | 30 (10.5%) | 49 (24.5%) |
| 12 to 14 Years | 58 (22.0%) | 0 (0.0%) |
| 15 Years | 0 (0.0%) | 0 (0.0%) |
| 16 and 17 Years | 0 (0.0%) | 0 (0.0%) |
| 18 to 24 Years | 0 (0.0%) | 0 (0.0%) |
| 25 to 34 Years | 59 (29.9%) | 27 (11.5%) |
| 35 to 44 Years | 10 (2.2%) | 54 (13.4%) |
| 45 to 54 Years | 0 (0.0%) | 0 (0.0%) |
| 55 to 64 Years | 0 (0.0%) | 0 (0.0%) |
| 65 to 74 Years | 0 (0.0%) | 0 (0.0%) |
| 75 Years and over | 0 (0.0%) | 0 (0.0%) |
| Total | 157 (8.0%) | 159 (8.5%) |
Income Above Poverty by Sex and Age in Clifton
According to the poverty statistics in Clifton, males aged under 5 years and females aged 12 to 14 years are the age groups that are most secure financially, with 100.0% of males and 100.0% of females in these age groups living above the poverty line.
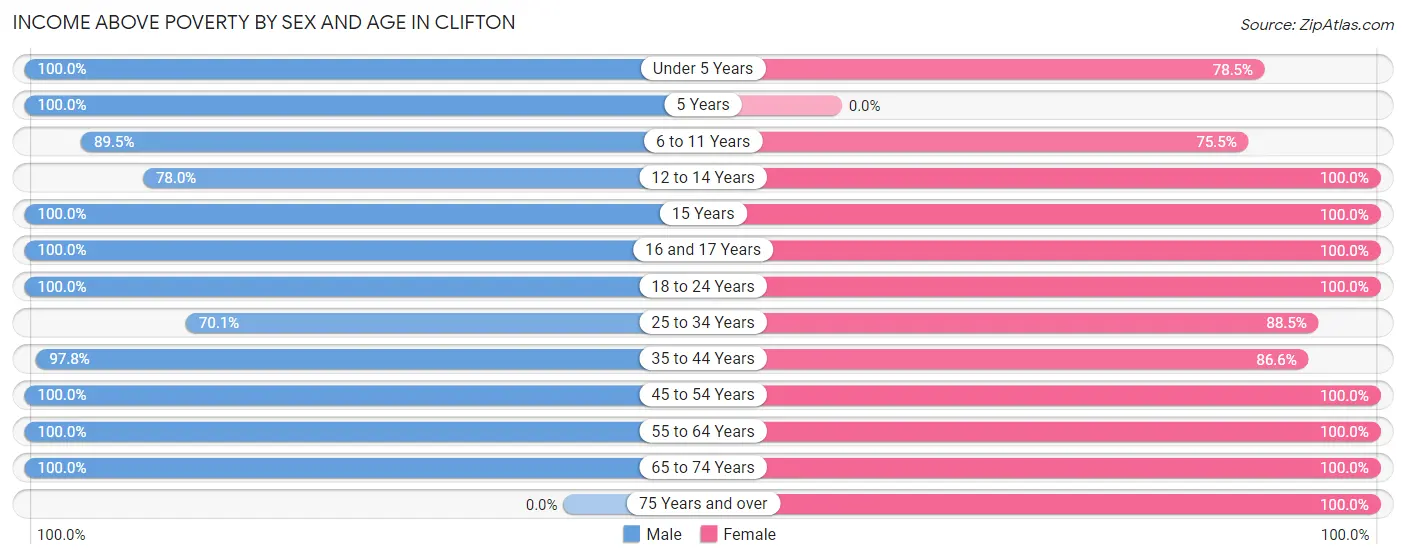
| Age Bracket | Male | Female |
| Under 5 Years | 83 (100.0%) | 106 (78.5%) |
| 5 Years | 50 (100.0%) | 0 (0.0%) |
| 6 to 11 Years | 256 (89.5%) | 151 (75.5%) |
| 12 to 14 Years | 206 (78.0%) | 155 (100.0%) |
| 15 Years | 19 (100.0%) | 9 (100.0%) |
| 16 and 17 Years | 103 (100.0%) | 64 (100.0%) |
| 18 to 24 Years | 228 (100.0%) | 247 (100.0%) |
| 25 to 34 Years | 138 (70.1%) | 208 (88.5%) |
| 35 to 44 Years | 445 (97.8%) | 350 (86.6%) |
| 45 to 54 Years | 76 (100.0%) | 99 (100.0%) |
| 55 to 64 Years | 136 (100.0%) | 125 (100.0%) |
| 65 to 74 Years | 70 (100.0%) | 76 (100.0%) |
| 75 Years and over | 0 (0.0%) | 116 (100.0%) |
| Total | 1,810 (92.0%) | 1,706 (91.5%) |
Income Below Poverty Among Married-Couple Families in Clifton
The poverty statistics for married-couple families in Clifton show that 4.5% or 27 of the total 596 families live below the poverty line. Families with 3 or 4 children have the highest poverty rate of 24.4%, comprising of 10 families. On the other hand, families with no children have the lowest poverty rate of 0.0%, which includes 0 families.
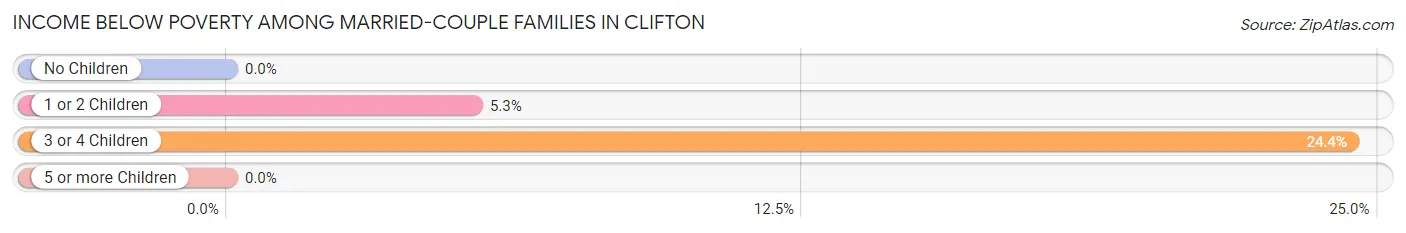
| Children | Above Poverty | Below Poverty |
| No Children | 215 (100.0%) | 0 (0.0%) |
| 1 or 2 Children | 302 (94.7%) | 17 (5.3%) |
| 3 or 4 Children | 31 (75.6%) | 10 (24.4%) |
| 5 or more Children | 21 (100.0%) | 0 (0.0%) |
| Total | 569 (95.5%) | 27 (4.5%) |
Income Below Poverty Among Single-Parent Households in Clifton
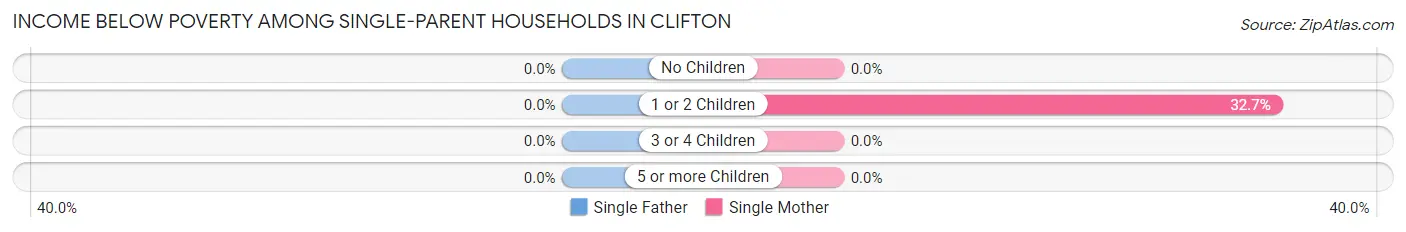
| Children | Single Father | Single Mother |
| No Children | 0 (0.0%) | 0 (0.0%) |
| 1 or 2 Children | 0 (0.0%) | 17 (32.7%) |
| 3 or 4 Children | 0 (0.0%) | 0 (0.0%) |
| 5 or more Children | 0 (0.0%) | 0 (0.0%) |
| Total | 0 (0.0%) | 17 (10.5%) |
Income Below Poverty Among Married-Couple vs Single-Parent Households in Clifton
The poverty data for Clifton shows that 27 of the married-couple family households (4.5%) and 17 of the single-parent households (6.8%) are living below the poverty level. Within the married-couple family households, those with 3 or 4 children have the highest poverty rate, with 10 households (24.4%) falling below the poverty line. Among the single-parent households, those with 1 or 2 children have the highest poverty rate, with 17 household (29.3%) living below poverty.
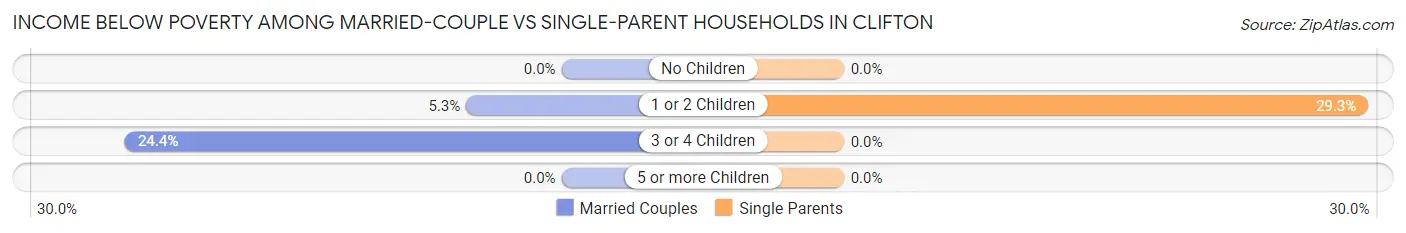
| Children | Married-Couple Families | Single-Parent Households |
| No Children | 0 (0.0%) | 0 (0.0%) |
| 1 or 2 Children | 17 (5.3%) | 17 (29.3%) |
| 3 or 4 Children | 10 (24.4%) | 0 (0.0%) |
| 5 or more Children | 0 (0.0%) | 0 (0.0%) |
| Total | 27 (4.5%) | 17 (6.8%) |
Race in Clifton
The most populous races in Clifton are White / Caucasian (2,830 | 73.2%), Hispanic or Latino (2,280 | 58.9%), and Two or more Races (734 | 19.0%).
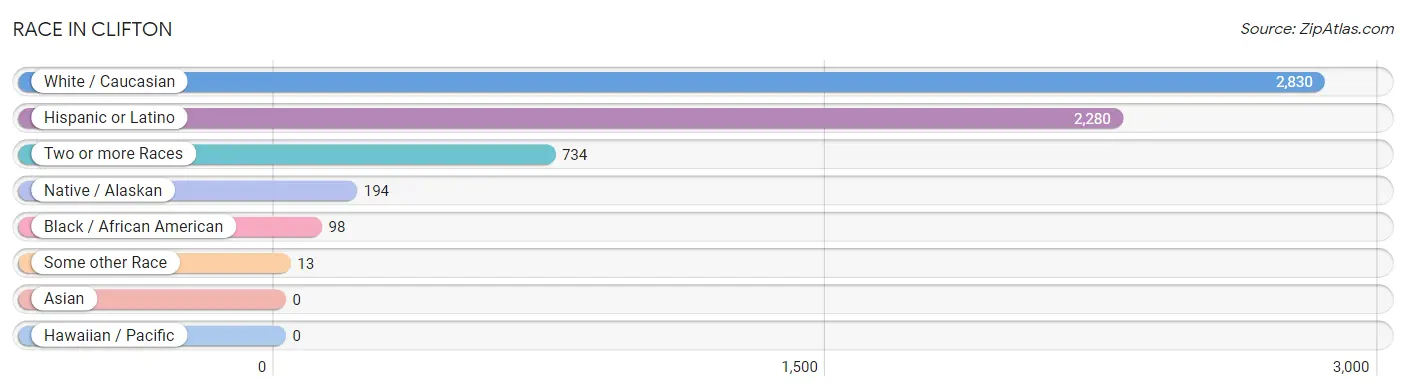
| Race | # Population | % Population |
| Asian | 0 | 0.0% |
| Black / African American | 98 | 2.5% |
| Hawaiian / Pacific | 0 | 0.0% |
| Hispanic or Latino | 2,280 | 58.9% |
| Native / Alaskan | 194 | 5.0% |
| White / Caucasian | 2,830 | 73.2% |
| Two or more Races | 734 | 19.0% |
| Some other Race | 13 | 0.3% |
| Total | 3,869 | 100.0% |
Ancestry in Clifton
The most populous ancestries reported in Clifton are Mexican (2,280 | 58.9%), Apache (133 | 3.4%), English (103 | 2.7%), Navajo (44 | 1.1%), and Irish (42 | 1.1%), together accounting for 67.3% of all Clifton residents.
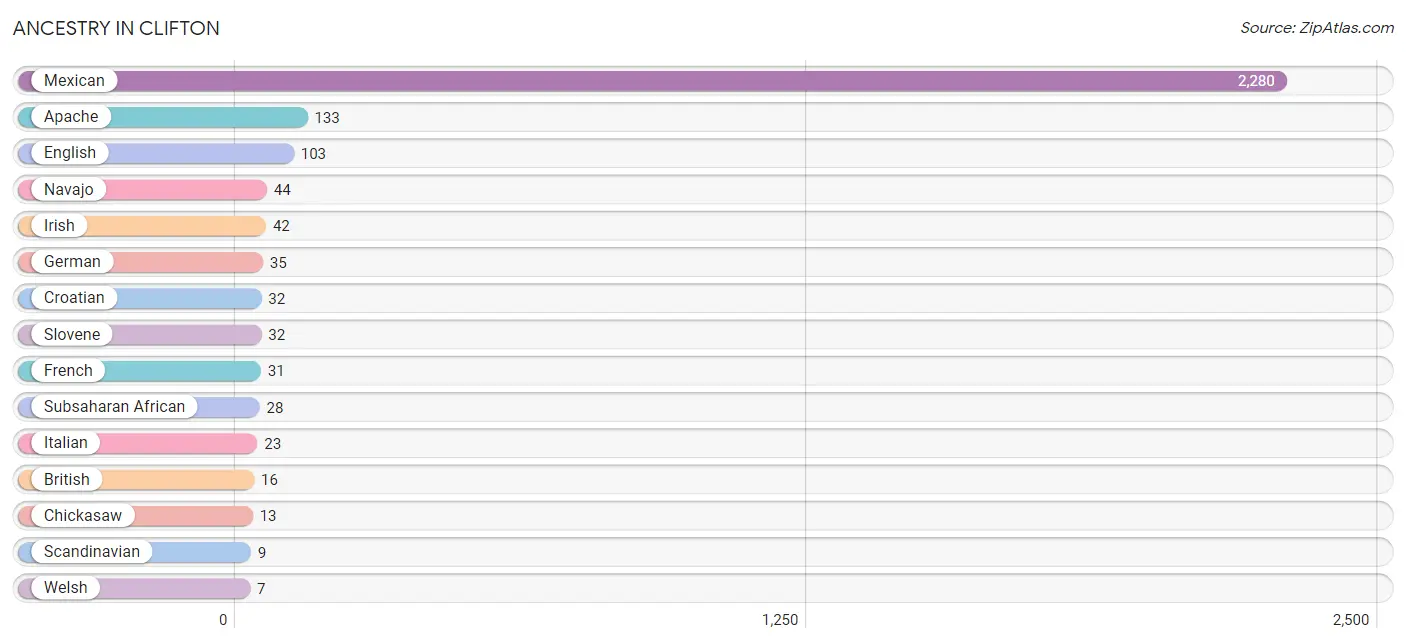
| Ancestry | # Population | % Population |
| Apache | 133 | 3.4% |
| British | 16 | 0.4% |
| Canadian | 5 | 0.1% |
| Chickasaw | 13 | 0.3% |
| Croatian | 32 | 0.8% |
| English | 103 | 2.7% |
| French | 31 | 0.8% |
| German | 35 | 0.9% |
| Irish | 42 | 1.1% |
| Italian | 23 | 0.6% |
| Jamaican | 5 | 0.1% |
| Mexican | 2,280 | 58.9% |
| Navajo | 44 | 1.1% |
| Pima | 4 | 0.1% |
| Scandinavian | 9 | 0.2% |
| Slovene | 32 | 0.8% |
| Subsaharan African | 28 | 0.7% |
| Welsh | 7 | 0.2% | View All 18 Rows |
Immigrants in Clifton
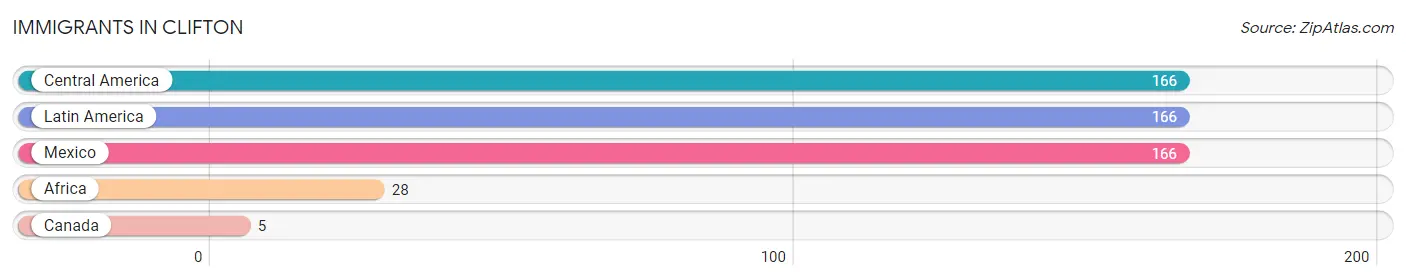
The most numerous immigrant groups reported in Clifton came from Central America (166 | 4.3%), Latin America (166 | 4.3%), Mexico (166 | 4.3%), Africa (28 | 0.7%), and Canada (5 | 0.1%), together accounting for 13.7% of all Clifton residents.
| Immigration Origin | # Population | % Population |
| Africa | 28 | 0.7% |
| Canada | 5 | 0.1% |
| Central America | 166 | 4.3% |
| Latin America | 166 | 4.3% |
| Mexico | 166 | 4.3% | View All 5 Rows |
Sex and Age in Clifton
Sex and Age in Clifton
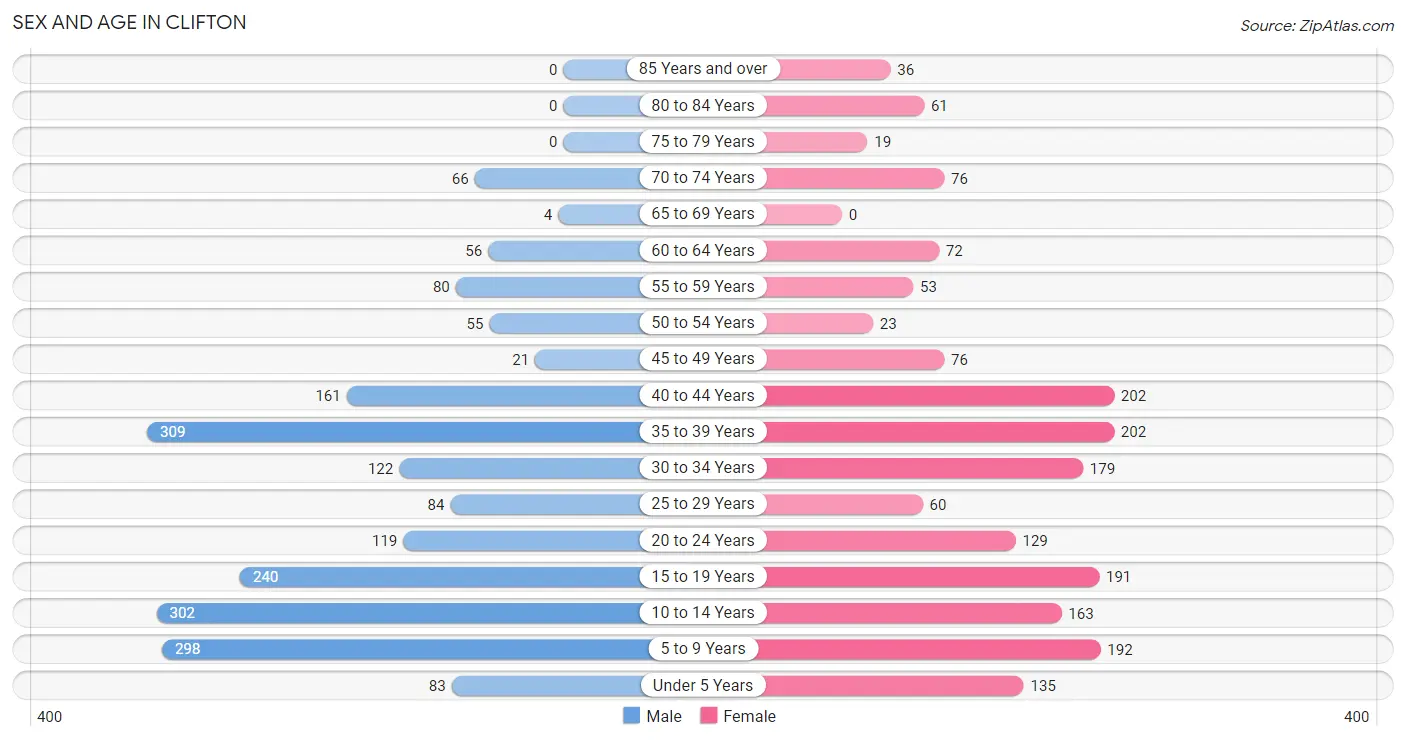
The most populous age groups in Clifton are 35 to 39 Years (309 | 15.4%) for men and 35 to 39 Years (202 | 10.8%) for women.
| Age Bracket | Male | Female |
| Under 5 Years | 83 (4.2%) | 135 (7.2%) |
| 5 to 9 Years | 298 (14.9%) | 192 (10.3%) |
| 10 to 14 Years | 302 (15.1%) | 163 (8.7%) |
| 15 to 19 Years | 240 (12.0%) | 191 (10.2%) |
| 20 to 24 Years | 119 (5.9%) | 129 (6.9%) |
| 25 to 29 Years | 84 (4.2%) | 60 (3.2%) |
| 30 to 34 Years | 122 (6.1%) | 179 (9.6%) |
| 35 to 39 Years | 309 (15.4%) | 202 (10.8%) |
| 40 to 44 Years | 161 (8.1%) | 202 (10.8%) |
| 45 to 49 Years | 21 (1.1%) | 76 (4.1%) |
| 50 to 54 Years | 55 (2.8%) | 23 (1.2%) |
| 55 to 59 Years | 80 (4.0%) | 53 (2.8%) |
| 60 to 64 Years | 56 (2.8%) | 72 (3.8%) |
| 65 to 69 Years | 4 (0.2%) | 0 (0.0%) |
| 70 to 74 Years | 66 (3.3%) | 76 (4.1%) |
| 75 to 79 Years | 0 (0.0%) | 19 (1.0%) |
| 80 to 84 Years | 0 (0.0%) | 61 (3.3%) |
| 85 Years and over | 0 (0.0%) | 36 (1.9%) |
| Total | 2,000 (100.0%) | 1,869 (100.0%) |
Families and Households in Clifton
Median Family Size in Clifton
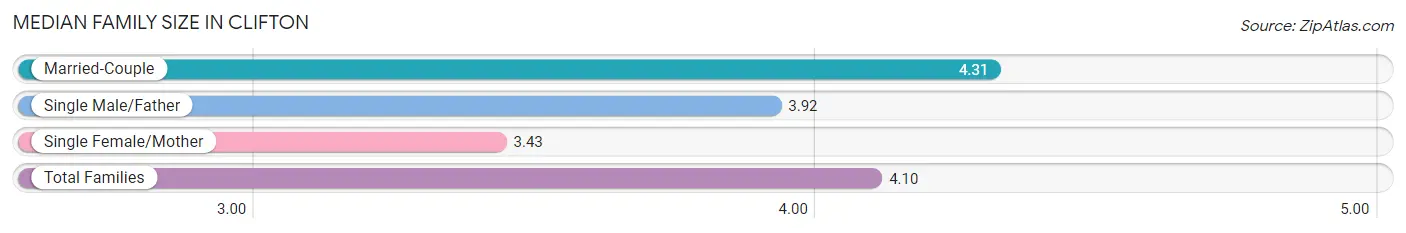
The median family size in Clifton is 4.10 persons per family, with married-couple families (596 | 70.4%) accounting for the largest median family size of 4.31 persons per family. On the other hand, single female/mother families (162 | 19.1%) represent the smallest median family size with 3.43 persons per family.
| Family Type | # Families | Family Size |
| Married-Couple | 596 (70.4%) | 4.31 |
| Single Male/Father | 89 (10.5%) | 3.92 |
| Single Female/Mother | 162 (19.1%) | 3.43 |
| Total Families | 847 (100.0%) | 4.10 |
Median Household Size in Clifton
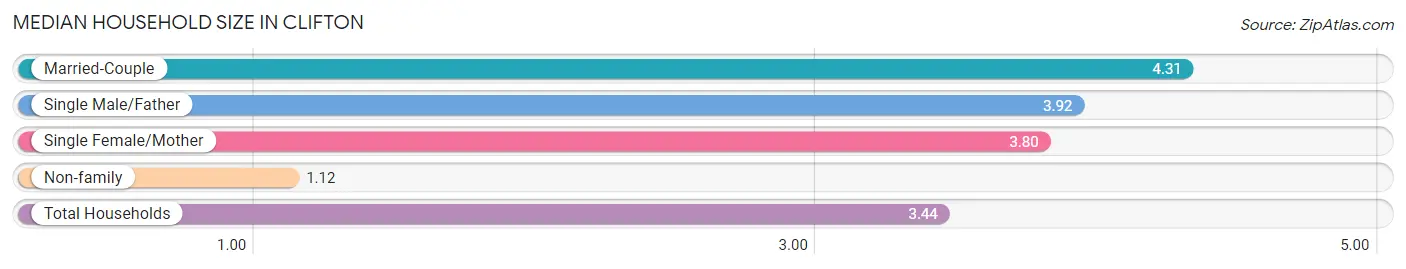
The median household size in Clifton is 3.44 persons per household, with married-couple households (596 | 53.5%) accounting for the largest median household size of 4.31 persons per household. non-family households (266 | 23.9%) represent the smallest median household size with 1.12 persons per household.
| Household Type | # Households | Household Size |
| Married-Couple | 596 (53.5%) | 4.31 |
| Single Male/Father | 89 (8.0%) | 3.92 |
| Single Female/Mother | 162 (14.6%) | 3.80 |
| Non-family | 266 (23.9%) | 1.12 |
| Total Households | 1,113 (100.0%) | 3.44 |
Household Size by Marriage Status in Clifton
Out of a total of 1,113 households in Clifton, 847 (76.1%) are family households, while 266 (23.9%) are nonfamily households. The most numerous type of family households are 4-person households, comprising 220, and the most common type of nonfamily households are 1-person households, comprising 232.
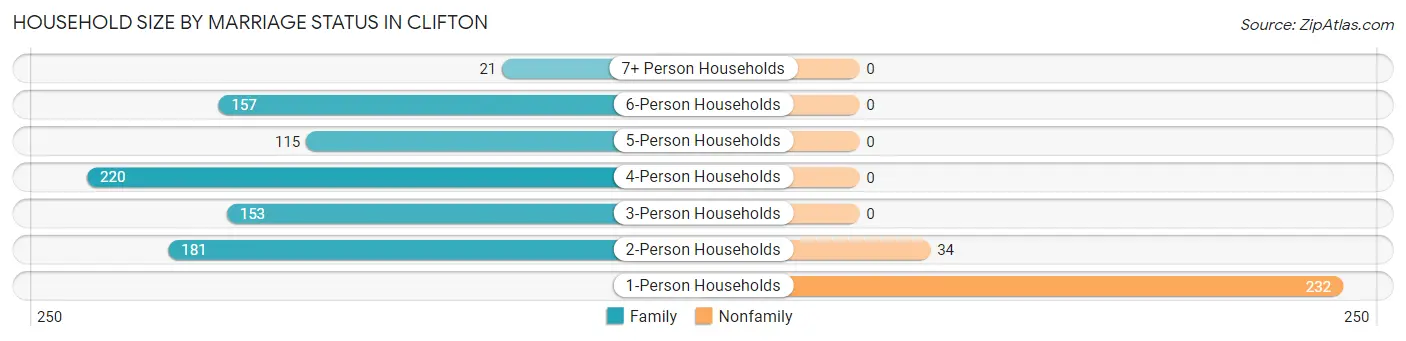
| Household Size | Family Households | Nonfamily Households |
| 1-Person Households | - | 232 (20.8%) |
| 2-Person Households | 181 (16.3%) | 34 (3.0%) |
| 3-Person Households | 153 (13.8%) | 0 (0.0%) |
| 4-Person Households | 220 (19.8%) | 0 (0.0%) |
| 5-Person Households | 115 (10.3%) | 0 (0.0%) |
| 6-Person Households | 157 (14.1%) | 0 (0.0%) |
| 7+ Person Households | 21 (1.9%) | 0 (0.0%) |
| Total | 847 (76.1%) | 266 (23.9%) |
Female Fertility in Clifton
Fertility by Age in Clifton
Average fertility rate in Clifton is 9.0 births per 1,000 women. Women in the age bracket of 35 to 50 years have the highest fertility rate with 19.0 births per 1,000 women. Women in the age bracket of 35 to 50 years acount for 100.0% of all women with births.
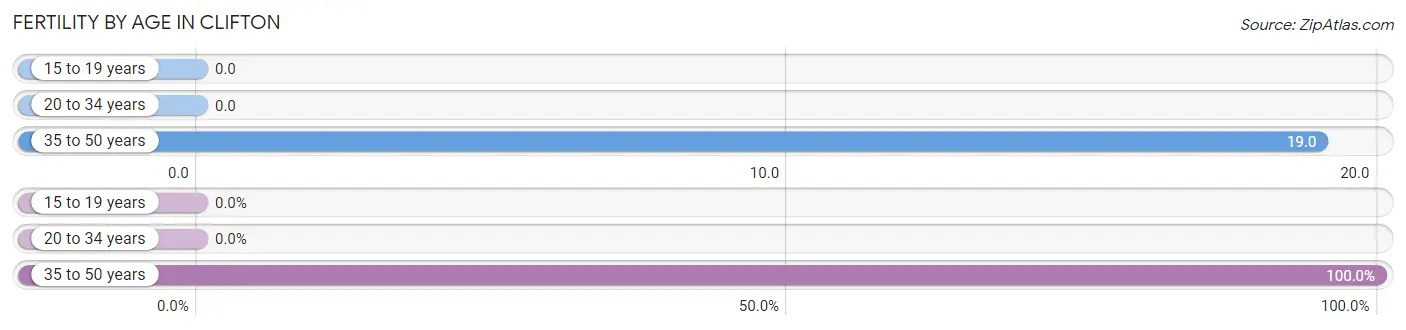
| Age Bracket | Women with Births | Births / 1,000 Women |
| 15 to 19 years | 0 (0.0%) | 0.0 |
| 20 to 34 years | 0 (0.0%) | 0.0 |
| 35 to 50 years | 9 (100.0%) | 19.0 |
| Total | 9 (100.0%) | 9.0 |
Fertility by Age by Marriage Status in Clifton
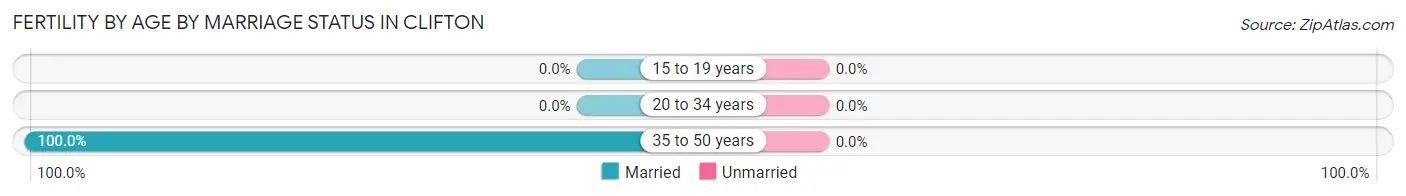
| Age Bracket | Married | Unmarried |
| 15 to 19 years | 0 (0.0%) | 0 (0.0%) |
| 20 to 34 years | 0 (0.0%) | 0 (0.0%) |
| 35 to 50 years | 9 (100.0%) | 0 (0.0%) |
| Total | 9 (100.0%) | 0 (0.0%) |
Fertility by Education in Clifton
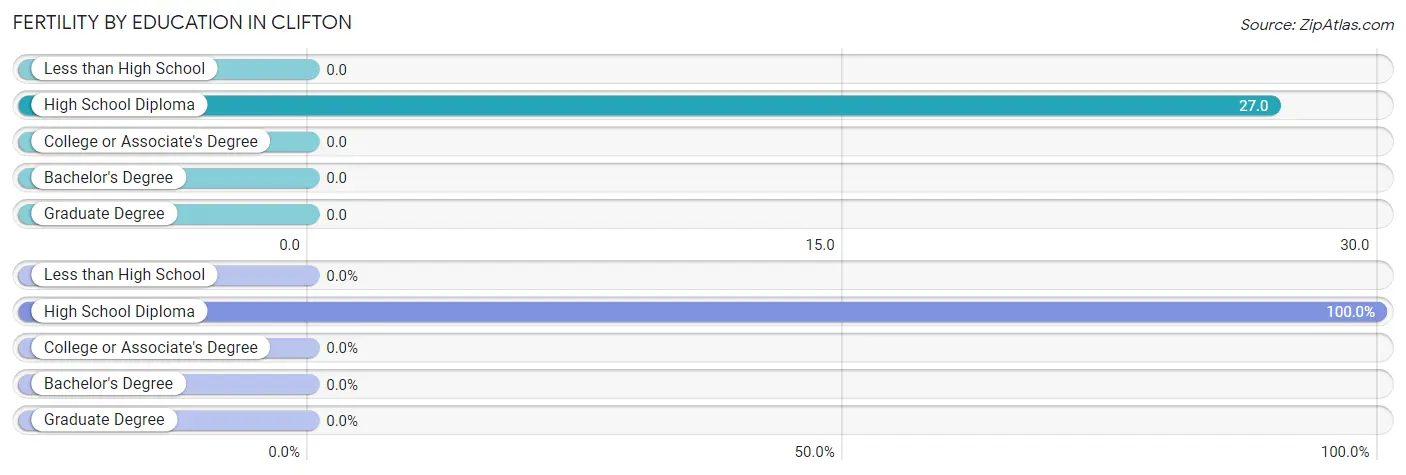
| Educational Attainment | Women with Births | Births / 1,000 Women |
| Less than High School | 0 (0.0%) | 0.0 |
| High School Diploma | 9 (100.0%) | 27.0 |
| College or Associate's Degree | 0 (0.0%) | 0.0 |
| Bachelor's Degree | 0 (0.0%) | 0.0 |
| Graduate Degree | 0 (0.0%) | 0.0 |
| Total | 9 (100.0%) | 9.0 |
Fertility by Education by Marriage Status in Clifton
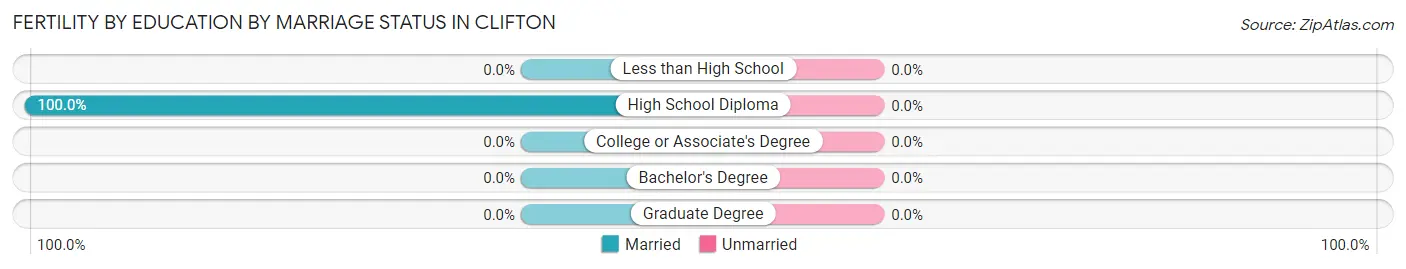
| Educational Attainment | Married | Unmarried |
| Less than High School | 0 (0.0%) | 0 (0.0%) |
| High School Diploma | 9 (100.0%) | 0 (0.0%) |
| College or Associate's Degree | 0 (0.0%) | 0 (0.0%) |
| Bachelor's Degree | 0 (0.0%) | 0 (0.0%) |
| Graduate Degree | 0 (0.0%) | 0 (0.0%) |
| Total | 9 (100.0%) | 0 (0.0%) |
Employment Characteristics in Clifton
Employment by Class of Employer in Clifton
Among the 1,799 employed individuals in Clifton, private company employees (1,357 | 75.4%), local government employees (225 | 12.5%), and state government employees (119 | 6.6%) make up the most common classes of employment.
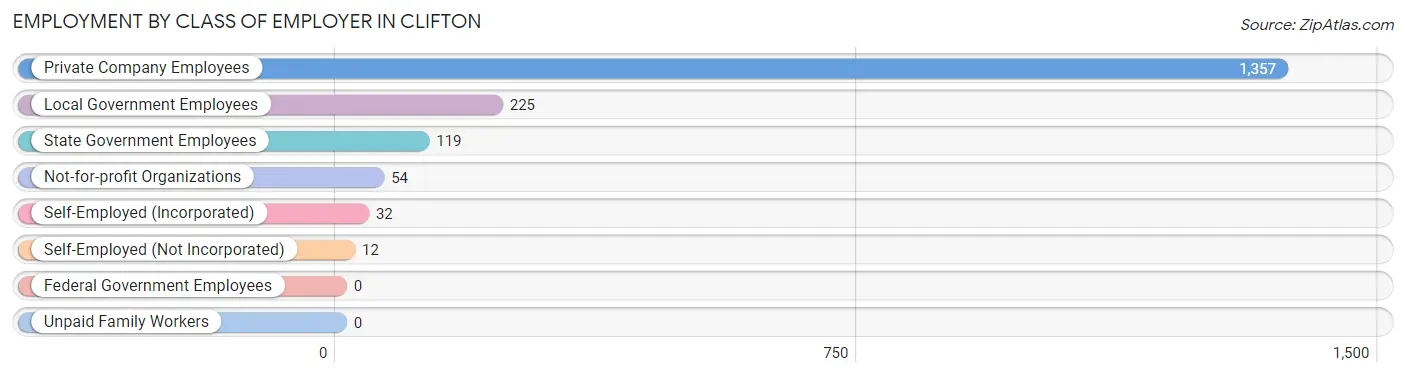
| Employer Class | # Employees | % Employees |
| Private Company Employees | 1,357 | 75.4% |
| Self-Employed (Incorporated) | 32 | 1.8% |
| Self-Employed (Not Incorporated) | 12 | 0.7% |
| Not-for-profit Organizations | 54 | 3.0% |
| Local Government Employees | 225 | 12.5% |
| State Government Employees | 119 | 6.6% |
| Federal Government Employees | 0 | 0.0% |
| Unpaid Family Workers | 0 | 0.0% |
| Total | 1,799 | 100.0% |
Employment Status by Age in Clifton
According to the labor force statistics for Clifton, out of the total population over 16 years of age (2,668), 68.2% or 1,820 individuals are in the labor force, with 1.2% or 22 of them unemployed. The age group with the highest labor force participation rate is 45 to 54 years, with 89.1% or 156 individuals in the labor force. Within the labor force, the 16 to 19 years age range has the highest percentage of unemployed individuals, with 8.6% or 14 of them being unemployed.
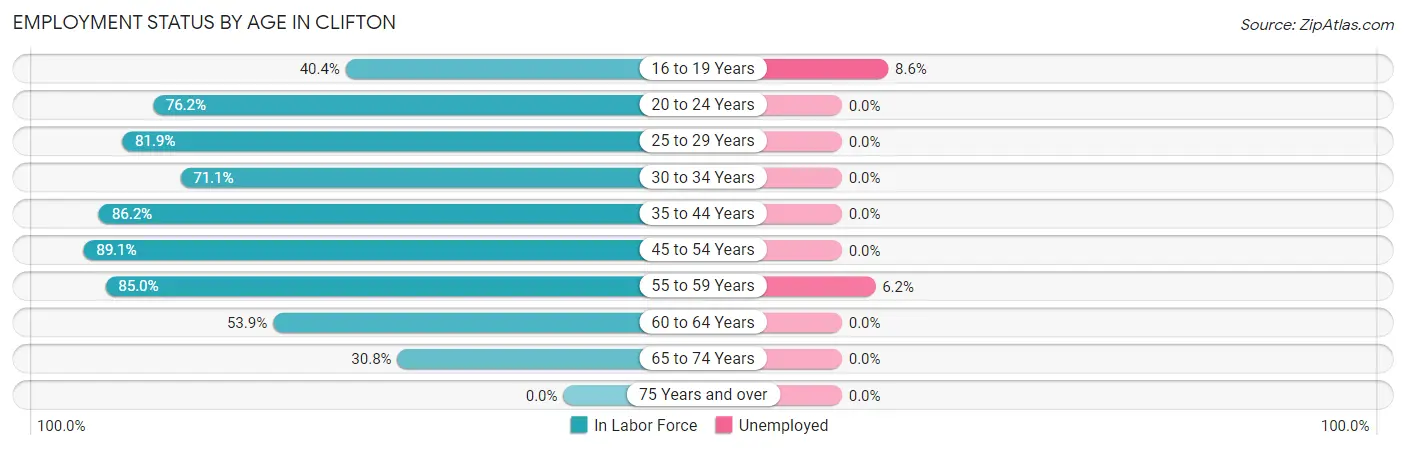
| Age Bracket | In Labor Force | Unemployed |
| 16 to 19 Years | 163 (40.4%) | 14 (8.6%) |
| 20 to 24 Years | 189 (76.2%) | 0 (0.0%) |
| 25 to 29 Years | 118 (81.9%) | 0 (0.0%) |
| 30 to 34 Years | 214 (71.1%) | 0 (0.0%) |
| 35 to 44 Years | 753 (86.2%) | 0 (0.0%) |
| 45 to 54 Years | 156 (89.1%) | 0 (0.0%) |
| 55 to 59 Years | 113 (85.0%) | 7 (6.2%) |
| 60 to 64 Years | 69 (53.9%) | 0 (0.0%) |
| 65 to 74 Years | 45 (30.8%) | 0 (0.0%) |
| 75 Years and over | 0 (0.0%) | 0 (0.0%) |
| Total | 1,820 (68.2%) | 22 (1.2%) |
Employment Status by Educational Attainment in Clifton
According to labor force statistics for Clifton, 81.1% of individuals (1,423) out of the total population between 25 and 64 years of age (1,755) are in the labor force, with 0.5% or 7 of them being unemployed. The group with the highest labor force participation rate are those with the educational attainment of bachelor's degree or higher, with 100.0% or 359 individuals in the labor force. Within the labor force, individuals with high school diploma education have the highest percentage of unemployment, with 1.2% or 7 of them being unemployed.
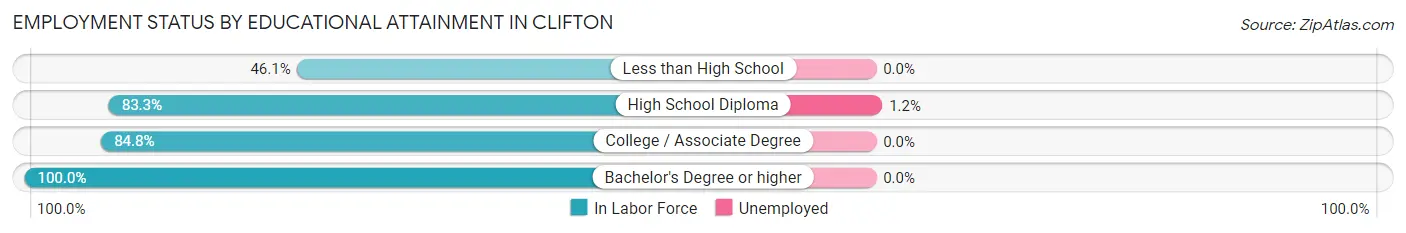
| Educational Attainment | In Labor Force | Unemployed |
| Less than High School | 130 (46.1%) | 0 (0.0%) |
| High School Diploma | 599 (83.3%) | 9 (1.2%) |
| College / Associate Degree | 335 (84.8%) | 0 (0.0%) |
| Bachelor's Degree or higher | 359 (100.0%) | 0 (0.0%) |
| Total | 1,423 (81.1%) | 9 (0.5%) |
Employment Occupations by Sex in Clifton
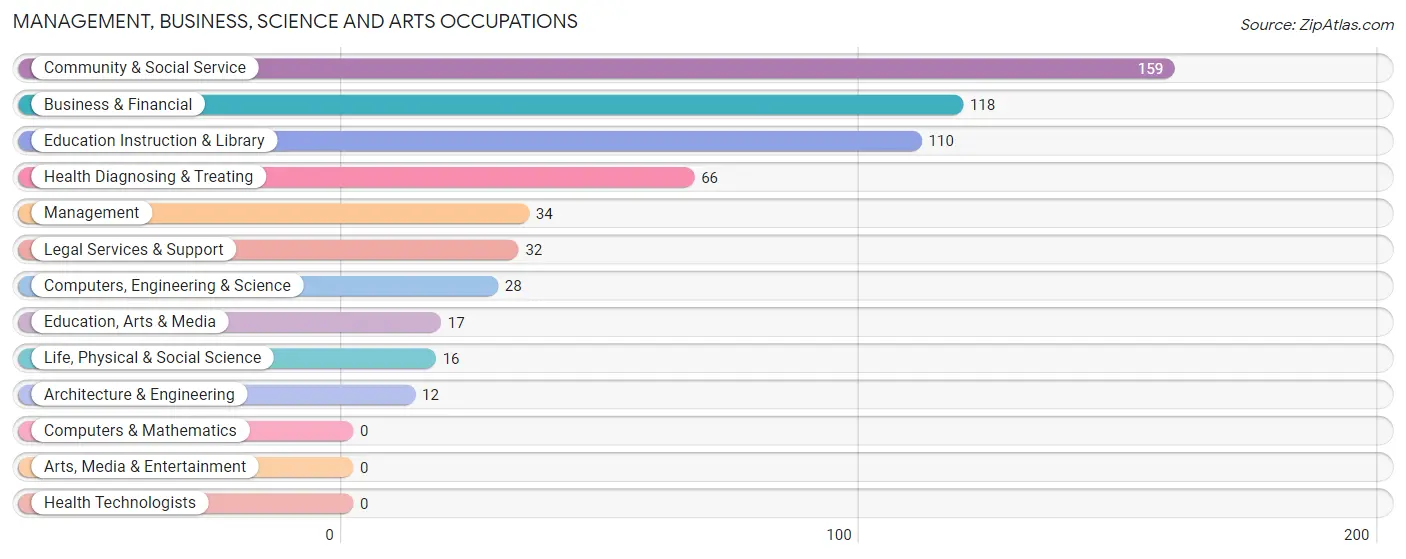
Management, Business, Science and Arts Occupations
The most common Management, Business, Science and Arts occupations in Clifton are Community & Social Service (159 | 8.8%), Business & Financial (118 | 6.6%), Education Instruction & Library (110 | 6.1%), Health Diagnosing & Treating (66 | 3.7%), and Management (34 | 1.9%).
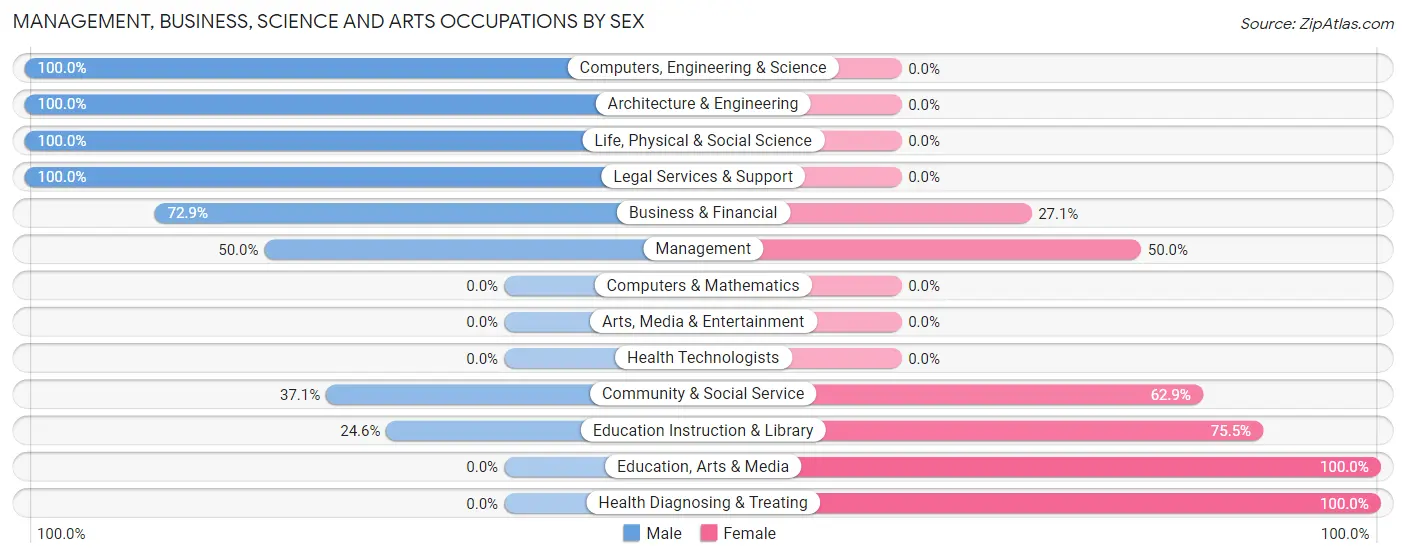
Management, Business, Science and Arts Occupations by Sex
Within the Management, Business, Science and Arts occupations in Clifton, the most male-oriented occupations are Computers, Engineering & Science (100.0%), Architecture & Engineering (100.0%), and Life, Physical & Social Science (100.0%), while the most female-oriented occupations are Education, Arts & Media (100.0%), Health Diagnosing & Treating (100.0%), and Education Instruction & Library (75.4%).
| Occupation | Male | Female |
| Management | 17 (50.0%) | 17 (50.0%) |
| Business & Financial | 86 (72.9%) | 32 (27.1%) |
| Computers, Engineering & Science | 28 (100.0%) | 0 (0.0%) |
| Computers & Mathematics | 0 (0.0%) | 0 (0.0%) |
| Architecture & Engineering | 12 (100.0%) | 0 (0.0%) |
| Life, Physical & Social Science | 16 (100.0%) | 0 (0.0%) |
| Community & Social Service | 59 (37.1%) | 100 (62.9%) |
| Education, Arts & Media | 0 (0.0%) | 17 (100.0%) |
| Legal Services & Support | 32 (100.0%) | 0 (0.0%) |
| Education Instruction & Library | 27 (24.5%) | 83 (75.4%) |
| Arts, Media & Entertainment | 0 (0.0%) | 0 (0.0%) |
| Health Diagnosing & Treating | 0 (0.0%) | 66 (100.0%) |
| Health Technologists | 0 (0.0%) | 0 (0.0%) |
| Total (Category) | 190 (46.9%) | 215 (53.1%) |
| Total (Overall) | 1,022 (56.8%) | 777 (43.2%) |
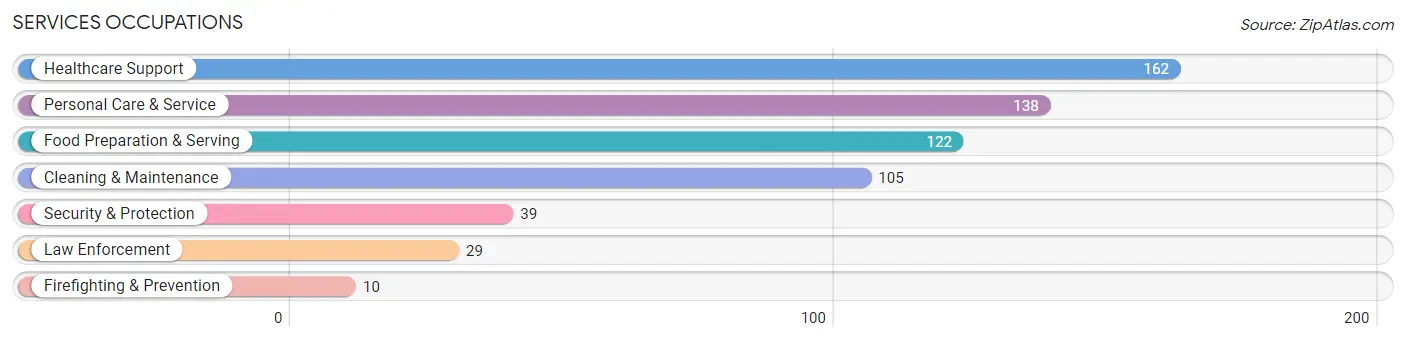
Services Occupations
The most common Services occupations in Clifton are Healthcare Support (162 | 9.0%), Personal Care & Service (138 | 7.7%), Food Preparation & Serving (122 | 6.8%), Cleaning & Maintenance (105 | 5.8%), and Security & Protection (39 | 2.2%).
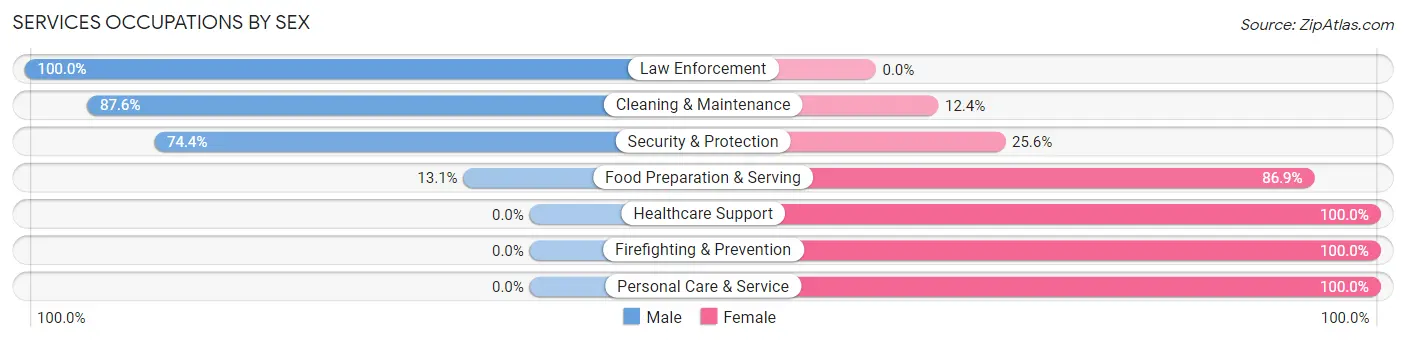
Services Occupations by Sex
Within the Services occupations in Clifton, the most male-oriented occupations are Law Enforcement (100.0%), Cleaning & Maintenance (87.6%), and Security & Protection (74.4%), while the most female-oriented occupations are Healthcare Support (100.0%), Firefighting & Prevention (100.0%), and Personal Care & Service (100.0%).
| Occupation | Male | Female |
| Healthcare Support | 0 (0.0%) | 162 (100.0%) |
| Security & Protection | 29 (74.4%) | 10 (25.6%) |
| Firefighting & Prevention | 0 (0.0%) | 10 (100.0%) |
| Law Enforcement | 29 (100.0%) | 0 (0.0%) |
| Food Preparation & Serving | 16 (13.1%) | 106 (86.9%) |
| Cleaning & Maintenance | 92 (87.6%) | 13 (12.4%) |
| Personal Care & Service | 0 (0.0%) | 138 (100.0%) |
| Total (Category) | 137 (24.2%) | 429 (75.8%) |
| Total (Overall) | 1,022 (56.8%) | 777 (43.2%) |
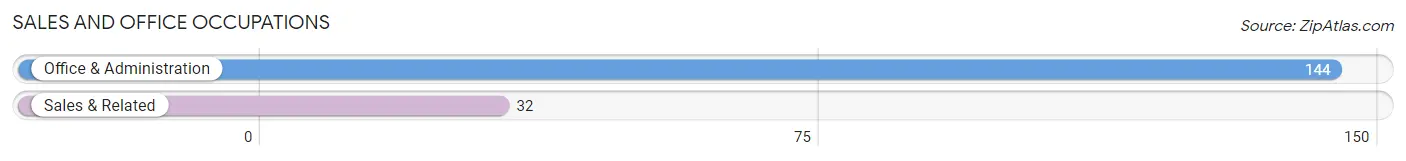
Sales and Office Occupations
The most common Sales and Office occupations in Clifton are Office & Administration (144 | 8.0%), and Sales & Related (32 | 1.8%).
Sales and Office Occupations by Sex
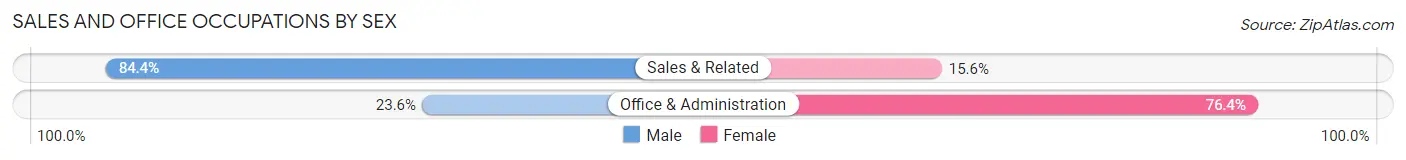
| Occupation | Male | Female |
| Sales & Related | 27 (84.4%) | 5 (15.6%) |
| Office & Administration | 34 (23.6%) | 110 (76.4%) |
| Total (Category) | 61 (34.7%) | 115 (65.3%) |
| Total (Overall) | 1,022 (56.8%) | 777 (43.2%) |
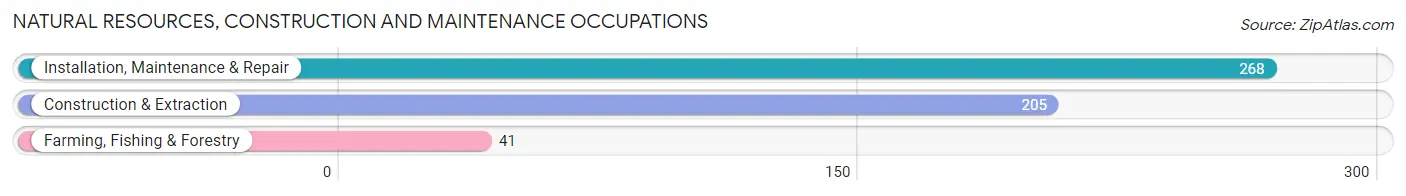
Natural Resources, Construction and Maintenance Occupations
The most common Natural Resources, Construction and Maintenance occupations in Clifton are Installation, Maintenance & Repair (268 | 14.9%), Construction & Extraction (205 | 11.4%), and Farming, Fishing & Forestry (41 | 2.3%).
Natural Resources, Construction and Maintenance Occupations by Sex
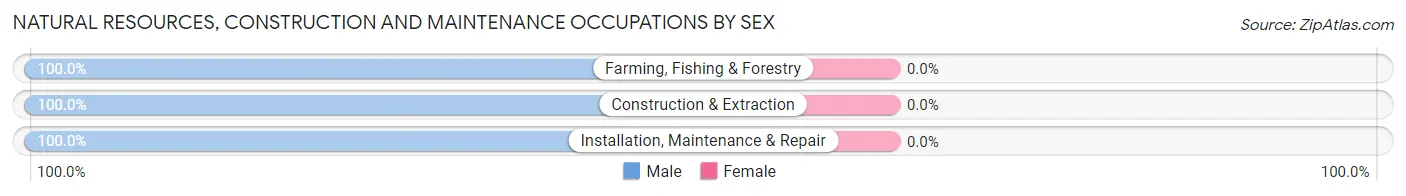
| Occupation | Male | Female |
| Farming, Fishing & Forestry | 41 (100.0%) | 0 (0.0%) |
| Construction & Extraction | 205 (100.0%) | 0 (0.0%) |
| Installation, Maintenance & Repair | 268 (100.0%) | 0 (0.0%) |
| Total (Category) | 514 (100.0%) | 0 (0.0%) |
| Total (Overall) | 1,022 (56.8%) | 777 (43.2%) |
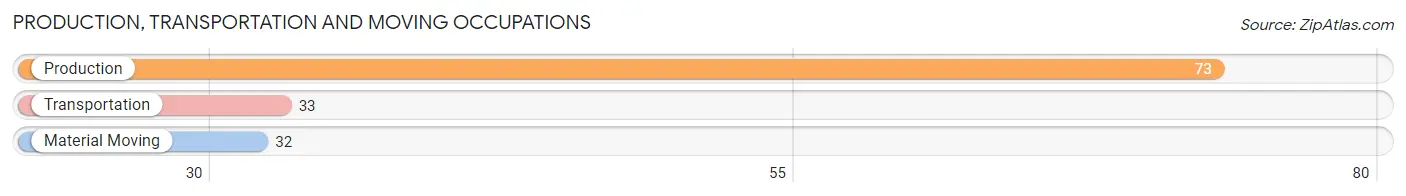
Production, Transportation and Moving Occupations
The most common Production, Transportation and Moving occupations in Clifton are Production (73 | 4.1%), Transportation (33 | 1.8%), and Material Moving (32 | 1.8%).
Production, Transportation and Moving Occupations by Sex
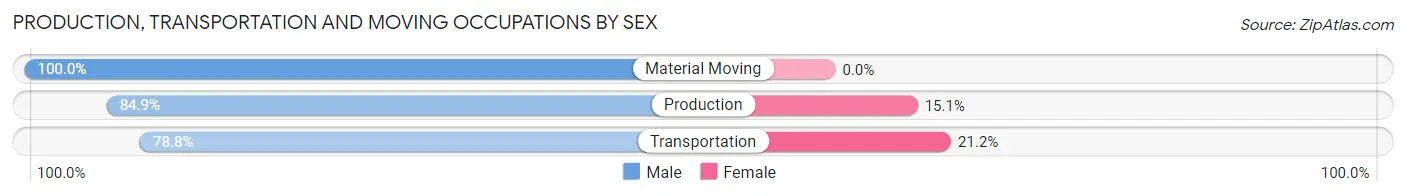
| Occupation | Male | Female |
| Production | 62 (84.9%) | 11 (15.1%) |
| Transportation | 26 (78.8%) | 7 (21.2%) |
| Material Moving | 32 (100.0%) | 0 (0.0%) |
| Total (Category) | 120 (87.0%) | 18 (13.0%) |
| Total (Overall) | 1,022 (56.8%) | 777 (43.2%) |
Employment Industries by Sex in Clifton
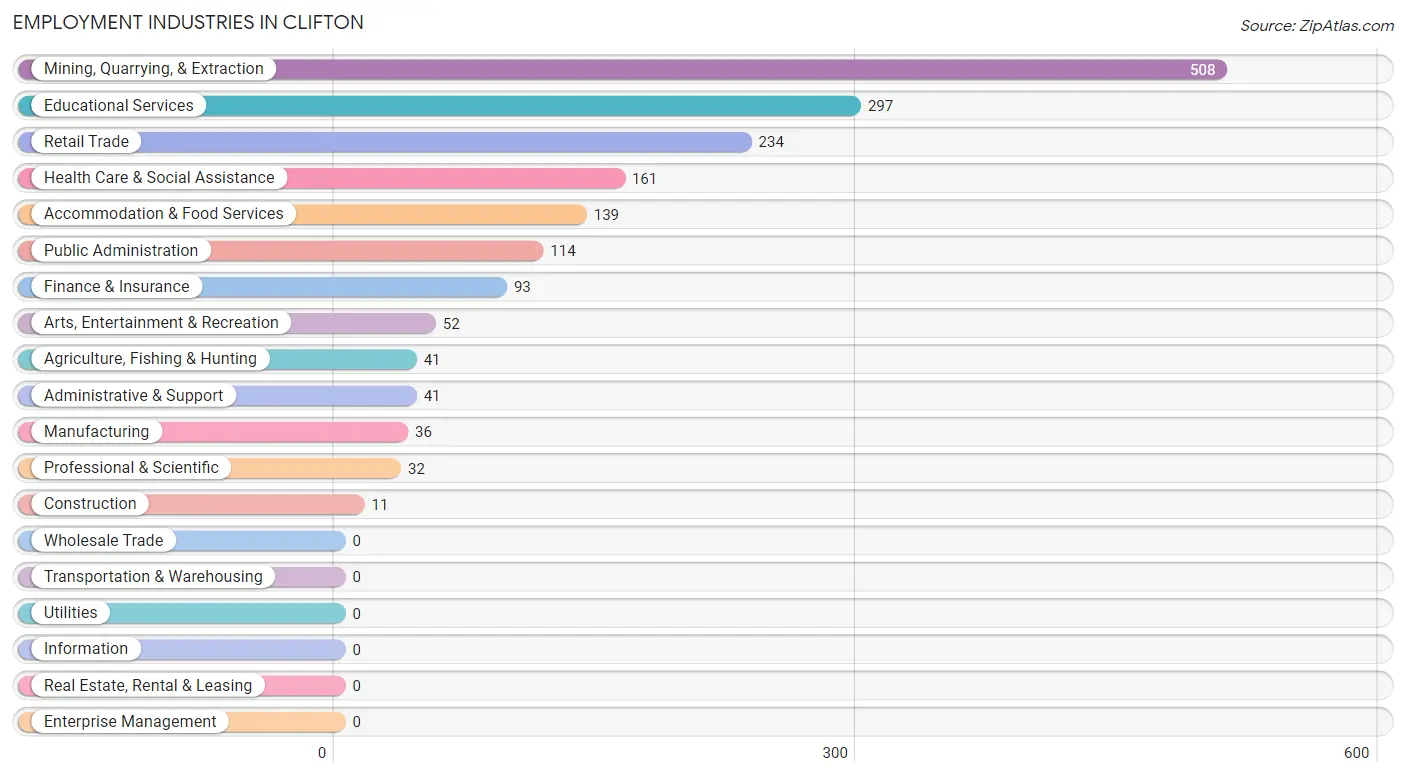
Employment Industries in Clifton
The major employment industries in Clifton include Mining, Quarrying, & Extraction (508 | 28.2%), Educational Services (297 | 16.5%), Retail Trade (234 | 13.0%), Health Care & Social Assistance (161 | 8.9%), and Accommodation & Food Services (139 | 7.7%).
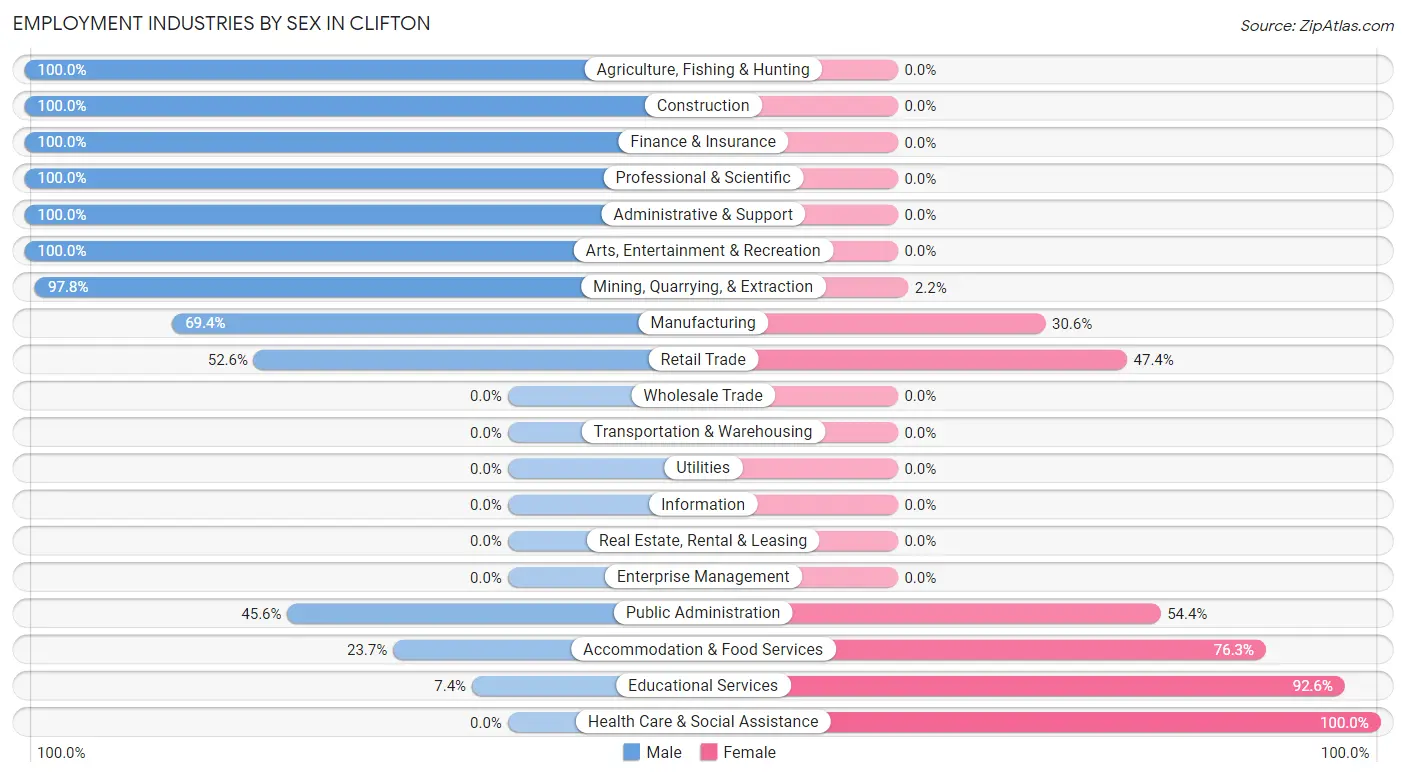
Employment Industries by Sex in Clifton
The Clifton industries that see more men than women are Agriculture, Fishing & Hunting (100.0%), Construction (100.0%), and Finance & Insurance (100.0%), whereas the industries that tend to have a higher number of women are Health Care & Social Assistance (100.0%), Educational Services (92.6%), and Accommodation & Food Services (76.3%).
| Industry | Male | Female |
| Agriculture, Fishing & Hunting | 41 (100.0%) | 0 (0.0%) |
| Mining, Quarrying, & Extraction | 497 (97.8%) | 11 (2.2%) |
| Construction | 11 (100.0%) | 0 (0.0%) |
| Manufacturing | 25 (69.4%) | 11 (30.6%) |
| Wholesale Trade | 0 (0.0%) | 0 (0.0%) |
| Retail Trade | 123 (52.6%) | 111 (47.4%) |
| Transportation & Warehousing | 0 (0.0%) | 0 (0.0%) |
| Utilities | 0 (0.0%) | 0 (0.0%) |
| Information | 0 (0.0%) | 0 (0.0%) |
| Finance & Insurance | 93 (100.0%) | 0 (0.0%) |
| Real Estate, Rental & Leasing | 0 (0.0%) | 0 (0.0%) |
| Professional & Scientific | 32 (100.0%) | 0 (0.0%) |
| Enterprise Management | 0 (0.0%) | 0 (0.0%) |
| Administrative & Support | 41 (100.0%) | 0 (0.0%) |
| Educational Services | 22 (7.4%) | 275 (92.6%) |
| Health Care & Social Assistance | 0 (0.0%) | 161 (100.0%) |
| Arts, Entertainment & Recreation | 52 (100.0%) | 0 (0.0%) |
| Accommodation & Food Services | 33 (23.7%) | 106 (76.3%) |
| Public Administration | 52 (45.6%) | 62 (54.4%) |
| Total | 1,022 (56.8%) | 777 (43.2%) |
Education in Clifton
School Enrollment in Clifton
The most common levels of schooling among the 1,264 students in Clifton are middle school (431 | 34.1%), elementary school (373 | 29.5%), and high school (298 | 23.6%).
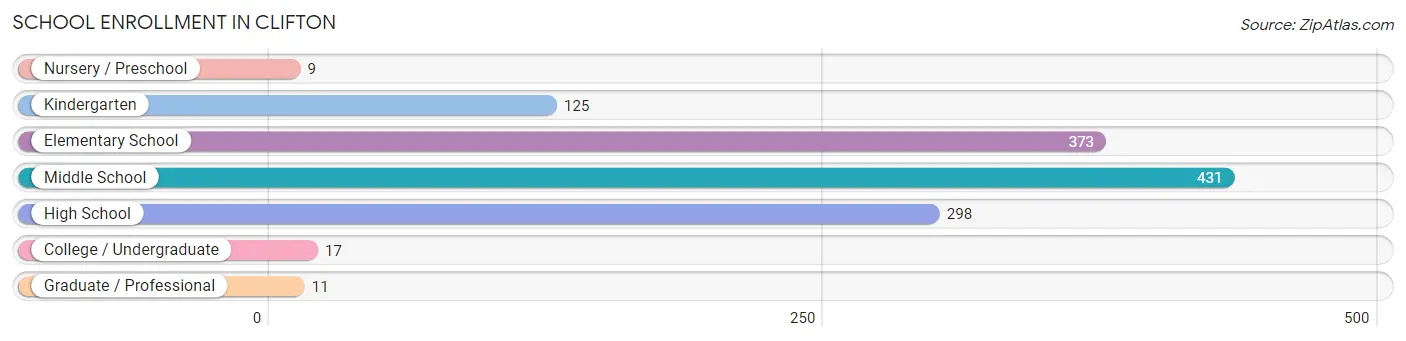
| School Level | # Students | % Students |
| Nursery / Preschool | 9 | 0.7% |
| Kindergarten | 125 | 9.9% |
| Elementary School | 373 | 29.5% |
| Middle School | 431 | 34.1% |
| High School | 298 | 23.6% |
| College / Undergraduate | 17 | 1.3% |
| Graduate / Professional | 11 | 0.9% |
| Total | 1,264 | 100.0% |
School Enrollment by Age by Funding Source in Clifton
Out of a total of 1,264 students who are enrolled in schools in Clifton, 102 (8.1%) attend a private institution, while the remaining 1,162 (91.9%) are enrolled in public schools. The age group of 35 years and over has the highest likelihood of being enrolled in private schools, with 11 (100.0% in the age bracket) enrolled. Conversely, the age group of 3 to 4 year olds has the lowest likelihood of being enrolled in a private school, with 9 (100.0% in the age bracket) attending a public institution.
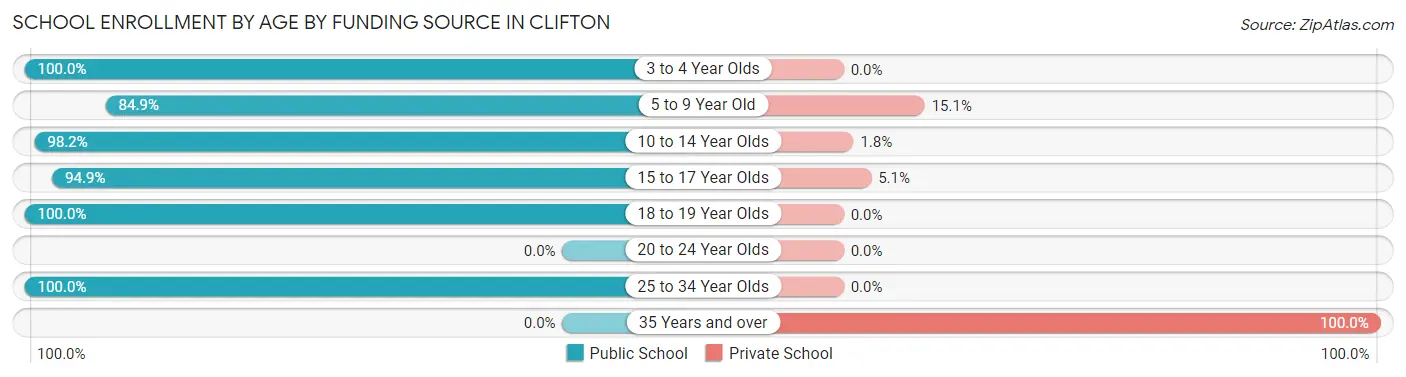
| Age Bracket | Public School | Private School |
| 3 to 4 Year Olds | 9 (100.0%) | 0 (0.0%) |
| 5 to 9 Year Old | 416 (84.9%) | 74 (15.1%) |
| 10 to 14 Year Olds | 431 (98.2%) | 8 (1.8%) |
| 15 to 17 Year Olds | 185 (94.9%) | 10 (5.1%) |
| 18 to 19 Year Olds | 103 (100.0%) | 0 (0.0%) |
| 20 to 24 Year Olds | 0 (0.0%) | 0 (0.0%) |
| 25 to 34 Year Olds | 17 (100.0%) | 0 (0.0%) |
| 35 Years and over | 0 (0.0%) | 11 (100.0%) |
| Total | 1,162 (91.9%) | 102 (8.1%) |
Educational Attainment by Field of Study in Clifton
Social sciences (138 | 37.2%), science & technology (109 | 29.4%), business (52 | 14.0%), physical & health sciences (29 | 7.8%), and bio, nature & agricultural (23 | 6.2%) are the most common fields of study among 371 individuals in Clifton who have obtained a bachelor's degree or higher.
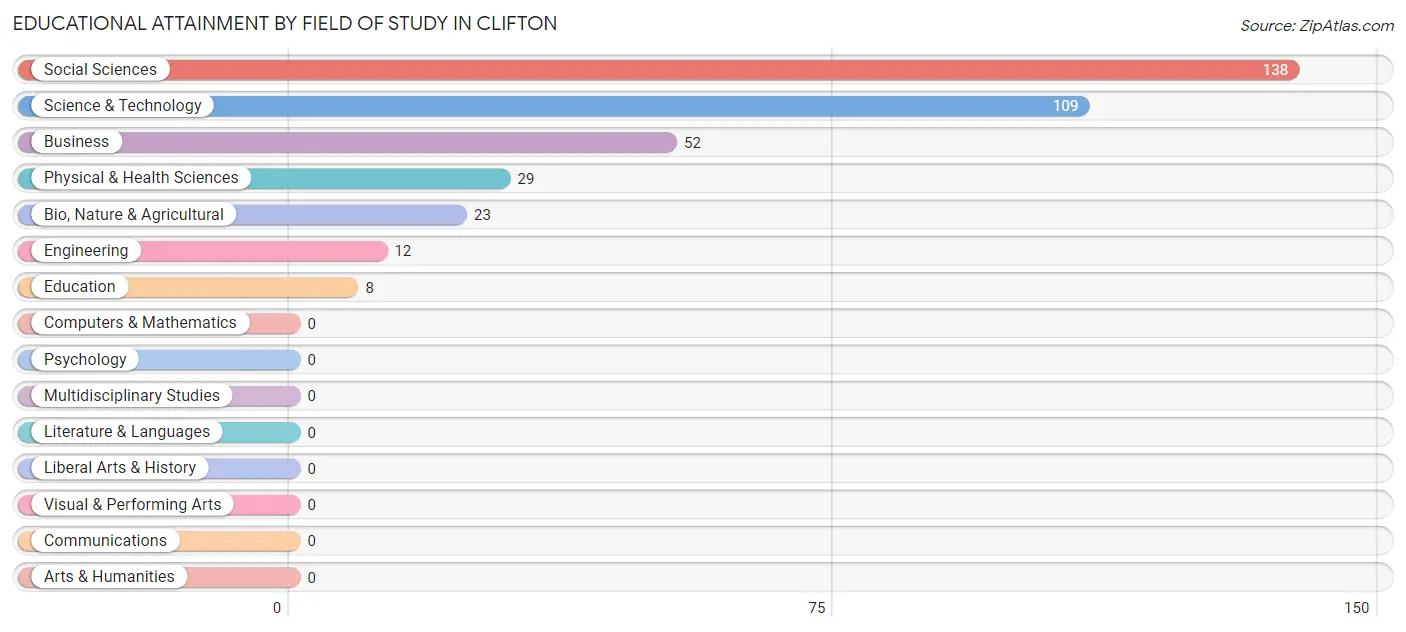
| Field of Study | # Graduates | % Graduates |
| Computers & Mathematics | 0 | 0.0% |
| Bio, Nature & Agricultural | 23 | 6.2% |
| Physical & Health Sciences | 29 | 7.8% |
| Psychology | 0 | 0.0% |
| Social Sciences | 138 | 37.2% |
| Engineering | 12 | 3.2% |
| Multidisciplinary Studies | 0 | 0.0% |
| Science & Technology | 109 | 29.4% |
| Business | 52 | 14.0% |
| Education | 8 | 2.2% |
| Literature & Languages | 0 | 0.0% |
| Liberal Arts & History | 0 | 0.0% |
| Visual & Performing Arts | 0 | 0.0% |
| Communications | 0 | 0.0% |
| Arts & Humanities | 0 | 0.0% |
| Total | 371 | 100.0% |
Transportation & Commute in Clifton
Vehicle Availability by Sex in Clifton
The most prevalent vehicle ownership categories in Clifton are males with 2 vehicles (304, accounting for 29.7%) and females with 2 vehicles (406, making up 39.1%).
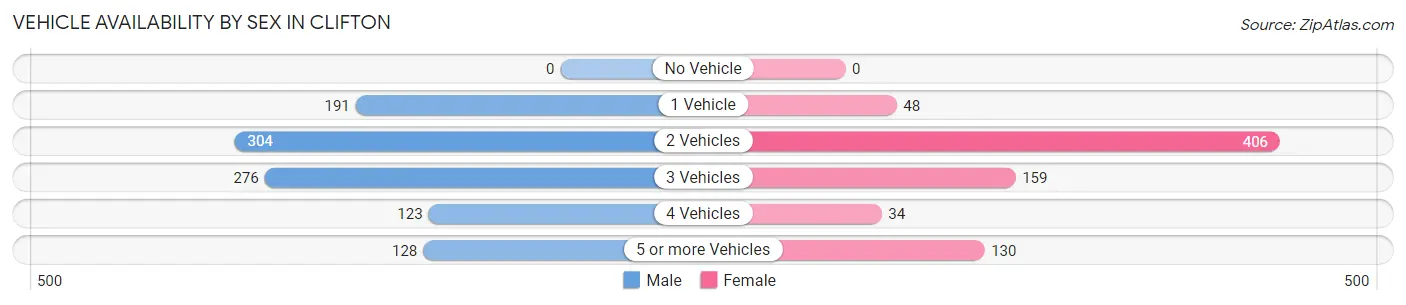
| Vehicles Available | Male | Female |
| No Vehicle | 0 (0.0%) | 0 (0.0%) |
| 1 Vehicle | 191 (18.7%) | 48 (6.2%) |
| 2 Vehicles | 304 (29.7%) | 406 (52.2%) |
| 3 Vehicles | 276 (27.0%) | 159 (20.5%) |
| 4 Vehicles | 123 (12.0%) | 34 (4.4%) |
| 5 or more Vehicles | 128 (12.5%) | 130 (16.7%) |
| Total | 1,022 (100.0%) | 777 (100.0%) |
Commute Time in Clifton
The most frequently occuring commute durations in Clifton are 5 to 9 minutes (492 commuters, 27.4%), 10 to 14 minutes (464 commuters, 25.8%), and 15 to 19 minutes (329 commuters, 18.3%).
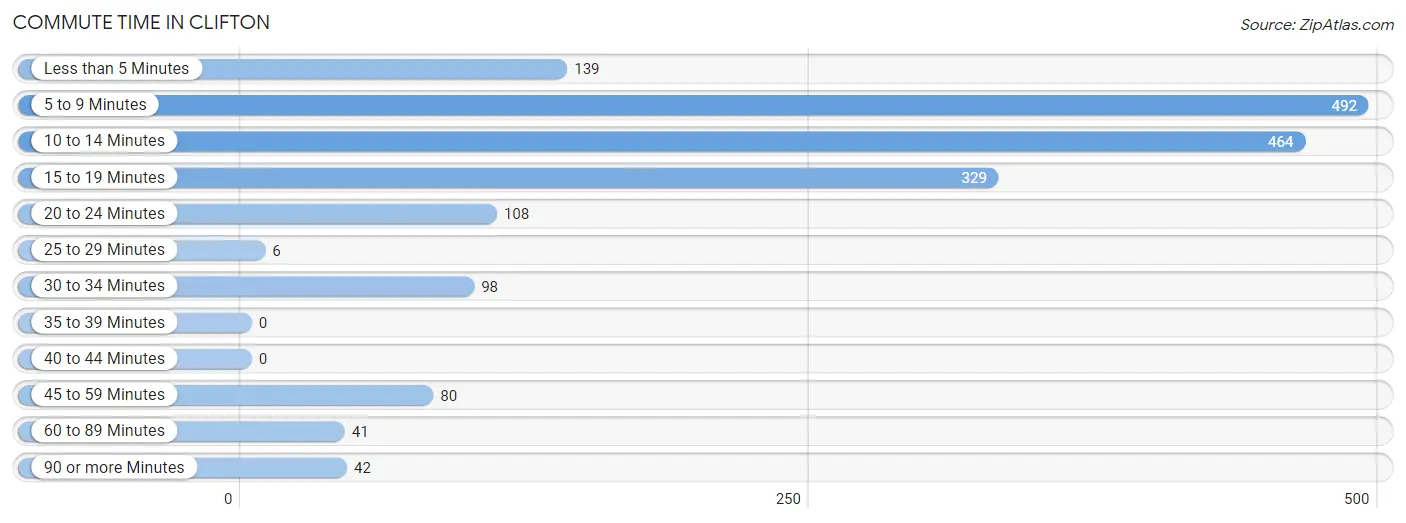
| Commute Time | # Commuters | % Commuters |
| Less than 5 Minutes | 139 | 7.7% |
| 5 to 9 Minutes | 492 | 27.4% |
| 10 to 14 Minutes | 464 | 25.8% |
| 15 to 19 Minutes | 329 | 18.3% |
| 20 to 24 Minutes | 108 | 6.0% |
| 25 to 29 Minutes | 6 | 0.3% |
| 30 to 34 Minutes | 98 | 5.4% |
| 35 to 39 Minutes | 0 | 0.0% |
| 40 to 44 Minutes | 0 | 0.0% |
| 45 to 59 Minutes | 80 | 4.4% |
| 60 to 89 Minutes | 41 | 2.3% |
| 90 or more Minutes | 42 | 2.3% |
Commute Time by Sex in Clifton
The most common commute times in Clifton are 5 to 9 minutes (392 commuters, 38.4%) for males and 10 to 14 minutes (259 commuters, 33.3%) for females.
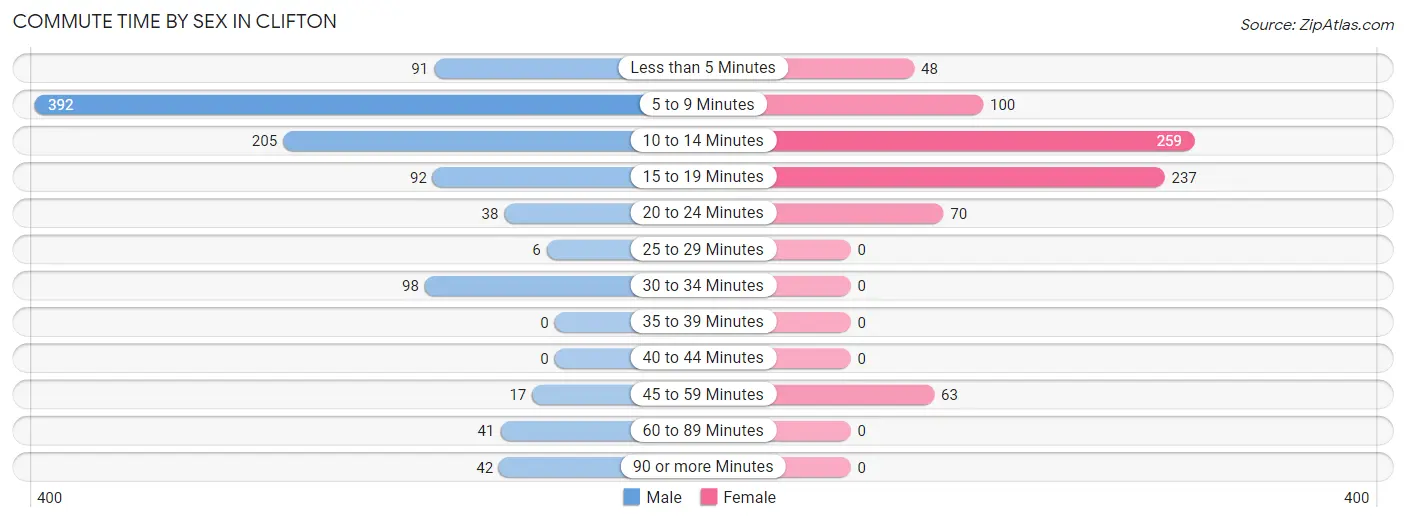
| Commute Time | Male | Female |
| Less than 5 Minutes | 91 (8.9%) | 48 (6.2%) |
| 5 to 9 Minutes | 392 (38.4%) | 100 (12.9%) |
| 10 to 14 Minutes | 205 (20.1%) | 259 (33.3%) |
| 15 to 19 Minutes | 92 (9.0%) | 237 (30.5%) |
| 20 to 24 Minutes | 38 (3.7%) | 70 (9.0%) |
| 25 to 29 Minutes | 6 (0.6%) | 0 (0.0%) |
| 30 to 34 Minutes | 98 (9.6%) | 0 (0.0%) |
| 35 to 39 Minutes | 0 (0.0%) | 0 (0.0%) |
| 40 to 44 Minutes | 0 (0.0%) | 0 (0.0%) |
| 45 to 59 Minutes | 17 (1.7%) | 63 (8.1%) |
| 60 to 89 Minutes | 41 (4.0%) | 0 (0.0%) |
| 90 or more Minutes | 42 (4.1%) | 0 (0.0%) |
Time of Departure to Work by Sex in Clifton
The most frequent times of departure to work in Clifton are 5:00 AM to 5:29 AM (258, 25.2%) for males and 4:00 PM to 11:59 PM (243, 31.3%) for females.
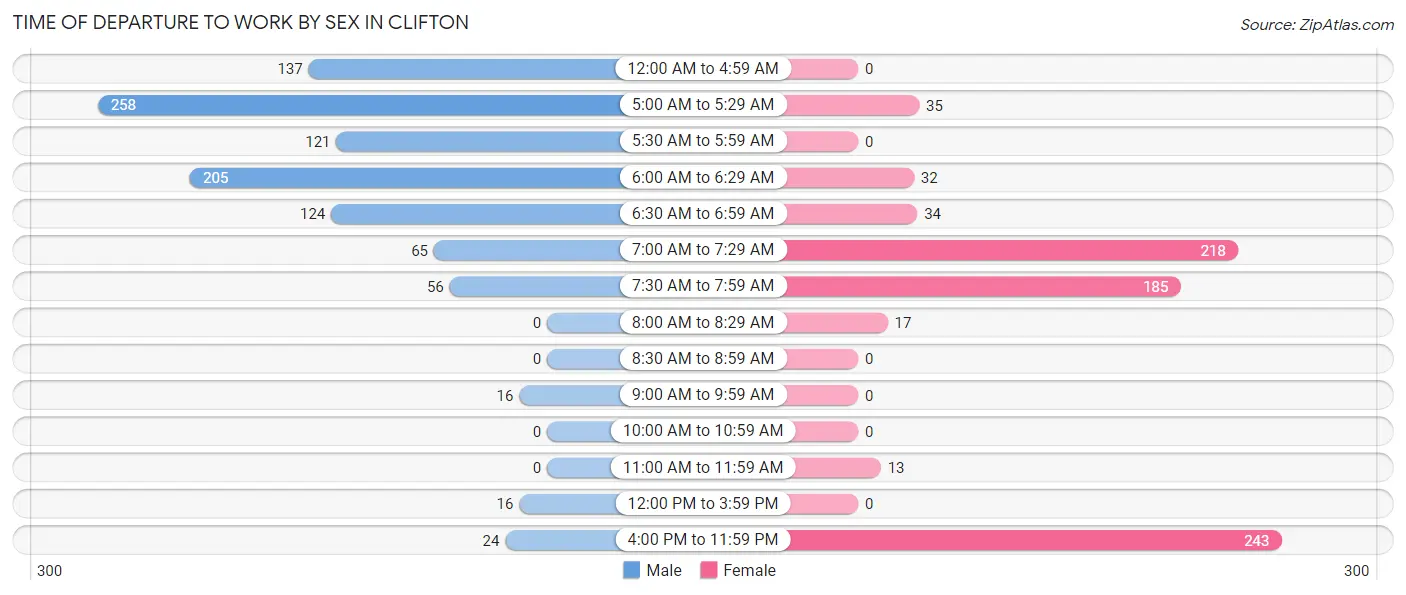
| Time of Departure | Male | Female |
| 12:00 AM to 4:59 AM | 137 (13.4%) | 0 (0.0%) |
| 5:00 AM to 5:29 AM | 258 (25.2%) | 35 (4.5%) |
| 5:30 AM to 5:59 AM | 121 (11.8%) | 0 (0.0%) |
| 6:00 AM to 6:29 AM | 205 (20.1%) | 32 (4.1%) |
| 6:30 AM to 6:59 AM | 124 (12.1%) | 34 (4.4%) |
| 7:00 AM to 7:29 AM | 65 (6.4%) | 218 (28.1%) |
| 7:30 AM to 7:59 AM | 56 (5.5%) | 185 (23.8%) |
| 8:00 AM to 8:29 AM | 0 (0.0%) | 17 (2.2%) |
| 8:30 AM to 8:59 AM | 0 (0.0%) | 0 (0.0%) |
| 9:00 AM to 9:59 AM | 16 (1.6%) | 0 (0.0%) |
| 10:00 AM to 10:59 AM | 0 (0.0%) | 0 (0.0%) |
| 11:00 AM to 11:59 AM | 0 (0.0%) | 13 (1.7%) |
| 12:00 PM to 3:59 PM | 16 (1.6%) | 0 (0.0%) |
| 4:00 PM to 11:59 PM | 24 (2.4%) | 243 (31.3%) |
| Total | 1,022 (100.0%) | 777 (100.0%) |
Housing Occupancy in Clifton
Occupancy by Ownership in Clifton
Of the total 1,113 dwellings in Clifton, owner-occupied units account for 444 (39.9%), while renter-occupied units make up 669 (60.1%).
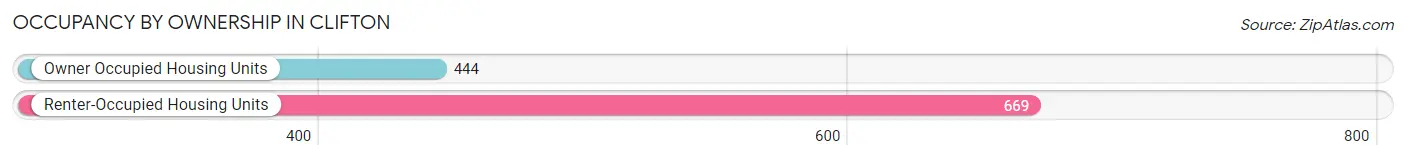
| Occupancy | # Housing Units | % Housing Units |
| Owner Occupied Housing Units | 444 | 39.9% |
| Renter-Occupied Housing Units | 669 | 60.1% |
| Total Occupied Housing Units | 1,113 | 100.0% |
Occupancy by Household Size in Clifton
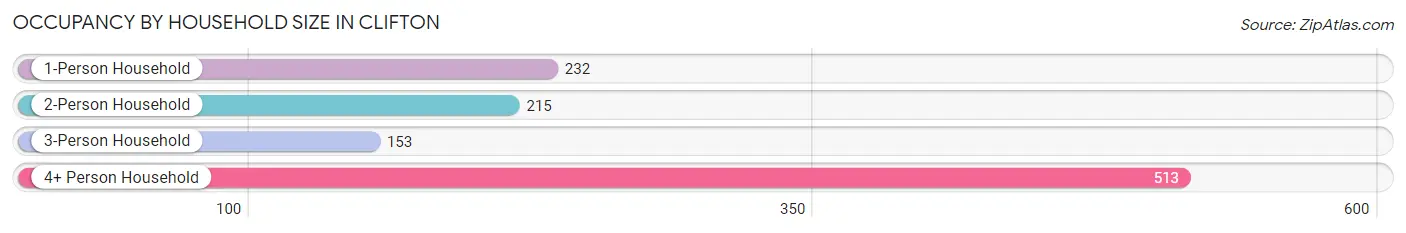
| Household Size | # Housing Units | % Housing Units |
| 1-Person Household | 232 | 20.8% |
| 2-Person Household | 215 | 19.3% |
| 3-Person Household | 153 | 13.8% |
| 4+ Person Household | 513 | 46.1% |
| Total Housing Units | 1,113 | 100.0% |
Occupancy by Ownership by Household Size in Clifton
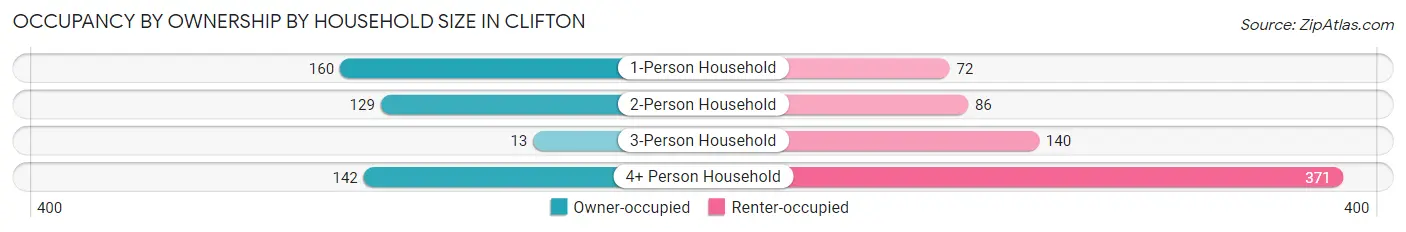
| Household Size | Owner-occupied | Renter-occupied |
| 1-Person Household | 160 (69.0%) | 72 (31.0%) |
| 2-Person Household | 129 (60.0%) | 86 (40.0%) |
| 3-Person Household | 13 (8.5%) | 140 (91.5%) |
| 4+ Person Household | 142 (27.7%) | 371 (72.3%) |
| Total Housing Units | 444 (39.9%) | 669 (60.1%) |
Occupancy by Educational Attainment in Clifton
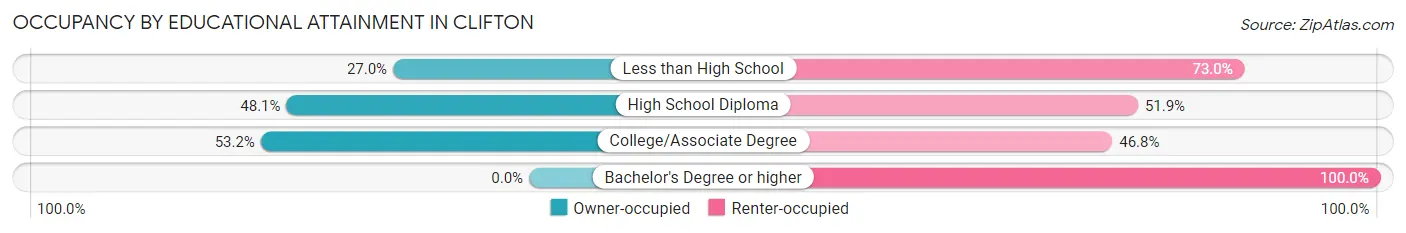
| Household Size | Owner-occupied | Renter-occupied |
| Less than High School | 41 (27.0%) | 111 (73.0%) |
| High School Diploma | 253 (48.1%) | 273 (51.9%) |
| College/Associate Degree | 150 (53.2%) | 132 (46.8%) |
| Bachelor's Degree or higher | 0 (0.0%) | 153 (100.0%) |
Occupancy by Age of Householder in Clifton
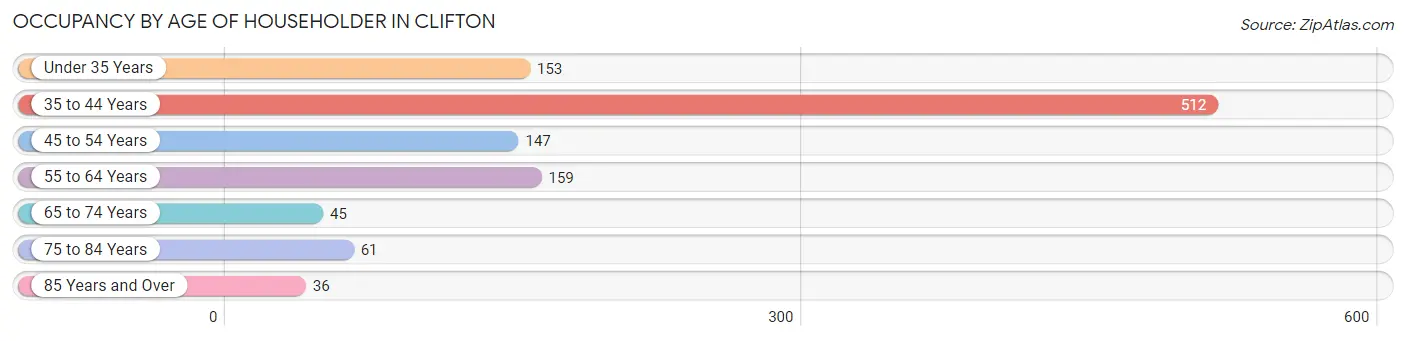
| Age Bracket | # Households | % Households |
| Under 35 Years | 153 | 13.8% |
| 35 to 44 Years | 512 | 46.0% |
| 45 to 54 Years | 147 | 13.2% |
| 55 to 64 Years | 159 | 14.3% |
| 65 to 74 Years | 45 | 4.0% |
| 75 to 84 Years | 61 | 5.5% |
| 85 Years and Over | 36 | 3.2% |
| Total | 1,113 | 100.0% |
Housing Finances in Clifton
Median Income by Occupancy in Clifton
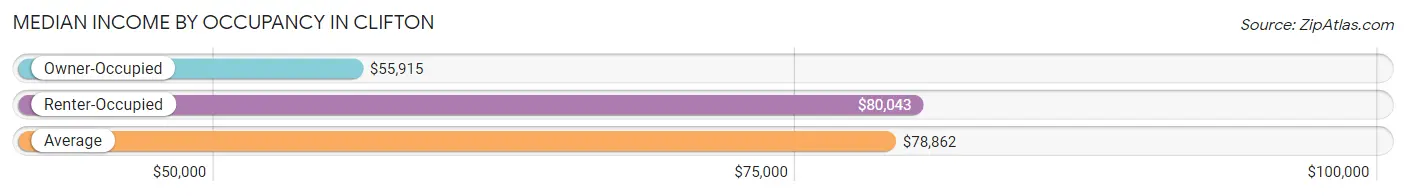
| Occupancy Type | # Households | Median Income |
| Owner-Occupied | 444 (39.9%) | $55,915 |
| Renter-Occupied | 669 (60.1%) | $80,043 |
| Average | 1,113 (100.0%) | $78,862 |
Occupancy by Householder Income Bracket in Clifton
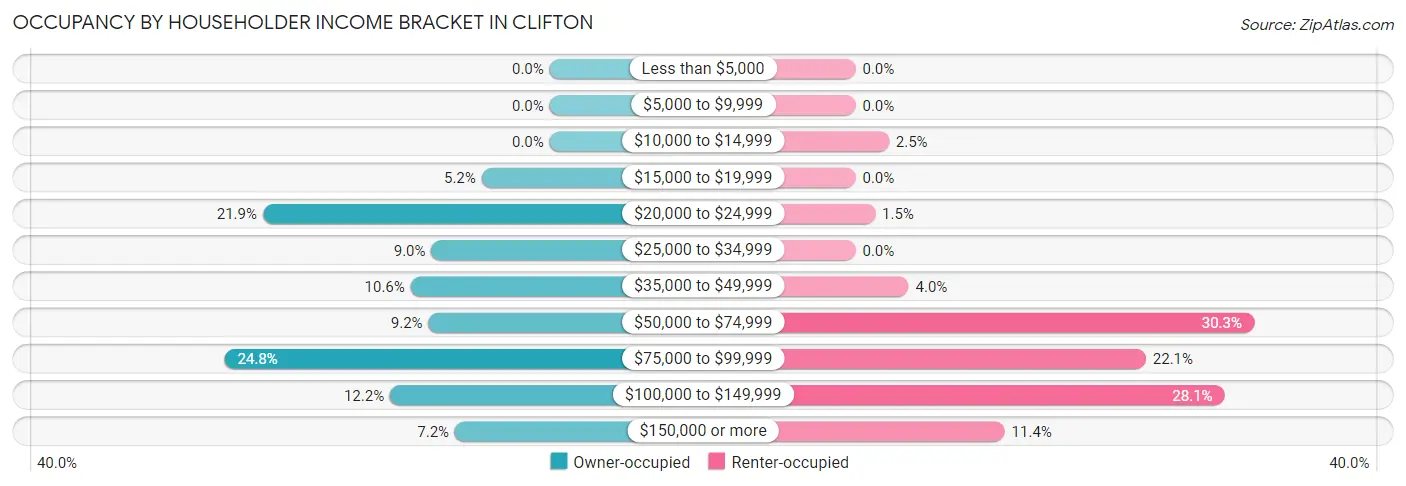
| Income Bracket | Owner-occupied | Renter-occupied |
| Less than $5,000 | 0 (0.0%) | 0 (0.0%) |
| $5,000 to $9,999 | 0 (0.0%) | 0 (0.0%) |
| $10,000 to $14,999 | 0 (0.0%) | 17 (2.5%) |
| $15,000 to $19,999 | 23 (5.2%) | 0 (0.0%) |
| $20,000 to $24,999 | 97 (21.8%) | 10 (1.5%) |
| $25,000 to $34,999 | 40 (9.0%) | 0 (0.0%) |
| $35,000 to $49,999 | 47 (10.6%) | 27 (4.0%) |
| $50,000 to $74,999 | 41 (9.2%) | 203 (30.3%) |
| $75,000 to $99,999 | 110 (24.8%) | 148 (22.1%) |
| $100,000 to $149,999 | 54 (12.2%) | 188 (28.1%) |
| $150,000 or more | 32 (7.2%) | 76 (11.4%) |
| Total | 444 (100.0%) | 669 (100.0%) |
Monthly Housing Cost Tiers in Clifton
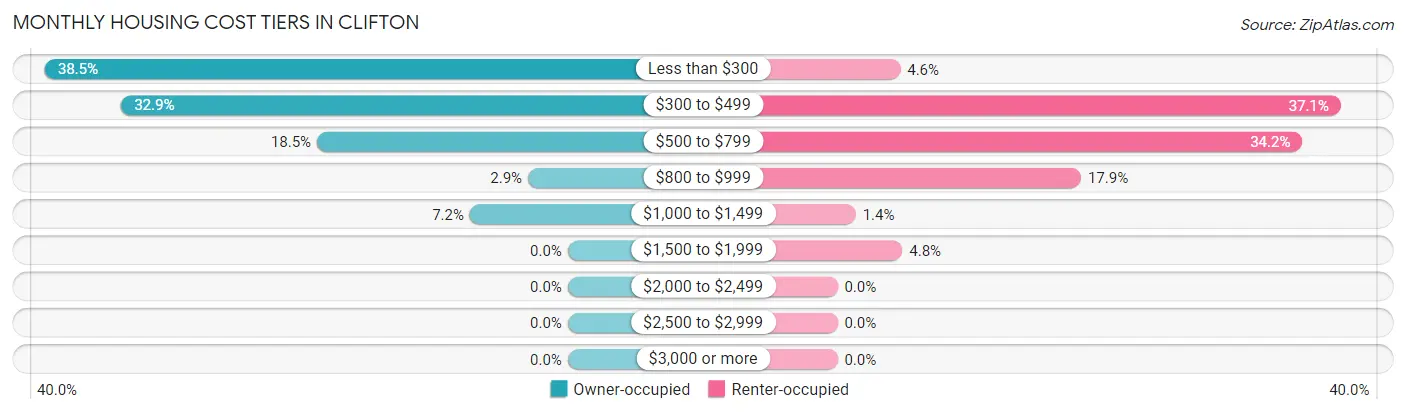
| Monthly Cost | Owner-occupied | Renter-occupied |
| Less than $300 | 171 (38.5%) | 31 (4.6%) |
| $300 to $499 | 146 (32.9%) | 248 (37.1%) |
| $500 to $799 | 82 (18.5%) | 229 (34.2%) |
| $800 to $999 | 13 (2.9%) | 120 (17.9%) |
| $1,000 to $1,499 | 32 (7.2%) | 9 (1.3%) |
| $1,500 to $1,999 | 0 (0.0%) | 32 (4.8%) |
| $2,000 to $2,499 | 0 (0.0%) | 0 (0.0%) |
| $2,500 to $2,999 | 0 (0.0%) | 0 (0.0%) |
| $3,000 or more | 0 (0.0%) | 0 (0.0%) |
| Total | 444 (100.0%) | 669 (100.0%) |
Physical Housing Characteristics in Clifton
Housing Structures in Clifton
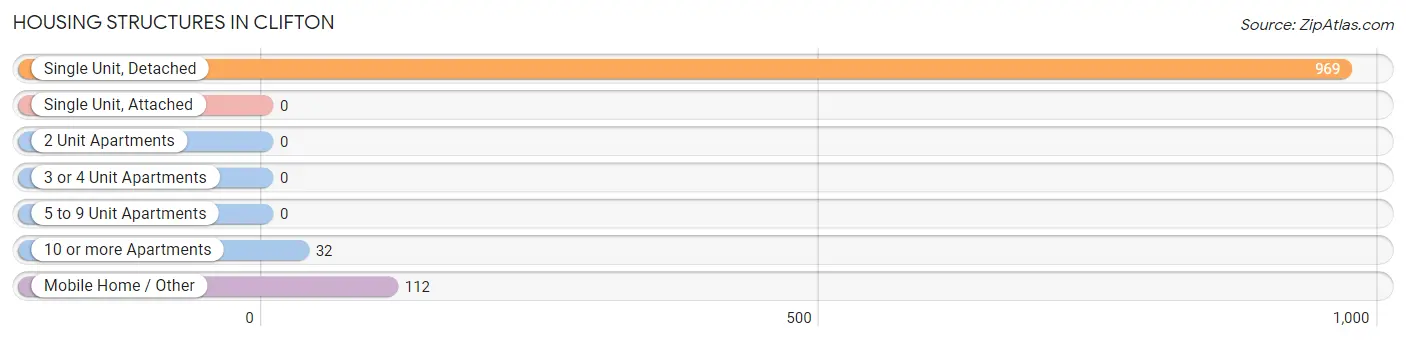
| Structure Type | # Housing Units | % Housing Units |
| Single Unit, Detached | 969 | 87.1% |
| Single Unit, Attached | 0 | 0.0% |
| 2 Unit Apartments | 0 | 0.0% |
| 3 or 4 Unit Apartments | 0 | 0.0% |
| 5 to 9 Unit Apartments | 0 | 0.0% |
| 10 or more Apartments | 32 | 2.9% |
| Mobile Home / Other | 112 | 10.1% |
| Total | 1,113 | 100.0% |
Housing Structures by Occupancy in Clifton
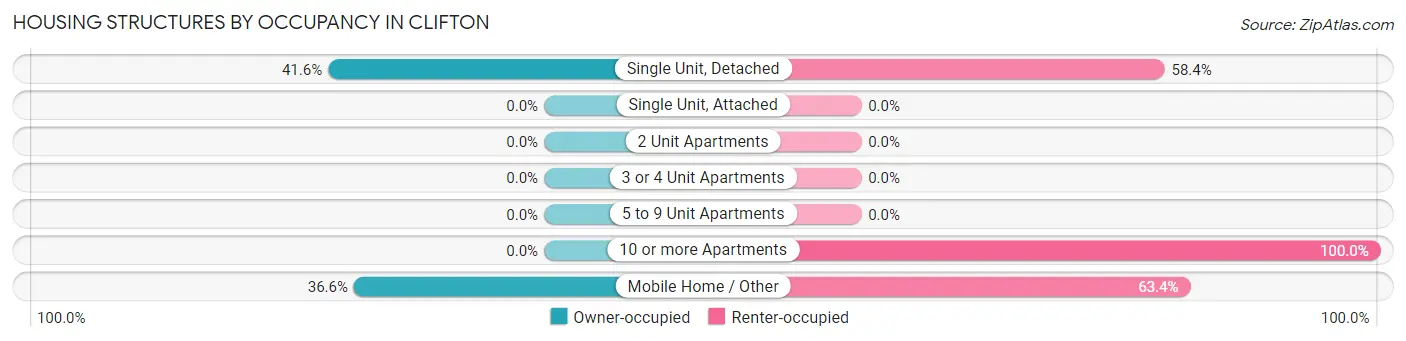
| Structure Type | Owner-occupied | Renter-occupied |
| Single Unit, Detached | 403 (41.6%) | 566 (58.4%) |
| Single Unit, Attached | 0 (0.0%) | 0 (0.0%) |
| 2 Unit Apartments | 0 (0.0%) | 0 (0.0%) |
| 3 or 4 Unit Apartments | 0 (0.0%) | 0 (0.0%) |
| 5 to 9 Unit Apartments | 0 (0.0%) | 0 (0.0%) |
| 10 or more Apartments | 0 (0.0%) | 32 (100.0%) |
| Mobile Home / Other | 41 (36.6%) | 71 (63.4%) |
| Total | 444 (39.9%) | 669 (60.1%) |
Housing Structures by Number of Rooms in Clifton
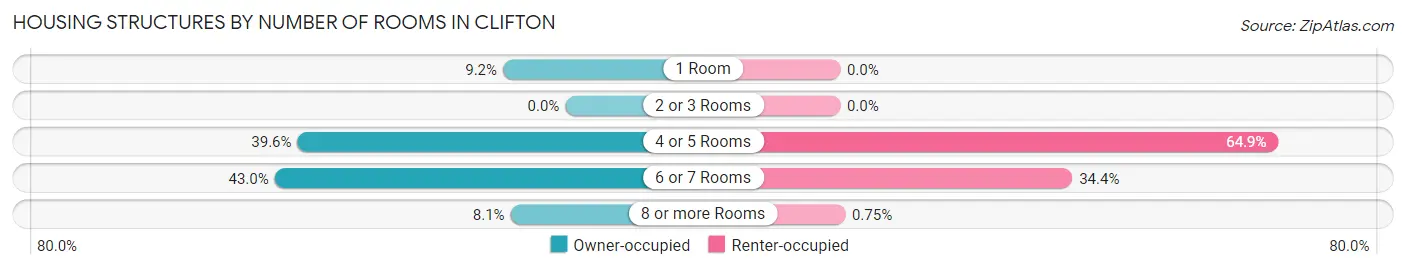
| Number of Rooms | Owner-occupied | Renter-occupied |
| 1 Room | 41 (9.2%) | 0 (0.0%) |
| 2 or 3 Rooms | 0 (0.0%) | 0 (0.0%) |
| 4 or 5 Rooms | 176 (39.6%) | 434 (64.9%) |
| 6 or 7 Rooms | 191 (43.0%) | 230 (34.4%) |
| 8 or more Rooms | 36 (8.1%) | 5 (0.7%) |
| Total | 444 (100.0%) | 669 (100.0%) |
Housing Structure by Heating Type in Clifton
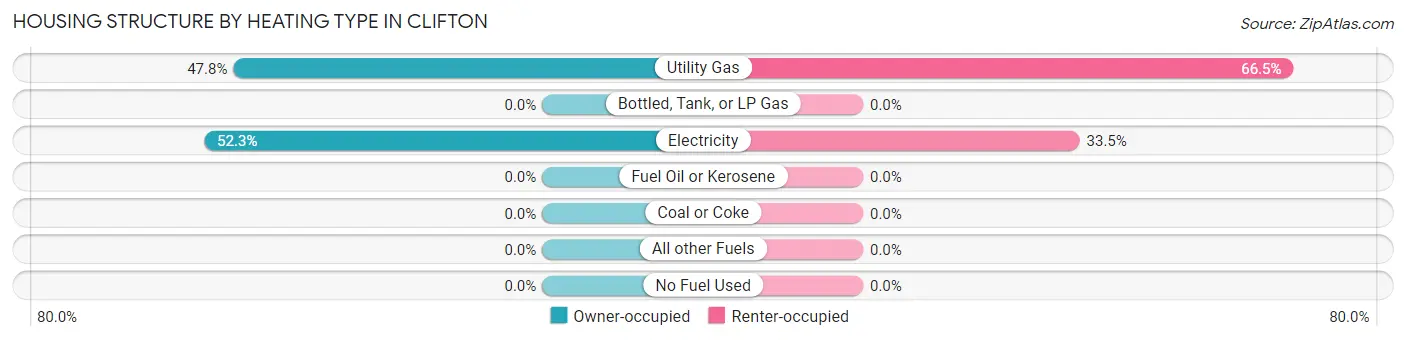
| Heating Type | Owner-occupied | Renter-occupied |
| Utility Gas | 212 (47.7%) | 445 (66.5%) |
| Bottled, Tank, or LP Gas | 0 (0.0%) | 0 (0.0%) |
| Electricity | 232 (52.2%) | 224 (33.5%) |
| Fuel Oil or Kerosene | 0 (0.0%) | 0 (0.0%) |
| Coal or Coke | 0 (0.0%) | 0 (0.0%) |
| All other Fuels | 0 (0.0%) | 0 (0.0%) |
| No Fuel Used | 0 (0.0%) | 0 (0.0%) |
| Total | 444 (100.0%) | 669 (100.0%) |
Household Vehicle Usage in Clifton
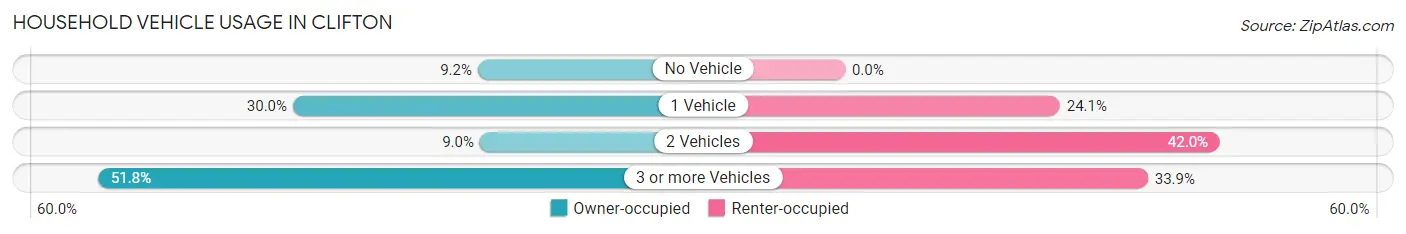
| Vehicles per Household | Owner-occupied | Renter-occupied |
| No Vehicle | 41 (9.2%) | 0 (0.0%) |
| 1 Vehicle | 133 (29.9%) | 161 (24.1%) |
| 2 Vehicles | 40 (9.0%) | 281 (42.0%) |
| 3 or more Vehicles | 230 (51.8%) | 227 (33.9%) |
| Total | 444 (100.0%) | 669 (100.0%) |
Real Estate & Mortgages in Clifton
Real Estate and Mortgage Overview in Clifton
| Characteristic | Without Mortgage | With Mortgage |
| Housing Units | 294 | 150 |
| Median Property Value | $66,000 | $0 |
| Median Household Income | $85,386 | $32 |
| Monthly Housing Costs | $220 | $0 |
| Real Estate Taxes | $338 | $13 |
Property Value by Mortgage Status in Clifton
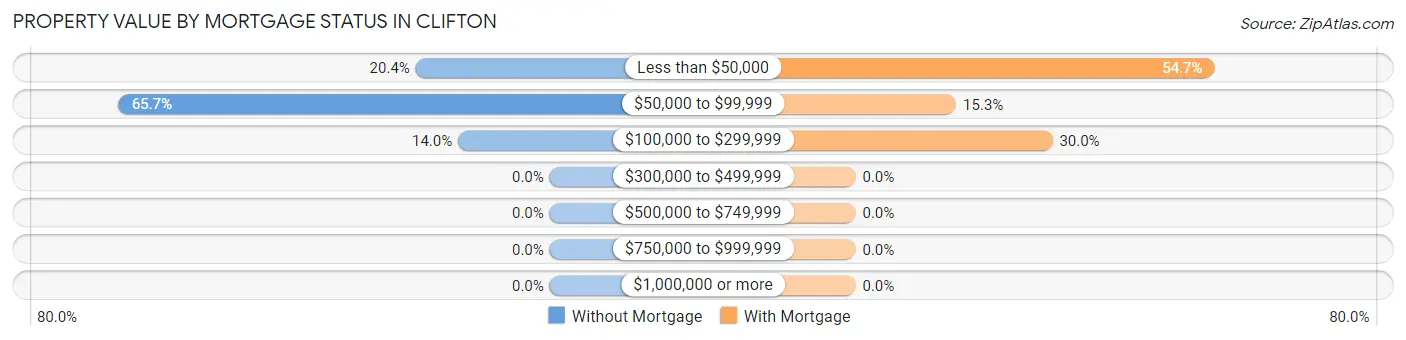
| Property Value | Without Mortgage | With Mortgage |
| Less than $50,000 | 60 (20.4%) | 82 (54.7%) |
| $50,000 to $99,999 | 193 (65.6%) | 23 (15.3%) |
| $100,000 to $299,999 | 41 (14.0%) | 45 (30.0%) |
| $300,000 to $499,999 | 0 (0.0%) | 0 (0.0%) |
| $500,000 to $749,999 | 0 (0.0%) | 0 (0.0%) |
| $750,000 to $999,999 | 0 (0.0%) | 0 (0.0%) |
| $1,000,000 or more | 0 (0.0%) | 0 (0.0%) |
| Total | 294 (100.0%) | 150 (100.0%) |
Household Income by Mortgage Status in Clifton
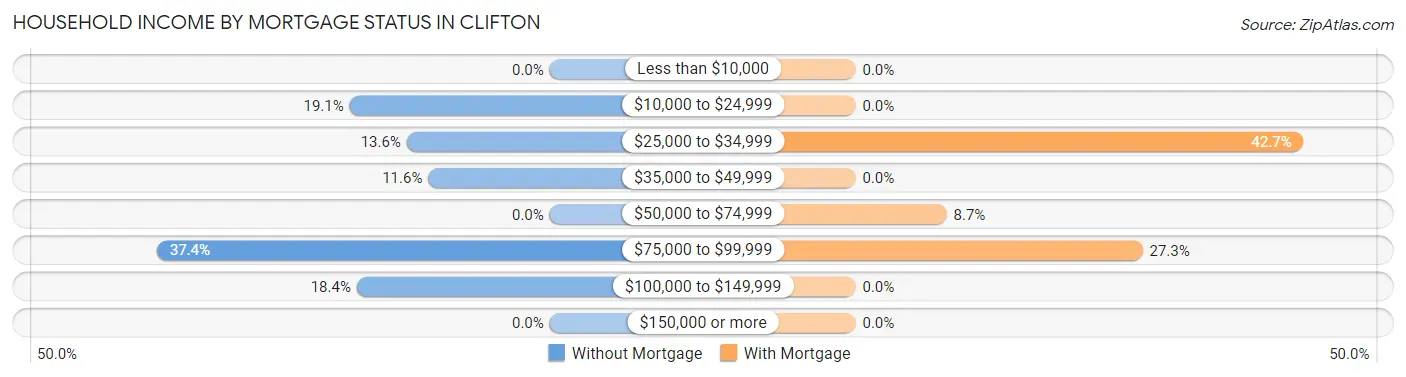
| Household Income | Without Mortgage | With Mortgage |
| Less than $10,000 | 0 (0.0%) | 0 (0.0%) |
| $10,000 to $24,999 | 56 (19.1%) | 0 (0.0%) |
| $25,000 to $34,999 | 40 (13.6%) | 64 (42.7%) |
| $35,000 to $49,999 | 34 (11.6%) | 0 (0.0%) |
| $50,000 to $74,999 | 0 (0.0%) | 13 (8.7%) |
| $75,000 to $99,999 | 110 (37.4%) | 41 (27.3%) |
| $100,000 to $149,999 | 54 (18.4%) | 0 (0.0%) |
| $150,000 or more | 0 (0.0%) | 0 (0.0%) |
| Total | 294 (100.0%) | 150 (100.0%) |
Property Value to Household Income Ratio in Clifton
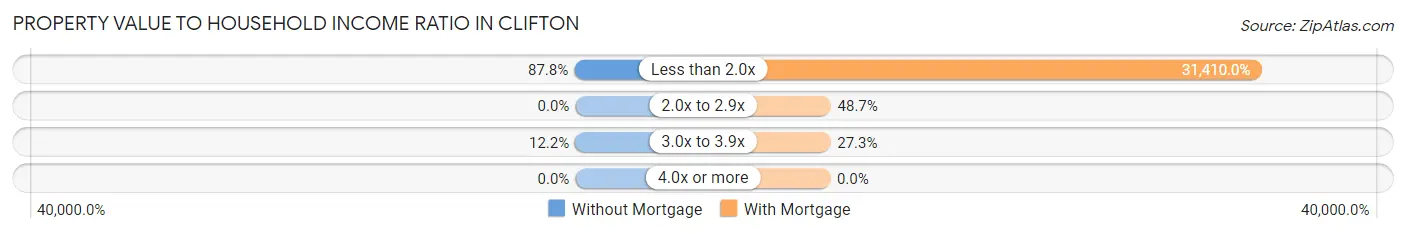
| Value-to-Income Ratio | Without Mortgage | With Mortgage |
| Less than 2.0x | 258 (87.8%) | 47,115 (31,410.0%) |
| 2.0x to 2.9x | 0 (0.0%) | 73 (48.7%) |
| 3.0x to 3.9x | 36 (12.2%) | 41 (27.3%) |
| 4.0x or more | 0 (0.0%) | 0 (0.0%) |
| Total | 294 (100.0%) | 150 (100.0%) |
Real Estate Taxes by Mortgage Status in Clifton
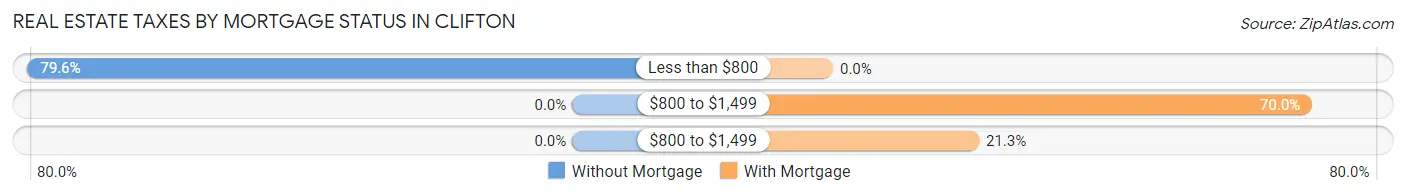
| Property Taxes | Without Mortgage | With Mortgage |
| Less than $800 | 234 (79.6%) | 0 (0.0%) |
| $800 to $1,499 | 0 (0.0%) | 105 (70.0%) |
| $800 to $1,499 | 0 (0.0%) | 32 (21.3%) |
| Total | 294 (100.0%) | 150 (100.0%) |
Health & Disability in Clifton
Health Insurance Coverage by Age in Clifton
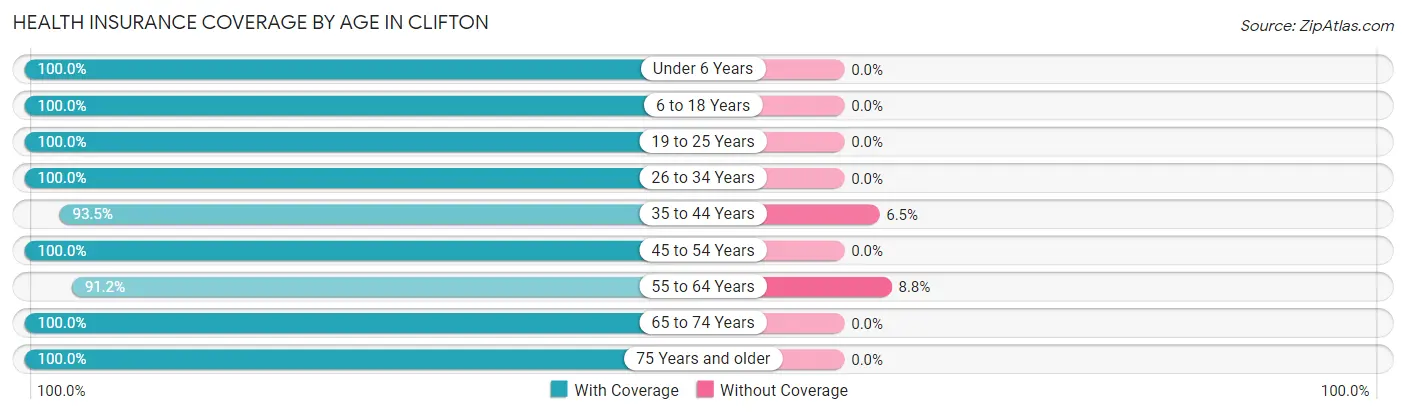
| Age Bracket | With Coverage | Without Coverage |
| Under 6 Years | 268 (100.0%) | 0 (0.0%) |
| 6 to 18 Years | 1,148 (100.0%) | 0 (0.0%) |
| 19 to 25 Years | 516 (100.0%) | 0 (0.0%) |
| 26 to 34 Years | 343 (100.0%) | 0 (0.0%) |
| 35 to 44 Years | 803 (93.5%) | 56 (6.5%) |
| 45 to 54 Years | 175 (100.0%) | 0 (0.0%) |
| 55 to 64 Years | 238 (91.2%) | 23 (8.8%) |
| 65 to 74 Years | 146 (100.0%) | 0 (0.0%) |
| 75 Years and older | 116 (100.0%) | 0 (0.0%) |
| Total | 3,753 (97.9%) | 79 (2.1%) |
Health Insurance Coverage by Citizenship Status in Clifton
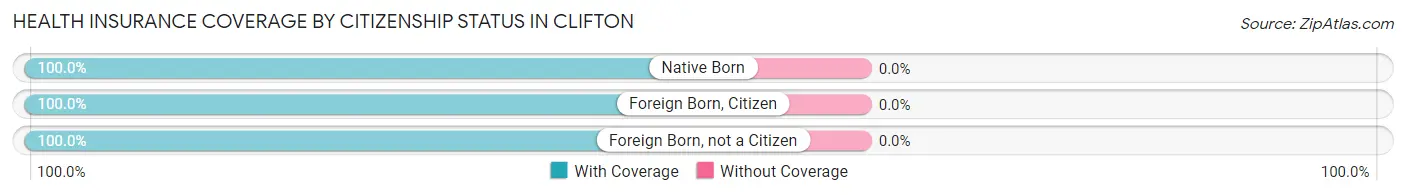
| Citizenship Status | With Coverage | Without Coverage |
| Native Born | 268 (100.0%) | 0 (0.0%) |
| Foreign Born, Citizen | 1,148 (100.0%) | 0 (0.0%) |
| Foreign Born, not a Citizen | 516 (100.0%) | 0 (0.0%) |
Health Insurance Coverage by Household Income in Clifton
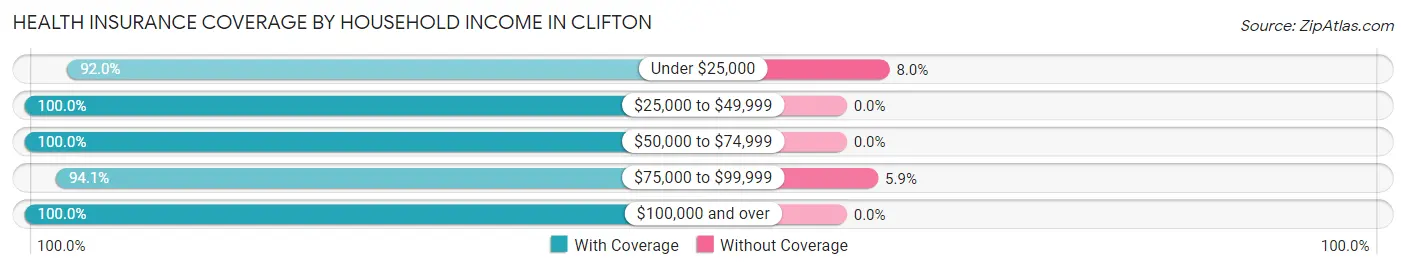
| Household Income | With Coverage | Without Coverage |
| Under $25,000 | 265 (92.0%) | 23 (8.0%) |
| $25,000 to $49,999 | 330 (100.0%) | 0 (0.0%) |
| $50,000 to $74,999 | 648 (100.0%) | 0 (0.0%) |
| $75,000 to $99,999 | 897 (94.1%) | 56 (5.9%) |
| $100,000 and over | 1,613 (100.0%) | 0 (0.0%) |
Public vs Private Health Insurance Coverage by Age in Clifton
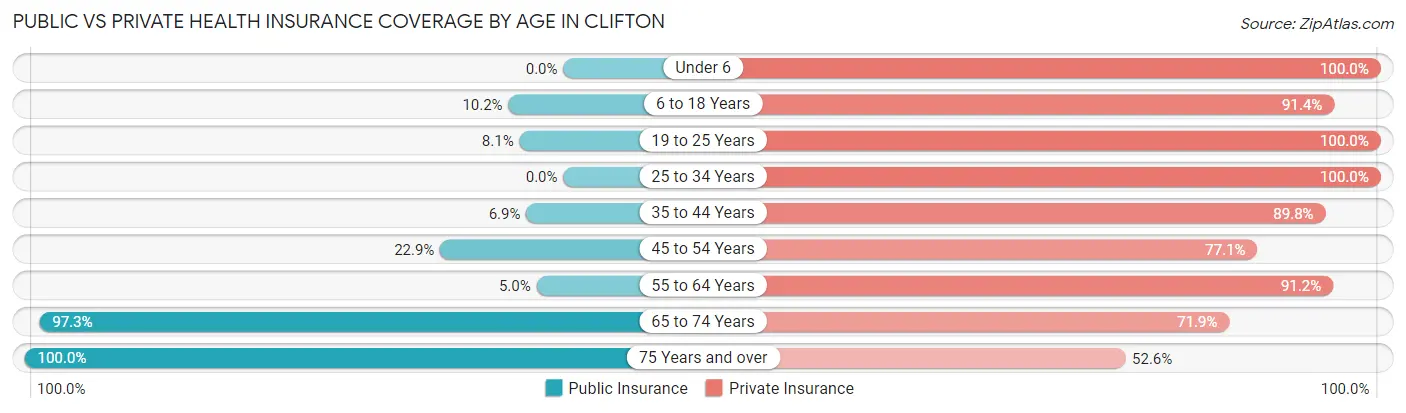
| Age Bracket | Public Insurance | Private Insurance |
| Under 6 | 0 (0.0%) | 268 (100.0%) |
| 6 to 18 Years | 117 (10.2%) | 1,049 (91.4%) |
| 19 to 25 Years | 42 (8.1%) | 516 (100.0%) |
| 25 to 34 Years | 0 (0.0%) | 343 (100.0%) |
| 35 to 44 Years | 59 (6.9%) | 771 (89.8%) |
| 45 to 54 Years | 40 (22.9%) | 135 (77.1%) |
| 55 to 64 Years | 13 (5.0%) | 238 (91.2%) |
| 65 to 74 Years | 142 (97.3%) | 105 (71.9%) |
| 75 Years and over | 116 (100.0%) | 61 (52.6%) |
| Total | 529 (13.8%) | 3,486 (91.0%) |
Disability Status by Sex by Age in Clifton
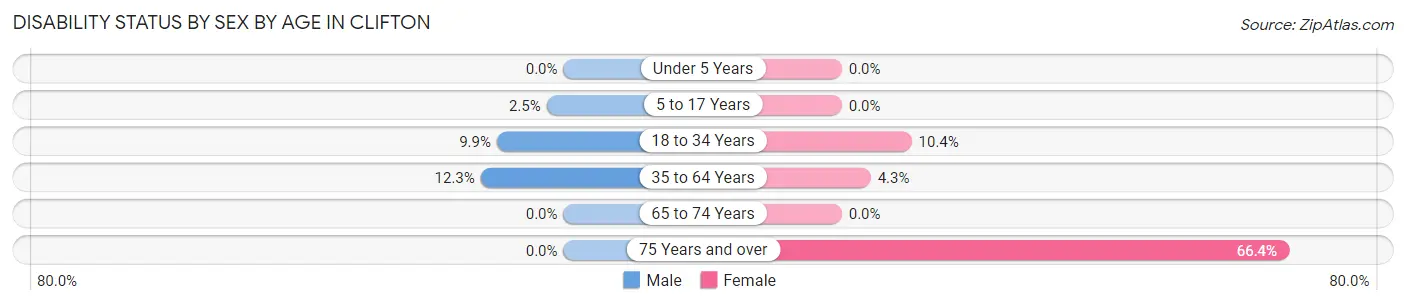
| Age Bracket | Male | Female |
| Under 5 Years | 0 (0.0%) | 0 (0.0%) |
| 5 to 17 Years | 18 (2.5%) | 0 (0.0%) |
| 18 to 34 Years | 42 (9.9%) | 50 (10.4%) |
| 35 to 64 Years | 82 (12.3%) | 27 (4.3%) |
| 65 to 74 Years | 0 (0.0%) | 0 (0.0%) |
| 75 Years and over | 0 (0.0%) | 77 (66.4%) |
Disability Class by Sex by Age in Clifton
Disability Class: Hearing Difficulty
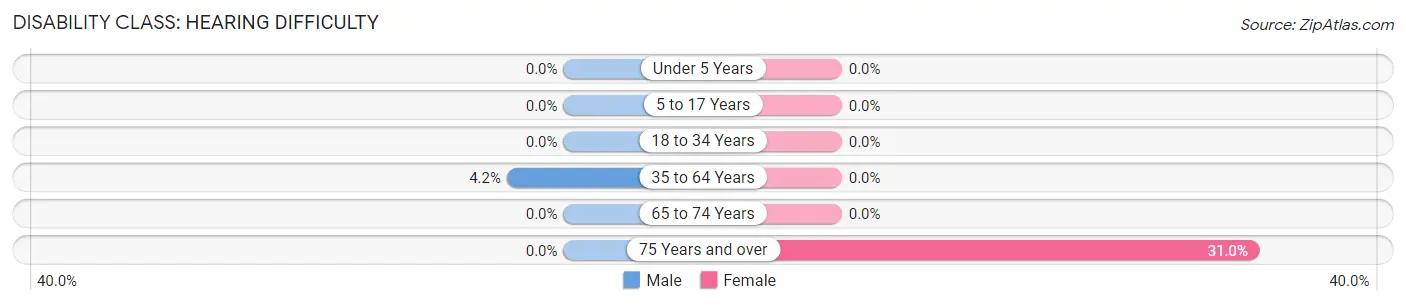
| Age Bracket | Male | Female |
| Under 5 Years | 0 (0.0%) | 0 (0.0%) |
| 5 to 17 Years | 0 (0.0%) | 0 (0.0%) |
| 18 to 34 Years | 0 (0.0%) | 0 (0.0%) |
| 35 to 64 Years | 28 (4.2%) | 0 (0.0%) |
| 65 to 74 Years | 0 (0.0%) | 0 (0.0%) |
| 75 Years and over | 0 (0.0%) | 36 (31.0%) |
Disability Class: Vision Difficulty
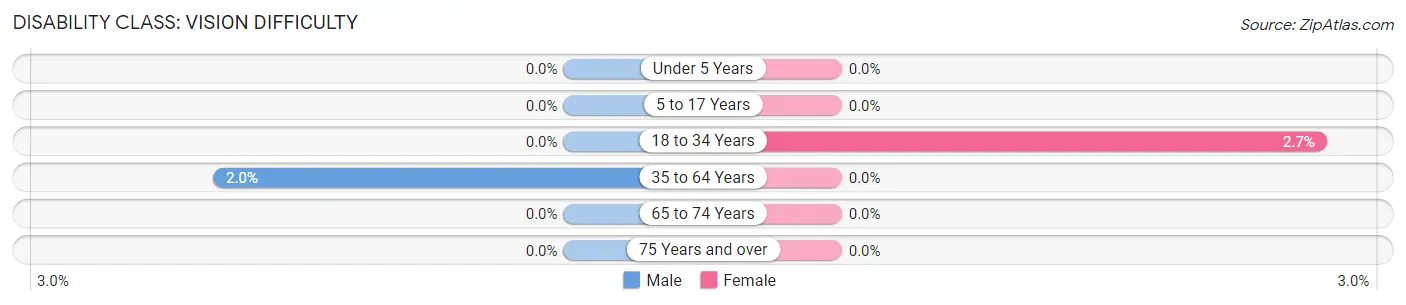
| Age Bracket | Male | Female |
| Under 5 Years | 0 (0.0%) | 0 (0.0%) |
| 5 to 17 Years | 0 (0.0%) | 0 (0.0%) |
| 18 to 34 Years | 0 (0.0%) | 13 (2.7%) |
| 35 to 64 Years | 13 (1.9%) | 0 (0.0%) |
| 65 to 74 Years | 0 (0.0%) | 0 (0.0%) |
| 75 Years and over | 0 (0.0%) | 0 (0.0%) |
Disability Class: Cognitive Difficulty
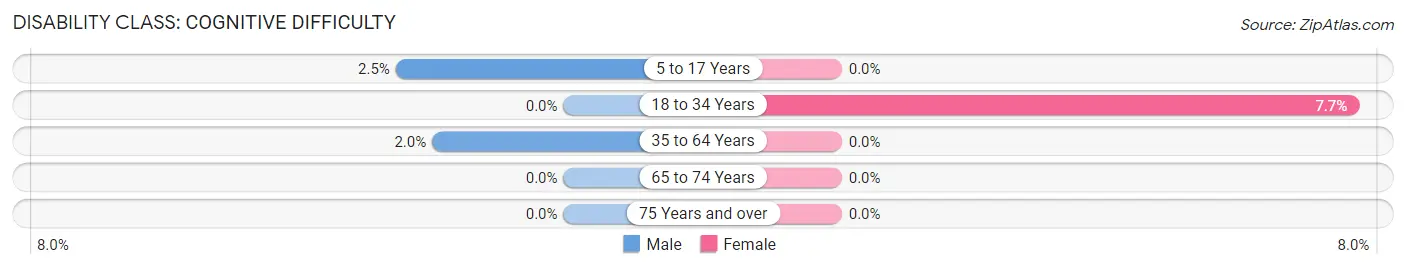
| Age Bracket | Male | Female |
| 5 to 17 Years | 18 (2.5%) | 0 (0.0%) |
| 18 to 34 Years | 0 (0.0%) | 37 (7.7%) |
| 35 to 64 Years | 13 (1.9%) | 0 (0.0%) |
| 65 to 74 Years | 0 (0.0%) | 0 (0.0%) |
| 75 Years and over | 0 (0.0%) | 0 (0.0%) |
Disability Class: Ambulatory Difficulty
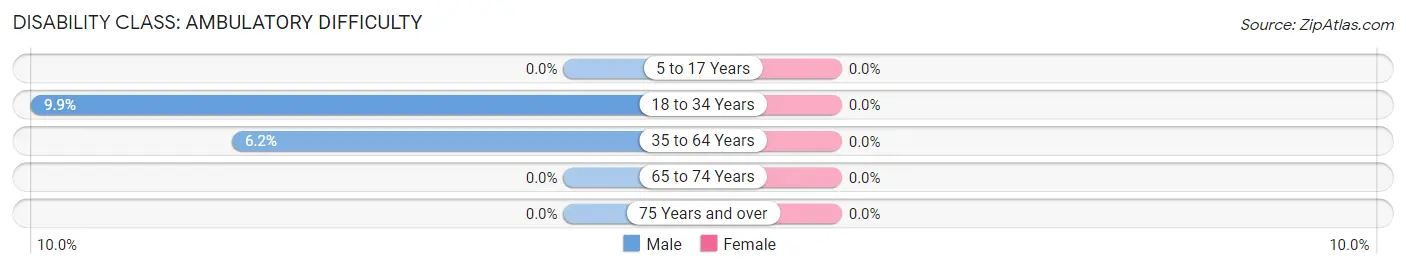
| Age Bracket | Male | Female |
| 5 to 17 Years | 0 (0.0%) | 0 (0.0%) |
| 18 to 34 Years | 42 (9.9%) | 0 (0.0%) |
| 35 to 64 Years | 41 (6.1%) | 0 (0.0%) |
| 65 to 74 Years | 0 (0.0%) | 0 (0.0%) |
| 75 Years and over | 0 (0.0%) | 0 (0.0%) |
Disability Class: Self-Care Difficulty
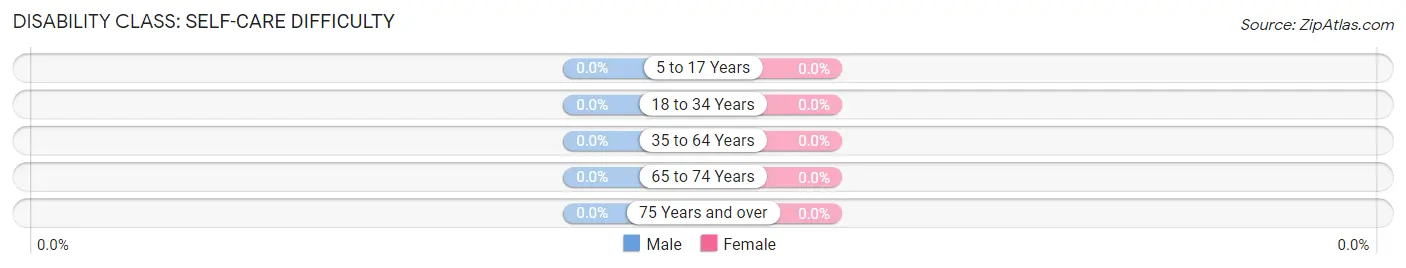
| Age Bracket | Male | Female |
| 5 to 17 Years | 0 (0.0%) | 0 (0.0%) |
| 18 to 34 Years | 0 (0.0%) | 0 (0.0%) |
| 35 to 64 Years | 0 (0.0%) | 0 (0.0%) |
| 65 to 74 Years | 0 (0.0%) | 0 (0.0%) |
| 75 Years and over | 0 (0.0%) | 0 (0.0%) |
Technology Access in Clifton
Computing Device Access in Clifton
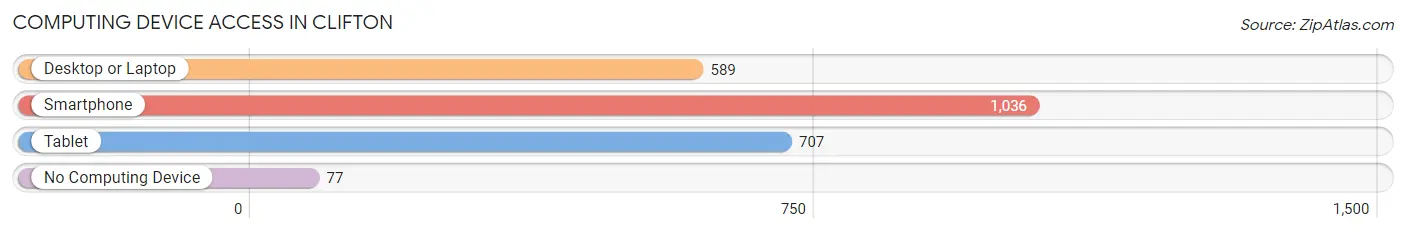
| Device Type | # Households | % Households |
| Desktop or Laptop | 589 | 52.9% |
| Smartphone | 1,036 | 93.1% |
| Tablet | 707 | 63.5% |
| No Computing Device | 77 | 6.9% |
| Total | 1,113 | 100.0% |
Internet Access in Clifton
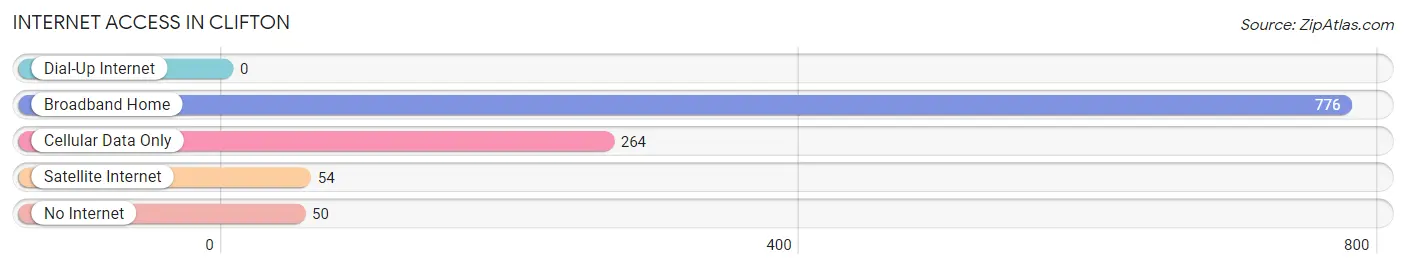
| Internet Type | # Households | % Households |
| Dial-Up Internet | 0 | 0.0% |
| Broadband Home | 776 | 69.7% |
| Cellular Data Only | 264 | 23.7% |
| Satellite Internet | 54 | 4.9% |
| No Internet | 50 | 4.5% |
| Total | 1,113 | 100.0% |
Clifton Summary
Clifton, Arizona is a small town located in Greenlee County, Arizona. It is situated in the Gila River Valley, near the New Mexico border. The town was founded in 1873 and is the oldest continuously inhabited settlement in the state. The population of Clifton was 2,837 in the 2010 census.
History
Clifton was founded in 1873 by a group of settlers from the nearby town of Morenci. The settlers were looking for a place to settle and start a new life. The town was named after the nearby Clifton Mine, which was discovered in 1872. The mine was a major source of copper ore for the area.
The town quickly grew and by 1876, it had a population of over 500 people. The town was incorporated in 1881 and the first mayor was elected in 1882.
In the late 1800s, Clifton was a major hub for the copper mining industry. The town was home to several large copper mines, including the Clifton Mine, the Morenci Mine, and the Metcalf Mine. The copper industry was the main source of income for the town and its residents.
In the early 1900s, the copper industry began to decline and the town's population began to decline as well. The town was hit hard by the Great Depression and many of the mines closed. The town's population dropped to just over 1,000 by 1940.
In the 1950s, the town began to experience a resurgence. The copper industry began to pick up again and the town's population began to grow. The town was also home to several large cattle ranches and the local economy began to diversify.
Geography
Clifton is located in the Gila River Valley, near the New Mexico border. The town is situated at an elevation of 4,400 feet and is surrounded by mountains. The town is located in a semi-arid climate and receives an average of 10 inches of precipitation per year.
The town is located near several national parks and monuments, including the Coronado National Forest, the Gila National Forest, and the Chiricahua National Monument.
Economy
The economy of Clifton is largely based on the copper mining industry. The town is home to several large copper mines, including the Clifton Mine, the Morenci Mine, and the Metcalf Mine. The copper industry is the main source of income for the town and its residents.
In addition to the copper industry, the town is also home to several large cattle ranches. The local economy is also supported by tourism, as the town is located near several national parks and monuments.
Demographics
As of the 2010 census, the population of Clifton was 2,837. The racial makeup of the town was 75.3% White, 0.7% African American, 0.9% Native American, 0.2% Asian, 0.1% Pacific Islander, 19.3% from other races, and 3.5% from two or more races. Hispanic or Latino of any race were 37.2% of the population.
The median household income in Clifton was $31,250 and the median family income was $35,417. The per capita income was $14,945. About 18.2% of the population was below the poverty line.
Common Questions
What is Per Capita Income in Clifton?
Per Capita income in Clifton is $26,367.
What is the Median Family Income in Clifton?
Median Family Income in Clifton is $85,331.
What is the Median Household income in Clifton?
Median Household Income in Clifton is $78,862.
What is Income or Wage Gap in Clifton?
Income or Wage Gap in Clifton is 52.8%.
Women in Clifton earn 47.2 cents for every dollar earned by a man.
What is Inequality or Gini Index in Clifton?
Inequality or Gini Index in Clifton is 0.35.
What is the Total Population of Clifton?
Total Population of Clifton is 3,869.
What is the Total Male Population of Clifton?
Total Male Population of Clifton is 2,000.
What is the Total Female Population of Clifton?
Total Female Population of Clifton is 1,869.
What is the Ratio of Males per 100 Females in Clifton?
There are 107.01 Males per 100 Females in Clifton.
What is the Ratio of Females per 100 Males in Clifton?
There are 93.45 Females per 100 Males in Clifton.
What is the Median Population Age in Clifton?
Median Population Age in Clifton is 25.9 Years.
What is the Average Family Size in Clifton
Average Family Size in Clifton is 4.1 People.
What is the Average Household Size in Clifton
Average Household Size in Clifton is 3.4 People.
How Large is the Labor Force in Clifton?
There are 1,820 People in the Labor Forcein in Clifton.
What is the Percentage of People in the Labor Force in Clifton?
68.2% of People are in the Labor Force in Clifton.
What is the Unemployment Rate in Clifton?
Unemployment Rate in Clifton is 1.2%.