Cameron, AZ Map & Demographics
Cameron Map
Cameron Overview
$18,910
PER CAPITA INCOME
$47,054
AVG FAMILY INCOME
$38,750
AVG HOUSEHOLD INCOME
17.7%
WAGE / INCOME GAP [ % ]
82.3¢/ $1
WAGE / INCOME GAP [ $ ]
0.49
INEQUALITY / GINI INDEX
780
TOTAL POPULATION
386
MALE POPULATION
394
FEMALE POPULATION
97.97
MALES / 100 FEMALES
102.07
FEMALES / 100 MALES
39.3
MEDIAN AGE
3.6
AVG FAMILY SIZE
3.1
AVG HOUSEHOLD SIZE
346
LABOR FORCE [ PEOPLE ]
52.8%
PERCENT IN LABOR FORCE
18.8%
UNEMPLOYMENT RATE
Cameron Zip Codes
Cameron Area Codes
Income in Cameron
Income Overview in Cameron
Per Capita Income in Cameron is $18,910, while median incomes of families and households are $47,054 and $38,750 respectively.
| Characteristic | Number | Measure |
| Per Capita Income | 780 | $18,910 |
| Median Family Income | 175 | $47,054 |
| Mean Family Income | 175 | $63,036 |
| Median Household Income | 249 | $38,750 |
| Mean Household Income | 249 | $52,976 |
| Income Deficit | 175 | $0 |
| Wage / Income Gap (%) | 780 | 17.73% |
| Wage / Income Gap ($) | 780 | 82.27¢ per $1 |
| Gini / Inequality Index | 780 | 0.49 |
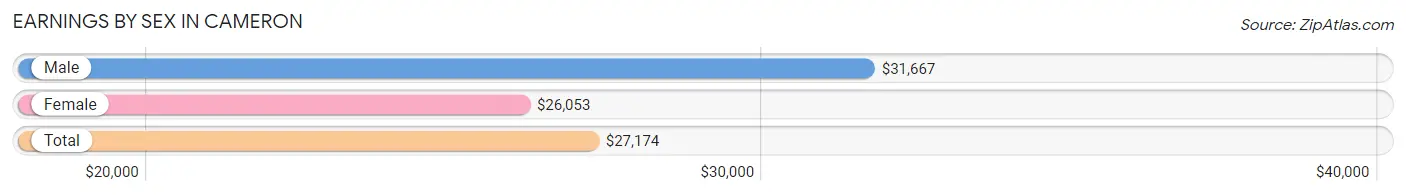
Earnings by Sex in Cameron
Average Earnings in Cameron are $27,174, $31,667 for men and $26,053 for women, a difference of 17.7%.
| Sex | Number | Average Earnings |
| Male | 156 (48.4%) | $31,667 |
| Female | 166 (51.5%) | $26,053 |
| Total | 322 (100.0%) | $27,174 |
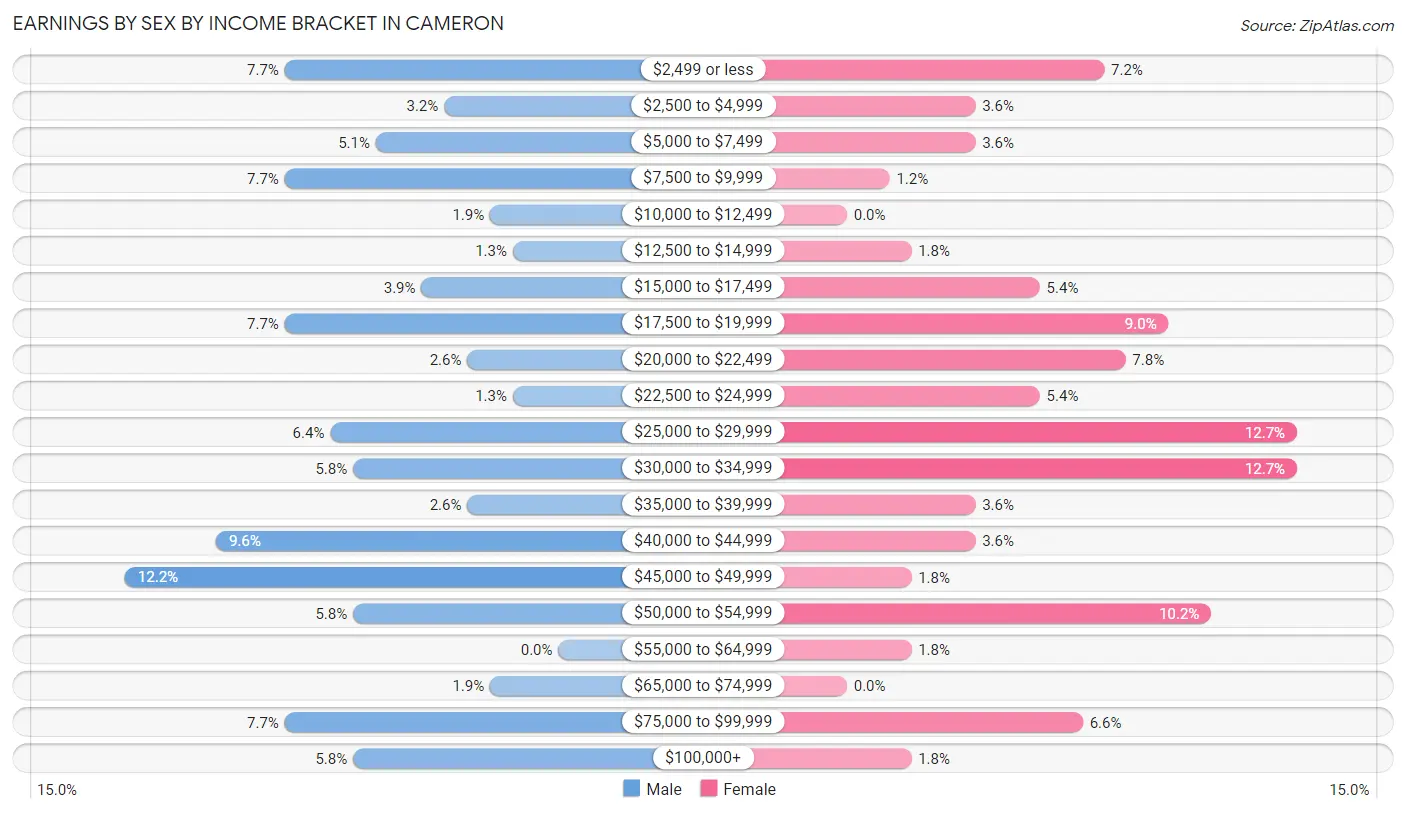
Earnings by Sex by Income Bracket in Cameron
The most common earnings brackets in Cameron are $45,000 to $49,999 for men (19 | 12.2%) and $25,000 to $29,999 for women (21 | 12.7%).
| Income | Male | Female |
| $2,499 or less | 12 (7.7%) | 12 (7.2%) |
| $2,500 to $4,999 | 5 (3.2%) | 6 (3.6%) |
| $5,000 to $7,499 | 8 (5.1%) | 6 (3.6%) |
| $7,500 to $9,999 | 12 (7.7%) | 2 (1.2%) |
| $10,000 to $12,499 | 3 (1.9%) | 0 (0.0%) |
| $12,500 to $14,999 | 2 (1.3%) | 3 (1.8%) |
| $15,000 to $17,499 | 6 (3.8%) | 9 (5.4%) |
| $17,500 to $19,999 | 12 (7.7%) | 15 (9.0%) |
| $20,000 to $22,499 | 4 (2.6%) | 13 (7.8%) |
| $22,500 to $24,999 | 2 (1.3%) | 9 (5.4%) |
| $25,000 to $29,999 | 10 (6.4%) | 21 (12.7%) |
| $30,000 to $34,999 | 9 (5.8%) | 21 (12.7%) |
| $35,000 to $39,999 | 4 (2.6%) | 6 (3.6%) |
| $40,000 to $44,999 | 15 (9.6%) | 6 (3.6%) |
| $45,000 to $49,999 | 19 (12.2%) | 3 (1.8%) |
| $50,000 to $54,999 | 9 (5.8%) | 17 (10.2%) |
| $55,000 to $64,999 | 0 (0.0%) | 3 (1.8%) |
| $65,000 to $74,999 | 3 (1.9%) | 0 (0.0%) |
| $75,000 to $99,999 | 12 (7.7%) | 11 (6.6%) |
| $100,000+ | 9 (5.8%) | 3 (1.8%) |
| Total | 156 (100.0%) | 166 (100.0%) |
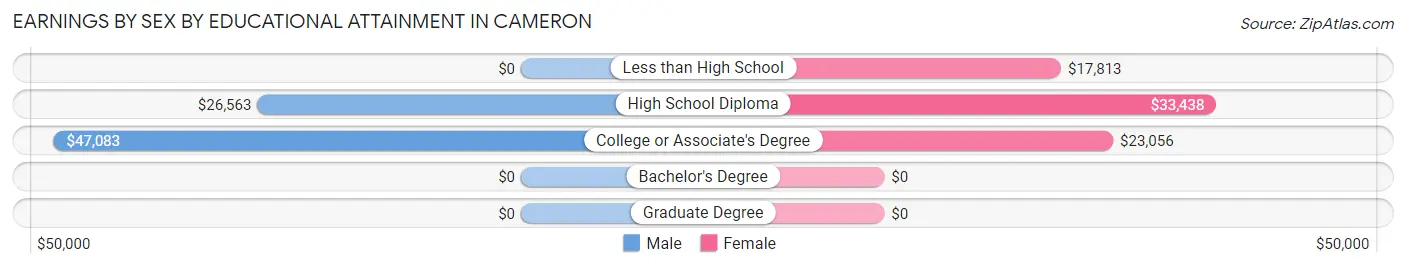
Earnings by Sex by Educational Attainment in Cameron
Average earnings in Cameron are $32,500 for men and $26,316 for women, a difference of 19.0%. Men with an educational attainment of college or associate's degree enjoy the highest average annual earnings of $47,083, while those with high school diploma education earn the least with $26,563. Women with an educational attainment of high school diploma earn the most with the average annual earnings of $33,438, while those with less than high school education have the smallest earnings of $17,813.
| Educational Attainment | Male Income | Female Income |
| Less than High School | - | - |
| High School Diploma | $26,563 | $33,438 |
| College or Associate's Degree | $47,083 | $23,056 |
| Bachelor's Degree | - | - |
| Graduate Degree | - | - |
| Total | $32,500 | $26,316 |
Family Income in Cameron
Family Income Brackets in Cameron
According to the Cameron family income data, there are 37 families falling into the $35,000 to $49,999 income range, which is the most common income bracket and makes up 21.1% of all families. Conversely, the $150,000 to $199,999 income bracket is the least frequent group with only 4 families (2.3%) belonging to this category.
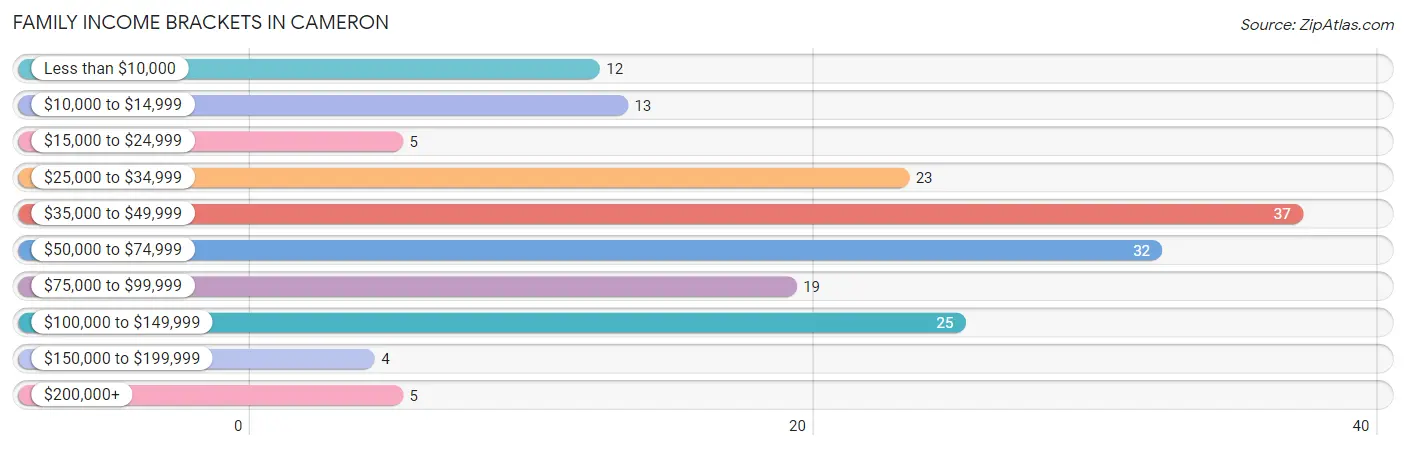
| Income Bracket | # Families | % Families |
| Less than $10,000 | 12 | 6.9% |
| $10,000 to $14,999 | 13 | 7.4% |
| $15,000 to $24,999 | 5 | 2.9% |
| $25,000 to $34,999 | 23 | 13.1% |
| $35,000 to $49,999 | 37 | 21.1% |
| $50,000 to $74,999 | 32 | 18.3% |
| $75,000 to $99,999 | 19 | 10.9% |
| $100,000 to $149,999 | 25 | 14.3% |
| $150,000 to $199,999 | 4 | 2.3% |
| $200,000+ | 5 | 2.9% |
Family Income by Famaliy Size in Cameron
5-person families (22 | 12.6%) account for the highest median family income in Cameron with $81,250 per family, while 2-person families (63 | 36.0%) have the highest median income of $27,292 per family member.
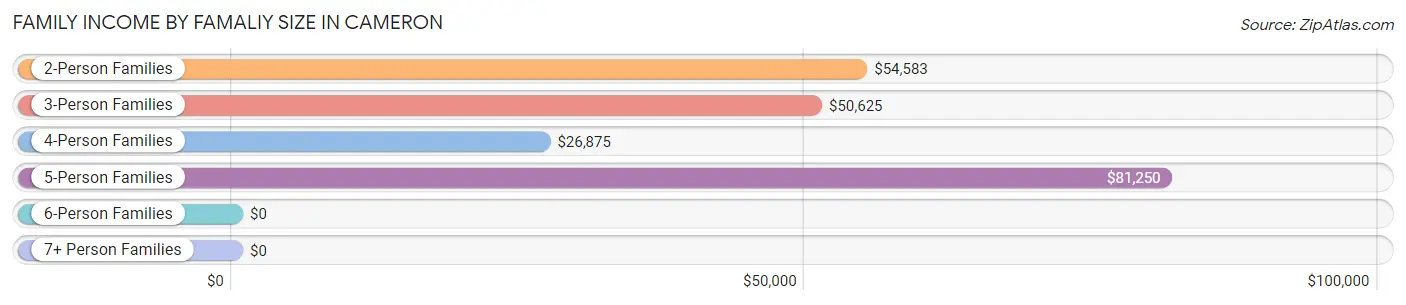
| Income Bracket | # Families | Median Income |
| 2-Person Families | 63 (36.0%) | $54,583 |
| 3-Person Families | 45 (25.7%) | $50,625 |
| 4-Person Families | 37 (21.1%) | $26,875 |
| 5-Person Families | 22 (12.6%) | $81,250 |
| 6-Person Families | 3 (1.7%) | $0 |
| 7+ Person Families | 5 (2.9%) | $0 |
| Total | 175 (100.0%) | $47,054 |
Family Income by Number of Earners in Cameron
The median family income in Cameron is $47,054, with families comprising 3+ earners (19) having the highest median family income of $108,750, while families with no earners (35) have the lowest median family income of $29,375, accounting for 10.9% and 20.0% of families, respectively.
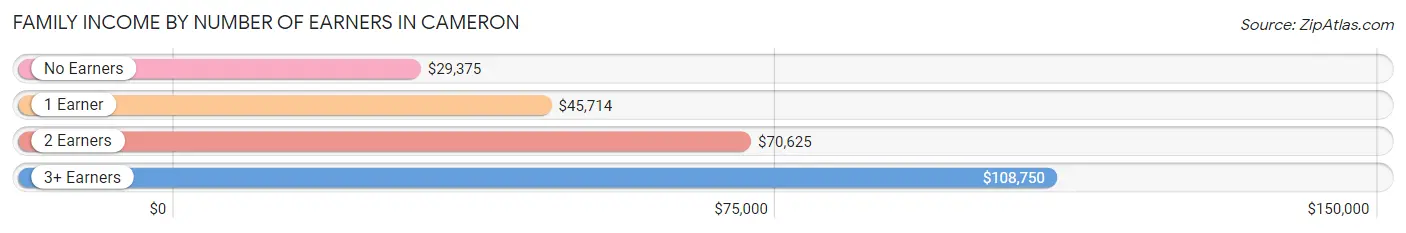
| Number of Earners | # Families | Median Income |
| No Earners | 35 (20.0%) | $29,375 |
| 1 Earner | 80 (45.7%) | $45,714 |
| 2 Earners | 41 (23.4%) | $70,625 |
| 3+ Earners | 19 (10.9%) | $108,750 |
| Total | 175 (100.0%) | $47,054 |
Household Income in Cameron
Household Income Brackets in Cameron
With 35 households falling in the category, the $35,000 to $49,999 income range is the most frequent in Cameron, accounting for 14.1% of all households.
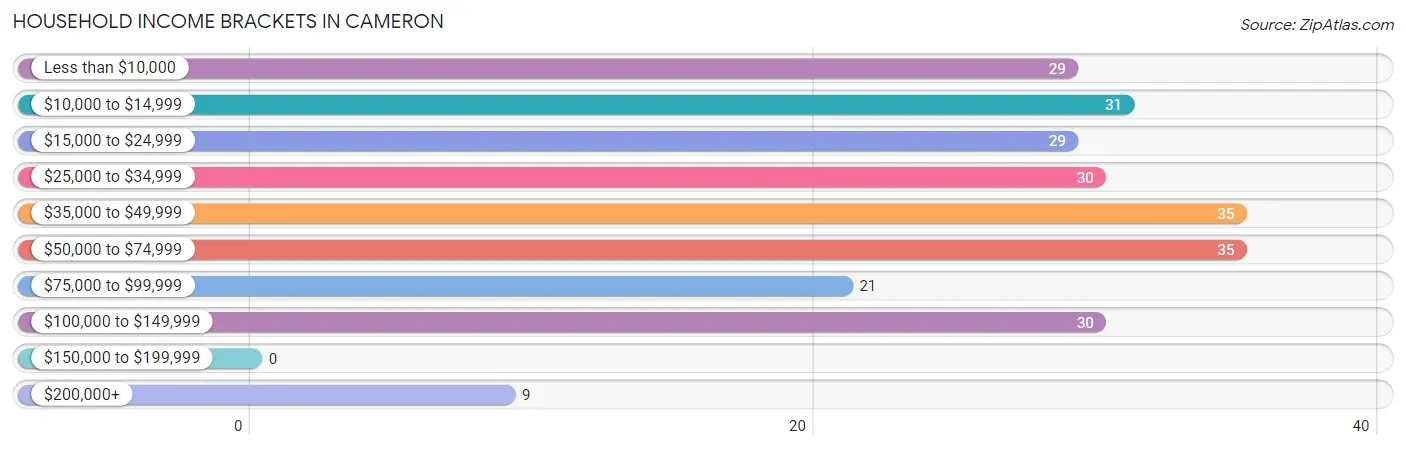
| Income Bracket | # Households | % Households |
| Less than $10,000 | 29 | 11.6% |
| $10,000 to $14,999 | 31 | 12.4% |
| $15,000 to $24,999 | 29 | 11.6% |
| $25,000 to $34,999 | 30 | 12.0% |
| $35,000 to $49,999 | 35 | 14.1% |
| $50,000 to $74,999 | 35 | 14.1% |
| $75,000 to $99,999 | 21 | 8.4% |
| $100,000 to $149,999 | 30 | 12.0% |
| $150,000 to $199,999 | 0 | 0.0% |
| $200,000+ | 9 | 3.6% |
Household Income by Householder Age in Cameron
The median household income in Cameron is $38,750, with the highest median household income of $52,500 found in the 45 to 64 years age bracket for the primary householder. A total of 106 households (42.6%) fall into this category. Meanwhile, the 15 to 24 years age bracket for the primary householder has the lowest median household income of $0, with 4 households (1.6%) in this group.
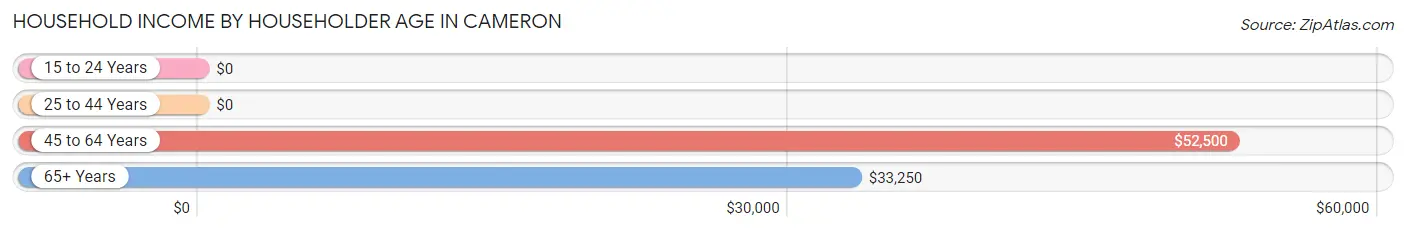
| Income Bracket | # Households | Median Income |
| 15 to 24 Years | 4 (1.6%) | $0 |
| 25 to 44 Years | 54 (21.7%) | $0 |
| 45 to 64 Years | 106 (42.6%) | $52,500 |
| 65+ Years | 85 (34.1%) | $33,250 |
| Total | 249 (100.0%) | $38,750 |
Poverty in Cameron
Income Below Poverty by Sex and Age in Cameron
With 28.0% poverty level for males and 32.7% for females among the residents of Cameron, 5 year old males and 15 year old females are the most vulnerable to poverty, with 9 males (100.0%) and 2 females (100.0%) in their respective age groups living below the poverty level.
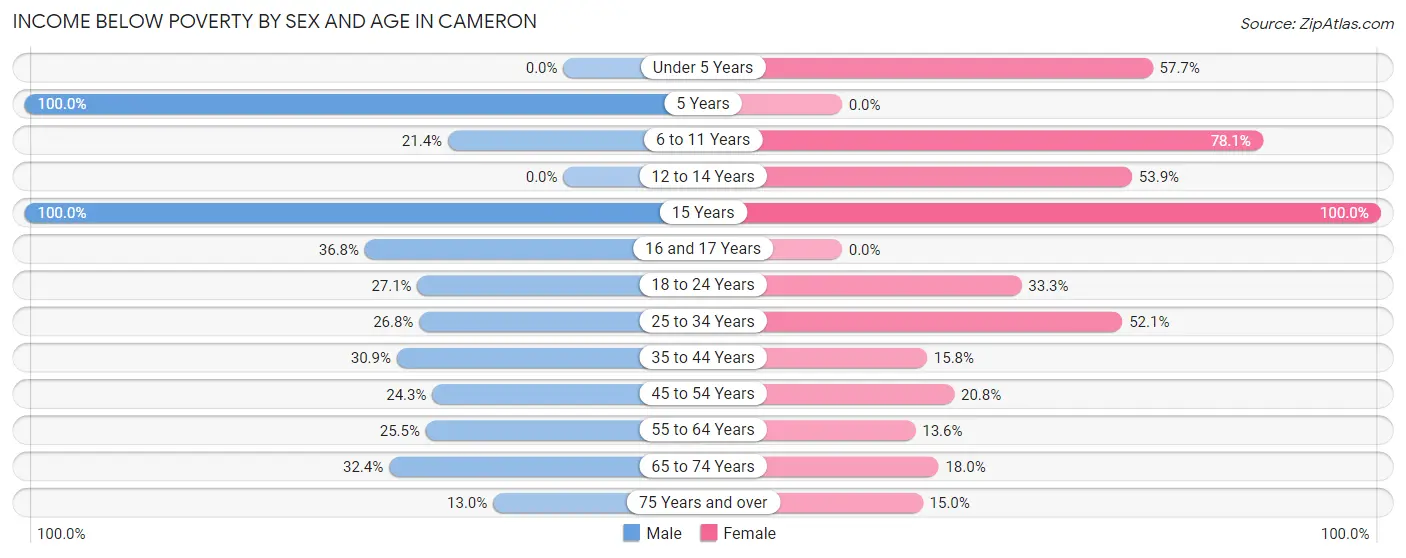
| Age Bracket | Male | Female |
| Under 5 Years | 0 (0.0%) | 15 (57.7%) |
| 5 Years | 9 (100.0%) | 0 (0.0%) |
| 6 to 11 Years | 6 (21.4%) | 25 (78.1%) |
| 12 to 14 Years | 0 (0.0%) | 7 (53.8%) |
| 15 Years | 2 (100.0%) | 2 (100.0%) |
| 16 and 17 Years | 7 (36.8%) | 0 (0.0%) |
| 18 to 24 Years | 13 (27.1%) | 4 (33.3%) |
| 25 to 34 Years | 19 (26.8%) | 38 (52.0%) |
| 35 to 44 Years | 17 (30.9%) | 6 (15.8%) |
| 45 to 54 Years | 9 (24.3%) | 10 (20.8%) |
| 55 to 64 Years | 12 (25.5%) | 9 (13.6%) |
| 65 to 74 Years | 11 (32.4%) | 7 (17.9%) |
| 75 Years and over | 3 (13.0%) | 6 (15.0%) |
| Total | 108 (28.0%) | 129 (32.7%) |
Income Above Poverty by Sex and Age in Cameron
According to the poverty statistics in Cameron, males aged under 5 years and females aged 16 and 17 years are the age groups that are most secure financially, with 100.0% of males and 100.0% of females in these age groups living above the poverty line.
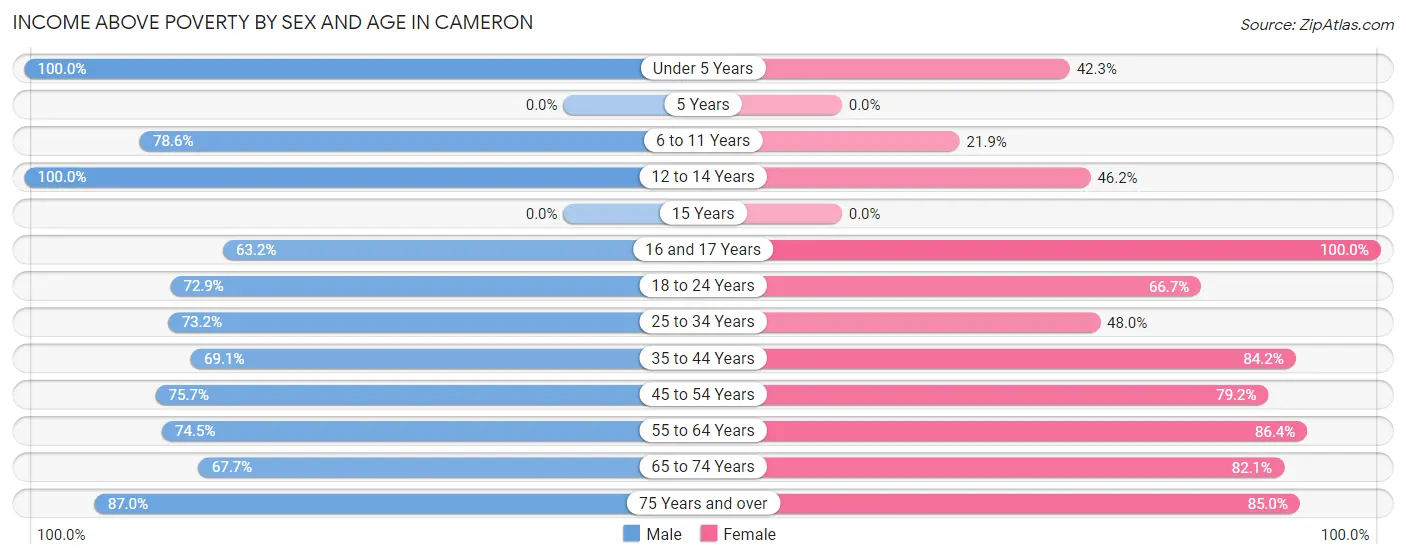
| Age Bracket | Male | Female |
| Under 5 Years | 7 (100.0%) | 11 (42.3%) |
| 5 Years | 0 (0.0%) | 0 (0.0%) |
| 6 to 11 Years | 22 (78.6%) | 7 (21.9%) |
| 12 to 14 Years | 6 (100.0%) | 6 (46.2%) |
| 15 Years | 0 (0.0%) | 0 (0.0%) |
| 16 and 17 Years | 12 (63.2%) | 5 (100.0%) |
| 18 to 24 Years | 35 (72.9%) | 8 (66.7%) |
| 25 to 34 Years | 52 (73.2%) | 35 (47.9%) |
| 35 to 44 Years | 38 (69.1%) | 32 (84.2%) |
| 45 to 54 Years | 28 (75.7%) | 38 (79.2%) |
| 55 to 64 Years | 35 (74.5%) | 57 (86.4%) |
| 65 to 74 Years | 23 (67.6%) | 32 (82.1%) |
| 75 Years and over | 20 (87.0%) | 34 (85.0%) |
| Total | 278 (72.0%) | 265 (67.3%) |
Income Below Poverty Among Married-Couple Families in Cameron
The poverty statistics for married-couple families in Cameron show that 16.0% or 8 of the total 50 families live below the poverty line. Families with 1 or 2 children have the highest poverty rate of 25.0%, comprising of 3 families. On the other hand, families with 3 or 4 children have the lowest poverty rate of 0.0%, which includes 0 families.
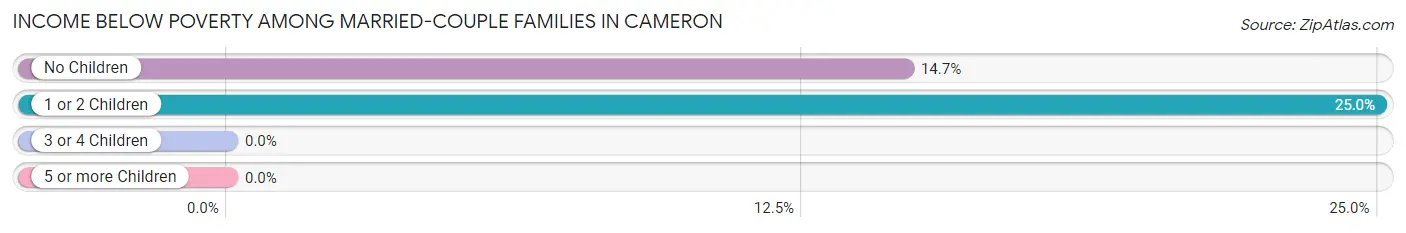
| Children | Above Poverty | Below Poverty |
| No Children | 29 (85.3%) | 5 (14.7%) |
| 1 or 2 Children | 9 (75.0%) | 3 (25.0%) |
| 3 or 4 Children | 4 (100.0%) | 0 (0.0%) |
| 5 or more Children | 0 (0.0%) | 0 (0.0%) |
| Total | 42 (84.0%) | 8 (16.0%) |
Income Below Poverty Among Single-Parent Households in Cameron
According to the poverty data in Cameron, 16.7% or 7 single-father households and 28.9% or 24 single-mother households are living below the poverty line. Among single-father households, those with 3 or 4 children have the highest poverty rate, with 4 households (100.0%) experiencing poverty. Likewise, among single-mother households, those with 3 or 4 children have the highest poverty rate, with 2 households (100.0%) falling below the poverty line.
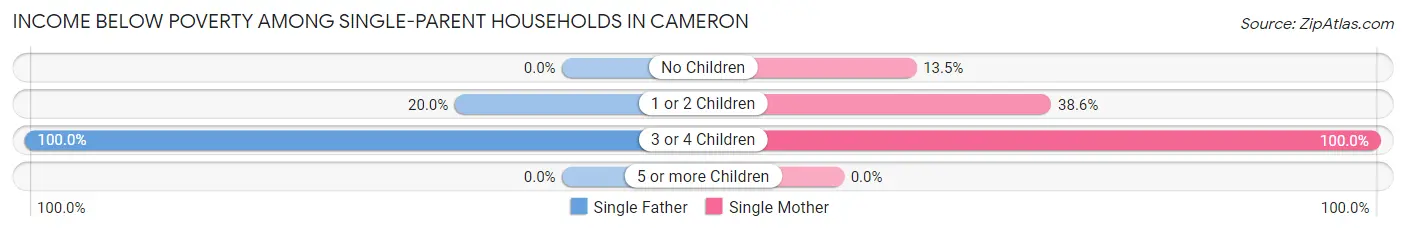
| Children | Single Father | Single Mother |
| No Children | 0 (0.0%) | 5 (13.5%) |
| 1 or 2 Children | 3 (20.0%) | 17 (38.6%) |
| 3 or 4 Children | 4 (100.0%) | 2 (100.0%) |
| 5 or more Children | 0 (0.0%) | 0 (0.0%) |
| Total | 7 (16.7%) | 24 (28.9%) |
Income Below Poverty Among Married-Couple vs Single-Parent Households in Cameron
The poverty data for Cameron shows that 8 of the married-couple family households (16.0%) and 31 of the single-parent households (24.8%) are living below the poverty level. Within the married-couple family households, those with 1 or 2 children have the highest poverty rate, with 3 households (25.0%) falling below the poverty line. Among the single-parent households, those with 3 or 4 children have the highest poverty rate, with 6 household (100.0%) living below poverty.
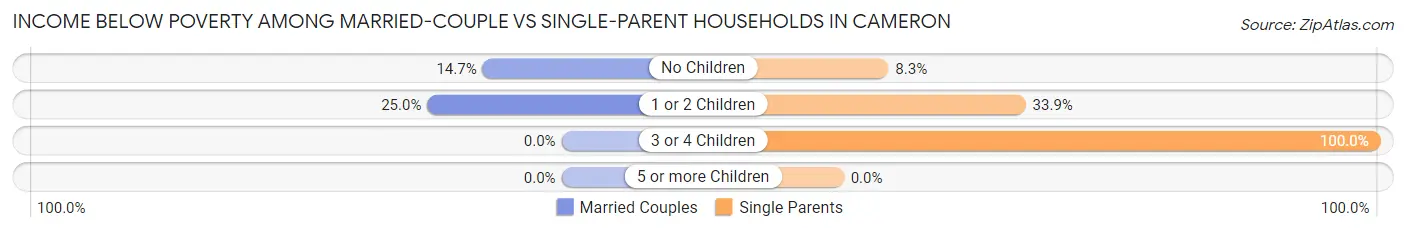
| Children | Married-Couple Families | Single-Parent Households |
| No Children | 5 (14.7%) | 5 (8.3%) |
| 1 or 2 Children | 3 (25.0%) | 20 (33.9%) |
| 3 or 4 Children | 0 (0.0%) | 6 (100.0%) |
| 5 or more Children | 0 (0.0%) | 0 (0.0%) |
| Total | 8 (16.0%) | 31 (24.8%) |
Race in Cameron
The most populous races in Cameron are Native / Alaskan (720 | 92.3%), White / Caucasian (34 | 4.4%), and Hispanic or Latino (28 | 3.6%).
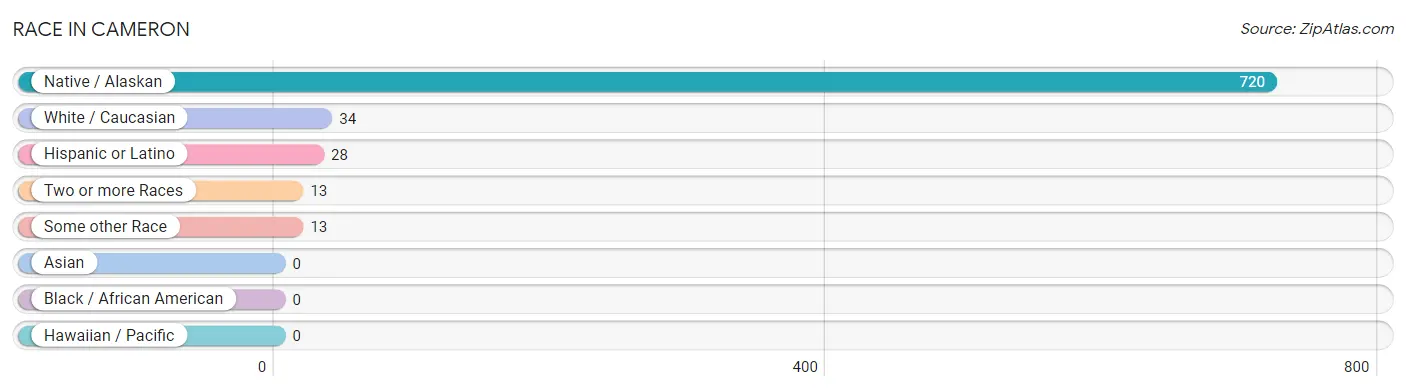
| Race | # Population | % Population |
| Asian | 0 | 0.0% |
| Black / African American | 0 | 0.0% |
| Hawaiian / Pacific | 0 | 0.0% |
| Hispanic or Latino | 28 | 3.6% |
| Native / Alaskan | 720 | 92.3% |
| White / Caucasian | 34 | 4.4% |
| Two or more Races | 13 | 1.7% |
| Some other Race | 13 | 1.7% |
| Total | 780 | 100.0% |
Ancestry in Cameron
The most populous ancestries reported in Cameron are Navajo (709 | 90.9%), English (35 | 4.5%), Mexican (22 | 2.8%), Irish (16 | 2.1%), and Hopi (7 | 0.9%), together accounting for 101.2% of all Cameron residents.
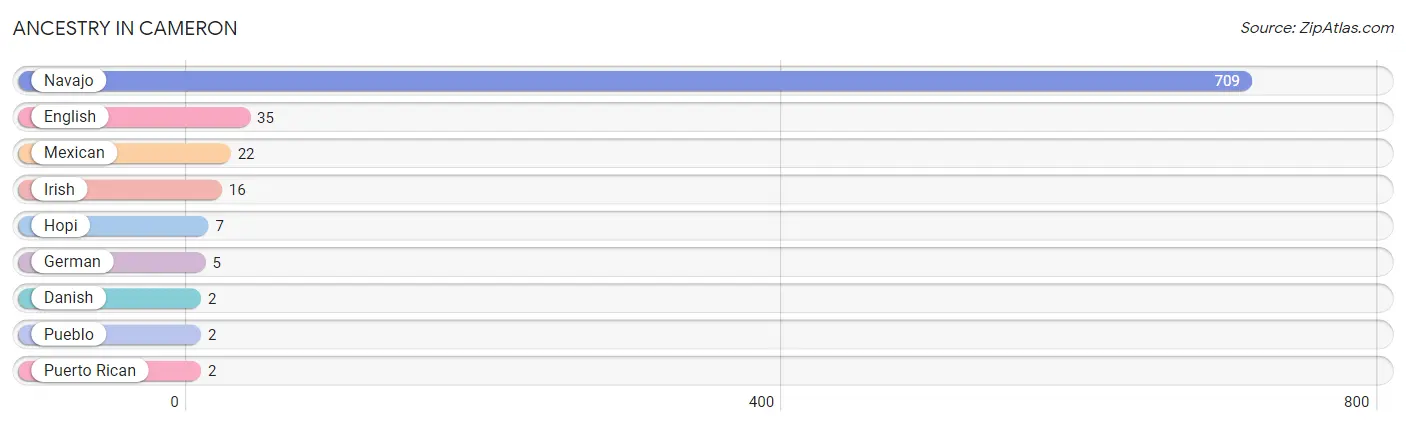
| Ancestry | # Population | % Population |
| Danish | 2 | 0.3% |
| English | 35 | 4.5% |
| German | 5 | 0.6% |
| Hopi | 7 | 0.9% |
| Irish | 16 | 2.1% |
| Mexican | 22 | 2.8% |
| Navajo | 709 | 90.9% |
| Pueblo | 2 | 0.3% |
| Puerto Rican | 2 | 0.3% | View All 9 Rows |
Immigrants in Cameron

| Immigration Origin | # Population | % Population | View All 0 Rows |
Sex and Age in Cameron
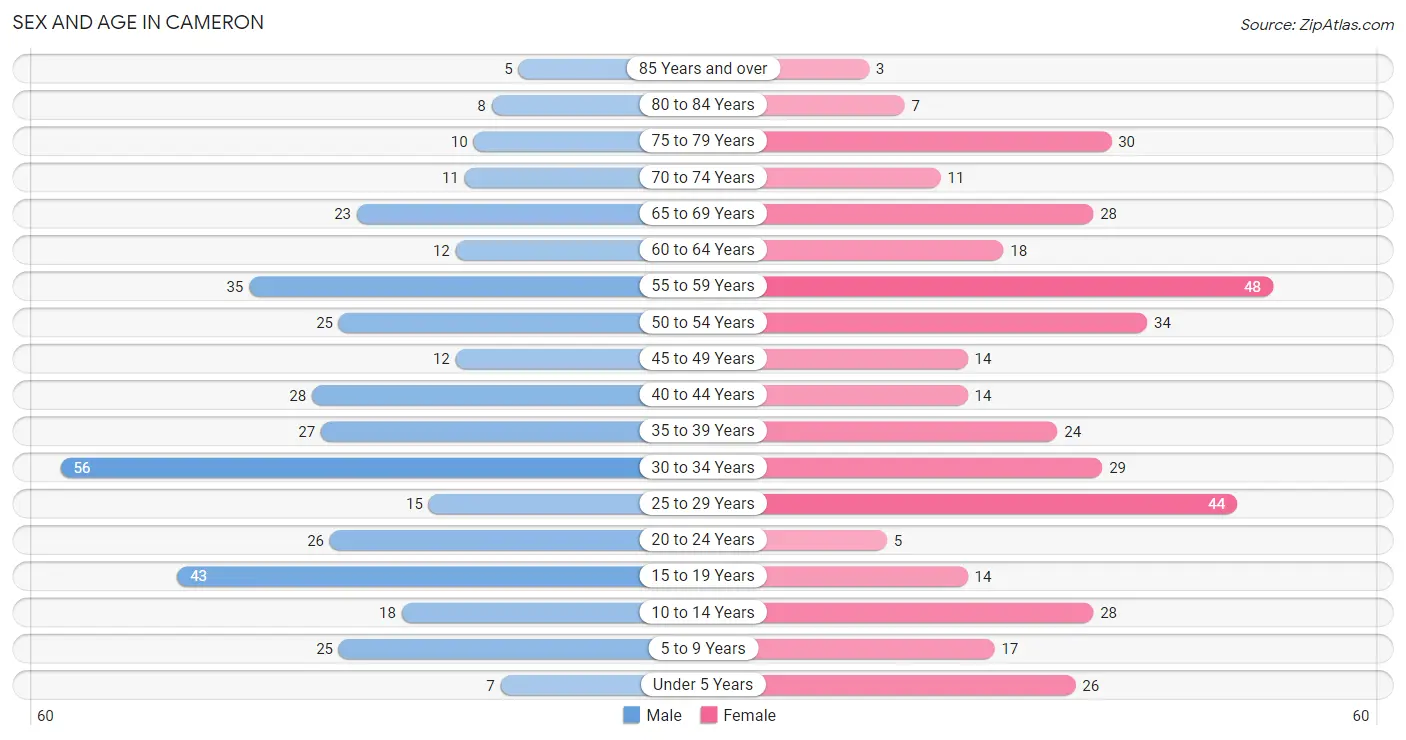
Sex and Age in Cameron
The most populous age groups in Cameron are 30 to 34 Years (56 | 14.5%) for men and 55 to 59 Years (48 | 12.2%) for women.
| Age Bracket | Male | Female |
| Under 5 Years | 7 (1.8%) | 26 (6.6%) |
| 5 to 9 Years | 25 (6.5%) | 17 (4.3%) |
| 10 to 14 Years | 18 (4.7%) | 28 (7.1%) |
| 15 to 19 Years | 43 (11.1%) | 14 (3.5%) |
| 20 to 24 Years | 26 (6.7%) | 5 (1.3%) |
| 25 to 29 Years | 15 (3.9%) | 44 (11.2%) |
| 30 to 34 Years | 56 (14.5%) | 29 (7.4%) |
| 35 to 39 Years | 27 (7.0%) | 24 (6.1%) |
| 40 to 44 Years | 28 (7.2%) | 14 (3.5%) |
| 45 to 49 Years | 12 (3.1%) | 14 (3.5%) |
| 50 to 54 Years | 25 (6.5%) | 34 (8.6%) |
| 55 to 59 Years | 35 (9.1%) | 48 (12.2%) |
| 60 to 64 Years | 12 (3.1%) | 18 (4.6%) |
| 65 to 69 Years | 23 (6.0%) | 28 (7.1%) |
| 70 to 74 Years | 11 (2.9%) | 11 (2.8%) |
| 75 to 79 Years | 10 (2.6%) | 30 (7.6%) |
| 80 to 84 Years | 8 (2.1%) | 7 (1.8%) |
| 85 Years and over | 5 (1.3%) | 3 (0.8%) |
| Total | 386 (100.0%) | 394 (100.0%) |
Families and Households in Cameron
Median Family Size in Cameron
The median family size in Cameron is 3.65 persons per family, with married-couple families (50 | 28.6%) accounting for the largest median family size of 4.54 persons per family. On the other hand, single male/father families (42 | 24.0%) represent the smallest median family size with 2.79 persons per family.
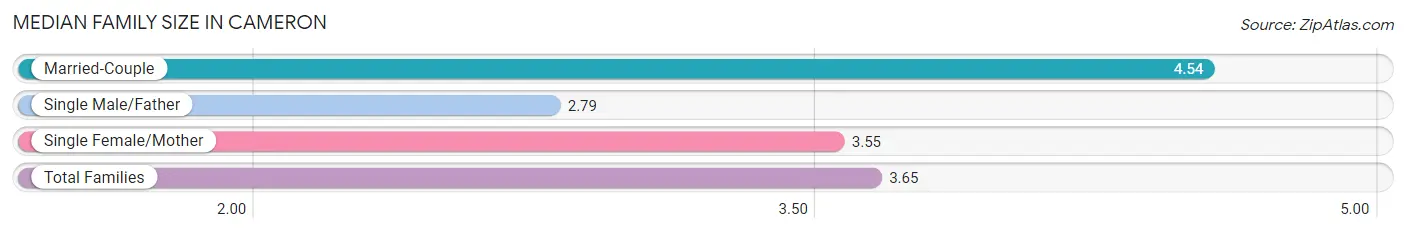
| Family Type | # Families | Family Size |
| Married-Couple | 50 (28.6%) | 4.54 |
| Single Male/Father | 42 (24.0%) | 2.79 |
| Single Female/Mother | 83 (47.4%) | 3.55 |
| Total Families | 175 (100.0%) | 3.65 |
Median Household Size in Cameron
The median household size in Cameron is 3.13 persons per household, with married-couple households (50 | 20.1%) accounting for the largest median household size of 4.8 persons per household. non-family households (74 | 29.7%) represent the smallest median household size with 1.07 persons per household.
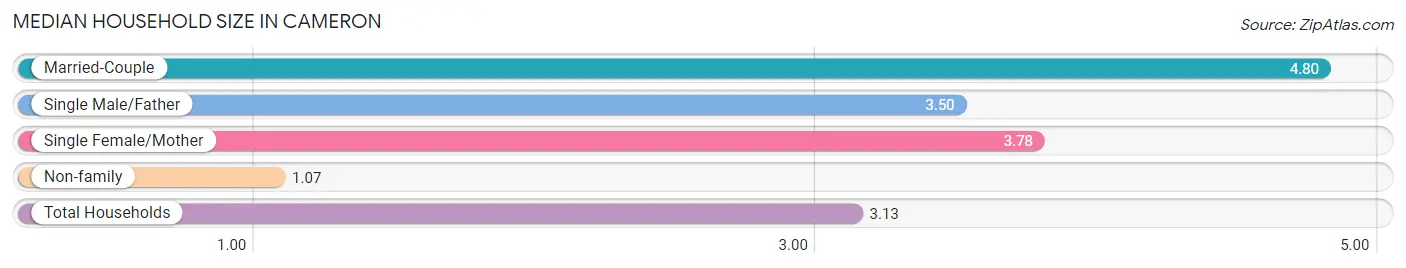
| Household Type | # Households | Household Size |
| Married-Couple | 50 (20.1%) | 4.80 |
| Single Male/Father | 42 (16.9%) | 3.50 |
| Single Female/Mother | 83 (33.3%) | 3.78 |
| Non-family | 74 (29.7%) | 1.07 |
| Total Households | 249 (100.0%) | 3.13 |
Household Size by Marriage Status in Cameron
Out of a total of 249 households in Cameron, 175 (70.3%) are family households, while 74 (29.7%) are nonfamily households. The most numerous type of family households are 3-person households, comprising 52, and the most common type of nonfamily households are 1-person households, comprising 68.
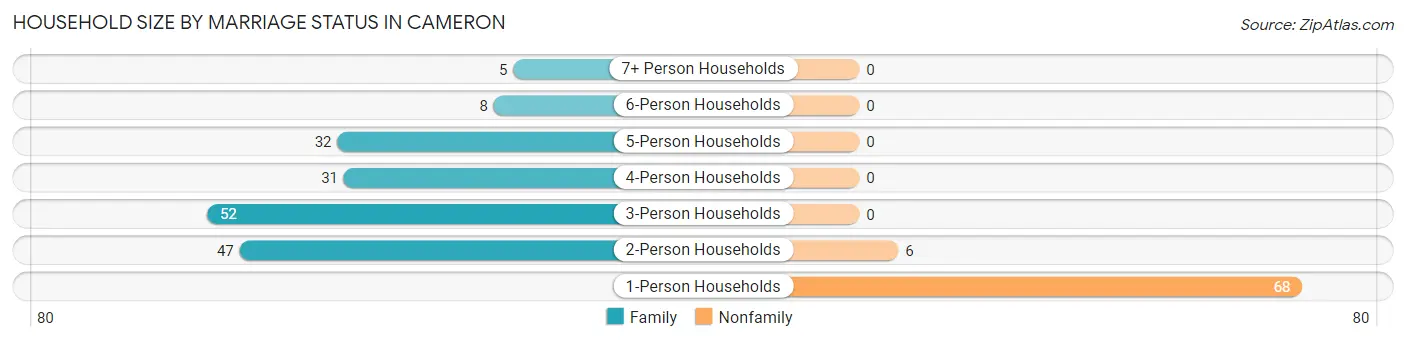
| Household Size | Family Households | Nonfamily Households |
| 1-Person Households | - | 68 (27.3%) |
| 2-Person Households | 47 (18.9%) | 6 (2.4%) |
| 3-Person Households | 52 (20.9%) | 0 (0.0%) |
| 4-Person Households | 31 (12.4%) | 0 (0.0%) |
| 5-Person Households | 32 (12.9%) | 0 (0.0%) |
| 6-Person Households | 8 (3.2%) | 0 (0.0%) |
| 7+ Person Households | 5 (2.0%) | 0 (0.0%) |
| Total | 175 (70.3%) | 74 (29.7%) |
Female Fertility in Cameron
Fertility by Age in Cameron
Average fertility rate in Cameron is 114.0 births per 1,000 women. Women in the age bracket of 20 to 34 years have the highest fertility rate with 192.0 births per 1,000 women. Women in the age bracket of 20 to 34 years acount for 88.2% of all women with births.
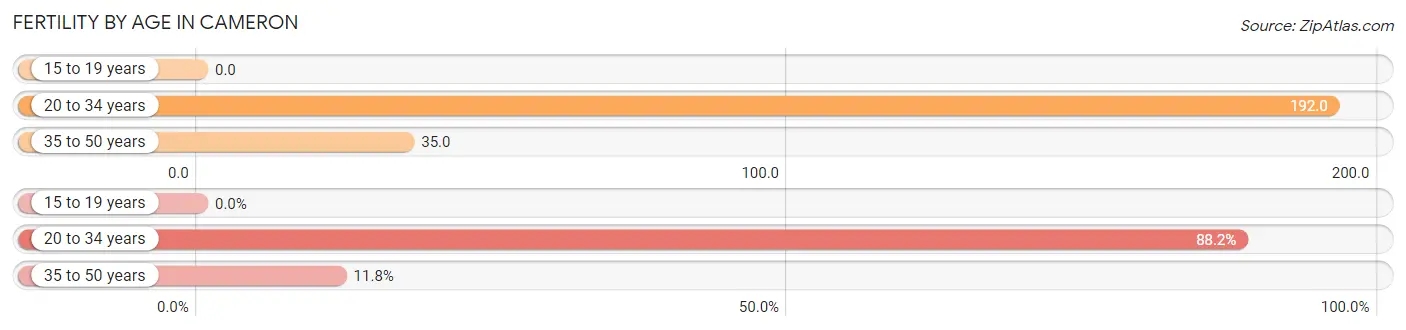
| Age Bracket | Women with Births | Births / 1,000 Women |
| 15 to 19 years | 0 (0.0%) | 0.0 |
| 20 to 34 years | 15 (88.2%) | 192.0 |
| 35 to 50 years | 2 (11.8%) | 35.0 |
| Total | 17 (100.0%) | 114.0 |
Fertility by Age by Marriage Status in Cameron
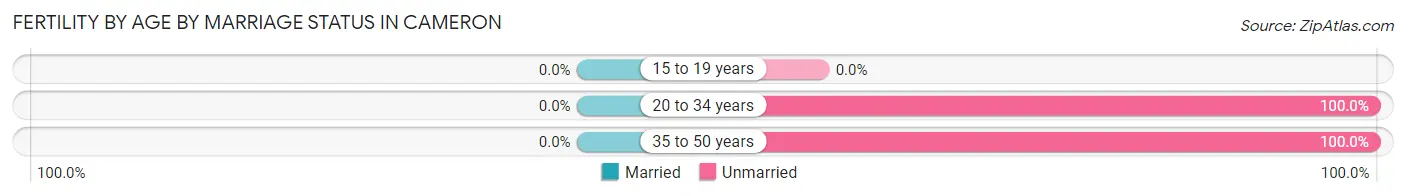
| Age Bracket | Married | Unmarried |
| 15 to 19 years | 0 (0.0%) | 0 (0.0%) |
| 20 to 34 years | 0 (0.0%) | 15 (100.0%) |
| 35 to 50 years | 0 (0.0%) | 2 (100.0%) |
| Total | 0 (0.0%) | 17 (100.0%) |
Fertility by Education in Cameron
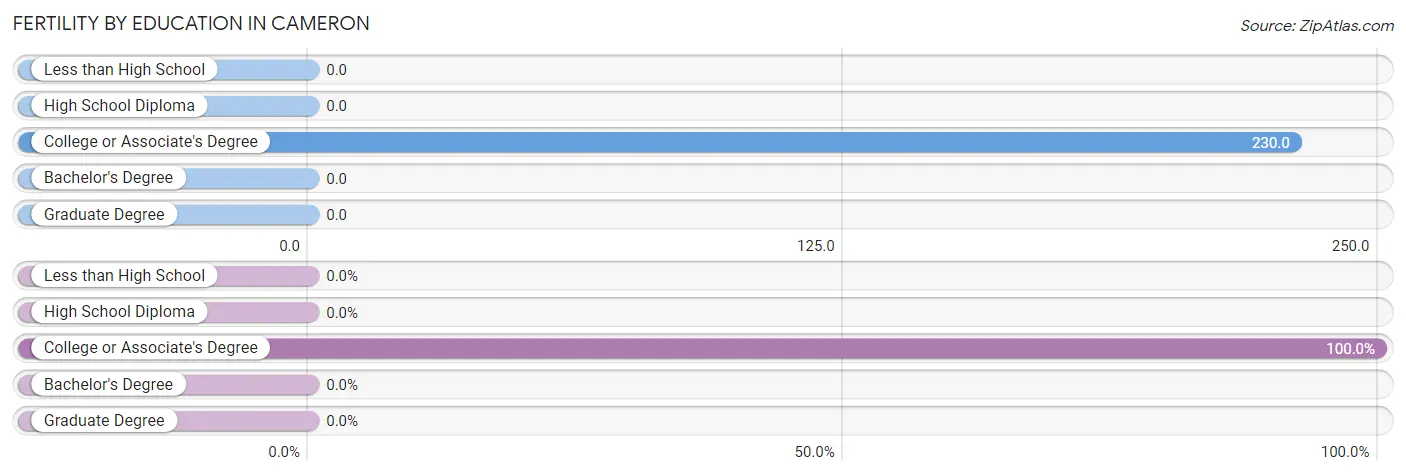
| Educational Attainment | Women with Births | Births / 1,000 Women |
| Less than High School | 0 (0.0%) | 0.0 |
| High School Diploma | 0 (0.0%) | 0.0 |
| College or Associate's Degree | 17 (100.0%) | 230.0 |
| Bachelor's Degree | 0 (0.0%) | 0.0 |
| Graduate Degree | 0 (0.0%) | 0.0 |
| Total | 17 (100.0%) | 114.0 |
Fertility by Education by Marriage Status in Cameron
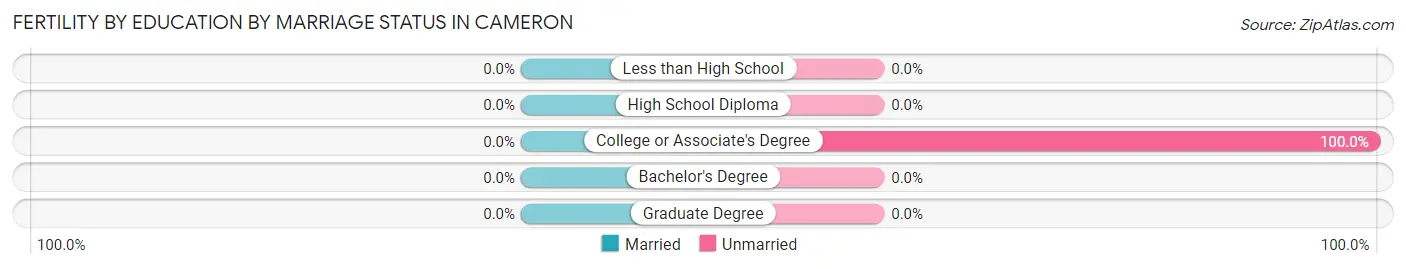
| Educational Attainment | Married | Unmarried |
| Less than High School | 0 (0.0%) | 0 (0.0%) |
| High School Diploma | 0 (0.0%) | 0 (0.0%) |
| College or Associate's Degree | 0 (0.0%) | 17 (100.0%) |
| Bachelor's Degree | 0 (0.0%) | 0 (0.0%) |
| Graduate Degree | 0 (0.0%) | 0 (0.0%) |
| Total | 0 (0.0%) | 17 (100.0%) |
Employment Characteristics in Cameron
Employment by Class of Employer in Cameron
Among the 278 employed individuals in Cameron, private company employees (210 | 75.5%), self-employed (not incorporated) (29 | 10.4%), and local government employees (22 | 7.9%) make up the most common classes of employment.
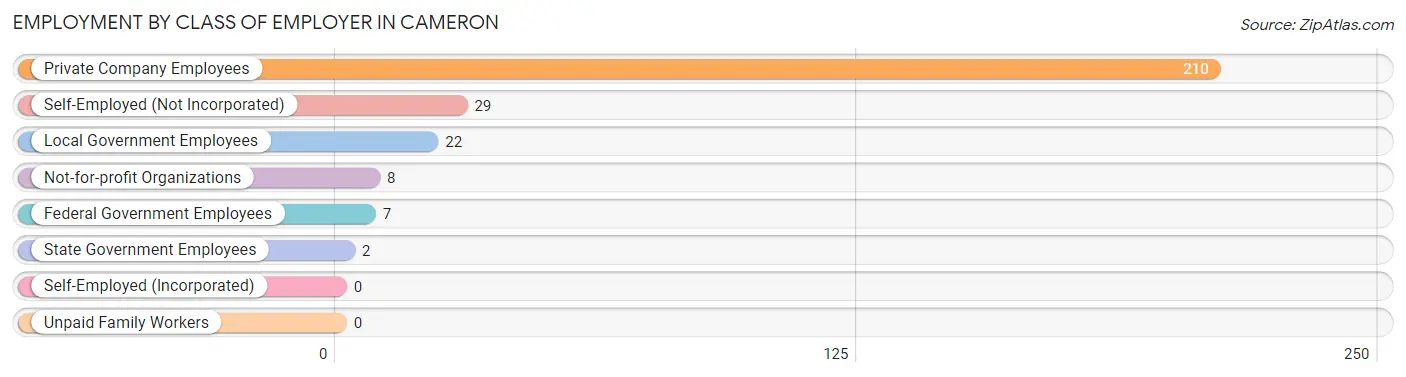
| Employer Class | # Employees | % Employees |
| Private Company Employees | 210 | 75.5% |
| Self-Employed (Incorporated) | 0 | 0.0% |
| Self-Employed (Not Incorporated) | 29 | 10.4% |
| Not-for-profit Organizations | 8 | 2.9% |
| Local Government Employees | 22 | 7.9% |
| State Government Employees | 2 | 0.7% |
| Federal Government Employees | 7 | 2.5% |
| Unpaid Family Workers | 0 | 0.0% |
| Total | 278 | 100.0% |
Employment Status by Age in Cameron
According to the labor force statistics for Cameron, out of the total population over 16 years of age (655), 52.8% or 346 individuals are in the labor force, with 18.8% or 65 of them unemployed. The age group with the highest labor force participation rate is 55 to 59 years, with 86.7% or 72 individuals in the labor force. Within the labor force, the 16 to 19 years age range has the highest percentage of unemployed individuals, with 66.7% or 16 of them being unemployed.
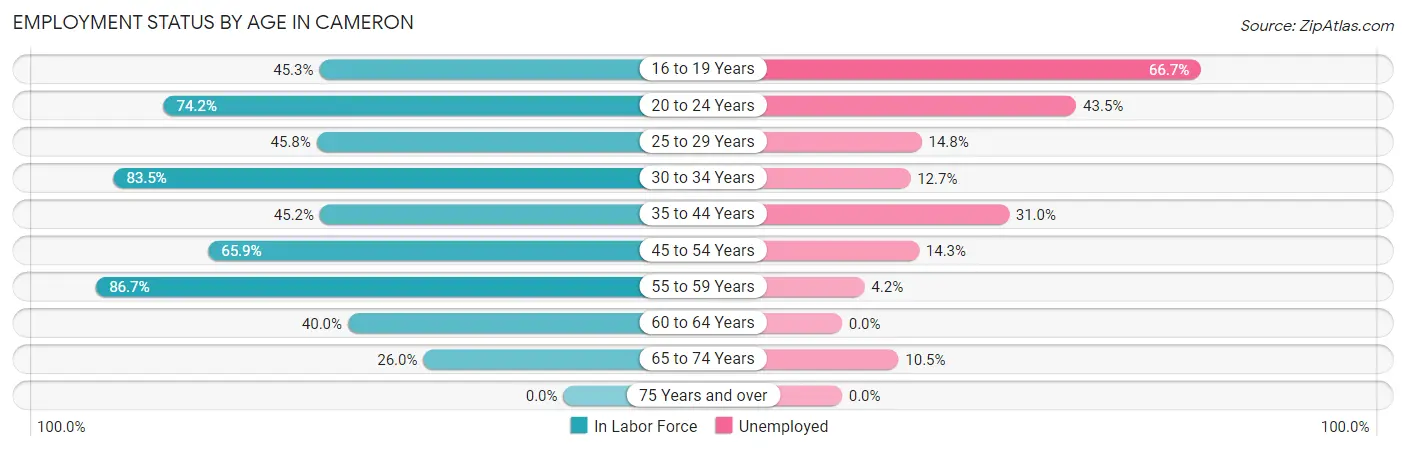
| Age Bracket | In Labor Force | Unemployed |
| 16 to 19 Years | 24 (45.3%) | 16 (66.7%) |
| 20 to 24 Years | 23 (74.2%) | 10 (43.5%) |
| 25 to 29 Years | 27 (45.8%) | 4 (14.8%) |
| 30 to 34 Years | 71 (83.5%) | 9 (12.7%) |
| 35 to 44 Years | 42 (45.2%) | 13 (31.0%) |
| 45 to 54 Years | 56 (65.9%) | 8 (14.3%) |
| 55 to 59 Years | 72 (86.7%) | 3 (4.2%) |
| 60 to 64 Years | 12 (40.0%) | 0 (0.0%) |
| 65 to 74 Years | 19 (26.0%) | 2 (10.5%) |
| 75 Years and over | 0 (0.0%) | 0 (0.0%) |
| Total | 346 (52.8%) | 65 (18.8%) |
Employment Status by Educational Attainment in Cameron
According to labor force statistics for Cameron, 64.4% of individuals (280) out of the total population between 25 and 64 years of age (435) are in the labor force, with 13.2% or 37 of them being unemployed. The group with the highest labor force participation rate are those with the educational attainment of bachelor's degree or higher, with 77.8% or 28 individuals in the labor force. Within the labor force, individuals with less than high school education have the highest percentage of unemployment, with 52.4% or 22 of them being unemployed.
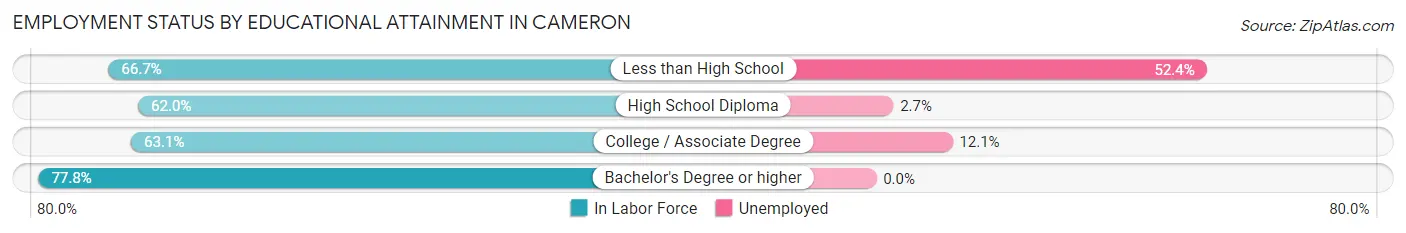
| Educational Attainment | In Labor Force | Unemployed |
| Less than High School | 42 (66.7%) | 33 (52.4%) |
| High School Diploma | 111 (62.0%) | 5 (2.7%) |
| College / Associate Degree | 99 (63.1%) | 19 (12.1%) |
| Bachelor's Degree or higher | 28 (77.8%) | 0 (0.0%) |
| Total | 280 (64.4%) | 57 (13.2%) |
Employment Occupations by Sex in Cameron
Management, Business, Science and Arts Occupations
The most common Management, Business, Science and Arts occupations in Cameron are Community & Social Service (20 | 7.1%), Education Instruction & Library (11 | 3.9%), Management (8 | 2.9%), Computers, Engineering & Science (7 | 2.5%), and Health Diagnosing & Treating (7 | 2.5%).
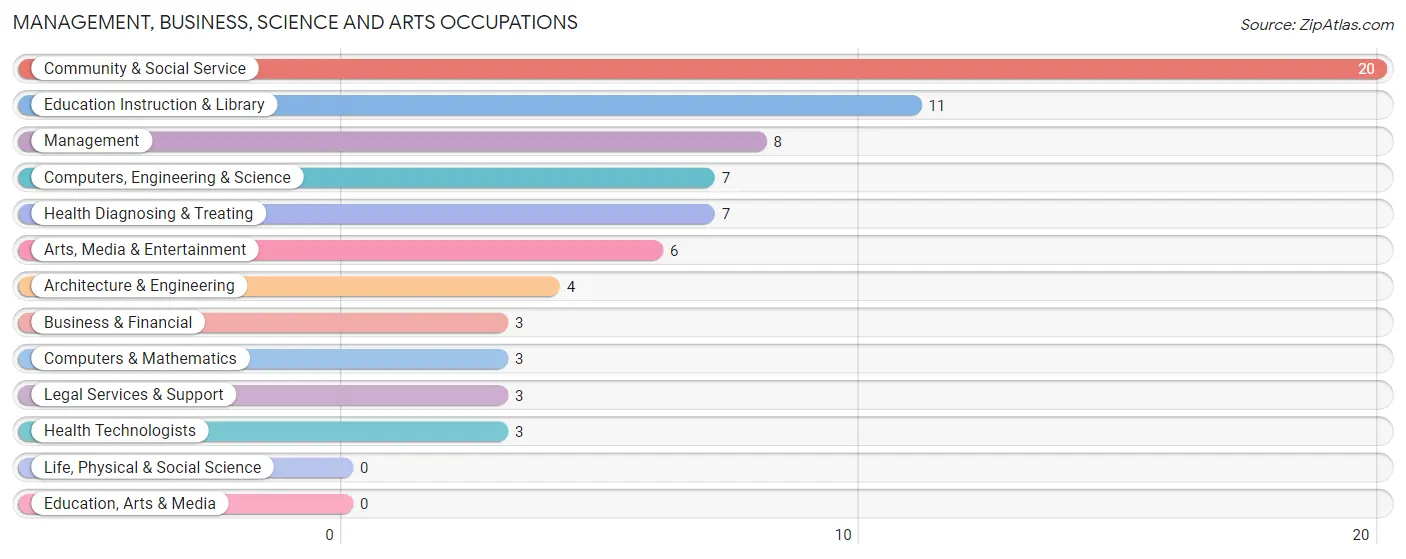
Management, Business, Science and Arts Occupations by Sex
Within the Management, Business, Science and Arts occupations in Cameron, the most male-oriented occupations are Architecture & Engineering (100.0%), Computers, Engineering & Science (57.1%), and Health Diagnosing & Treating (57.1%), while the most female-oriented occupations are Business & Financial (100.0%), Computers & Mathematics (100.0%), and Community & Social Service (100.0%).
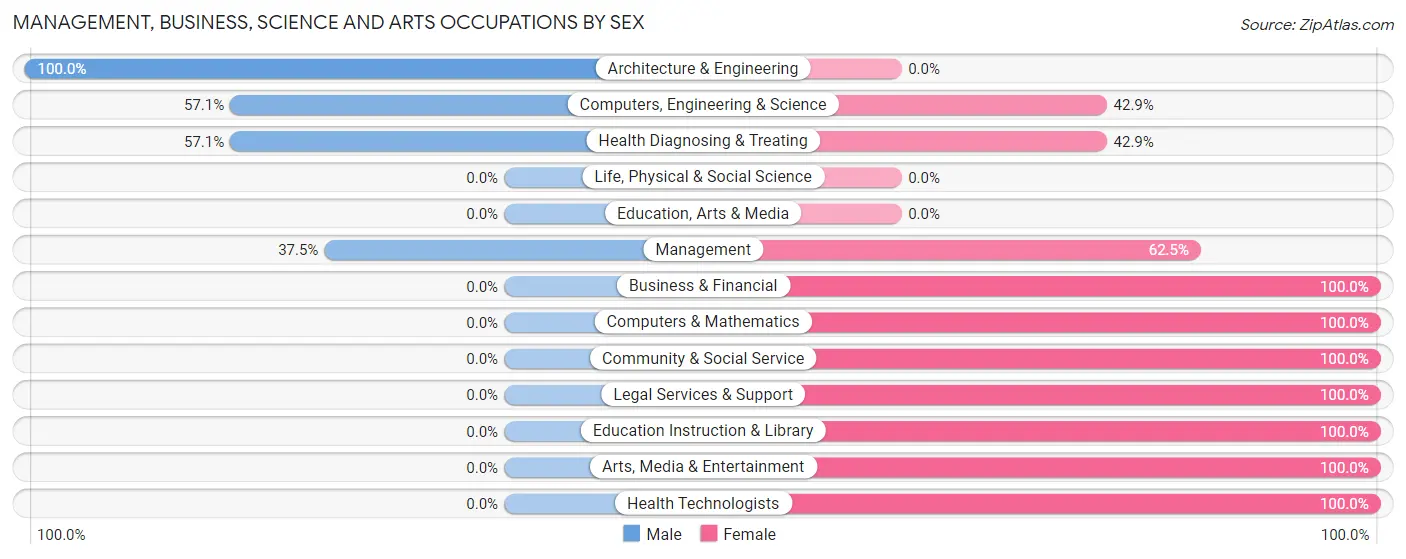
| Occupation | Male | Female |
| Management | 3 (37.5%) | 5 (62.5%) |
| Business & Financial | 0 (0.0%) | 3 (100.0%) |
| Computers, Engineering & Science | 4 (57.1%) | 3 (42.9%) |
| Computers & Mathematics | 0 (0.0%) | 3 (100.0%) |
| Architecture & Engineering | 4 (100.0%) | 0 (0.0%) |
| Life, Physical & Social Science | 0 (0.0%) | 0 (0.0%) |
| Community & Social Service | 0 (0.0%) | 20 (100.0%) |
| Education, Arts & Media | 0 (0.0%) | 0 (0.0%) |
| Legal Services & Support | 0 (0.0%) | 3 (100.0%) |
| Education Instruction & Library | 0 (0.0%) | 11 (100.0%) |
| Arts, Media & Entertainment | 0 (0.0%) | 6 (100.0%) |
| Health Diagnosing & Treating | 4 (57.1%) | 3 (42.9%) |
| Health Technologists | 0 (0.0%) | 3 (100.0%) |
| Total (Category) | 11 (24.4%) | 34 (75.6%) |
| Total (Overall) | 131 (46.6%) | 150 (53.4%) |
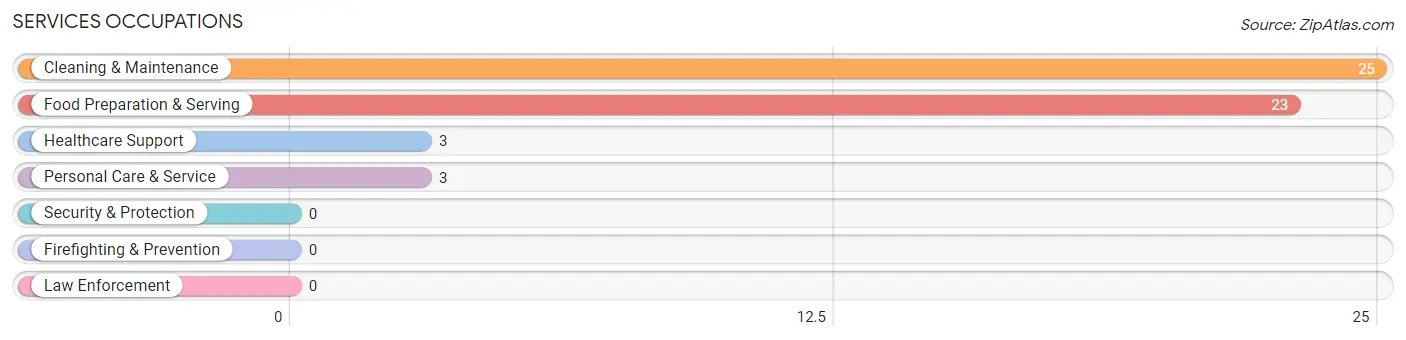
Services Occupations
The most common Services occupations in Cameron are Cleaning & Maintenance (25 | 8.9%), Food Preparation & Serving (23 | 8.2%), Healthcare Support (3 | 1.1%), and Personal Care & Service (3 | 1.1%).
Services Occupations by Sex
Within the Services occupations in Cameron, the most male-oriented occupations are Personal Care & Service (100.0%), Food Preparation & Serving (56.5%), and Cleaning & Maintenance (56.0%), while the most female-oriented occupations are Healthcare Support (100.0%), Cleaning & Maintenance (44.0%), and Food Preparation & Serving (43.5%).
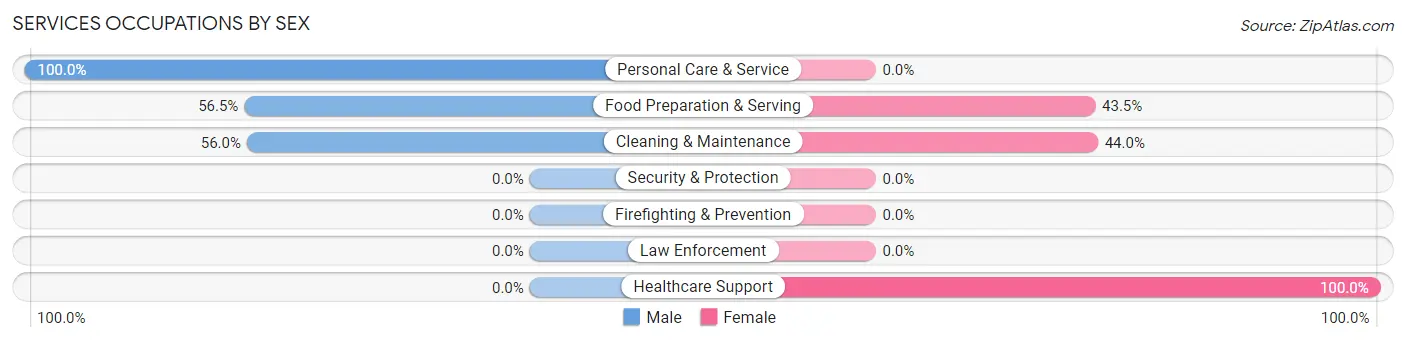
| Occupation | Male | Female |
| Healthcare Support | 0 (0.0%) | 3 (100.0%) |
| Security & Protection | 0 (0.0%) | 0 (0.0%) |
| Firefighting & Prevention | 0 (0.0%) | 0 (0.0%) |
| Law Enforcement | 0 (0.0%) | 0 (0.0%) |
| Food Preparation & Serving | 13 (56.5%) | 10 (43.5%) |
| Cleaning & Maintenance | 14 (56.0%) | 11 (44.0%) |
| Personal Care & Service | 3 (100.0%) | 0 (0.0%) |
| Total (Category) | 30 (55.6%) | 24 (44.4%) |
| Total (Overall) | 131 (46.6%) | 150 (53.4%) |
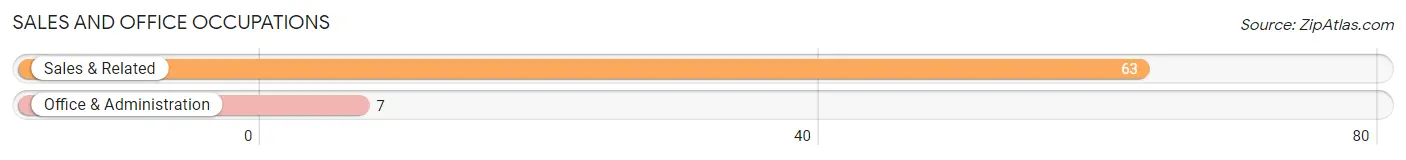
Sales and Office Occupations
The most common Sales and Office occupations in Cameron are Sales & Related (63 | 22.4%), and Office & Administration (7 | 2.5%).
Sales and Office Occupations by Sex
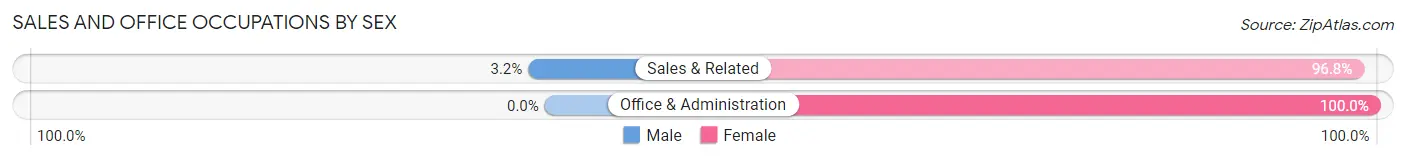
| Occupation | Male | Female |
| Sales & Related | 2 (3.2%) | 61 (96.8%) |
| Office & Administration | 0 (0.0%) | 7 (100.0%) |
| Total (Category) | 2 (2.9%) | 68 (97.1%) |
| Total (Overall) | 131 (46.6%) | 150 (53.4%) |
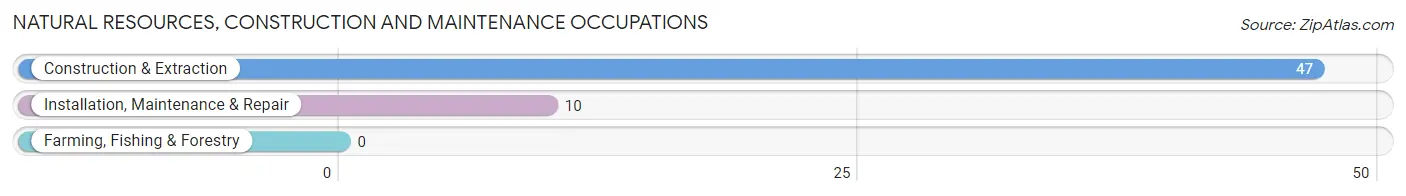
Natural Resources, Construction and Maintenance Occupations
The most common Natural Resources, Construction and Maintenance occupations in Cameron are Construction & Extraction (47 | 16.7%), and Installation, Maintenance & Repair (10 | 3.6%).
Natural Resources, Construction and Maintenance Occupations by Sex
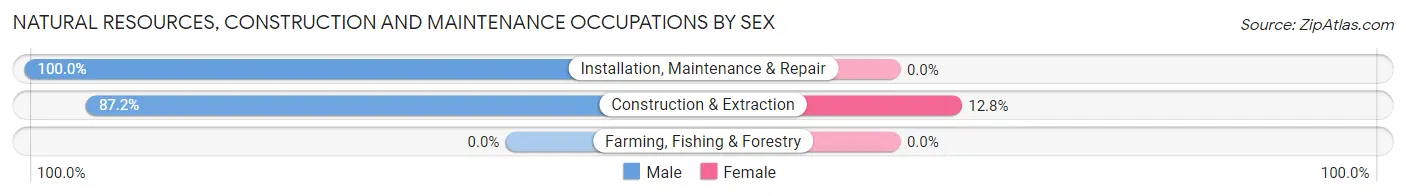
| Occupation | Male | Female |
| Farming, Fishing & Forestry | 0 (0.0%) | 0 (0.0%) |
| Construction & Extraction | 41 (87.2%) | 6 (12.8%) |
| Installation, Maintenance & Repair | 10 (100.0%) | 0 (0.0%) |
| Total (Category) | 51 (89.5%) | 6 (10.5%) |
| Total (Overall) | 131 (46.6%) | 150 (53.4%) |
Production, Transportation and Moving Occupations
The most common Production, Transportation and Moving occupations in Cameron are Production (25 | 8.9%), Material Moving (22 | 7.8%), and Transportation (8 | 2.9%).
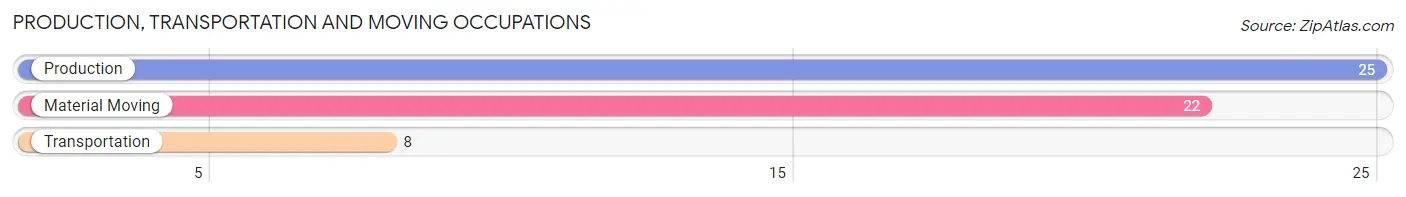
Production, Transportation and Moving Occupations by Sex
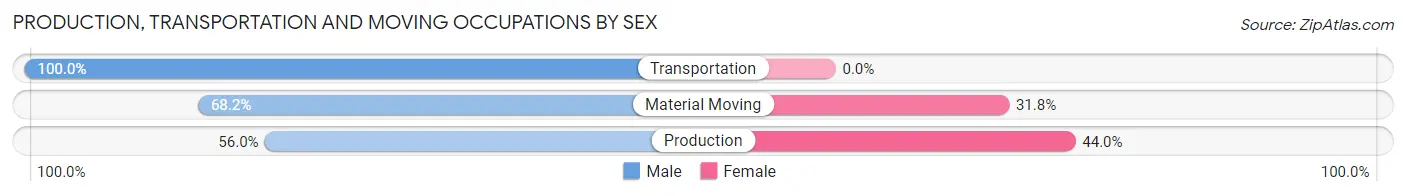
| Occupation | Male | Female |
| Production | 14 (56.0%) | 11 (44.0%) |
| Transportation | 8 (100.0%) | 0 (0.0%) |
| Material Moving | 15 (68.2%) | 7 (31.8%) |
| Total (Category) | 37 (67.3%) | 18 (32.7%) |
| Total (Overall) | 131 (46.6%) | 150 (53.4%) |
Employment Industries by Sex in Cameron
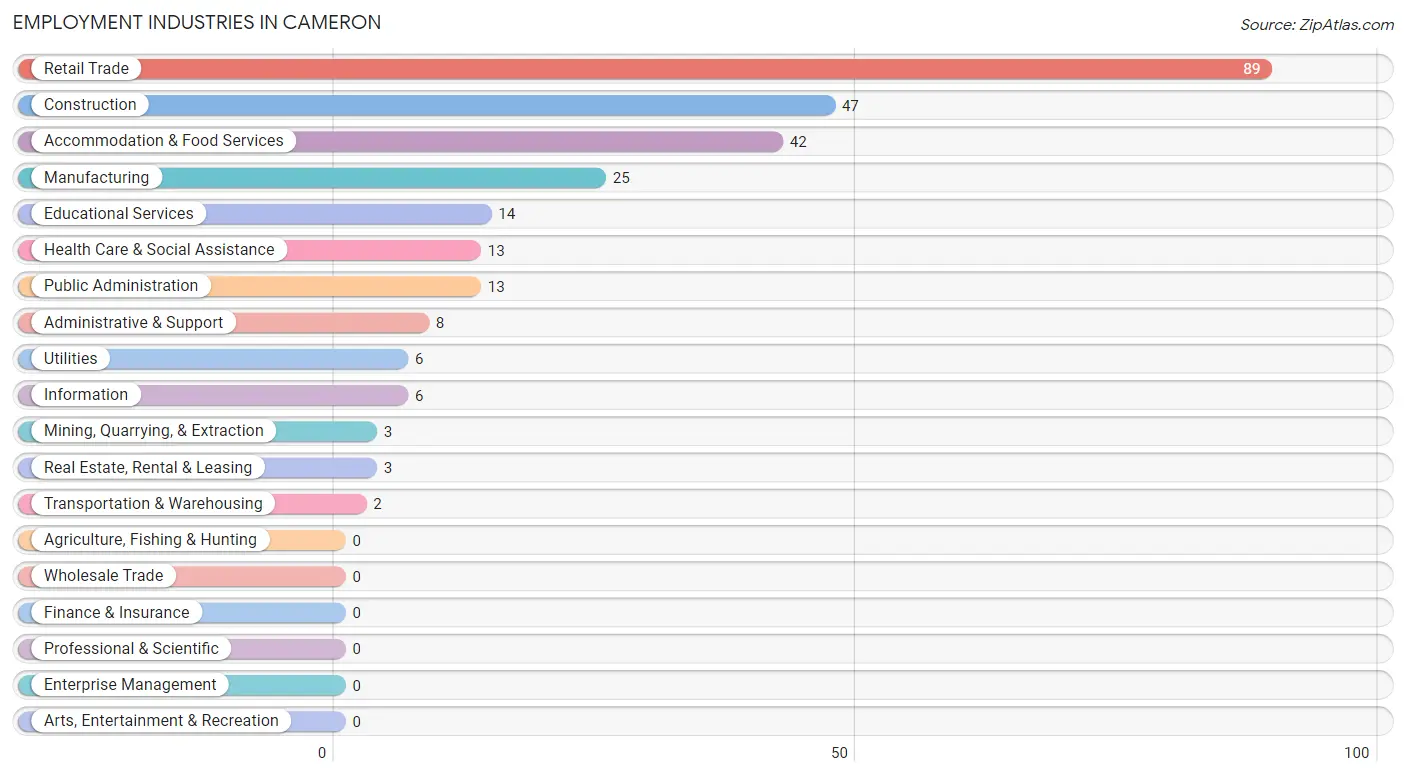
Employment Industries in Cameron
The major employment industries in Cameron include Retail Trade (89 | 31.7%), Construction (47 | 16.7%), Accommodation & Food Services (42 | 14.9%), Manufacturing (25 | 8.9%), and Educational Services (14 | 5.0%).
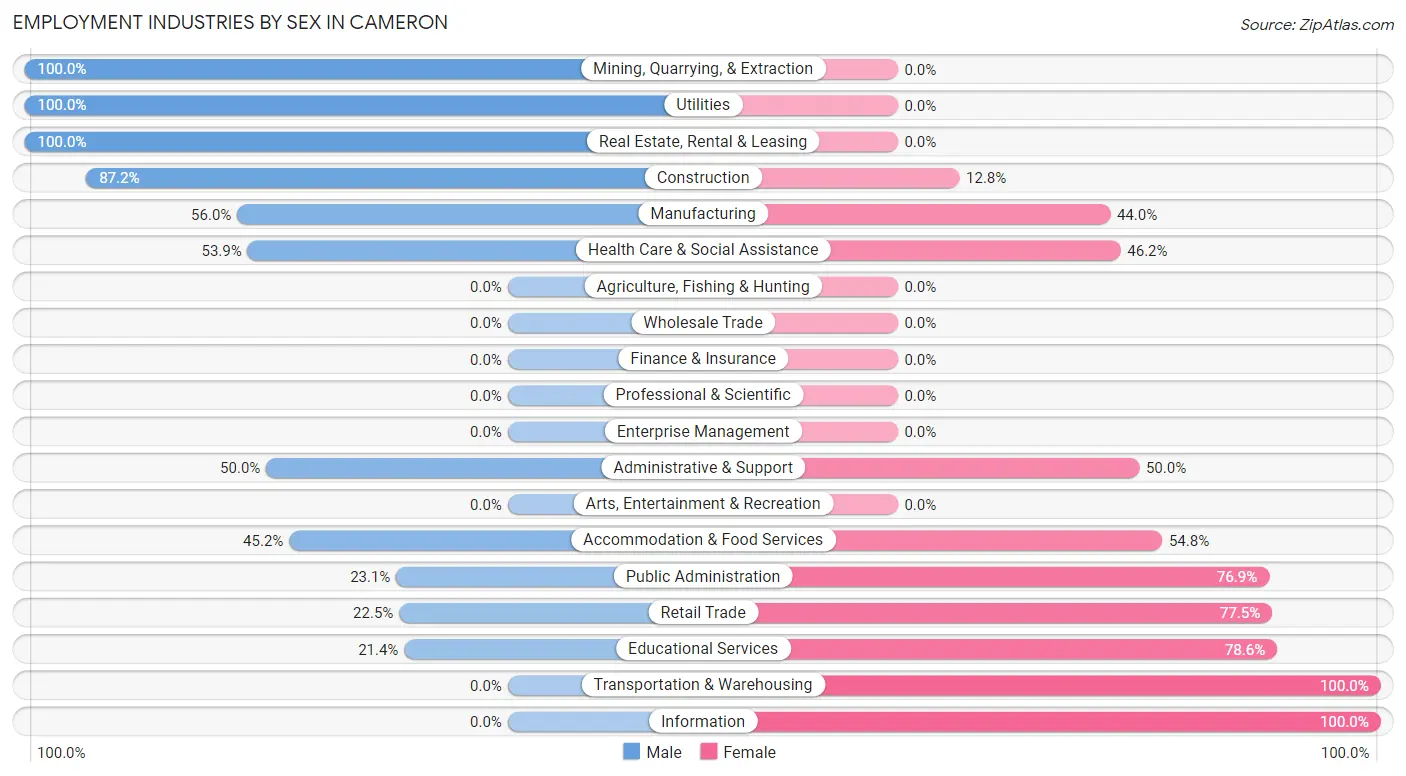
Employment Industries by Sex in Cameron
The Cameron industries that see more men than women are Mining, Quarrying, & Extraction (100.0%), Utilities (100.0%), and Real Estate, Rental & Leasing (100.0%), whereas the industries that tend to have a higher number of women are Transportation & Warehousing (100.0%), Information (100.0%), and Educational Services (78.6%).
| Industry | Male | Female |
| Agriculture, Fishing & Hunting | 0 (0.0%) | 0 (0.0%) |
| Mining, Quarrying, & Extraction | 3 (100.0%) | 0 (0.0%) |
| Construction | 41 (87.2%) | 6 (12.8%) |
| Manufacturing | 14 (56.0%) | 11 (44.0%) |
| Wholesale Trade | 0 (0.0%) | 0 (0.0%) |
| Retail Trade | 20 (22.5%) | 69 (77.5%) |
| Transportation & Warehousing | 0 (0.0%) | 2 (100.0%) |
| Utilities | 6 (100.0%) | 0 (0.0%) |
| Information | 0 (0.0%) | 6 (100.0%) |
| Finance & Insurance | 0 (0.0%) | 0 (0.0%) |
| Real Estate, Rental & Leasing | 3 (100.0%) | 0 (0.0%) |
| Professional & Scientific | 0 (0.0%) | 0 (0.0%) |
| Enterprise Management | 0 (0.0%) | 0 (0.0%) |
| Administrative & Support | 4 (50.0%) | 4 (50.0%) |
| Educational Services | 3 (21.4%) | 11 (78.6%) |
| Health Care & Social Assistance | 7 (53.8%) | 6 (46.2%) |
| Arts, Entertainment & Recreation | 0 (0.0%) | 0 (0.0%) |
| Accommodation & Food Services | 19 (45.2%) | 23 (54.8%) |
| Public Administration | 3 (23.1%) | 10 (76.9%) |
| Total | 131 (46.6%) | 150 (53.4%) |
Education in Cameron
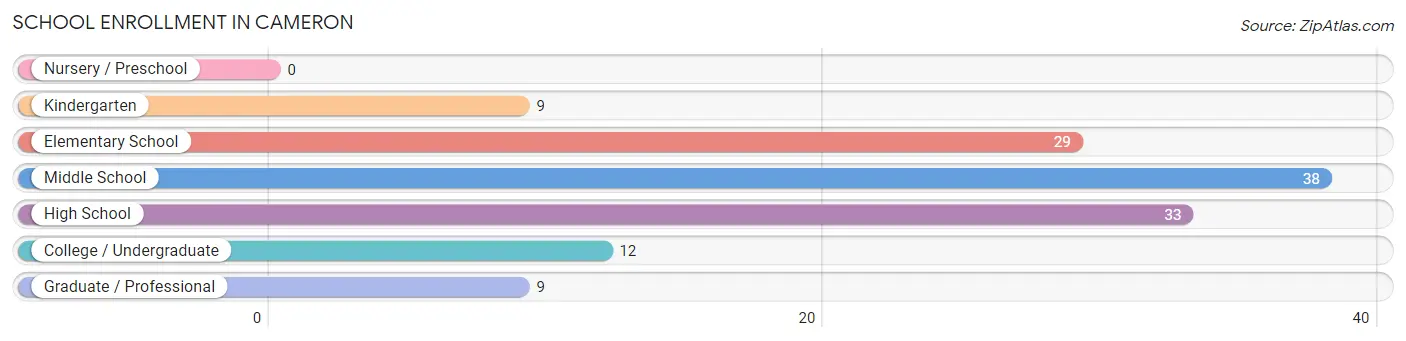
School Enrollment in Cameron
The most common levels of schooling among the 130 students in Cameron are middle school (38 | 29.2%), high school (33 | 25.4%), and elementary school (29 | 22.3%).
| School Level | # Students | % Students |
| Nursery / Preschool | 0 | 0.0% |
| Kindergarten | 9 | 6.9% |
| Elementary School | 29 | 22.3% |
| Middle School | 38 | 29.2% |
| High School | 33 | 25.4% |
| College / Undergraduate | 12 | 9.2% |
| Graduate / Professional | 9 | 6.9% |
| Total | 130 | 100.0% |
School Enrollment by Age by Funding Source in Cameron
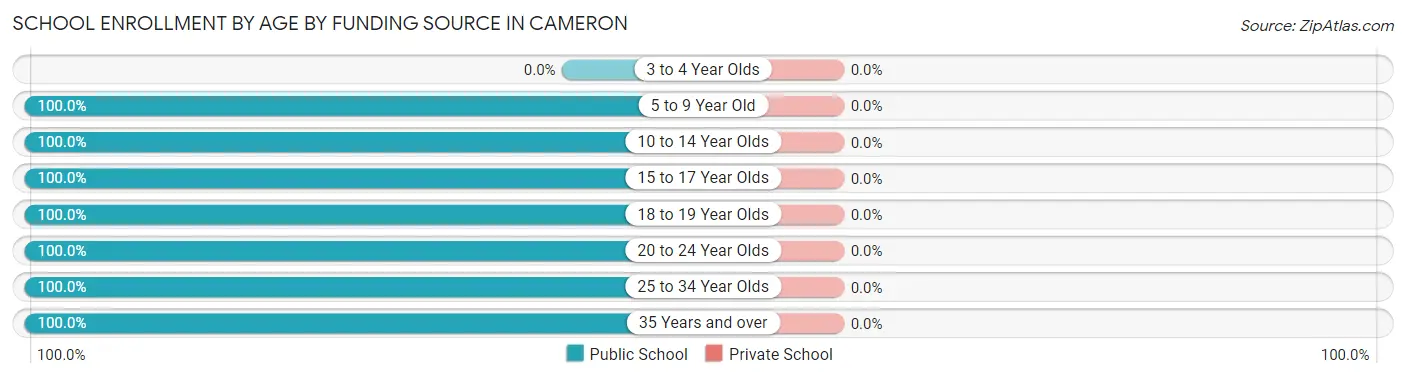
| Age Bracket | Public School | Private School |
| 3 to 4 Year Olds | 0 (0.0%) | 0 (0.0%) |
| 5 to 9 Year Old | 36 (100.0%) | 0 (0.0%) |
| 10 to 14 Year Olds | 40 (100.0%) | 0 (0.0%) |
| 15 to 17 Year Olds | 26 (100.0%) | 0 (0.0%) |
| 18 to 19 Year Olds | 7 (100.0%) | 0 (0.0%) |
| 20 to 24 Year Olds | 5 (100.0%) | 0 (0.0%) |
| 25 to 34 Year Olds | 4 (100.0%) | 0 (0.0%) |
| 35 Years and over | 12 (100.0%) | 0 (0.0%) |
| Total | 130 (100.0%) | 0 (0.0%) |
Educational Attainment by Field of Study in Cameron
Psychology (10 | 25.6%), literature & languages (9 | 23.1%), science & technology (6 | 15.4%), education (4 | 10.3%), and arts & humanities (4 | 10.3%) are the most common fields of study among 39 individuals in Cameron who have obtained a bachelor's degree or higher.
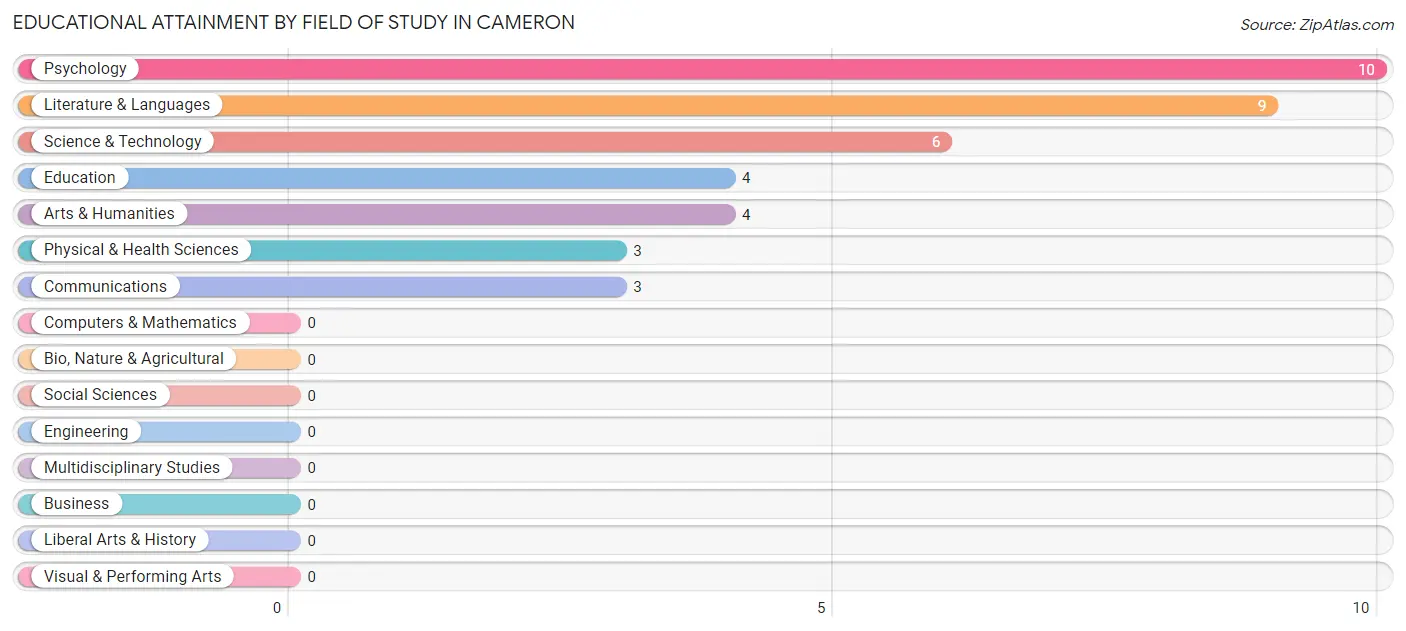
| Field of Study | # Graduates | % Graduates |
| Computers & Mathematics | 0 | 0.0% |
| Bio, Nature & Agricultural | 0 | 0.0% |
| Physical & Health Sciences | 3 | 7.7% |
| Psychology | 10 | 25.6% |
| Social Sciences | 0 | 0.0% |
| Engineering | 0 | 0.0% |
| Multidisciplinary Studies | 0 | 0.0% |
| Science & Technology | 6 | 15.4% |
| Business | 0 | 0.0% |
| Education | 4 | 10.3% |
| Literature & Languages | 9 | 23.1% |
| Liberal Arts & History | 0 | 0.0% |
| Visual & Performing Arts | 0 | 0.0% |
| Communications | 3 | 7.7% |
| Arts & Humanities | 4 | 10.3% |
| Total | 39 | 100.0% |
Transportation & Commute in Cameron
Vehicle Availability by Sex in Cameron
The most prevalent vehicle ownership categories in Cameron are males with 1 vehicle (32, accounting for 25.0%) and females with 1 vehicle (32, making up 21.3%).
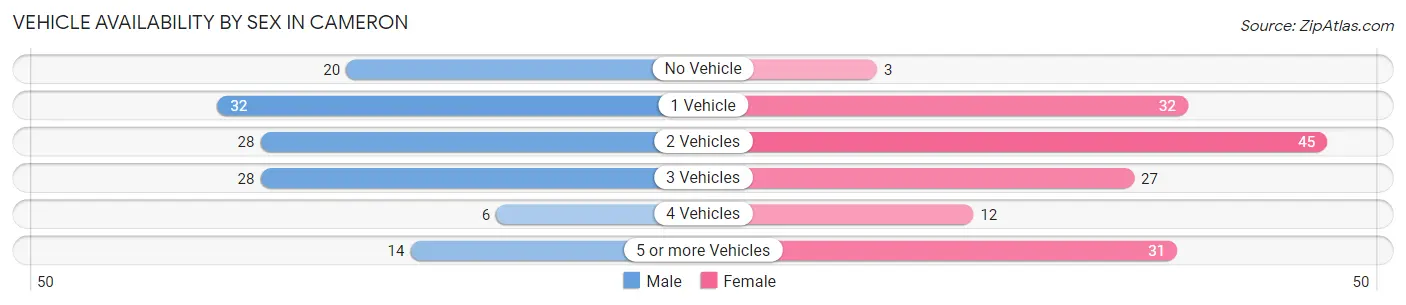
| Vehicles Available | Male | Female |
| No Vehicle | 20 (15.6%) | 3 (2.0%) |
| 1 Vehicle | 32 (25.0%) | 32 (21.3%) |
| 2 Vehicles | 28 (21.9%) | 45 (30.0%) |
| 3 Vehicles | 28 (21.9%) | 27 (18.0%) |
| 4 Vehicles | 6 (4.7%) | 12 (8.0%) |
| 5 or more Vehicles | 14 (10.9%) | 31 (20.7%) |
| Total | 128 (100.0%) | 150 (100.0%) |
Commute Time in Cameron
The most frequently occuring commute durations in Cameron are 60 to 89 minutes (51 commuters, 19.8%), 5 to 9 minutes (38 commuters, 14.8%), and 30 to 34 minutes (38 commuters, 14.8%).
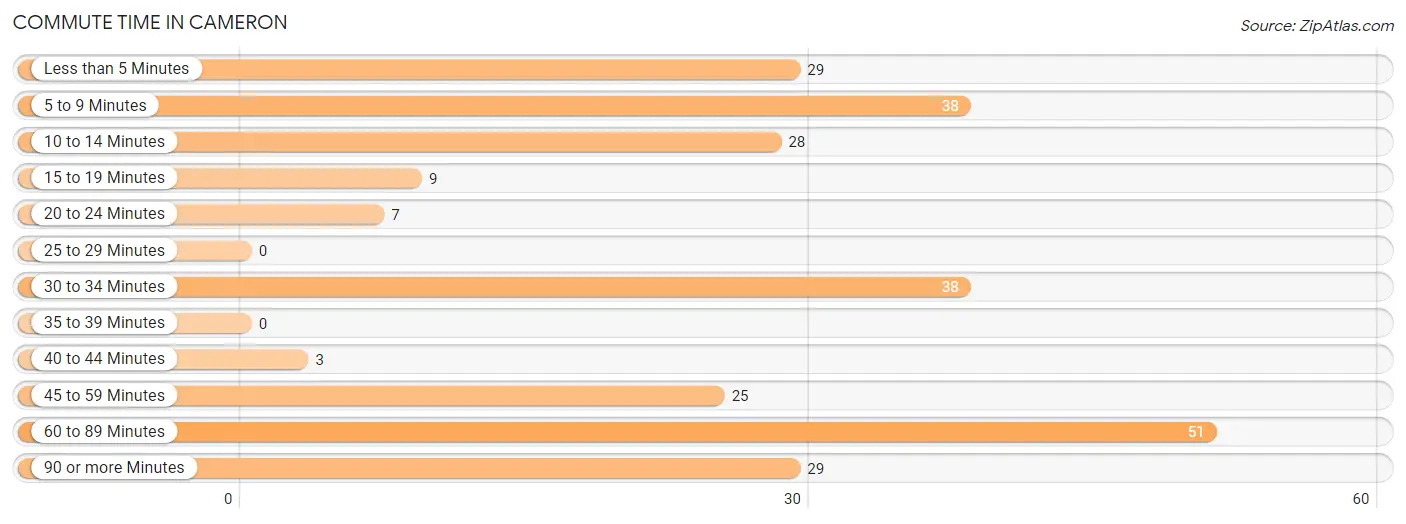
| Commute Time | # Commuters | % Commuters |
| Less than 5 Minutes | 29 | 11.3% |
| 5 to 9 Minutes | 38 | 14.8% |
| 10 to 14 Minutes | 28 | 10.9% |
| 15 to 19 Minutes | 9 | 3.5% |
| 20 to 24 Minutes | 7 | 2.7% |
| 25 to 29 Minutes | 0 | 0.0% |
| 30 to 34 Minutes | 38 | 14.8% |
| 35 to 39 Minutes | 0 | 0.0% |
| 40 to 44 Minutes | 3 | 1.2% |
| 45 to 59 Minutes | 25 | 9.7% |
| 60 to 89 Minutes | 51 | 19.8% |
| 90 or more Minutes | 29 | 11.3% |
Commute Time by Sex in Cameron
The most common commute times in Cameron are 60 to 89 minutes (30 commuters, 24.8%) for males and 30 to 34 minutes (24 commuters, 17.6%) for females.
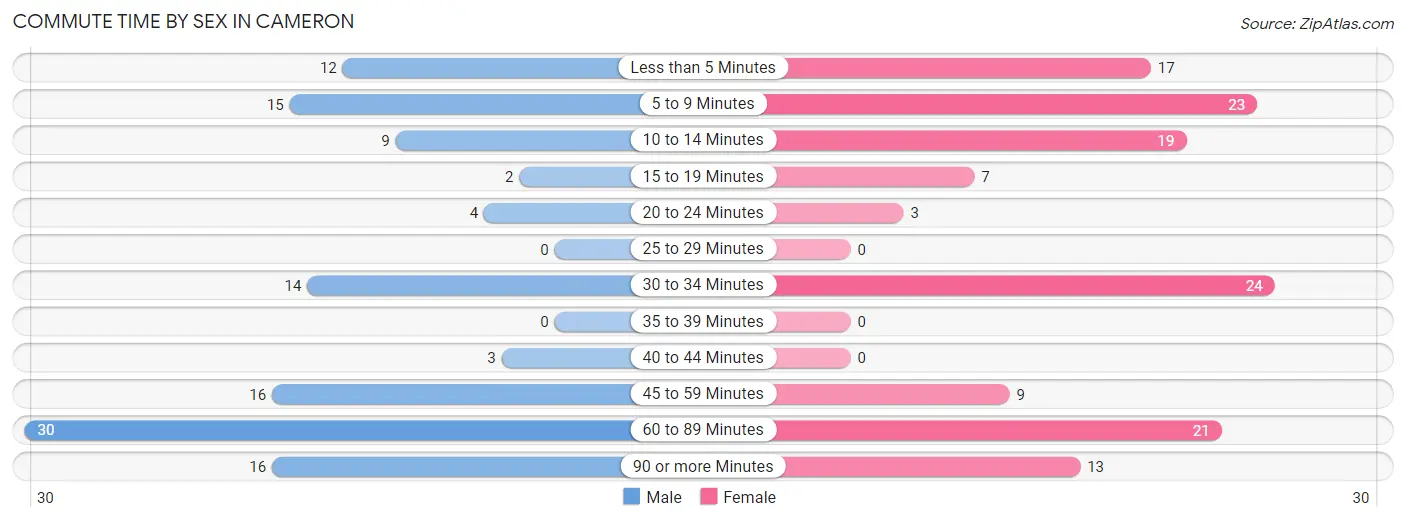
| Commute Time | Male | Female |
| Less than 5 Minutes | 12 (9.9%) | 17 (12.5%) |
| 5 to 9 Minutes | 15 (12.4%) | 23 (16.9%) |
| 10 to 14 Minutes | 9 (7.4%) | 19 (14.0%) |
| 15 to 19 Minutes | 2 (1.7%) | 7 (5.1%) |
| 20 to 24 Minutes | 4 (3.3%) | 3 (2.2%) |
| 25 to 29 Minutes | 0 (0.0%) | 0 (0.0%) |
| 30 to 34 Minutes | 14 (11.6%) | 24 (17.6%) |
| 35 to 39 Minutes | 0 (0.0%) | 0 (0.0%) |
| 40 to 44 Minutes | 3 (2.5%) | 0 (0.0%) |
| 45 to 59 Minutes | 16 (13.2%) | 9 (6.6%) |
| 60 to 89 Minutes | 30 (24.8%) | 21 (15.4%) |
| 90 or more Minutes | 16 (13.2%) | 13 (9.6%) |
Time of Departure to Work by Sex in Cameron
The most frequent times of departure to work in Cameron are 5:00 AM to 5:29 AM (21, 17.4%) for males and 7:30 AM to 7:59 AM (20, 14.7%) for females.
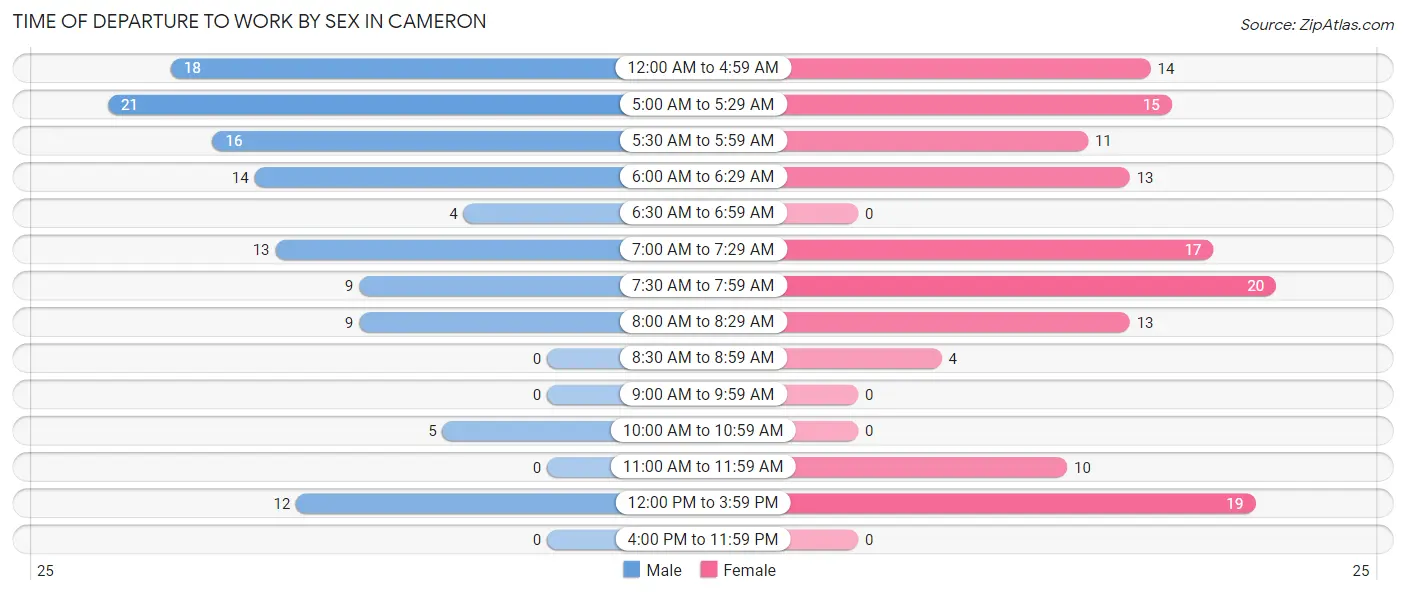
| Time of Departure | Male | Female |
| 12:00 AM to 4:59 AM | 18 (14.9%) | 14 (10.3%) |
| 5:00 AM to 5:29 AM | 21 (17.4%) | 15 (11.0%) |
| 5:30 AM to 5:59 AM | 16 (13.2%) | 11 (8.1%) |
| 6:00 AM to 6:29 AM | 14 (11.6%) | 13 (9.6%) |
| 6:30 AM to 6:59 AM | 4 (3.3%) | 0 (0.0%) |
| 7:00 AM to 7:29 AM | 13 (10.7%) | 17 (12.5%) |
| 7:30 AM to 7:59 AM | 9 (7.4%) | 20 (14.7%) |
| 8:00 AM to 8:29 AM | 9 (7.4%) | 13 (9.6%) |
| 8:30 AM to 8:59 AM | 0 (0.0%) | 4 (2.9%) |
| 9:00 AM to 9:59 AM | 0 (0.0%) | 0 (0.0%) |
| 10:00 AM to 10:59 AM | 5 (4.1%) | 0 (0.0%) |
| 11:00 AM to 11:59 AM | 0 (0.0%) | 10 (7.3%) |
| 12:00 PM to 3:59 PM | 12 (9.9%) | 19 (14.0%) |
| 4:00 PM to 11:59 PM | 0 (0.0%) | 0 (0.0%) |
| Total | 121 (100.0%) | 136 (100.0%) |
Housing Occupancy in Cameron
Occupancy by Ownership in Cameron
Of the total 249 dwellings in Cameron, owner-occupied units account for 213 (85.5%), while renter-occupied units make up 36 (14.5%).
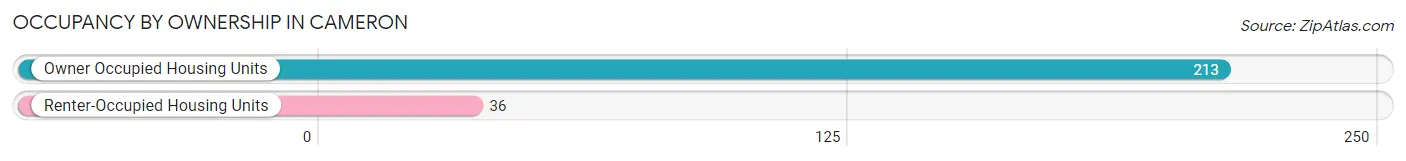
| Occupancy | # Housing Units | % Housing Units |
| Owner Occupied Housing Units | 213 | 85.5% |
| Renter-Occupied Housing Units | 36 | 14.5% |
| Total Occupied Housing Units | 249 | 100.0% |
Occupancy by Household Size in Cameron
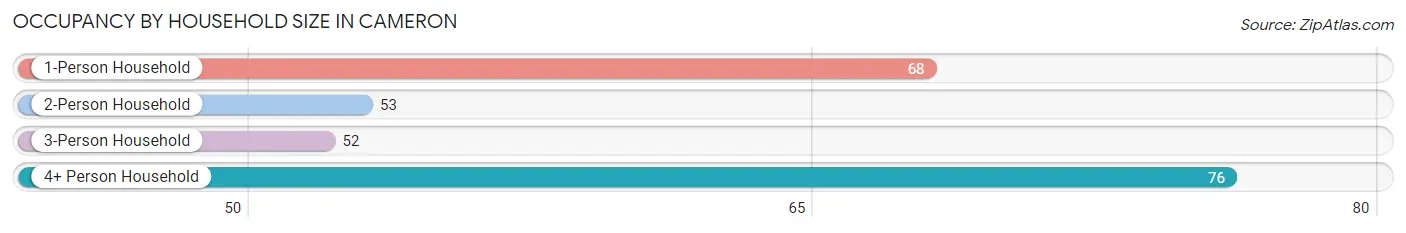
| Household Size | # Housing Units | % Housing Units |
| 1-Person Household | 68 | 27.3% |
| 2-Person Household | 53 | 21.3% |
| 3-Person Household | 52 | 20.9% |
| 4+ Person Household | 76 | 30.5% |
| Total Housing Units | 249 | 100.0% |
Occupancy by Ownership by Household Size in Cameron
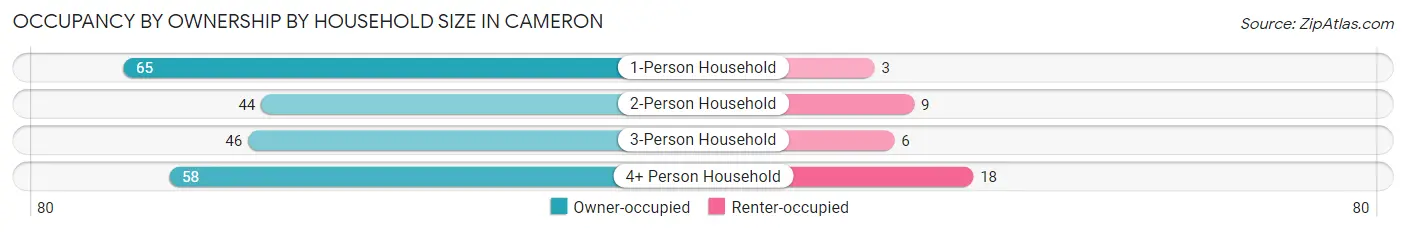
| Household Size | Owner-occupied | Renter-occupied |
| 1-Person Household | 65 (95.6%) | 3 (4.4%) |
| 2-Person Household | 44 (83.0%) | 9 (17.0%) |
| 3-Person Household | 46 (88.5%) | 6 (11.5%) |
| 4+ Person Household | 58 (76.3%) | 18 (23.7%) |
| Total Housing Units | 213 (85.5%) | 36 (14.5%) |
Occupancy by Educational Attainment in Cameron
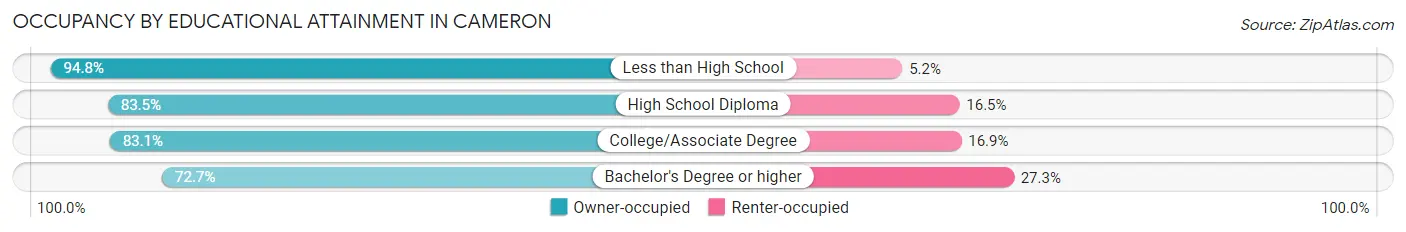
| Household Size | Owner-occupied | Renter-occupied |
| Less than High School | 55 (94.8%) | 3 (5.2%) |
| High School Diploma | 86 (83.5%) | 17 (16.5%) |
| College/Associate Degree | 64 (83.1%) | 13 (16.9%) |
| Bachelor's Degree or higher | 8 (72.7%) | 3 (27.3%) |
Occupancy by Age of Householder in Cameron
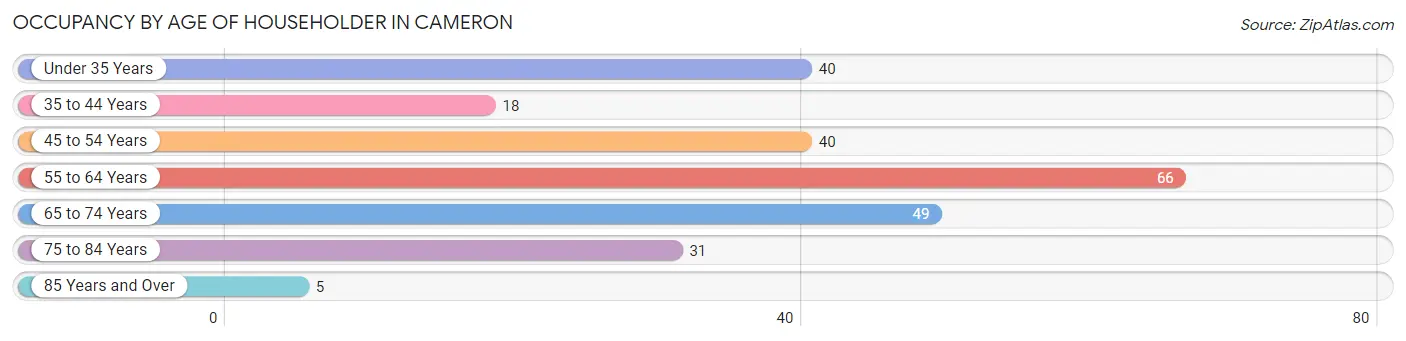
| Age Bracket | # Households | % Households |
| Under 35 Years | 40 | 16.1% |
| 35 to 44 Years | 18 | 7.2% |
| 45 to 54 Years | 40 | 16.1% |
| 55 to 64 Years | 66 | 26.5% |
| 65 to 74 Years | 49 | 19.7% |
| 75 to 84 Years | 31 | 12.4% |
| 85 Years and Over | 5 | 2.0% |
| Total | 249 | 100.0% |
Housing Finances in Cameron
Median Income by Occupancy in Cameron
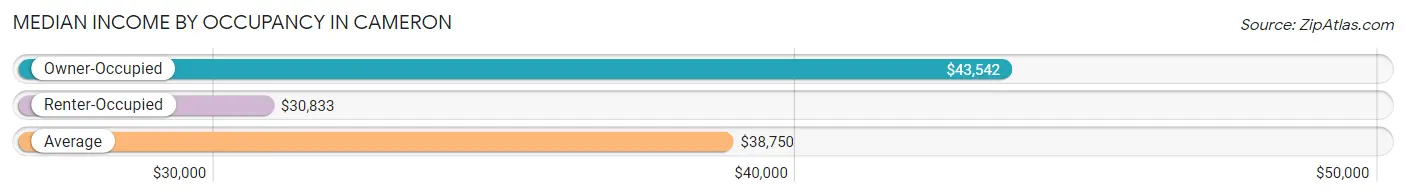
| Occupancy Type | # Households | Median Income |
| Owner-Occupied | 213 (85.5%) | $43,542 |
| Renter-Occupied | 36 (14.5%) | $30,833 |
| Average | 249 (100.0%) | $38,750 |
Occupancy by Householder Income Bracket in Cameron
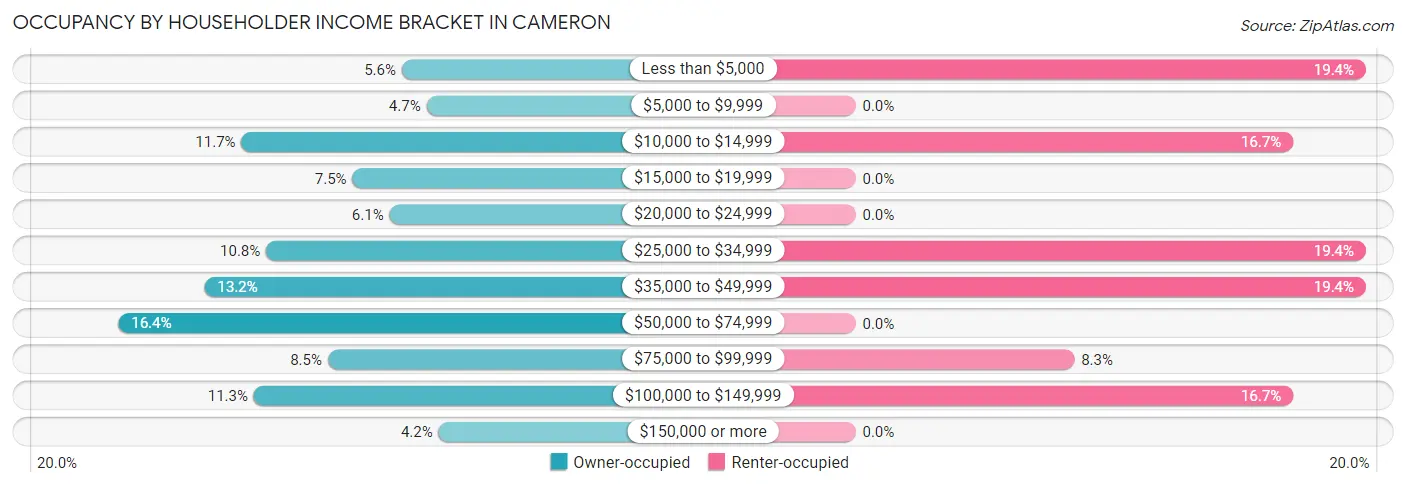
| Income Bracket | Owner-occupied | Renter-occupied |
| Less than $5,000 | 12 (5.6%) | 7 (19.4%) |
| $5,000 to $9,999 | 10 (4.7%) | 0 (0.0%) |
| $10,000 to $14,999 | 25 (11.7%) | 6 (16.7%) |
| $15,000 to $19,999 | 16 (7.5%) | 0 (0.0%) |
| $20,000 to $24,999 | 13 (6.1%) | 0 (0.0%) |
| $25,000 to $34,999 | 23 (10.8%) | 7 (19.4%) |
| $35,000 to $49,999 | 28 (13.2%) | 7 (19.4%) |
| $50,000 to $74,999 | 35 (16.4%) | 0 (0.0%) |
| $75,000 to $99,999 | 18 (8.5%) | 3 (8.3%) |
| $100,000 to $149,999 | 24 (11.3%) | 6 (16.7%) |
| $150,000 or more | 9 (4.2%) | 0 (0.0%) |
| Total | 213 (100.0%) | 36 (100.0%) |
Monthly Housing Cost Tiers in Cameron
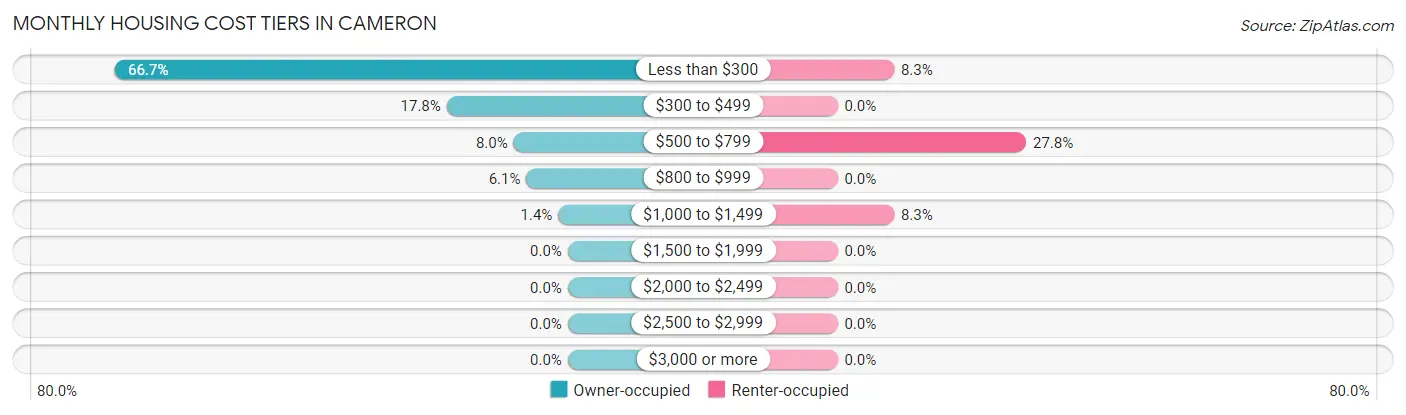
| Monthly Cost | Owner-occupied | Renter-occupied |
| Less than $300 | 142 (66.7%) | 3 (8.3%) |
| $300 to $499 | 38 (17.8%) | 0 (0.0%) |
| $500 to $799 | 17 (8.0%) | 10 (27.8%) |
| $800 to $999 | 13 (6.1%) | 0 (0.0%) |
| $1,000 to $1,499 | 3 (1.4%) | 3 (8.3%) |
| $1,500 to $1,999 | 0 (0.0%) | 0 (0.0%) |
| $2,000 to $2,499 | 0 (0.0%) | 0 (0.0%) |
| $2,500 to $2,999 | 0 (0.0%) | 0 (0.0%) |
| $3,000 or more | 0 (0.0%) | 0 (0.0%) |
| Total | 213 (100.0%) | 36 (100.0%) |
Physical Housing Characteristics in Cameron
Housing Structures in Cameron
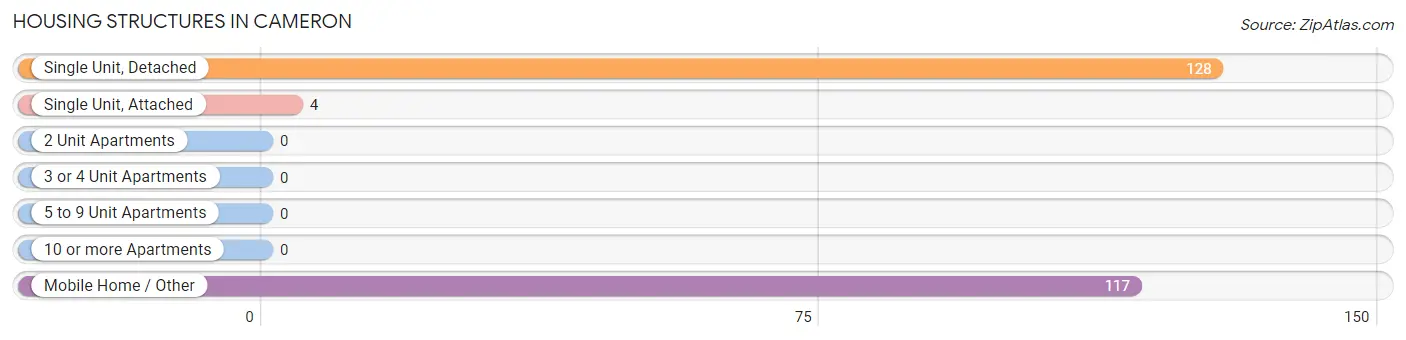
| Structure Type | # Housing Units | % Housing Units |
| Single Unit, Detached | 128 | 51.4% |
| Single Unit, Attached | 4 | 1.6% |
| 2 Unit Apartments | 0 | 0.0% |
| 3 or 4 Unit Apartments | 0 | 0.0% |
| 5 to 9 Unit Apartments | 0 | 0.0% |
| 10 or more Apartments | 0 | 0.0% |
| Mobile Home / Other | 117 | 47.0% |
| Total | 249 | 100.0% |
Housing Structures by Occupancy in Cameron
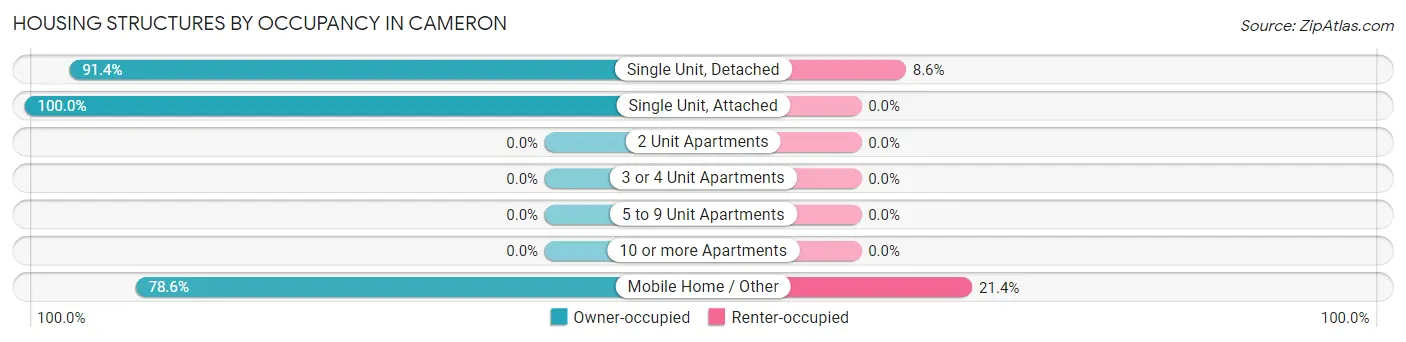
| Structure Type | Owner-occupied | Renter-occupied |
| Single Unit, Detached | 117 (91.4%) | 11 (8.6%) |
| Single Unit, Attached | 4 (100.0%) | 0 (0.0%) |
| 2 Unit Apartments | 0 (0.0%) | 0 (0.0%) |
| 3 or 4 Unit Apartments | 0 (0.0%) | 0 (0.0%) |
| 5 to 9 Unit Apartments | 0 (0.0%) | 0 (0.0%) |
| 10 or more Apartments | 0 (0.0%) | 0 (0.0%) |
| Mobile Home / Other | 92 (78.6%) | 25 (21.4%) |
| Total | 213 (85.5%) | 36 (14.5%) |
Housing Structures by Number of Rooms in Cameron
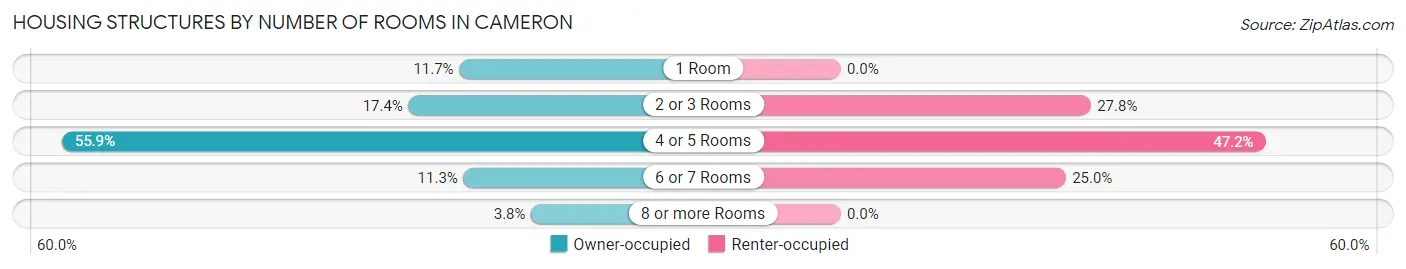
| Number of Rooms | Owner-occupied | Renter-occupied |
| 1 Room | 25 (11.7%) | 0 (0.0%) |
| 2 or 3 Rooms | 37 (17.4%) | 10 (27.8%) |
| 4 or 5 Rooms | 119 (55.9%) | 17 (47.2%) |
| 6 or 7 Rooms | 24 (11.3%) | 9 (25.0%) |
| 8 or more Rooms | 8 (3.8%) | 0 (0.0%) |
| Total | 213 (100.0%) | 36 (100.0%) |
Housing Structure by Heating Type in Cameron
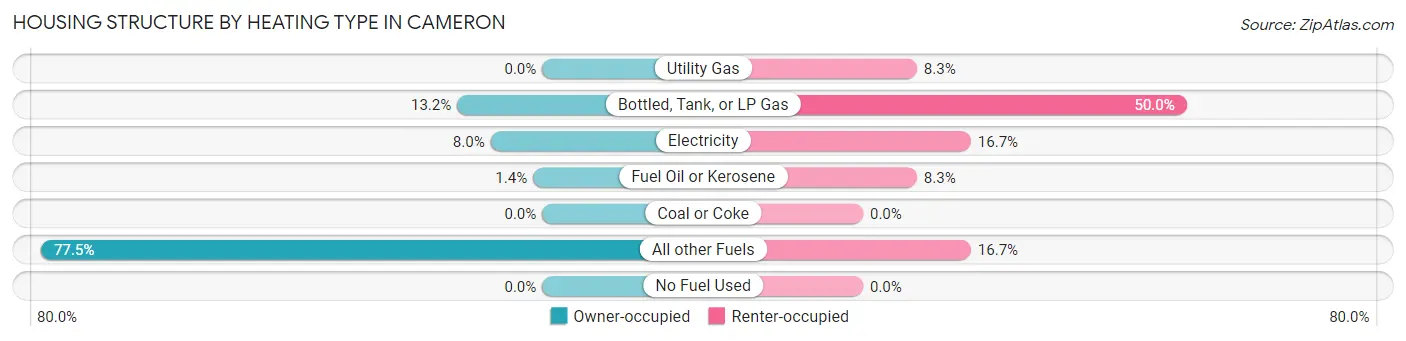
| Heating Type | Owner-occupied | Renter-occupied |
| Utility Gas | 0 (0.0%) | 3 (8.3%) |
| Bottled, Tank, or LP Gas | 28 (13.2%) | 18 (50.0%) |
| Electricity | 17 (8.0%) | 6 (16.7%) |
| Fuel Oil or Kerosene | 3 (1.4%) | 3 (8.3%) |
| Coal or Coke | 0 (0.0%) | 0 (0.0%) |
| All other Fuels | 165 (77.5%) | 6 (16.7%) |
| No Fuel Used | 0 (0.0%) | 0 (0.0%) |
| Total | 213 (100.0%) | 36 (100.0%) |
Household Vehicle Usage in Cameron
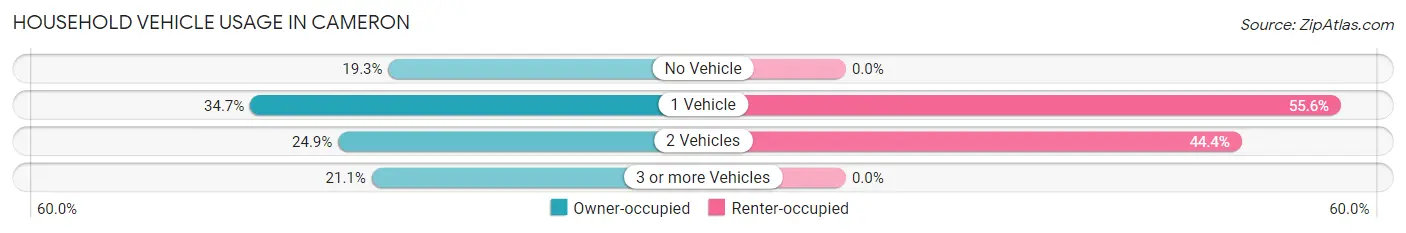
| Vehicles per Household | Owner-occupied | Renter-occupied |
| No Vehicle | 41 (19.3%) | 0 (0.0%) |
| 1 Vehicle | 74 (34.7%) | 20 (55.6%) |
| 2 Vehicles | 53 (24.9%) | 16 (44.4%) |
| 3 or more Vehicles | 45 (21.1%) | 0 (0.0%) |
| Total | 213 (100.0%) | 36 (100.0%) |
Real Estate & Mortgages in Cameron
Real Estate and Mortgage Overview in Cameron
| Characteristic | Without Mortgage | With Mortgage |
| Housing Units | 190 | 23 |
| Median Property Value | $62,700 | $65,000 |
| Median Household Income | $35,000 | $0 |
| Monthly Housing Costs | $177 | $0 |
| Real Estate Taxes | - | - |
Property Value by Mortgage Status in Cameron
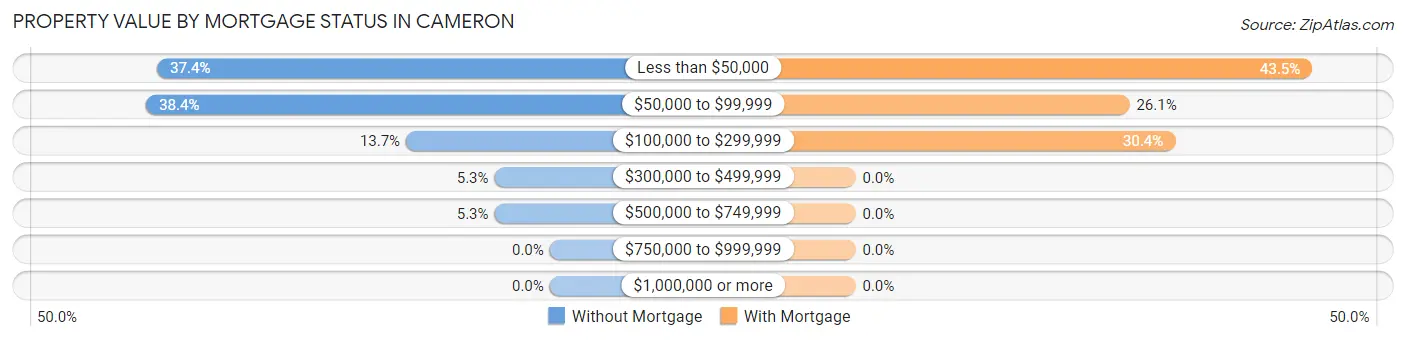
| Property Value | Without Mortgage | With Mortgage |
| Less than $50,000 | 71 (37.4%) | 10 (43.5%) |
| $50,000 to $99,999 | 73 (38.4%) | 6 (26.1%) |
| $100,000 to $299,999 | 26 (13.7%) | 7 (30.4%) |
| $300,000 to $499,999 | 10 (5.3%) | 0 (0.0%) |
| $500,000 to $749,999 | 10 (5.3%) | 0 (0.0%) |
| $750,000 to $999,999 | 0 (0.0%) | 0 (0.0%) |
| $1,000,000 or more | 0 (0.0%) | 0 (0.0%) |
| Total | 190 (100.0%) | 23 (100.0%) |
Household Income by Mortgage Status in Cameron
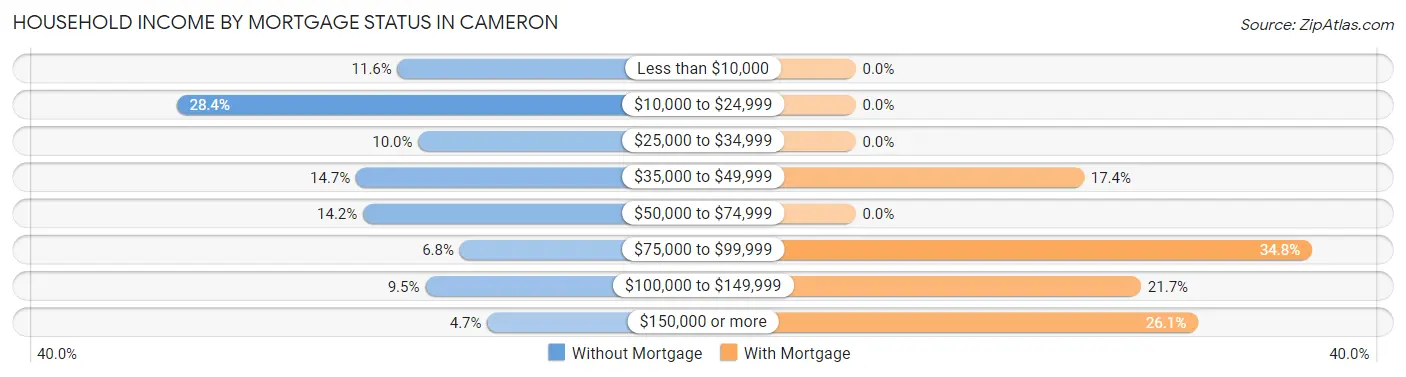
| Household Income | Without Mortgage | With Mortgage |
| Less than $10,000 | 22 (11.6%) | 0 (0.0%) |
| $10,000 to $24,999 | 54 (28.4%) | 0 (0.0%) |
| $25,000 to $34,999 | 19 (10.0%) | 0 (0.0%) |
| $35,000 to $49,999 | 28 (14.7%) | 4 (17.4%) |
| $50,000 to $74,999 | 27 (14.2%) | 0 (0.0%) |
| $75,000 to $99,999 | 13 (6.8%) | 8 (34.8%) |
| $100,000 to $149,999 | 18 (9.5%) | 5 (21.7%) |
| $150,000 or more | 9 (4.7%) | 6 (26.1%) |
| Total | 190 (100.0%) | 23 (100.0%) |
Property Value to Household Income Ratio in Cameron
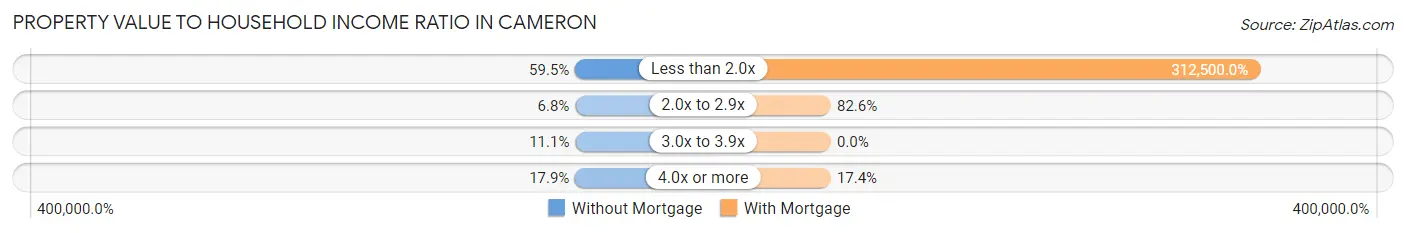
| Value-to-Income Ratio | Without Mortgage | With Mortgage |
| Less than 2.0x | 113 (59.5%) | 71,875 (312,500.0%) |
| 2.0x to 2.9x | 13 (6.8%) | 19 (82.6%) |
| 3.0x to 3.9x | 21 (11.1%) | 0 (0.0%) |
| 4.0x or more | 34 (17.9%) | 4 (17.4%) |
| Total | 190 (100.0%) | 23 (100.0%) |
Real Estate Taxes by Mortgage Status in Cameron
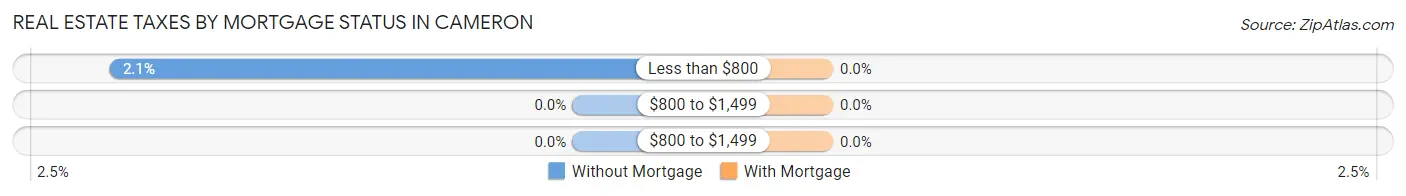
| Property Taxes | Without Mortgage | With Mortgage |
| Less than $800 | 4 (2.1%) | 0 (0.0%) |
| $800 to $1,499 | 0 (0.0%) | 0 (0.0%) |
| $800 to $1,499 | 0 (0.0%) | 0 (0.0%) |
| Total | 190 (100.0%) | 23 (100.0%) |
Health & Disability in Cameron
Health Insurance Coverage by Age in Cameron
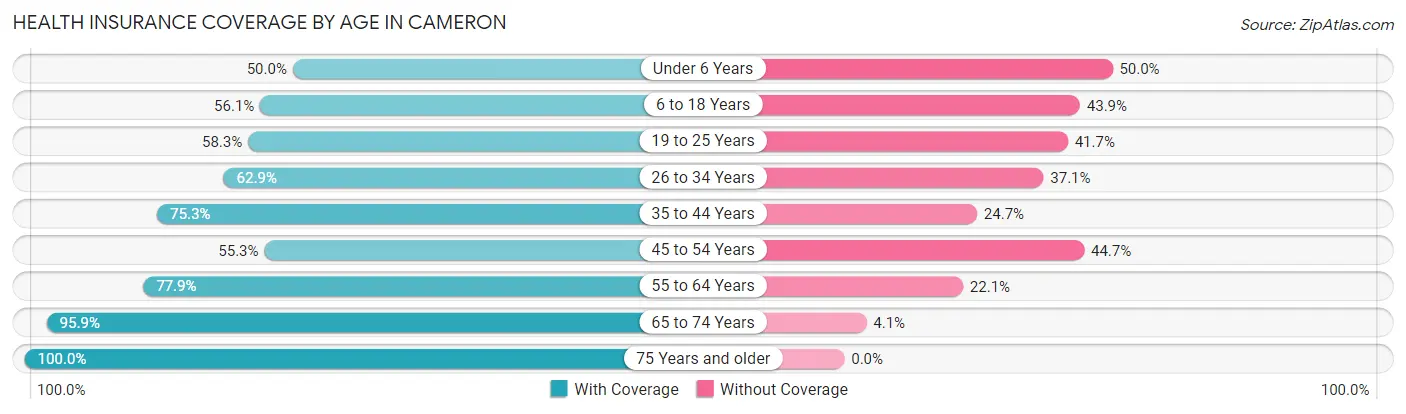
| Age Bracket | With Coverage | Without Coverage |
| Under 6 Years | 21 (50.0%) | 21 (50.0%) |
| 6 to 18 Years | 60 (56.1%) | 47 (43.9%) |
| 19 to 25 Years | 42 (58.3%) | 30 (41.7%) |
| 26 to 34 Years | 83 (62.9%) | 49 (37.1%) |
| 35 to 44 Years | 70 (75.3%) | 23 (24.7%) |
| 45 to 54 Years | 47 (55.3%) | 38 (44.7%) |
| 55 to 64 Years | 88 (77.9%) | 25 (22.1%) |
| 65 to 74 Years | 70 (95.9%) | 3 (4.1%) |
| 75 Years and older | 63 (100.0%) | 0 (0.0%) |
| Total | 544 (69.7%) | 236 (30.3%) |
Health Insurance Coverage by Citizenship Status in Cameron
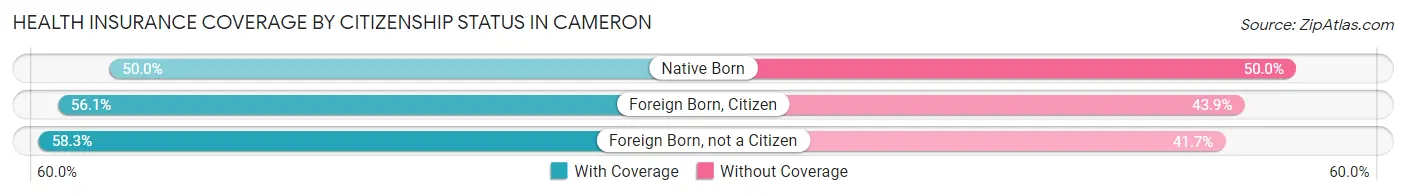
| Citizenship Status | With Coverage | Without Coverage |
| Native Born | 21 (50.0%) | 21 (50.0%) |
| Foreign Born, Citizen | 60 (56.1%) | 47 (43.9%) |
| Foreign Born, not a Citizen | 42 (58.3%) | 30 (41.7%) |
Health Insurance Coverage by Household Income in Cameron
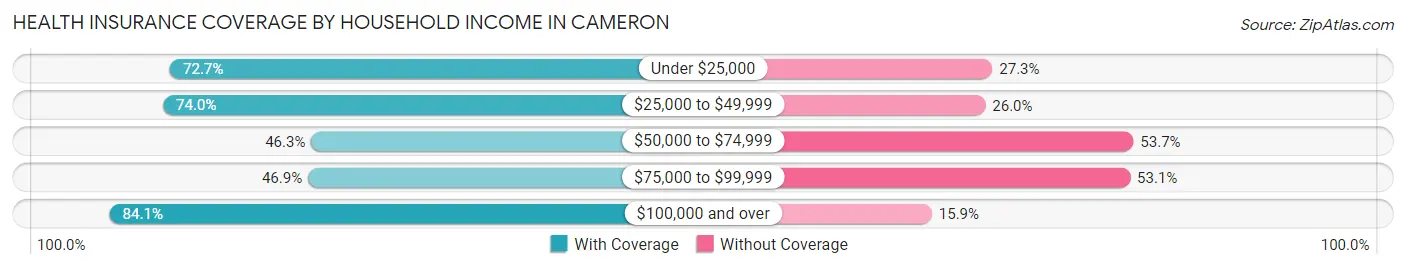
| Household Income | With Coverage | Without Coverage |
| Under $25,000 | 128 (72.7%) | 48 (27.3%) |
| $25,000 to $49,999 | 154 (74.0%) | 54 (26.0%) |
| $50,000 to $74,999 | 50 (46.3%) | 58 (53.7%) |
| $75,000 to $99,999 | 38 (46.9%) | 43 (53.1%) |
| $100,000 and over | 174 (84.1%) | 33 (15.9%) |
Public vs Private Health Insurance Coverage by Age in Cameron
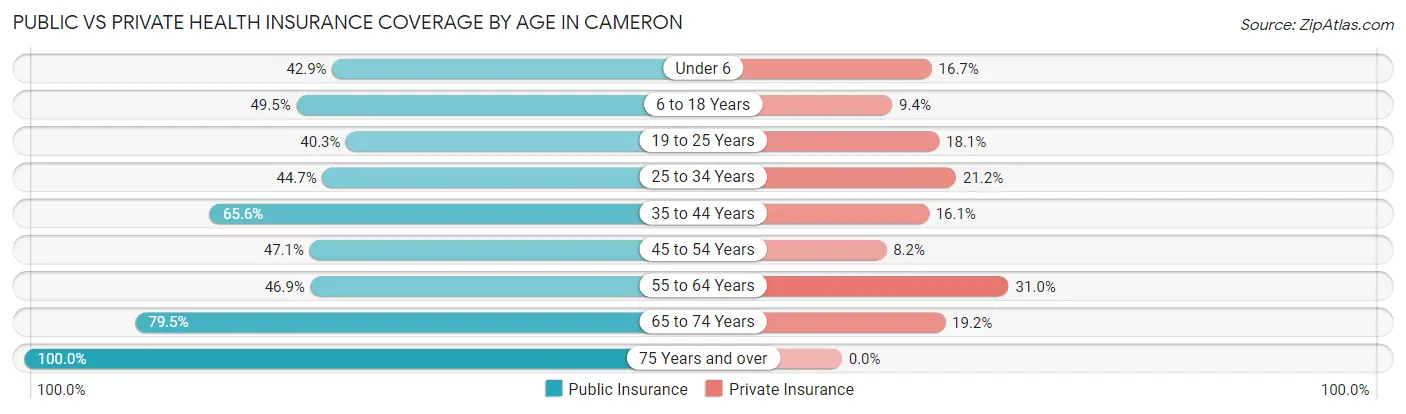
| Age Bracket | Public Insurance | Private Insurance |
| Under 6 | 18 (42.9%) | 7 (16.7%) |
| 6 to 18 Years | 53 (49.5%) | 10 (9.3%) |
| 19 to 25 Years | 29 (40.3%) | 13 (18.1%) |
| 25 to 34 Years | 59 (44.7%) | 28 (21.2%) |
| 35 to 44 Years | 61 (65.6%) | 15 (16.1%) |
| 45 to 54 Years | 40 (47.1%) | 7 (8.2%) |
| 55 to 64 Years | 53 (46.9%) | 35 (31.0%) |
| 65 to 74 Years | 58 (79.4%) | 14 (19.2%) |
| 75 Years and over | 63 (100.0%) | 0 (0.0%) |
| Total | 434 (55.6%) | 129 (16.5%) |
Disability Status by Sex by Age in Cameron
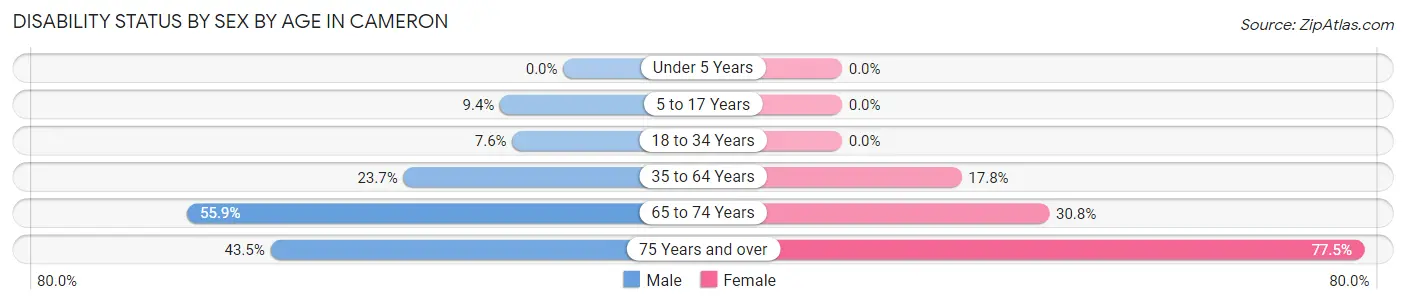
| Age Bracket | Male | Female |
| Under 5 Years | 0 (0.0%) | 0 (0.0%) |
| 5 to 17 Years | 6 (9.4%) | 0 (0.0%) |
| 18 to 34 Years | 9 (7.6%) | 0 (0.0%) |
| 35 to 64 Years | 33 (23.7%) | 27 (17.8%) |
| 65 to 74 Years | 19 (55.9%) | 12 (30.8%) |
| 75 Years and over | 10 (43.5%) | 31 (77.5%) |
Disability Class by Sex by Age in Cameron
Disability Class: Hearing Difficulty
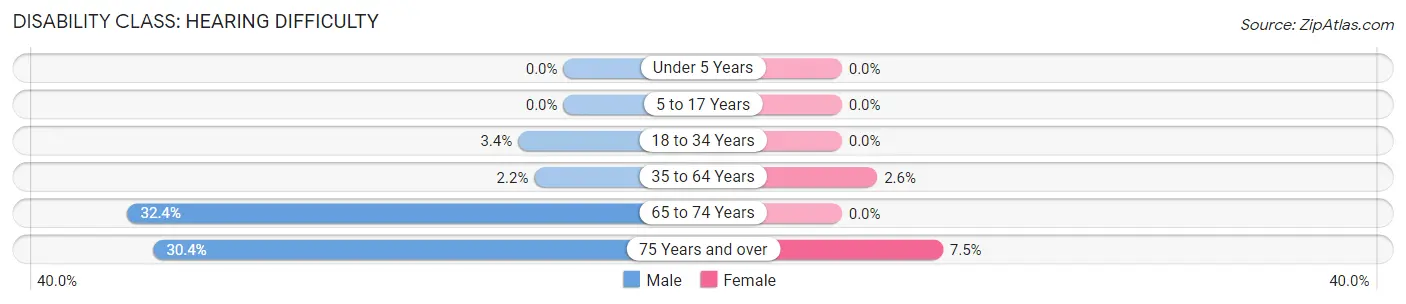
| Age Bracket | Male | Female |
| Under 5 Years | 0 (0.0%) | 0 (0.0%) |
| 5 to 17 Years | 0 (0.0%) | 0 (0.0%) |
| 18 to 34 Years | 4 (3.4%) | 0 (0.0%) |
| 35 to 64 Years | 3 (2.2%) | 4 (2.6%) |
| 65 to 74 Years | 11 (32.4%) | 0 (0.0%) |
| 75 Years and over | 7 (30.4%) | 3 (7.5%) |
Disability Class: Vision Difficulty
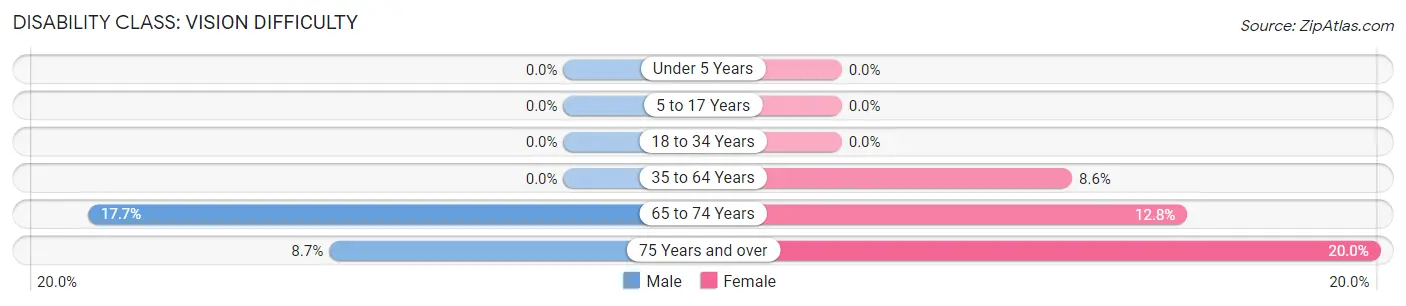
| Age Bracket | Male | Female |
| Under 5 Years | 0 (0.0%) | 0 (0.0%) |
| 5 to 17 Years | 0 (0.0%) | 0 (0.0%) |
| 18 to 34 Years | 0 (0.0%) | 0 (0.0%) |
| 35 to 64 Years | 0 (0.0%) | 13 (8.6%) |
| 65 to 74 Years | 6 (17.6%) | 5 (12.8%) |
| 75 Years and over | 2 (8.7%) | 8 (20.0%) |
Disability Class: Cognitive Difficulty
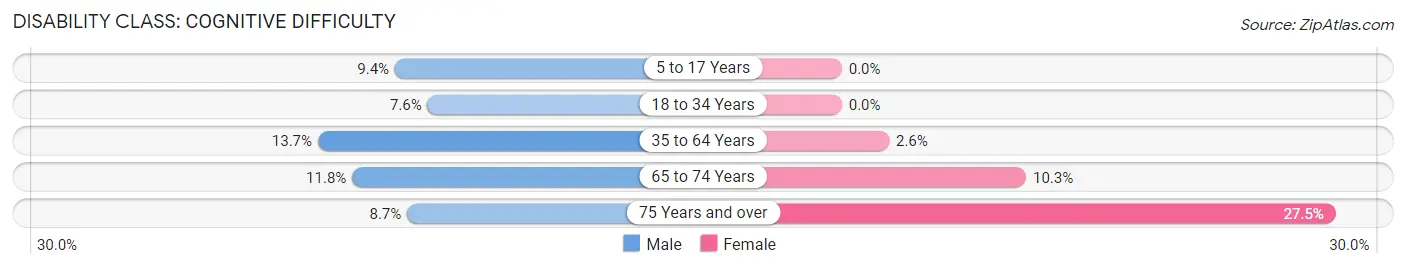
| Age Bracket | Male | Female |
| 5 to 17 Years | 6 (9.4%) | 0 (0.0%) |
| 18 to 34 Years | 9 (7.6%) | 0 (0.0%) |
| 35 to 64 Years | 19 (13.7%) | 4 (2.6%) |
| 65 to 74 Years | 4 (11.8%) | 4 (10.3%) |
| 75 Years and over | 2 (8.7%) | 11 (27.5%) |
Disability Class: Ambulatory Difficulty
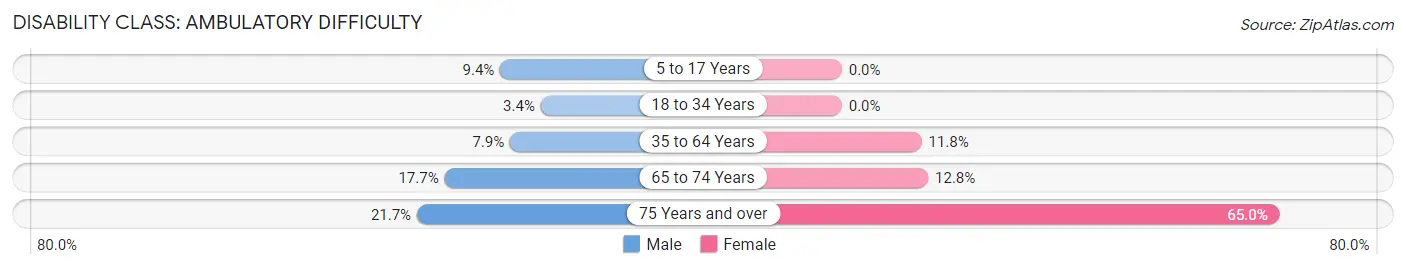
| Age Bracket | Male | Female |
| 5 to 17 Years | 6 (9.4%) | 0 (0.0%) |
| 18 to 34 Years | 4 (3.4%) | 0 (0.0%) |
| 35 to 64 Years | 11 (7.9%) | 18 (11.8%) |
| 65 to 74 Years | 6 (17.6%) | 5 (12.8%) |
| 75 Years and over | 5 (21.7%) | 26 (65.0%) |
Disability Class: Self-Care Difficulty
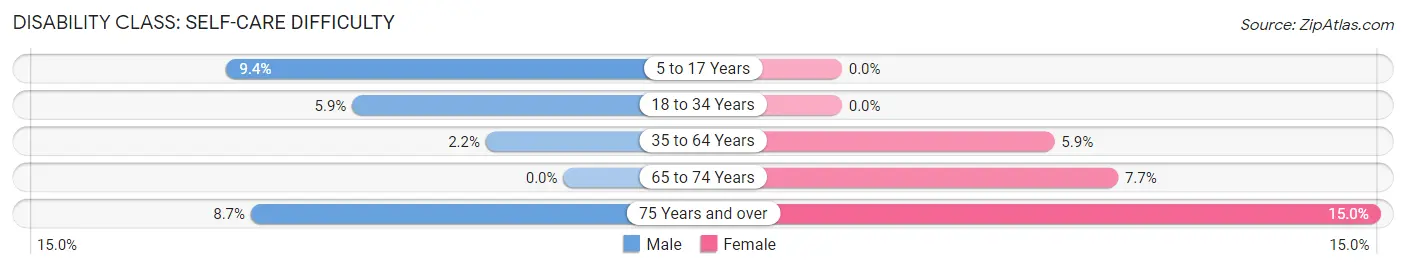
| Age Bracket | Male | Female |
| 5 to 17 Years | 6 (9.4%) | 0 (0.0%) |
| 18 to 34 Years | 7 (5.9%) | 0 (0.0%) |
| 35 to 64 Years | 3 (2.2%) | 9 (5.9%) |
| 65 to 74 Years | 0 (0.0%) | 3 (7.7%) |
| 75 Years and over | 2 (8.7%) | 6 (15.0%) |
Technology Access in Cameron
Computing Device Access in Cameron
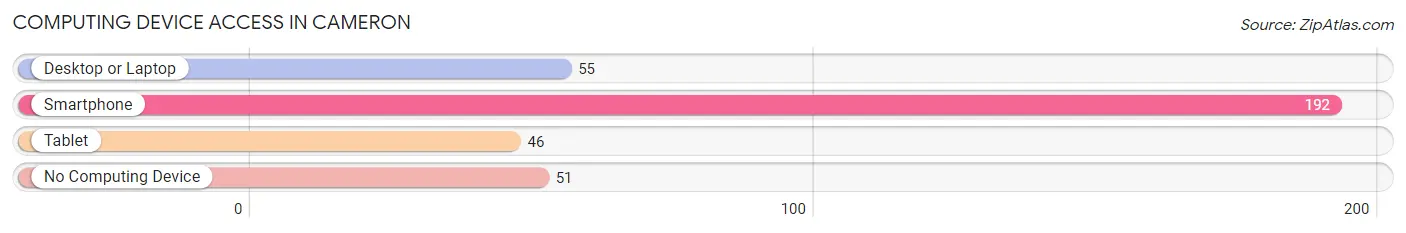
| Device Type | # Households | % Households |
| Desktop or Laptop | 55 | 22.1% |
| Smartphone | 192 | 77.1% |
| Tablet | 46 | 18.5% |
| No Computing Device | 51 | 20.5% |
| Total | 249 | 100.0% |
Internet Access in Cameron
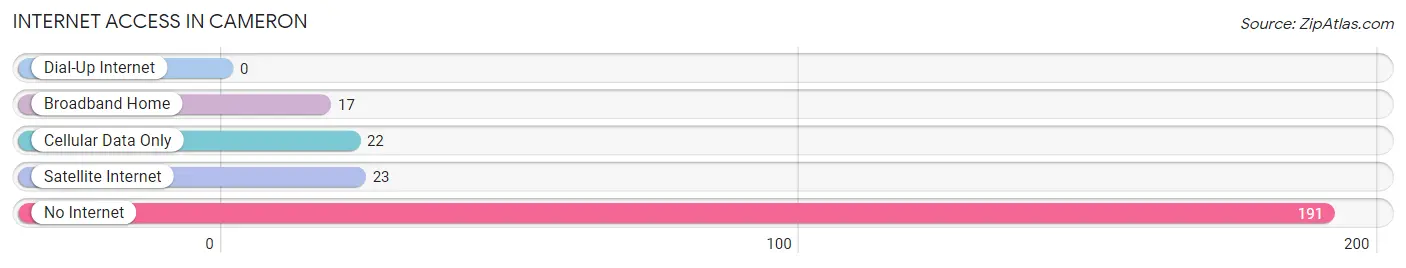
| Internet Type | # Households | % Households |
| Dial-Up Internet | 0 | 0.0% |
| Broadband Home | 17 | 6.8% |
| Cellular Data Only | 22 | 8.8% |
| Satellite Internet | 23 | 9.2% |
| No Internet | 191 | 76.7% |
| Total | 249 | 100.0% |
Cameron Summary
Cameron, Arizona is a small unincorporated community located in Coconino County, Arizona. It is situated on the Navajo Nation Reservation, approximately 25 miles east of Flagstaff. The population of Cameron was estimated to be around 1,000 in 2020.
History
Cameron was established in 1876 as a trading post for the Navajo people. The trading post was built by John Cameron, a Scottish immigrant who had come to the area in search of gold. Cameron quickly realized that trading with the Navajo was more profitable than mining, and he established a trading post in the area. The trading post was a success, and Cameron soon opened a store and a post office.
In 1882, the Atlantic and Pacific Railroad was built through the area, connecting Cameron to Flagstaff and other nearby towns. This allowed for increased trade and commerce in the area, and Cameron soon became a hub for the Navajo people.
In the early 1900s, the area around Cameron was opened up to homesteaders. Many of these homesteaders were Mormon settlers from Utah, and they established farms and ranches in the area. The Mormon settlers also built a church in Cameron, which still stands today.
Geography
Cameron is located in the northern part of Coconino County, Arizona. It is situated on the Navajo Nation Reservation, approximately 25 miles east of Flagstaff. The area around Cameron is mostly flat, with some rolling hills. The climate is semi-arid, with hot summers and cold winters.
Economy
The economy of Cameron is largely based on tourism and agriculture. The area is home to several tourist attractions, including the Cameron Trading Post, the Cameron Museum, and the Cameron Indian School. The trading post and museum are popular destinations for tourists, and the Indian school is a popular destination for students and researchers.
Agriculture is also an important part of the local economy. The area around Cameron is home to several farms and ranches, which produce a variety of crops and livestock.
Demographics
As of 2020, the population of Cameron was estimated to be around 1,000. The majority of the population is Native American, with the Navajo people making up the largest ethnic group. The median household income in Cameron is $30,000, and the median home value is $90,000. The unemployment rate in Cameron is higher than the national average, at 8.2%.
Common Questions
What is Per Capita Income in Cameron?
Per Capita income in Cameron is $18,910.
What is the Median Family Income in Cameron?
Median Family Income in Cameron is $47,054.
What is the Median Household income in Cameron?
Median Household Income in Cameron is $38,750.
What is Income or Wage Gap in Cameron?
Income or Wage Gap in Cameron is 17.7%.
Women in Cameron earn 82.3 cents for every dollar earned by a man.
What is Inequality or Gini Index in Cameron?
Inequality or Gini Index in Cameron is 0.49.
What is the Total Population of Cameron?
Total Population of Cameron is 780.
What is the Total Male Population of Cameron?
Total Male Population of Cameron is 386.
What is the Total Female Population of Cameron?
Total Female Population of Cameron is 394.
What is the Ratio of Males per 100 Females in Cameron?
There are 97.97 Males per 100 Females in Cameron.
What is the Ratio of Females per 100 Males in Cameron?
There are 102.07 Females per 100 Males in Cameron.
What is the Median Population Age in Cameron?
Median Population Age in Cameron is 39.3 Years.
What is the Average Family Size in Cameron
Average Family Size in Cameron is 3.6 People.
What is the Average Household Size in Cameron
Average Household Size in Cameron is 3.1 People.
How Large is the Labor Force in Cameron?
There are 346 People in the Labor Forcein in Cameron.
What is the Percentage of People in the Labor Force in Cameron?
52.8% of People are in the Labor Force in Cameron.
What is the Unemployment Rate in Cameron?
Unemployment Rate in Cameron is 18.8%.