Cactus Flats, AZ Map & Demographics
Cactus Flats Map
Cactus Flats Overview
$23,490
PER CAPITA INCOME
$56,250
AVG FAMILY INCOME
$56,111
AVG HOUSEHOLD INCOME
54.6%
WAGE / INCOME GAP [ % ]
45.4¢/ $1
WAGE / INCOME GAP [ $ ]
0.38
INEQUALITY / GINI INDEX
1,238
TOTAL POPULATION
658
MALE POPULATION
580
FEMALE POPULATION
113.45
MALES / 100 FEMALES
88.15
FEMALES / 100 MALES
42.1
MEDIAN AGE
3.3
AVG FAMILY SIZE
2.8
AVG HOUSEHOLD SIZE
385
LABOR FORCE [ PEOPLE ]
42.0%
PERCENT IN LABOR FORCE
1.8%
UNEMPLOYMENT RATE
Income in Cactus Flats
Income Overview in Cactus Flats
Per Capita Income in Cactus Flats is $23,490, while median incomes of families and households are $56,250 and $56,111 respectively.
| Characteristic | Number | Measure |
| Per Capita Income | 1,238 | $23,490 |
| Median Family Income | 316 | $56,250 |
| Mean Family Income | 316 | $69,672 |
| Median Household Income | 448 | $56,111 |
| Mean Household Income | 448 | $66,575 |
| Income Deficit | 316 | $0 |
| Wage / Income Gap (%) | 1,238 | 54.63% |
| Wage / Income Gap ($) | 1,238 | 45.37¢ per $1 |
| Gini / Inequality Index | 1,238 | 0.38 |
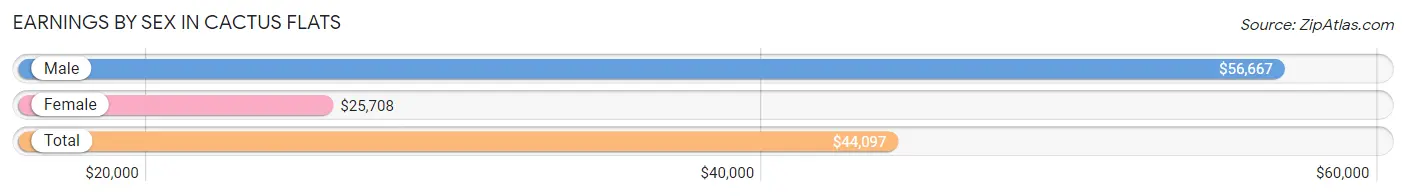
Earnings by Sex in Cactus Flats
Average Earnings in Cactus Flats are $44,097, $56,667 for men and $25,708 for women, a difference of 54.6%.
| Sex | Number | Average Earnings |
| Male | 316 (75.4%) | $56,667 |
| Female | 103 (24.6%) | $25,708 |
| Total | 419 (100.0%) | $44,097 |
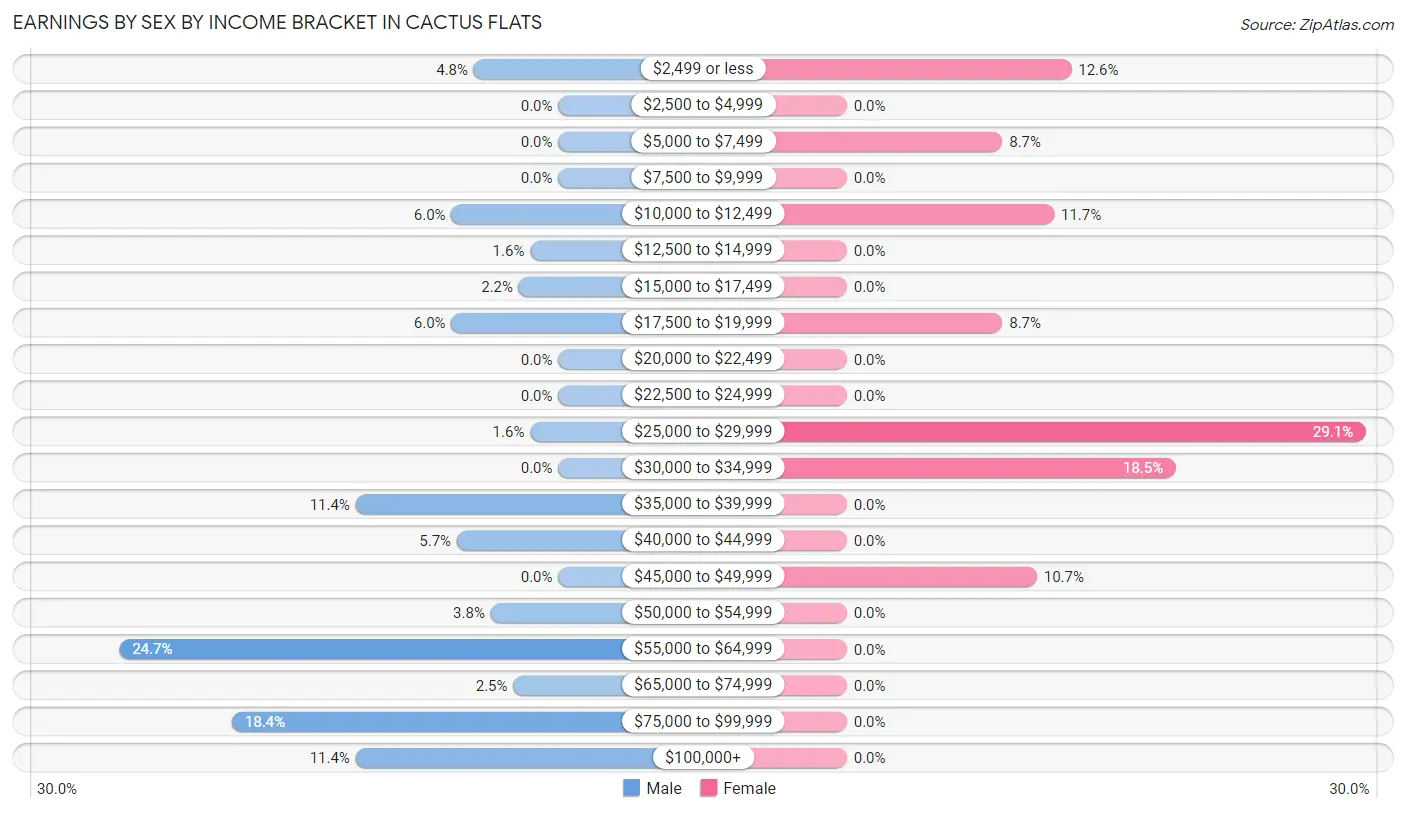
Earnings by Sex by Income Bracket in Cactus Flats
The most common earnings brackets in Cactus Flats are $55,000 to $64,999 for men (78 | 24.7%) and $25,000 to $29,999 for women (30 | 29.1%).
| Income | Male | Female |
| $2,499 or less | 15 (4.8%) | 13 (12.6%) |
| $2,500 to $4,999 | 0 (0.0%) | 0 (0.0%) |
| $5,000 to $7,499 | 0 (0.0%) | 9 (8.7%) |
| $7,500 to $9,999 | 0 (0.0%) | 0 (0.0%) |
| $10,000 to $12,499 | 19 (6.0%) | 12 (11.7%) |
| $12,500 to $14,999 | 5 (1.6%) | 0 (0.0%) |
| $15,000 to $17,499 | 7 (2.2%) | 0 (0.0%) |
| $17,500 to $19,999 | 19 (6.0%) | 9 (8.7%) |
| $20,000 to $22,499 | 0 (0.0%) | 0 (0.0%) |
| $22,500 to $24,999 | 0 (0.0%) | 0 (0.0%) |
| $25,000 to $29,999 | 5 (1.6%) | 30 (29.1%) |
| $30,000 to $34,999 | 0 (0.0%) | 19 (18.4%) |
| $35,000 to $39,999 | 36 (11.4%) | 0 (0.0%) |
| $40,000 to $44,999 | 18 (5.7%) | 0 (0.0%) |
| $45,000 to $49,999 | 0 (0.0%) | 11 (10.7%) |
| $50,000 to $54,999 | 12 (3.8%) | 0 (0.0%) |
| $55,000 to $64,999 | 78 (24.7%) | 0 (0.0%) |
| $65,000 to $74,999 | 8 (2.5%) | 0 (0.0%) |
| $75,000 to $99,999 | 58 (18.3%) | 0 (0.0%) |
| $100,000+ | 36 (11.4%) | 0 (0.0%) |
| Total | 316 (100.0%) | 103 (100.0%) |
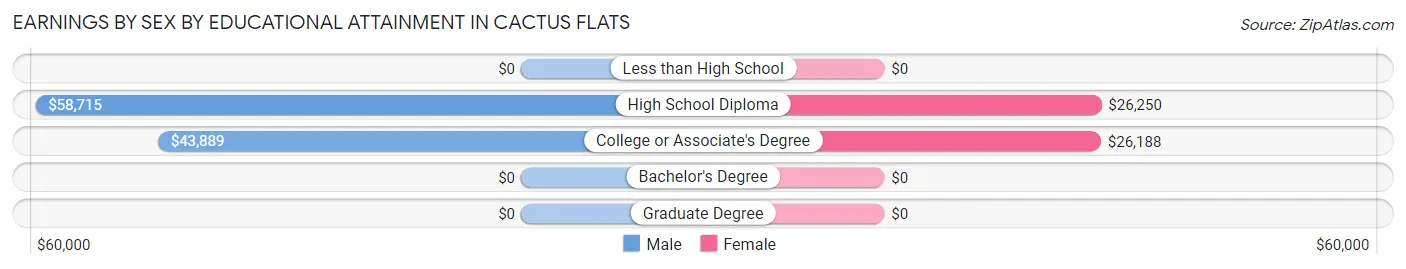
Earnings by Sex by Educational Attainment in Cactus Flats
Average earnings in Cactus Flats are $57,743 for men and $26,208 for women, a difference of 54.6%. Men with an educational attainment of high school diploma enjoy the highest average annual earnings of $58,715, while those with college or associate's degree education earn the least with $43,889. Women with an educational attainment of high school diploma earn the most with the average annual earnings of $26,250, while those with college or associate's degree education have the smallest earnings of $26,188.
| Educational Attainment | Male Income | Female Income |
| Less than High School | - | - |
| High School Diploma | $58,715 | $26,250 |
| College or Associate's Degree | $43,889 | $26,188 |
| Bachelor's Degree | - | - |
| Graduate Degree | - | - |
| Total | $57,743 | $26,208 |
Family Income in Cactus Flats
Family Income Brackets in Cactus Flats
According to the Cactus Flats family income data, there are 104 families falling into the $35,000 to $49,999 income range, which is the most common income bracket and makes up 32.9% of all families.
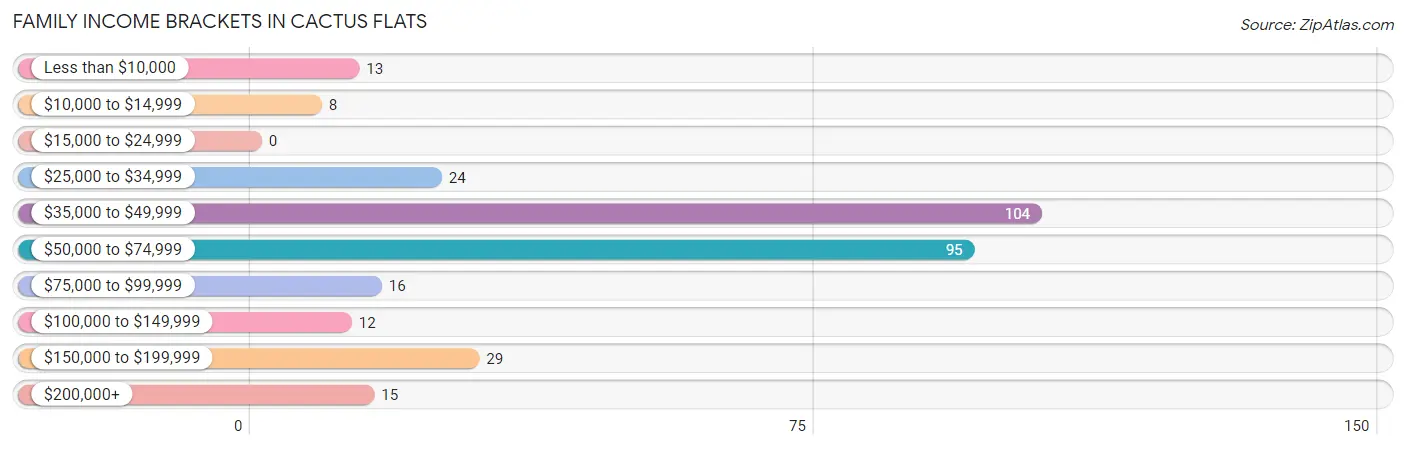
| Income Bracket | # Families | % Families |
| Less than $10,000 | 13 | 4.1% |
| $10,000 to $14,999 | 8 | 2.5% |
| $15,000 to $24,999 | 0 | 0.0% |
| $25,000 to $34,999 | 24 | 7.6% |
| $35,000 to $49,999 | 104 | 32.9% |
| $50,000 to $74,999 | 95 | 30.1% |
| $75,000 to $99,999 | 16 | 5.1% |
| $100,000 to $149,999 | 12 | 3.8% |
| $150,000 to $199,999 | 29 | 9.2% |
| $200,000+ | 15 | 4.7% |
Family Income by Famaliy Size in Cactus Flats
3-person families (116 | 36.7%) account for the highest median family income in Cactus Flats with $48,056 per family, while 3-person families (116 | 36.7%) have the highest median income of $16,019 per family member.
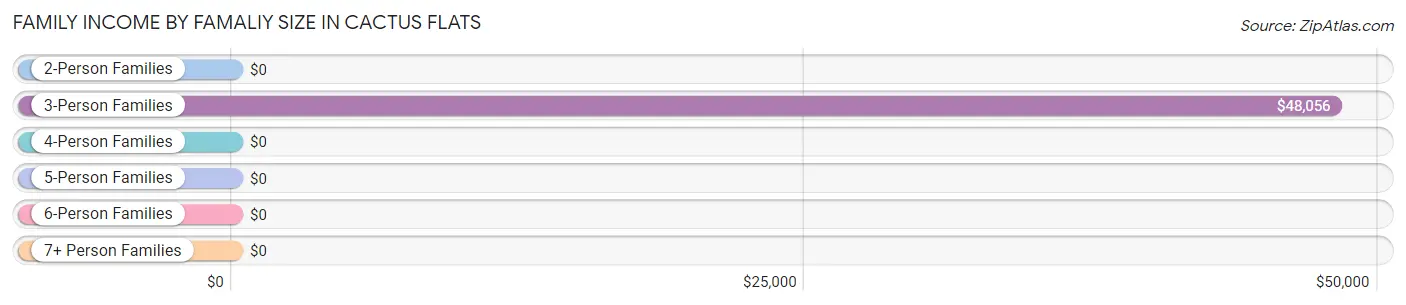
| Income Bracket | # Families | Median Income |
| 2-Person Families | 130 (41.1%) | $0 |
| 3-Person Families | 116 (36.7%) | $48,056 |
| 4-Person Families | 15 (4.8%) | $0 |
| 5-Person Families | 9 (2.9%) | $0 |
| 6-Person Families | 33 (10.4%) | $0 |
| 7+ Person Families | 13 (4.1%) | $0 |
| Total | 316 (100.0%) | $56,250 |
Family Income by Number of Earners in Cactus Flats
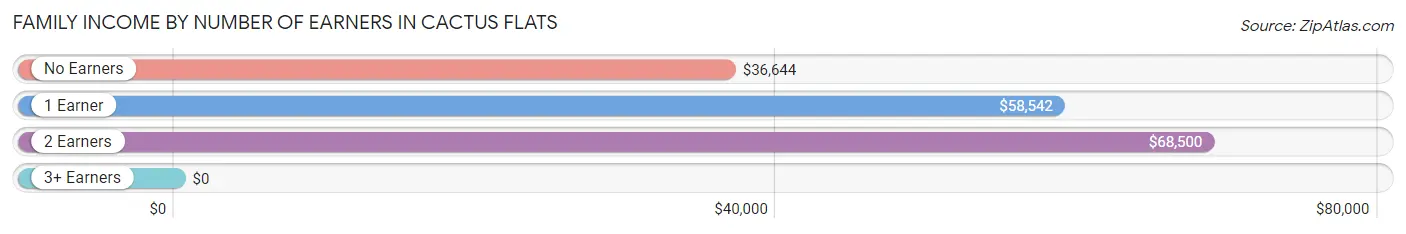
| Number of Earners | # Families | Median Income |
| No Earners | 85 (26.9%) | $36,644 |
| 1 Earner | 160 (50.6%) | $58,542 |
| 2 Earners | 62 (19.6%) | $68,500 |
| 3+ Earners | 9 (2.9%) | $0 |
| Total | 316 (100.0%) | $56,250 |
Household Income in Cactus Flats
Household Income Brackets in Cactus Flats
With 114 households falling in the category, the $35,000 to $49,999 income range is the most frequent in Cactus Flats, accounting for 25.5% of all households. In contrast, only 6 households (1.3%) fall into the $15,000 to $24,999 income bracket, making it the least populous group.
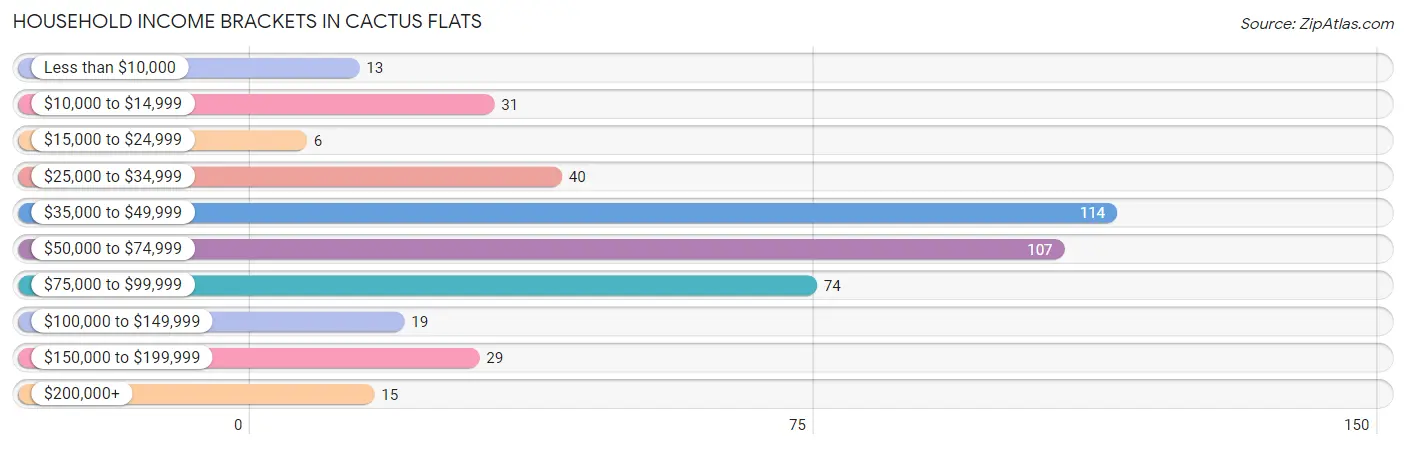
| Income Bracket | # Households | % Households |
| Less than $10,000 | 13 | 2.9% |
| $10,000 to $14,999 | 31 | 6.9% |
| $15,000 to $24,999 | 6 | 1.3% |
| $25,000 to $34,999 | 40 | 8.9% |
| $35,000 to $49,999 | 114 | 25.4% |
| $50,000 to $74,999 | 107 | 23.9% |
| $75,000 to $99,999 | 74 | 16.5% |
| $100,000 to $149,999 | 19 | 4.2% |
| $150,000 to $199,999 | 29 | 6.5% |
| $200,000+ | 15 | 3.3% |
Household Income by Householder Age in Cactus Flats
The median household income in Cactus Flats is $56,111, with the highest median household income of $73,077 found in the 25 to 44 years age bracket for the primary householder. A total of 122 households (27.2%) fall into this category. Meanwhile, the 15 to 24 years age bracket for the primary householder has the lowest median household income of $0, with 8 households (1.8%) in this group.
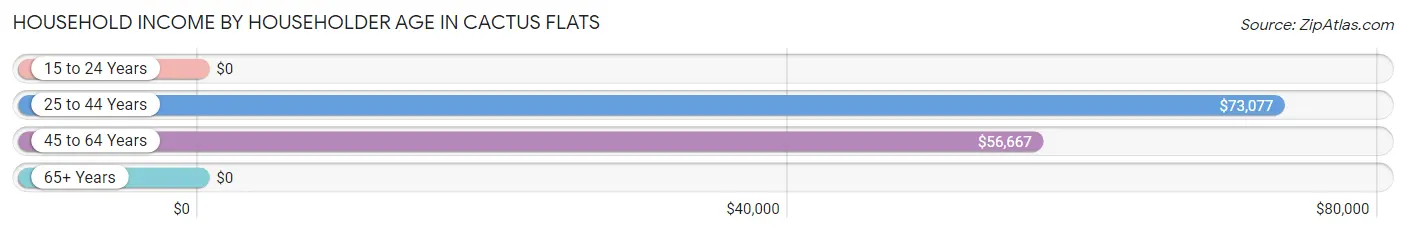
| Income Bracket | # Households | Median Income |
| 15 to 24 Years | 8 (1.8%) | $0 |
| 25 to 44 Years | 122 (27.2%) | $73,077 |
| 45 to 64 Years | 226 (50.4%) | $56,667 |
| 65+ Years | 92 (20.5%) | $0 |
| Total | 448 (100.0%) | $56,111 |
Poverty in Cactus Flats
Income Below Poverty by Sex and Age in Cactus Flats
With 15.3% poverty level for males and 20.0% for females among the residents of Cactus Flats, 6 to 11 year old males and 15 year old females are the most vulnerable to poverty, with 26 males (100.0%) and 17 females (100.0%) in their respective age groups living below the poverty level.
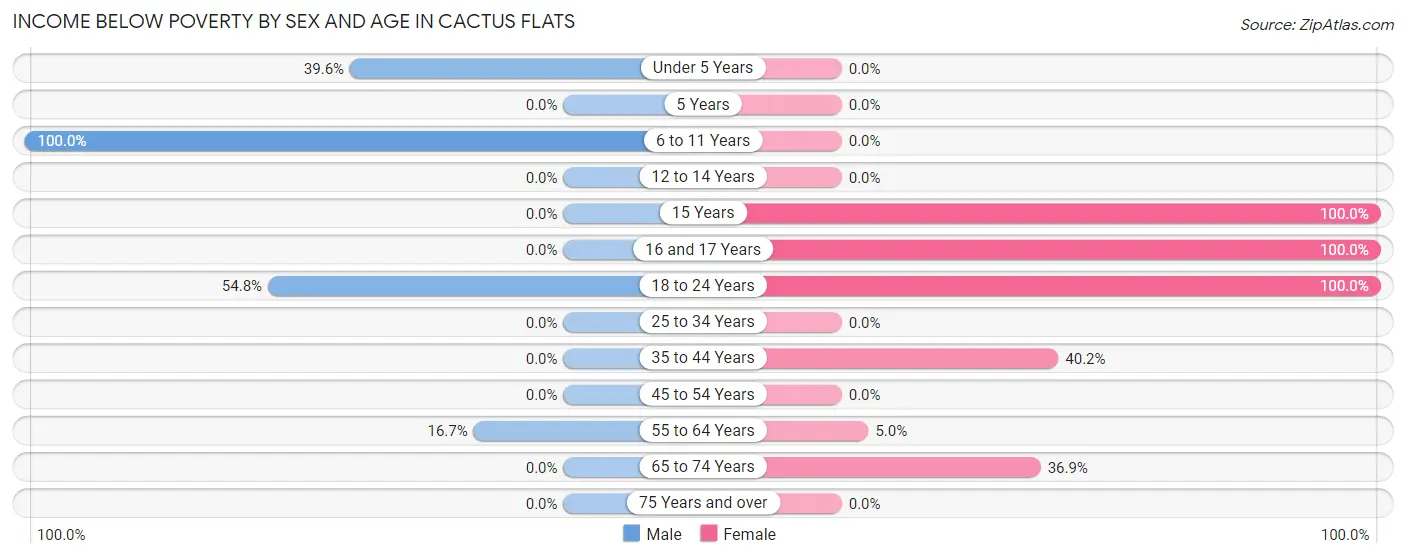
| Age Bracket | Male | Female |
| Under 5 Years | 42 (39.6%) | 0 (0.0%) |
| 5 Years | 0 (0.0%) | 0 (0.0%) |
| 6 to 11 Years | 26 (100.0%) | 0 (0.0%) |
| 12 to 14 Years | 0 (0.0%) | 0 (0.0%) |
| 15 Years | 0 (0.0%) | 17 (100.0%) |
| 16 and 17 Years | 0 (0.0%) | 17 (100.0%) |
| 18 to 24 Years | 17 (54.8%) | 12 (100.0%) |
| 25 to 34 Years | 0 (0.0%) | 0 (0.0%) |
| 35 to 44 Years | 0 (0.0%) | 41 (40.2%) |
| 45 to 54 Years | 0 (0.0%) | 0 (0.0%) |
| 55 to 64 Years | 16 (16.7%) | 5 (5.0%) |
| 65 to 74 Years | 0 (0.0%) | 24 (36.9%) |
| 75 Years and over | 0 (0.0%) | 0 (0.0%) |
| Total | 101 (15.3%) | 116 (20.0%) |
Income Above Poverty by Sex and Age in Cactus Flats
According to the poverty statistics in Cactus Flats, males aged 12 to 14 years and females aged under 5 years are the age groups that are most secure financially, with 100.0% of males and 100.0% of females in these age groups living above the poverty line.
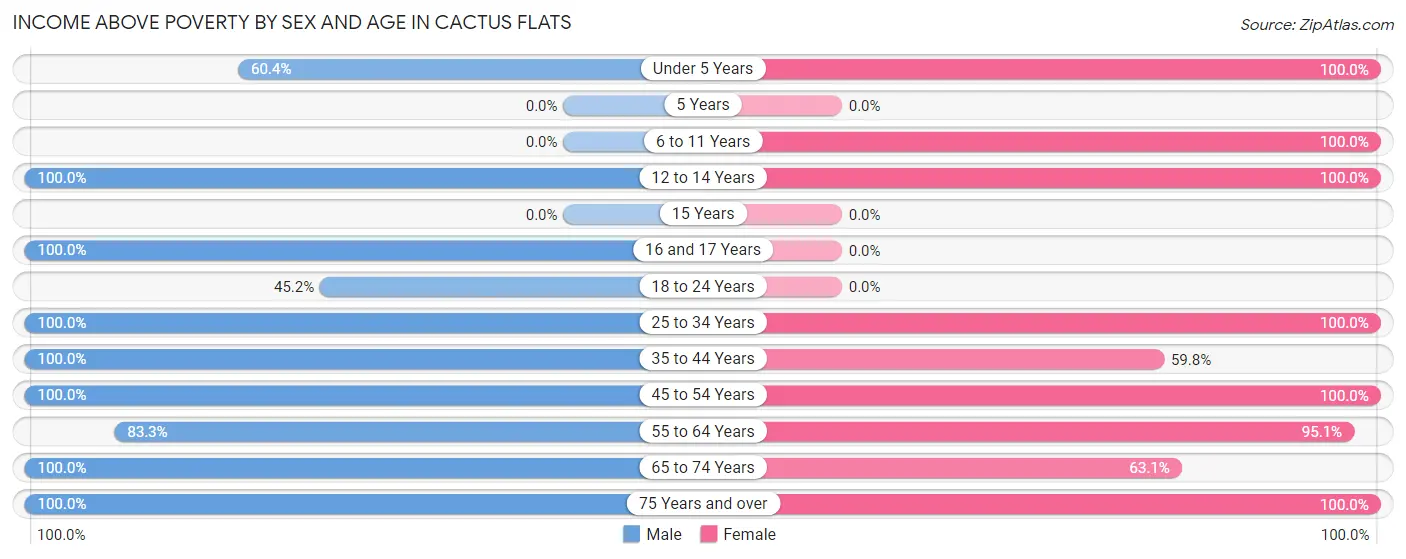
| Age Bracket | Male | Female |
| Under 5 Years | 64 (60.4%) | 40 (100.0%) |
| 5 Years | 0 (0.0%) | 0 (0.0%) |
| 6 to 11 Years | 0 (0.0%) | 59 (100.0%) |
| 12 to 14 Years | 9 (100.0%) | 64 (100.0%) |
| 15 Years | 0 (0.0%) | 0 (0.0%) |
| 16 and 17 Years | 110 (100.0%) | 0 (0.0%) |
| 18 to 24 Years | 14 (45.2%) | 0 (0.0%) |
| 25 to 34 Years | 49 (100.0%) | 17 (100.0%) |
| 35 to 44 Years | 114 (100.0%) | 61 (59.8%) |
| 45 to 54 Years | 59 (100.0%) | 37 (100.0%) |
| 55 to 64 Years | 80 (83.3%) | 96 (95.1%) |
| 65 to 74 Years | 34 (100.0%) | 41 (63.1%) |
| 75 Years and over | 24 (100.0%) | 49 (100.0%) |
| Total | 557 (84.7%) | 464 (80.0%) |
Income Below Poverty Among Married-Couple Families in Cactus Flats
The poverty statistics for married-couple families in Cactus Flats show that 4.5% or 8 of the total 178 families live below the poverty line. Families with no children have the highest poverty rate of 7.8%, comprising of 8 families. On the other hand, families with 1 or 2 children have the lowest poverty rate of 0.0%, which includes 0 families.
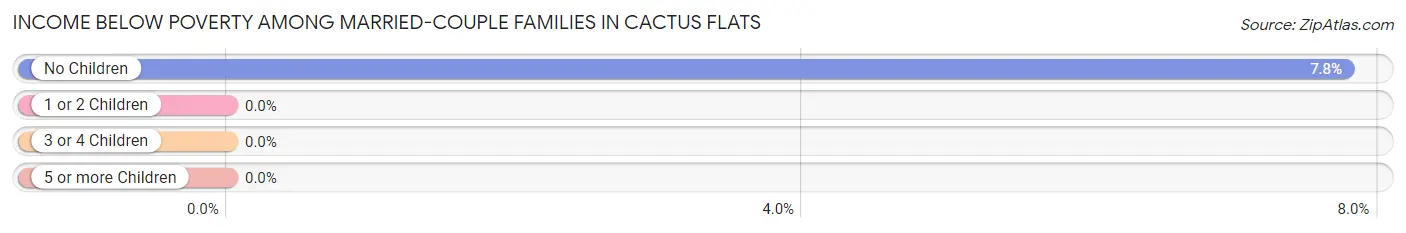
| Children | Above Poverty | Below Poverty |
| No Children | 95 (92.2%) | 8 (7.8%) |
| 1 or 2 Children | 49 (100.0%) | 0 (0.0%) |
| 3 or 4 Children | 26 (100.0%) | 0 (0.0%) |
| 5 or more Children | 0 (0.0%) | 0 (0.0%) |
| Total | 170 (95.5%) | 8 (4.5%) |
Income Below Poverty Among Single-Parent Households in Cactus Flats
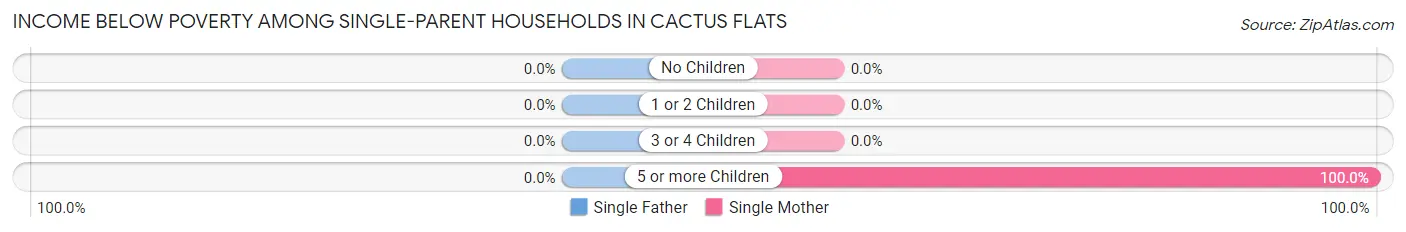
| Children | Single Father | Single Mother |
| No Children | 0 (0.0%) | 0 (0.0%) |
| 1 or 2 Children | 0 (0.0%) | 0 (0.0%) |
| 3 or 4 Children | 0 (0.0%) | 0 (0.0%) |
| 5 or more Children | 0 (0.0%) | 13 (100.0%) |
| Total | 0 (0.0%) | 13 (15.5%) |
Income Below Poverty Among Married-Couple vs Single-Parent Households in Cactus Flats
The poverty data for Cactus Flats shows that 8 of the married-couple family households (4.5%) and 13 of the single-parent households (9.4%) are living below the poverty level. Within the married-couple family households, those with no children have the highest poverty rate, with 8 households (7.8%) falling below the poverty line. Among the single-parent households, those with 5 or more children have the highest poverty rate, with 13 household (100.0%) living below poverty.
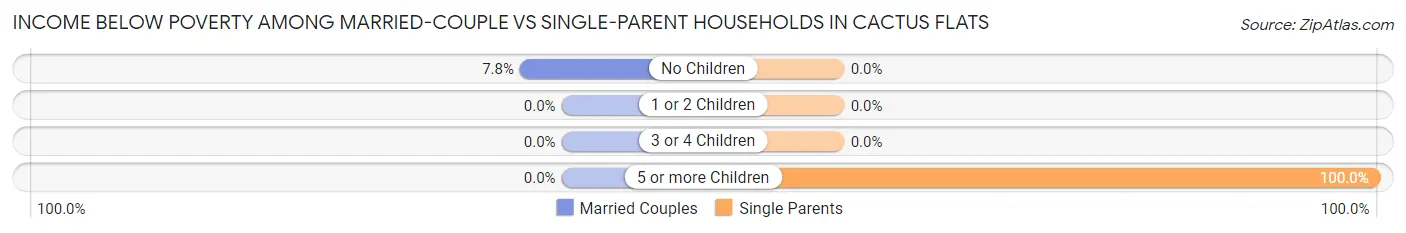
| Children | Married-Couple Families | Single-Parent Households |
| No Children | 8 (7.8%) | 0 (0.0%) |
| 1 or 2 Children | 0 (0.0%) | 0 (0.0%) |
| 3 or 4 Children | 0 (0.0%) | 0 (0.0%) |
| 5 or more Children | 0 (0.0%) | 13 (100.0%) |
| Total | 8 (4.5%) | 13 (9.4%) |
Race in Cactus Flats
The most populous races in Cactus Flats are White / Caucasian (1,158 | 93.5%), Hispanic or Latino (323 | 26.1%), and Two or more Races (55 | 4.4%).
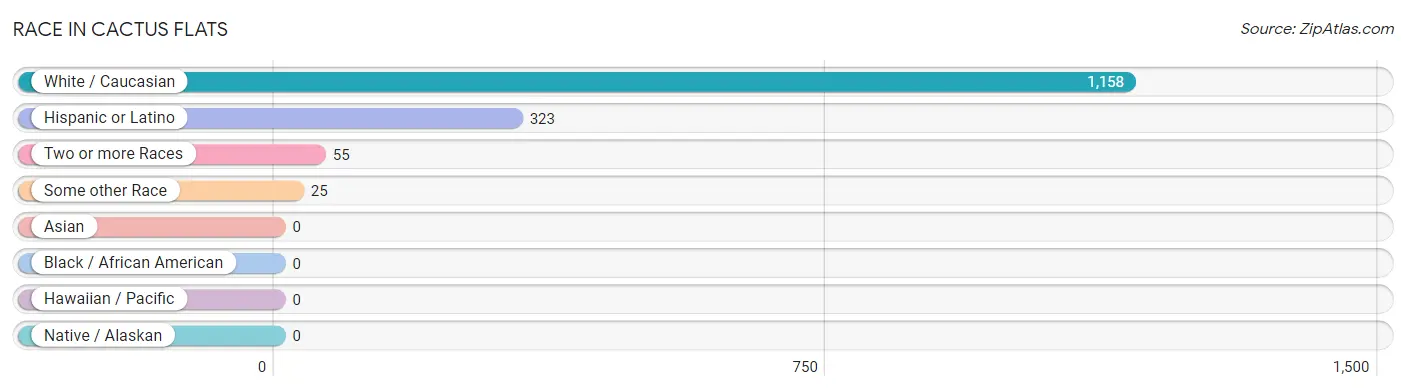
| Race | # Population | % Population |
| Asian | 0 | 0.0% |
| Black / African American | 0 | 0.0% |
| Hawaiian / Pacific | 0 | 0.0% |
| Hispanic or Latino | 323 | 26.1% |
| Native / Alaskan | 0 | 0.0% |
| White / Caucasian | 1,158 | 93.5% |
| Two or more Races | 55 | 4.4% |
| Some other Race | 25 | 2.0% |
| Total | 1,238 | 100.0% |
Ancestry in Cactus Flats
The most populous ancestries reported in Cactus Flats are Mexican (195 | 15.8%), English (60 | 4.9%), Italian (38 | 3.1%), German (23 | 1.9%), and American (18 | 1.5%), together accounting for 27.0% of all Cactus Flats residents.
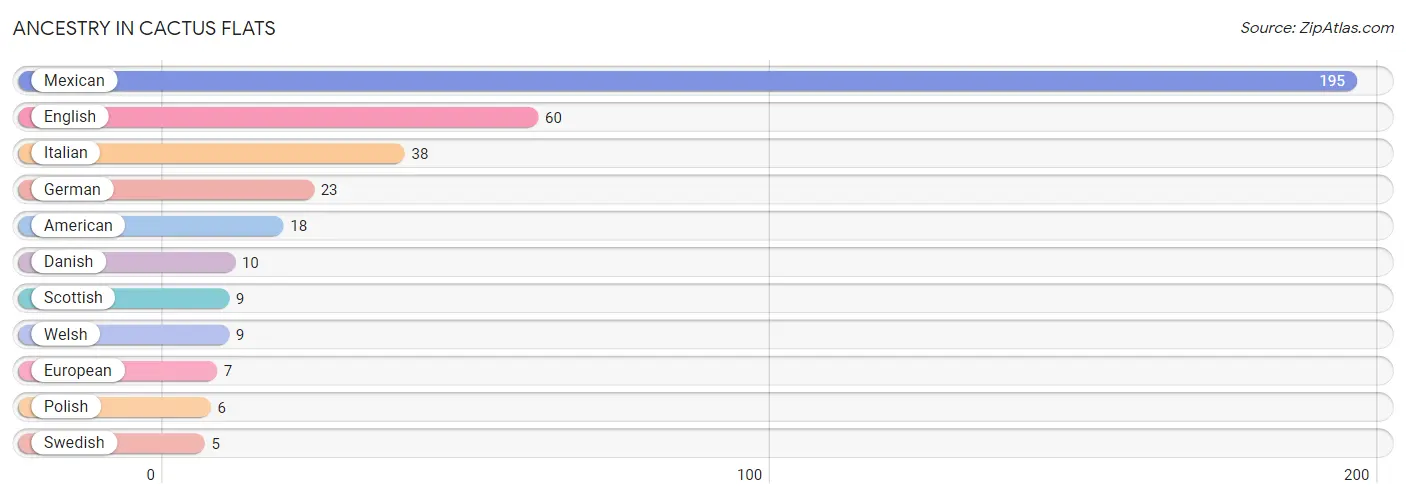
| Ancestry | # Population | % Population |
| American | 18 | 1.5% |
| Danish | 10 | 0.8% |
| English | 60 | 4.9% |
| European | 7 | 0.6% |
| German | 23 | 1.9% |
| Italian | 38 | 3.1% |
| Mexican | 195 | 15.8% |
| Polish | 6 | 0.5% |
| Scottish | 9 | 0.7% |
| Swedish | 5 | 0.4% |
| Welsh | 9 | 0.7% | View All 11 Rows |
Immigrants in Cactus Flats

| Immigration Origin | # Population | % Population | View All 0 Rows |
Sex and Age in Cactus Flats
Sex and Age in Cactus Flats
The most populous age groups in Cactus Flats are 15 to 19 Years (124 | 18.8%) for men and 10 to 14 Years (99 | 17.1%) for women.
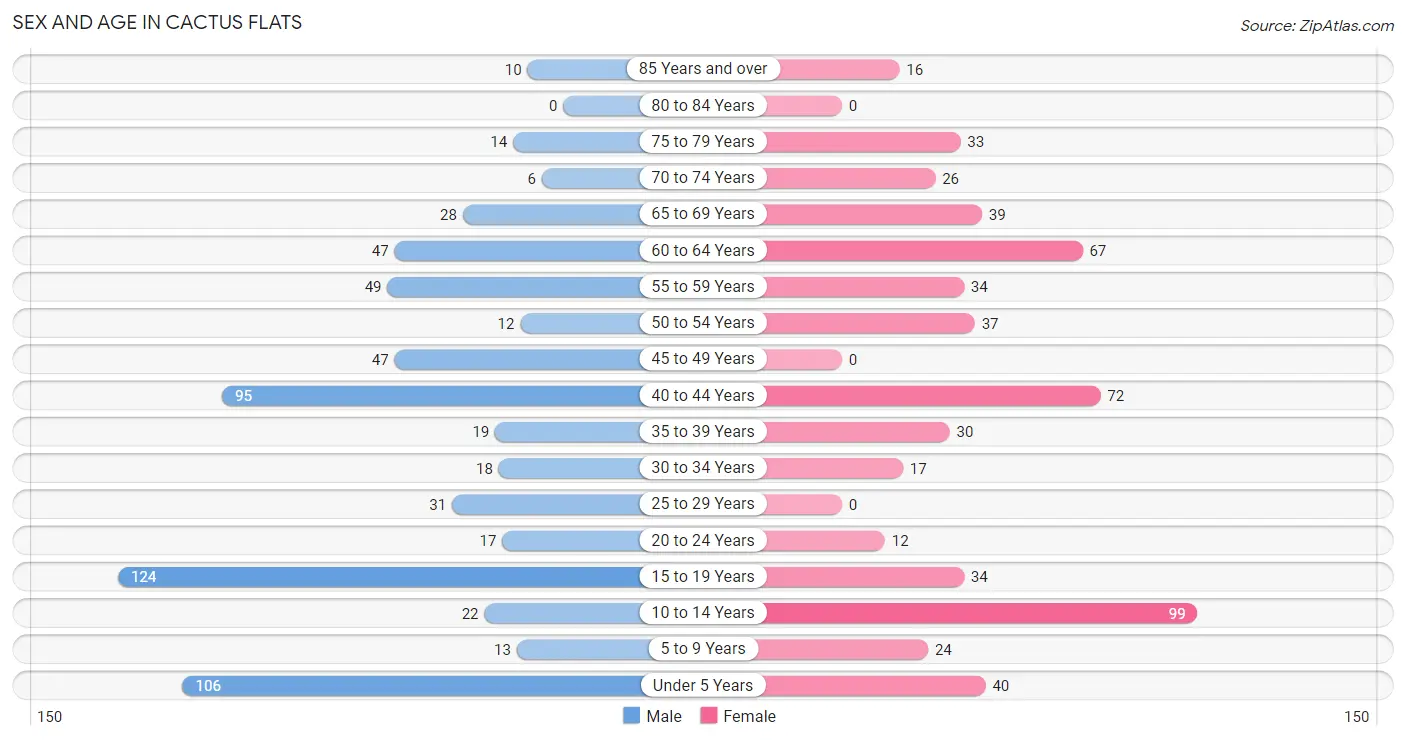
| Age Bracket | Male | Female |
| Under 5 Years | 106 (16.1%) | 40 (6.9%) |
| 5 to 9 Years | 13 (2.0%) | 24 (4.1%) |
| 10 to 14 Years | 22 (3.3%) | 99 (17.1%) |
| 15 to 19 Years | 124 (18.8%) | 34 (5.9%) |
| 20 to 24 Years | 17 (2.6%) | 12 (2.1%) |
| 25 to 29 Years | 31 (4.7%) | 0 (0.0%) |
| 30 to 34 Years | 18 (2.7%) | 17 (2.9%) |
| 35 to 39 Years | 19 (2.9%) | 30 (5.2%) |
| 40 to 44 Years | 95 (14.4%) | 72 (12.4%) |
| 45 to 49 Years | 47 (7.1%) | 0 (0.0%) |
| 50 to 54 Years | 12 (1.8%) | 37 (6.4%) |
| 55 to 59 Years | 49 (7.4%) | 34 (5.9%) |
| 60 to 64 Years | 47 (7.1%) | 67 (11.6%) |
| 65 to 69 Years | 28 (4.3%) | 39 (6.7%) |
| 70 to 74 Years | 6 (0.9%) | 26 (4.5%) |
| 75 to 79 Years | 14 (2.1%) | 33 (5.7%) |
| 80 to 84 Years | 0 (0.0%) | 0 (0.0%) |
| 85 Years and over | 10 (1.5%) | 16 (2.8%) |
| Total | 658 (100.0%) | 580 (100.0%) |
Families and Households in Cactus Flats
Median Family Size in Cactus Flats
The median family size in Cactus Flats is 3.30 persons per family, with single female/mother families (84 | 26.6%) accounting for the largest median family size of 3.56 persons per family. On the other hand, single male/father families (54 | 17.1%) represent the smallest median family size with 2.57 persons per family.
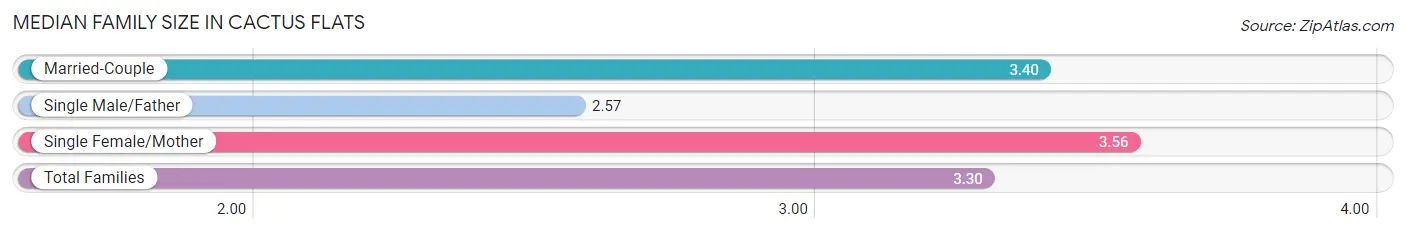
| Family Type | # Families | Family Size |
| Married-Couple | 178 (56.3%) | 3.40 |
| Single Male/Father | 54 (17.1%) | 2.57 |
| Single Female/Mother | 84 (26.6%) | 3.56 |
| Total Families | 316 (100.0%) | 3.30 |
Median Household Size in Cactus Flats
The median household size in Cactus Flats is 2.76 persons per household, with single female/mother households (84 | 18.8%) accounting for the largest median household size of 3.56 persons per household. non-family households (132 | 29.5%) represent the smallest median household size with 1.04 persons per household.
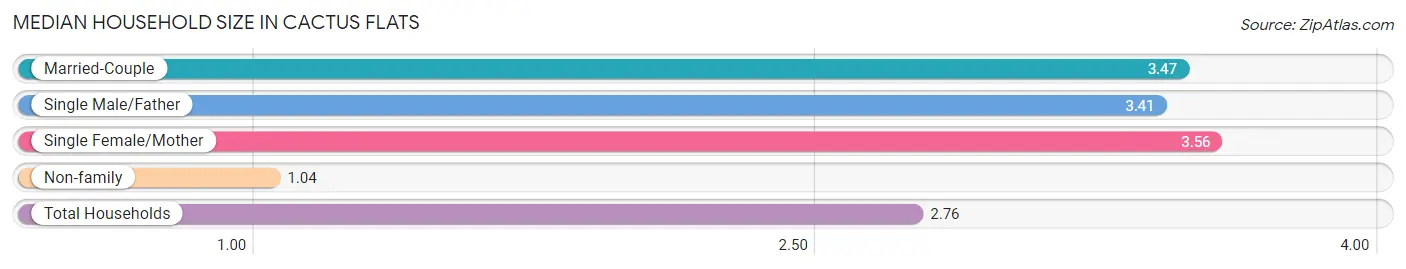
| Household Type | # Households | Household Size |
| Married-Couple | 178 (39.7%) | 3.47 |
| Single Male/Father | 54 (12.0%) | 3.41 |
| Single Female/Mother | 84 (18.8%) | 3.56 |
| Non-family | 132 (29.5%) | 1.04 |
| Total Households | 448 (100.0%) | 2.76 |
Household Size by Marriage Status in Cactus Flats
Out of a total of 448 households in Cactus Flats, 316 (70.5%) are family households, while 132 (29.5%) are nonfamily households. The most numerous type of family households are 2-person households, comprising 112, and the most common type of nonfamily households are 1-person households, comprising 125.
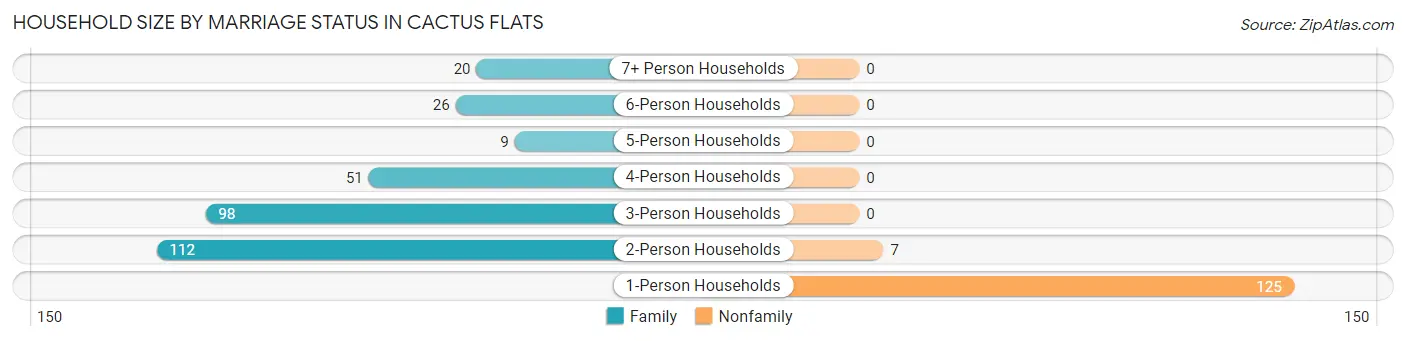
| Household Size | Family Households | Nonfamily Households |
| 1-Person Households | - | 125 (27.9%) |
| 2-Person Households | 112 (25.0%) | 7 (1.6%) |
| 3-Person Households | 98 (21.9%) | 0 (0.0%) |
| 4-Person Households | 51 (11.4%) | 0 (0.0%) |
| 5-Person Households | 9 (2.0%) | 0 (0.0%) |
| 6-Person Households | 26 (5.8%) | 0 (0.0%) |
| 7+ Person Households | 20 (4.5%) | 0 (0.0%) |
| Total | 316 (70.5%) | 132 (29.5%) |
Female Fertility in Cactus Flats
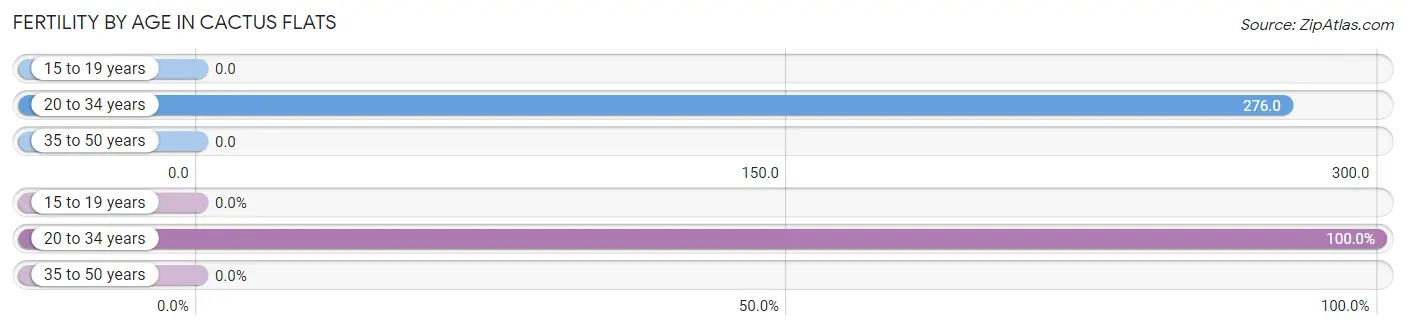
Fertility by Age in Cactus Flats
Average fertility rate in Cactus Flats is 48.0 births per 1,000 women. Women in the age bracket of 20 to 34 years have the highest fertility rate with 276.0 births per 1,000 women. Women in the age bracket of 20 to 34 years acount for 100.0% of all women with births.
| Age Bracket | Women with Births | Births / 1,000 Women |
| 15 to 19 years | 0 (0.0%) | 0.0 |
| 20 to 34 years | 8 (100.0%) | 276.0 |
| 35 to 50 years | 0 (0.0%) | 0.0 |
| Total | 8 (100.0%) | 48.0 |
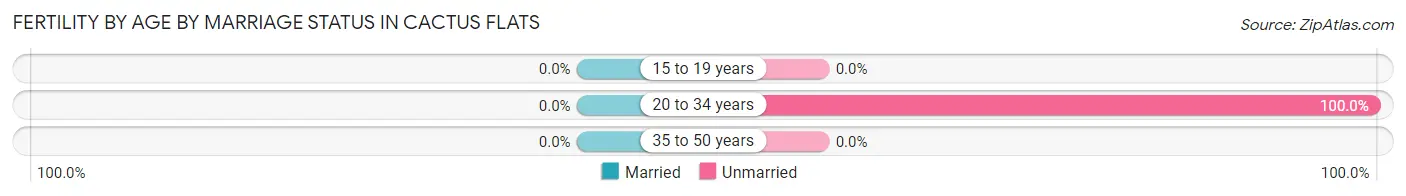
Fertility by Age by Marriage Status in Cactus Flats
| Age Bracket | Married | Unmarried |
| 15 to 19 years | 0 (0.0%) | 0 (0.0%) |
| 20 to 34 years | 0 (0.0%) | 8 (100.0%) |
| 35 to 50 years | 0 (0.0%) | 0 (0.0%) |
| Total | 0 (0.0%) | 8 (100.0%) |
Fertility by Education in Cactus Flats
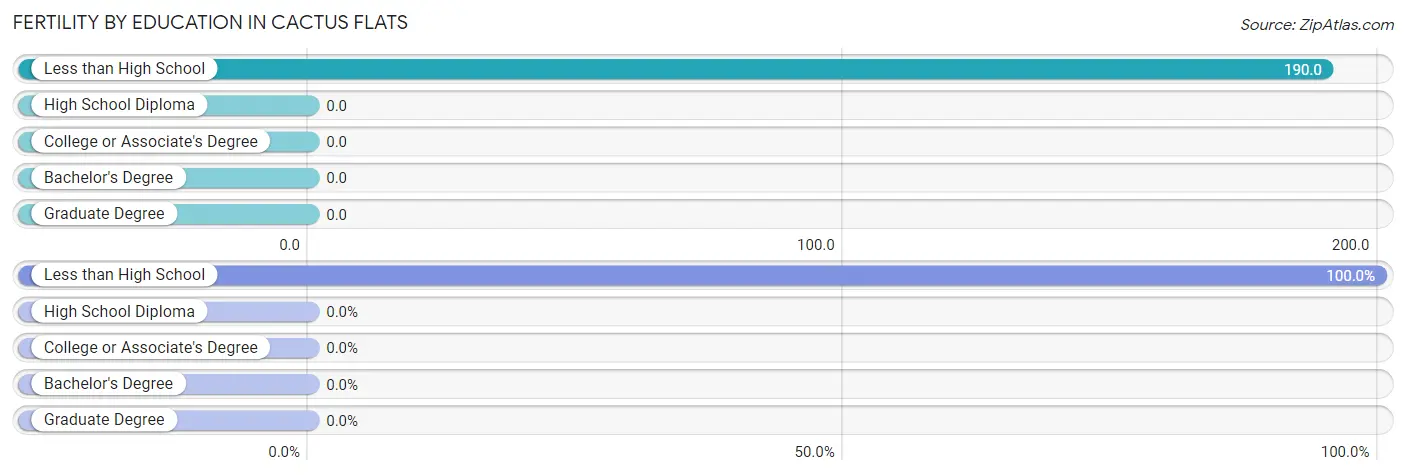
| Educational Attainment | Women with Births | Births / 1,000 Women |
| Less than High School | 8 (100.0%) | 190.0 |
| High School Diploma | 0 (0.0%) | 0.0 |
| College or Associate's Degree | 0 (0.0%) | 0.0 |
| Bachelor's Degree | 0 (0.0%) | 0.0 |
| Graduate Degree | 0 (0.0%) | 0.0 |
| Total | 8 (100.0%) | 48.0 |
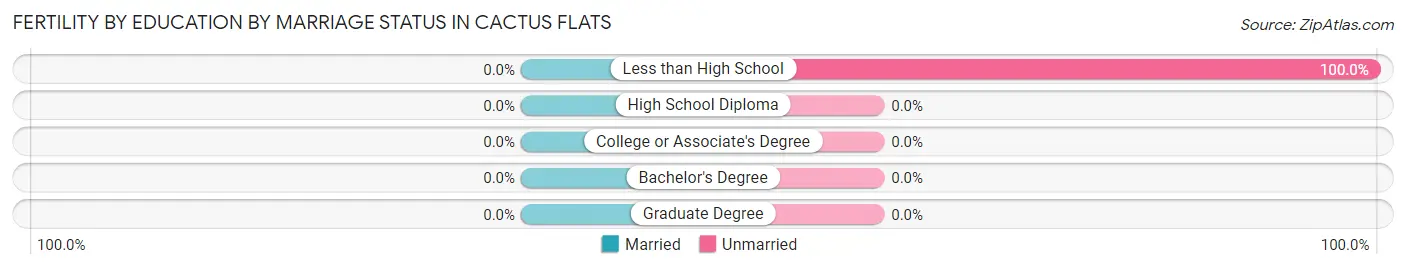
Fertility by Education by Marriage Status in Cactus Flats
| Educational Attainment | Married | Unmarried |
| Less than High School | 0 (0.0%) | 8 (100.0%) |
| High School Diploma | 0 (0.0%) | 0 (0.0%) |
| College or Associate's Degree | 0 (0.0%) | 0 (0.0%) |
| Bachelor's Degree | 0 (0.0%) | 0 (0.0%) |
| Graduate Degree | 0 (0.0%) | 0 (0.0%) |
| Total | 0 (0.0%) | 8 (100.0%) |
Employment Characteristics in Cactus Flats
Employment by Class of Employer in Cactus Flats
Among the 378 employed individuals in Cactus Flats, private company employees (212 | 56.1%), not-for-profit organizations (52 | 13.8%), and self-employed (not incorporated) (41 | 10.8%) make up the most common classes of employment.
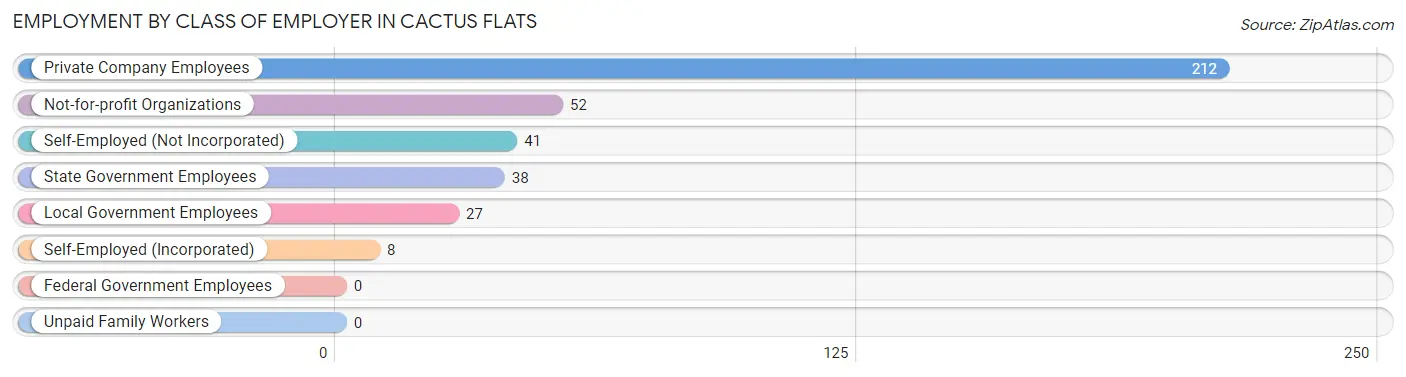
| Employer Class | # Employees | % Employees |
| Private Company Employees | 212 | 56.1% |
| Self-Employed (Incorporated) | 8 | 2.1% |
| Self-Employed (Not Incorporated) | 41 | 10.8% |
| Not-for-profit Organizations | 52 | 13.8% |
| Local Government Employees | 27 | 7.1% |
| State Government Employees | 38 | 10.1% |
| Federal Government Employees | 0 | 0.0% |
| Unpaid Family Workers | 0 | 0.0% |
| Total | 378 | 100.0% |
Employment Status by Age in Cactus Flats
According to the labor force statistics for Cactus Flats, out of the total population over 16 years of age (917), 42.0% or 385 individuals are in the labor force, with 1.8% or 7 of them unemployed. The age group with the highest labor force participation rate is 30 to 34 years, with 77.1% or 27 individuals in the labor force. Within the labor force, the 35 to 44 years age range has the highest percentage of unemployed individuals, with 4.9% or 7 of them being unemployed.
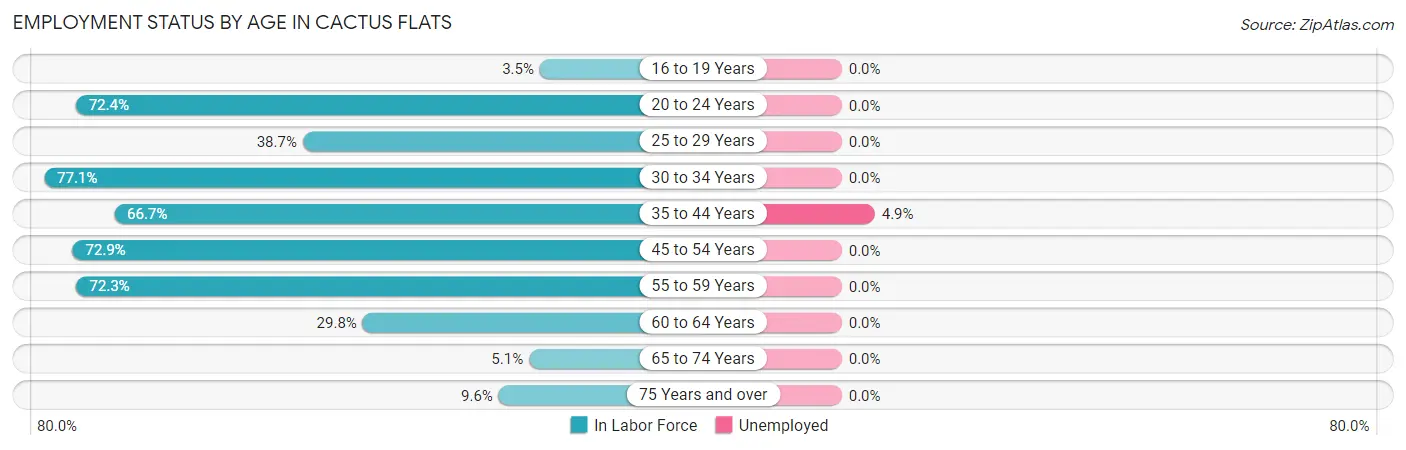
| Age Bracket | In Labor Force | Unemployed |
| 16 to 19 Years | 5 (3.5%) | 0 (0.0%) |
| 20 to 24 Years | 21 (72.4%) | 0 (0.0%) |
| 25 to 29 Years | 12 (38.7%) | 0 (0.0%) |
| 30 to 34 Years | 27 (77.1%) | 0 (0.0%) |
| 35 to 44 Years | 144 (66.7%) | 7 (4.9%) |
| 45 to 54 Years | 70 (72.9%) | 0 (0.0%) |
| 55 to 59 Years | 60 (72.3%) | 0 (0.0%) |
| 60 to 64 Years | 34 (29.8%) | 0 (0.0%) |
| 65 to 74 Years | 5 (5.1%) | 0 (0.0%) |
| 75 Years and over | 7 (9.6%) | 0 (0.0%) |
| Total | 385 (42.0%) | 7 (1.8%) |
Employment Status by Educational Attainment in Cactus Flats
According to labor force statistics for Cactus Flats, 60.3% of individuals (347) out of the total population between 25 and 64 years of age (575) are in the labor force, with 2.0% or 7 of them being unemployed. The group with the highest labor force participation rate are those with the educational attainment of bachelor's degree or higher, with 100.0% or 4 individuals in the labor force. Within the labor force, individuals with less than high school education have the highest percentage of unemployment, with 17.1% or 7 of them being unemployed.
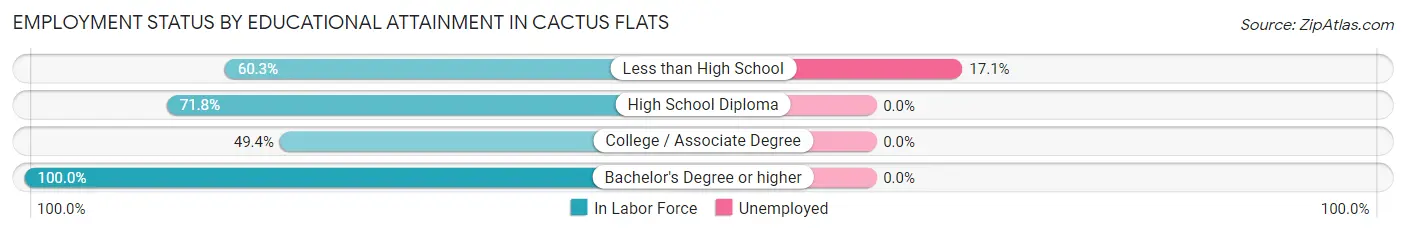
| Educational Attainment | In Labor Force | Unemployed |
| Less than High School | 41 (60.3%) | 12 (17.1%) |
| High School Diploma | 171 (71.8%) | 0 (0.0%) |
| College / Associate Degree | 131 (49.4%) | 0 (0.0%) |
| Bachelor's Degree or higher | 4 (100.0%) | 0 (0.0%) |
| Total | 347 (60.3%) | 12 (2.0%) |
Employment Occupations by Sex in Cactus Flats
Management, Business, Science and Arts Occupations
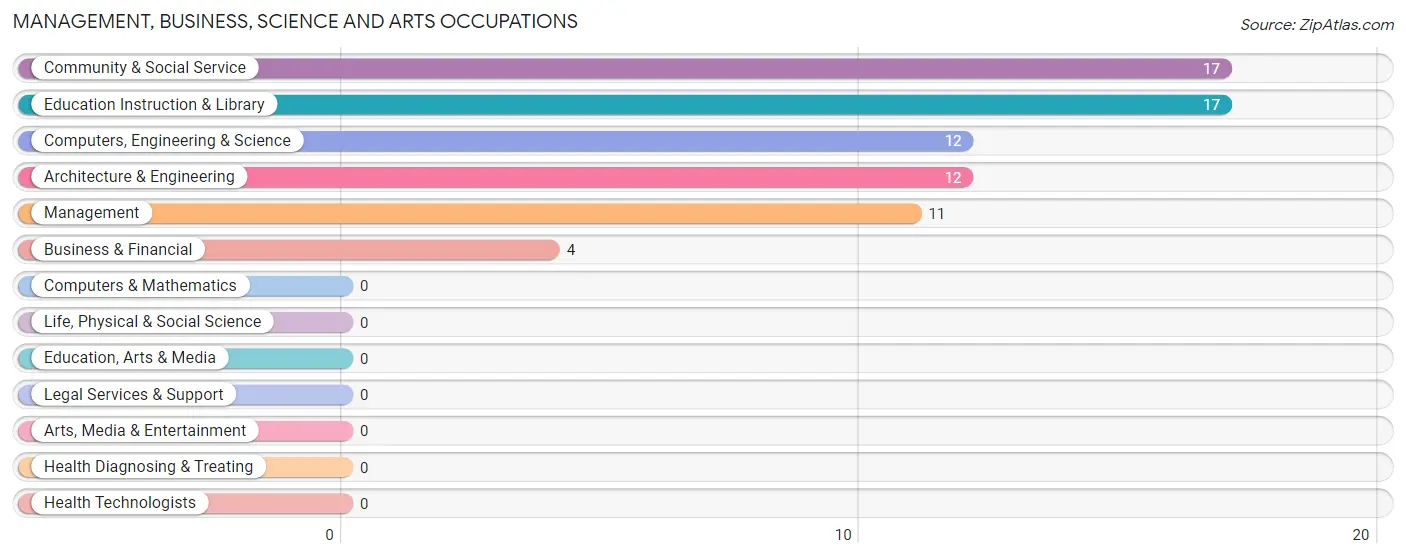
The most common Management, Business, Science and Arts occupations in Cactus Flats are Community & Social Service (17 | 4.5%), Education Instruction & Library (17 | 4.5%), Computers, Engineering & Science (12 | 3.2%), Architecture & Engineering (12 | 3.2%), and Management (11 | 2.9%).
Management, Business, Science and Arts Occupations by Sex
Within the Management, Business, Science and Arts occupations in Cactus Flats, the most male-oriented occupations are Management (100.0%), Business & Financial (100.0%), and Computers, Engineering & Science (100.0%), while the most female-oriented occupations are Community & Social Service (100.0%), and Education Instruction & Library (100.0%).
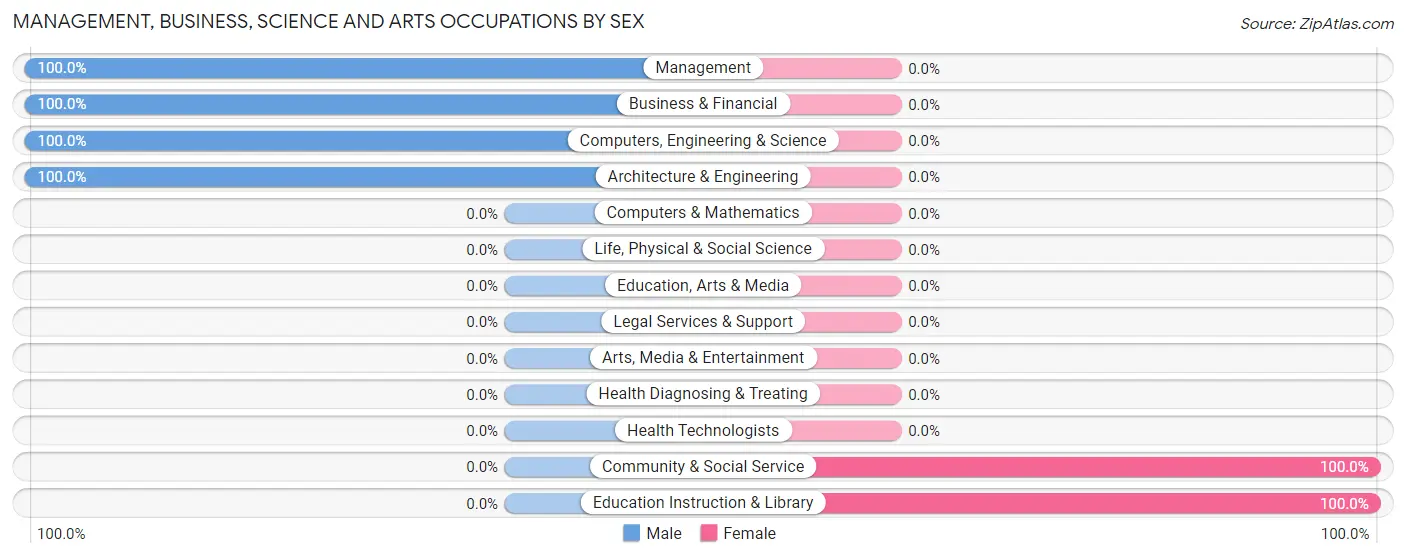
| Occupation | Male | Female |
| Management | 11 (100.0%) | 0 (0.0%) |
| Business & Financial | 4 (100.0%) | 0 (0.0%) |
| Computers, Engineering & Science | 12 (100.0%) | 0 (0.0%) |
| Computers & Mathematics | 0 (0.0%) | 0 (0.0%) |
| Architecture & Engineering | 12 (100.0%) | 0 (0.0%) |
| Life, Physical & Social Science | 0 (0.0%) | 0 (0.0%) |
| Community & Social Service | 0 (0.0%) | 17 (100.0%) |
| Education, Arts & Media | 0 (0.0%) | 0 (0.0%) |
| Legal Services & Support | 0 (0.0%) | 0 (0.0%) |
| Education Instruction & Library | 0 (0.0%) | 17 (100.0%) |
| Arts, Media & Entertainment | 0 (0.0%) | 0 (0.0%) |
| Health Diagnosing & Treating | 0 (0.0%) | 0 (0.0%) |
| Health Technologists | 0 (0.0%) | 0 (0.0%) |
| Total (Category) | 27 (61.4%) | 17 (38.6%) |
| Total (Overall) | 275 (72.8%) | 103 (27.3%) |
Services Occupations
The most common Services occupations in Cactus Flats are Security & Protection (31 | 8.2%), Firefighting & Prevention (31 | 8.2%), Healthcare Support (25 | 6.6%), Personal Care & Service (18 | 4.8%), and Food Preparation & Serving (10 | 2.6%).
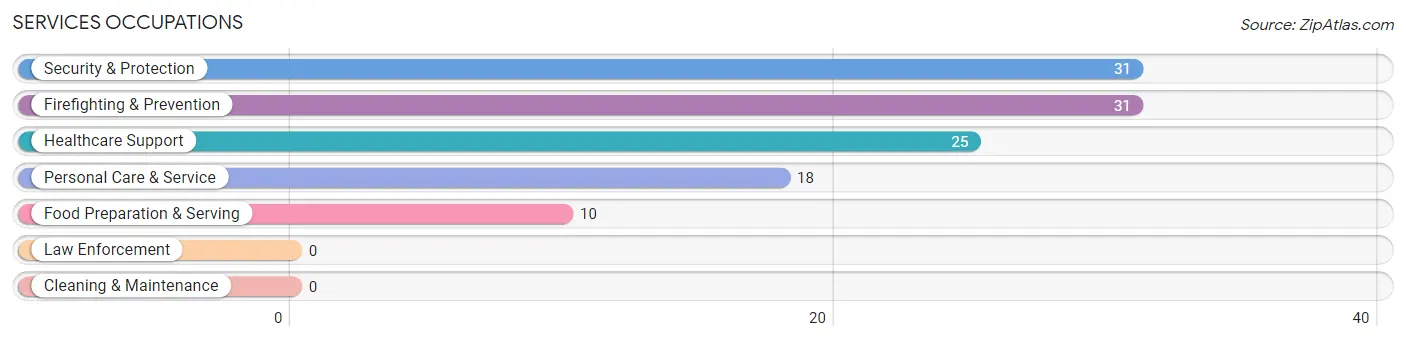
Services Occupations by Sex
Within the Services occupations in Cactus Flats, the most male-oriented occupations are Security & Protection (100.0%), Firefighting & Prevention (100.0%), and Personal Care & Service (50.0%), while the most female-oriented occupations are Food Preparation & Serving (100.0%), Healthcare Support (52.0%), and Personal Care & Service (50.0%).
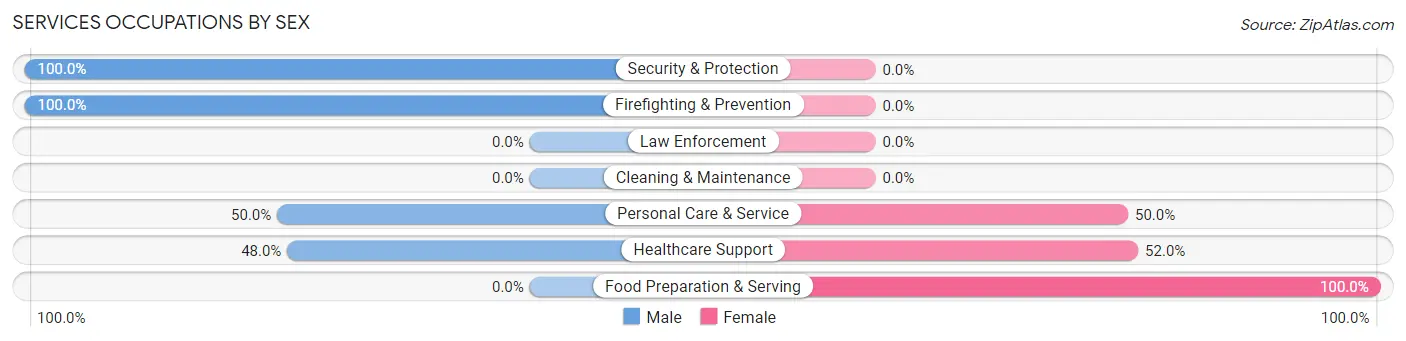
| Occupation | Male | Female |
| Healthcare Support | 12 (48.0%) | 13 (52.0%) |
| Security & Protection | 31 (100.0%) | 0 (0.0%) |
| Firefighting & Prevention | 31 (100.0%) | 0 (0.0%) |
| Law Enforcement | 0 (0.0%) | 0 (0.0%) |
| Food Preparation & Serving | 0 (0.0%) | 10 (100.0%) |
| Cleaning & Maintenance | 0 (0.0%) | 0 (0.0%) |
| Personal Care & Service | 9 (50.0%) | 9 (50.0%) |
| Total (Category) | 52 (61.9%) | 32 (38.1%) |
| Total (Overall) | 275 (72.8%) | 103 (27.3%) |
Sales and Office Occupations
The most common Sales and Office occupations in Cactus Flats are Sales & Related (21 | 5.6%), and Office & Administration (14 | 3.7%).
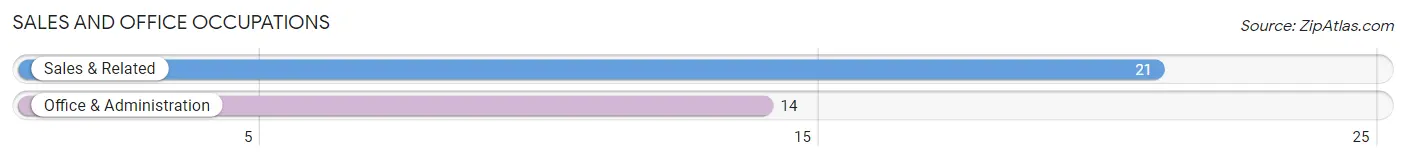
Sales and Office Occupations by Sex
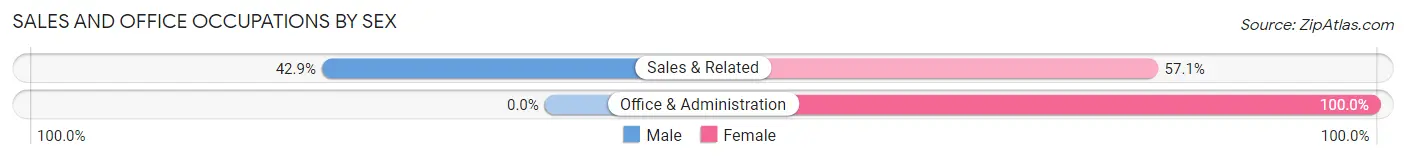
| Occupation | Male | Female |
| Sales & Related | 9 (42.9%) | 12 (57.1%) |
| Office & Administration | 0 (0.0%) | 14 (100.0%) |
| Total (Category) | 9 (25.7%) | 26 (74.3%) |
| Total (Overall) | 275 (72.8%) | 103 (27.3%) |
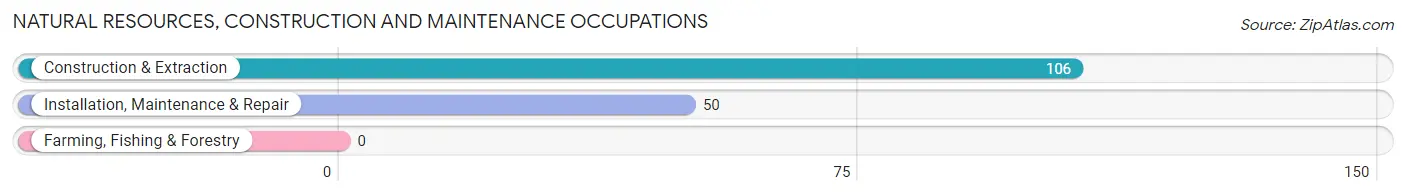
Natural Resources, Construction and Maintenance Occupations
The most common Natural Resources, Construction and Maintenance occupations in Cactus Flats are Construction & Extraction (106 | 28.0%), and Installation, Maintenance & Repair (50 | 13.2%).
Natural Resources, Construction and Maintenance Occupations by Sex
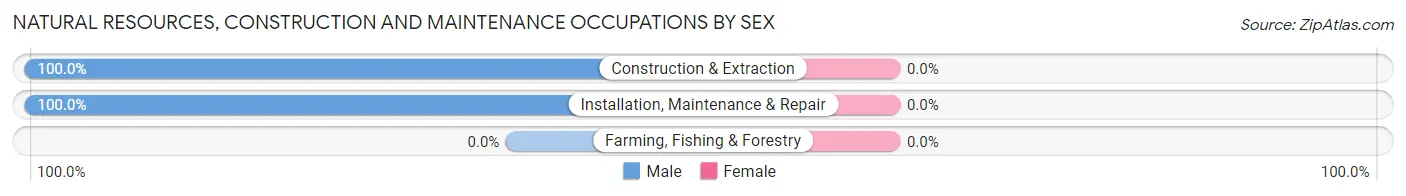
| Occupation | Male | Female |
| Farming, Fishing & Forestry | 0 (0.0%) | 0 (0.0%) |
| Construction & Extraction | 106 (100.0%) | 0 (0.0%) |
| Installation, Maintenance & Repair | 50 (100.0%) | 0 (0.0%) |
| Total (Category) | 156 (100.0%) | 0 (0.0%) |
| Total (Overall) | 275 (72.8%) | 103 (27.3%) |
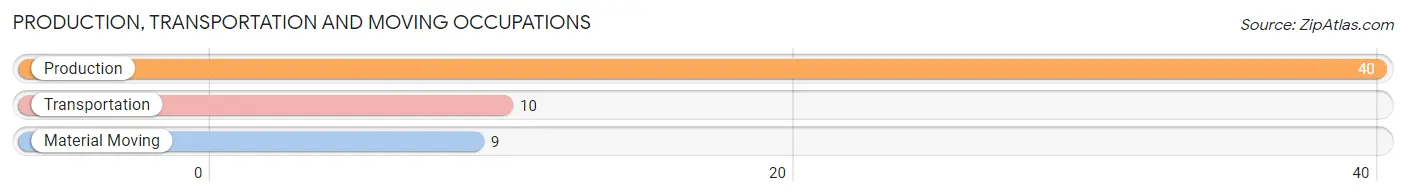
Production, Transportation and Moving Occupations
The most common Production, Transportation and Moving occupations in Cactus Flats are Production (40 | 10.6%), Transportation (10 | 2.6%), and Material Moving (9 | 2.4%).
Production, Transportation and Moving Occupations by Sex
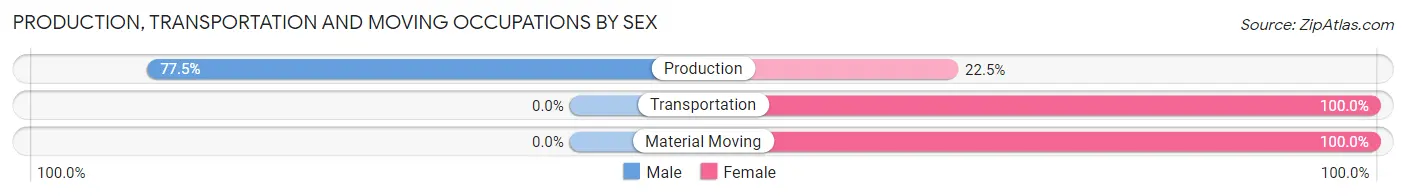
| Occupation | Male | Female |
| Production | 31 (77.5%) | 9 (22.5%) |
| Transportation | 0 (0.0%) | 10 (100.0%) |
| Material Moving | 0 (0.0%) | 9 (100.0%) |
| Total (Category) | 31 (52.5%) | 28 (47.5%) |
| Total (Overall) | 275 (72.8%) | 103 (27.3%) |
Employment Industries by Sex in Cactus Flats
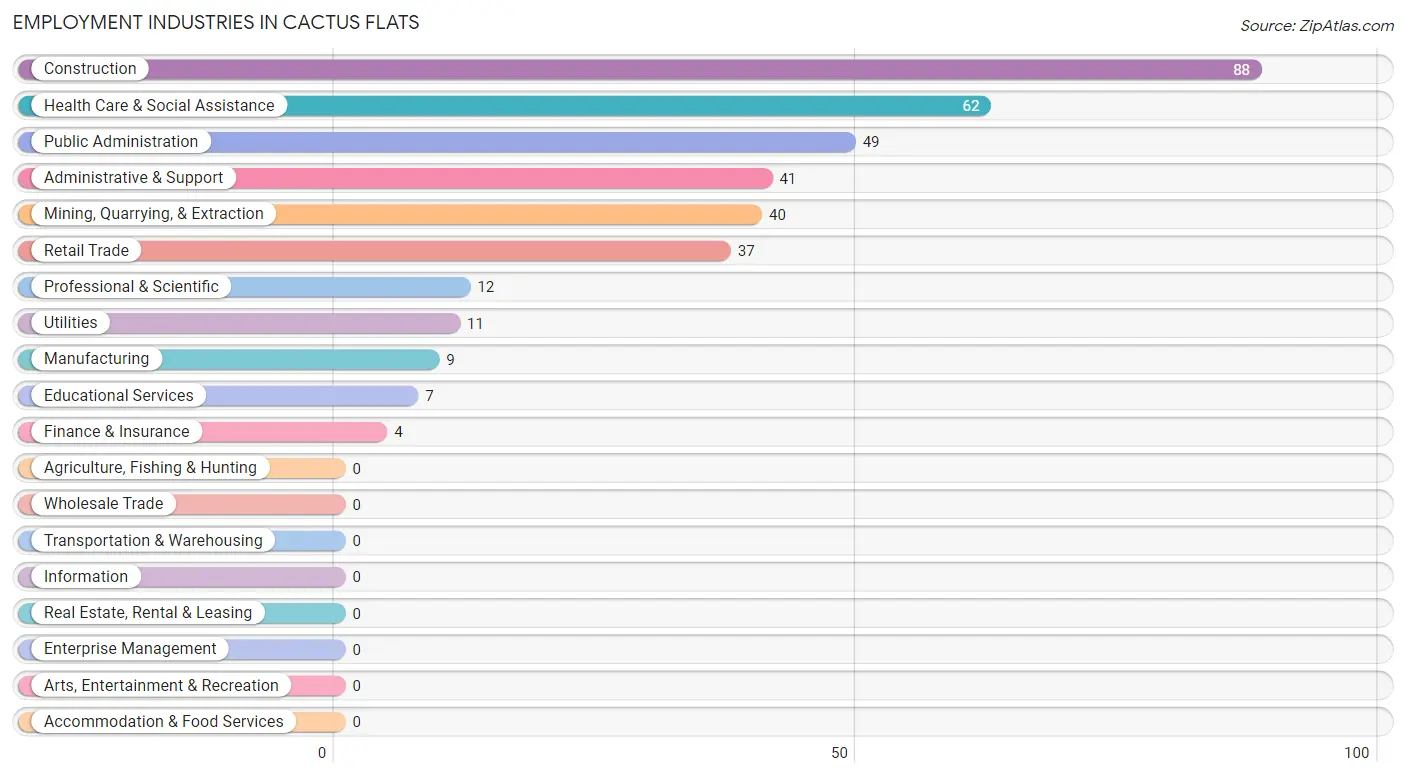
Employment Industries in Cactus Flats
The major employment industries in Cactus Flats include Construction (88 | 23.3%), Health Care & Social Assistance (62 | 16.4%), Public Administration (49 | 13.0%), Administrative & Support (41 | 10.8%), and Mining, Quarrying, & Extraction (40 | 10.6%).
Employment Industries by Sex in Cactus Flats
The Cactus Flats industries that see more men than women are Utilities (100.0%), Finance & Insurance (100.0%), and Professional & Scientific (100.0%), whereas the industries that tend to have a higher number of women are Manufacturing (100.0%), Health Care & Social Assistance (80.6%), and Retail Trade (56.8%).
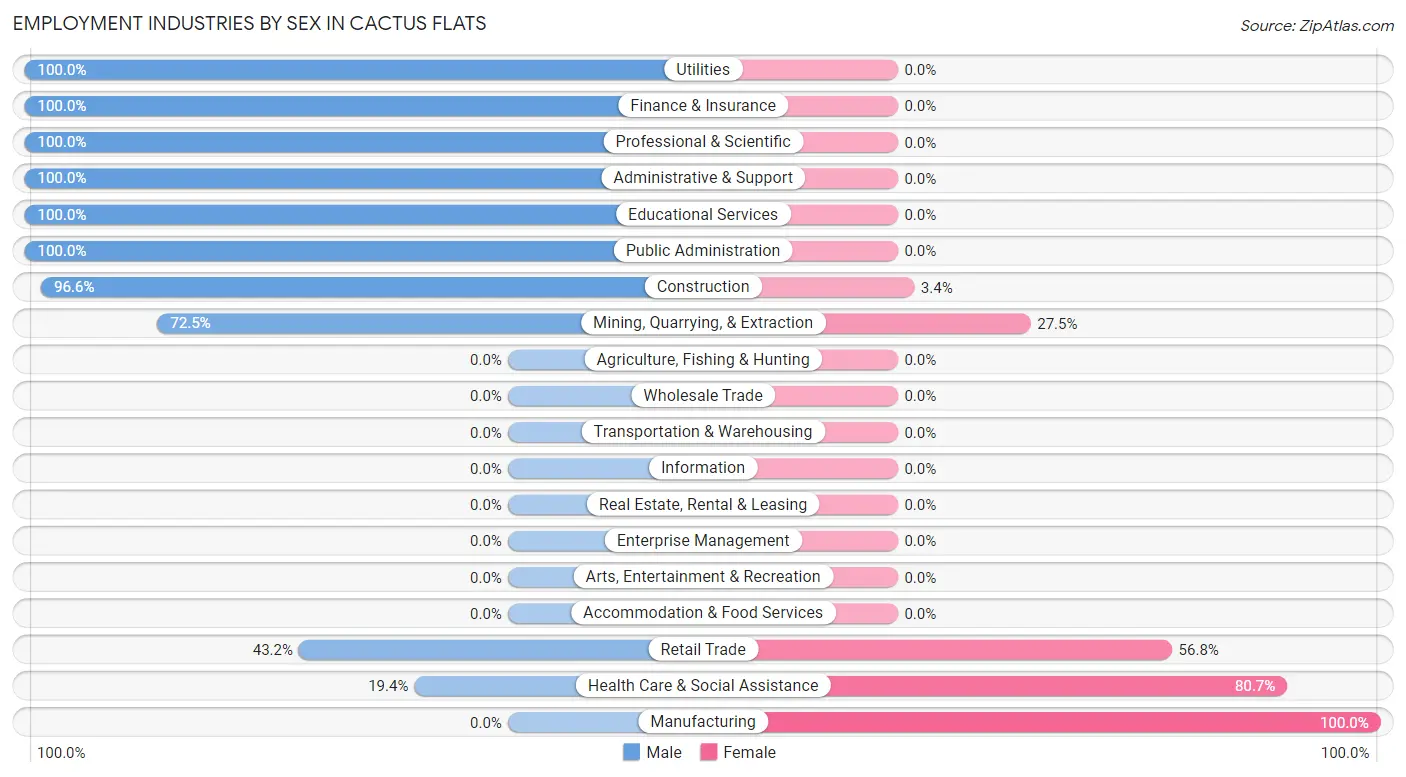
| Industry | Male | Female |
| Agriculture, Fishing & Hunting | 0 (0.0%) | 0 (0.0%) |
| Mining, Quarrying, & Extraction | 29 (72.5%) | 11 (27.5%) |
| Construction | 85 (96.6%) | 3 (3.4%) |
| Manufacturing | 0 (0.0%) | 9 (100.0%) |
| Wholesale Trade | 0 (0.0%) | 0 (0.0%) |
| Retail Trade | 16 (43.2%) | 21 (56.8%) |
| Transportation & Warehousing | 0 (0.0%) | 0 (0.0%) |
| Utilities | 11 (100.0%) | 0 (0.0%) |
| Information | 0 (0.0%) | 0 (0.0%) |
| Finance & Insurance | 4 (100.0%) | 0 (0.0%) |
| Real Estate, Rental & Leasing | 0 (0.0%) | 0 (0.0%) |
| Professional & Scientific | 12 (100.0%) | 0 (0.0%) |
| Enterprise Management | 0 (0.0%) | 0 (0.0%) |
| Administrative & Support | 41 (100.0%) | 0 (0.0%) |
| Educational Services | 7 (100.0%) | 0 (0.0%) |
| Health Care & Social Assistance | 12 (19.4%) | 50 (80.6%) |
| Arts, Entertainment & Recreation | 0 (0.0%) | 0 (0.0%) |
| Accommodation & Food Services | 0 (0.0%) | 0 (0.0%) |
| Public Administration | 49 (100.0%) | 0 (0.0%) |
| Total | 275 (72.8%) | 103 (27.3%) |
Education in Cactus Flats
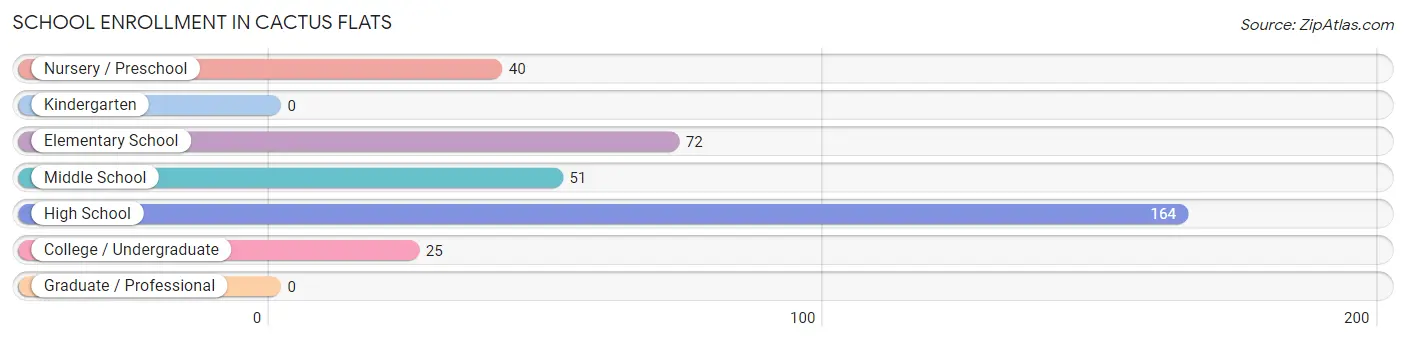
School Enrollment in Cactus Flats
The most common levels of schooling among the 352 students in Cactus Flats are high school (164 | 46.6%), elementary school (72 | 20.4%), and middle school (51 | 14.5%).
| School Level | # Students | % Students |
| Nursery / Preschool | 40 | 11.4% |
| Kindergarten | 0 | 0.0% |
| Elementary School | 72 | 20.4% |
| Middle School | 51 | 14.5% |
| High School | 164 | 46.6% |
| College / Undergraduate | 25 | 7.1% |
| Graduate / Professional | 0 | 0.0% |
| Total | 352 | 100.0% |
School Enrollment by Age by Funding Source in Cactus Flats
Out of a total of 352 students who are enrolled in schools in Cactus Flats, 96 (27.3%) attend a private institution, while the remaining 256 (72.7%) are enrolled in public schools. The age group of 15 to 17 year olds has the highest likelihood of being enrolled in private schools, with 57 (44.2% in the age bracket) enrolled. Conversely, the age group of 3 to 4 year olds has the lowest likelihood of being enrolled in a private school, with 40 (100.0% in the age bracket) attending a public institution.
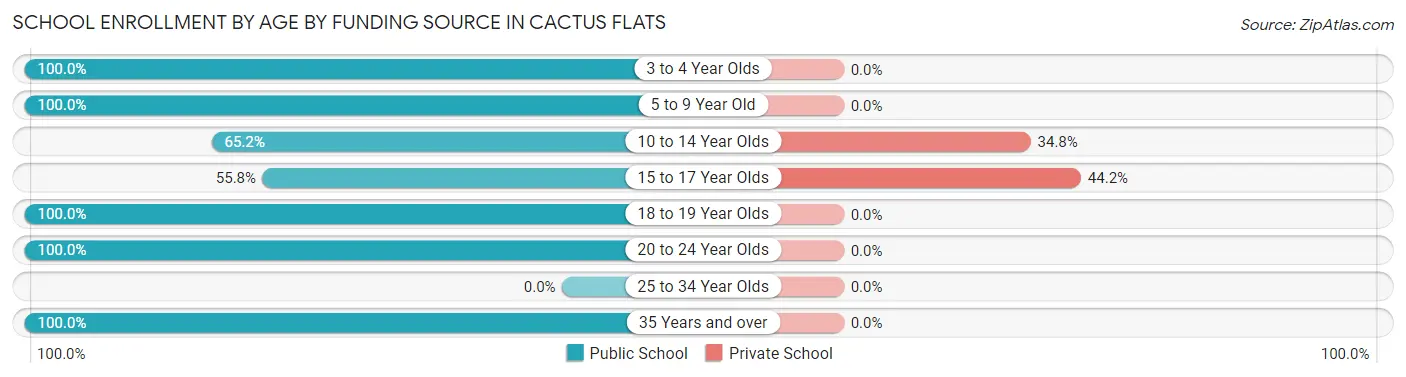
| Age Bracket | Public School | Private School |
| 3 to 4 Year Olds | 40 (100.0%) | 0 (0.0%) |
| 5 to 9 Year Old | 37 (100.0%) | 0 (0.0%) |
| 10 to 14 Year Olds | 73 (65.2%) | 39 (34.8%) |
| 15 to 17 Year Olds | 72 (55.8%) | 57 (44.2%) |
| 18 to 19 Year Olds | 9 (100.0%) | 0 (0.0%) |
| 20 to 24 Year Olds | 8 (100.0%) | 0 (0.0%) |
| 25 to 34 Year Olds | 0 (0.0%) | 0 (0.0%) |
| 35 Years and over | 17 (100.0%) | 0 (0.0%) |
| Total | 256 (72.7%) | 96 (27.3%) |
Educational Attainment by Field of Study in Cactus Flats
Arts & humanities (15 | 78.9%), and education (4 | 21.0%) are the most common fields of study among 19 individuals in Cactus Flats who have obtained a bachelor's degree or higher.
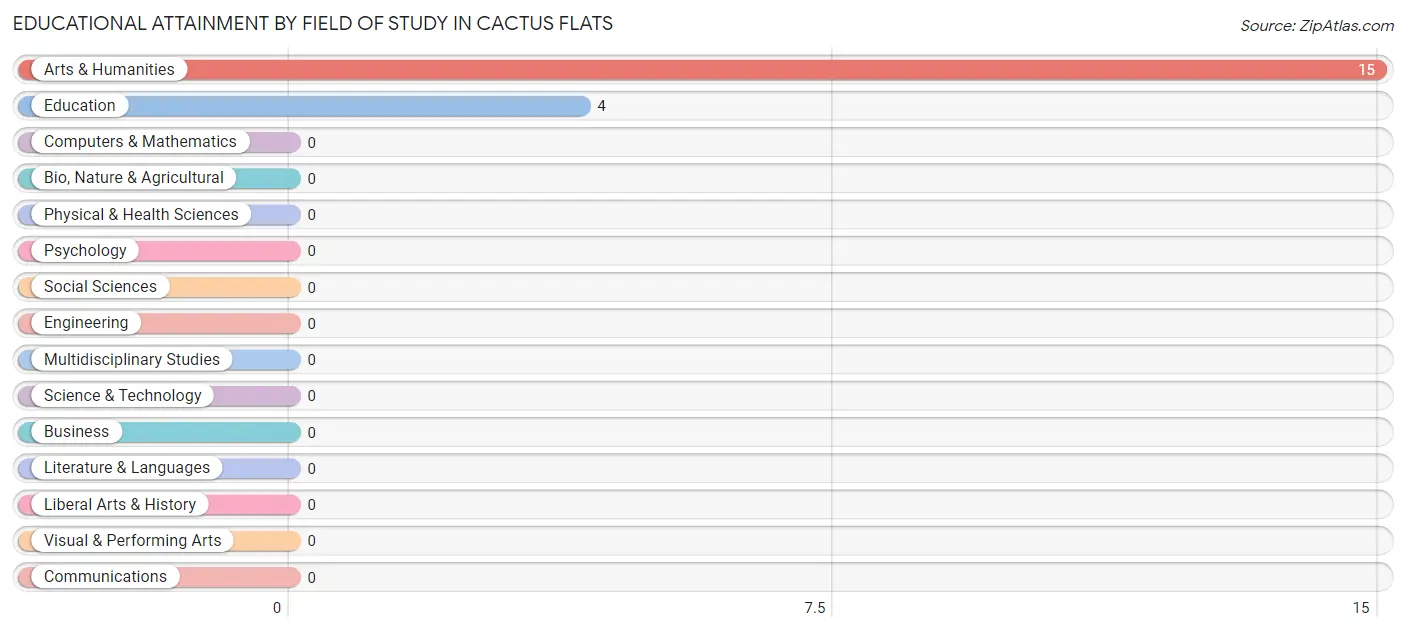
| Field of Study | # Graduates | % Graduates |
| Computers & Mathematics | 0 | 0.0% |
| Bio, Nature & Agricultural | 0 | 0.0% |
| Physical & Health Sciences | 0 | 0.0% |
| Psychology | 0 | 0.0% |
| Social Sciences | 0 | 0.0% |
| Engineering | 0 | 0.0% |
| Multidisciplinary Studies | 0 | 0.0% |
| Science & Technology | 0 | 0.0% |
| Business | 0 | 0.0% |
| Education | 4 | 21.0% |
| Literature & Languages | 0 | 0.0% |
| Liberal Arts & History | 0 | 0.0% |
| Visual & Performing Arts | 0 | 0.0% |
| Communications | 0 | 0.0% |
| Arts & Humanities | 15 | 78.9% |
| Total | 19 | 100.0% |
Transportation & Commute in Cactus Flats
Vehicle Availability by Sex in Cactus Flats
The most prevalent vehicle ownership categories in Cactus Flats are males with 3 vehicles (113, accounting for 41.1%) and females with 3 vehicles (60, making up 109.7%).
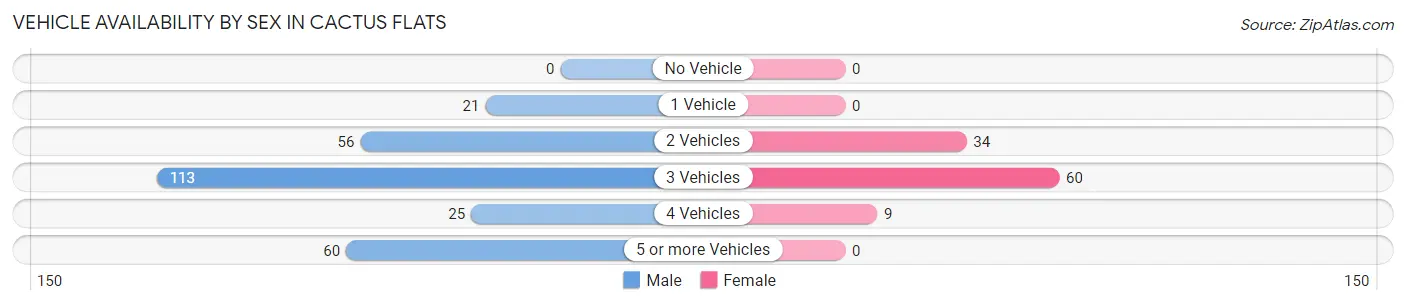
| Vehicles Available | Male | Female |
| No Vehicle | 0 (0.0%) | 0 (0.0%) |
| 1 Vehicle | 21 (7.6%) | 0 (0.0%) |
| 2 Vehicles | 56 (20.4%) | 34 (33.0%) |
| 3 Vehicles | 113 (41.1%) | 60 (58.3%) |
| 4 Vehicles | 25 (9.1%) | 9 (8.7%) |
| 5 or more Vehicles | 60 (21.8%) | 0 (0.0%) |
| Total | 275 (100.0%) | 103 (100.0%) |
Commute Time in Cactus Flats
The most frequently occuring commute durations in Cactus Flats are 30 to 34 minutes (94 commuters, 24.9%), 20 to 24 minutes (79 commuters, 20.9%), and 10 to 14 minutes (56 commuters, 14.8%).
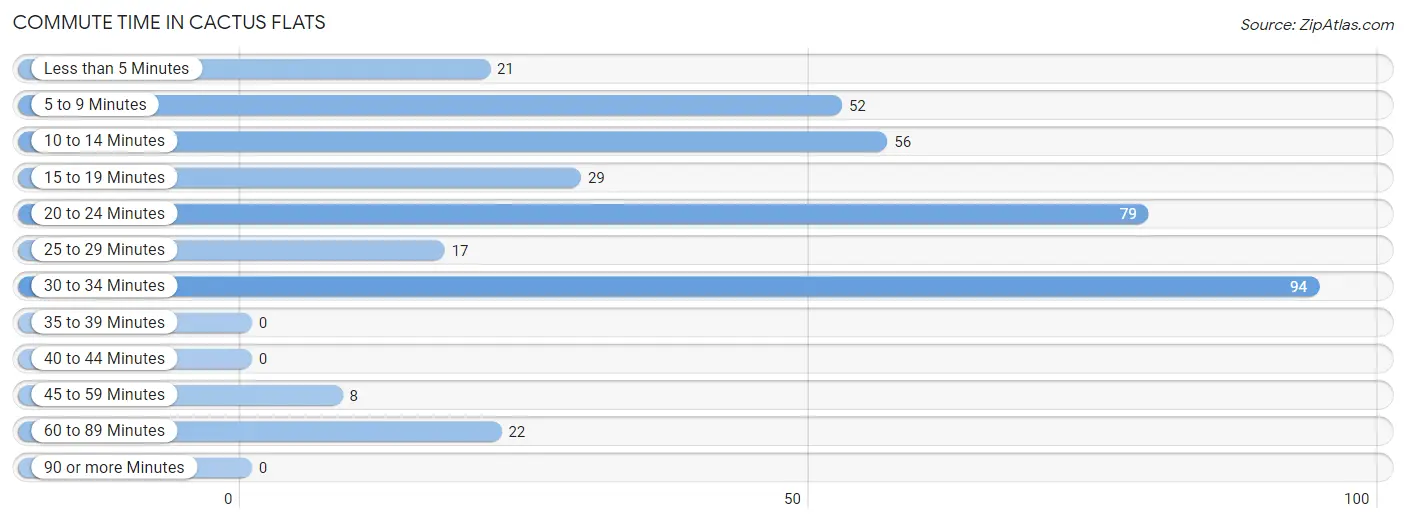
| Commute Time | # Commuters | % Commuters |
| Less than 5 Minutes | 21 | 5.6% |
| 5 to 9 Minutes | 52 | 13.8% |
| 10 to 14 Minutes | 56 | 14.8% |
| 15 to 19 Minutes | 29 | 7.7% |
| 20 to 24 Minutes | 79 | 20.9% |
| 25 to 29 Minutes | 17 | 4.5% |
| 30 to 34 Minutes | 94 | 24.9% |
| 35 to 39 Minutes | 0 | 0.0% |
| 40 to 44 Minutes | 0 | 0.0% |
| 45 to 59 Minutes | 8 | 2.1% |
| 60 to 89 Minutes | 22 | 5.8% |
| 90 or more Minutes | 0 | 0.0% |
Commute Time by Sex in Cactus Flats
The most common commute times in Cactus Flats are 30 to 34 minutes (94 commuters, 34.2%) for males and 10 to 14 minutes (23 commuters, 22.3%) for females.
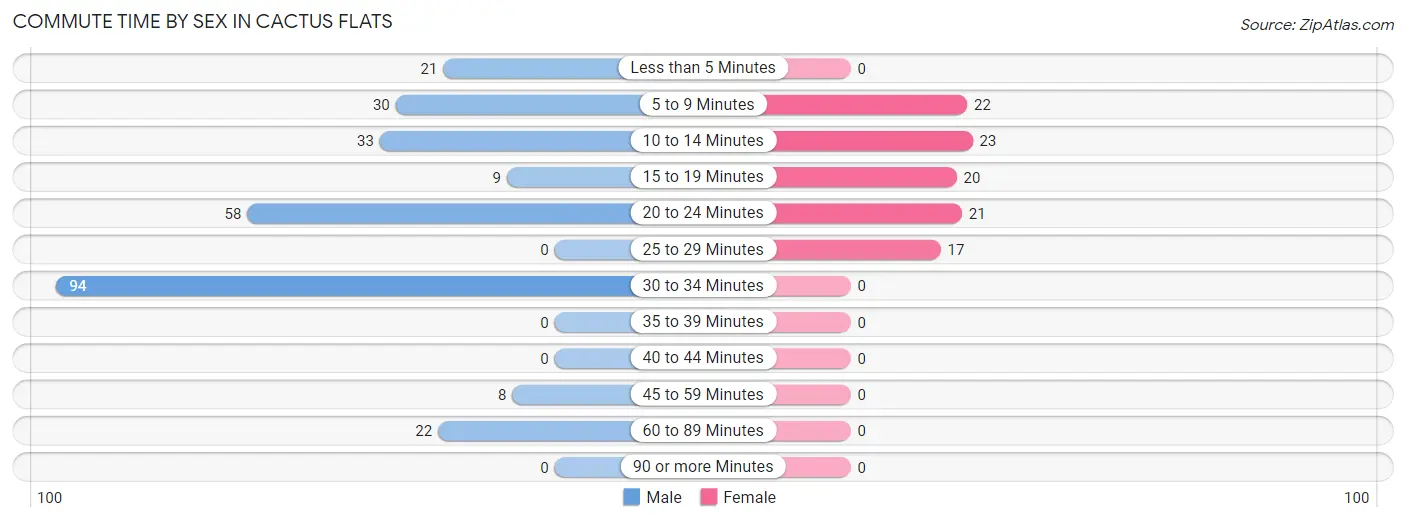
| Commute Time | Male | Female |
| Less than 5 Minutes | 21 (7.6%) | 0 (0.0%) |
| 5 to 9 Minutes | 30 (10.9%) | 22 (21.4%) |
| 10 to 14 Minutes | 33 (12.0%) | 23 (22.3%) |
| 15 to 19 Minutes | 9 (3.3%) | 20 (19.4%) |
| 20 to 24 Minutes | 58 (21.1%) | 21 (20.4%) |
| 25 to 29 Minutes | 0 (0.0%) | 17 (16.5%) |
| 30 to 34 Minutes | 94 (34.2%) | 0 (0.0%) |
| 35 to 39 Minutes | 0 (0.0%) | 0 (0.0%) |
| 40 to 44 Minutes | 0 (0.0%) | 0 (0.0%) |
| 45 to 59 Minutes | 8 (2.9%) | 0 (0.0%) |
| 60 to 89 Minutes | 22 (8.0%) | 0 (0.0%) |
| 90 or more Minutes | 0 (0.0%) | 0 (0.0%) |
Time of Departure to Work by Sex in Cactus Flats
The most frequent times of departure to work in Cactus Flats are 12:00 AM to 4:59 AM (95, 34.5%) for males and 7:00 AM to 7:29 AM (26, 25.2%) for females.
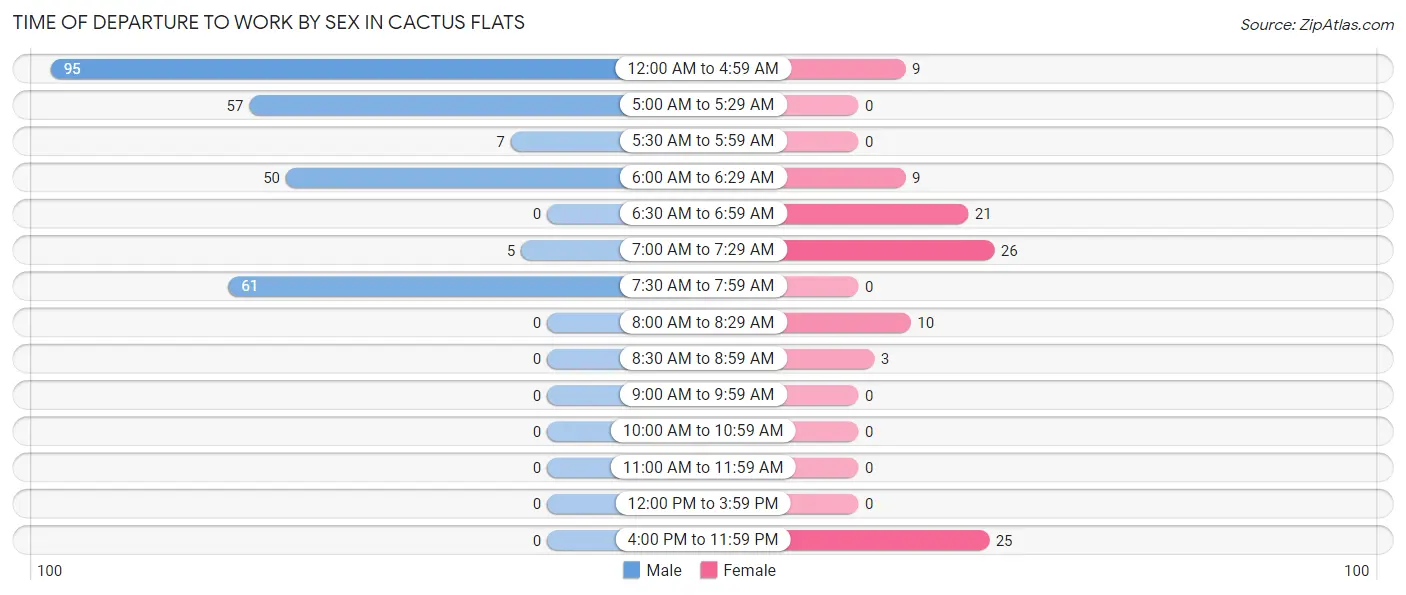
| Time of Departure | Male | Female |
| 12:00 AM to 4:59 AM | 95 (34.5%) | 9 (8.7%) |
| 5:00 AM to 5:29 AM | 57 (20.7%) | 0 (0.0%) |
| 5:30 AM to 5:59 AM | 7 (2.5%) | 0 (0.0%) |
| 6:00 AM to 6:29 AM | 50 (18.2%) | 9 (8.7%) |
| 6:30 AM to 6:59 AM | 0 (0.0%) | 21 (20.4%) |
| 7:00 AM to 7:29 AM | 5 (1.8%) | 26 (25.2%) |
| 7:30 AM to 7:59 AM | 61 (22.2%) | 0 (0.0%) |
| 8:00 AM to 8:29 AM | 0 (0.0%) | 10 (9.7%) |
| 8:30 AM to 8:59 AM | 0 (0.0%) | 3 (2.9%) |
| 9:00 AM to 9:59 AM | 0 (0.0%) | 0 (0.0%) |
| 10:00 AM to 10:59 AM | 0 (0.0%) | 0 (0.0%) |
| 11:00 AM to 11:59 AM | 0 (0.0%) | 0 (0.0%) |
| 12:00 PM to 3:59 PM | 0 (0.0%) | 0 (0.0%) |
| 4:00 PM to 11:59 PM | 0 (0.0%) | 25 (24.3%) |
| Total | 275 (100.0%) | 103 (100.0%) |
Housing Occupancy in Cactus Flats
Occupancy by Ownership in Cactus Flats
Of the total 448 dwellings in Cactus Flats, owner-occupied units account for 375 (83.7%), while renter-occupied units make up 73 (16.3%).
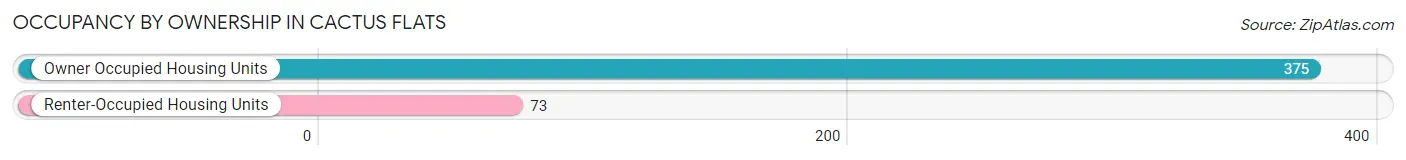
| Occupancy | # Housing Units | % Housing Units |
| Owner Occupied Housing Units | 375 | 83.7% |
| Renter-Occupied Housing Units | 73 | 16.3% |
| Total Occupied Housing Units | 448 | 100.0% |
Occupancy by Household Size in Cactus Flats
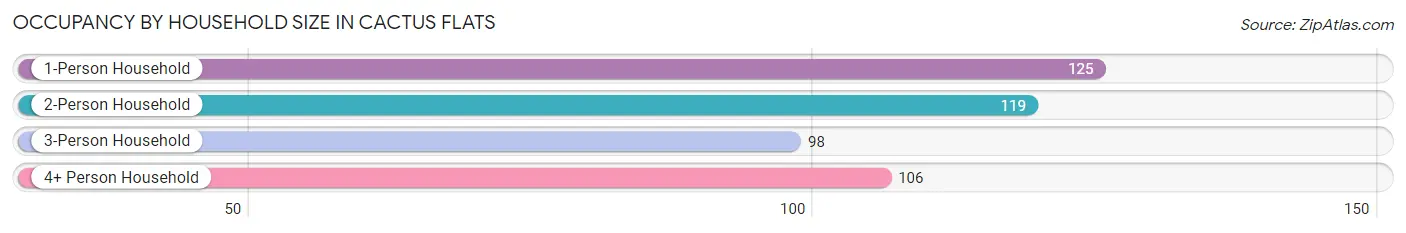
| Household Size | # Housing Units | % Housing Units |
| 1-Person Household | 125 | 27.9% |
| 2-Person Household | 119 | 26.6% |
| 3-Person Household | 98 | 21.9% |
| 4+ Person Household | 106 | 23.7% |
| Total Housing Units | 448 | 100.0% |
Occupancy by Ownership by Household Size in Cactus Flats
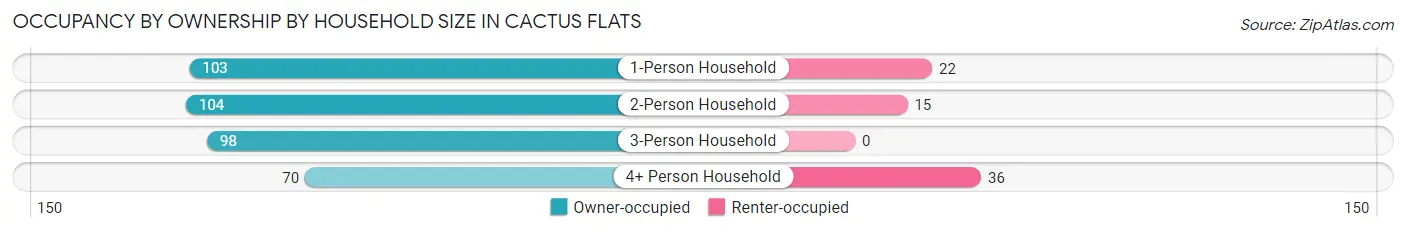
| Household Size | Owner-occupied | Renter-occupied |
| 1-Person Household | 103 (82.4%) | 22 (17.6%) |
| 2-Person Household | 104 (87.4%) | 15 (12.6%) |
| 3-Person Household | 98 (100.0%) | 0 (0.0%) |
| 4+ Person Household | 70 (66.0%) | 36 (34.0%) |
| Total Housing Units | 375 (83.7%) | 73 (16.3%) |
Occupancy by Educational Attainment in Cactus Flats
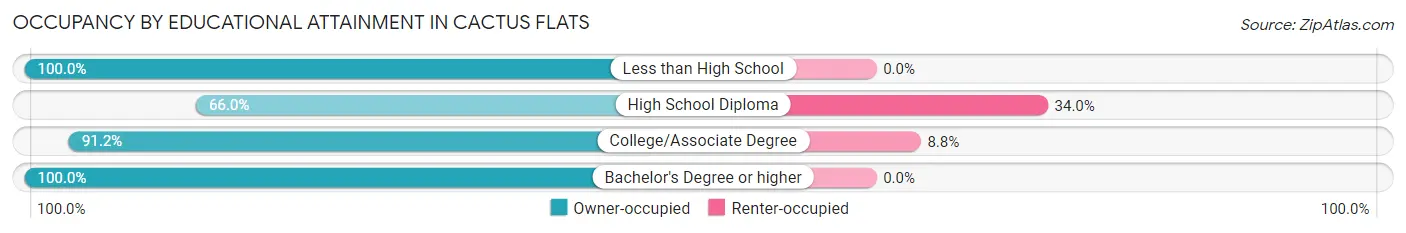
| Household Size | Owner-occupied | Renter-occupied |
| Less than High School | 41 (100.0%) | 0 (0.0%) |
| High School Diploma | 101 (66.0%) | 52 (34.0%) |
| College/Associate Degree | 218 (91.2%) | 21 (8.8%) |
| Bachelor's Degree or higher | 15 (100.0%) | 0 (0.0%) |
Occupancy by Age of Householder in Cactus Flats
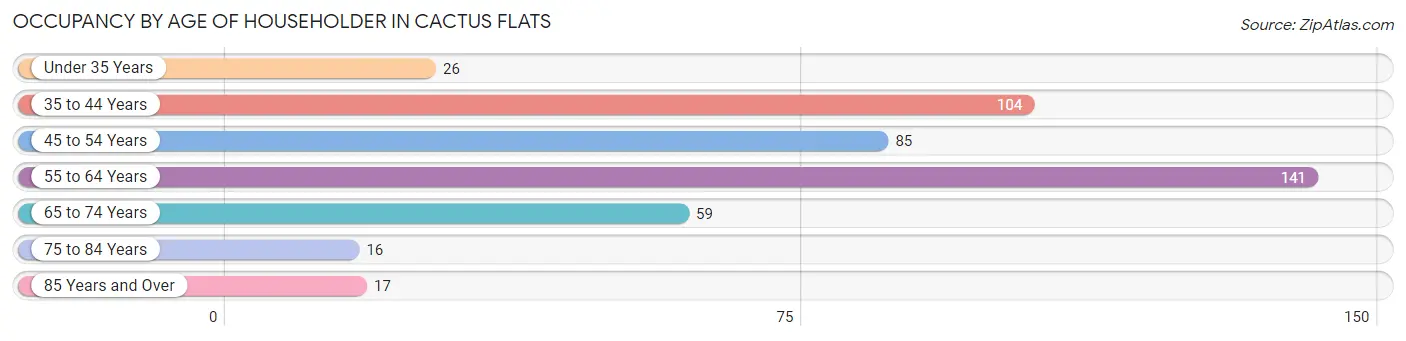
| Age Bracket | # Households | % Households |
| Under 35 Years | 26 | 5.8% |
| 35 to 44 Years | 104 | 23.2% |
| 45 to 54 Years | 85 | 19.0% |
| 55 to 64 Years | 141 | 31.5% |
| 65 to 74 Years | 59 | 13.2% |
| 75 to 84 Years | 16 | 3.6% |
| 85 Years and Over | 17 | 3.8% |
| Total | 448 | 100.0% |
Housing Finances in Cactus Flats
Median Income by Occupancy in Cactus Flats
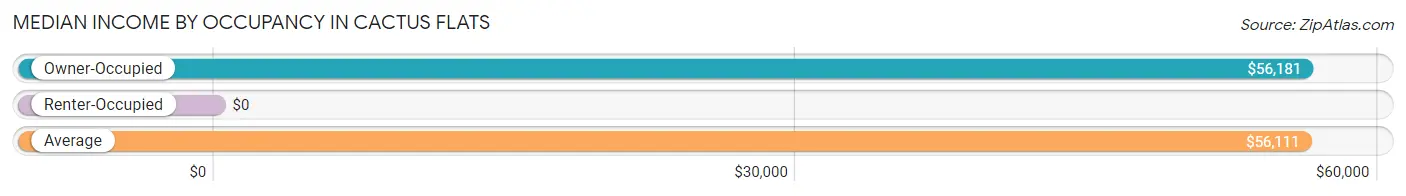
| Occupancy Type | # Households | Median Income |
| Owner-Occupied | 375 (83.7%) | $56,181 |
| Renter-Occupied | 73 (16.3%) | $0 |
| Average | 448 (100.0%) | $56,111 |
Occupancy by Householder Income Bracket in Cactus Flats
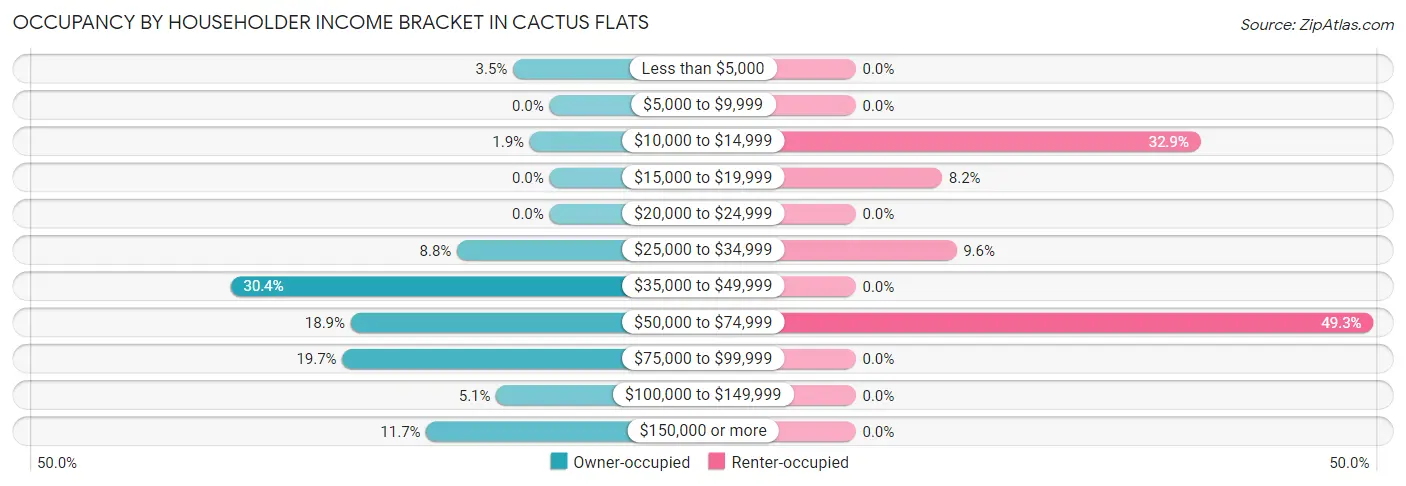
| Income Bracket | Owner-occupied | Renter-occupied |
| Less than $5,000 | 13 (3.5%) | 0 (0.0%) |
| $5,000 to $9,999 | 0 (0.0%) | 0 (0.0%) |
| $10,000 to $14,999 | 7 (1.9%) | 24 (32.9%) |
| $15,000 to $19,999 | 0 (0.0%) | 6 (8.2%) |
| $20,000 to $24,999 | 0 (0.0%) | 0 (0.0%) |
| $25,000 to $34,999 | 33 (8.8%) | 7 (9.6%) |
| $35,000 to $49,999 | 114 (30.4%) | 0 (0.0%) |
| $50,000 to $74,999 | 71 (18.9%) | 36 (49.3%) |
| $75,000 to $99,999 | 74 (19.7%) | 0 (0.0%) |
| $100,000 to $149,999 | 19 (5.1%) | 0 (0.0%) |
| $150,000 or more | 44 (11.7%) | 0 (0.0%) |
| Total | 375 (100.0%) | 73 (100.0%) |
Monthly Housing Cost Tiers in Cactus Flats
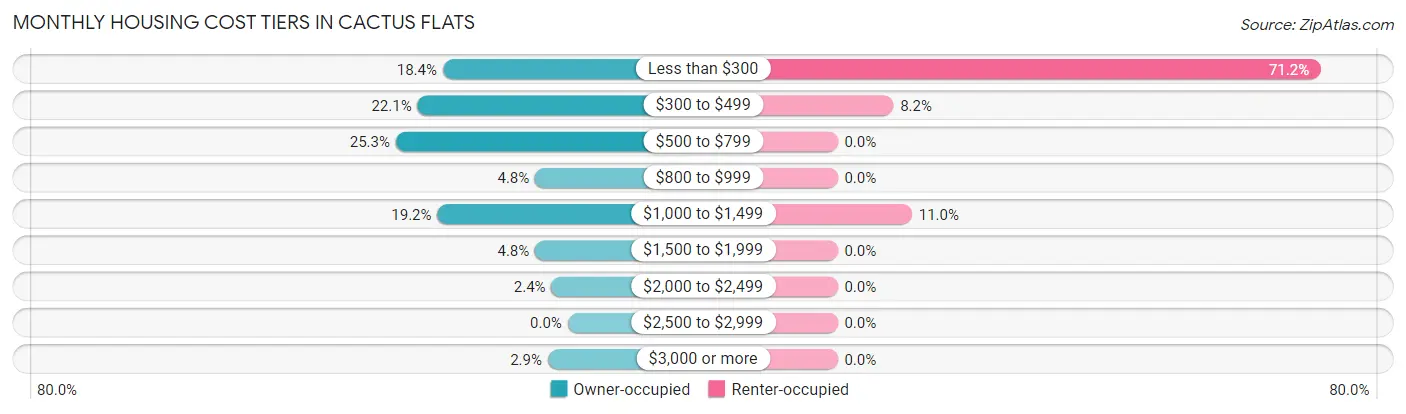
| Monthly Cost | Owner-occupied | Renter-occupied |
| Less than $300 | 69 (18.4%) | 52 (71.2%) |
| $300 to $499 | 83 (22.1%) | 6 (8.2%) |
| $500 to $799 | 95 (25.3%) | 0 (0.0%) |
| $800 to $999 | 18 (4.8%) | 0 (0.0%) |
| $1,000 to $1,499 | 72 (19.2%) | 8 (11.0%) |
| $1,500 to $1,999 | 18 (4.8%) | 0 (0.0%) |
| $2,000 to $2,499 | 9 (2.4%) | 0 (0.0%) |
| $2,500 to $2,999 | 0 (0.0%) | 0 (0.0%) |
| $3,000 or more | 11 (2.9%) | 0 (0.0%) |
| Total | 375 (100.0%) | 73 (100.0%) |
Physical Housing Characteristics in Cactus Flats
Housing Structures in Cactus Flats
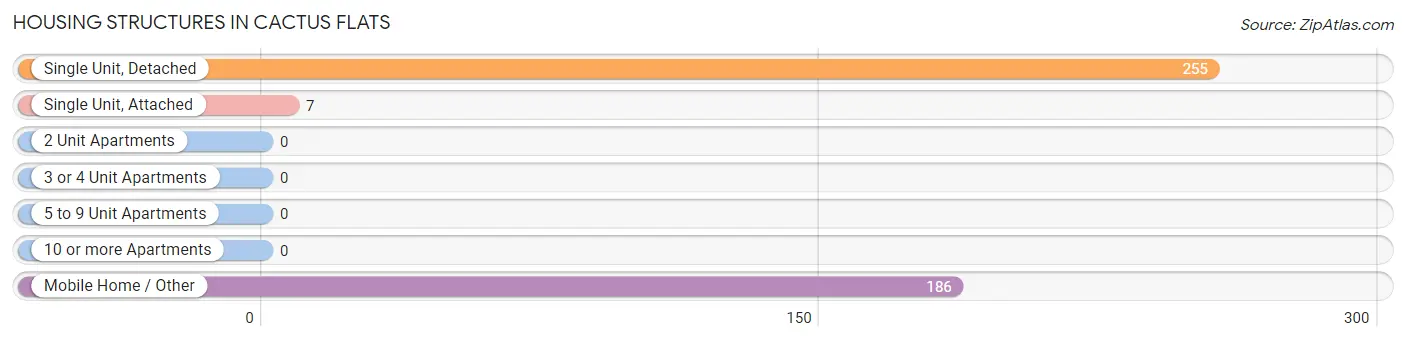
| Structure Type | # Housing Units | % Housing Units |
| Single Unit, Detached | 255 | 56.9% |
| Single Unit, Attached | 7 | 1.6% |
| 2 Unit Apartments | 0 | 0.0% |
| 3 or 4 Unit Apartments | 0 | 0.0% |
| 5 to 9 Unit Apartments | 0 | 0.0% |
| 10 or more Apartments | 0 | 0.0% |
| Mobile Home / Other | 186 | 41.5% |
| Total | 448 | 100.0% |
Housing Structures by Occupancy in Cactus Flats
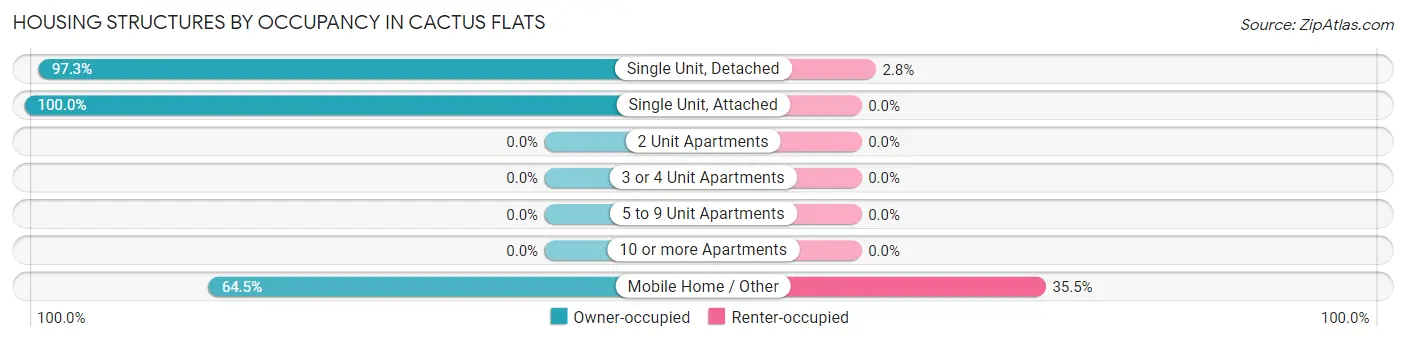
| Structure Type | Owner-occupied | Renter-occupied |
| Single Unit, Detached | 248 (97.3%) | 7 (2.8%) |
| Single Unit, Attached | 7 (100.0%) | 0 (0.0%) |
| 2 Unit Apartments | 0 (0.0%) | 0 (0.0%) |
| 3 or 4 Unit Apartments | 0 (0.0%) | 0 (0.0%) |
| 5 to 9 Unit Apartments | 0 (0.0%) | 0 (0.0%) |
| 10 or more Apartments | 0 (0.0%) | 0 (0.0%) |
| Mobile Home / Other | 120 (64.5%) | 66 (35.5%) |
| Total | 375 (83.7%) | 73 (16.3%) |
Housing Structures by Number of Rooms in Cactus Flats
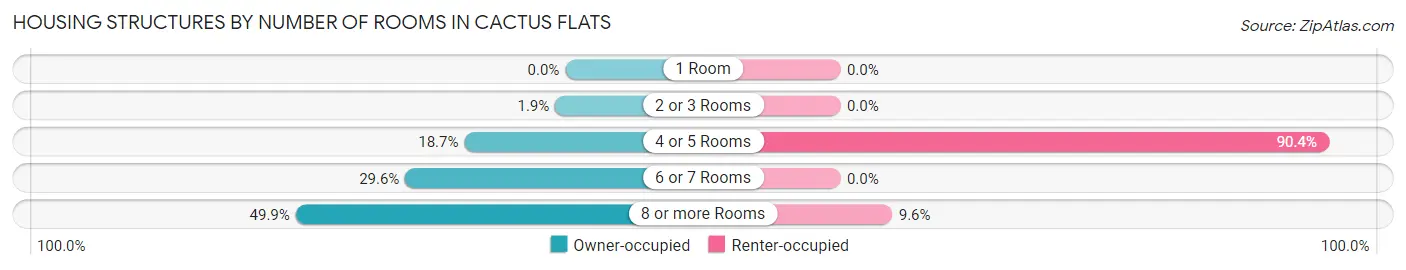
| Number of Rooms | Owner-occupied | Renter-occupied |
| 1 Room | 0 (0.0%) | 0 (0.0%) |
| 2 or 3 Rooms | 7 (1.9%) | 0 (0.0%) |
| 4 or 5 Rooms | 70 (18.7%) | 66 (90.4%) |
| 6 or 7 Rooms | 111 (29.6%) | 0 (0.0%) |
| 8 or more Rooms | 187 (49.9%) | 7 (9.6%) |
| Total | 375 (100.0%) | 73 (100.0%) |
Housing Structure by Heating Type in Cactus Flats
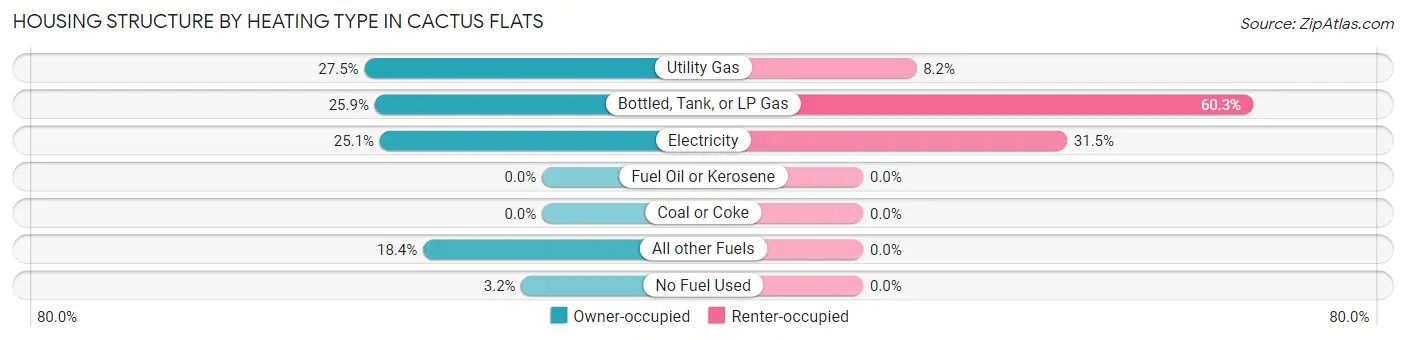
| Heating Type | Owner-occupied | Renter-occupied |
| Utility Gas | 103 (27.5%) | 6 (8.2%) |
| Bottled, Tank, or LP Gas | 97 (25.9%) | 44 (60.3%) |
| Electricity | 94 (25.1%) | 23 (31.5%) |
| Fuel Oil or Kerosene | 0 (0.0%) | 0 (0.0%) |
| Coal or Coke | 0 (0.0%) | 0 (0.0%) |
| All other Fuels | 69 (18.4%) | 0 (0.0%) |
| No Fuel Used | 12 (3.2%) | 0 (0.0%) |
| Total | 375 (100.0%) | 73 (100.0%) |
Household Vehicle Usage in Cactus Flats

| Vehicles per Household | Owner-occupied | Renter-occupied |
| No Vehicle | 0 (0.0%) | 6 (8.2%) |
| 1 Vehicle | 28 (7.5%) | 16 (21.9%) |
| 2 Vehicles | 70 (18.7%) | 15 (20.5%) |
| 3 or more Vehicles | 277 (73.9%) | 36 (49.3%) |
| Total | 375 (100.0%) | 73 (100.0%) |
Real Estate & Mortgages in Cactus Flats
Real Estate and Mortgage Overview in Cactus Flats
| Characteristic | Without Mortgage | With Mortgage |
| Housing Units | 247 | 128 |
| Median Property Value | $273,000 | $215,400 |
| Median Household Income | $60,536 | $29 |
| Monthly Housing Costs | $419 | $11 |
| Real Estate Taxes | $1,159 | $0 |
Property Value by Mortgage Status in Cactus Flats
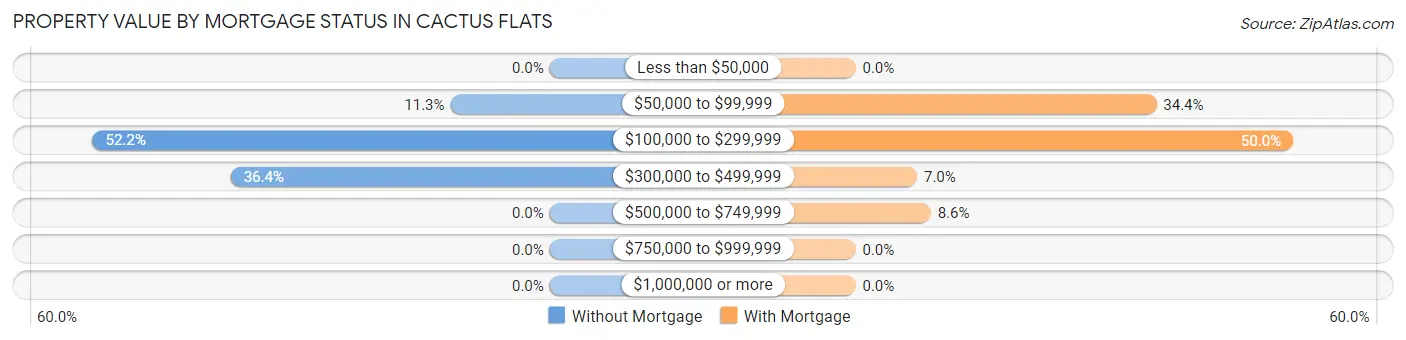
| Property Value | Without Mortgage | With Mortgage |
| Less than $50,000 | 0 (0.0%) | 0 (0.0%) |
| $50,000 to $99,999 | 28 (11.3%) | 44 (34.4%) |
| $100,000 to $299,999 | 129 (52.2%) | 64 (50.0%) |
| $300,000 to $499,999 | 90 (36.4%) | 9 (7.0%) |
| $500,000 to $749,999 | 0 (0.0%) | 11 (8.6%) |
| $750,000 to $999,999 | 0 (0.0%) | 0 (0.0%) |
| $1,000,000 or more | 0 (0.0%) | 0 (0.0%) |
| Total | 247 (100.0%) | 128 (100.0%) |
Household Income by Mortgage Status in Cactus Flats
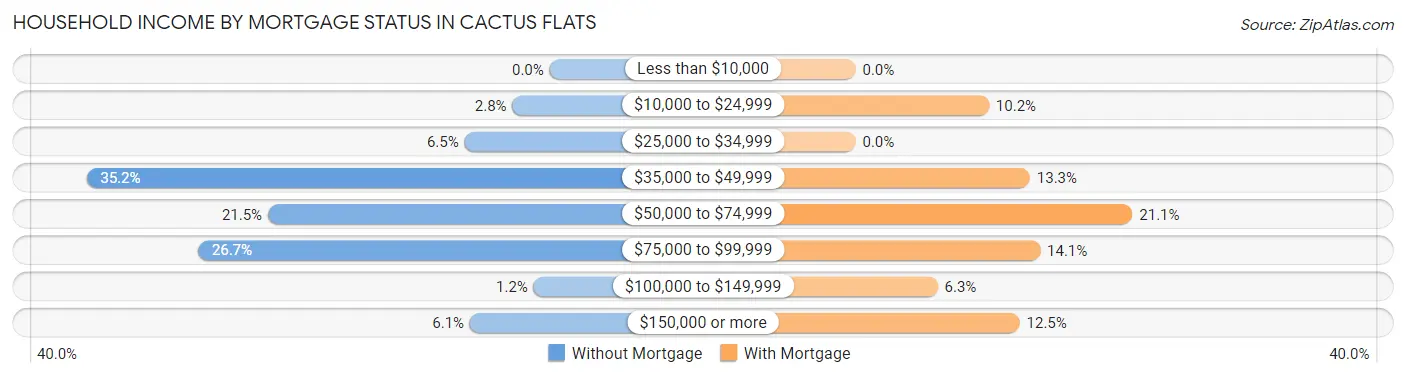
| Household Income | Without Mortgage | With Mortgage |
| Less than $10,000 | 0 (0.0%) | 0 (0.0%) |
| $10,000 to $24,999 | 7 (2.8%) | 13 (10.2%) |
| $25,000 to $34,999 | 16 (6.5%) | 0 (0.0%) |
| $35,000 to $49,999 | 87 (35.2%) | 17 (13.3%) |
| $50,000 to $74,999 | 53 (21.5%) | 27 (21.1%) |
| $75,000 to $99,999 | 66 (26.7%) | 18 (14.1%) |
| $100,000 to $149,999 | 3 (1.2%) | 8 (6.2%) |
| $150,000 or more | 15 (6.1%) | 16 (12.5%) |
| Total | 247 (100.0%) | 128 (100.0%) |
Property Value to Household Income Ratio in Cactus Flats
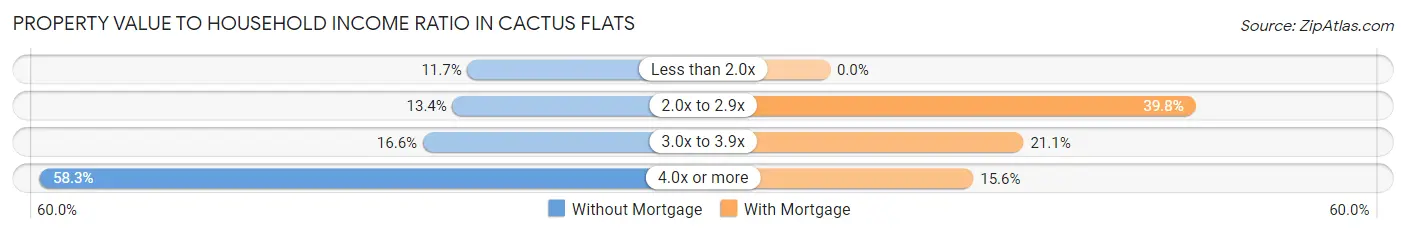
| Value-to-Income Ratio | Without Mortgage | With Mortgage |
| Less than 2.0x | 29 (11.7%) | 0 (0.0%) |
| 2.0x to 2.9x | 33 (13.4%) | 51 (39.8%) |
| 3.0x to 3.9x | 41 (16.6%) | 27 (21.1%) |
| 4.0x or more | 144 (58.3%) | 20 (15.6%) |
| Total | 247 (100.0%) | 128 (100.0%) |
Real Estate Taxes by Mortgage Status in Cactus Flats
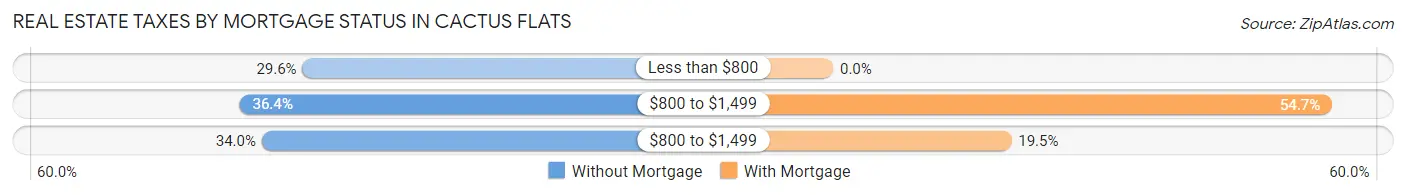
| Property Taxes | Without Mortgage | With Mortgage |
| Less than $800 | 73 (29.5%) | 0 (0.0%) |
| $800 to $1,499 | 90 (36.4%) | 70 (54.7%) |
| $800 to $1,499 | 84 (34.0%) | 25 (19.5%) |
| Total | 247 (100.0%) | 128 (100.0%) |
Health & Disability in Cactus Flats
Health Insurance Coverage by Age in Cactus Flats
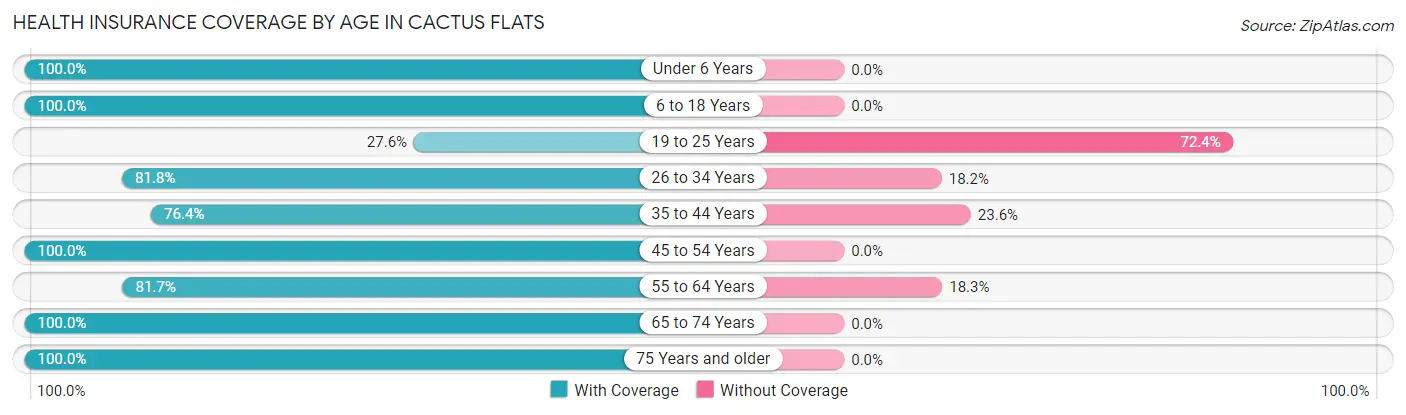
| Age Bracket | With Coverage | Without Coverage |
| Under 6 Years | 146 (100.0%) | 0 (0.0%) |
| 6 to 18 Years | 316 (100.0%) | 0 (0.0%) |
| 19 to 25 Years | 8 (27.6%) | 21 (72.4%) |
| 26 to 34 Years | 54 (81.8%) | 12 (18.2%) |
| 35 to 44 Years | 165 (76.4%) | 51 (23.6%) |
| 45 to 54 Years | 96 (100.0%) | 0 (0.0%) |
| 55 to 64 Years | 161 (81.7%) | 36 (18.3%) |
| 65 to 74 Years | 99 (100.0%) | 0 (0.0%) |
| 75 Years and older | 73 (100.0%) | 0 (0.0%) |
| Total | 1,118 (90.3%) | 120 (9.7%) |
Health Insurance Coverage by Citizenship Status in Cactus Flats
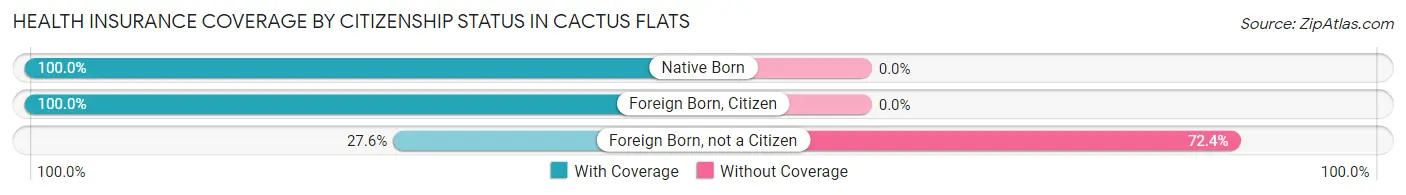
| Citizenship Status | With Coverage | Without Coverage |
| Native Born | 146 (100.0%) | 0 (0.0%) |
| Foreign Born, Citizen | 316 (100.0%) | 0 (0.0%) |
| Foreign Born, not a Citizen | 8 (27.6%) | 21 (72.4%) |
Health Insurance Coverage by Household Income in Cactus Flats
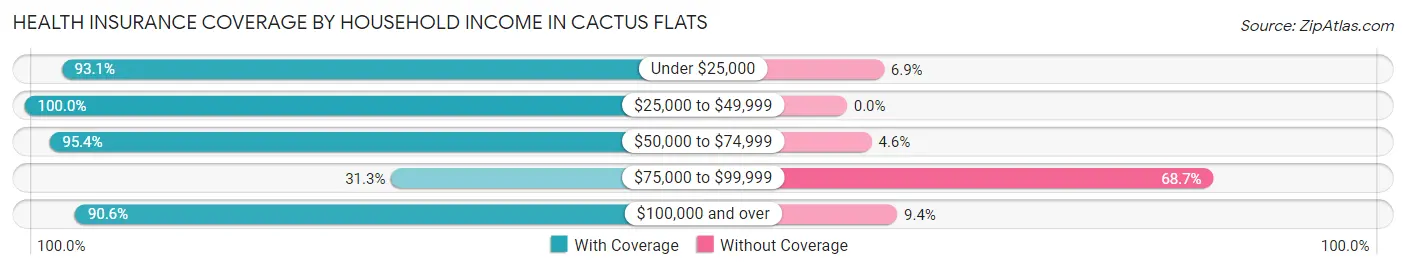
| Household Income | With Coverage | Without Coverage |
| Under $25,000 | 161 (93.1%) | 12 (6.9%) |
| $25,000 to $49,999 | 333 (100.0%) | 0 (0.0%) |
| $50,000 to $74,999 | 391 (95.4%) | 19 (4.6%) |
| $75,000 to $99,999 | 31 (31.3%) | 68 (68.7%) |
| $100,000 and over | 202 (90.6%) | 21 (9.4%) |
Public vs Private Health Insurance Coverage by Age in Cactus Flats
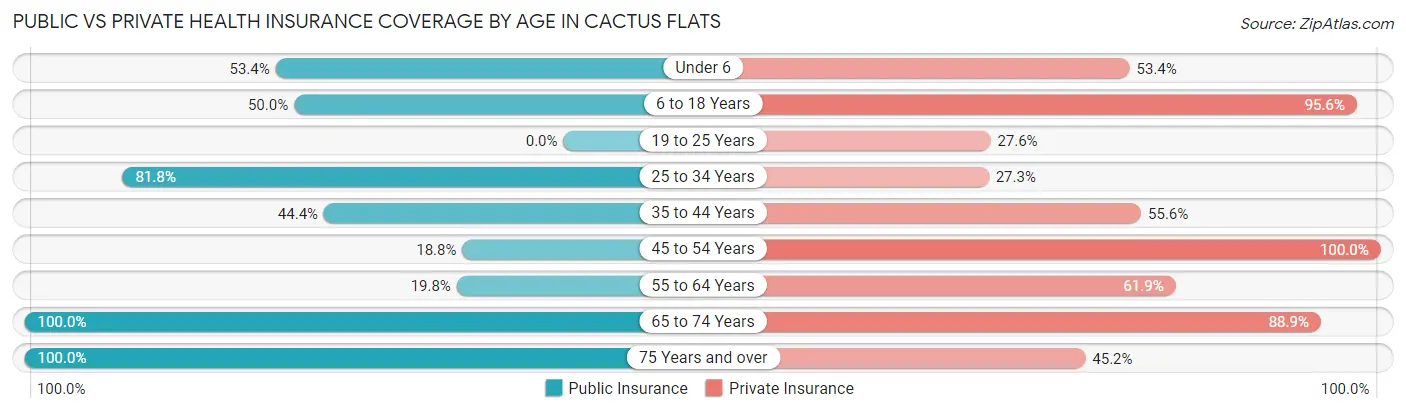
| Age Bracket | Public Insurance | Private Insurance |
| Under 6 | 78 (53.4%) | 78 (53.4%) |
| 6 to 18 Years | 158 (50.0%) | 302 (95.6%) |
| 19 to 25 Years | 0 (0.0%) | 8 (27.6%) |
| 25 to 34 Years | 54 (81.8%) | 18 (27.3%) |
| 35 to 44 Years | 96 (44.4%) | 120 (55.6%) |
| 45 to 54 Years | 18 (18.8%) | 96 (100.0%) |
| 55 to 64 Years | 39 (19.8%) | 122 (61.9%) |
| 65 to 74 Years | 99 (100.0%) | 88 (88.9%) |
| 75 Years and over | 73 (100.0%) | 33 (45.2%) |
| Total | 615 (49.7%) | 865 (69.9%) |
Disability Status by Sex by Age in Cactus Flats
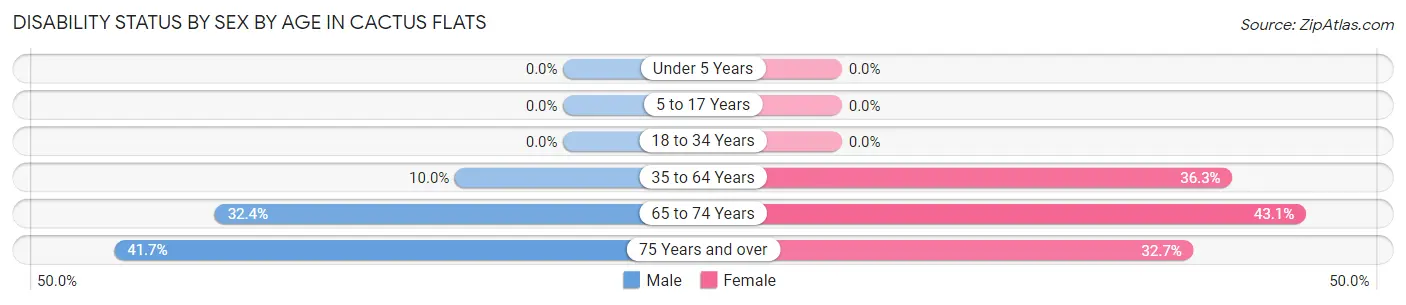
| Age Bracket | Male | Female |
| Under 5 Years | 0 (0.0%) | 0 (0.0%) |
| 5 to 17 Years | 0 (0.0%) | 0 (0.0%) |
| 18 to 34 Years | 0 (0.0%) | 0 (0.0%) |
| 35 to 64 Years | 27 (10.0%) | 87 (36.2%) |
| 65 to 74 Years | 11 (32.4%) | 28 (43.1%) |
| 75 Years and over | 10 (41.7%) | 16 (32.7%) |
Disability Class by Sex by Age in Cactus Flats
Disability Class: Hearing Difficulty
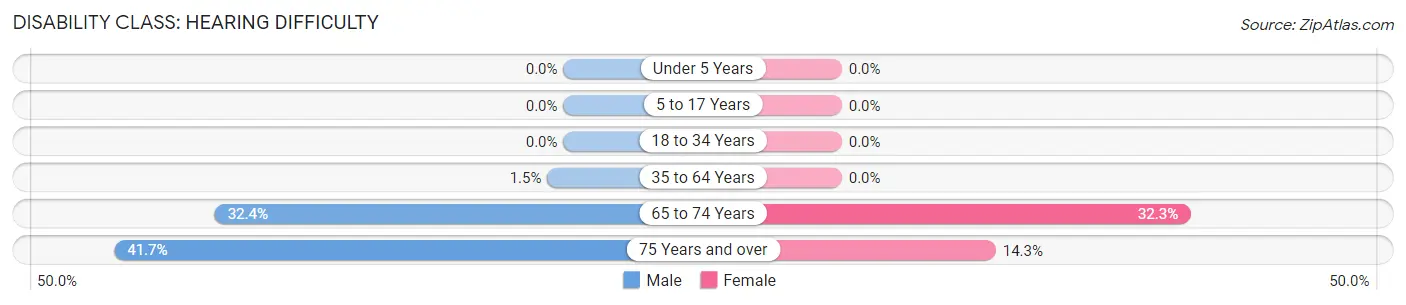
| Age Bracket | Male | Female |
| Under 5 Years | 0 (0.0%) | 0 (0.0%) |
| 5 to 17 Years | 0 (0.0%) | 0 (0.0%) |
| 18 to 34 Years | 0 (0.0%) | 0 (0.0%) |
| 35 to 64 Years | 4 (1.5%) | 0 (0.0%) |
| 65 to 74 Years | 11 (32.4%) | 21 (32.3%) |
| 75 Years and over | 10 (41.7%) | 7 (14.3%) |
Disability Class: Vision Difficulty
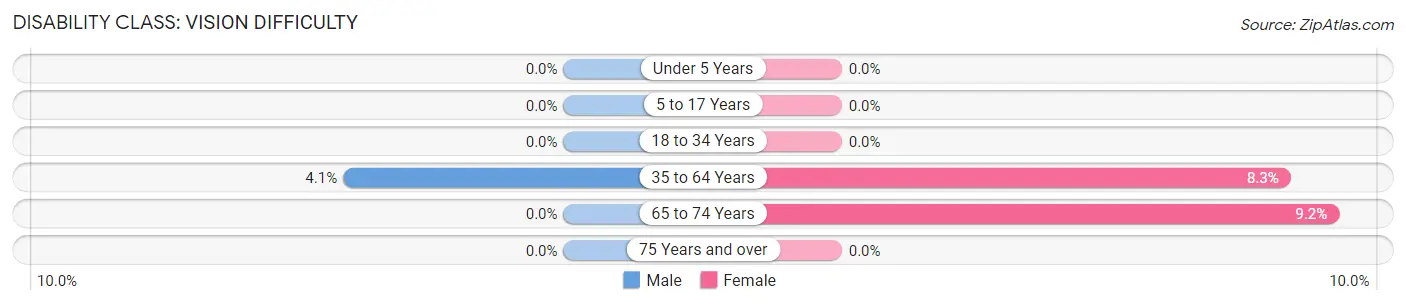
| Age Bracket | Male | Female |
| Under 5 Years | 0 (0.0%) | 0 (0.0%) |
| 5 to 17 Years | 0 (0.0%) | 0 (0.0%) |
| 18 to 34 Years | 0 (0.0%) | 0 (0.0%) |
| 35 to 64 Years | 11 (4.1%) | 20 (8.3%) |
| 65 to 74 Years | 0 (0.0%) | 6 (9.2%) |
| 75 Years and over | 0 (0.0%) | 0 (0.0%) |
Disability Class: Cognitive Difficulty
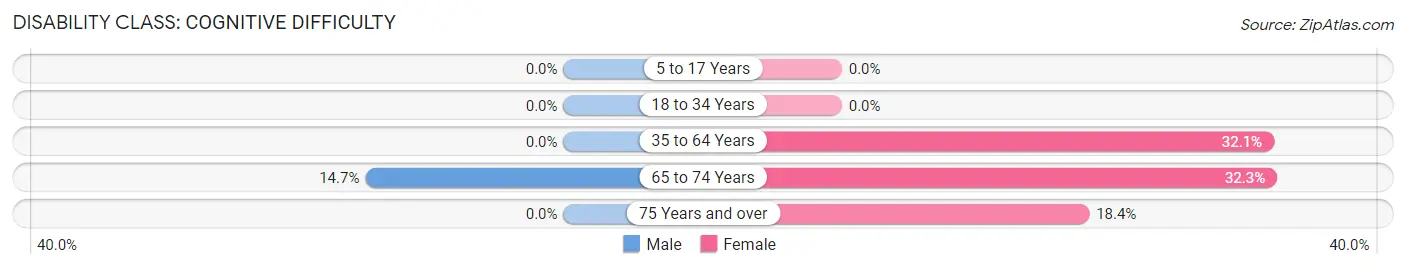
| Age Bracket | Male | Female |
| 5 to 17 Years | 0 (0.0%) | 0 (0.0%) |
| 18 to 34 Years | 0 (0.0%) | 0 (0.0%) |
| 35 to 64 Years | 0 (0.0%) | 77 (32.1%) |
| 65 to 74 Years | 5 (14.7%) | 21 (32.3%) |
| 75 Years and over | 0 (0.0%) | 9 (18.4%) |
Disability Class: Ambulatory Difficulty
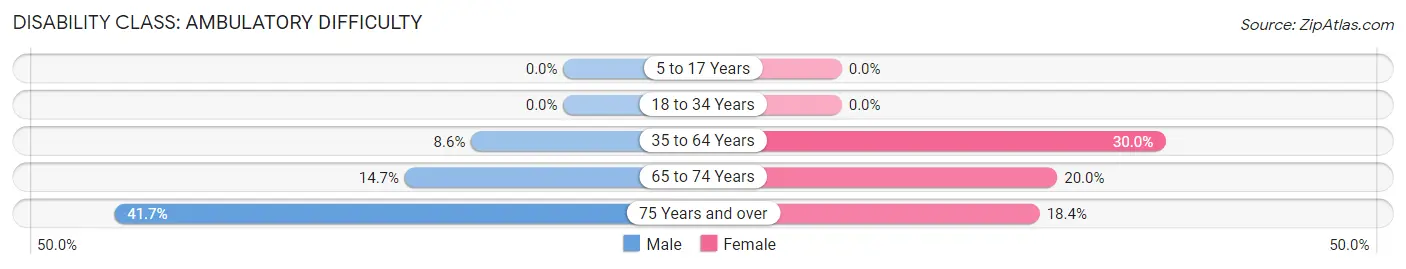
| Age Bracket | Male | Female |
| 5 to 17 Years | 0 (0.0%) | 0 (0.0%) |
| 18 to 34 Years | 0 (0.0%) | 0 (0.0%) |
| 35 to 64 Years | 23 (8.6%) | 72 (30.0%) |
| 65 to 74 Years | 5 (14.7%) | 13 (20.0%) |
| 75 Years and over | 10 (41.7%) | 9 (18.4%) |
Disability Class: Self-Care Difficulty
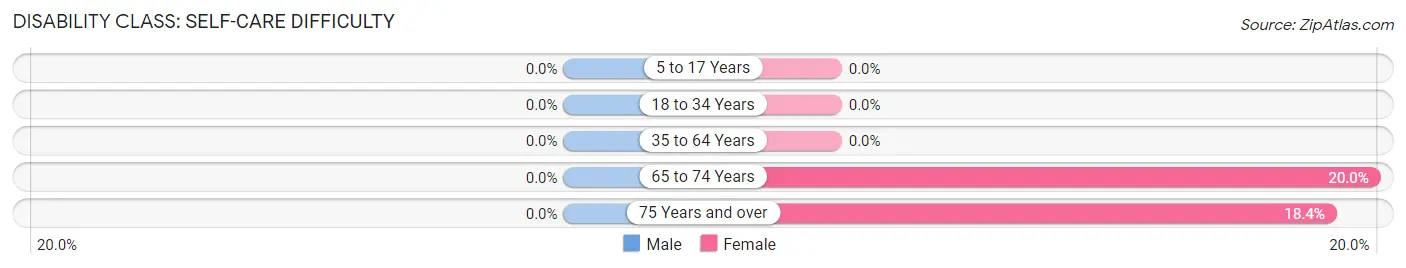
| Age Bracket | Male | Female |
| 5 to 17 Years | 0 (0.0%) | 0 (0.0%) |
| 18 to 34 Years | 0 (0.0%) | 0 (0.0%) |
| 35 to 64 Years | 0 (0.0%) | 0 (0.0%) |
| 65 to 74 Years | 0 (0.0%) | 13 (20.0%) |
| 75 Years and over | 0 (0.0%) | 9 (18.4%) |
Technology Access in Cactus Flats
Computing Device Access in Cactus Flats
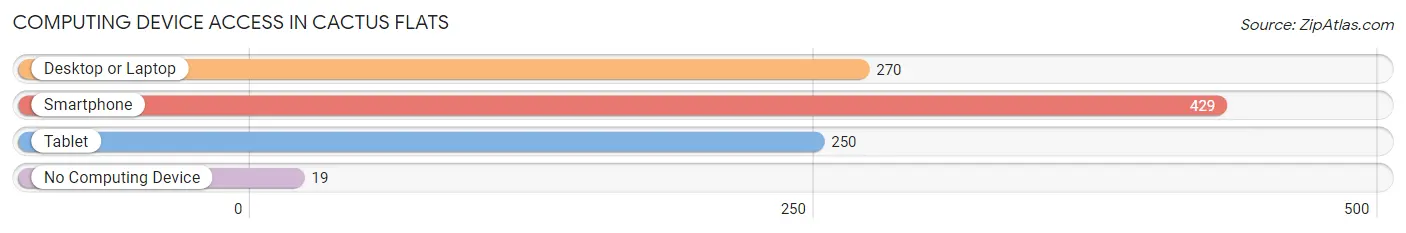
| Device Type | # Households | % Households |
| Desktop or Laptop | 270 | 60.3% |
| Smartphone | 429 | 95.8% |
| Tablet | 250 | 55.8% |
| No Computing Device | 19 | 4.2% |
| Total | 448 | 100.0% |
Internet Access in Cactus Flats
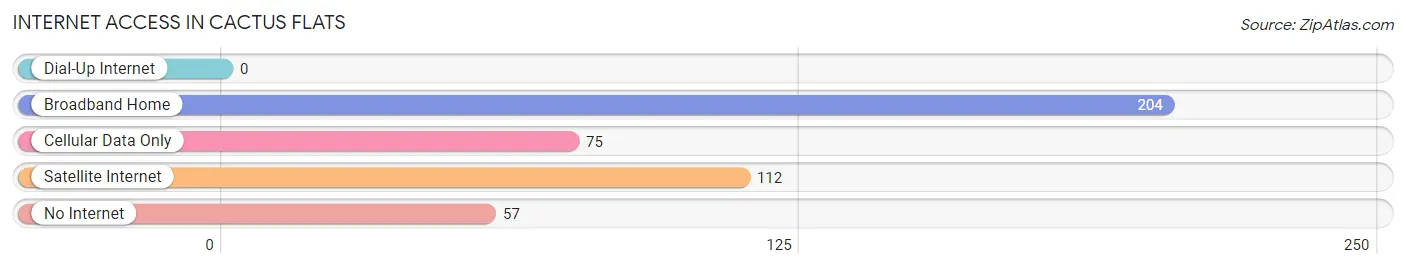
| Internet Type | # Households | % Households |
| Dial-Up Internet | 0 | 0.0% |
| Broadband Home | 204 | 45.5% |
| Cellular Data Only | 75 | 16.7% |
| Satellite Internet | 112 | 25.0% |
| No Internet | 57 | 12.7% |
| Total | 448 | 100.0% |
Cactus Flats Summary
Cactus Flats is a small town located in the state of Arizona, in the United States. It is situated in the Sonoran Desert, in the northern part of the state, and is surrounded by the Gila River, the San Pedro River, and the Santa Cruz River. The town is located in the county of Pima, and is part of the Tucson Metropolitan Statistical Area.
History
Cactus Flats was founded in 1876 by a group of settlers from the nearby town of Tucson. The settlers were looking for a place to settle and farm, and the area around Cactus Flats was ideal for this purpose. The town was named after the abundance of cacti in the area.
The town grew slowly, but steadily, and by the early 1900s, it had become a thriving agricultural community. The town was home to a variety of crops, including cotton, alfalfa, and citrus fruits. The town also had a small mining industry, which provided jobs for many of the town's residents.
In the 1950s, the town began to experience a decline in population, as many of the town's residents moved away in search of better opportunities. However, in the late 1970s, the town experienced a resurgence in population, as many people moved to the area in search of a more rural lifestyle.
Geography
Cactus Flats is located in the Sonoran Desert, in the northern part of Arizona. The town is situated in the county of Pima, and is part of the Tucson Metropolitan Statistical Area. The town is surrounded by the Gila River, the San Pedro River, and the Santa Cruz River.
The town is located at an elevation of 1,890 feet (576 meters) above sea level. The climate in Cactus Flats is arid, with hot summers and mild winters. The average annual temperature is around 70°F (21°C).
Economy
The economy of Cactus Flats is largely based on agriculture. The town is home to a variety of crops, including cotton, alfalfa, and citrus fruits. The town also has a small mining industry, which provides jobs for many of the town's residents.
In addition to agriculture and mining, the town is also home to a number of small businesses, including restaurants, shops, and other services. The town is also home to a number of tourist attractions, including the Cactus Flats Museum and the Cactus Flats Wildlife Refuge.
Demographics
As of the 2010 census, the population of Cactus Flats was 1,890. The town has a population density of 1,890 people per square mile (726 people per square kilometer). The racial makeup of the town is 87.3% White, 0.9% African American, 0.7% Native American, 0.3% Asian, 0.1% Pacific Islander, 8.7% from other races, and 2.0% from two or more races.
The median household income in Cactus Flats is $35,000, and the median family income is $41,000. The town has a poverty rate of 16.3%. The town has a high school graduation rate of 79.3%. The town is served by the Cactus Flats Unified School District.
Common Questions
What is Per Capita Income in Cactus Flats?
Per Capita income in Cactus Flats is $23,490.
What is the Median Family Income in Cactus Flats?
Median Family Income in Cactus Flats is $56,250.
What is the Median Household income in Cactus Flats?
Median Household Income in Cactus Flats is $56,111.
What is Income or Wage Gap in Cactus Flats?
Income or Wage Gap in Cactus Flats is 54.6%.
Women in Cactus Flats earn 45.4 cents for every dollar earned by a man.
What is Inequality or Gini Index in Cactus Flats?
Inequality or Gini Index in Cactus Flats is 0.38.
What is the Total Population of Cactus Flats?
Total Population of Cactus Flats is 1,238.
What is the Total Male Population of Cactus Flats?
Total Male Population of Cactus Flats is 658.
What is the Total Female Population of Cactus Flats?
Total Female Population of Cactus Flats is 580.
What is the Ratio of Males per 100 Females in Cactus Flats?
There are 113.45 Males per 100 Females in Cactus Flats.
What is the Ratio of Females per 100 Males in Cactus Flats?
There are 88.15 Females per 100 Males in Cactus Flats.
What is the Median Population Age in Cactus Flats?
Median Population Age in Cactus Flats is 42.1 Years.
What is the Average Family Size in Cactus Flats
Average Family Size in Cactus Flats is 3.3 People.
What is the Average Household Size in Cactus Flats
Average Household Size in Cactus Flats is 2.8 People.
How Large is the Labor Force in Cactus Flats?
There are 385 People in the Labor Forcein in Cactus Flats.
What is the Percentage of People in the Labor Force in Cactus Flats?
42.0% of People are in the Labor Force in Cactus Flats.
What is the Unemployment Rate in Cactus Flats?
Unemployment Rate in Cactus Flats is 1.8%.