Navajo County, AZ Map & Demographics
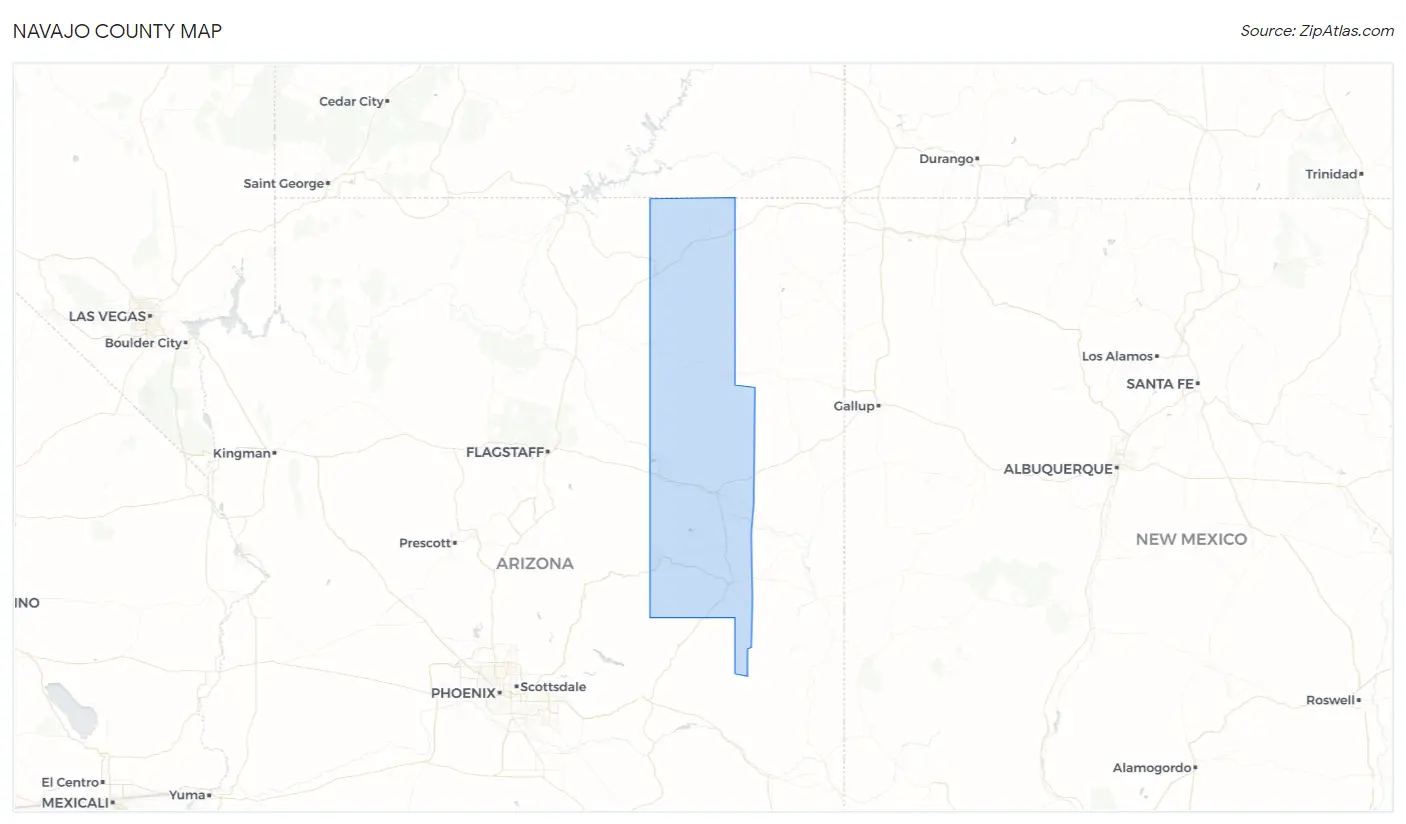
Navajo County Map
Navajo County Overview
$22,826
PER CAPITA INCOME
$58,541
AVG FAMILY INCOME
$50,335
AVG HOUSEHOLD INCOME
21.2%
WAGE / INCOME GAP [ % ]
78.8¢/ $1
WAGE / INCOME GAP [ $ ]
$12,957
FAMILY INCOME DEFICIT
0.45
INEQUALITY / GINI INDEX
107,110
TOTAL POPULATION
54,016
MALE POPULATION
53,094
FEMALE POPULATION
101.74
MALES / 100 FEMALES
98.29
FEMALES / 100 MALES
38.7
MEDIAN AGE
3.4
AVG FAMILY SIZE
2.8
AVG HOUSEHOLD SIZE
37,626
LABOR FORCE [ PEOPLE ]
45.7%
PERCENT IN LABOR FORCE
9.7%
UNEMPLOYMENT RATE
Navajo County Area Codes
Income in Navajo County
Income Overview in Navajo County
Per Capita Income in Navajo County is $22,826, while median incomes of families and households are $58,541 and $50,335 respectively.
| Characteristic | Number | Measure |
| Per Capita Income | 107,110 | $22,826 |
| Median Family Income | 26,486 | $58,541 |
| Mean Family Income | 26,486 | $73,268 |
| Median Household Income | 37,565 | $50,335 |
| Mean Household Income | 37,565 | $63,992 |
| Income Deficit | 26,486 | $12,957 |
| Wage / Income Gap (%) | 107,110 | 21.16% |
| Wage / Income Gap ($) | 107,110 | 78.84¢ per $1 |
| Gini / Inequality Index | 107,110 | 0.45 |
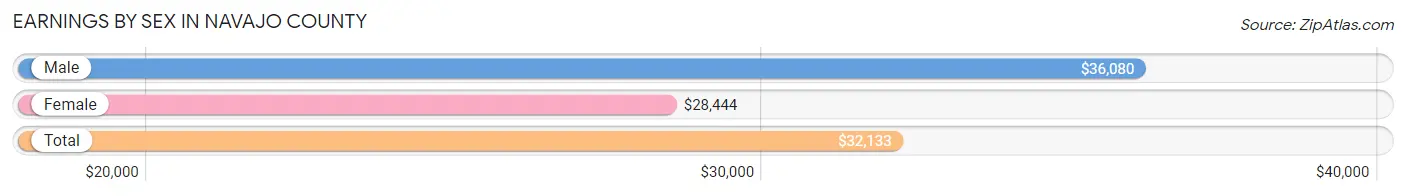
Earnings by Sex in Navajo County
Average Earnings in Navajo County are $32,133, $36,080 for men and $28,444 for women, a difference of 21.2%.
| Sex | Number | Average Earnings |
| Male | 20,464 (52.1%) | $36,080 |
| Female | 18,831 (47.9%) | $28,444 |
| Total | 39,295 (100.0%) | $32,133 |
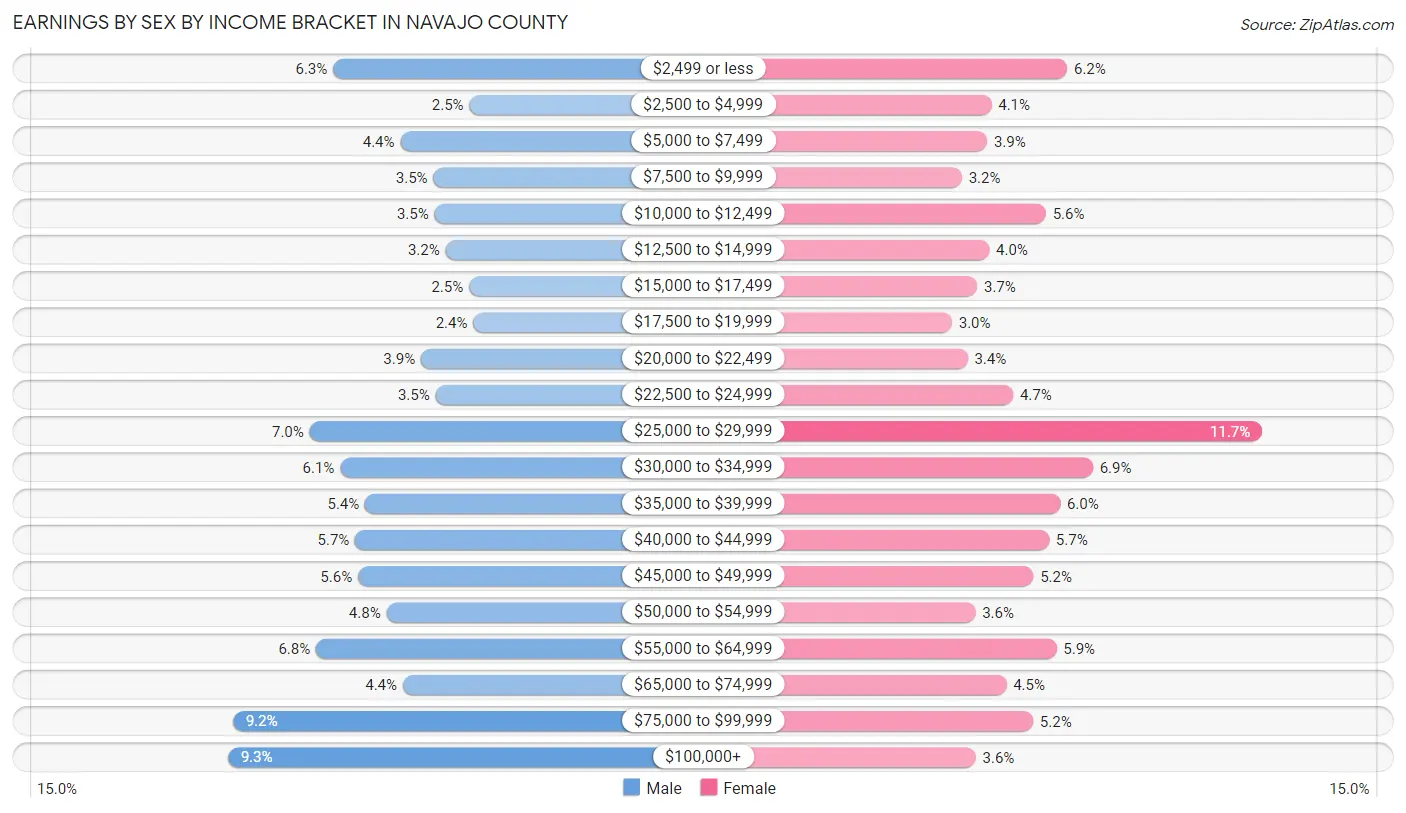
Earnings by Sex by Income Bracket in Navajo County
The most common earnings brackets in Navajo County are $100,000+ for men (1,902 | 9.3%) and $25,000 to $29,999 for women (2,197 | 11.7%).
| Income | Male | Female |
| $2,499 or less | 1,296 (6.3%) | 1,166 (6.2%) |
| $2,500 to $4,999 | 512 (2.5%) | 764 (4.1%) |
| $5,000 to $7,499 | 908 (4.4%) | 741 (3.9%) |
| $7,500 to $9,999 | 719 (3.5%) | 609 (3.2%) |
| $10,000 to $12,499 | 713 (3.5%) | 1,052 (5.6%) |
| $12,500 to $14,999 | 648 (3.2%) | 753 (4.0%) |
| $15,000 to $17,499 | 514 (2.5%) | 690 (3.7%) |
| $17,500 to $19,999 | 489 (2.4%) | 556 (2.9%) |
| $20,000 to $22,499 | 790 (3.9%) | 638 (3.4%) |
| $22,500 to $24,999 | 707 (3.5%) | 880 (4.7%) |
| $25,000 to $29,999 | 1,431 (7.0%) | 2,197 (11.7%) |
| $30,000 to $34,999 | 1,254 (6.1%) | 1,301 (6.9%) |
| $35,000 to $39,999 | 1,111 (5.4%) | 1,128 (6.0%) |
| $40,000 to $44,999 | 1,168 (5.7%) | 1,069 (5.7%) |
| $45,000 to $49,999 | 1,152 (5.6%) | 987 (5.2%) |
| $50,000 to $54,999 | 988 (4.8%) | 680 (3.6%) |
| $55,000 to $64,999 | 1,394 (6.8%) | 1,110 (5.9%) |
| $65,000 to $74,999 | 895 (4.4%) | 843 (4.5%) |
| $75,000 to $99,999 | 1,873 (9.1%) | 985 (5.2%) |
| $100,000+ | 1,902 (9.3%) | 682 (3.6%) |
| Total | 20,464 (100.0%) | 18,831 (100.0%) |
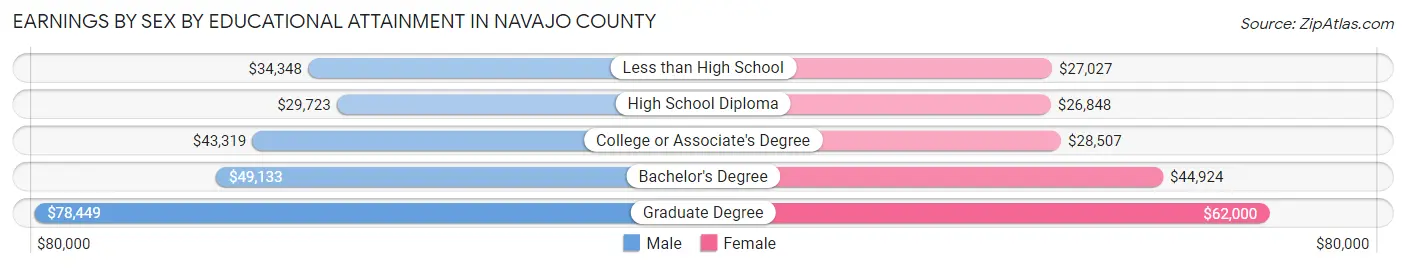
Earnings by Sex by Educational Attainment in Navajo County
Average earnings in Navajo County are $40,527 for men and $31,240 for women, a difference of 22.9%. Men with an educational attainment of graduate degree enjoy the highest average annual earnings of $78,449, while those with high school diploma education earn the least with $29,723. Women with an educational attainment of graduate degree earn the most with the average annual earnings of $62,000, while those with high school diploma education have the smallest earnings of $26,848.
| Educational Attainment | Male Income | Female Income |
| Less than High School | $34,348 | $27,027 |
| High School Diploma | $29,723 | $26,848 |
| College or Associate's Degree | $43,319 | $28,507 |
| Bachelor's Degree | $49,133 | $44,924 |
| Graduate Degree | $78,449 | $62,000 |
| Total | $40,527 | $31,240 |
Family Income in Navajo County
Family Income Brackets in Navajo County
According to the Navajo County family income data, there are 4,715 families falling into the $50,000 to $74,999 income range, which is the most common income bracket and makes up 17.8% of all families. Conversely, the $200,000+ income bracket is the least frequent group with only 768 families (2.9%) belonging to this category.
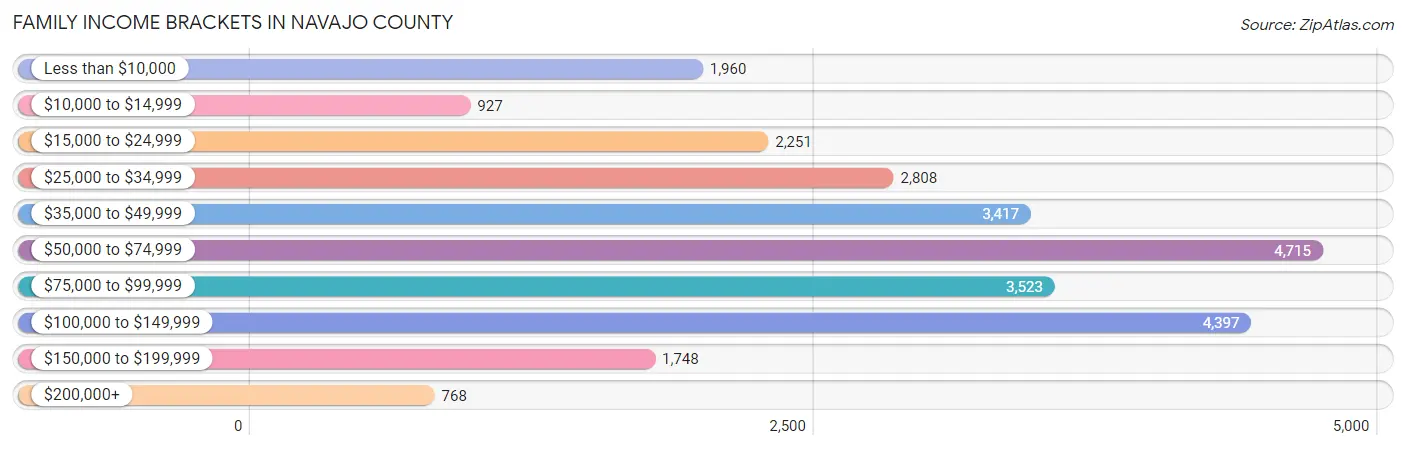
| Income Bracket | # Families | % Families |
| Less than $10,000 | 1,960 | 7.4% |
| $10,000 to $14,999 | 927 | 3.5% |
| $15,000 to $24,999 | 2,251 | 8.5% |
| $25,000 to $34,999 | 2,808 | 10.6% |
| $35,000 to $49,999 | 3,417 | 12.9% |
| $50,000 to $74,999 | 4,715 | 17.8% |
| $75,000 to $99,999 | 3,523 | 13.3% |
| $100,000 to $149,999 | 4,397 | 16.6% |
| $150,000 to $199,999 | 1,748 | 6.6% |
| $200,000+ | 768 | 2.9% |
Family Income by Famaliy Size in Navajo County
5-person families (2,510 | 9.5%) account for the highest median family income in Navajo County with $71,354 per family, while 2-person families (12,097 | 45.7%) have the highest median income of $30,396 per family member.
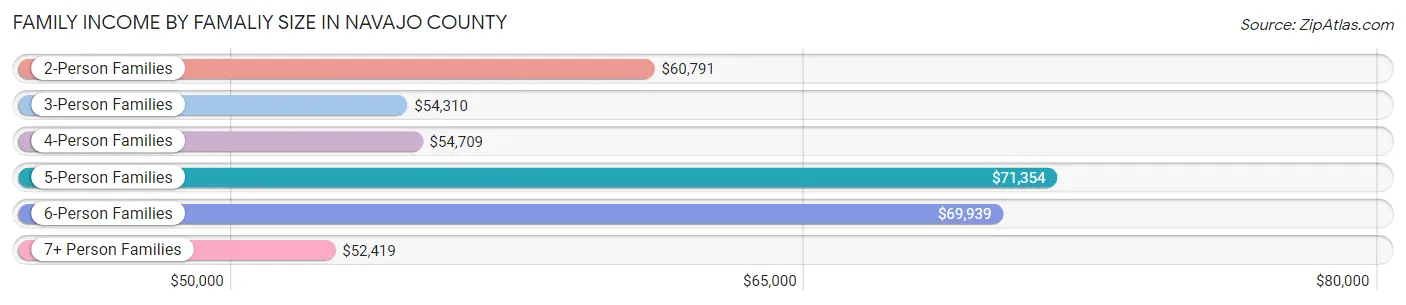
| Income Bracket | # Families | Median Income |
| 2-Person Families | 12,097 (45.7%) | $60,791 |
| 3-Person Families | 5,267 (19.9%) | $54,310 |
| 4-Person Families | 3,747 (14.1%) | $54,709 |
| 5-Person Families | 2,510 (9.5%) | $71,354 |
| 6-Person Families | 1,553 (5.9%) | $69,939 |
| 7+ Person Families | 1,312 (5.0%) | $52,419 |
| Total | 26,486 (100.0%) | $58,541 |
Family Income by Number of Earners in Navajo County
The median family income in Navajo County is $58,541, with families comprising 3+ earners (2,076) having the highest median family income of $117,623, while families with no earners (7,692) have the lowest median family income of $35,959, accounting for 7.8% and 29.0% of families, respectively.
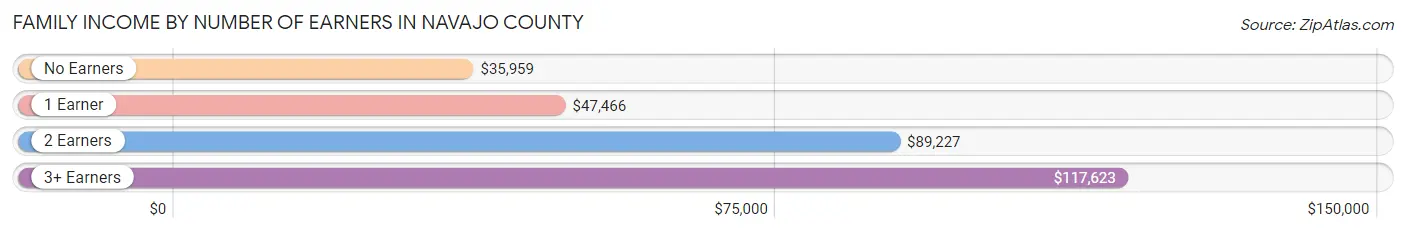
| Number of Earners | # Families | Median Income |
| No Earners | 7,692 (29.0%) | $35,959 |
| 1 Earner | 9,199 (34.7%) | $47,466 |
| 2 Earners | 7,519 (28.4%) | $89,227 |
| 3+ Earners | 2,076 (7.8%) | $117,623 |
| Total | 26,486 (100.0%) | $58,541 |
Household Income in Navajo County
Household Income Brackets in Navajo County
With 6,874 households falling in the category, the $50,000 to $74,999 income range is the most frequent in Navajo County, accounting for 18.3% of all households. In contrast, only 864 households (2.3%) fall into the $200,000+ income bracket, making it the least populous group.
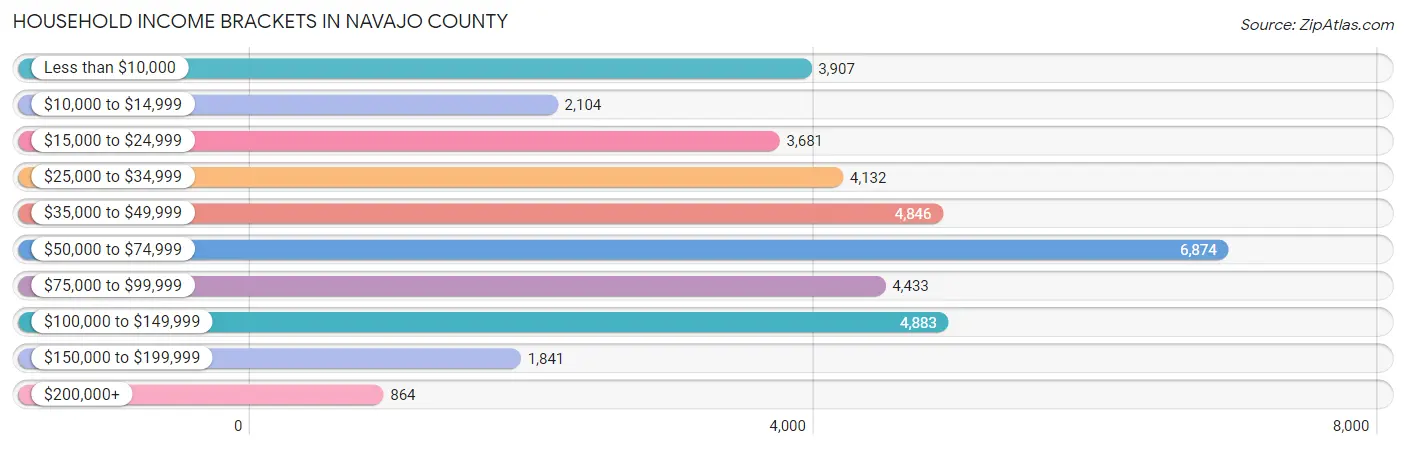
| Income Bracket | # Households | % Households |
| Less than $10,000 | 3,907 | 10.4% |
| $10,000 to $14,999 | 2,104 | 5.6% |
| $15,000 to $24,999 | 3,681 | 9.8% |
| $25,000 to $34,999 | 4,132 | 11.0% |
| $35,000 to $49,999 | 4,846 | 12.9% |
| $50,000 to $74,999 | 6,874 | 18.3% |
| $75,000 to $99,999 | 4,433 | 11.8% |
| $100,000 to $149,999 | 4,883 | 13.0% |
| $150,000 to $199,999 | 1,841 | 4.9% |
| $200,000+ | 864 | 2.3% |
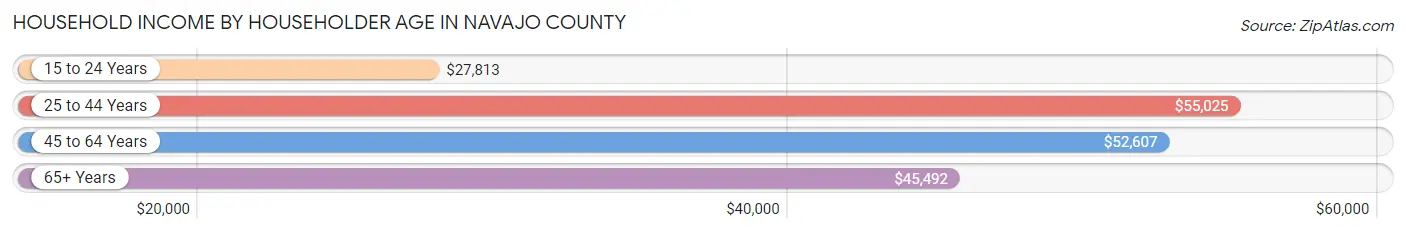
Household Income by Householder Age in Navajo County
The median household income in Navajo County is $50,335, with the highest median household income of $55,025 found in the 25 to 44 years age bracket for the primary householder. A total of 9,042 households (24.1%) fall into this category. Meanwhile, the 15 to 24 years age bracket for the primary householder has the lowest median household income of $27,813, with 1,088 households (2.9%) in this group.
| Income Bracket | # Households | Median Income |
| 15 to 24 Years | 1,088 (2.9%) | $27,813 |
| 25 to 44 Years | 9,042 (24.1%) | $55,025 |
| 45 to 64 Years | 14,660 (39.0%) | $52,607 |
| 65+ Years | 12,775 (34.0%) | $45,492 |
| Total | 37,565 (100.0%) | $50,335 |
Poverty in Navajo County
Income Below Poverty by Sex and Age in Navajo County
With 25.1% poverty level for males and 25.9% for females among the residents of Navajo County, 6 to 11 year old males and 5 year old females are the most vulnerable to poverty, with 1,884 males (36.8%) and 191 females (39.2%) in their respective age groups living below the poverty level.
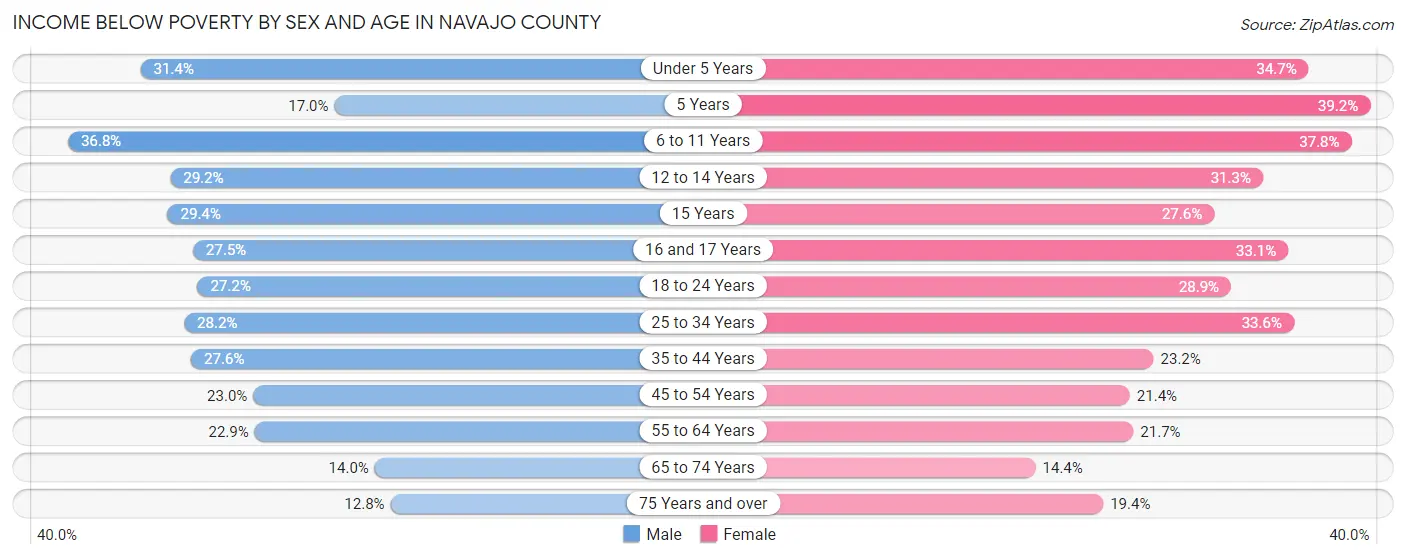
| Age Bracket | Male | Female |
| Under 5 Years | 1,076 (31.4%) | 1,104 (34.6%) |
| 5 Years | 126 (17.0%) | 191 (39.2%) |
| 6 to 11 Years | 1,884 (36.8%) | 1,741 (37.8%) |
| 12 to 14 Years | 712 (29.2%) | 795 (31.2%) |
| 15 Years | 223 (29.4%) | 302 (27.6%) |
| 16 and 17 Years | 467 (27.5%) | 425 (33.1%) |
| 18 to 24 Years | 1,212 (27.2%) | 1,191 (28.9%) |
| 25 to 34 Years | 1,669 (28.1%) | 2,036 (33.6%) |
| 35 to 44 Years | 1,504 (27.6%) | 1,299 (23.2%) |
| 45 to 54 Years | 1,264 (23.0%) | 1,215 (21.4%) |
| 55 to 64 Years | 1,532 (22.9%) | 1,606 (21.6%) |
| 65 to 74 Years | 846 (14.0%) | 925 (14.4%) |
| 75 Years and over | 452 (12.8%) | 794 (19.4%) |
| Total | 12,967 (25.1%) | 13,624 (25.9%) |
Income Above Poverty by Sex and Age in Navajo County
According to the poverty statistics in Navajo County, males aged 75 years and over and females aged 65 to 74 years are the age groups that are most secure financially, with 87.2% of males and 85.6% of females in these age groups living above the poverty line.
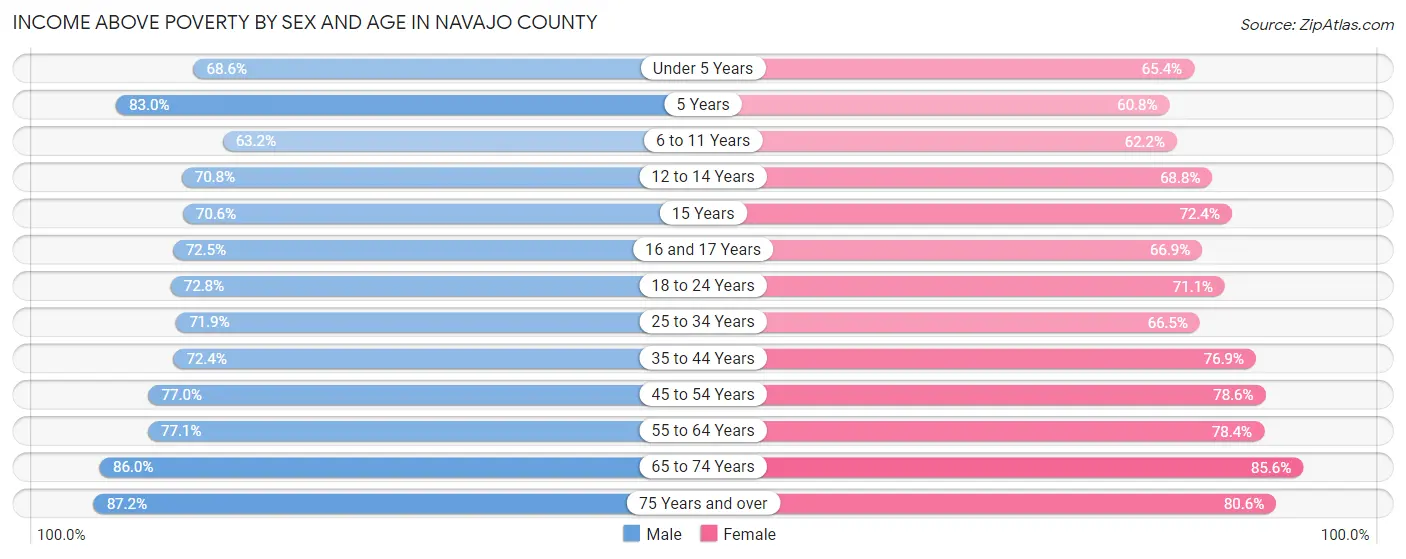
| Age Bracket | Male | Female |
| Under 5 Years | 2,352 (68.6%) | 2,082 (65.3%) |
| 5 Years | 615 (83.0%) | 296 (60.8%) |
| 6 to 11 Years | 3,239 (63.2%) | 2,861 (62.2%) |
| 12 to 14 Years | 1,728 (70.8%) | 1,749 (68.8%) |
| 15 Years | 536 (70.6%) | 791 (72.4%) |
| 16 and 17 Years | 1,231 (72.5%) | 858 (66.9%) |
| 18 to 24 Years | 3,250 (72.8%) | 2,931 (71.1%) |
| 25 to 34 Years | 4,260 (71.9%) | 4,032 (66.4%) |
| 35 to 44 Years | 3,938 (72.4%) | 4,313 (76.8%) |
| 45 to 54 Years | 4,225 (77.0%) | 4,465 (78.6%) |
| 55 to 64 Years | 5,150 (77.1%) | 5,812 (78.3%) |
| 65 to 74 Years | 5,191 (86.0%) | 5,502 (85.6%) |
| 75 Years and over | 3,069 (87.2%) | 3,297 (80.6%) |
| Total | 38,784 (74.9%) | 38,989 (74.1%) |
Income Below Poverty Among Married-Couple Families in Navajo County
The poverty statistics for married-couple families in Navajo County show that 10.0% or 1,766 of the total 17,605 families live below the poverty line. Families with 5 or more children have the highest poverty rate of 42.4%, comprising of 158 families. On the other hand, families with no children have the lowest poverty rate of 6.1%, which includes 657 families.
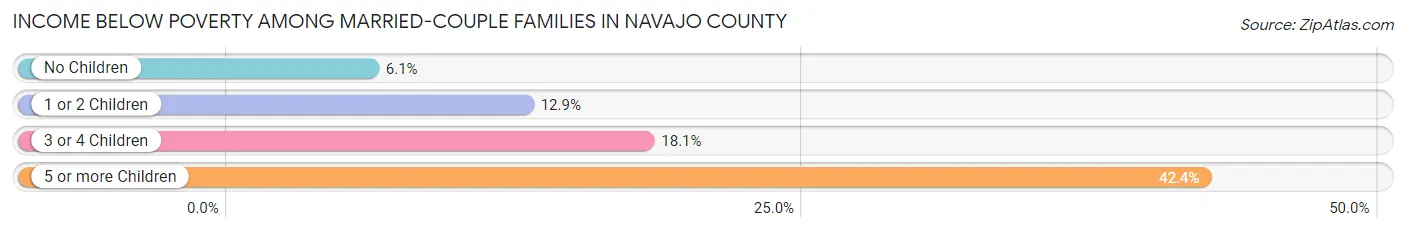
| Children | Above Poverty | Below Poverty |
| No Children | 10,058 (93.9%) | 657 (6.1%) |
| 1 or 2 Children | 3,813 (87.1%) | 563 (12.9%) |
| 3 or 4 Children | 1,753 (81.9%) | 388 (18.1%) |
| 5 or more Children | 215 (57.6%) | 158 (42.4%) |
| Total | 15,839 (90.0%) | 1,766 (10.0%) |
Income Below Poverty Among Single-Parent Households in Navajo County
According to the poverty data in Navajo County, 33.4% or 865 single-father households and 42.0% or 2,643 single-mother households are living below the poverty line. Among single-father households, those with 5 or more children have the highest poverty rate, with 71 households (67.6%) experiencing poverty. Likewise, among single-mother households, those with 3 or 4 children have the highest poverty rate, with 653 households (65.2%) falling below the poverty line.
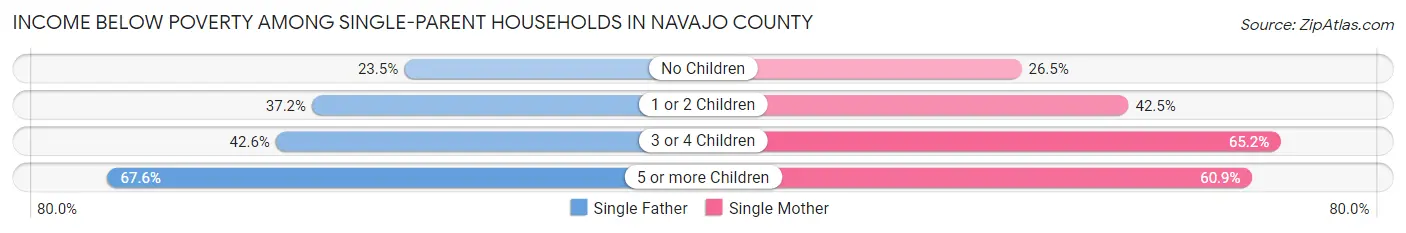
| Children | Single Father | Single Mother |
| No Children | 249 (23.5%) | 506 (26.5%) |
| 1 or 2 Children | 430 (37.2%) | 1,319 (42.4%) |
| 3 or 4 Children | 115 (42.6%) | 653 (65.2%) |
| 5 or more Children | 71 (67.6%) | 165 (60.9%) |
| Total | 865 (33.4%) | 2,643 (42.0%) |
Income Below Poverty Among Married-Couple vs Single-Parent Households in Navajo County
The poverty data for Navajo County shows that 1,766 of the married-couple family households (10.0%) and 3,508 of the single-parent households (39.5%) are living below the poverty level. Within the married-couple family households, those with 5 or more children have the highest poverty rate, with 158 households (42.4%) falling below the poverty line. Among the single-parent households, those with 5 or more children have the highest poverty rate, with 236 household (62.8%) living below poverty.
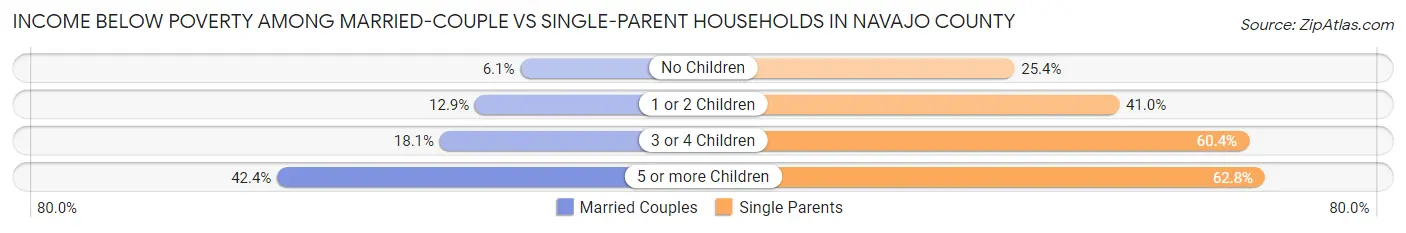
| Children | Married-Couple Families | Single-Parent Households |
| No Children | 657 (6.1%) | 755 (25.4%) |
| 1 or 2 Children | 563 (12.9%) | 1,749 (41.0%) |
| 3 or 4 Children | 388 (18.1%) | 768 (60.4%) |
| 5 or more Children | 158 (42.4%) | 236 (62.8%) |
| Total | 1,766 (10.0%) | 3,508 (39.5%) |
Race in Navajo County
The most populous races in Navajo County are White / Caucasian (49,409 | 46.1%), Native / Alaskan (46,154 | 43.1%), and Hispanic or Latino (12,728 | 11.9%).
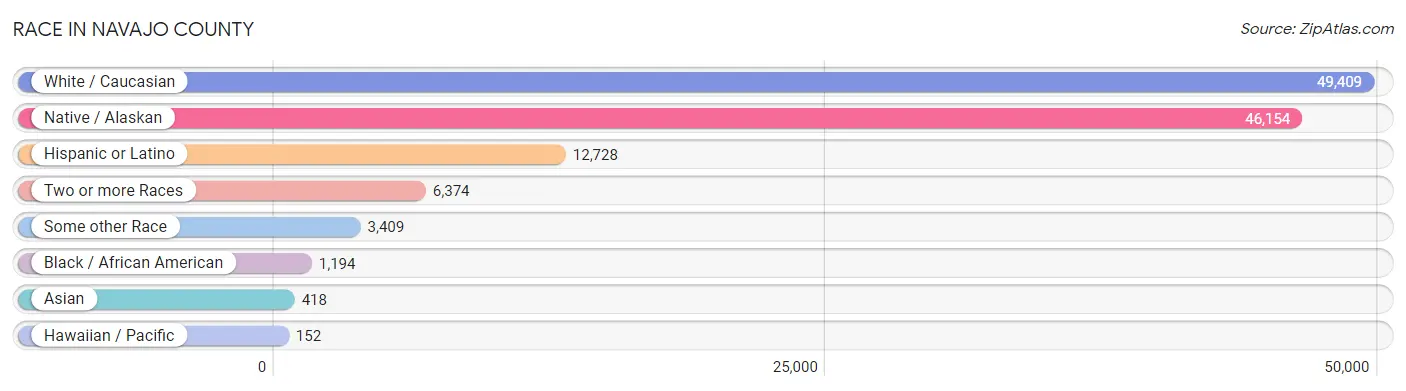
| Race | # Population | % Population |
| Asian | 418 | 0.4% |
| Black / African American | 1,194 | 1.1% |
| Hawaiian / Pacific | 152 | 0.1% |
| Hispanic or Latino | 12,728 | 11.9% |
| Native / Alaskan | 46,154 | 43.1% |
| White / Caucasian | 49,409 | 46.1% |
| Two or more Races | 6,374 | 5.9% |
| Some other Race | 3,409 | 3.2% |
| Total | 107,110 | 100.0% |
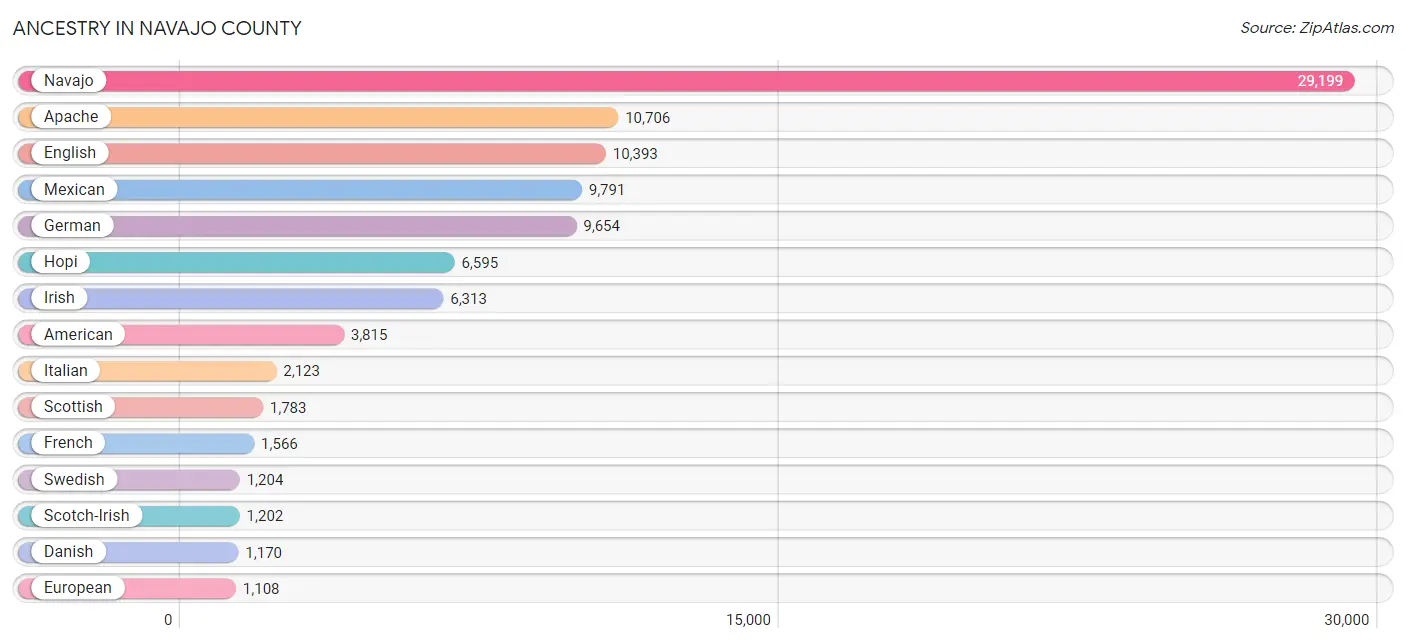
Ancestry in Navajo County
The most populous ancestries reported in Navajo County are Navajo (29,199 | 27.3%), Apache (10,706 | 10.0%), English (10,393 | 9.7%), Mexican (9,791 | 9.1%), and German (9,654 | 9.0%), together accounting for 65.1% of all Navajo County residents.
| Ancestry | # Population | % Population |
| African | 230 | 0.2% |
| American | 3,815 | 3.6% |
| Apache | 10,706 | 10.0% |
| Arab | 95 | 0.1% |
| Arapaho | 127 | 0.1% |
| Argentinean | 3 | 0.0% |
| Austrian | 67 | 0.1% |
| Basque | 32 | 0.0% |
| Belgian | 59 | 0.1% |
| Bhutanese | 238 | 0.2% |
| Blackfeet | 27 | 0.0% |
| British | 347 | 0.3% |
| Bulgarian | 154 | 0.1% |
| Burmese | 57 | 0.1% |
| Cajun | 12 | 0.0% |
| Canadian | 51 | 0.1% |
| Celtic | 23 | 0.0% |
| Central American | 195 | 0.2% |
| Central American Indian | 62 | 0.1% |
| Cherokee | 567 | 0.5% |
| Chilean | 3 | 0.0% |
| Chippewa | 21 | 0.0% |
| Choctaw | 133 | 0.1% |
| Colombian | 50 | 0.1% |
| Comanche | 94 | 0.1% |
| Costa Rican | 11 | 0.0% |
| Creek | 60 | 0.1% |
| Croatian | 66 | 0.1% |
| Crow | 330 | 0.3% |
| Cuban | 18 | 0.0% |
| Czech | 151 | 0.1% |
| Czechoslovakian | 31 | 0.0% |
| Danish | 1,170 | 1.1% |
| Dominican | 24 | 0.0% |
| Dutch | 791 | 0.7% |
| Dutch West Indian | 87 | 0.1% |
| Eastern European | 106 | 0.1% |
| Egyptian | 27 | 0.0% |
| English | 10,393 | 9.7% |
| European | 1,108 | 1.0% |
| Finnish | 88 | 0.1% |
| French | 1,566 | 1.5% |
| French Canadian | 115 | 0.1% |
| German | 9,654 | 9.0% |
| Greek | 255 | 0.2% |
| Guamanian / Chamorro | 11 | 0.0% |
| Guatemalan | 31 | 0.0% |
| Honduran | 24 | 0.0% |
| Hopi | 6,595 | 6.2% |
| Hungarian | 180 | 0.2% |
| Indian (Asian) | 216 | 0.2% |
| Inupiat | 34 | 0.0% |
| Iranian | 18 | 0.0% |
| Irish | 6,313 | 5.9% |
| Iroquois | 21 | 0.0% |
| Italian | 2,123 | 2.0% |
| Jordanian | 10 | 0.0% |
| Kiowa | 5 | 0.0% |
| Korean | 315 | 0.3% |
| Laotian | 147 | 0.1% |
| Latvian | 5 | 0.0% |
| Lebanese | 49 | 0.1% |
| Lithuanian | 41 | 0.0% |
| Mexican | 9,791 | 9.1% |
| Mexican American Indian | 17 | 0.0% |
| Native Hawaiian | 188 | 0.2% |
| Navajo | 29,199 | 27.3% |
| Northern European | 56 | 0.1% |
| Norwegian | 1,036 | 1.0% |
| Paraguayan | 11 | 0.0% |
| Pennsylvania German | 143 | 0.1% |
| Peruvian | 14 | 0.0% |
| Pima | 370 | 0.4% |
| Polish | 686 | 0.6% |
| Portuguese | 106 | 0.1% |
| Potawatomi | 16 | 0.0% |
| Pueblo | 201 | 0.2% |
| Puerto Rican | 306 | 0.3% |
| Puget Sound Salish | 1 | 0.0% |
| Romanian | 53 | 0.1% |
| Russian | 232 | 0.2% |
| Salvadoran | 31 | 0.0% |
| Samoan | 10 | 0.0% |
| Scandinavian | 289 | 0.3% |
| Scotch-Irish | 1,202 | 1.1% |
| Scottish | 1,783 | 1.7% |
| Sioux | 412 | 0.4% |
| Slovak | 53 | 0.1% |
| Slovene | 22 | 0.0% |
| South American | 90 | 0.1% |
| South American Indian | 11 | 0.0% |
| Spaniard | 716 | 0.7% |
| Spanish | 420 | 0.4% |
| Spanish American | 89 | 0.1% |
| Sri Lankan | 70 | 0.1% |
| Subsaharan African | 242 | 0.2% |
| Swedish | 1,204 | 1.1% |
| Swiss | 98 | 0.1% |
| Thai | 18 | 0.0% |
| Tohono O'Odham | 64 | 0.1% |
| Tongan | 87 | 0.1% |
| Tsimshian | 3 | 0.0% |
| Turkish | 9 | 0.0% |
| Ukrainian | 66 | 0.1% |
| Venezuelan | 9 | 0.0% |
| Welsh | 531 | 0.5% |
| West Indian | 9 | 0.0% |
| Yakama | 14 | 0.0% |
| Yaqui | 129 | 0.1% |
| Yugoslavian | 29 | 0.0% |
| Yuman | 12 | 0.0% | View All 111 Rows |
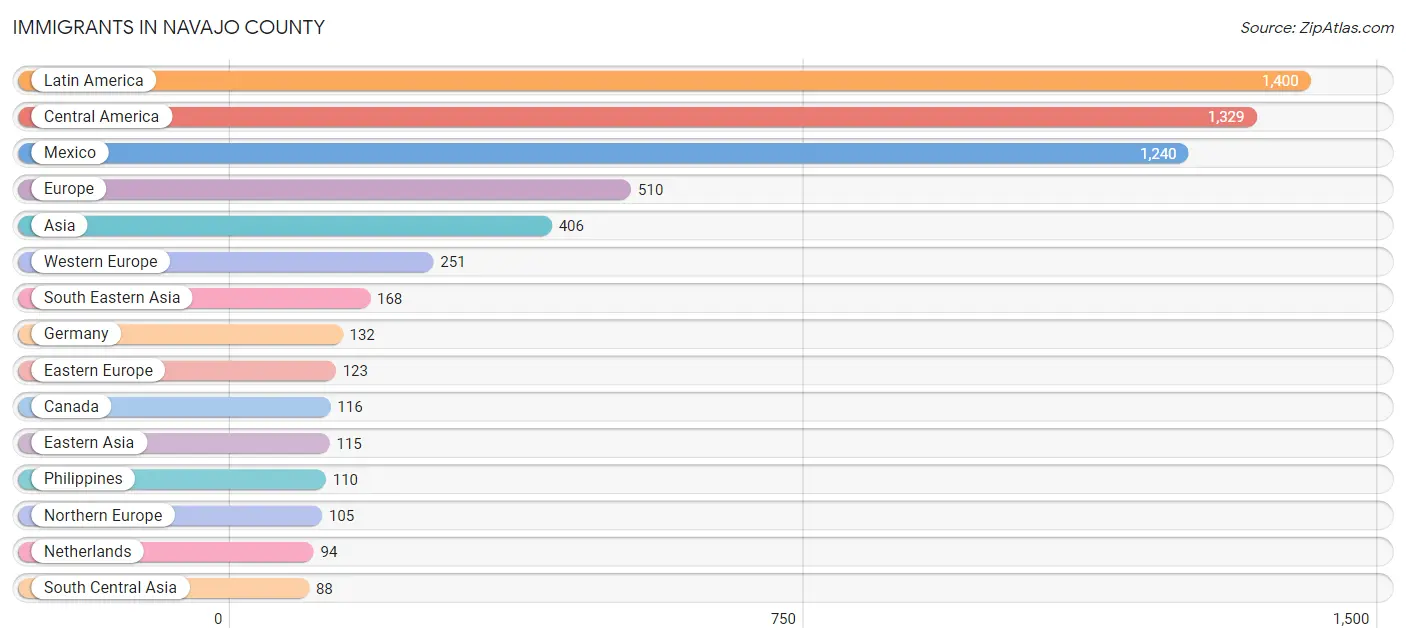
Immigrants in Navajo County
The most numerous immigrant groups reported in Navajo County came from Latin America (1,400 | 1.3%), Central America (1,329 | 1.2%), Mexico (1,240 | 1.2%), Europe (510 | 0.5%), and Asia (406 | 0.4%), together accounting for 4.6% of all Navajo County residents.
| Immigration Origin | # Population | % Population |
| Africa | 29 | 0.0% |
| Asia | 406 | 0.4% |
| Australia | 9 | 0.0% |
| Bahamas | 4 | 0.0% |
| Belarus | 6 | 0.0% |
| Belgium | 10 | 0.0% |
| Bulgaria | 61 | 0.1% |
| Canada | 116 | 0.1% |
| Caribbean | 14 | 0.0% |
| Central America | 1,329 | 1.2% |
| China | 75 | 0.1% |
| Colombia | 23 | 0.0% |
| Costa Rica | 22 | 0.0% |
| Cuba | 10 | 0.0% |
| Czechoslovakia | 9 | 0.0% |
| Eastern Africa | 12 | 0.0% |
| Eastern Asia | 115 | 0.1% |
| Eastern Europe | 123 | 0.1% |
| England | 84 | 0.1% |
| Europe | 510 | 0.5% |
| France | 15 | 0.0% |
| Germany | 132 | 0.1% |
| Guatemala | 67 | 0.1% |
| Indonesia | 22 | 0.0% |
| Iran | 18 | 0.0% |
| Italy | 31 | 0.0% |
| Jordan | 10 | 0.0% |
| Korea | 40 | 0.0% |
| Latin America | 1,400 | 1.3% |
| Lithuania | 9 | 0.0% |
| Mexico | 1,240 | 1.2% |
| Netherlands | 94 | 0.1% |
| Northern Europe | 105 | 0.1% |
| Norway | 21 | 0.0% |
| Oceania | 9 | 0.0% |
| Pakistan | 70 | 0.1% |
| Peru | 14 | 0.0% |
| Philippines | 110 | 0.1% |
| Romania | 1 | 0.0% |
| Russia | 20 | 0.0% |
| Saudi Arabia | 25 | 0.0% |
| Serbia | 5 | 0.0% |
| South America | 57 | 0.1% |
| South Central Asia | 88 | 0.1% |
| South Eastern Asia | 168 | 0.2% |
| Southern Europe | 31 | 0.0% |
| Ukraine | 12 | 0.0% |
| Venezuela | 9 | 0.0% |
| Vietnam | 36 | 0.0% |
| Western Asia | 35 | 0.0% |
| Western Europe | 251 | 0.2% | View All 51 Rows |
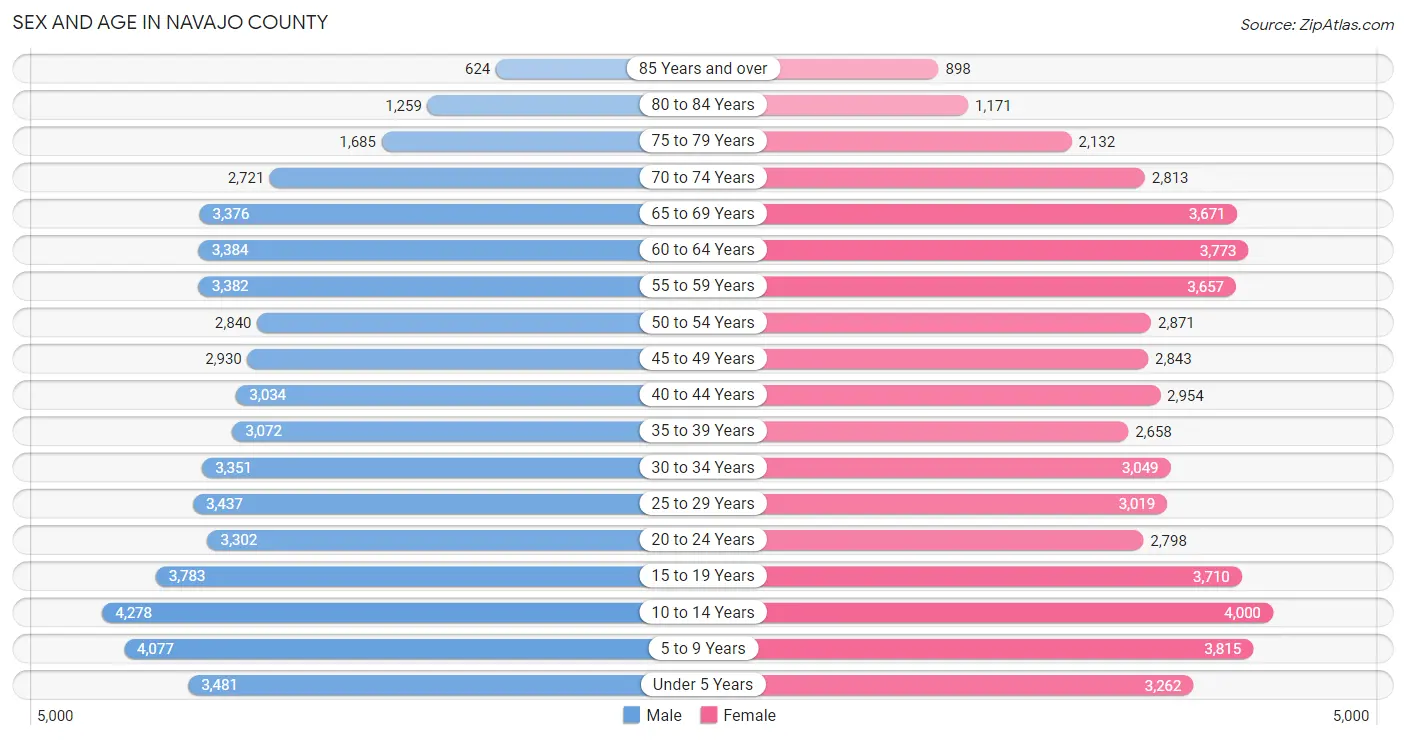
Sex and Age in Navajo County
Sex and Age in Navajo County
The most populous age groups in Navajo County are 10 to 14 Years (4,278 | 7.9%) for men and 10 to 14 Years (4,000 | 7.5%) for women.
| Age Bracket | Male | Female |
| Under 5 Years | 3,481 (6.4%) | 3,262 (6.1%) |
| 5 to 9 Years | 4,077 (7.5%) | 3,815 (7.2%) |
| 10 to 14 Years | 4,278 (7.9%) | 4,000 (7.5%) |
| 15 to 19 Years | 3,783 (7.0%) | 3,710 (7.0%) |
| 20 to 24 Years | 3,302 (6.1%) | 2,798 (5.3%) |
| 25 to 29 Years | 3,437 (6.4%) | 3,019 (5.7%) |
| 30 to 34 Years | 3,351 (6.2%) | 3,049 (5.7%) |
| 35 to 39 Years | 3,072 (5.7%) | 2,658 (5.0%) |
| 40 to 44 Years | 3,034 (5.6%) | 2,954 (5.6%) |
| 45 to 49 Years | 2,930 (5.4%) | 2,843 (5.3%) |
| 50 to 54 Years | 2,840 (5.3%) | 2,871 (5.4%) |
| 55 to 59 Years | 3,382 (6.3%) | 3,657 (6.9%) |
| 60 to 64 Years | 3,384 (6.3%) | 3,773 (7.1%) |
| 65 to 69 Years | 3,376 (6.2%) | 3,671 (6.9%) |
| 70 to 74 Years | 2,721 (5.0%) | 2,813 (5.3%) |
| 75 to 79 Years | 1,685 (3.1%) | 2,132 (4.0%) |
| 80 to 84 Years | 1,259 (2.3%) | 1,171 (2.2%) |
| 85 Years and over | 624 (1.2%) | 898 (1.7%) |
| Total | 54,016 (100.0%) | 53,094 (100.0%) |
Families and Households in Navajo County
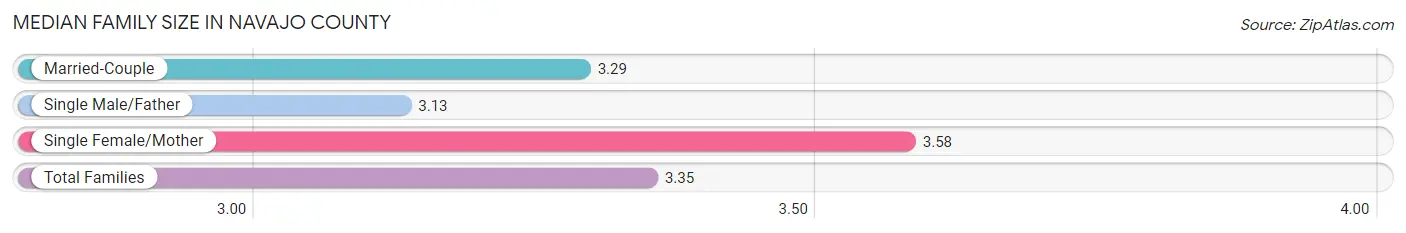
Median Family Size in Navajo County
The median family size in Navajo County is 3.35 persons per family, with single female/mother families (6,289 | 23.7%) accounting for the largest median family size of 3.58 persons per family. On the other hand, single male/father families (2,592 | 9.8%) represent the smallest median family size with 3.13 persons per family.
| Family Type | # Families | Family Size |
| Married-Couple | 17,605 (66.5%) | 3.29 |
| Single Male/Father | 2,592 (9.8%) | 3.13 |
| Single Female/Mother | 6,289 (23.7%) | 3.58 |
| Total Families | 26,486 (100.0%) | 3.35 |
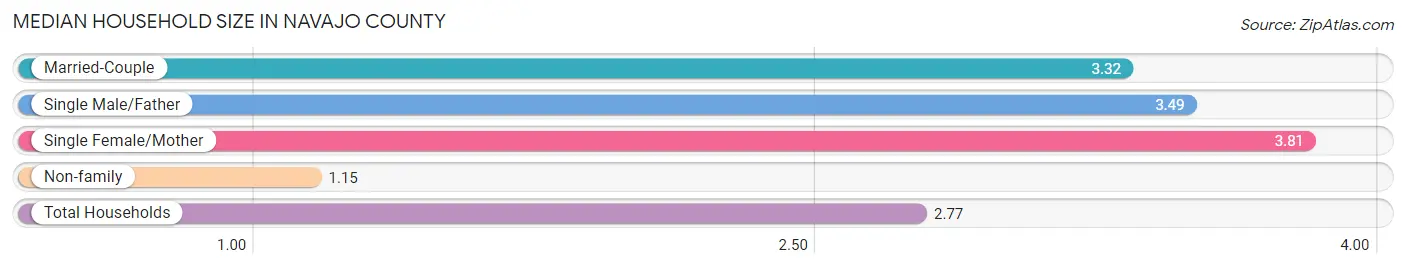
Median Household Size in Navajo County
The median household size in Navajo County is 2.77 persons per household, with single female/mother households (6,289 | 16.7%) accounting for the largest median household size of 3.81 persons per household. non-family households (11,079 | 29.5%) represent the smallest median household size with 1.15 persons per household.
| Household Type | # Households | Household Size |
| Married-Couple | 17,605 (46.9%) | 3.32 |
| Single Male/Father | 2,592 (6.9%) | 3.49 |
| Single Female/Mother | 6,289 (16.7%) | 3.81 |
| Non-family | 11,079 (29.5%) | 1.15 |
| Total Households | 37,565 (100.0%) | 2.77 |
Household Size by Marriage Status in Navajo County
Out of a total of 37,565 households in Navajo County, 26,486 (70.5%) are family households, while 11,079 (29.5%) are nonfamily households. The most numerous type of family households are 2-person households, comprising 11,272, and the most common type of nonfamily households are 1-person households, comprising 9,652.
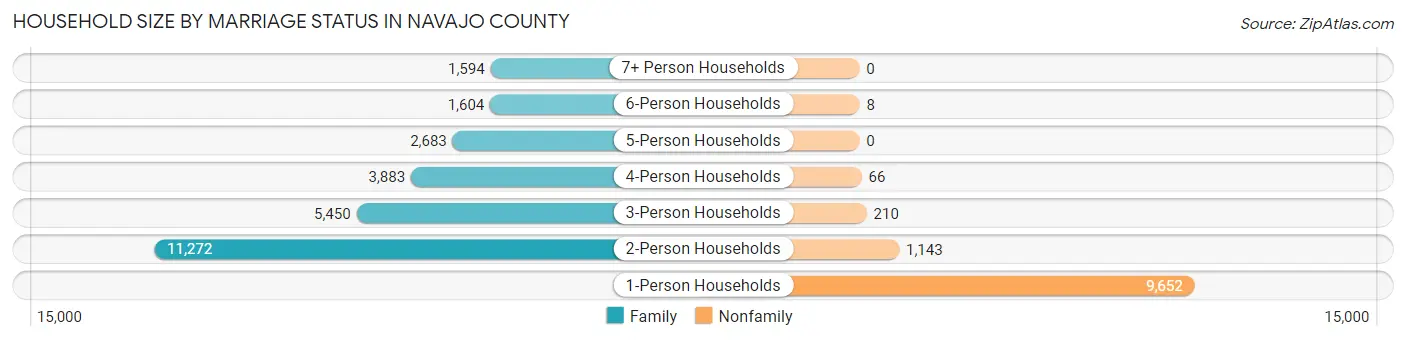
| Household Size | Family Households | Nonfamily Households |
| 1-Person Households | - | 9,652 (25.7%) |
| 2-Person Households | 11,272 (30.0%) | 1,143 (3.0%) |
| 3-Person Households | 5,450 (14.5%) | 210 (0.6%) |
| 4-Person Households | 3,883 (10.3%) | 66 (0.2%) |
| 5-Person Households | 2,683 (7.1%) | 0 (0.0%) |
| 6-Person Households | 1,604 (4.3%) | 8 (0.0%) |
| 7+ Person Households | 1,594 (4.2%) | 0 (0.0%) |
| Total | 26,486 (70.5%) | 11,079 (29.5%) |
Female Fertility in Navajo County
Fertility by Age in Navajo County
Average fertility rate in Navajo County is 53.0 births per 1,000 women. Women in the age bracket of 20 to 34 years have the highest fertility rate with 100.0 births per 1,000 women. Women in the age bracket of 20 to 34 years acount for 76.9% of all women with births.
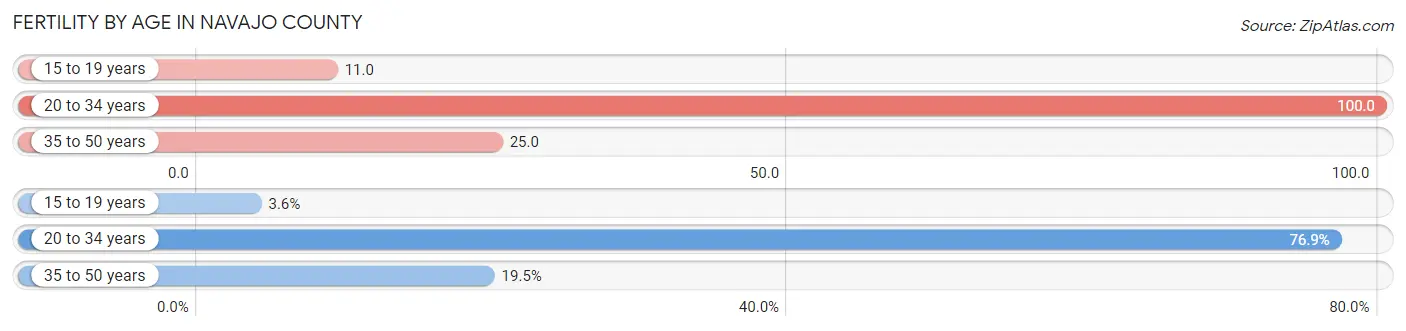
| Age Bracket | Women with Births | Births / 1,000 Women |
| 15 to 19 years | 42 (3.6%) | 11.0 |
| 20 to 34 years | 890 (76.9%) | 100.0 |
| 35 to 50 years | 225 (19.5%) | 25.0 |
| Total | 1,157 (100.0%) | 53.0 |
Fertility by Age by Marriage Status in Navajo County
49.4% of women with births (1,157) in Navajo County are married. The highest percentage of unmarried women with births falls into 15 to 19 years age bracket with 85.7% of them unmarried at the time of birth, while the lowest percentage of unmarried women with births belong to 35 to 50 years age bracket with 21.3% of them unmarried.
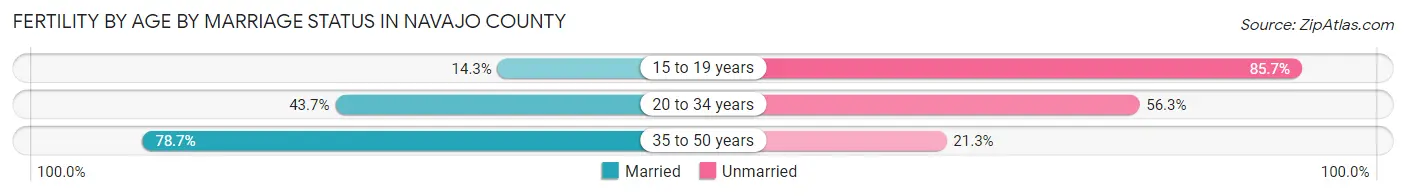
| Age Bracket | Married | Unmarried |
| 15 to 19 years | 6 (14.3%) | 36 (85.7%) |
| 20 to 34 years | 389 (43.7%) | 501 (56.3%) |
| 35 to 50 years | 177 (78.7%) | 48 (21.3%) |
| Total | 572 (49.4%) | 585 (50.6%) |
Fertility by Education in Navajo County
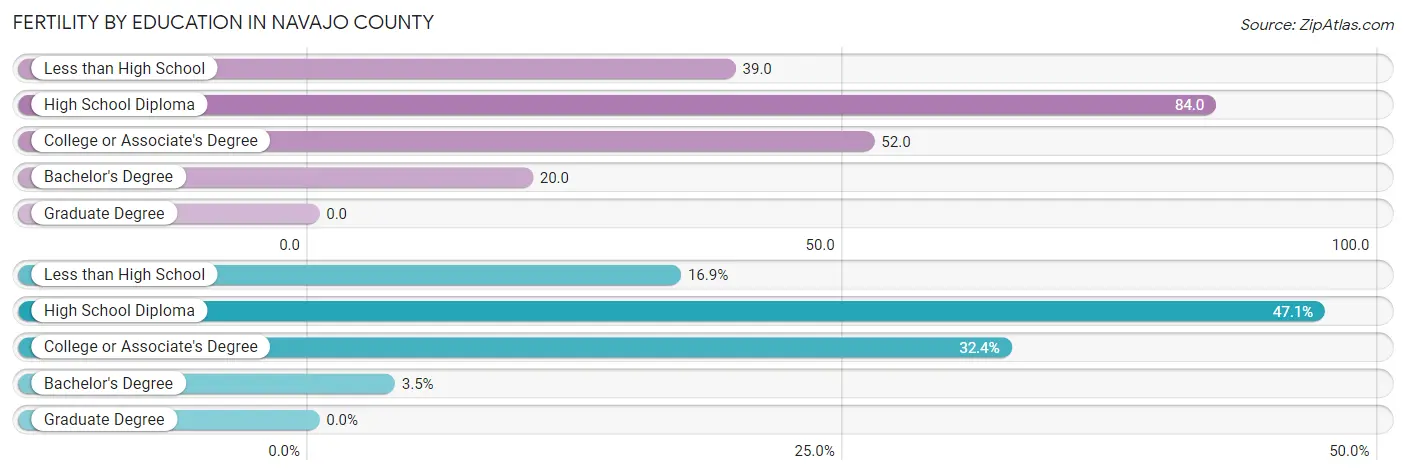
| Educational Attainment | Women with Births | Births / 1,000 Women |
| Less than High School | 196 (16.9%) | 39.0 |
| High School Diploma | 545 (47.1%) | 84.0 |
| College or Associate's Degree | 375 (32.4%) | 52.0 |
| Bachelor's Degree | 41 (3.5%) | 20.0 |
| Graduate Degree | 0 (0.0%) | 0.0 |
| Total | 1,157 (100.0%) | 53.0 |
Fertility by Education by Marriage Status in Navajo County
50.6% of women with births in Navajo County are unmarried. Women with the educational attainment of bachelor's degree are most likely to be married with 100.0% of them married at childbirth, while women with the educational attainment of less than high school are least likely to be married with 62.8% of them unmarried at childbirth.
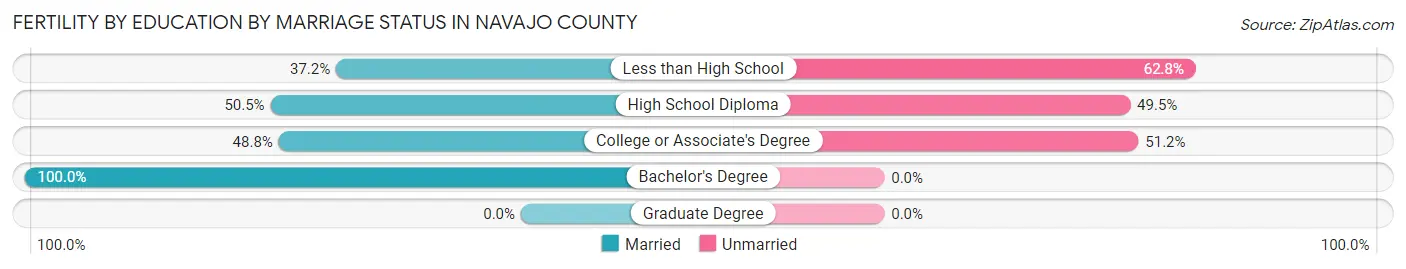
| Educational Attainment | Married | Unmarried |
| Less than High School | 73 (37.2%) | 123 (62.8%) |
| High School Diploma | 275 (50.5%) | 270 (49.5%) |
| College or Associate's Degree | 183 (48.8%) | 192 (51.2%) |
| Bachelor's Degree | 41 (100.0%) | 0 (0.0%) |
| Graduate Degree | 0 (0.0%) | 0 (0.0%) |
| Total | 572 (49.4%) | 585 (50.6%) |
Employment Characteristics in Navajo County
Employment by Class of Employer in Navajo County
Among the 33,309 employed individuals in Navajo County, private company employees (16,770 | 50.3%), local government employees (5,523 | 16.6%), and state government employees (2,709 | 8.1%) make up the most common classes of employment.
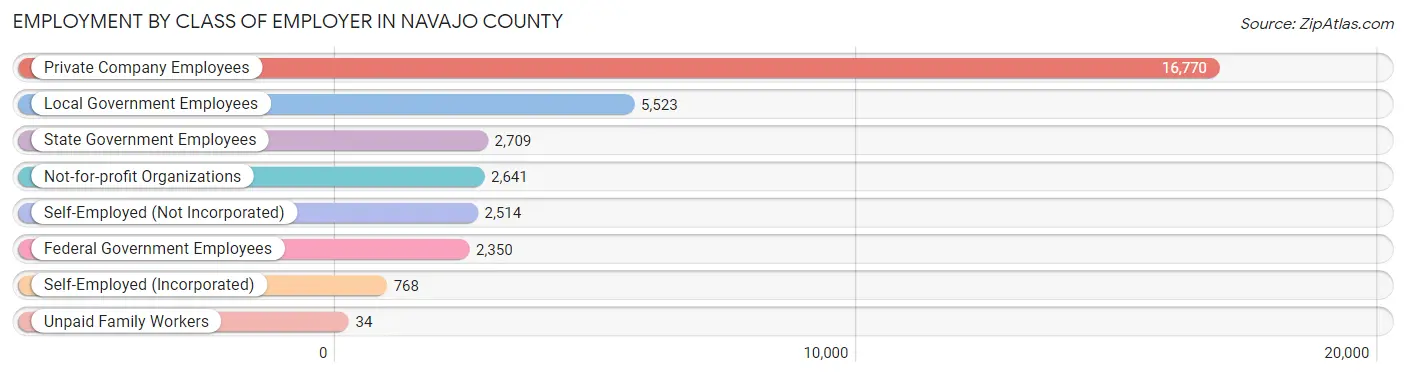
| Employer Class | # Employees | % Employees |
| Private Company Employees | 16,770 | 50.3% |
| Self-Employed (Incorporated) | 768 | 2.3% |
| Self-Employed (Not Incorporated) | 2,514 | 7.5% |
| Not-for-profit Organizations | 2,641 | 7.9% |
| Local Government Employees | 5,523 | 16.6% |
| State Government Employees | 2,709 | 8.1% |
| Federal Government Employees | 2,350 | 7.1% |
| Unpaid Family Workers | 34 | 0.1% |
| Total | 33,309 | 100.0% |
Employment Status by Age in Navajo County
According to the labor force statistics for Navajo County, out of the total population over 16 years of age (82,333), 45.7% or 37,626 individuals are in the labor force, with 9.7% or 3,650 of them unemployed. The age group with the highest labor force participation rate is 35 to 44 years, with 65.8% or 7,710 individuals in the labor force. Within the labor force, the 16 to 19 years age range has the highest percentage of unemployed individuals, with 22.1% or 289 of them being unemployed.
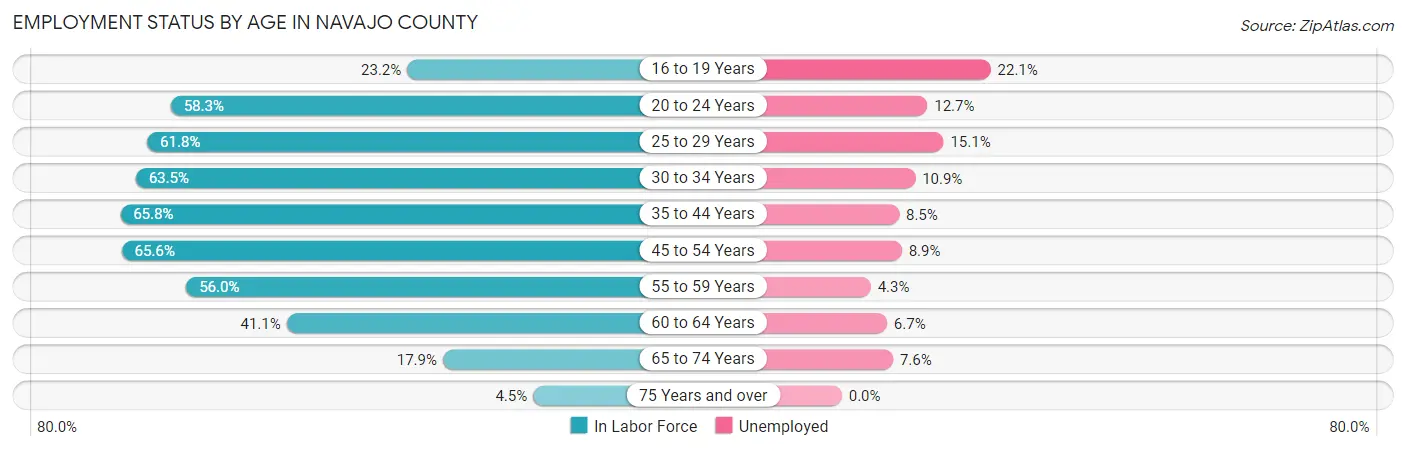
| Age Bracket | In Labor Force | Unemployed |
| 16 to 19 Years | 1,306 (23.2%) | 289 (22.1%) |
| 20 to 24 Years | 3,556 (58.3%) | 452 (12.7%) |
| 25 to 29 Years | 3,990 (61.8%) | 602 (15.1%) |
| 30 to 34 Years | 4,064 (63.5%) | 443 (10.9%) |
| 35 to 44 Years | 7,710 (65.8%) | 655 (8.5%) |
| 45 to 54 Years | 7,534 (65.6%) | 671 (8.9%) |
| 55 to 59 Years | 3,942 (56.0%) | 170 (4.3%) |
| 60 to 64 Years | 2,942 (41.1%) | 197 (6.7%) |
| 65 to 74 Years | 2,252 (17.9%) | 171 (7.6%) |
| 75 Years and over | 350 (4.5%) | 0 (0.0%) |
| Total | 37,626 (45.7%) | 3,650 (9.7%) |
Employment Status by Educational Attainment in Navajo County
According to labor force statistics for Navajo County, 60.1% of individuals (30,203) out of the total population between 25 and 64 years of age (50,254) are in the labor force, with 9.1% or 2,748 of them being unemployed. The group with the highest labor force participation rate are those with the educational attainment of bachelor's degree or higher, with 76.9% or 6,230 individuals in the labor force. Within the labor force, individuals with less than high school education have the highest percentage of unemployment, with 18.1% or 463 of them being unemployed.
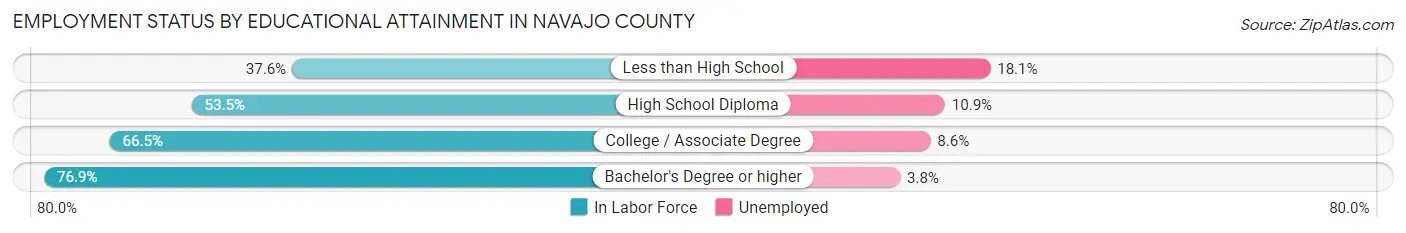
| Educational Attainment | In Labor Force | Unemployed |
| Less than High School | 2,560 (37.6%) | 1,232 (18.1%) |
| High School Diploma | 8,700 (53.5%) | 1,773 (10.9%) |
| College / Associate Degree | 12,690 (66.5%) | 1,641 (8.6%) |
| Bachelor's Degree or higher | 6,230 (76.9%) | 308 (3.8%) |
| Total | 30,203 (60.1%) | 4,573 (9.1%) |
Employment Occupations by Sex in Navajo County
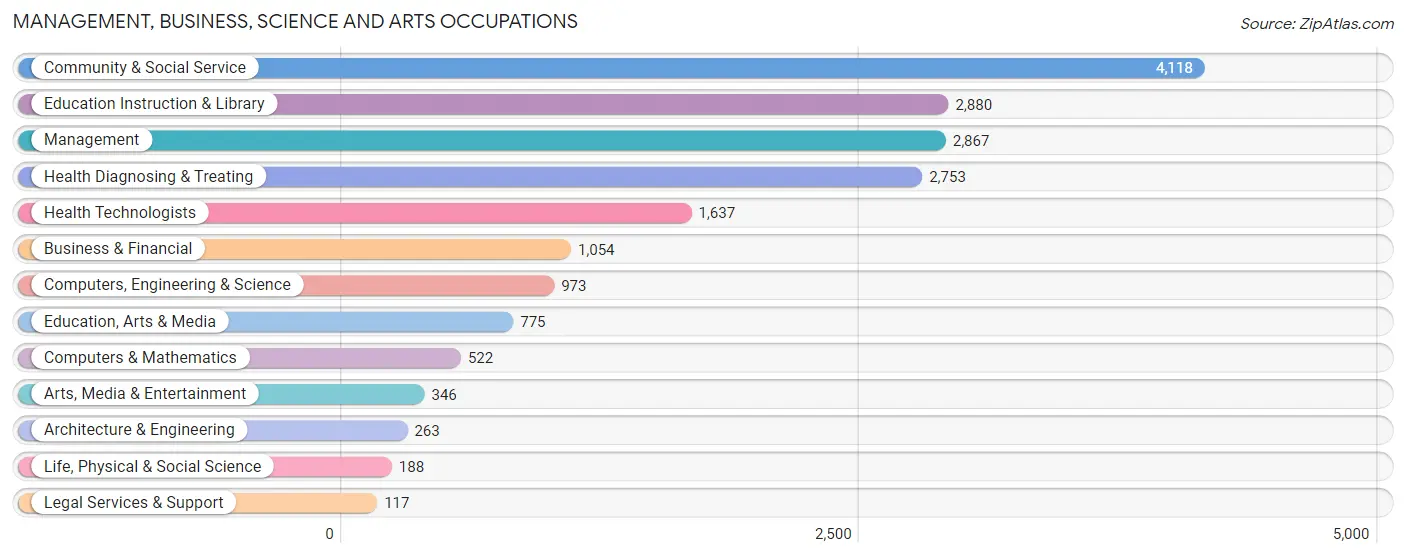
Management, Business, Science and Arts Occupations
The most common Management, Business, Science and Arts occupations in Navajo County are Community & Social Service (4,118 | 12.1%), Education Instruction & Library (2,880 | 8.5%), Management (2,867 | 8.4%), Health Diagnosing & Treating (2,753 | 8.1%), and Health Technologists (1,637 | 4.8%).
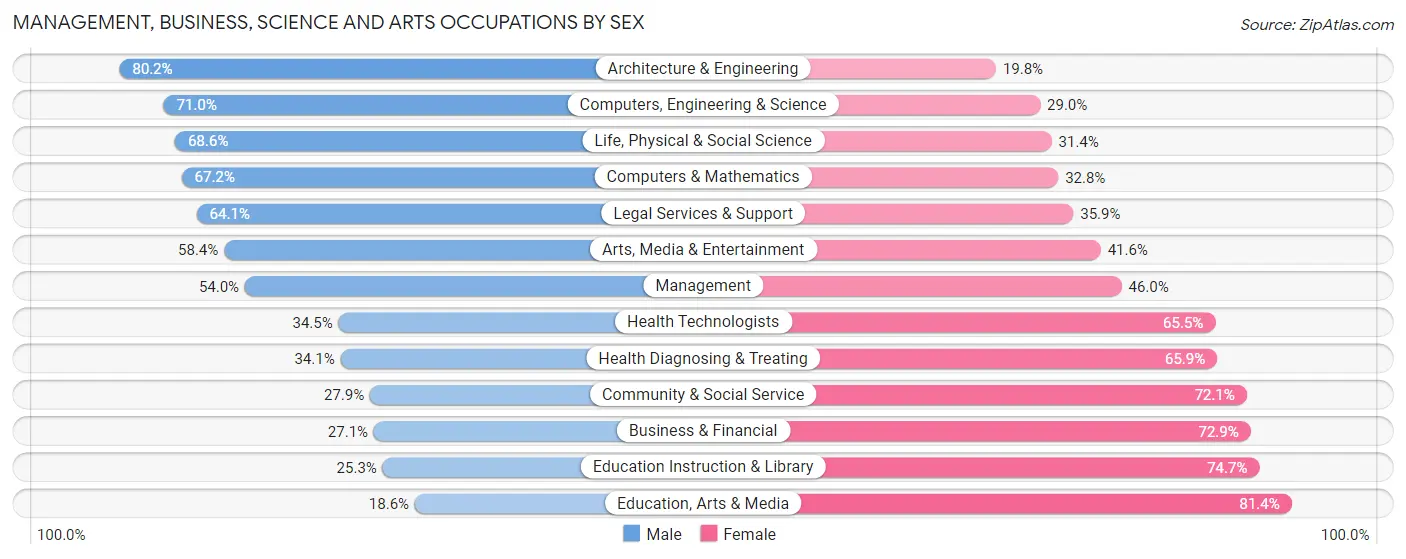
Management, Business, Science and Arts Occupations by Sex
Within the Management, Business, Science and Arts occupations in Navajo County, the most male-oriented occupations are Architecture & Engineering (80.2%), Computers, Engineering & Science (71.0%), and Life, Physical & Social Science (68.6%), while the most female-oriented occupations are Education, Arts & Media (81.4%), Education Instruction & Library (74.7%), and Business & Financial (72.9%).
| Occupation | Male | Female |
| Management | 1,549 (54.0%) | 1,318 (46.0%) |
| Business & Financial | 286 (27.1%) | 768 (72.9%) |
| Computers, Engineering & Science | 691 (71.0%) | 282 (29.0%) |
| Computers & Mathematics | 351 (67.2%) | 171 (32.8%) |
| Architecture & Engineering | 211 (80.2%) | 52 (19.8%) |
| Life, Physical & Social Science | 129 (68.6%) | 59 (31.4%) |
| Community & Social Service | 1,150 (27.9%) | 2,968 (72.1%) |
| Education, Arts & Media | 144 (18.6%) | 631 (81.4%) |
| Legal Services & Support | 75 (64.1%) | 42 (35.9%) |
| Education Instruction & Library | 729 (25.3%) | 2,151 (74.7%) |
| Arts, Media & Entertainment | 202 (58.4%) | 144 (41.6%) |
| Health Diagnosing & Treating | 939 (34.1%) | 1,814 (65.9%) |
| Health Technologists | 565 (34.5%) | 1,072 (65.5%) |
| Total (Category) | 4,615 (39.2%) | 7,150 (60.8%) |
| Total (Overall) | 17,275 (50.9%) | 16,694 (49.1%) |
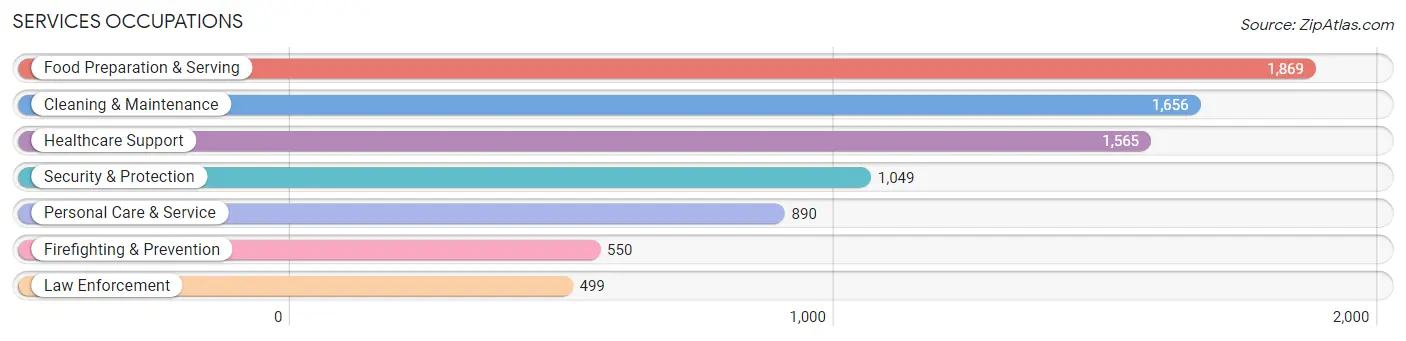
Services Occupations
The most common Services occupations in Navajo County are Food Preparation & Serving (1,869 | 5.5%), Cleaning & Maintenance (1,656 | 4.9%), Healthcare Support (1,565 | 4.6%), Security & Protection (1,049 | 3.1%), and Personal Care & Service (890 | 2.6%).
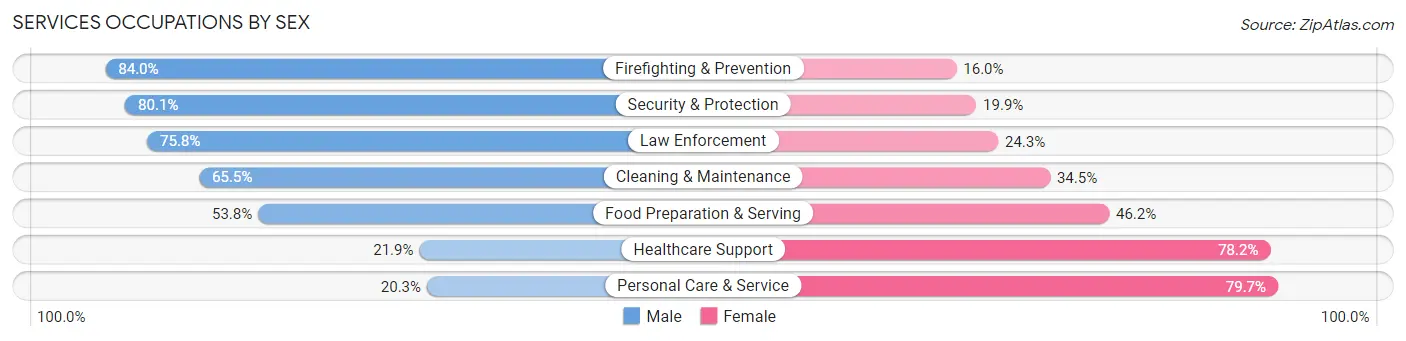
Services Occupations by Sex
Within the Services occupations in Navajo County, the most male-oriented occupations are Firefighting & Prevention (84.0%), Security & Protection (80.1%), and Law Enforcement (75.7%), while the most female-oriented occupations are Personal Care & Service (79.7%), Healthcare Support (78.1%), and Food Preparation & Serving (46.2%).
| Occupation | Male | Female |
| Healthcare Support | 342 (21.8%) | 1,223 (78.1%) |
| Security & Protection | 840 (80.1%) | 209 (19.9%) |
| Firefighting & Prevention | 462 (84.0%) | 88 (16.0%) |
| Law Enforcement | 378 (75.7%) | 121 (24.2%) |
| Food Preparation & Serving | 1,005 (53.8%) | 864 (46.2%) |
| Cleaning & Maintenance | 1,084 (65.5%) | 572 (34.5%) |
| Personal Care & Service | 181 (20.3%) | 709 (79.7%) |
| Total (Category) | 3,452 (49.1%) | 3,577 (50.9%) |
| Total (Overall) | 17,275 (50.9%) | 16,694 (49.1%) |
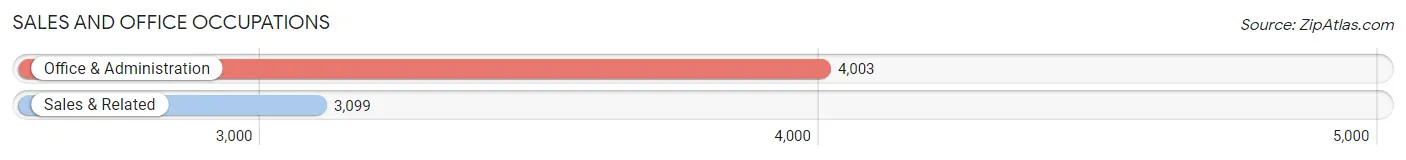
Sales and Office Occupations
The most common Sales and Office occupations in Navajo County are Office & Administration (4,003 | 11.8%), and Sales & Related (3,099 | 9.1%).
Sales and Office Occupations by Sex
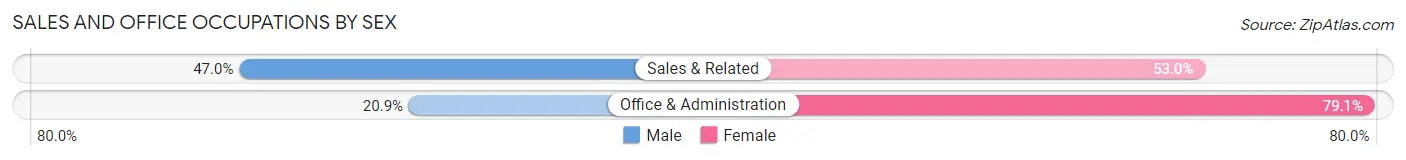
| Occupation | Male | Female |
| Sales & Related | 1,456 (47.0%) | 1,643 (53.0%) |
| Office & Administration | 836 (20.9%) | 3,167 (79.1%) |
| Total (Category) | 2,292 (32.3%) | 4,810 (67.7%) |
| Total (Overall) | 17,275 (50.9%) | 16,694 (49.1%) |
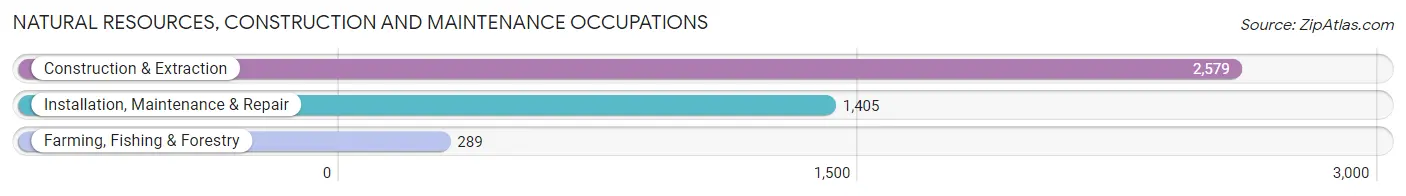
Natural Resources, Construction and Maintenance Occupations
The most common Natural Resources, Construction and Maintenance occupations in Navajo County are Construction & Extraction (2,579 | 7.6%), Installation, Maintenance & Repair (1,405 | 4.1%), and Farming, Fishing & Forestry (289 | 0.9%).
Natural Resources, Construction and Maintenance Occupations by Sex
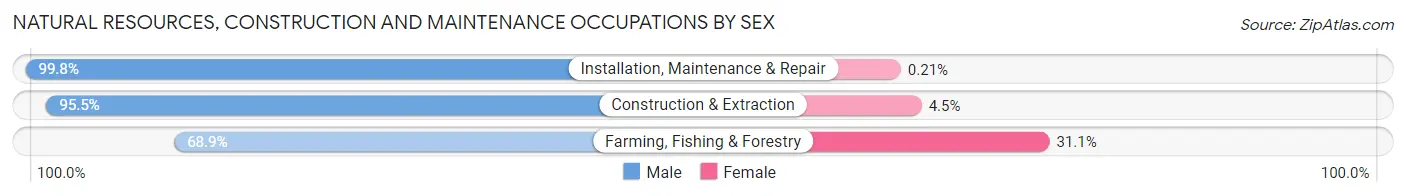
| Occupation | Male | Female |
| Farming, Fishing & Forestry | 199 (68.9%) | 90 (31.1%) |
| Construction & Extraction | 2,462 (95.5%) | 117 (4.5%) |
| Installation, Maintenance & Repair | 1,402 (99.8%) | 3 (0.2%) |
| Total (Category) | 4,063 (95.1%) | 210 (4.9%) |
| Total (Overall) | 17,275 (50.9%) | 16,694 (49.1%) |
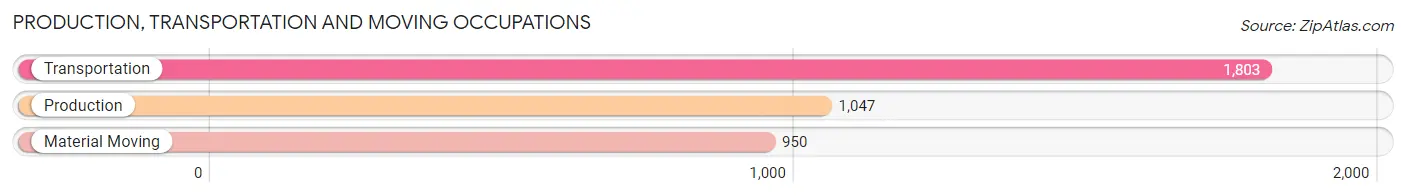
Production, Transportation and Moving Occupations
The most common Production, Transportation and Moving occupations in Navajo County are Transportation (1,803 | 5.3%), Production (1,047 | 3.1%), and Material Moving (950 | 2.8%).
Production, Transportation and Moving Occupations by Sex
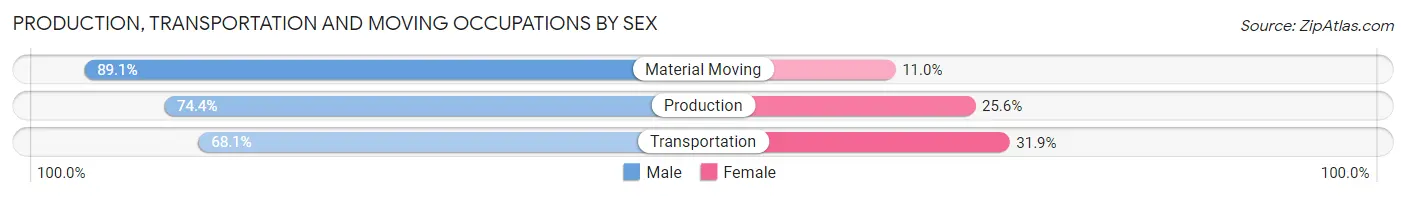
| Occupation | Male | Female |
| Production | 779 (74.4%) | 268 (25.6%) |
| Transportation | 1,228 (68.1%) | 575 (31.9%) |
| Material Moving | 846 (89.0%) | 104 (11.0%) |
| Total (Category) | 2,853 (75.1%) | 947 (24.9%) |
| Total (Overall) | 17,275 (50.9%) | 16,694 (49.1%) |
Employment Industries by Sex in Navajo County
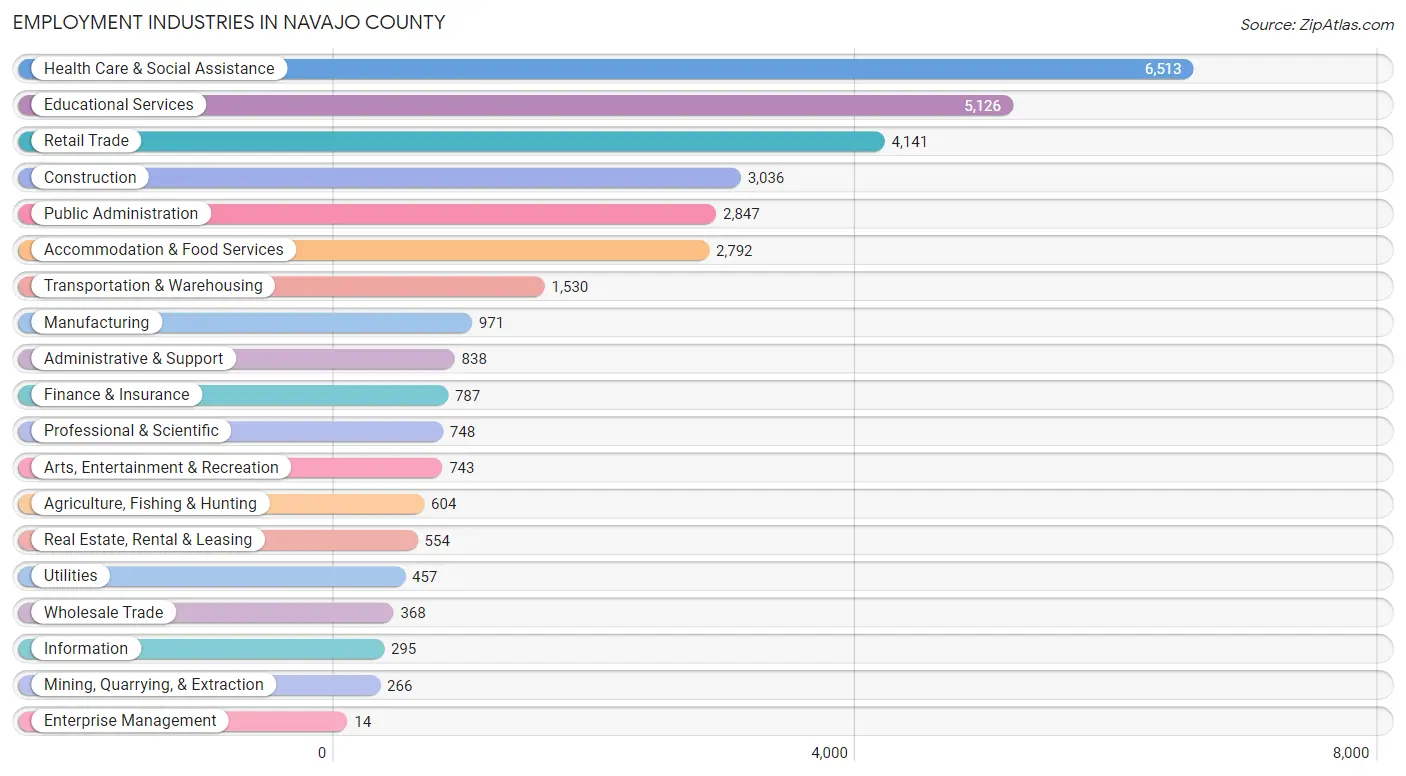
Employment Industries in Navajo County
The major employment industries in Navajo County include Health Care & Social Assistance (6,513 | 19.2%), Educational Services (5,126 | 15.1%), Retail Trade (4,141 | 12.2%), Construction (3,036 | 8.9%), and Public Administration (2,847 | 8.4%).
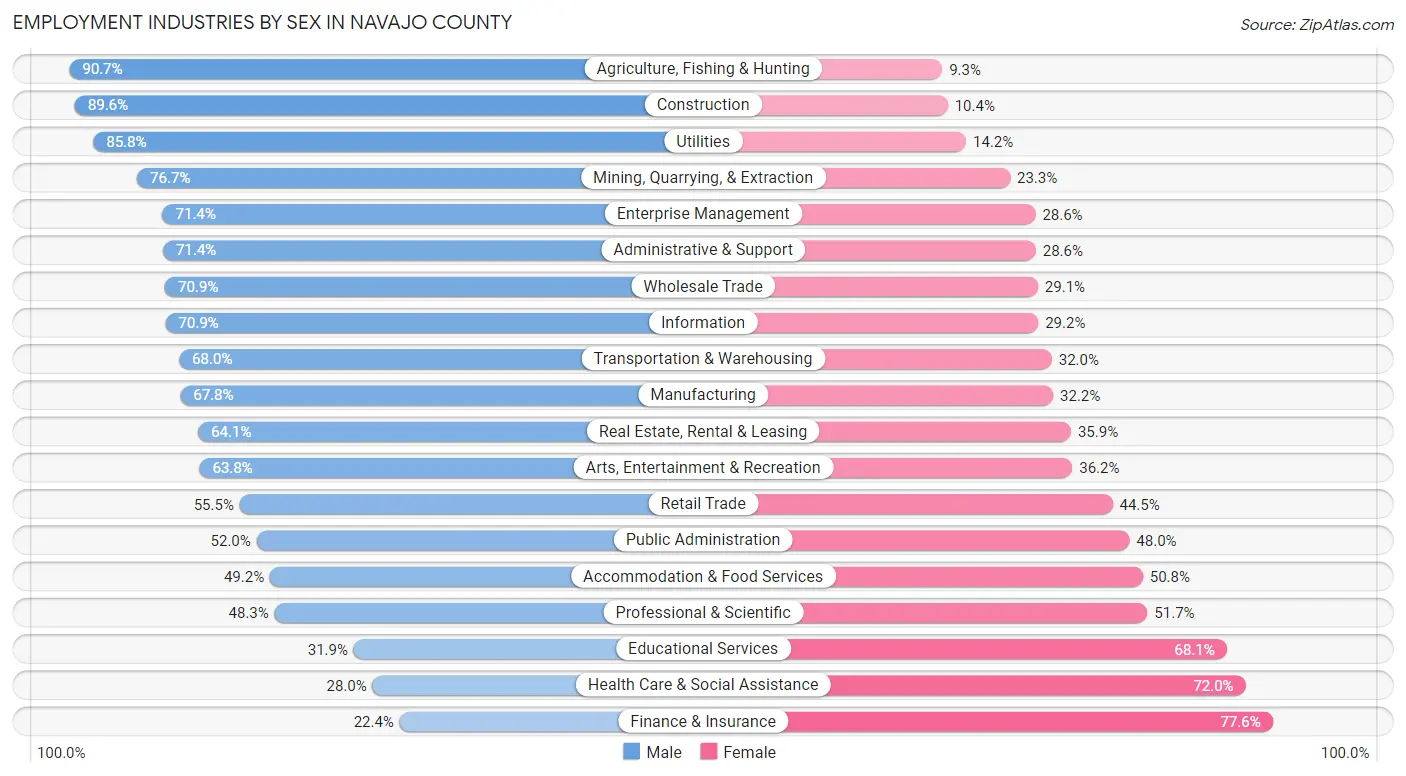
Employment Industries by Sex in Navajo County
The Navajo County industries that see more men than women are Agriculture, Fishing & Hunting (90.7%), Construction (89.6%), and Utilities (85.8%), whereas the industries that tend to have a higher number of women are Finance & Insurance (77.6%), Health Care & Social Assistance (72.0%), and Educational Services (68.1%).
| Industry | Male | Female |
| Agriculture, Fishing & Hunting | 548 (90.7%) | 56 (9.3%) |
| Mining, Quarrying, & Extraction | 204 (76.7%) | 62 (23.3%) |
| Construction | 2,720 (89.6%) | 316 (10.4%) |
| Manufacturing | 658 (67.8%) | 313 (32.2%) |
| Wholesale Trade | 261 (70.9%) | 107 (29.1%) |
| Retail Trade | 2,297 (55.5%) | 1,844 (44.5%) |
| Transportation & Warehousing | 1,041 (68.0%) | 489 (32.0%) |
| Utilities | 392 (85.8%) | 65 (14.2%) |
| Information | 209 (70.9%) | 86 (29.1%) |
| Finance & Insurance | 176 (22.4%) | 611 (77.6%) |
| Real Estate, Rental & Leasing | 355 (64.1%) | 199 (35.9%) |
| Professional & Scientific | 361 (48.3%) | 387 (51.7%) |
| Enterprise Management | 10 (71.4%) | 4 (28.6%) |
| Administrative & Support | 598 (71.4%) | 240 (28.6%) |
| Educational Services | 1,633 (31.9%) | 3,493 (68.1%) |
| Health Care & Social Assistance | 1,822 (28.0%) | 4,691 (72.0%) |
| Arts, Entertainment & Recreation | 474 (63.8%) | 269 (36.2%) |
| Accommodation & Food Services | 1,374 (49.2%) | 1,418 (50.8%) |
| Public Administration | 1,480 (52.0%) | 1,367 (48.0%) |
| Total | 17,275 (50.9%) | 16,694 (49.1%) |
Education in Navajo County
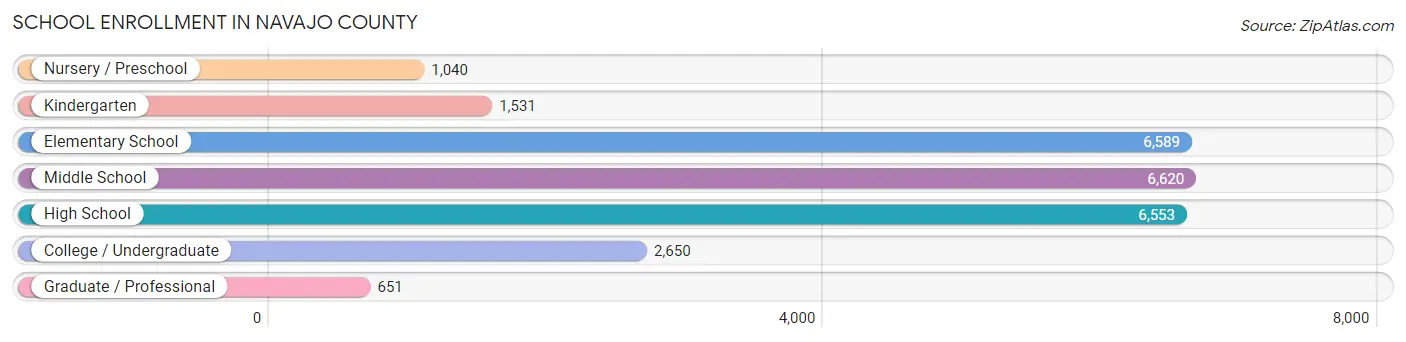
School Enrollment in Navajo County
The most common levels of schooling among the 25,634 students in Navajo County are middle school (6,620 | 25.8%), elementary school (6,589 | 25.7%), and high school (6,553 | 25.6%).
| School Level | # Students | % Students |
| Nursery / Preschool | 1,040 | 4.1% |
| Kindergarten | 1,531 | 6.0% |
| Elementary School | 6,589 | 25.7% |
| Middle School | 6,620 | 25.8% |
| High School | 6,553 | 25.6% |
| College / Undergraduate | 2,650 | 10.3% |
| Graduate / Professional | 651 | 2.5% |
| Total | 25,634 | 100.0% |
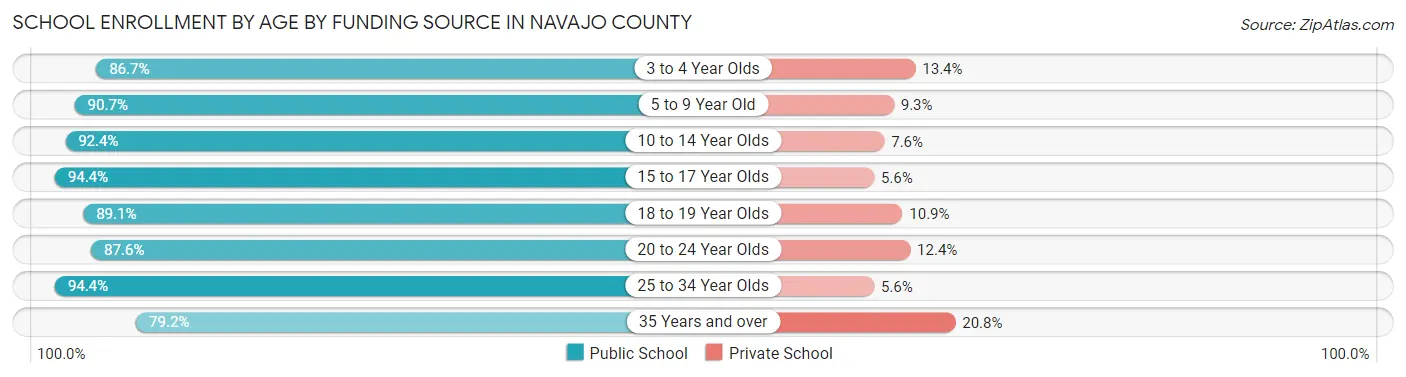
School Enrollment by Age by Funding Source in Navajo County
Out of a total of 25,634 students who are enrolled in schools in Navajo County, 2,281 (8.9%) attend a private institution, while the remaining 23,353 (91.1%) are enrolled in public schools. The age group of 35 years and over has the highest likelihood of being enrolled in private schools, with 268 (20.8% in the age bracket) enrolled. Conversely, the age group of 15 to 17 year olds has the lowest likelihood of being enrolled in a private school, with 4,297 (94.4% in the age bracket) attending a public institution.
| Age Bracket | Public School | Private School |
| 3 to 4 Year Olds | 714 (86.7%) | 110 (13.4%) |
| 5 to 9 Year Old | 6,733 (90.7%) | 693 (9.3%) |
| 10 to 14 Year Olds | 7,470 (92.4%) | 612 (7.6%) |
| 15 to 17 Year Olds | 4,297 (94.4%) | 257 (5.6%) |
| 18 to 19 Year Olds | 1,345 (89.1%) | 165 (10.9%) |
| 20 to 24 Year Olds | 807 (87.6%) | 114 (12.4%) |
| 25 to 34 Year Olds | 970 (94.4%) | 58 (5.6%) |
| 35 Years and over | 1,021 (79.2%) | 268 (20.8%) |
| Total | 23,353 (91.1%) | 2,281 (8.9%) |
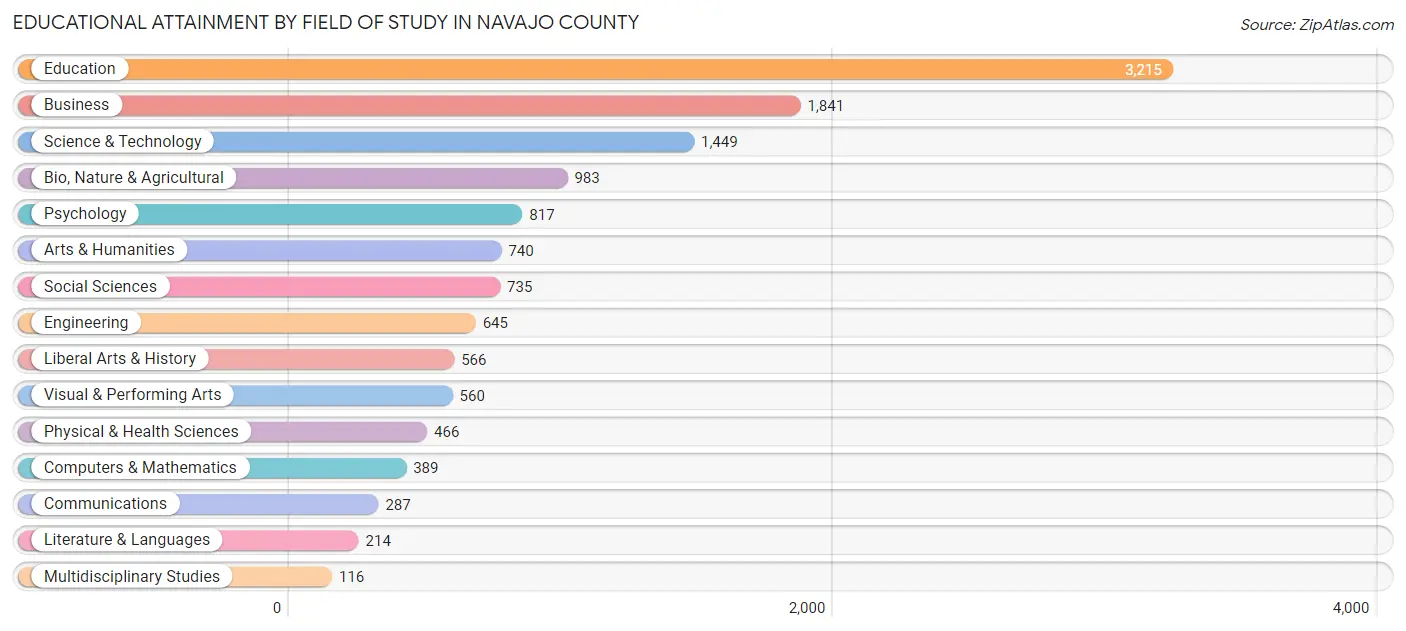
Educational Attainment by Field of Study in Navajo County
Education (3,215 | 24.7%), business (1,841 | 14.1%), science & technology (1,449 | 11.1%), bio, nature & agricultural (983 | 7.5%), and psychology (817 | 6.3%) are the most common fields of study among 13,023 individuals in Navajo County who have obtained a bachelor's degree or higher.
| Field of Study | # Graduates | % Graduates |
| Computers & Mathematics | 389 | 3.0% |
| Bio, Nature & Agricultural | 983 | 7.5% |
| Physical & Health Sciences | 466 | 3.6% |
| Psychology | 817 | 6.3% |
| Social Sciences | 735 | 5.6% |
| Engineering | 645 | 5.0% |
| Multidisciplinary Studies | 116 | 0.9% |
| Science & Technology | 1,449 | 11.1% |
| Business | 1,841 | 14.1% |
| Education | 3,215 | 24.7% |
| Literature & Languages | 214 | 1.6% |
| Liberal Arts & History | 566 | 4.3% |
| Visual & Performing Arts | 560 | 4.3% |
| Communications | 287 | 2.2% |
| Arts & Humanities | 740 | 5.7% |
| Total | 13,023 | 100.0% |
Transportation & Commute in Navajo County
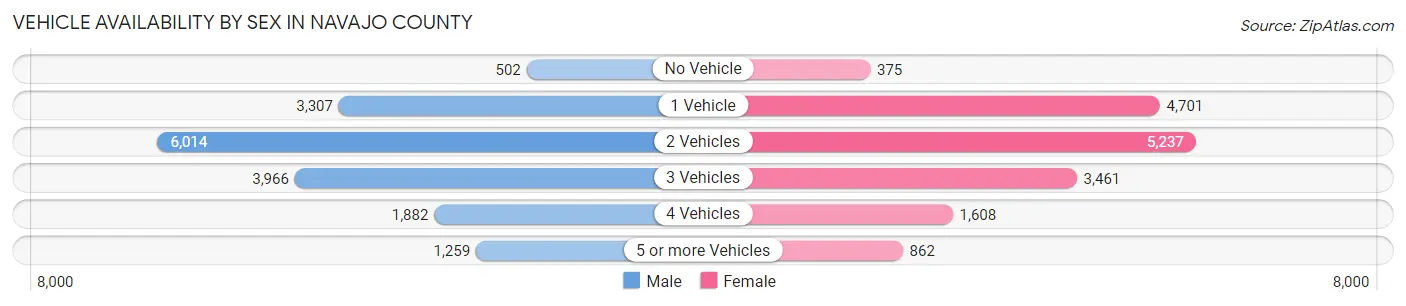
Vehicle Availability by Sex in Navajo County
The most prevalent vehicle ownership categories in Navajo County are males with 2 vehicles (6,014, accounting for 35.5%) and females with 2 vehicles (5,237, making up 37.0%).
| Vehicles Available | Male | Female |
| No Vehicle | 502 (3.0%) | 375 (2.3%) |
| 1 Vehicle | 3,307 (19.5%) | 4,701 (28.9%) |
| 2 Vehicles | 6,014 (35.5%) | 5,237 (32.2%) |
| 3 Vehicles | 3,966 (23.4%) | 3,461 (21.3%) |
| 4 Vehicles | 1,882 (11.1%) | 1,608 (9.9%) |
| 5 or more Vehicles | 1,259 (7.4%) | 862 (5.3%) |
| Total | 16,930 (100.0%) | 16,244 (100.0%) |
Commute Time in Navajo County
The most frequently occuring commute durations in Navajo County are 5 to 9 minutes (6,414 commuters, 20.9%), 10 to 14 minutes (4,654 commuters, 15.2%), and 15 to 19 minutes (4,330 commuters, 14.1%).
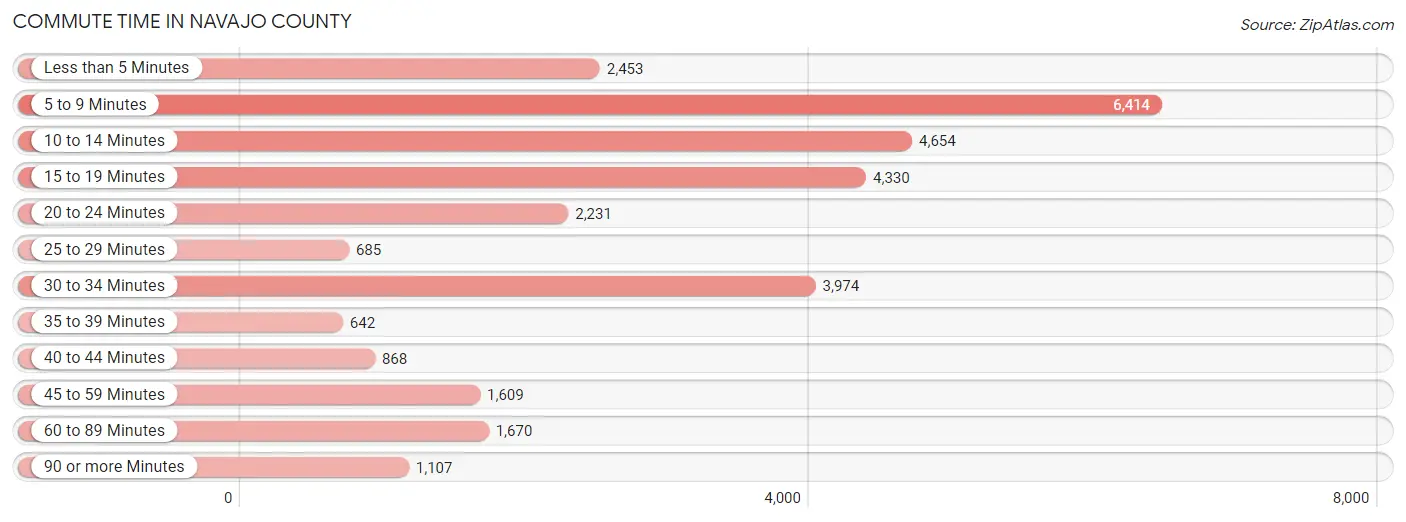
| Commute Time | # Commuters | % Commuters |
| Less than 5 Minutes | 2,453 | 8.0% |
| 5 to 9 Minutes | 6,414 | 20.9% |
| 10 to 14 Minutes | 4,654 | 15.2% |
| 15 to 19 Minutes | 4,330 | 14.1% |
| 20 to 24 Minutes | 2,231 | 7.3% |
| 25 to 29 Minutes | 685 | 2.2% |
| 30 to 34 Minutes | 3,974 | 13.0% |
| 35 to 39 Minutes | 642 | 2.1% |
| 40 to 44 Minutes | 868 | 2.8% |
| 45 to 59 Minutes | 1,609 | 5.2% |
| 60 to 89 Minutes | 1,670 | 5.4% |
| 90 or more Minutes | 1,107 | 3.6% |
Commute Time by Sex in Navajo County
The most common commute times in Navajo County are 5 to 9 minutes (3,372 commuters, 21.4%) for males and 5 to 9 minutes (3,042 commuters, 20.4%) for females.
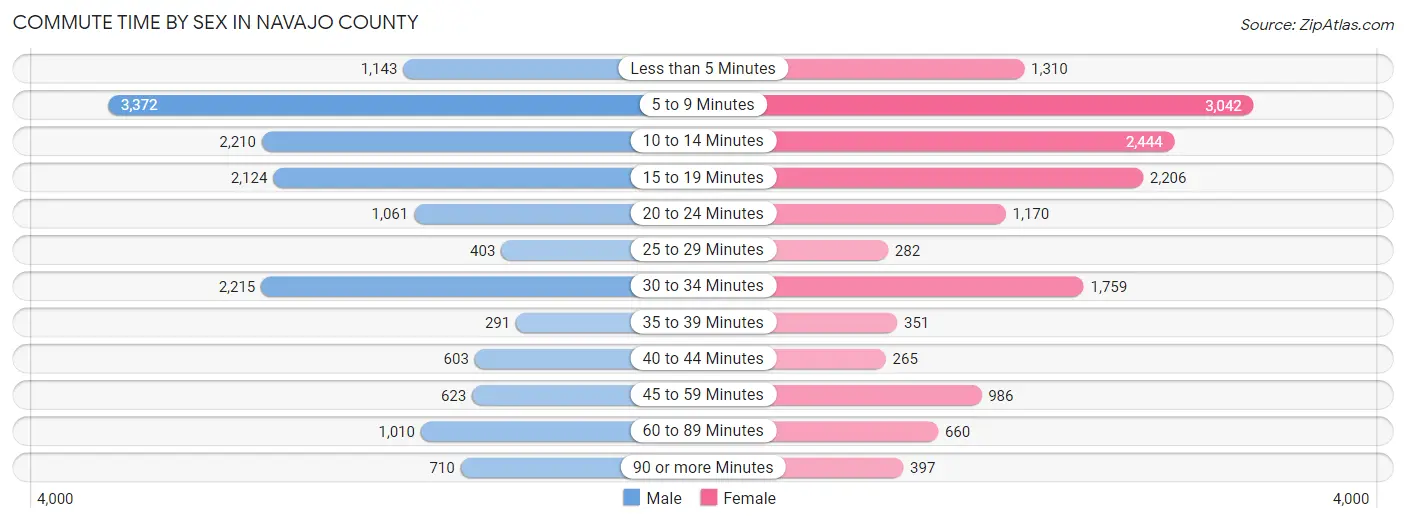
| Commute Time | Male | Female |
| Less than 5 Minutes | 1,143 (7.2%) | 1,310 (8.8%) |
| 5 to 9 Minutes | 3,372 (21.4%) | 3,042 (20.4%) |
| 10 to 14 Minutes | 2,210 (14.0%) | 2,444 (16.4%) |
| 15 to 19 Minutes | 2,124 (13.5%) | 2,206 (14.8%) |
| 20 to 24 Minutes | 1,061 (6.7%) | 1,170 (7.9%) |
| 25 to 29 Minutes | 403 (2.6%) | 282 (1.9%) |
| 30 to 34 Minutes | 2,215 (14.1%) | 1,759 (11.8%) |
| 35 to 39 Minutes | 291 (1.8%) | 351 (2.4%) |
| 40 to 44 Minutes | 603 (3.8%) | 265 (1.8%) |
| 45 to 59 Minutes | 623 (4.0%) | 986 (6.6%) |
| 60 to 89 Minutes | 1,010 (6.4%) | 660 (4.4%) |
| 90 or more Minutes | 710 (4.5%) | 397 (2.7%) |
Time of Departure to Work by Sex in Navajo County
The most frequent times of departure to work in Navajo County are 7:00 AM to 7:29 AM (2,549, 16.2%) for males and 7:30 AM to 7:59 AM (3,299, 22.2%) for females.
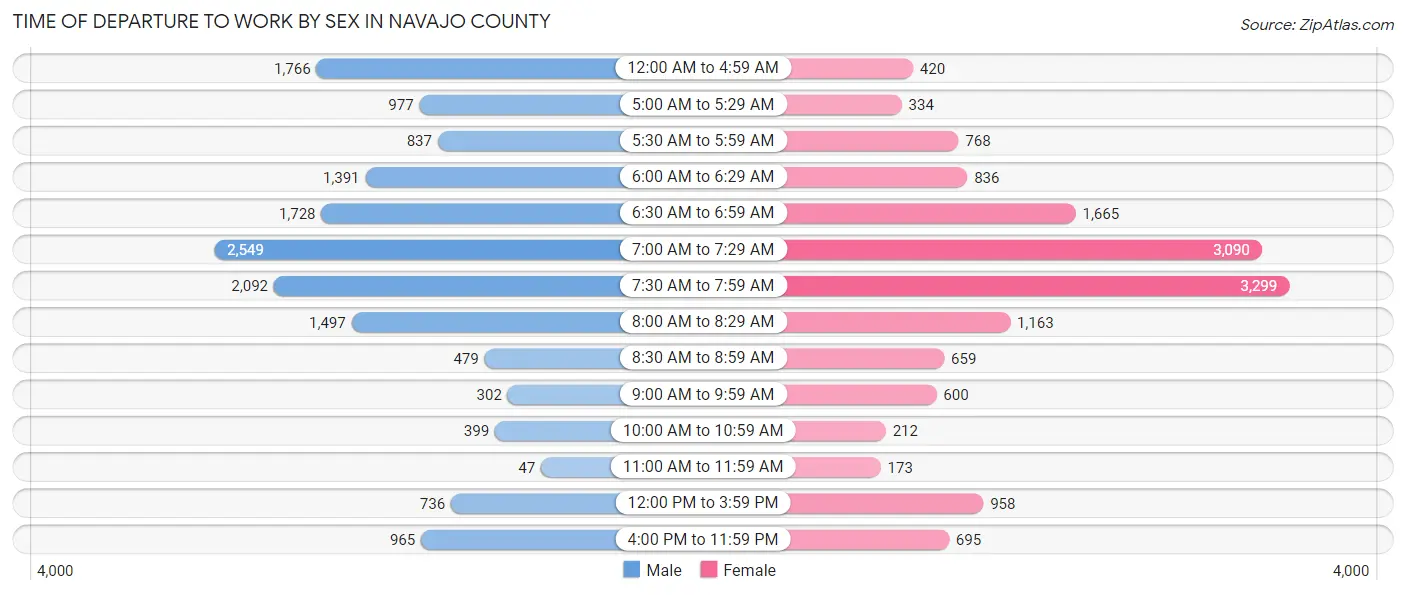
| Time of Departure | Male | Female |
| 12:00 AM to 4:59 AM | 1,766 (11.2%) | 420 (2.8%) |
| 5:00 AM to 5:29 AM | 977 (6.2%) | 334 (2.2%) |
| 5:30 AM to 5:59 AM | 837 (5.3%) | 768 (5.2%) |
| 6:00 AM to 6:29 AM | 1,391 (8.8%) | 836 (5.6%) |
| 6:30 AM to 6:59 AM | 1,728 (11.0%) | 1,665 (11.2%) |
| 7:00 AM to 7:29 AM | 2,549 (16.2%) | 3,090 (20.8%) |
| 7:30 AM to 7:59 AM | 2,092 (13.3%) | 3,299 (22.2%) |
| 8:00 AM to 8:29 AM | 1,497 (9.5%) | 1,163 (7.8%) |
| 8:30 AM to 8:59 AM | 479 (3.0%) | 659 (4.4%) |
| 9:00 AM to 9:59 AM | 302 (1.9%) | 600 (4.0%) |
| 10:00 AM to 10:59 AM | 399 (2.5%) | 212 (1.4%) |
| 11:00 AM to 11:59 AM | 47 (0.3%) | 173 (1.2%) |
| 12:00 PM to 3:59 PM | 736 (4.7%) | 958 (6.4%) |
| 4:00 PM to 11:59 PM | 965 (6.1%) | 695 (4.7%) |
| Total | 15,765 (100.0%) | 14,872 (100.0%) |
Housing Occupancy in Navajo County
Occupancy by Ownership in Navajo County
Of the total 37,565 dwellings in Navajo County, owner-occupied units account for 27,163 (72.3%), while renter-occupied units make up 10,402 (27.7%).
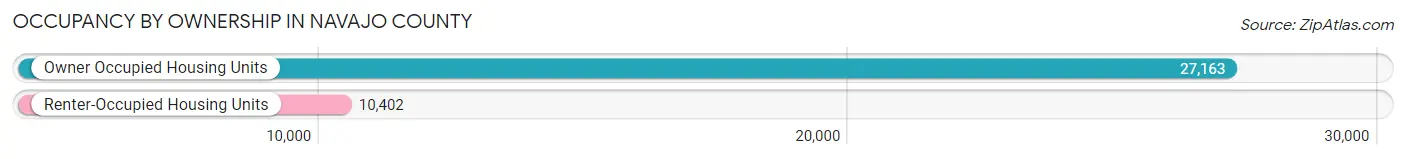
| Occupancy | # Housing Units | % Housing Units |
| Owner Occupied Housing Units | 27,163 | 72.3% |
| Renter-Occupied Housing Units | 10,402 | 27.7% |
| Total Occupied Housing Units | 37,565 | 100.0% |
Occupancy by Household Size in Navajo County
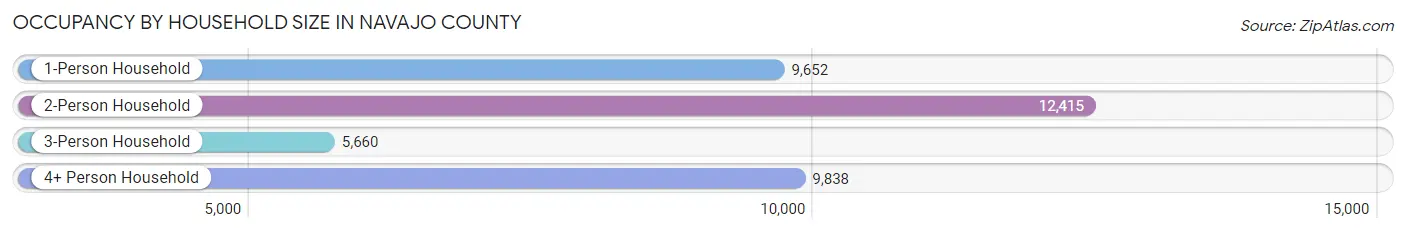
| Household Size | # Housing Units | % Housing Units |
| 1-Person Household | 9,652 | 25.7% |
| 2-Person Household | 12,415 | 33.1% |
| 3-Person Household | 5,660 | 15.1% |
| 4+ Person Household | 9,838 | 26.2% |
| Total Housing Units | 37,565 | 100.0% |
Occupancy by Ownership by Household Size in Navajo County
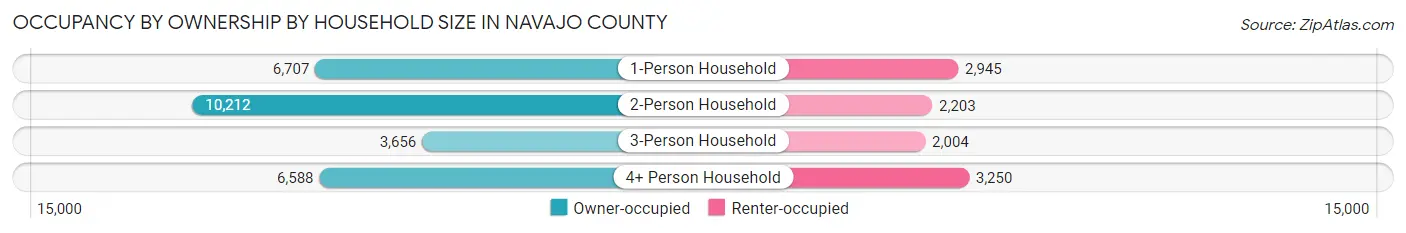
| Household Size | Owner-occupied | Renter-occupied |
| 1-Person Household | 6,707 (69.5%) | 2,945 (30.5%) |
| 2-Person Household | 10,212 (82.3%) | 2,203 (17.7%) |
| 3-Person Household | 3,656 (64.6%) | 2,004 (35.4%) |
| 4+ Person Household | 6,588 (67.0%) | 3,250 (33.0%) |
| Total Housing Units | 27,163 (72.3%) | 10,402 (27.7%) |
Occupancy by Educational Attainment in Navajo County
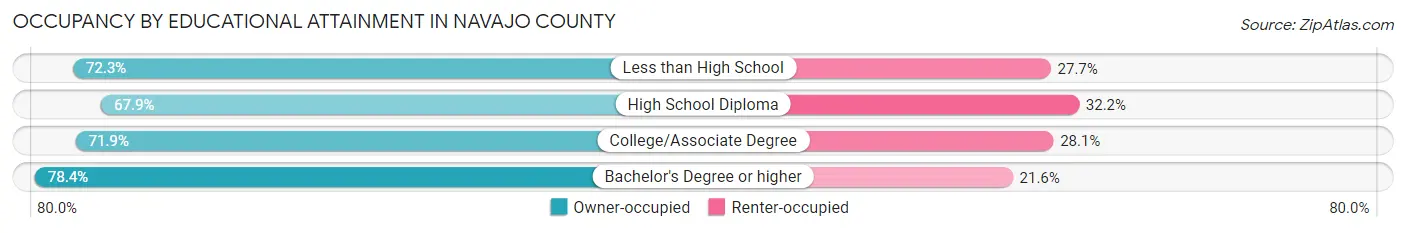
| Household Size | Owner-occupied | Renter-occupied |
| Less than High School | 3,801 (72.3%) | 1,454 (27.7%) |
| High School Diploma | 6,124 (67.8%) | 2,902 (32.2%) |
| College/Associate Degree | 11,256 (71.9%) | 4,394 (28.1%) |
| Bachelor's Degree or higher | 5,982 (78.4%) | 1,652 (21.6%) |
Occupancy by Age of Householder in Navajo County
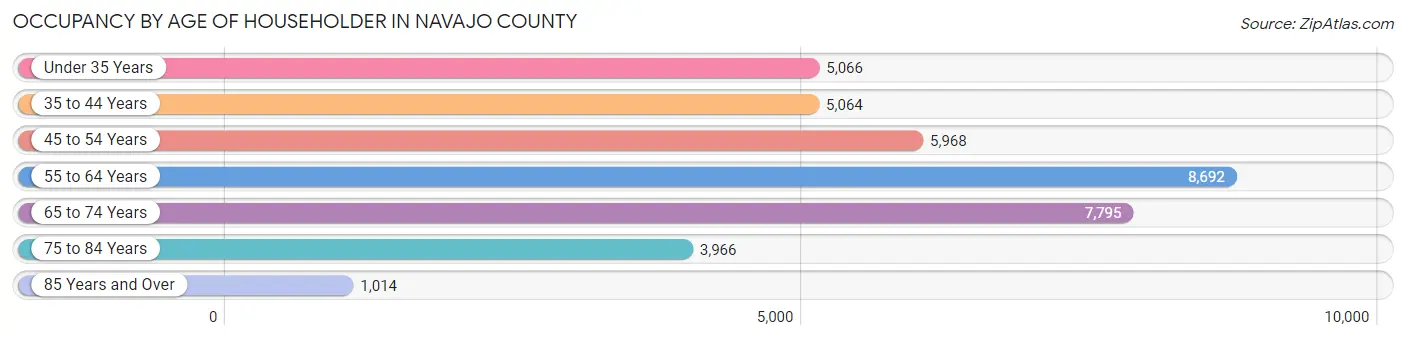
| Age Bracket | # Households | % Households |
| Under 35 Years | 5,066 | 13.5% |
| 35 to 44 Years | 5,064 | 13.5% |
| 45 to 54 Years | 5,968 | 15.9% |
| 55 to 64 Years | 8,692 | 23.1% |
| 65 to 74 Years | 7,795 | 20.7% |
| 75 to 84 Years | 3,966 | 10.6% |
| 85 Years and Over | 1,014 | 2.7% |
| Total | 37,565 | 100.0% |
Housing Finances in Navajo County
Median Income by Occupancy in Navajo County
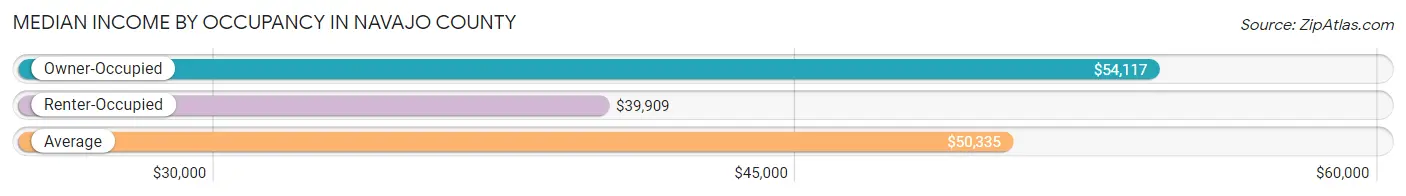
| Occupancy Type | # Households | Median Income |
| Owner-Occupied | 27,163 (72.3%) | $54,117 |
| Renter-Occupied | 10,402 (27.7%) | $39,909 |
| Average | 37,565 (100.0%) | $50,335 |
Occupancy by Householder Income Bracket in Navajo County
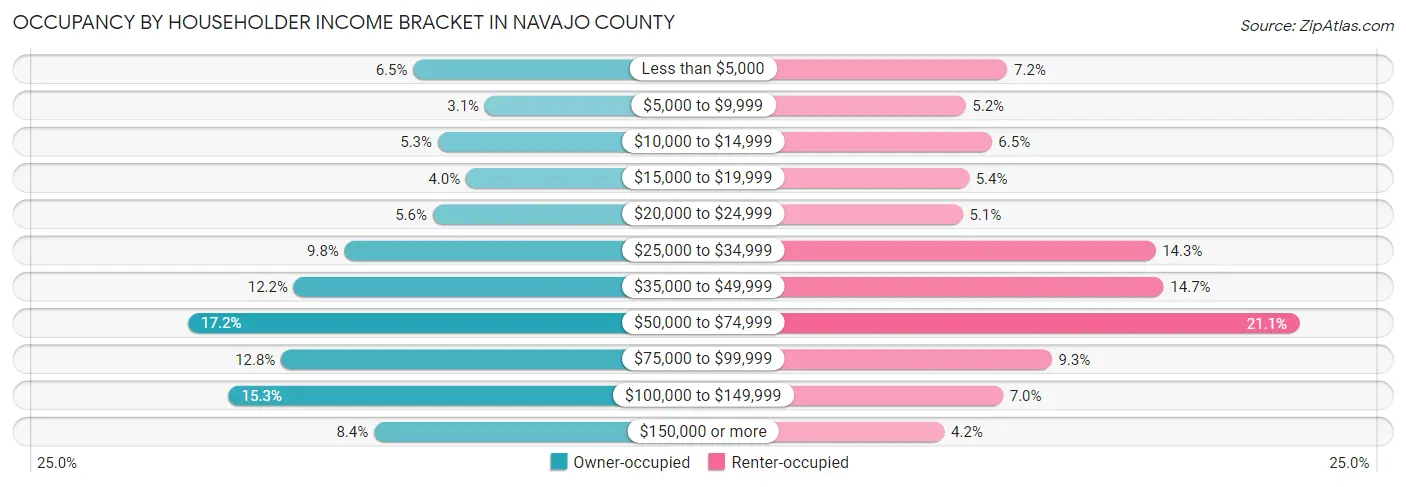
| Income Bracket | Owner-occupied | Renter-occupied |
| Less than $5,000 | 1,763 (6.5%) | 751 (7.2%) |
| $5,000 to $9,999 | 837 (3.1%) | 544 (5.2%) |
| $10,000 to $14,999 | 1,446 (5.3%) | 673 (6.5%) |
| $15,000 to $19,999 | 1,080 (4.0%) | 561 (5.4%) |
| $20,000 to $24,999 | 1,510 (5.6%) | 529 (5.1%) |
| $25,000 to $34,999 | 2,650 (9.8%) | 1,484 (14.3%) |
| $35,000 to $49,999 | 3,308 (12.2%) | 1,525 (14.7%) |
| $50,000 to $74,999 | 4,676 (17.2%) | 2,196 (21.1%) |
| $75,000 to $99,999 | 3,472 (12.8%) | 971 (9.3%) |
| $100,000 to $149,999 | 4,151 (15.3%) | 729 (7.0%) |
| $150,000 or more | 2,270 (8.4%) | 439 (4.2%) |
| Total | 27,163 (100.0%) | 10,402 (100.0%) |
Monthly Housing Cost Tiers in Navajo County
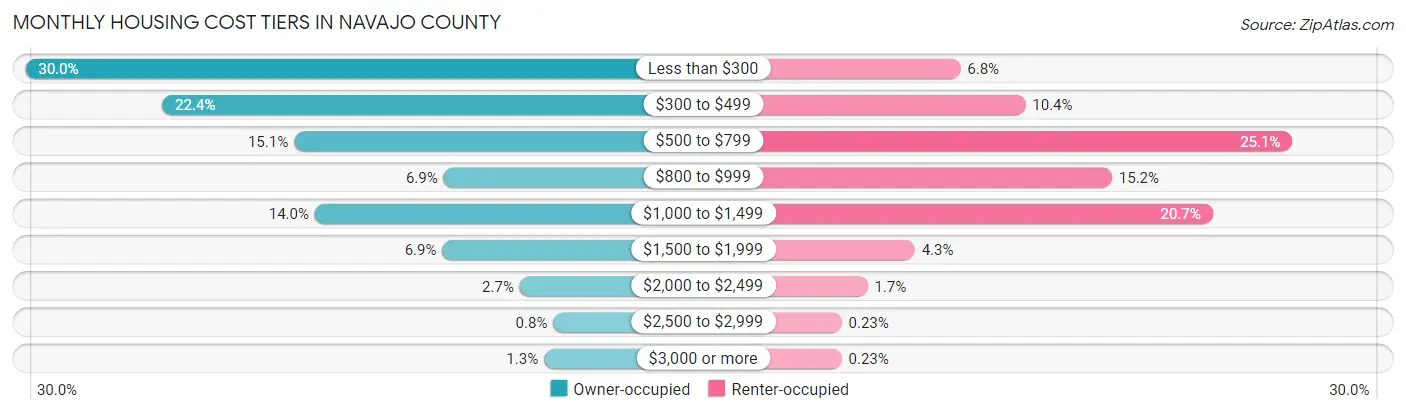
| Monthly Cost | Owner-occupied | Renter-occupied |
| Less than $300 | 8,138 (30.0%) | 706 (6.8%) |
| $300 to $499 | 6,085 (22.4%) | 1,080 (10.4%) |
| $500 to $799 | 4,106 (15.1%) | 2,613 (25.1%) |
| $800 to $999 | 1,863 (6.9%) | 1,577 (15.2%) |
| $1,000 to $1,499 | 3,794 (14.0%) | 2,155 (20.7%) |
| $1,500 to $1,999 | 1,882 (6.9%) | 444 (4.3%) |
| $2,000 to $2,499 | 721 (2.6%) | 173 (1.7%) |
| $2,500 to $2,999 | 218 (0.8%) | 24 (0.2%) |
| $3,000 or more | 356 (1.3%) | 24 (0.2%) |
| Total | 27,163 (100.0%) | 10,402 (100.0%) |
Physical Housing Characteristics in Navajo County
Housing Structures in Navajo County
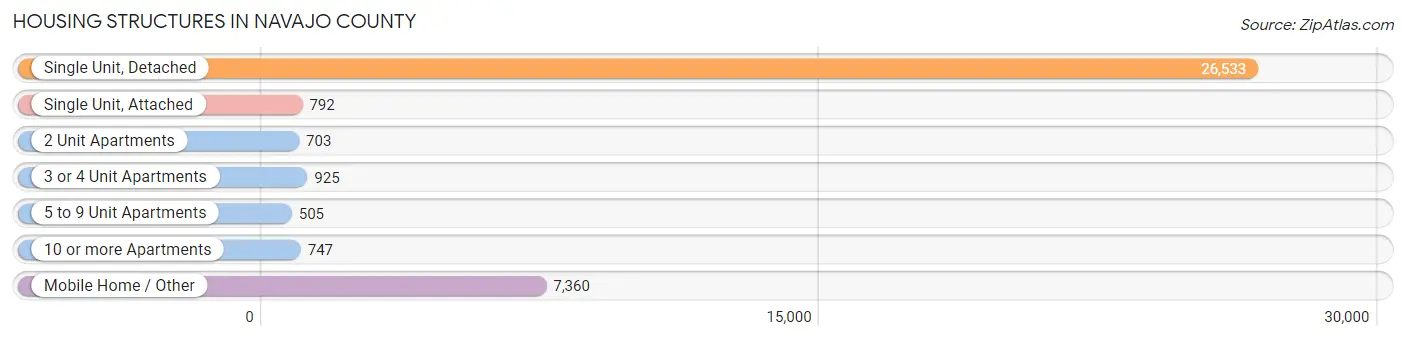
| Structure Type | # Housing Units | % Housing Units |
| Single Unit, Detached | 26,533 | 70.6% |
| Single Unit, Attached | 792 | 2.1% |
| 2 Unit Apartments | 703 | 1.9% |
| 3 or 4 Unit Apartments | 925 | 2.5% |
| 5 to 9 Unit Apartments | 505 | 1.3% |
| 10 or more Apartments | 747 | 2.0% |
| Mobile Home / Other | 7,360 | 19.6% |
| Total | 37,565 | 100.0% |
Housing Structures by Occupancy in Navajo County
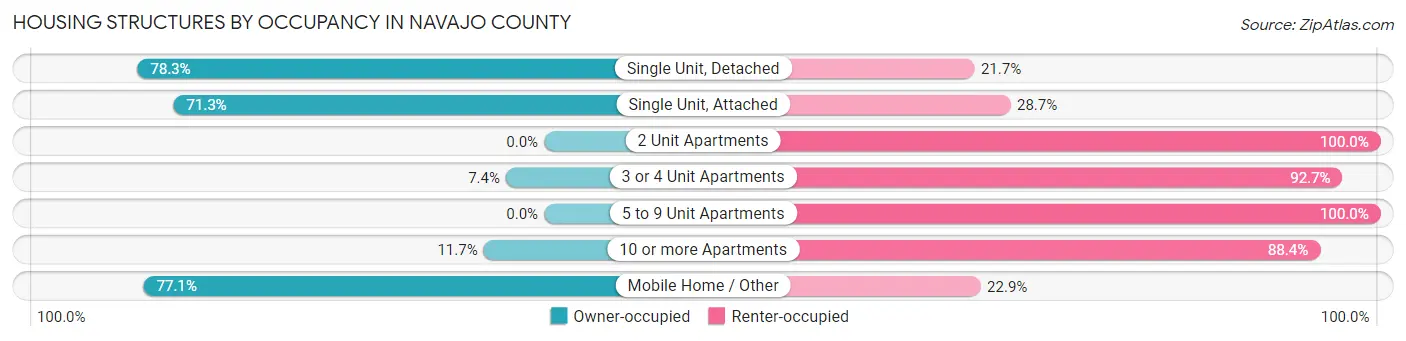
| Structure Type | Owner-occupied | Renter-occupied |
| Single Unit, Detached | 20,769 (78.3%) | 5,764 (21.7%) |
| Single Unit, Attached | 565 (71.3%) | 227 (28.7%) |
| 2 Unit Apartments | 0 (0.0%) | 703 (100.0%) |
| 3 or 4 Unit Apartments | 68 (7.3%) | 857 (92.6%) |
| 5 to 9 Unit Apartments | 0 (0.0%) | 505 (100.0%) |
| 10 or more Apartments | 87 (11.7%) | 660 (88.3%) |
| Mobile Home / Other | 5,674 (77.1%) | 1,686 (22.9%) |
| Total | 27,163 (72.3%) | 10,402 (27.7%) |
Housing Structures by Number of Rooms in Navajo County
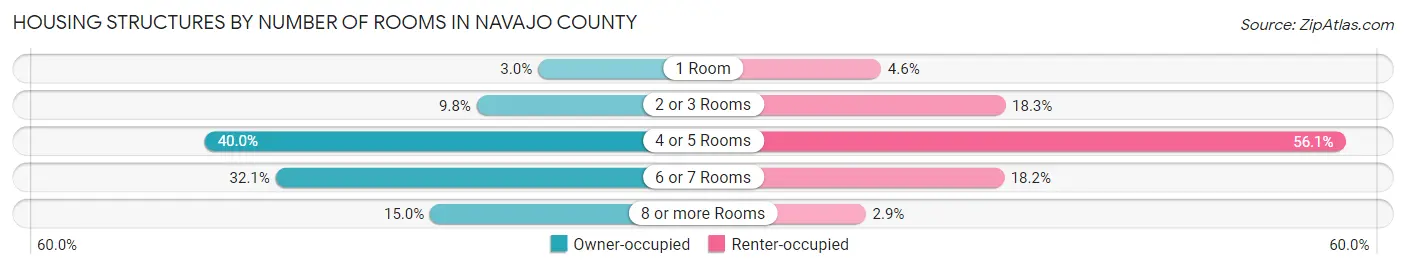
| Number of Rooms | Owner-occupied | Renter-occupied |
| 1 Room | 820 (3.0%) | 473 (4.5%) |
| 2 or 3 Rooms | 2,670 (9.8%) | 1,907 (18.3%) |
| 4 or 5 Rooms | 10,867 (40.0%) | 5,835 (56.1%) |
| 6 or 7 Rooms | 8,731 (32.1%) | 1,891 (18.2%) |
| 8 or more Rooms | 4,075 (15.0%) | 296 (2.9%) |
| Total | 27,163 (100.0%) | 10,402 (100.0%) |
Housing Structure by Heating Type in Navajo County
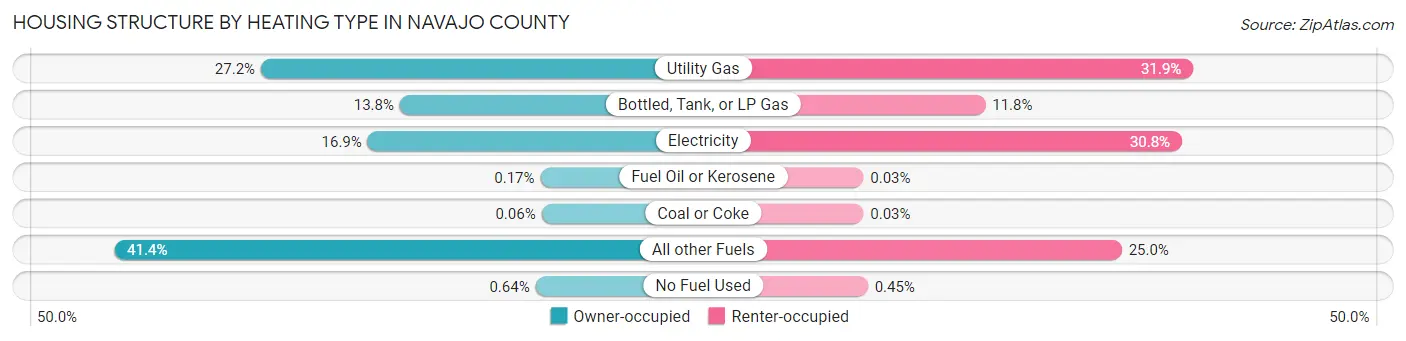
| Heating Type | Owner-occupied | Renter-occupied |
| Utility Gas | 7,379 (27.2%) | 3,317 (31.9%) |
| Bottled, Tank, or LP Gas | 3,735 (13.8%) | 1,228 (11.8%) |
| Electricity | 4,580 (16.9%) | 3,205 (30.8%) |
| Fuel Oil or Kerosene | 46 (0.2%) | 3 (0.0%) |
| Coal or Coke | 17 (0.1%) | 3 (0.0%) |
| All other Fuels | 11,232 (41.3%) | 2,599 (25.0%) |
| No Fuel Used | 174 (0.6%) | 47 (0.4%) |
| Total | 27,163 (100.0%) | 10,402 (100.0%) |
Household Vehicle Usage in Navajo County
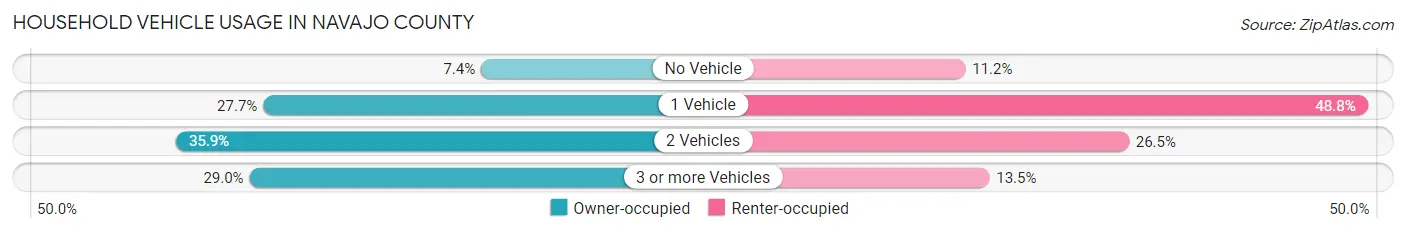
| Vehicles per Household | Owner-occupied | Renter-occupied |
| No Vehicle | 2,006 (7.4%) | 1,169 (11.2%) |
| 1 Vehicle | 7,533 (27.7%) | 5,074 (48.8%) |
| 2 Vehicles | 9,743 (35.9%) | 2,757 (26.5%) |
| 3 or more Vehicles | 7,881 (29.0%) | 1,402 (13.5%) |
| Total | 27,163 (100.0%) | 10,402 (100.0%) |
Real Estate & Mortgages in Navajo County
Real Estate and Mortgage Overview in Navajo County
| Characteristic | Without Mortgage | With Mortgage |
| Housing Units | 17,713 | 9,450 |
| Median Property Value | $125,700 | $236,100 |
| Median Household Income | $41,789 | $1,332 |
| Monthly Housing Costs | $325 | $348 |
| Real Estate Taxes | $955 | $677 |
Property Value by Mortgage Status in Navajo County
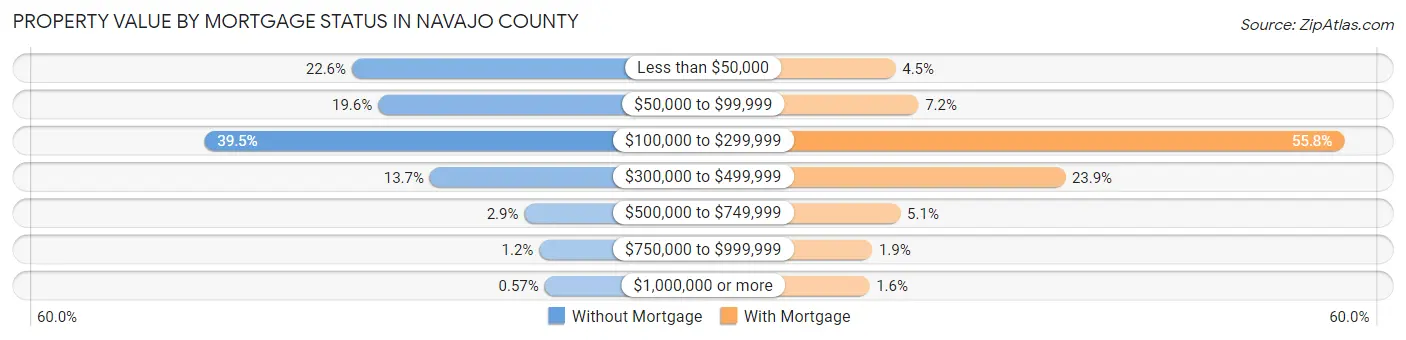
| Property Value | Without Mortgage | With Mortgage |
| Less than $50,000 | 4,004 (22.6%) | 429 (4.5%) |
| $50,000 to $99,999 | 3,474 (19.6%) | 677 (7.2%) |
| $100,000 to $299,999 | 6,987 (39.5%) | 5,276 (55.8%) |
| $300,000 to $499,999 | 2,425 (13.7%) | 2,261 (23.9%) |
| $500,000 to $749,999 | 512 (2.9%) | 482 (5.1%) |
| $750,000 to $999,999 | 210 (1.2%) | 178 (1.9%) |
| $1,000,000 or more | 101 (0.6%) | 147 (1.6%) |
| Total | 17,713 (100.0%) | 9,450 (100.0%) |
Household Income by Mortgage Status in Navajo County
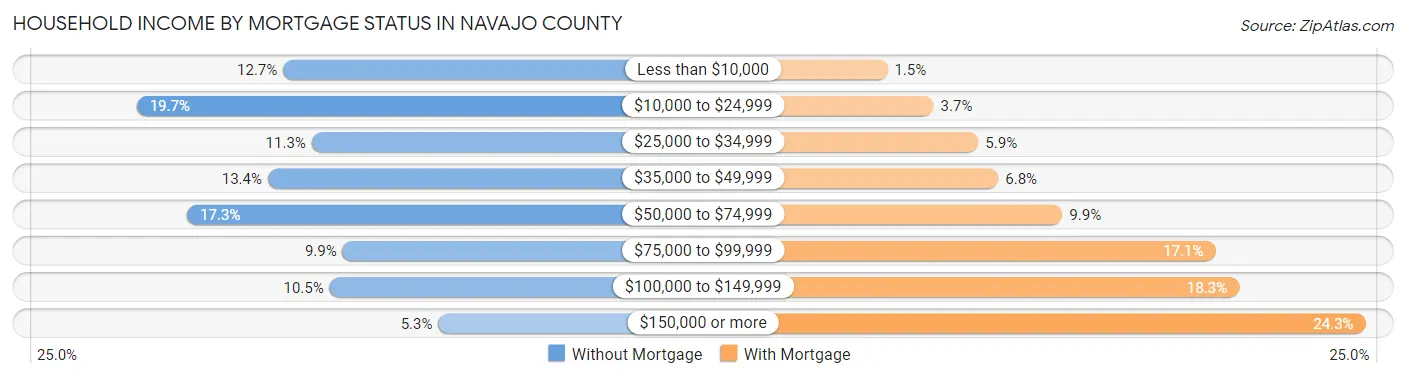
| Household Income | Without Mortgage | With Mortgage |
| Less than $10,000 | 2,248 (12.7%) | 144 (1.5%) |
| $10,000 to $24,999 | 3,483 (19.7%) | 352 (3.7%) |
| $25,000 to $34,999 | 2,007 (11.3%) | 553 (5.9%) |
| $35,000 to $49,999 | 2,377 (13.4%) | 643 (6.8%) |
| $50,000 to $74,999 | 3,057 (17.3%) | 931 (9.9%) |
| $75,000 to $99,999 | 1,746 (9.9%) | 1,619 (17.1%) |
| $100,000 to $149,999 | 1,857 (10.5%) | 1,726 (18.3%) |
| $150,000 or more | 938 (5.3%) | 2,294 (24.3%) |
| Total | 17,713 (100.0%) | 9,450 (100.0%) |
Property Value to Household Income Ratio in Navajo County
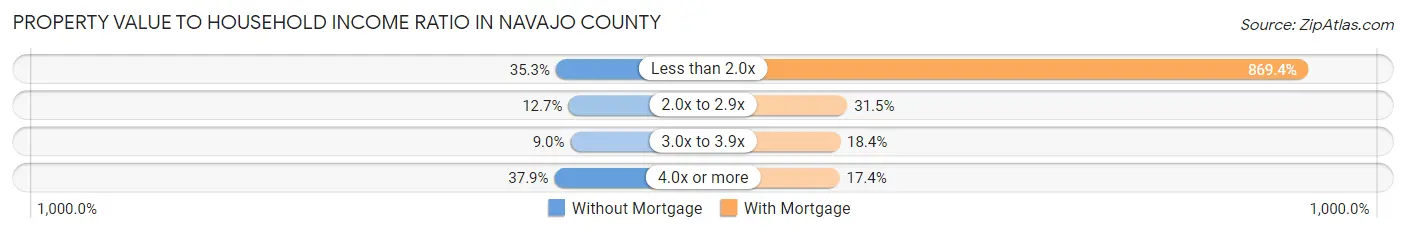
| Value-to-Income Ratio | Without Mortgage | With Mortgage |
| Less than 2.0x | 6,253 (35.3%) | 82,154 (869.4%) |
| 2.0x to 2.9x | 2,245 (12.7%) | 2,977 (31.5%) |
| 3.0x to 3.9x | 1,589 (9.0%) | 1,741 (18.4%) |
| 4.0x or more | 6,716 (37.9%) | 1,648 (17.4%) |
| Total | 17,713 (100.0%) | 9,450 (100.0%) |
Real Estate Taxes by Mortgage Status in Navajo County
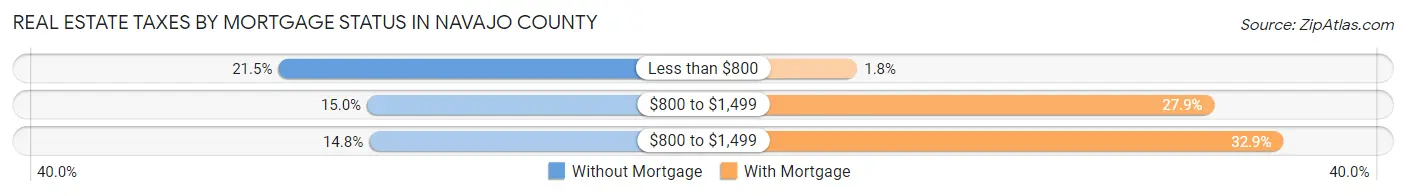
| Property Taxes | Without Mortgage | With Mortgage |
| Less than $800 | 3,803 (21.5%) | 167 (1.8%) |
| $800 to $1,499 | 2,655 (15.0%) | 2,633 (27.9%) |
| $800 to $1,499 | 2,629 (14.8%) | 3,108 (32.9%) |
| Total | 17,713 (100.0%) | 9,450 (100.0%) |
Health & Disability in Navajo County
Health Insurance Coverage by Age in Navajo County
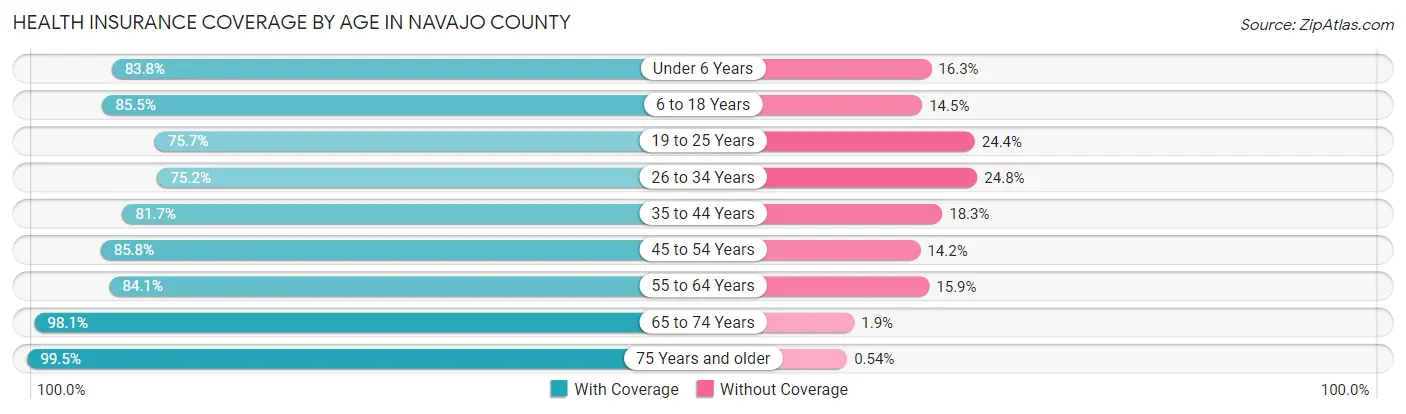
| Age Bracket | With Coverage | Without Coverage |
| Under 6 Years | 6,695 (83.8%) | 1,299 (16.3%) |
| 6 to 18 Years | 18,181 (85.5%) | 3,090 (14.5%) |
| 19 to 25 Years | 6,186 (75.6%) | 1,991 (24.3%) |
| 26 to 34 Years | 8,136 (75.2%) | 2,686 (24.8%) |
| 35 to 44 Years | 9,033 (81.7%) | 2,021 (18.3%) |
| 45 to 54 Years | 9,582 (85.8%) | 1,587 (14.2%) |
| 55 to 64 Years | 11,864 (84.1%) | 2,236 (15.9%) |
| 65 to 74 Years | 12,230 (98.1%) | 234 (1.9%) |
| 75 Years and older | 7,571 (99.5%) | 41 (0.5%) |
| Total | 89,478 (85.5%) | 15,185 (14.5%) |
Health Insurance Coverage by Citizenship Status in Navajo County
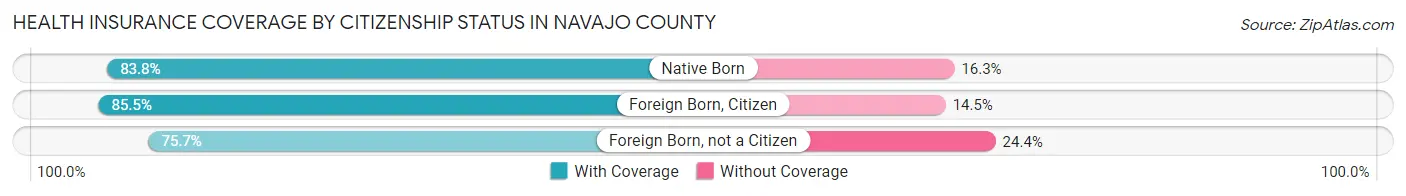
| Citizenship Status | With Coverage | Without Coverage |
| Native Born | 6,695 (83.8%) | 1,299 (16.3%) |
| Foreign Born, Citizen | 18,181 (85.5%) | 3,090 (14.5%) |
| Foreign Born, not a Citizen | 6,186 (75.6%) | 1,991 (24.3%) |
Health Insurance Coverage by Household Income in Navajo County
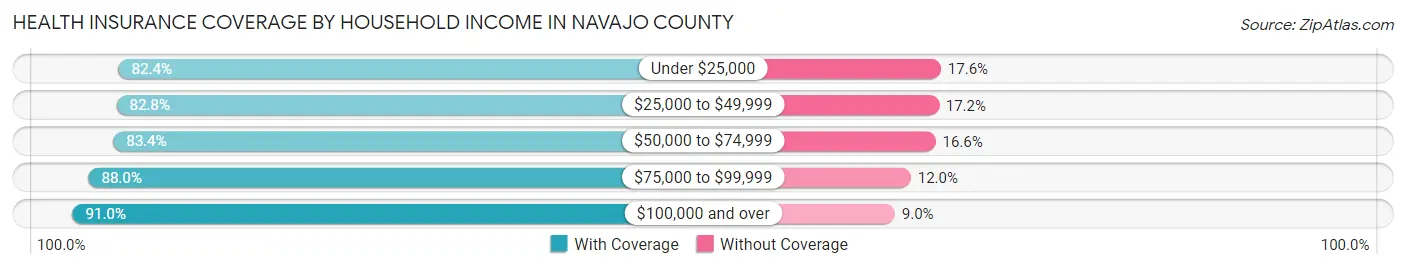
| Household Income | With Coverage | Without Coverage |
| Under $25,000 | 17,084 (82.4%) | 3,656 (17.6%) |
| $25,000 to $49,999 | 19,615 (82.8%) | 4,082 (17.2%) |
| $50,000 to $74,999 | 17,359 (83.4%) | 3,462 (16.6%) |
| $75,000 to $99,999 | 11,303 (88.0%) | 1,540 (12.0%) |
| $100,000 and over | 23,694 (91.0%) | 2,342 (9.0%) |
Public vs Private Health Insurance Coverage by Age in Navajo County
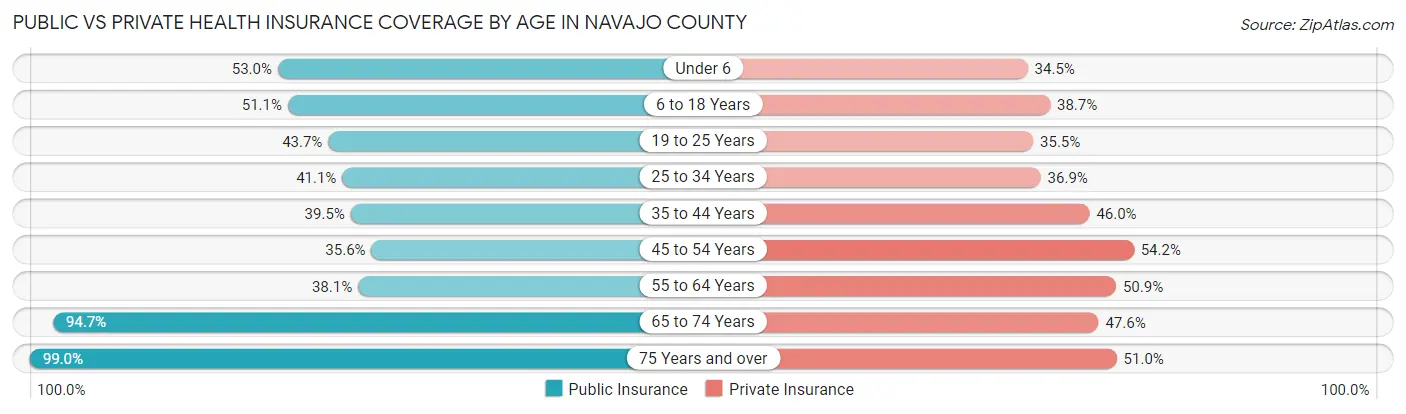
| Age Bracket | Public Insurance | Private Insurance |
| Under 6 | 4,237 (53.0%) | 2,758 (34.5%) |
| 6 to 18 Years | 10,877 (51.1%) | 8,224 (38.7%) |
| 19 to 25 Years | 3,569 (43.6%) | 2,904 (35.5%) |
| 25 to 34 Years | 4,442 (41.0%) | 3,994 (36.9%) |
| 35 to 44 Years | 4,364 (39.5%) | 5,082 (46.0%) |
| 45 to 54 Years | 3,980 (35.6%) | 6,053 (54.2%) |
| 55 to 64 Years | 5,375 (38.1%) | 7,175 (50.9%) |
| 65 to 74 Years | 11,809 (94.7%) | 5,938 (47.6%) |
| 75 Years and over | 7,538 (99.0%) | 3,884 (51.0%) |
| Total | 56,191 (53.7%) | 46,012 (44.0%) |
Disability Status by Sex by Age in Navajo County
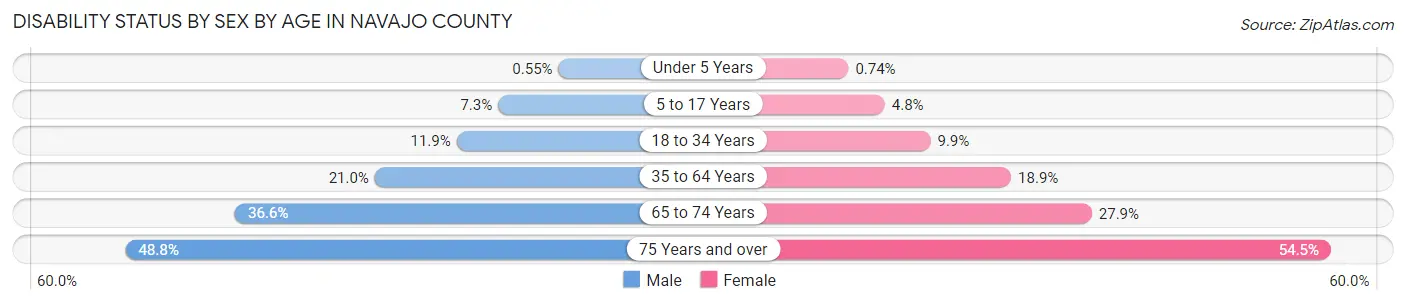
| Age Bracket | Male | Female |
| Under 5 Years | 19 (0.5%) | 24 (0.7%) |
| 5 to 17 Years | 784 (7.3%) | 488 (4.8%) |
| 18 to 34 Years | 1,231 (11.9%) | 1,007 (9.9%) |
| 35 to 64 Years | 3,701 (21.0%) | 3,528 (18.9%) |
| 65 to 74 Years | 2,207 (36.6%) | 1,790 (27.9%) |
| 75 Years and over | 1,717 (48.8%) | 2,228 (54.5%) |
Disability Class by Sex by Age in Navajo County
Disability Class: Hearing Difficulty
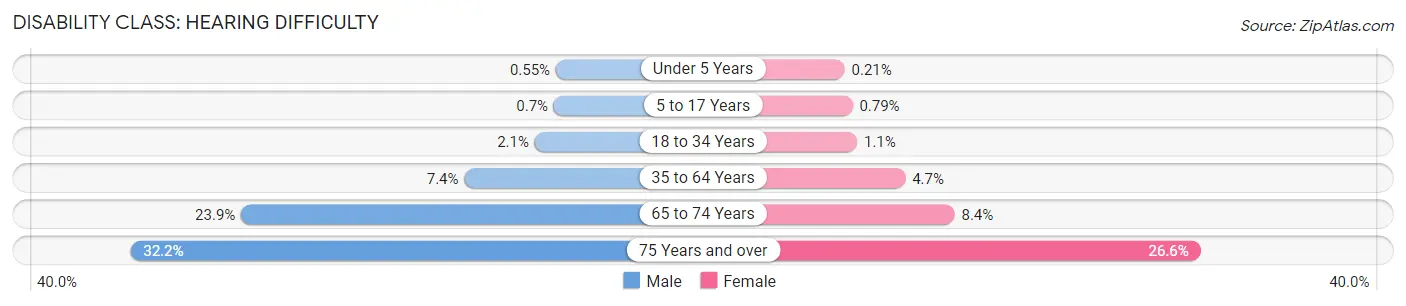
| Age Bracket | Male | Female |
| Under 5 Years | 19 (0.5%) | 7 (0.2%) |
| 5 to 17 Years | 75 (0.7%) | 80 (0.8%) |
| 18 to 34 Years | 220 (2.1%) | 115 (1.1%) |
| 35 to 64 Years | 1,294 (7.3%) | 882 (4.7%) |
| 65 to 74 Years | 1,444 (23.9%) | 538 (8.4%) |
| 75 Years and over | 1,132 (32.2%) | 1,090 (26.6%) |
Disability Class: Vision Difficulty
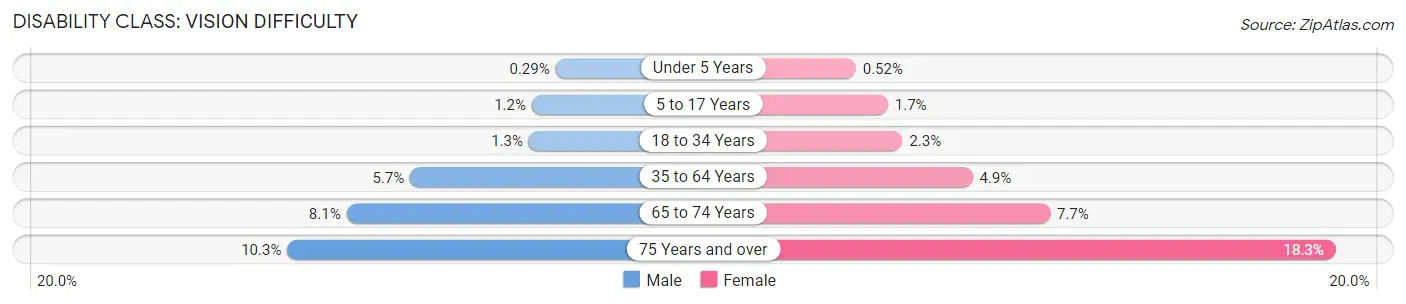
| Age Bracket | Male | Female |
| Under 5 Years | 10 (0.3%) | 17 (0.5%) |
| 5 to 17 Years | 126 (1.2%) | 174 (1.7%) |
| 18 to 34 Years | 133 (1.3%) | 229 (2.2%) |
| 35 to 64 Years | 1,003 (5.7%) | 908 (4.9%) |
| 65 to 74 Years | 486 (8.1%) | 497 (7.7%) |
| 75 Years and over | 361 (10.2%) | 750 (18.3%) |
Disability Class: Cognitive Difficulty
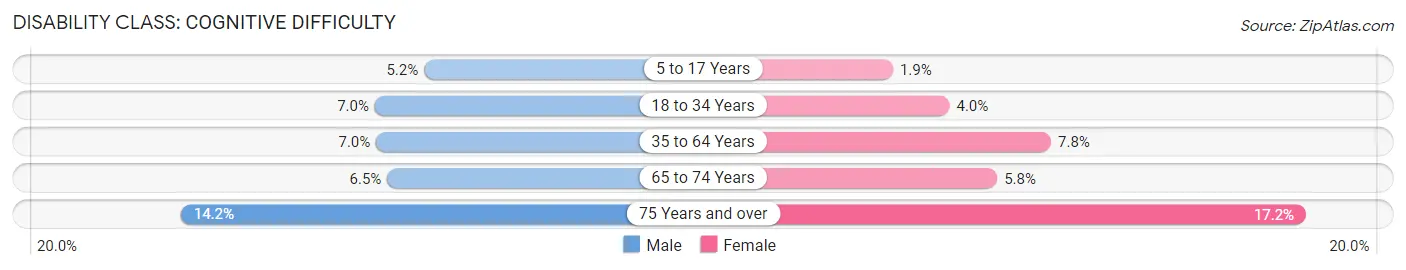
| Age Bracket | Male | Female |
| 5 to 17 Years | 558 (5.2%) | 194 (1.9%) |
| 18 to 34 Years | 725 (7.0%) | 408 (4.0%) |
| 35 to 64 Years | 1,224 (7.0%) | 1,454 (7.8%) |
| 65 to 74 Years | 395 (6.5%) | 371 (5.8%) |
| 75 Years and over | 500 (14.2%) | 705 (17.2%) |
Disability Class: Ambulatory Difficulty
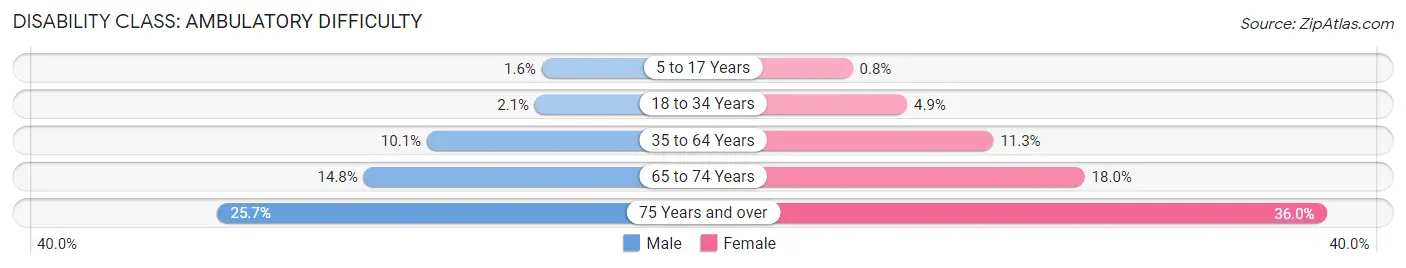
| Age Bracket | Male | Female |
| 5 to 17 Years | 174 (1.6%) | 81 (0.8%) |
| 18 to 34 Years | 219 (2.1%) | 494 (4.9%) |
| 35 to 64 Years | 1,784 (10.1%) | 2,107 (11.3%) |
| 65 to 74 Years | 895 (14.8%) | 1,159 (18.0%) |
| 75 Years and over | 904 (25.7%) | 1,472 (36.0%) |
Disability Class: Self-Care Difficulty
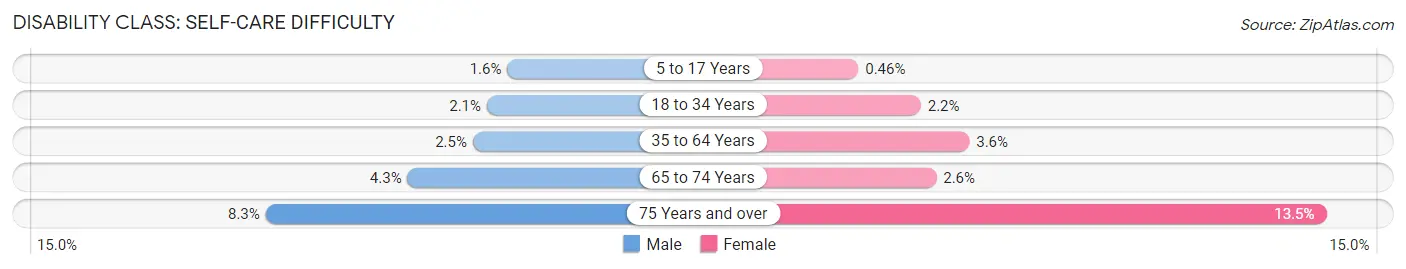
| Age Bracket | Male | Female |
| 5 to 17 Years | 168 (1.6%) | 47 (0.5%) |
| 18 to 34 Years | 221 (2.1%) | 224 (2.2%) |
| 35 to 64 Years | 444 (2.5%) | 665 (3.5%) |
| 65 to 74 Years | 262 (4.3%) | 169 (2.6%) |
| 75 Years and over | 292 (8.3%) | 552 (13.5%) |
Technology Access in Navajo County
Computing Device Access in Navajo County
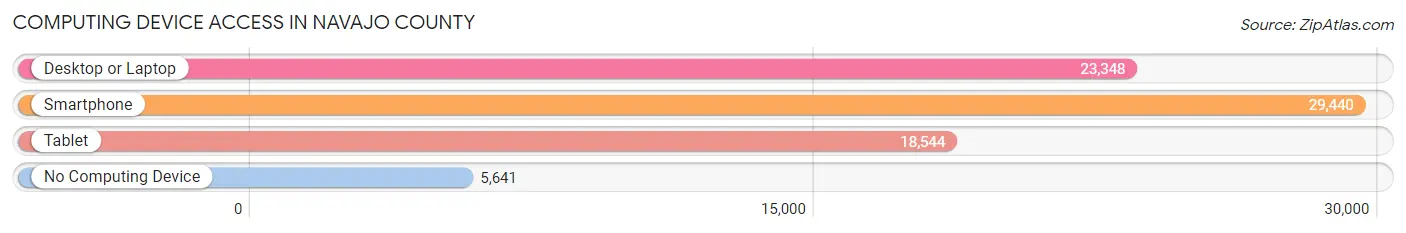
| Device Type | # Households | % Households |
| Desktop or Laptop | 23,348 | 62.2% |
| Smartphone | 29,440 | 78.4% |
| Tablet | 18,544 | 49.4% |
| No Computing Device | 5,641 | 15.0% |
| Total | 37,565 | 100.0% |
Internet Access in Navajo County
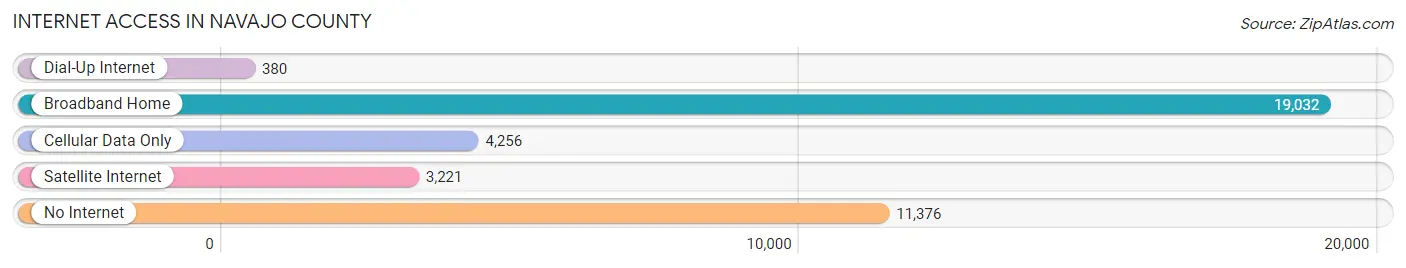
| Internet Type | # Households | % Households |
| Dial-Up Internet | 380 | 1.0% |
| Broadband Home | 19,032 | 50.7% |
| Cellular Data Only | 4,256 | 11.3% |
| Satellite Internet | 3,221 | 8.6% |
| No Internet | 11,376 | 30.3% |
| Total | 37,565 | 100.0% |
Navajo County Summary
Navajo County is located in the northern part of Arizona and is the third largest county in the state. It is bordered by Apache County to the east, Coconino County to the north, Gila County to the south, and the state of Utah to the west. The county seat is Holbrook, and the largest city is Show Low. The county has a total area of 9,960 square miles, making it the largest county in Arizona.
History
Navajo County was established in 1895, and was named after the Navajo Nation, which had inhabited the area for centuries. The county was originally part of Apache County, but was split off in 1895. The county was initially populated by Native Americans, but by the early 1900s, settlers began to move into the area. The county was largely rural until the 1950s, when the population began to grow rapidly due to the development of the mining and timber industries.
Geography
Navajo County is located in the northern part of Arizona and is the third largest county in the state. It is bordered by Apache County to the east, Coconino County to the north, Gila County to the south, and the state of Utah to the west. The county has a total area of 9,960 square miles, making it the largest county in Arizona. The county is mostly mountainous, with the highest point being the San Francisco Peaks at 12,633 feet. The county is home to several national forests, including the Apache-Sitgreaves National Forest, Coconino National Forest, and Kaibab National Forest.
Economy
Navajo County’s economy is largely based on agriculture, mining, and tourism. The county is home to several large agricultural operations, including cattle ranches, dairy farms, and hay farms. Mining is also an important part of the economy, with copper, uranium, and coal being the main minerals mined in the county. Tourism is also an important part of the economy, with the county being home to several popular tourist attractions, including the Petrified Forest National Park, the Grand Canyon, and Monument Valley.
Demographics
As of the 2010 census, the population of Navajo County was 107,449. The population is largely Native American, with the Navajo Nation making up the largest ethnic group in the county. The county is also home to a large Hispanic population, as well as a small population of African Americans and Asians. The median household income in the county is $41,945, and the median home value is $133,400. The unemployment rate in the county is 8.2%, which is slightly higher than the national average.
Common Questions
What is Per Capita Income in Navajo County?
Per Capita income in Navajo County is $22,826.
What is the Median Family Income in Navajo County?
Median Family Income in Navajo County is $58,541.
What is the Median Household income in Navajo County?
Median Household Income in Navajo County is $50,335.
What is Income or Wage Gap in Navajo County?
Income or Wage Gap in Navajo County is 21.2%.
Women in Navajo County earn 78.8 cents for every dollar earned by a man.
What is Family Income Deficit in Navajo County?
Family Income Deficit in Navajo County is $12,957.
Families that are below poverty line in Navajo County earn $12,957 less on average than the poverty threshold level.
What is Inequality or Gini Index in Navajo County?
Inequality or Gini Index in Navajo County is 0.45.
What is the Total Population of Navajo County?
Total Population of Navajo County is 107,110.
What is the Total Male Population of Navajo County?
Total Male Population of Navajo County is 54,016.
What is the Total Female Population of Navajo County?
Total Female Population of Navajo County is 53,094.
What is the Ratio of Males per 100 Females in Navajo County?
There are 101.74 Males per 100 Females in Navajo County.
What is the Ratio of Females per 100 Males in Navajo County?
There are 98.29 Females per 100 Males in Navajo County.
What is the Median Population Age in Navajo County?
Median Population Age in Navajo County is 38.7 Years.
What is the Average Family Size in Navajo County
Average Family Size in Navajo County is 3.4 People.
What is the Average Household Size in Navajo County
Average Household Size in Navajo County is 2.8 People.
How Large is the Labor Force in Navajo County?
There are 37,626 People in the Labor Forcein in Navajo County.
What is the Percentage of People in the Labor Force in Navajo County?
45.7% of People are in the Labor Force in Navajo County.
What is the Unemployment Rate in Navajo County?
Unemployment Rate in Navajo County is 9.7%.