La Paz County, AZ Map & Demographics
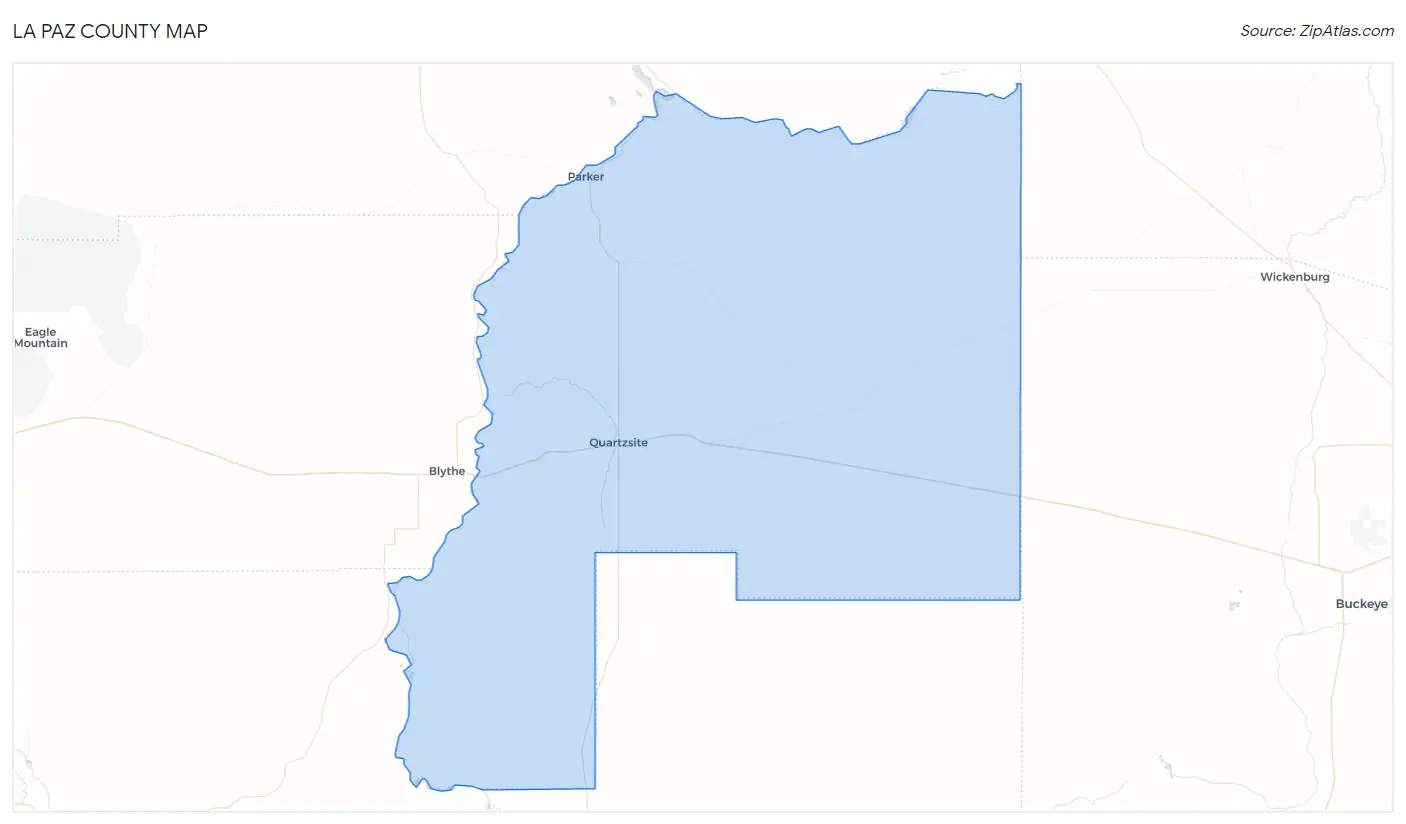
La Paz County Map
La Paz County Overview
$30,399
PER CAPITA INCOME
$58,960
AVG FAMILY INCOME
$46,634
AVG HOUSEHOLD INCOME
29.9%
WAGE / INCOME GAP [ % ]
70.1¢/ $1
WAGE / INCOME GAP [ $ ]
$9,669
FAMILY INCOME DEFICIT
0.48
INEQUALITY / GINI INDEX
16,681
TOTAL POPULATION
8,617
MALE POPULATION
8,064
FEMALE POPULATION
106.86
MALES / 100 FEMALES
93.58
FEMALES / 100 MALES
57.3
MEDIAN AGE
2.2
AVG FAMILY SIZE
1.9
AVG HOUSEHOLD SIZE
6,136
LABOR FORCE [ PEOPLE ]
43.0%
PERCENT IN LABOR FORCE
10.7%
UNEMPLOYMENT RATE
La Paz County Area Codes
Income in La Paz County
Income Overview in La Paz County
Per Capita Income in La Paz County is $30,399, while median incomes of families and households are $58,960 and $46,634 respectively.
| Characteristic | Number | Measure |
| Per Capita Income | 16,681 | $30,399 |
| Median Family Income | 5,326 | $58,960 |
| Mean Family Income | 5,326 | $76,012 |
| Median Household Income | 8,911 | $46,634 |
| Mean Household Income | 8,911 | $62,044 |
| Income Deficit | 5,326 | $9,669 |
| Wage / Income Gap (%) | 16,681 | 29.89% |
| Wage / Income Gap ($) | 16,681 | 70.11¢ per $1 |
| Gini / Inequality Index | 16,681 | 0.48 |
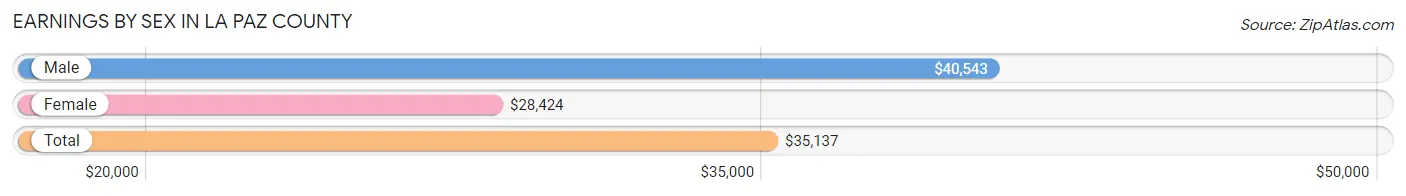
Earnings by Sex in La Paz County
Average Earnings in La Paz County are $35,137, $40,543 for men and $28,424 for women, a difference of 29.9%.
| Sex | Number | Average Earnings |
| Male | 3,524 (54.9%) | $40,543 |
| Female | 2,890 (45.1%) | $28,424 |
| Total | 6,414 (100.0%) | $35,137 |
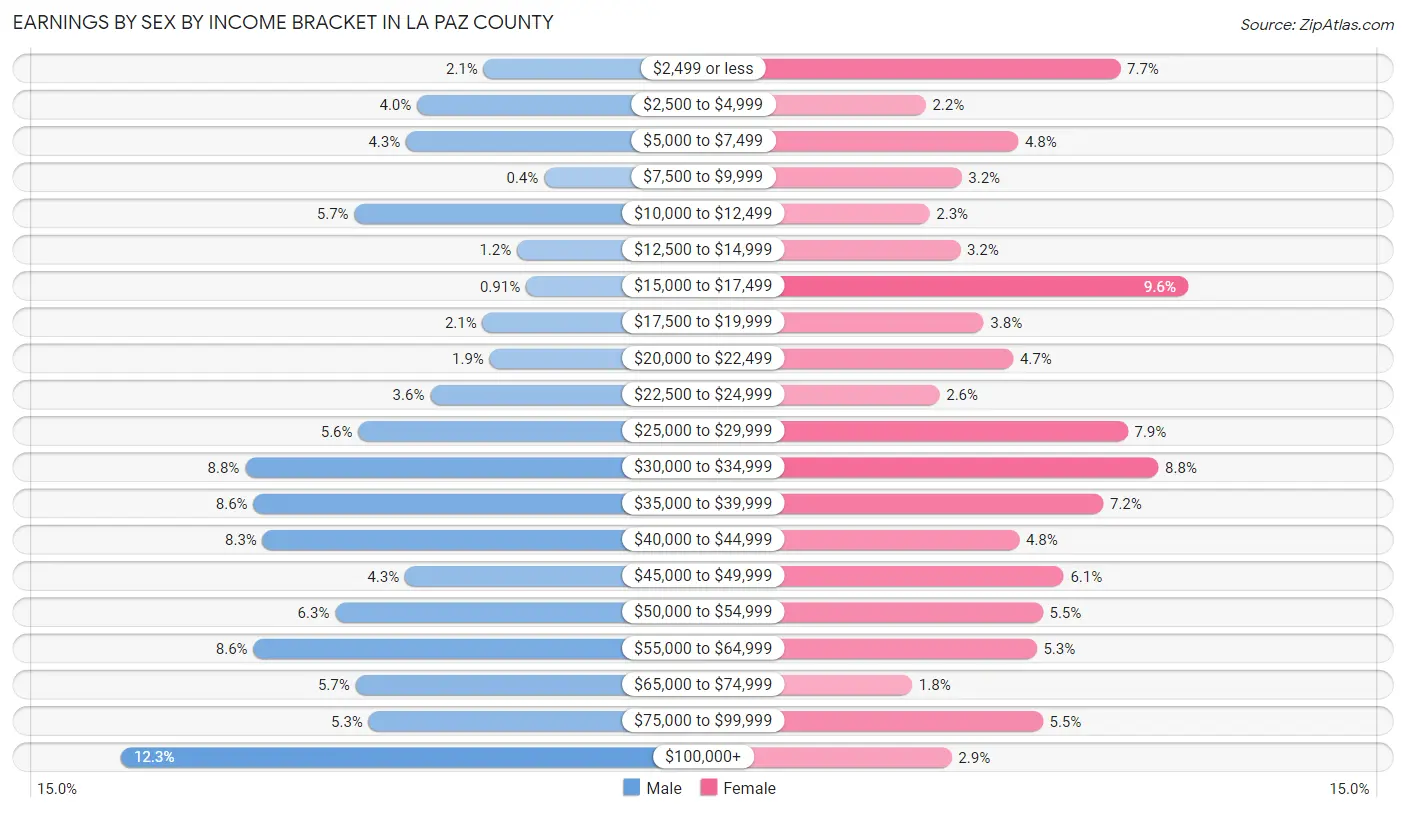
Earnings by Sex by Income Bracket in La Paz County
The most common earnings brackets in La Paz County are $100,000+ for men (433 | 12.3%) and $15,000 to $17,499 for women (277 | 9.6%).
| Income | Male | Female |
| $2,499 or less | 74 (2.1%) | 222 (7.7%) |
| $2,500 to $4,999 | 140 (4.0%) | 64 (2.2%) |
| $5,000 to $7,499 | 151 (4.3%) | 139 (4.8%) |
| $7,500 to $9,999 | 14 (0.4%) | 93 (3.2%) |
| $10,000 to $12,499 | 202 (5.7%) | 67 (2.3%) |
| $12,500 to $14,999 | 41 (1.2%) | 92 (3.2%) |
| $15,000 to $17,499 | 32 (0.9%) | 277 (9.6%) |
| $17,500 to $19,999 | 75 (2.1%) | 111 (3.8%) |
| $20,000 to $22,499 | 68 (1.9%) | 135 (4.7%) |
| $22,500 to $24,999 | 127 (3.6%) | 75 (2.6%) |
| $25,000 to $29,999 | 198 (5.6%) | 228 (7.9%) |
| $30,000 to $34,999 | 310 (8.8%) | 253 (8.7%) |
| $35,000 to $39,999 | 302 (8.6%) | 208 (7.2%) |
| $40,000 to $44,999 | 293 (8.3%) | 140 (4.8%) |
| $45,000 to $49,999 | 152 (4.3%) | 176 (6.1%) |
| $50,000 to $54,999 | 221 (6.3%) | 159 (5.5%) |
| $55,000 to $64,999 | 302 (8.6%) | 154 (5.3%) |
| $65,000 to $74,999 | 201 (5.7%) | 53 (1.8%) |
| $75,000 to $99,999 | 188 (5.3%) | 159 (5.5%) |
| $100,000+ | 433 (12.3%) | 85 (2.9%) |
| Total | 3,524 (100.0%) | 2,890 (100.0%) |
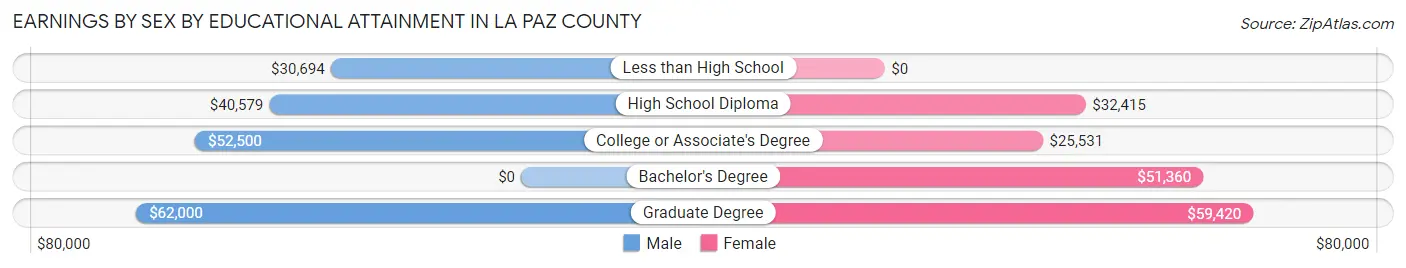
Earnings by Sex by Educational Attainment in La Paz County
Average earnings in La Paz County are $42,200 for men and $30,225 for women, a difference of 28.4%. Men with an educational attainment of graduate degree enjoy the highest average annual earnings of $62,000, while those with less than high school education earn the least with $30,694. Women with an educational attainment of graduate degree earn the most with the average annual earnings of $59,420, while those with college or associate's degree education have the smallest earnings of $25,531.
| Educational Attainment | Male Income | Female Income |
| Less than High School | $30,694 | $0 |
| High School Diploma | $40,579 | $32,415 |
| College or Associate's Degree | $52,500 | $25,531 |
| Bachelor's Degree | - | - |
| Graduate Degree | $62,000 | $59,420 |
| Total | $42,200 | $30,225 |
Family Income in La Paz County
Family Income Brackets in La Paz County
According to the La Paz County family income data, there are 1,268 families falling into the $50,000 to $74,999 income range, which is the most common income bracket and makes up 23.8% of all families. Conversely, the $10,000 to $14,999 income bracket is the least frequent group with only 53 families (1.0%) belonging to this category.
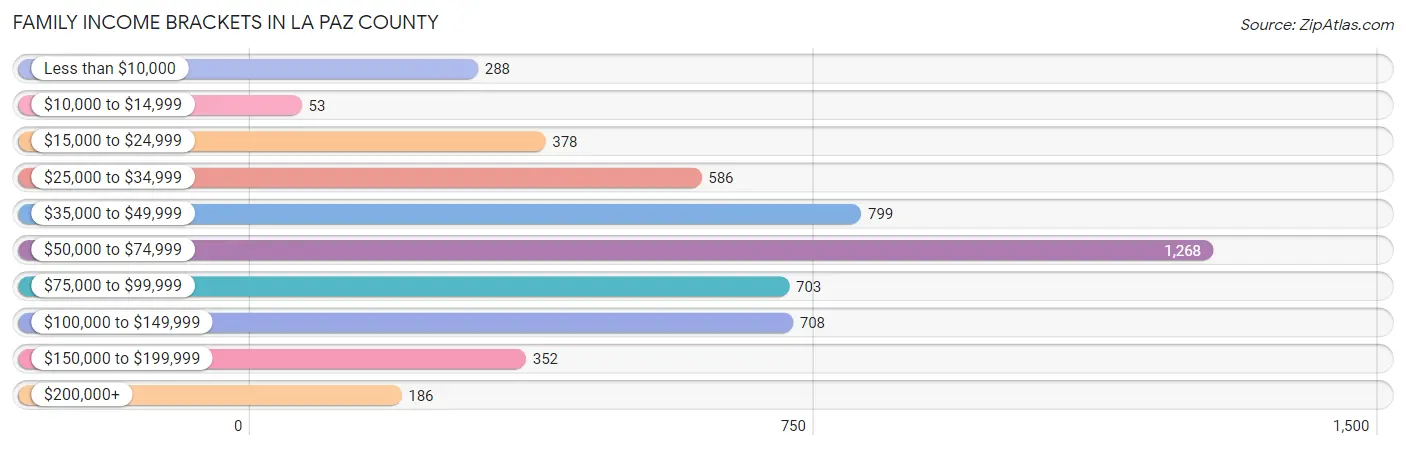
| Income Bracket | # Families | % Families |
| Less than $10,000 | 288 | 5.4% |
| $10,000 to $14,999 | 53 | 1.0% |
| $15,000 to $24,999 | 378 | 7.1% |
| $25,000 to $34,999 | 586 | 11.0% |
| $35,000 to $49,999 | 799 | 15.0% |
| $50,000 to $74,999 | 1,268 | 23.8% |
| $75,000 to $99,999 | 703 | 13.2% |
| $100,000 to $149,999 | 708 | 13.3% |
| $150,000 to $199,999 | 352 | 6.6% |
| $200,000+ | 186 | 3.5% |
Family Income by Famaliy Size in La Paz County
5-person families (306 | 5.8%) account for the highest median family income in La Paz County with $84,286 per family, while 2-person families (3,347 | 62.8%) have the highest median income of $29,046 per family member.
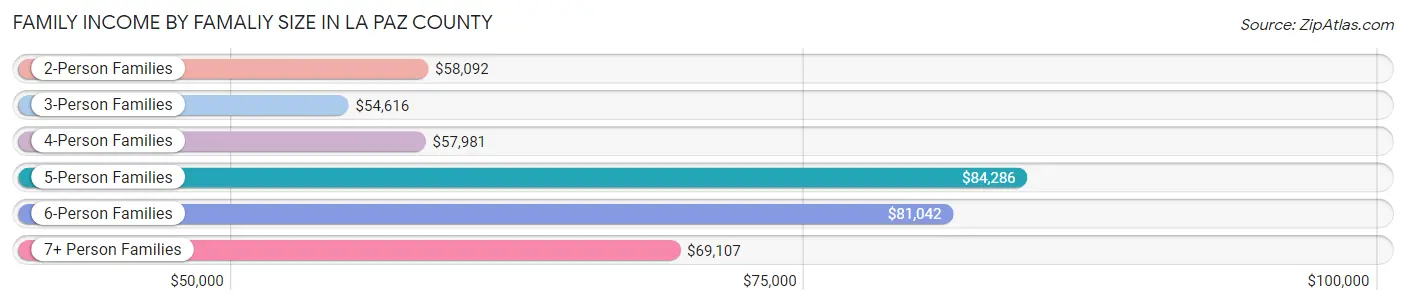
| Income Bracket | # Families | Median Income |
| 2-Person Families | 3,347 (62.8%) | $58,092 |
| 3-Person Families | 859 (16.1%) | $54,616 |
| 4-Person Families | 395 (7.4%) | $57,981 |
| 5-Person Families | 306 (5.8%) | $84,286 |
| 6-Person Families | 249 (4.7%) | $81,042 |
| 7+ Person Families | 170 (3.2%) | $69,107 |
| Total | 5,326 (100.0%) | $58,960 |
Family Income by Number of Earners in La Paz County
The median family income in La Paz County is $58,960, with families comprising 3+ earners (332) having the highest median family income of $126,667, while families with no earners (1,835) have the lowest median family income of $44,176, accounting for 6.2% and 34.4% of families, respectively.
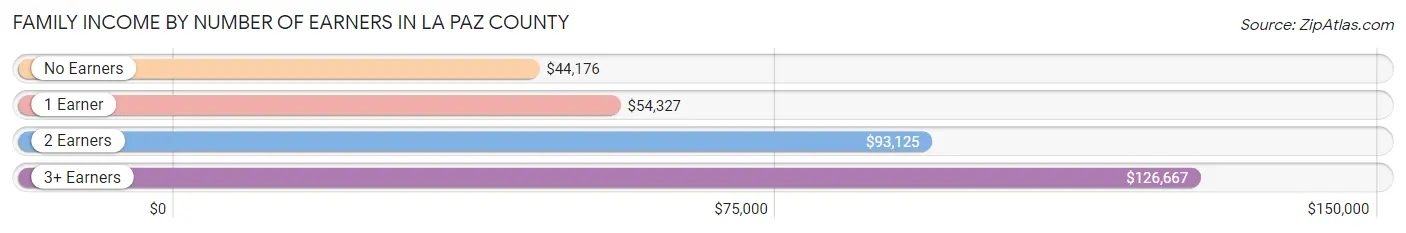
| Number of Earners | # Families | Median Income |
| No Earners | 1,835 (34.4%) | $44,176 |
| 1 Earner | 1,798 (33.8%) | $54,327 |
| 2 Earners | 1,361 (25.6%) | $93,125 |
| 3+ Earners | 332 (6.2%) | $126,667 |
| Total | 5,326 (100.0%) | $58,960 |
Household Income in La Paz County
Household Income Brackets in La Paz County
With 1,649 households falling in the category, the $50,000 to $74,999 income range is the most frequent in La Paz County, accounting for 18.5% of all households. In contrast, only 250 households (2.8%) fall into the $200,000+ income bracket, making it the least populous group.
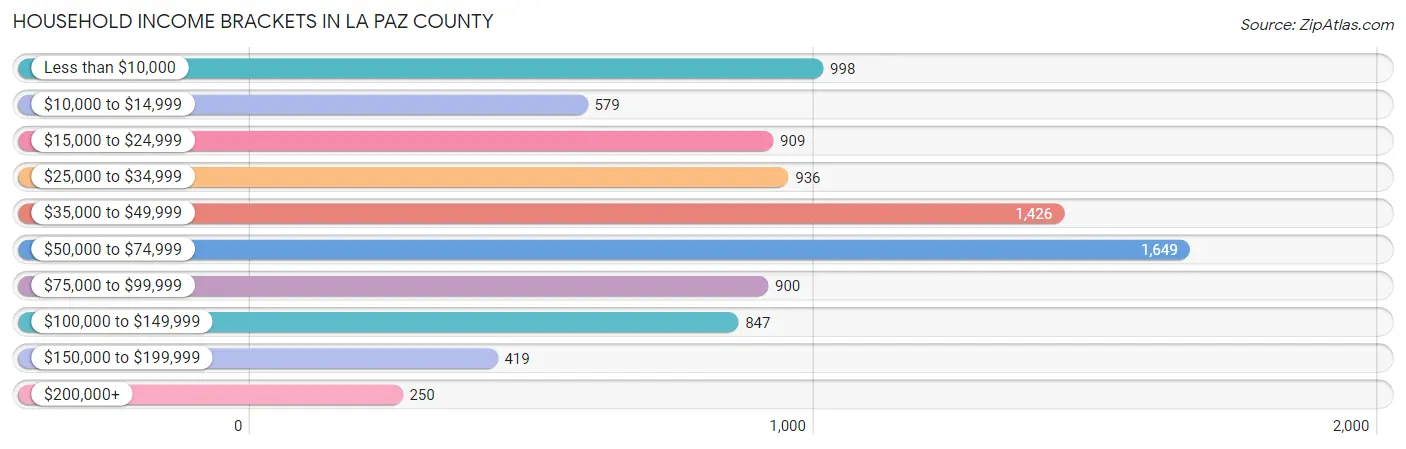
| Income Bracket | # Households | % Households |
| Less than $10,000 | 998 | 11.2% |
| $10,000 to $14,999 | 579 | 6.5% |
| $15,000 to $24,999 | 909 | 10.2% |
| $25,000 to $34,999 | 936 | 10.5% |
| $35,000 to $49,999 | 1,426 | 16.0% |
| $50,000 to $74,999 | 1,649 | 18.5% |
| $75,000 to $99,999 | 900 | 10.1% |
| $100,000 to $149,999 | 847 | 9.5% |
| $150,000 to $199,999 | 419 | 4.7% |
| $200,000+ | 250 | 2.8% |
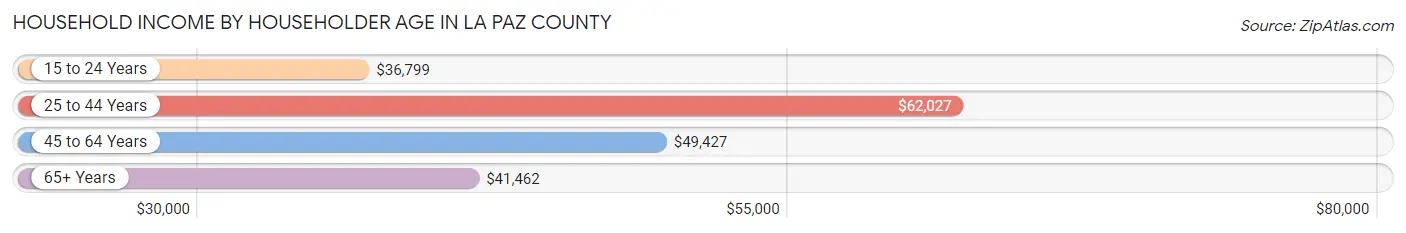
Household Income by Householder Age in La Paz County
The median household income in La Paz County is $46,634, with the highest median household income of $62,027 found in the 25 to 44 years age bracket for the primary householder. A total of 1,584 households (17.8%) fall into this category. Meanwhile, the 15 to 24 years age bracket for the primary householder has the lowest median household income of $36,799, with 460 households (5.2%) in this group.
| Income Bracket | # Households | Median Income |
| 15 to 24 Years | 460 (5.2%) | $36,799 |
| 25 to 44 Years | 1,584 (17.8%) | $62,027 |
| 45 to 64 Years | 2,307 (25.9%) | $49,427 |
| 65+ Years | 4,560 (51.2%) | $41,462 |
| Total | 8,911 (100.0%) | $46,634 |
Poverty in La Paz County
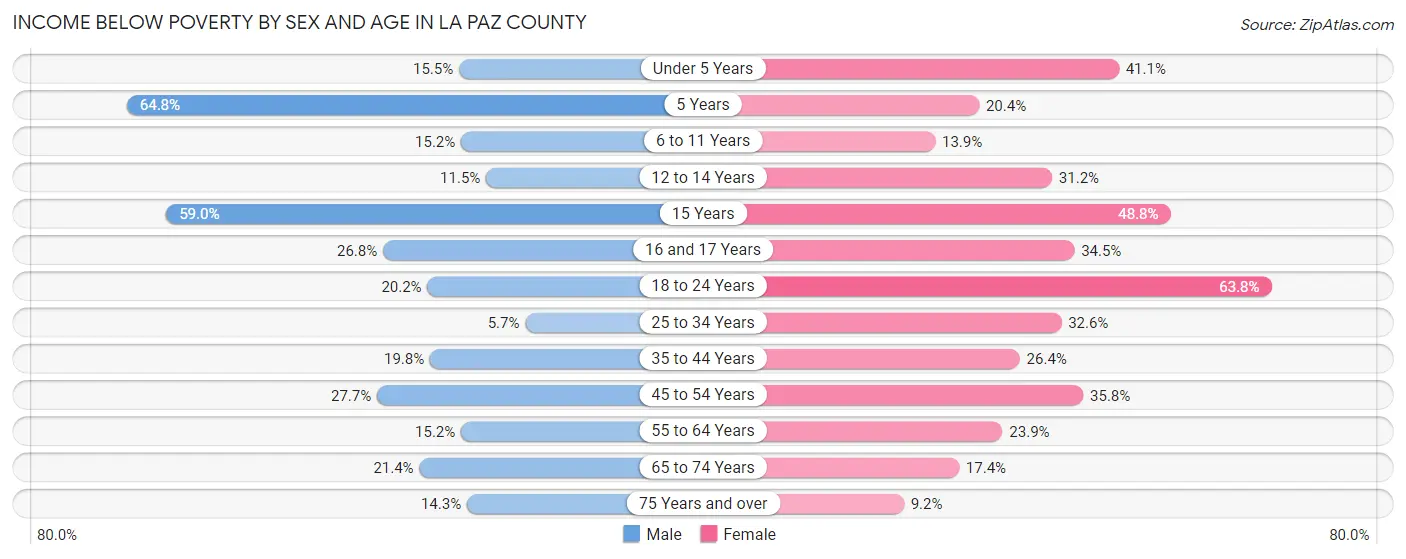
Income Below Poverty by Sex and Age in La Paz County
With 18.2% poverty level for males and 23.9% for females among the residents of La Paz County, 5 year old males and 18 to 24 year old females are the most vulnerable to poverty, with 35 males (64.8%) and 199 females (63.8%) in their respective age groups living below the poverty level.
| Age Bracket | Male | Female |
| Under 5 Years | 44 (15.5%) | 139 (41.1%) |
| 5 Years | 35 (64.8%) | 11 (20.4%) |
| 6 to 11 Years | 63 (15.2%) | 54 (13.9%) |
| 12 to 14 Years | 29 (11.5%) | 78 (31.2%) |
| 15 Years | 79 (59.0%) | 20 (48.8%) |
| 16 and 17 Years | 49 (26.8%) | 39 (34.5%) |
| 18 to 24 Years | 91 (20.2%) | 199 (63.8%) |
| 25 to 34 Years | 43 (5.7%) | 203 (32.6%) |
| 35 to 44 Years | 115 (19.8%) | 211 (26.4%) |
| 45 to 54 Years | 210 (27.7%) | 292 (35.8%) |
| 55 to 64 Years | 146 (15.2%) | 249 (23.8%) |
| 65 to 74 Years | 336 (21.4%) | 263 (17.4%) |
| 75 Years and over | 280 (14.3%) | 157 (9.2%) |
| Total | 1,520 (18.2%) | 1,915 (23.9%) |
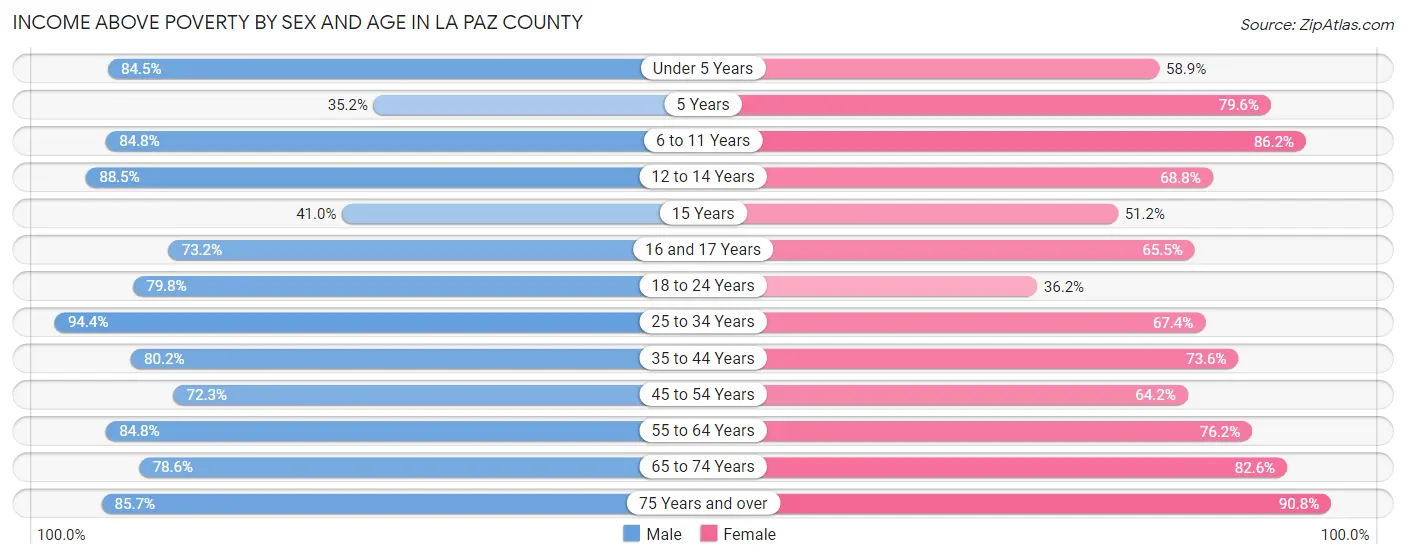
Income Above Poverty by Sex and Age in La Paz County
According to the poverty statistics in La Paz County, males aged 25 to 34 years and females aged 75 years and over are the age groups that are most secure financially, with 94.4% of males and 90.8% of females in these age groups living above the poverty line.
| Age Bracket | Male | Female |
| Under 5 Years | 240 (84.5%) | 199 (58.9%) |
| 5 Years | 19 (35.2%) | 43 (79.6%) |
| 6 to 11 Years | 352 (84.8%) | 336 (86.2%) |
| 12 to 14 Years | 224 (88.5%) | 172 (68.8%) |
| 15 Years | 55 (41.0%) | 21 (51.2%) |
| 16 and 17 Years | 134 (73.2%) | 74 (65.5%) |
| 18 to 24 Years | 360 (79.8%) | 113 (36.2%) |
| 25 to 34 Years | 718 (94.4%) | 420 (67.4%) |
| 35 to 44 Years | 466 (80.2%) | 588 (73.6%) |
| 45 to 54 Years | 549 (72.3%) | 523 (64.2%) |
| 55 to 64 Years | 816 (84.8%) | 795 (76.1%) |
| 65 to 74 Years | 1,236 (78.6%) | 1,249 (82.6%) |
| 75 Years and over | 1,676 (85.7%) | 1,551 (90.8%) |
| Total | 6,845 (81.8%) | 6,084 (76.1%) |
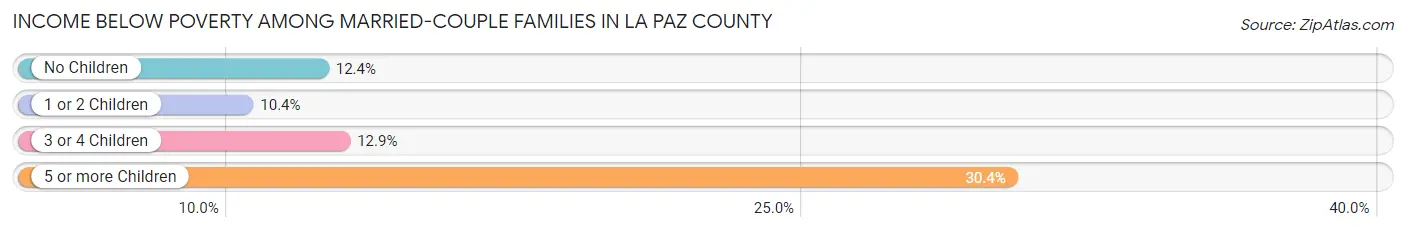
Income Below Poverty Among Married-Couple Families in La Paz County
The poverty statistics for married-couple families in La Paz County show that 12.4% or 474 of the total 3,809 families live below the poverty line. Families with 5 or more children have the highest poverty rate of 30.4%, comprising of 17 families. On the other hand, families with 1 or 2 children have the lowest poverty rate of 10.4%, which includes 47 families.
| Children | Above Poverty | Below Poverty |
| No Children | 2,635 (87.6%) | 372 (12.4%) |
| 1 or 2 Children | 405 (89.6%) | 47 (10.4%) |
| 3 or 4 Children | 256 (87.1%) | 38 (12.9%) |
| 5 or more Children | 39 (69.6%) | 17 (30.4%) |
| Total | 3,335 (87.6%) | 474 (12.4%) |
Income Below Poverty Among Single-Parent Households in La Paz County
According to the poverty data in La Paz County, 4.2% or 26 single-father households and 34.0% or 306 single-mother households are living below the poverty line. Among single-father households, those with 5 or more children have the highest poverty rate, with 16 households (88.9%) experiencing poverty. Likewise, among single-mother households, those with 1 or 2 children have the highest poverty rate, with 195 households (47.3%) falling below the poverty line.
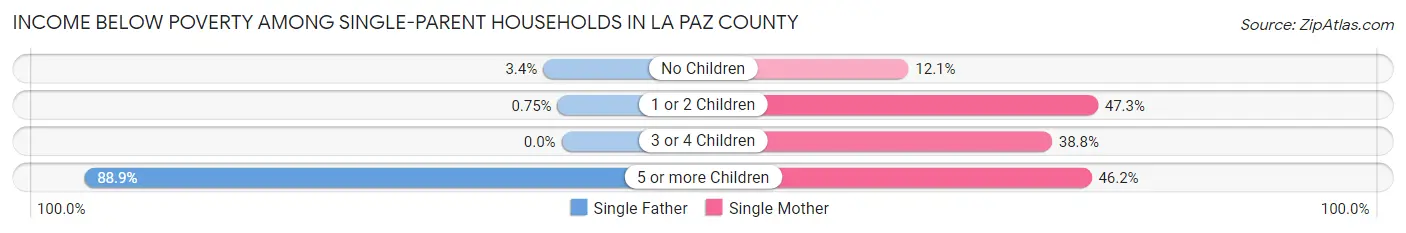
| Children | Single Father | Single Mother |
| No Children | 8 (3.4%) | 37 (12.0%) |
| 1 or 2 Children | 2 (0.7%) | 195 (47.3%) |
| 3 or 4 Children | 0 (0.0%) | 50 (38.8%) |
| 5 or more Children | 16 (88.9%) | 24 (46.2%) |
| Total | 26 (4.2%) | 306 (34.0%) |
Income Below Poverty Among Married-Couple vs Single-Parent Households in La Paz County
The poverty data for La Paz County shows that 474 of the married-couple family households (12.4%) and 332 of the single-parent households (21.9%) are living below the poverty level. Within the married-couple family households, those with 5 or more children have the highest poverty rate, with 17 households (30.4%) falling below the poverty line. Among the single-parent households, those with 5 or more children have the highest poverty rate, with 40 household (57.1%) living below poverty.
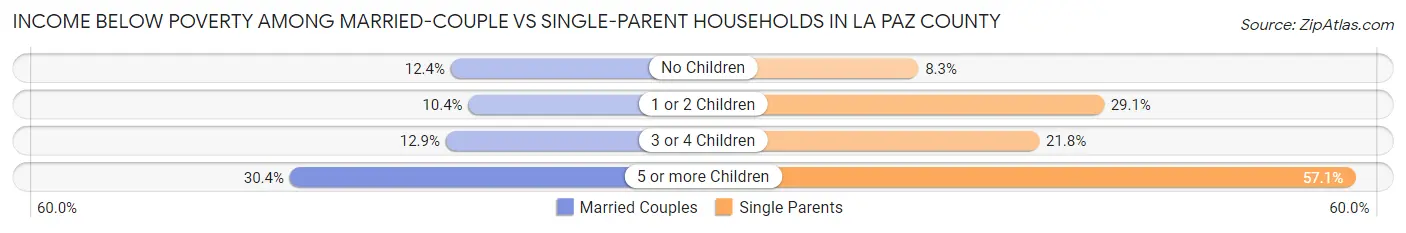
| Children | Married-Couple Families | Single-Parent Households |
| No Children | 372 (12.4%) | 45 (8.3%) |
| 1 or 2 Children | 47 (10.4%) | 197 (29.1%) |
| 3 or 4 Children | 38 (12.9%) | 50 (21.8%) |
| 5 or more Children | 17 (30.4%) | 40 (57.1%) |
| Total | 474 (12.4%) | 332 (21.9%) |
Race in La Paz County
The most populous races in La Paz County are White / Caucasian (10,593 | 63.5%), Hispanic or Latino (4,699 | 28.2%), and Native / Alaskan (2,516 | 15.1%).
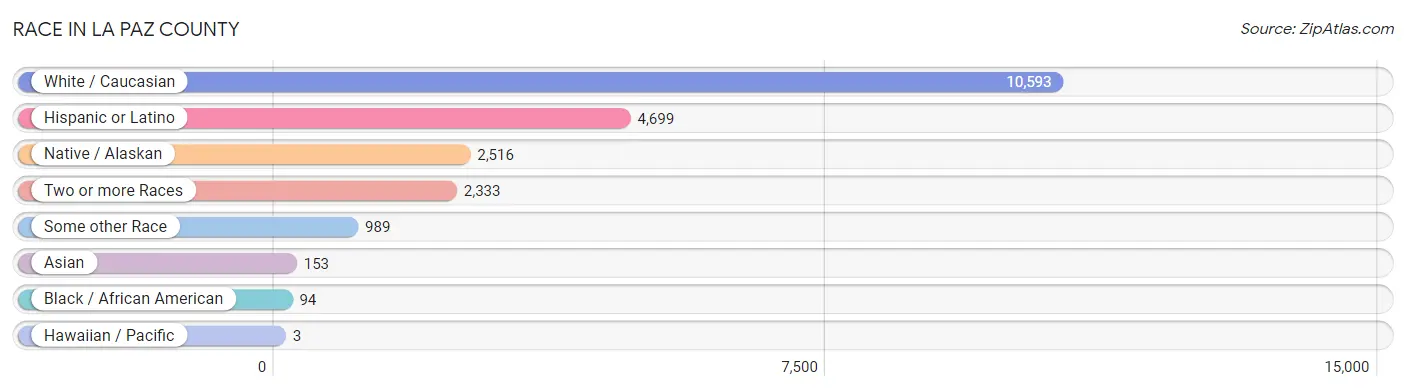
| Race | # Population | % Population |
| Asian | 153 | 0.9% |
| Black / African American | 94 | 0.6% |
| Hawaiian / Pacific | 3 | 0.0% |
| Hispanic or Latino | 4,699 | 28.2% |
| Native / Alaskan | 2,516 | 15.1% |
| White / Caucasian | 10,593 | 63.5% |
| Two or more Races | 2,333 | 14.0% |
| Some other Race | 989 | 5.9% |
| Total | 16,681 | 100.0% |
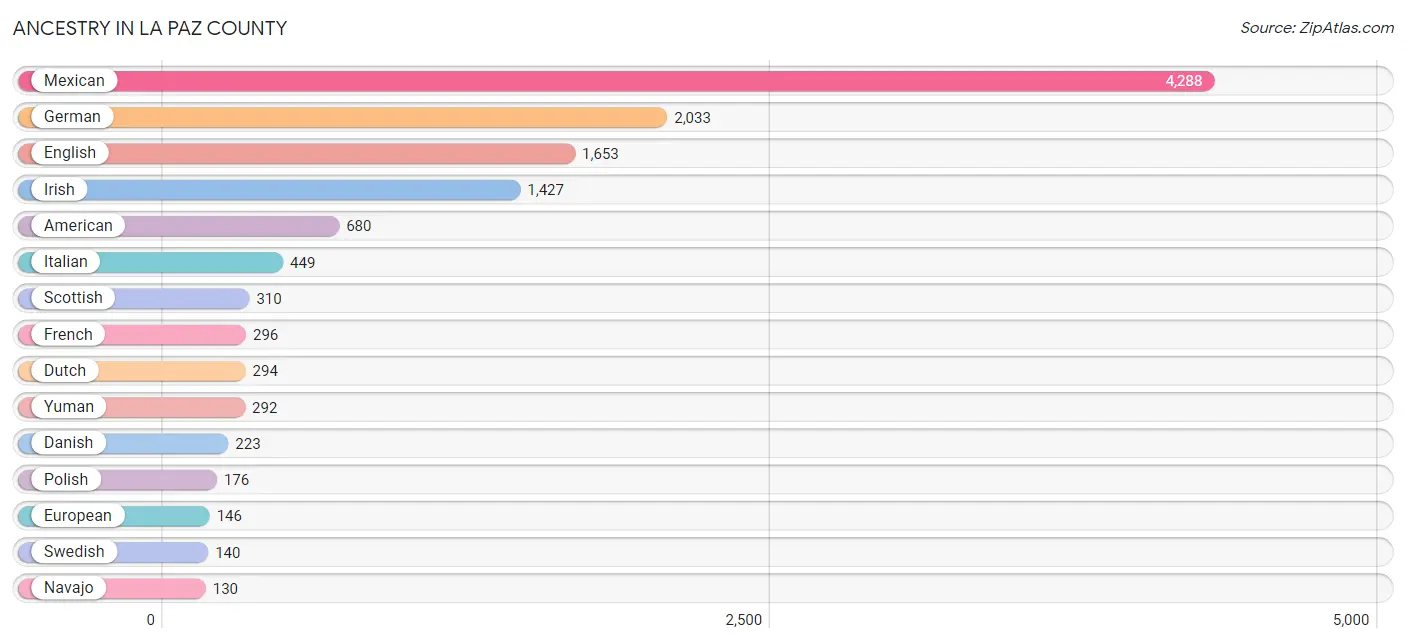
Ancestry in La Paz County
The most populous ancestries reported in La Paz County are Mexican (4,288 | 25.7%), German (2,033 | 12.2%), English (1,653 | 9.9%), Irish (1,427 | 8.6%), and American (680 | 4.1%), together accounting for 60.4% of all La Paz County residents.
| Ancestry | # Population | % Population |
| American | 680 | 4.1% |
| Arab | 8 | 0.1% |
| Argentinean | 25 | 0.2% |
| Armenian | 4 | 0.0% |
| Australian | 8 | 0.1% |
| Basque | 2 | 0.0% |
| Belgian | 2 | 0.0% |
| Bhutanese | 37 | 0.2% |
| Bolivian | 32 | 0.2% |
| British | 13 | 0.1% |
| Cajun | 4 | 0.0% |
| Canadian | 90 | 0.5% |
| Central American | 7 | 0.0% |
| Central American Indian | 14 | 0.1% |
| Cherokee | 62 | 0.4% |
| Chilean | 7 | 0.0% |
| Creek | 13 | 0.1% |
| Cuban | 49 | 0.3% |
| Czech | 22 | 0.1% |
| Czechoslovakian | 12 | 0.1% |
| Danish | 223 | 1.3% |
| Dutch | 294 | 1.8% |
| English | 1,653 | 9.9% |
| European | 146 | 0.9% |
| Finnish | 8 | 0.1% |
| French | 296 | 1.8% |
| French Canadian | 40 | 0.2% |
| German | 2,033 | 12.2% |
| Greek | 19 | 0.1% |
| Guamanian / Chamorro | 3 | 0.0% |
| Guatemalan | 7 | 0.0% |
| Hopi | 55 | 0.3% |
| Hungarian | 57 | 0.3% |
| Irish | 1,427 | 8.6% |
| Italian | 449 | 2.7% |
| Kiowa | 10 | 0.1% |
| Korean | 104 | 0.6% |
| Mexican | 4,288 | 25.7% |
| Mexican American Indian | 73 | 0.4% |
| Navajo | 130 | 0.8% |
| Northern European | 48 | 0.3% |
| Norwegian | 110 | 0.7% |
| Pima | 19 | 0.1% |
| Polish | 176 | 1.1% |
| Portuguese | 13 | 0.1% |
| Puerto Rican | 23 | 0.1% |
| Romanian | 14 | 0.1% |
| Russian | 23 | 0.1% |
| Scandinavian | 74 | 0.4% |
| Scotch-Irish | 63 | 0.4% |
| Scottish | 310 | 1.9% |
| Seminole | 10 | 0.1% |
| South American | 65 | 0.4% |
| South American Indian | 6 | 0.0% |
| Spaniard | 52 | 0.3% |
| Spanish | 119 | 0.7% |
| Subsaharan African | 10 | 0.1% |
| Swedish | 140 | 0.8% |
| Swiss | 33 | 0.2% |
| Syrian | 8 | 0.1% |
| Thai | 60 | 0.4% |
| Ukrainian | 50 | 0.3% |
| Venezuelan | 1 | 0.0% |
| Welsh | 66 | 0.4% |
| Yugoslavian | 1 | 0.0% |
| Yuman | 292 | 1.8% | View All 66 Rows |
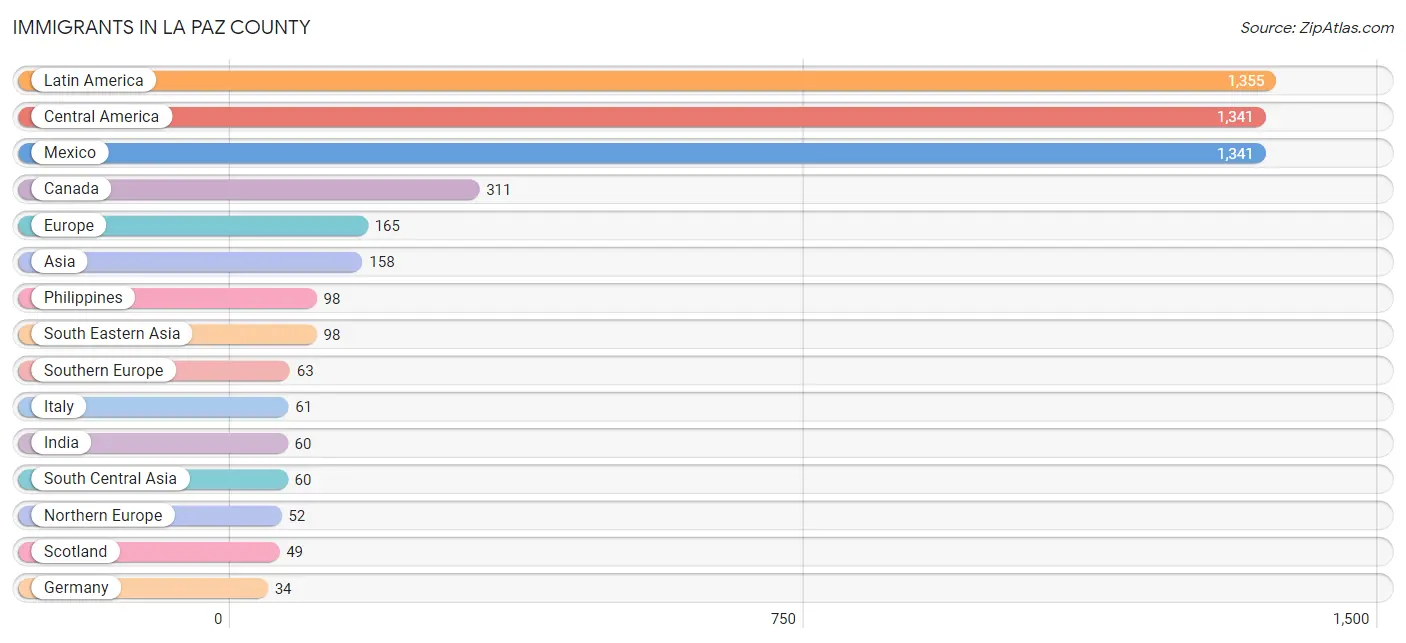
Immigrants in La Paz County
The most numerous immigrant groups reported in La Paz County came from Latin America (1,355 | 8.1%), Central America (1,341 | 8.0%), Mexico (1,341 | 8.0%), Canada (311 | 1.9%), and Europe (165 | 1.0%), together accounting for 27.1% of all La Paz County residents.
| Immigration Origin | # Population | % Population |
| Africa | 10 | 0.1% |
| Argentina | 13 | 0.1% |
| Asia | 158 | 0.9% |
| Australia | 8 | 0.1% |
| Canada | 311 | 1.9% |
| Central America | 1,341 | 8.0% |
| Eastern Europe | 16 | 0.1% |
| Europe | 165 | 1.0% |
| Germany | 34 | 0.2% |
| India | 60 | 0.4% |
| Italy | 61 | 0.4% |
| Latin America | 1,355 | 8.1% |
| Lithuania | 11 | 0.1% |
| Mexico | 1,341 | 8.0% |
| Northern Europe | 52 | 0.3% |
| Oceania | 8 | 0.1% |
| Philippines | 98 | 0.6% |
| Russia | 5 | 0.0% |
| Scotland | 49 | 0.3% |
| South America | 14 | 0.1% |
| South Central Asia | 60 | 0.4% |
| South Eastern Asia | 98 | 0.6% |
| Southern Europe | 63 | 0.4% |
| Spain | 2 | 0.0% |
| Venezuela | 1 | 0.0% |
| Western Africa | 10 | 0.1% |
| Western Europe | 34 | 0.2% | View All 27 Rows |
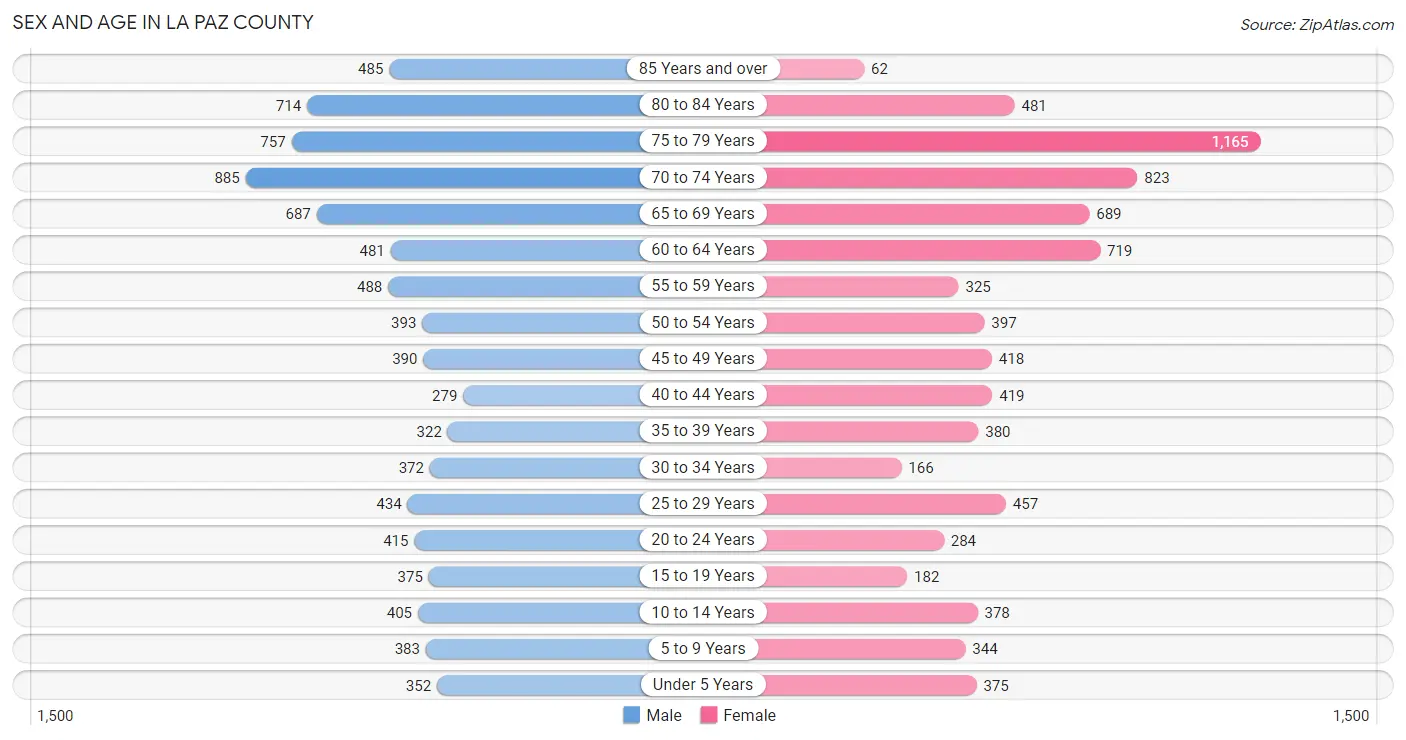
Sex and Age in La Paz County
Sex and Age in La Paz County
The most populous age groups in La Paz County are 70 to 74 Years (885 | 10.3%) for men and 75 to 79 Years (1,165 | 14.4%) for women.
| Age Bracket | Male | Female |
| Under 5 Years | 352 (4.1%) | 375 (4.6%) |
| 5 to 9 Years | 383 (4.4%) | 344 (4.3%) |
| 10 to 14 Years | 405 (4.7%) | 378 (4.7%) |
| 15 to 19 Years | 375 (4.3%) | 182 (2.3%) |
| 20 to 24 Years | 415 (4.8%) | 284 (3.5%) |
| 25 to 29 Years | 434 (5.0%) | 457 (5.7%) |
| 30 to 34 Years | 372 (4.3%) | 166 (2.1%) |
| 35 to 39 Years | 322 (3.7%) | 380 (4.7%) |
| 40 to 44 Years | 279 (3.2%) | 419 (5.2%) |
| 45 to 49 Years | 390 (4.5%) | 418 (5.2%) |
| 50 to 54 Years | 393 (4.6%) | 397 (4.9%) |
| 55 to 59 Years | 488 (5.7%) | 325 (4.0%) |
| 60 to 64 Years | 481 (5.6%) | 719 (8.9%) |
| 65 to 69 Years | 687 (8.0%) | 689 (8.5%) |
| 70 to 74 Years | 885 (10.3%) | 823 (10.2%) |
| 75 to 79 Years | 757 (8.8%) | 1,165 (14.4%) |
| 80 to 84 Years | 714 (8.3%) | 481 (6.0%) |
| 85 Years and over | 485 (5.6%) | 62 (0.8%) |
| Total | 8,617 (100.0%) | 8,064 (100.0%) |
Families and Households in La Paz County
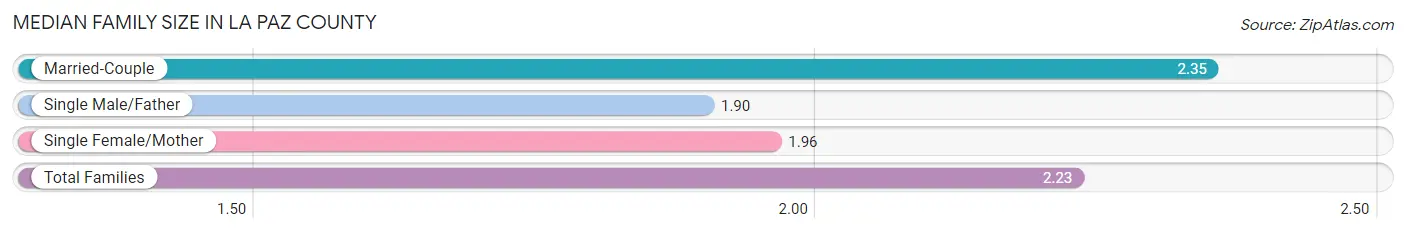
Median Family Size in La Paz County
The median family size in La Paz County is 2.23 persons per family, with married-couple families (3,809 | 71.5%) accounting for the largest median family size of 2.35 persons per family. On the other hand, single male/father families (617 | 11.6%) represent the smallest median family size with 1.90 persons per family.
| Family Type | # Families | Family Size |
| Married-Couple | 3,809 (71.5%) | 2.35 |
| Single Male/Father | 617 (11.6%) | 1.90 |
| Single Female/Mother | 900 (16.9%) | 1.96 |
| Total Families | 5,326 (100.0%) | 2.23 |
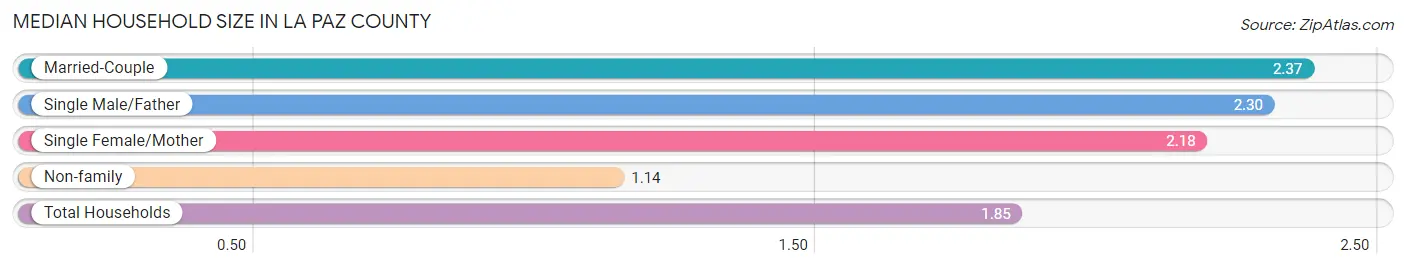
Median Household Size in La Paz County
The median household size in La Paz County is 1.85 persons per household, with married-couple households (3,809 | 42.7%) accounting for the largest median household size of 2.37 persons per household. non-family households (3,585 | 40.2%) represent the smallest median household size with 1.14 persons per household.
| Household Type | # Households | Household Size |
| Married-Couple | 3,809 (42.7%) | 2.37 |
| Single Male/Father | 617 (6.9%) | 2.30 |
| Single Female/Mother | 900 (10.1%) | 2.18 |
| Non-family | 3,585 (40.2%) | 1.14 |
| Total Households | 8,911 (100.0%) | 1.85 |
Household Size by Marriage Status in La Paz County
Out of a total of 8,911 households in La Paz County, 5,326 (59.8%) are family households, while 3,585 (40.2%) are nonfamily households. The most numerous type of family households are 2-person households, comprising 3,231, and the most common type of nonfamily households are 1-person households, comprising 3,048.
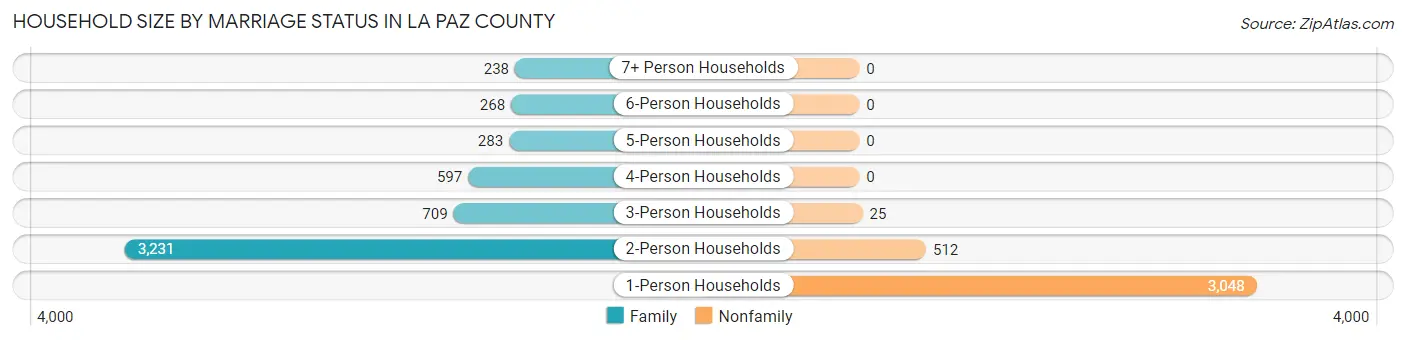
| Household Size | Family Households | Nonfamily Households |
| 1-Person Households | - | 3,048 (34.2%) |
| 2-Person Households | 3,231 (36.3%) | 512 (5.8%) |
| 3-Person Households | 709 (8.0%) | 25 (0.3%) |
| 4-Person Households | 597 (6.7%) | 0 (0.0%) |
| 5-Person Households | 283 (3.2%) | 0 (0.0%) |
| 6-Person Households | 268 (3.0%) | 0 (0.0%) |
| 7+ Person Households | 238 (2.7%) | 0 (0.0%) |
| Total | 5,326 (59.8%) | 3,585 (40.2%) |
Female Fertility in La Paz County
Fertility by Age in La Paz County
Average fertility rate in La Paz County is 78.0 births per 1,000 women. Women in the age bracket of 20 to 34 years have the highest fertility rate with 178.0 births per 1,000 women. Women in the age bracket of 20 to 34 years acount for 87.5% of all women with births.
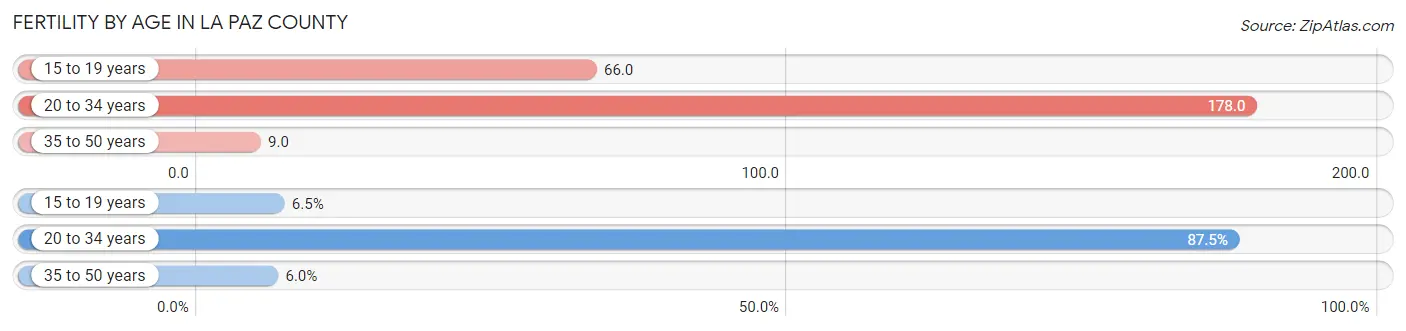
| Age Bracket | Women with Births | Births / 1,000 Women |
| 15 to 19 years | 12 (6.5%) | 66.0 |
| 20 to 34 years | 161 (87.5%) | 178.0 |
| 35 to 50 years | 11 (6.0%) | 9.0 |
| Total | 184 (100.0%) | 78.0 |
Fertility by Age by Marriage Status in La Paz County
45.7% of women with births (184) in La Paz County are married. The highest percentage of unmarried women with births falls into 15 to 19 years age bracket with 75.0% of them unmarried at the time of birth, while the lowest percentage of unmarried women with births belong to 35 to 50 years age bracket with 0.0% of them unmarried.
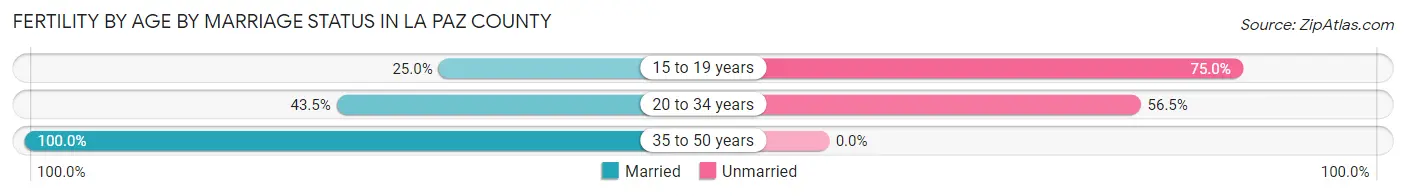
| Age Bracket | Married | Unmarried |
| 15 to 19 years | 3 (25.0%) | 9 (75.0%) |
| 20 to 34 years | 70 (43.5%) | 91 (56.5%) |
| 35 to 50 years | 11 (100.0%) | 0 (0.0%) |
| Total | 84 (45.7%) | 100 (54.3%) |
Fertility by Education in La Paz County

| Educational Attainment | Women with Births | Births / 1,000 Women |
| Less than High School | 9 (4.9%) | 17.0 |
| High School Diploma | 51 (27.7%) | 62.0 |
| College or Associate's Degree | 113 (61.4%) | 158.0 |
| Bachelor's Degree | 11 (6.0%) | 55.0 |
| Graduate Degree | 0 (0.0%) | 0.0 |
| Total | 184 (100.0%) | 78.0 |
Fertility by Education by Marriage Status in La Paz County
54.3% of women with births in La Paz County are unmarried. Women with the educational attainment of bachelor's degree are most likely to be married with 100.0% of them married at childbirth, while women with the educational attainment of less than high school are least likely to be married with 100.0% of them unmarried at childbirth.
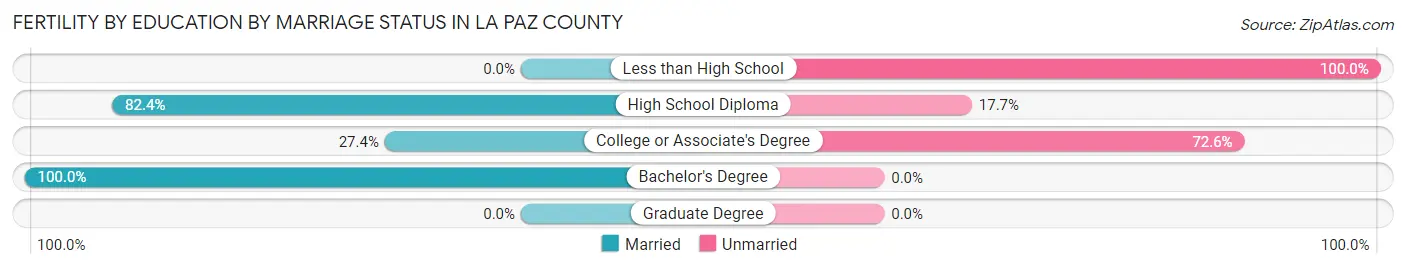
| Educational Attainment | Married | Unmarried |
| Less than High School | 0 (0.0%) | 9 (100.0%) |
| High School Diploma | 42 (82.4%) | 9 (17.6%) |
| College or Associate's Degree | 31 (27.4%) | 82 (72.6%) |
| Bachelor's Degree | 11 (100.0%) | 0 (0.0%) |
| Graduate Degree | 0 (0.0%) | 0 (0.0%) |
| Total | 84 (45.7%) | 100 (54.3%) |
Employment Characteristics in La Paz County
Employment by Class of Employer in La Paz County
Among the 5,410 employed individuals in La Paz County, private company employees (3,087 | 57.1%), local government employees (774 | 14.3%), and state government employees (399 | 7.4%) make up the most common classes of employment.
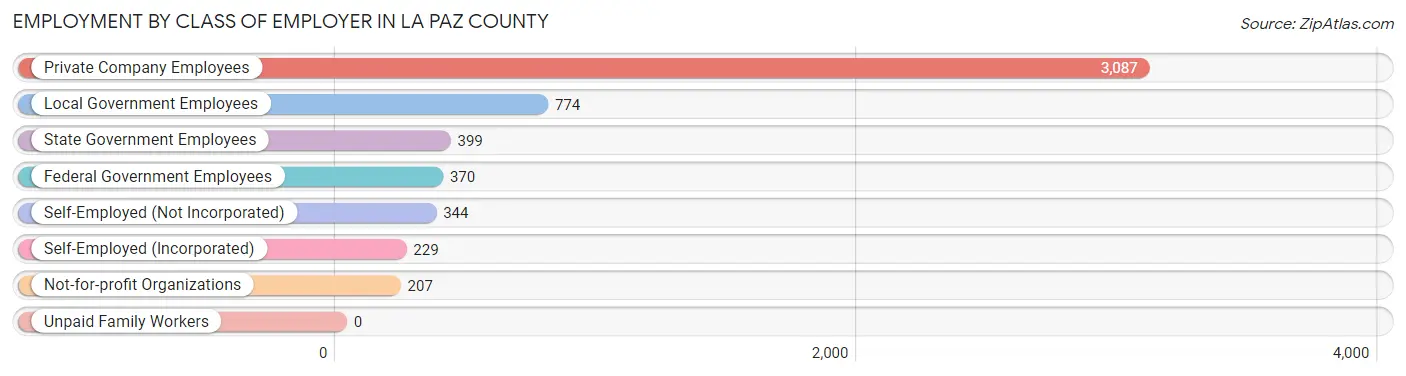
| Employer Class | # Employees | % Employees |
| Private Company Employees | 3,087 | 57.1% |
| Self-Employed (Incorporated) | 229 | 4.2% |
| Self-Employed (Not Incorporated) | 344 | 6.4% |
| Not-for-profit Organizations | 207 | 3.8% |
| Local Government Employees | 774 | 14.3% |
| State Government Employees | 399 | 7.4% |
| Federal Government Employees | 370 | 6.8% |
| Unpaid Family Workers | 0 | 0.0% |
| Total | 5,410 | 100.0% |
Employment Status by Age in La Paz County
According to the labor force statistics for La Paz County, out of the total population over 16 years of age (14,269), 43.0% or 6,136 individuals are in the labor force, with 10.7% or 657 of them unemployed. The age group with the highest labor force participation rate is 25 to 29 years, with 94.1% or 838 individuals in the labor force. Within the labor force, the 45 to 54 years age range has the highest percentage of unemployed individuals, with 23.0% or 285 of them being unemployed.
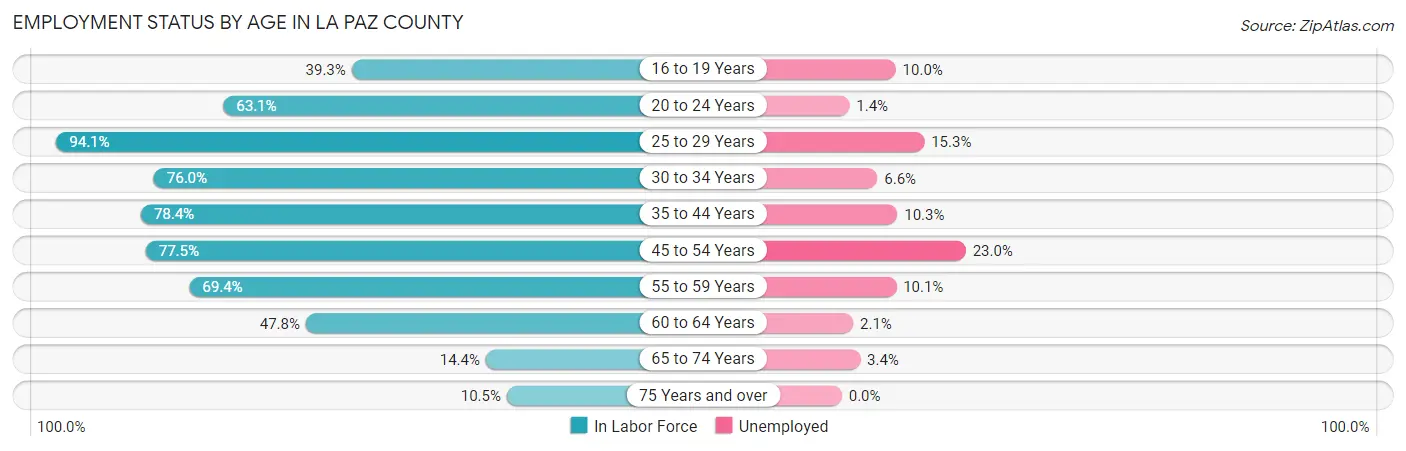
| Age Bracket | In Labor Force | Unemployed |
| 16 to 19 Years | 150 (39.3%) | 15 (10.0%) |
| 20 to 24 Years | 441 (63.1%) | 6 (1.4%) |
| 25 to 29 Years | 838 (94.1%) | 128 (15.3%) |
| 30 to 34 Years | 409 (76.0%) | 27 (6.6%) |
| 35 to 44 Years | 1,098 (78.4%) | 113 (10.3%) |
| 45 to 54 Years | 1,238 (77.5%) | 285 (23.0%) |
| 55 to 59 Years | 564 (69.4%) | 57 (10.1%) |
| 60 to 64 Years | 574 (47.8%) | 12 (2.1%) |
| 65 to 74 Years | 444 (14.4%) | 15 (3.4%) |
| 75 Years and over | 385 (10.5%) | 0 (0.0%) |
| Total | 6,136 (43.0%) | 657 (10.7%) |
Employment Status by Educational Attainment in La Paz County
According to labor force statistics for La Paz County, 73.3% of individuals (4,721) out of the total population between 25 and 64 years of age (6,440) are in the labor force, with 13.2% or 623 of them being unemployed. The group with the highest labor force participation rate are those with the educational attainment of bachelor's degree or higher, with 77.5% or 678 individuals in the labor force. Within the labor force, individuals with less than high school education have the highest percentage of unemployment, with 40.6% or 338 of them being unemployed.
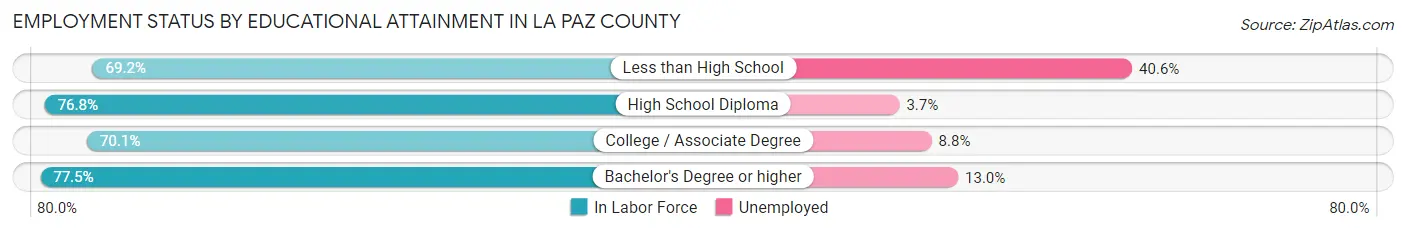
| Educational Attainment | In Labor Force | Unemployed |
| Less than High School | 832 (69.2%) | 488 (40.6%) |
| High School Diploma | 1,723 (76.8%) | 83 (3.7%) |
| College / Associate Degree | 1,485 (70.1%) | 186 (8.8%) |
| Bachelor's Degree or higher | 678 (77.5%) | 114 (13.0%) |
| Total | 4,721 (73.3%) | 850 (13.2%) |
Employment Occupations by Sex in La Paz County
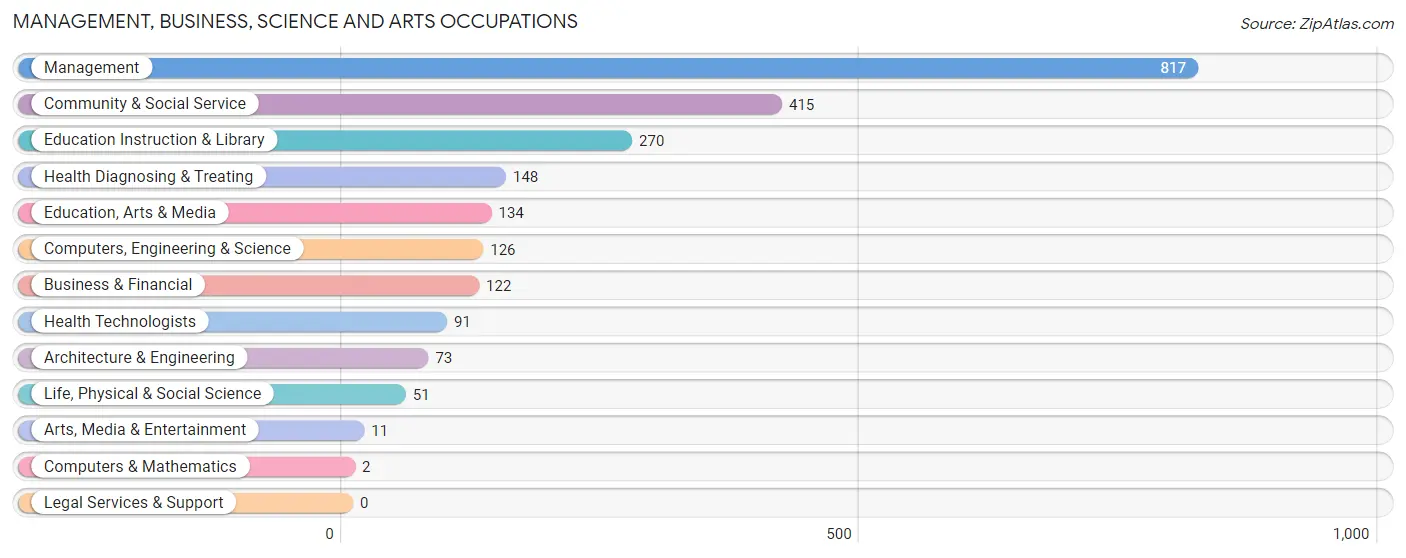
Management, Business, Science and Arts Occupations
The most common Management, Business, Science and Arts occupations in La Paz County are Management (817 | 14.9%), Community & Social Service (415 | 7.6%), Education Instruction & Library (270 | 4.9%), Health Diagnosing & Treating (148 | 2.7%), and Education, Arts & Media (134 | 2.5%).
Management, Business, Science and Arts Occupations by Sex
Within the Management, Business, Science and Arts occupations in La Paz County, the most male-oriented occupations are Computers & Mathematics (100.0%), Architecture & Engineering (91.8%), and Computers, Engineering & Science (80.9%), while the most female-oriented occupations are Arts, Media & Entertainment (90.9%), Business & Financial (79.5%), and Health Diagnosing & Treating (70.3%).
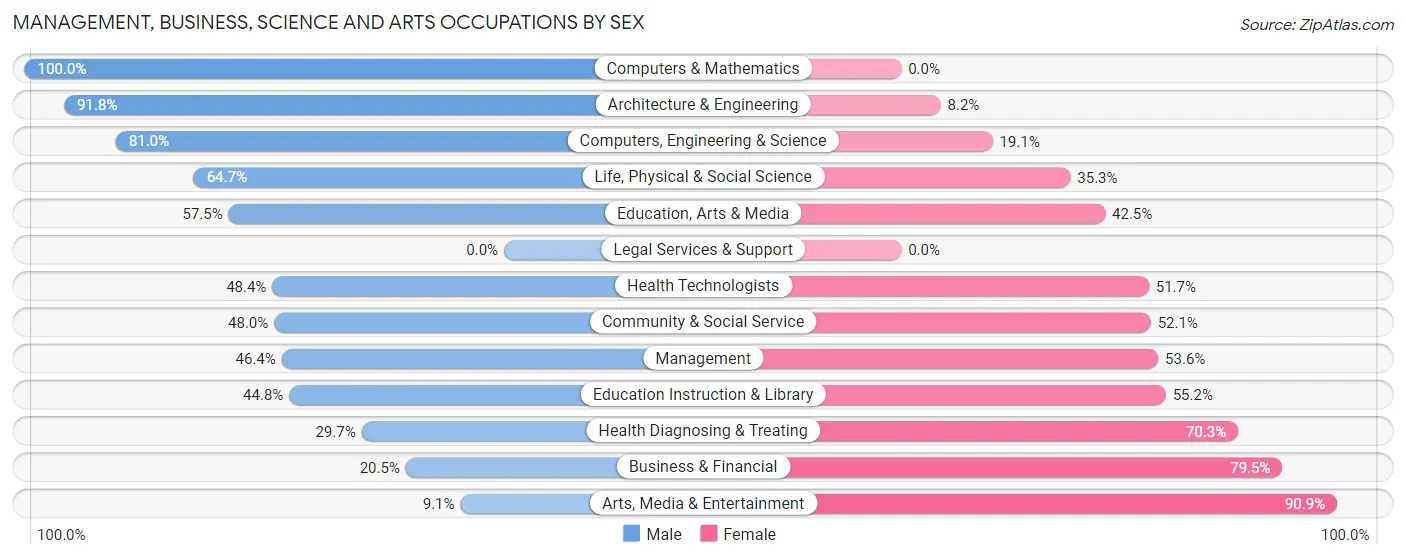
| Occupation | Male | Female |
| Management | 379 (46.4%) | 438 (53.6%) |
| Business & Financial | 25 (20.5%) | 97 (79.5%) |
| Computers, Engineering & Science | 102 (80.9%) | 24 (19.1%) |
| Computers & Mathematics | 2 (100.0%) | 0 (0.0%) |
| Architecture & Engineering | 67 (91.8%) | 6 (8.2%) |
| Life, Physical & Social Science | 33 (64.7%) | 18 (35.3%) |
| Community & Social Service | 199 (47.9%) | 216 (52.0%) |
| Education, Arts & Media | 77 (57.5%) | 57 (42.5%) |
| Legal Services & Support | 0 (0.0%) | 0 (0.0%) |
| Education Instruction & Library | 121 (44.8%) | 149 (55.2%) |
| Arts, Media & Entertainment | 1 (9.1%) | 10 (90.9%) |
| Health Diagnosing & Treating | 44 (29.7%) | 104 (70.3%) |
| Health Technologists | 44 (48.3%) | 47 (51.6%) |
| Total (Category) | 749 (46.0%) | 879 (54.0%) |
| Total (Overall) | 3,021 (55.3%) | 2,446 (44.7%) |
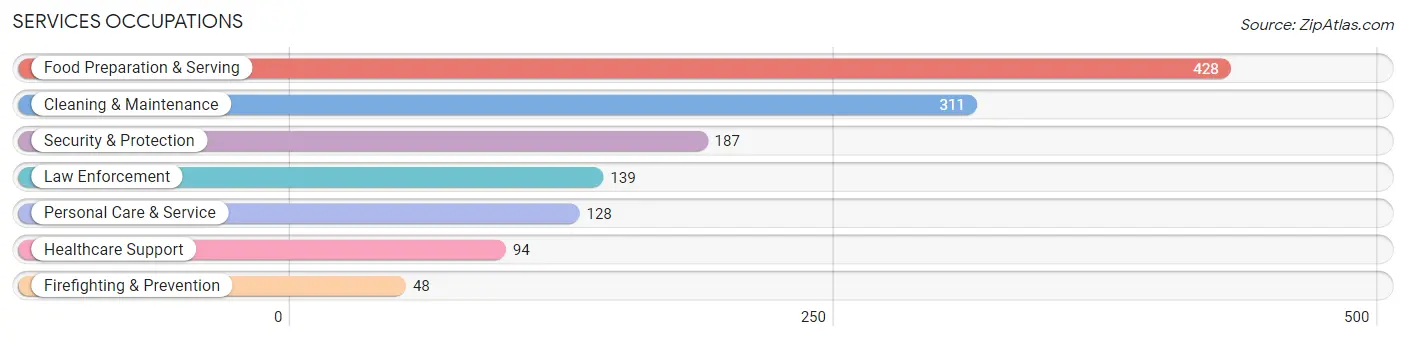
Services Occupations
The most common Services occupations in La Paz County are Food Preparation & Serving (428 | 7.8%), Cleaning & Maintenance (311 | 5.7%), Security & Protection (187 | 3.4%), Law Enforcement (139 | 2.5%), and Personal Care & Service (128 | 2.3%).
Services Occupations by Sex
Within the Services occupations in La Paz County, the most male-oriented occupations are Cleaning & Maintenance (81.7%), Law Enforcement (79.9%), and Security & Protection (62.6%), while the most female-oriented occupations are Firefighting & Prevention (87.5%), Healthcare Support (81.9%), and Food Preparation & Serving (72.7%).
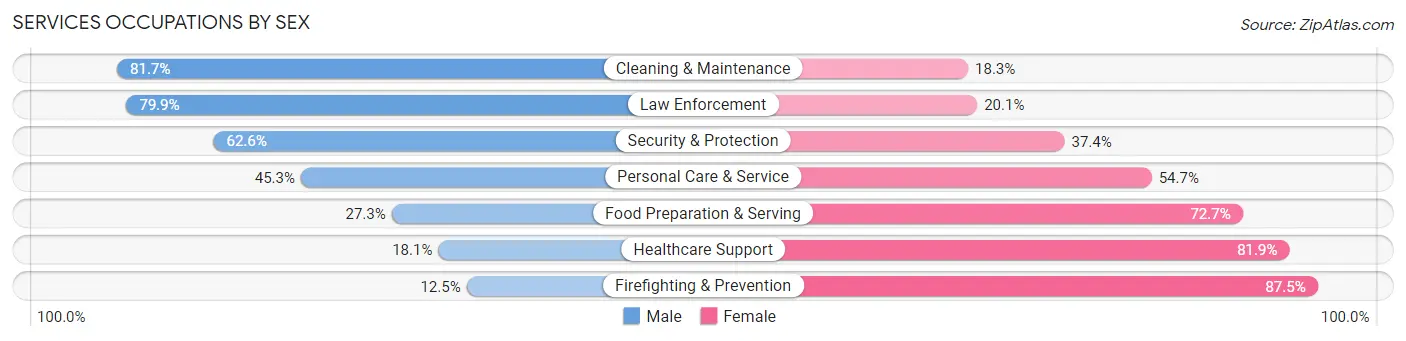
| Occupation | Male | Female |
| Healthcare Support | 17 (18.1%) | 77 (81.9%) |
| Security & Protection | 117 (62.6%) | 70 (37.4%) |
| Firefighting & Prevention | 6 (12.5%) | 42 (87.5%) |
| Law Enforcement | 111 (79.9%) | 28 (20.1%) |
| Food Preparation & Serving | 117 (27.3%) | 311 (72.7%) |
| Cleaning & Maintenance | 254 (81.7%) | 57 (18.3%) |
| Personal Care & Service | 58 (45.3%) | 70 (54.7%) |
| Total (Category) | 563 (49.0%) | 585 (51.0%) |
| Total (Overall) | 3,021 (55.3%) | 2,446 (44.7%) |
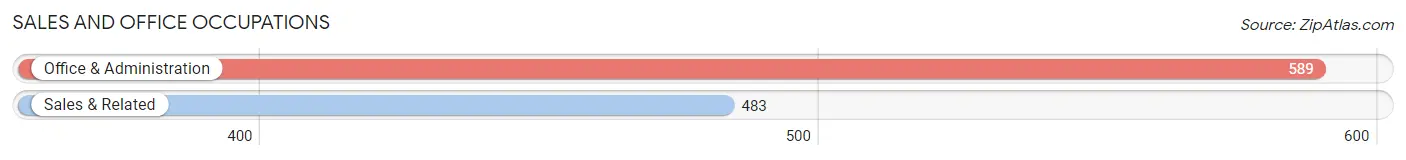
Sales and Office Occupations
The most common Sales and Office occupations in La Paz County are Office & Administration (589 | 10.8%), and Sales & Related (483 | 8.8%).
Sales and Office Occupations by Sex
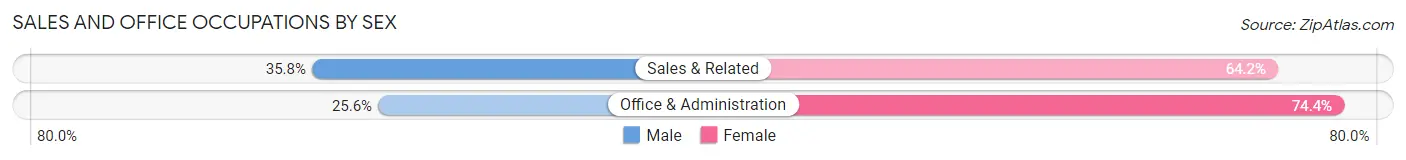
| Occupation | Male | Female |
| Sales & Related | 173 (35.8%) | 310 (64.2%) |
| Office & Administration | 151 (25.6%) | 438 (74.4%) |
| Total (Category) | 324 (30.2%) | 748 (69.8%) |
| Total (Overall) | 3,021 (55.3%) | 2,446 (44.7%) |
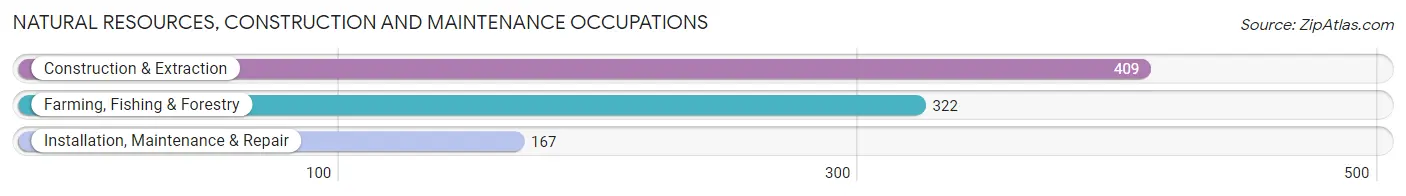
Natural Resources, Construction and Maintenance Occupations
The most common Natural Resources, Construction and Maintenance occupations in La Paz County are Construction & Extraction (409 | 7.5%), Farming, Fishing & Forestry (322 | 5.9%), and Installation, Maintenance & Repair (167 | 3.0%).
Natural Resources, Construction and Maintenance Occupations by Sex
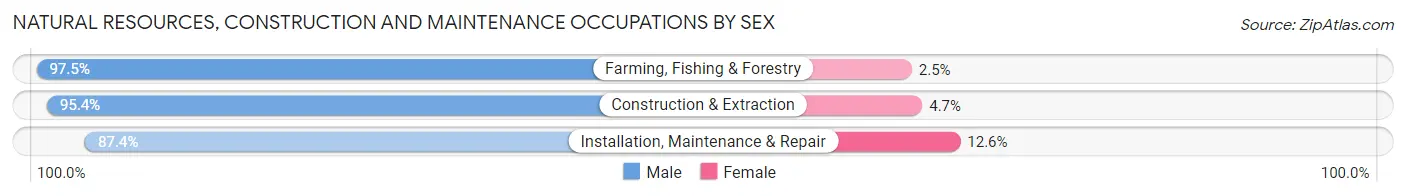
| Occupation | Male | Female |
| Farming, Fishing & Forestry | 314 (97.5%) | 8 (2.5%) |
| Construction & Extraction | 390 (95.4%) | 19 (4.6%) |
| Installation, Maintenance & Repair | 146 (87.4%) | 21 (12.6%) |
| Total (Category) | 850 (94.7%) | 48 (5.3%) |
| Total (Overall) | 3,021 (55.3%) | 2,446 (44.7%) |
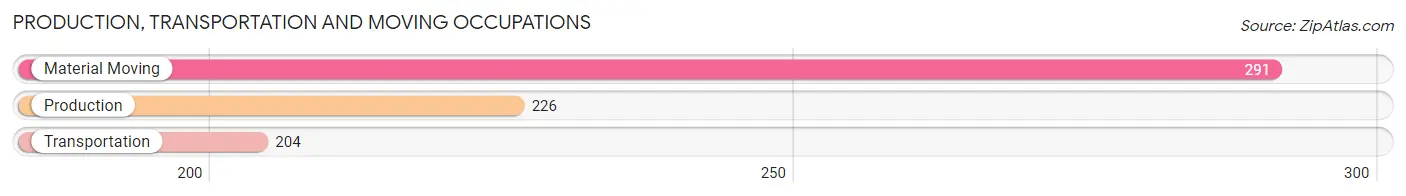
Production, Transportation and Moving Occupations
The most common Production, Transportation and Moving occupations in La Paz County are Material Moving (291 | 5.3%), Production (226 | 4.1%), and Transportation (204 | 3.7%).
Production, Transportation and Moving Occupations by Sex
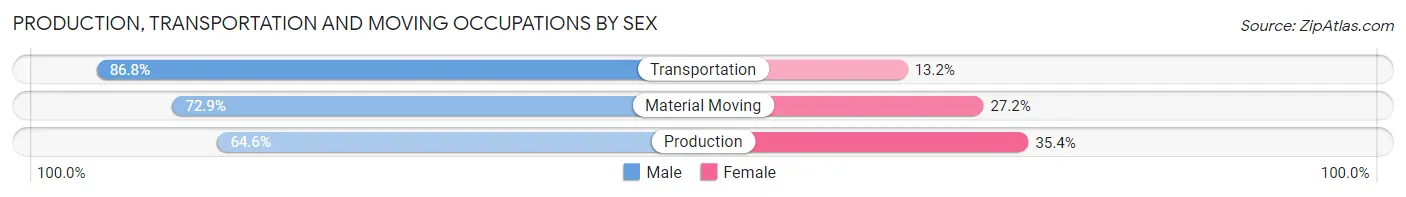
| Occupation | Male | Female |
| Production | 146 (64.6%) | 80 (35.4%) |
| Transportation | 177 (86.8%) | 27 (13.2%) |
| Material Moving | 212 (72.9%) | 79 (27.2%) |
| Total (Category) | 535 (74.2%) | 186 (25.8%) |
| Total (Overall) | 3,021 (55.3%) | 2,446 (44.7%) |
Employment Industries by Sex in La Paz County
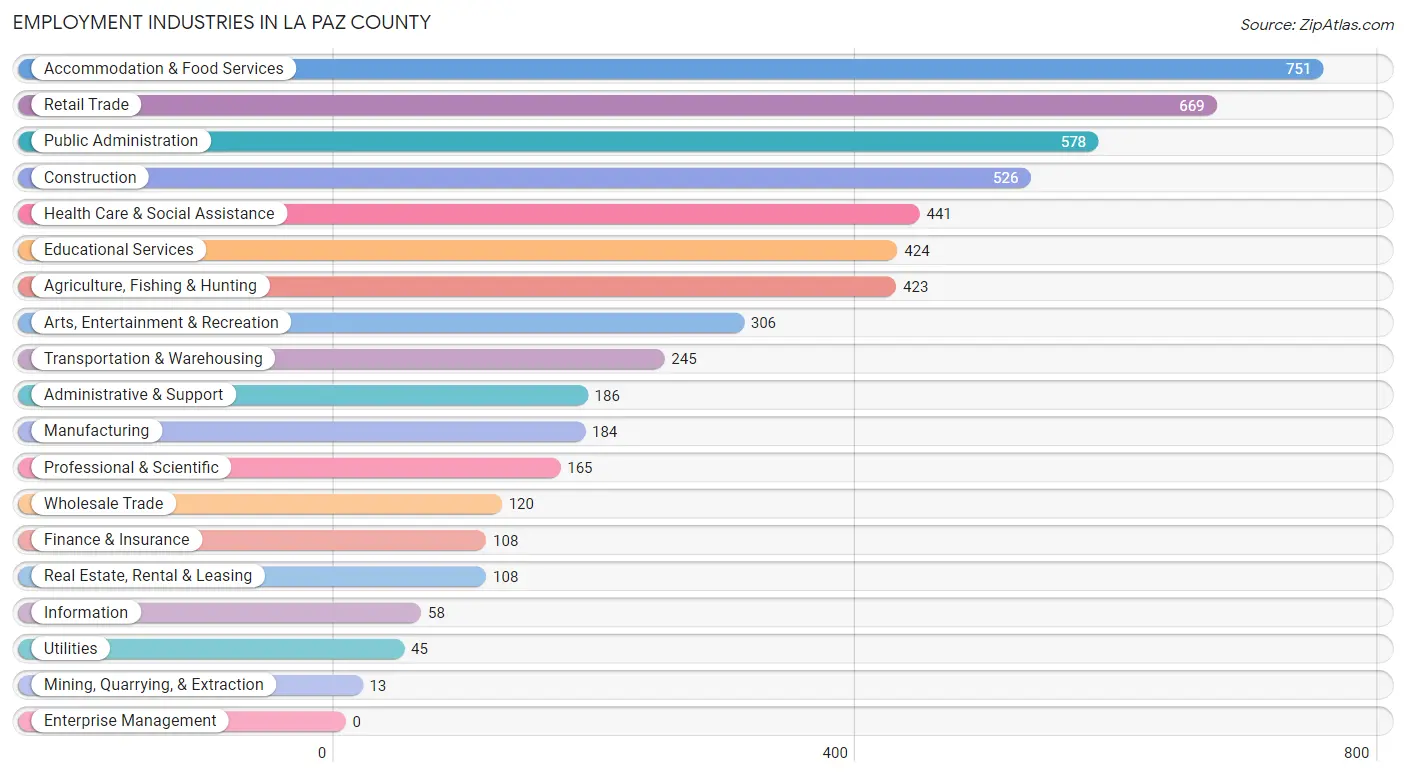
Employment Industries in La Paz County
The major employment industries in La Paz County include Accommodation & Food Services (751 | 13.7%), Retail Trade (669 | 12.2%), Public Administration (578 | 10.6%), Construction (526 | 9.6%), and Health Care & Social Assistance (441 | 8.1%).
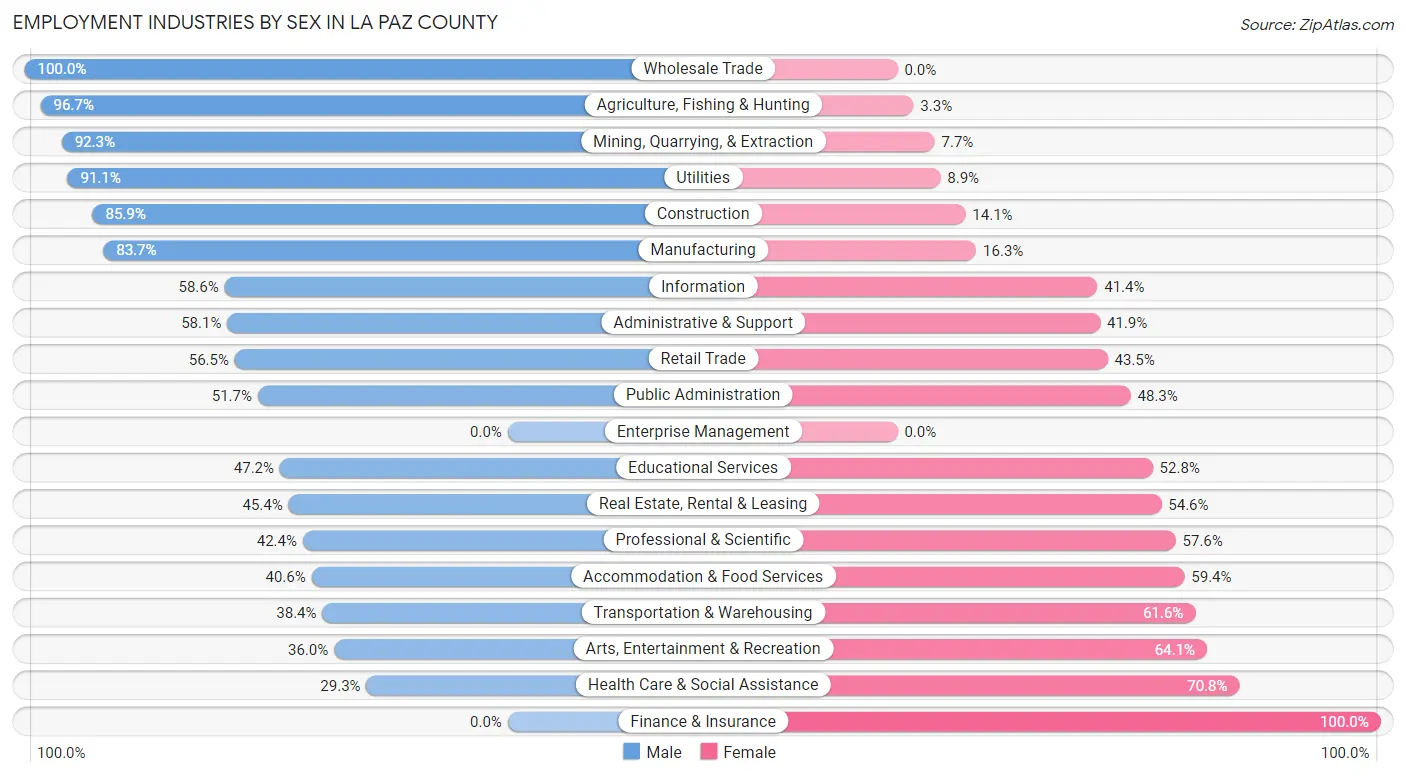
Employment Industries by Sex in La Paz County
The La Paz County industries that see more men than women are Wholesale Trade (100.0%), Agriculture, Fishing & Hunting (96.7%), and Mining, Quarrying, & Extraction (92.3%), whereas the industries that tend to have a higher number of women are Finance & Insurance (100.0%), Health Care & Social Assistance (70.8%), and Arts, Entertainment & Recreation (64.0%).
| Industry | Male | Female |
| Agriculture, Fishing & Hunting | 409 (96.7%) | 14 (3.3%) |
| Mining, Quarrying, & Extraction | 12 (92.3%) | 1 (7.7%) |
| Construction | 452 (85.9%) | 74 (14.1%) |
| Manufacturing | 154 (83.7%) | 30 (16.3%) |
| Wholesale Trade | 120 (100.0%) | 0 (0.0%) |
| Retail Trade | 378 (56.5%) | 291 (43.5%) |
| Transportation & Warehousing | 94 (38.4%) | 151 (61.6%) |
| Utilities | 41 (91.1%) | 4 (8.9%) |
| Information | 34 (58.6%) | 24 (41.4%) |
| Finance & Insurance | 0 (0.0%) | 108 (100.0%) |
| Real Estate, Rental & Leasing | 49 (45.4%) | 59 (54.6%) |
| Professional & Scientific | 70 (42.4%) | 95 (57.6%) |
| Enterprise Management | 0 (0.0%) | 0 (0.0%) |
| Administrative & Support | 108 (58.1%) | 78 (41.9%) |
| Educational Services | 200 (47.2%) | 224 (52.8%) |
| Health Care & Social Assistance | 129 (29.2%) | 312 (70.8%) |
| Arts, Entertainment & Recreation | 110 (35.9%) | 196 (64.0%) |
| Accommodation & Food Services | 305 (40.6%) | 446 (59.4%) |
| Public Administration | 299 (51.7%) | 279 (48.3%) |
| Total | 3,021 (55.3%) | 2,446 (44.7%) |
Education in La Paz County
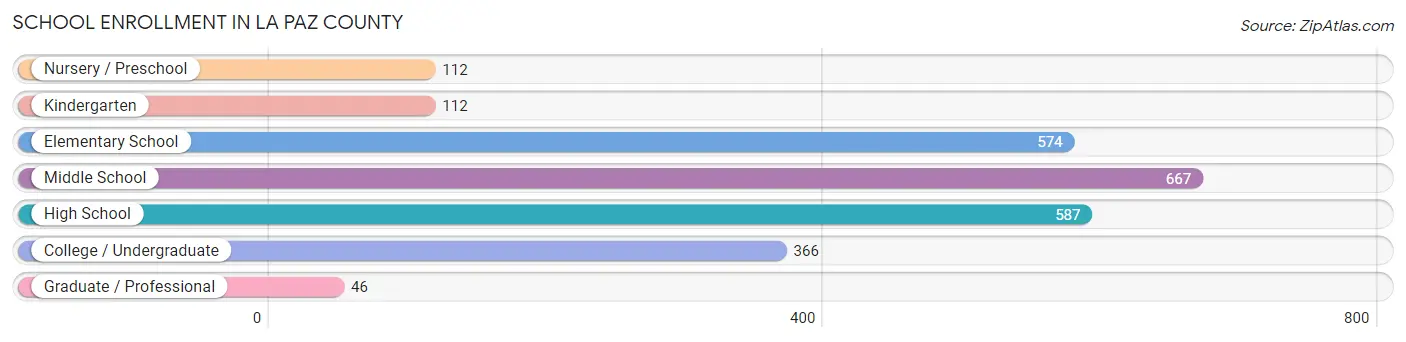
School Enrollment in La Paz County
The most common levels of schooling among the 2,464 students in La Paz County are middle school (667 | 27.1%), high school (587 | 23.8%), and elementary school (574 | 23.3%).
| School Level | # Students | % Students |
| Nursery / Preschool | 112 | 4.5% |
| Kindergarten | 112 | 4.5% |
| Elementary School | 574 | 23.3% |
| Middle School | 667 | 27.1% |
| High School | 587 | 23.8% |
| College / Undergraduate | 366 | 14.8% |
| Graduate / Professional | 46 | 1.9% |
| Total | 2,464 | 100.0% |
School Enrollment by Age by Funding Source in La Paz County
Out of a total of 2,464 students who are enrolled in schools in La Paz County, 239 (9.7%) attend a private institution, while the remaining 2,225 (90.3%) are enrolled in public schools. The age group of 35 years and over has the highest likelihood of being enrolled in private schools, with 41 (42.3% in the age bracket) enrolled. Conversely, the age group of 20 to 24 year olds has the lowest likelihood of being enrolled in a private school, with 138 (100.0% in the age bracket) attending a public institution.
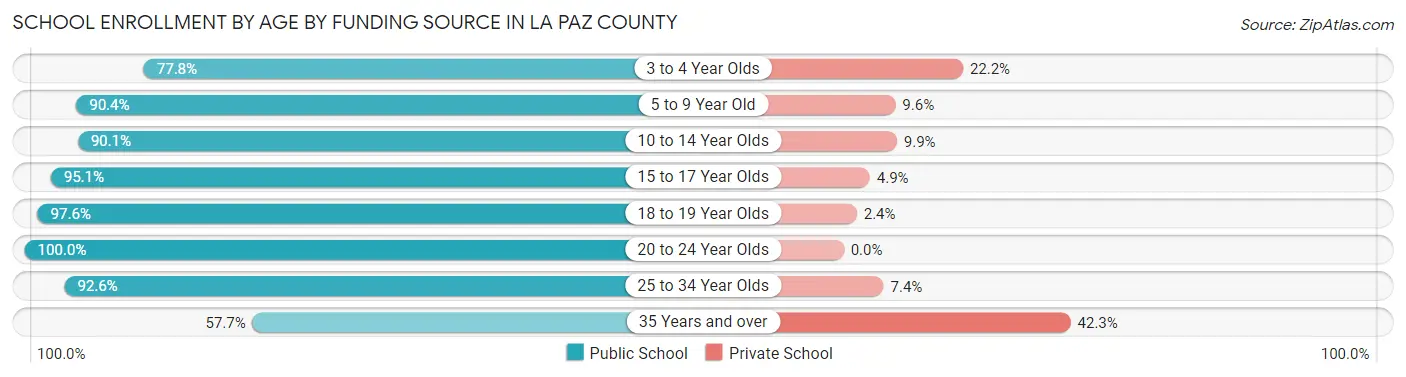
| Age Bracket | Public School | Private School |
| 3 to 4 Year Olds | 70 (77.8%) | 20 (22.2%) |
| 5 to 9 Year Old | 609 (90.4%) | 65 (9.6%) |
| 10 to 14 Year Olds | 701 (90.1%) | 77 (9.9%) |
| 15 to 17 Year Olds | 448 (95.1%) | 23 (4.9%) |
| 18 to 19 Year Olds | 40 (97.6%) | 1 (2.4%) |
| 20 to 24 Year Olds | 138 (100.0%) | 0 (0.0%) |
| 25 to 34 Year Olds | 162 (92.6%) | 13 (7.4%) |
| 35 Years and over | 56 (57.7%) | 41 (42.3%) |
| Total | 2,225 (90.3%) | 239 (9.7%) |
Educational Attainment by Field of Study in La Paz County
Education (461 | 27.6%), business (338 | 20.2%), science & technology (219 | 13.1%), engineering (172 | 10.3%), and physical & health sciences (139 | 8.3%) are the most common fields of study among 1,670 individuals in La Paz County who have obtained a bachelor's degree or higher.
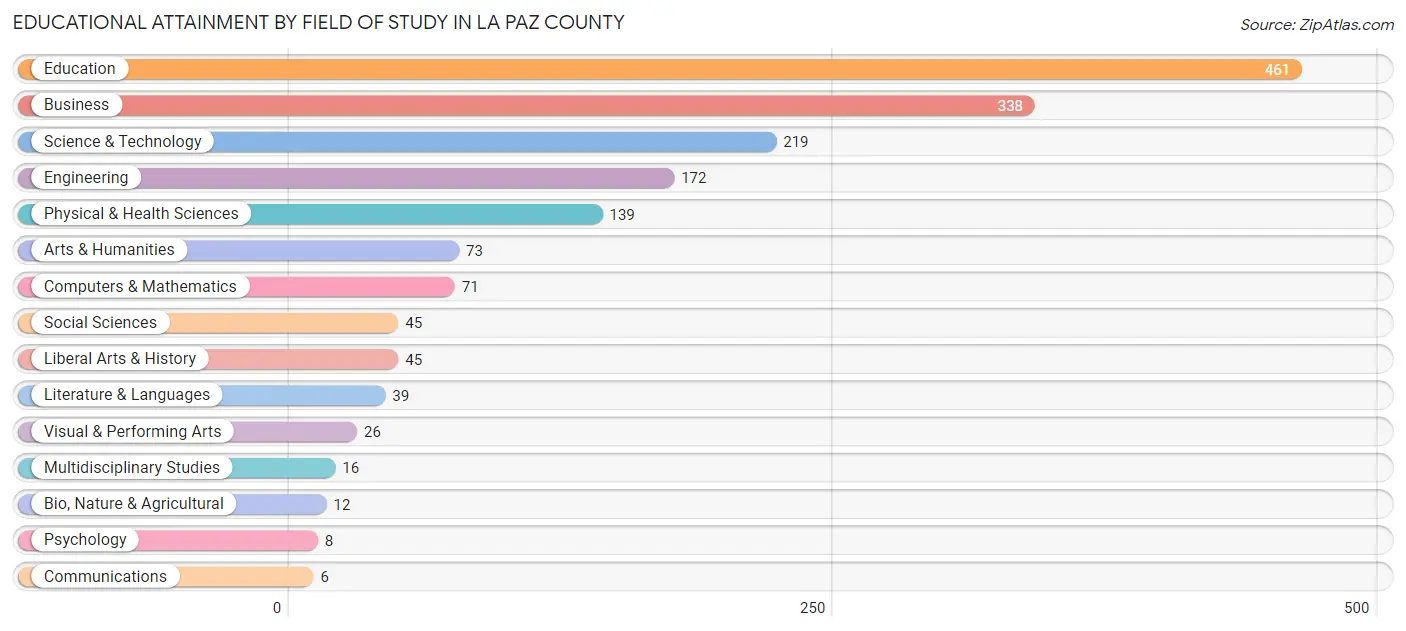
| Field of Study | # Graduates | % Graduates |
| Computers & Mathematics | 71 | 4.3% |
| Bio, Nature & Agricultural | 12 | 0.7% |
| Physical & Health Sciences | 139 | 8.3% |
| Psychology | 8 | 0.5% |
| Social Sciences | 45 | 2.7% |
| Engineering | 172 | 10.3% |
| Multidisciplinary Studies | 16 | 1.0% |
| Science & Technology | 219 | 13.1% |
| Business | 338 | 20.2% |
| Education | 461 | 27.6% |
| Literature & Languages | 39 | 2.3% |
| Liberal Arts & History | 45 | 2.7% |
| Visual & Performing Arts | 26 | 1.6% |
| Communications | 6 | 0.4% |
| Arts & Humanities | 73 | 4.4% |
| Total | 1,670 | 100.0% |
Transportation & Commute in La Paz County
Vehicle Availability by Sex in La Paz County
The most prevalent vehicle ownership categories in La Paz County are males with 2 vehicles (1,366, accounting for 45.7%) and females with 2 vehicles (1,145, making up 57.5%).
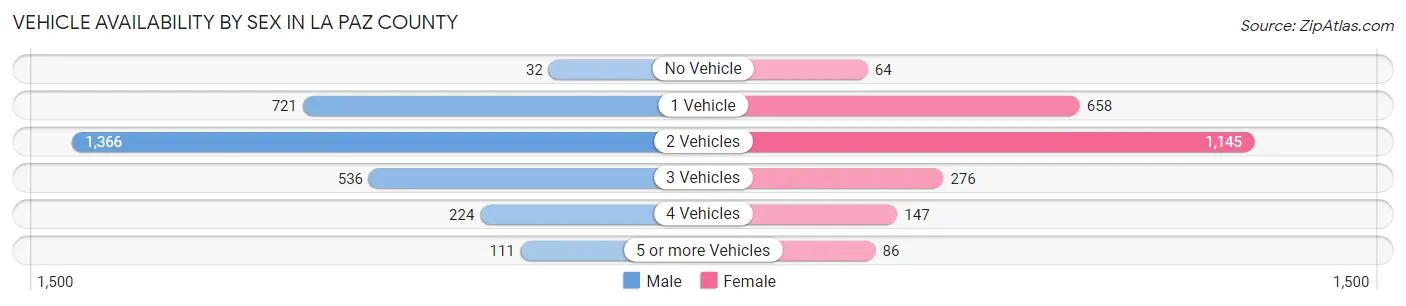
| Vehicles Available | Male | Female |
| No Vehicle | 32 (1.1%) | 64 (2.7%) |
| 1 Vehicle | 721 (24.1%) | 658 (27.7%) |
| 2 Vehicles | 1,366 (45.7%) | 1,145 (48.2%) |
| 3 Vehicles | 536 (17.9%) | 276 (11.6%) |
| 4 Vehicles | 224 (7.5%) | 147 (6.2%) |
| 5 or more Vehicles | 111 (3.7%) | 86 (3.6%) |
| Total | 2,990 (100.0%) | 2,376 (100.0%) |
Commute Time in La Paz County
The most frequently occuring commute durations in La Paz County are 5 to 9 minutes (1,954 commuters, 38.8%), 10 to 14 minutes (833 commuters, 16.5%), and 20 to 24 minutes (560 commuters, 11.1%).
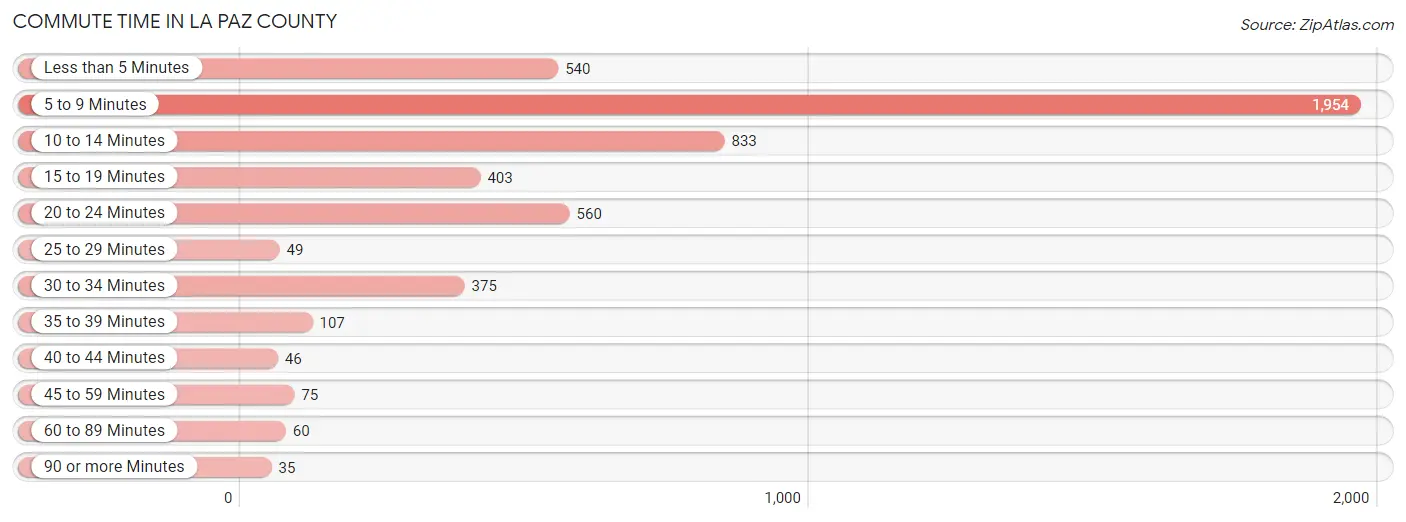
| Commute Time | # Commuters | % Commuters |
| Less than 5 Minutes | 540 | 10.7% |
| 5 to 9 Minutes | 1,954 | 38.8% |
| 10 to 14 Minutes | 833 | 16.5% |
| 15 to 19 Minutes | 403 | 8.0% |
| 20 to 24 Minutes | 560 | 11.1% |
| 25 to 29 Minutes | 49 | 1.0% |
| 30 to 34 Minutes | 375 | 7.4% |
| 35 to 39 Minutes | 107 | 2.1% |
| 40 to 44 Minutes | 46 | 0.9% |
| 45 to 59 Minutes | 75 | 1.5% |
| 60 to 89 Minutes | 60 | 1.2% |
| 90 or more Minutes | 35 | 0.7% |
Commute Time by Sex in La Paz County
The most common commute times in La Paz County are 5 to 9 minutes (860 commuters, 30.3%) for males and 5 to 9 minutes (1,094 commuters, 49.8%) for females.
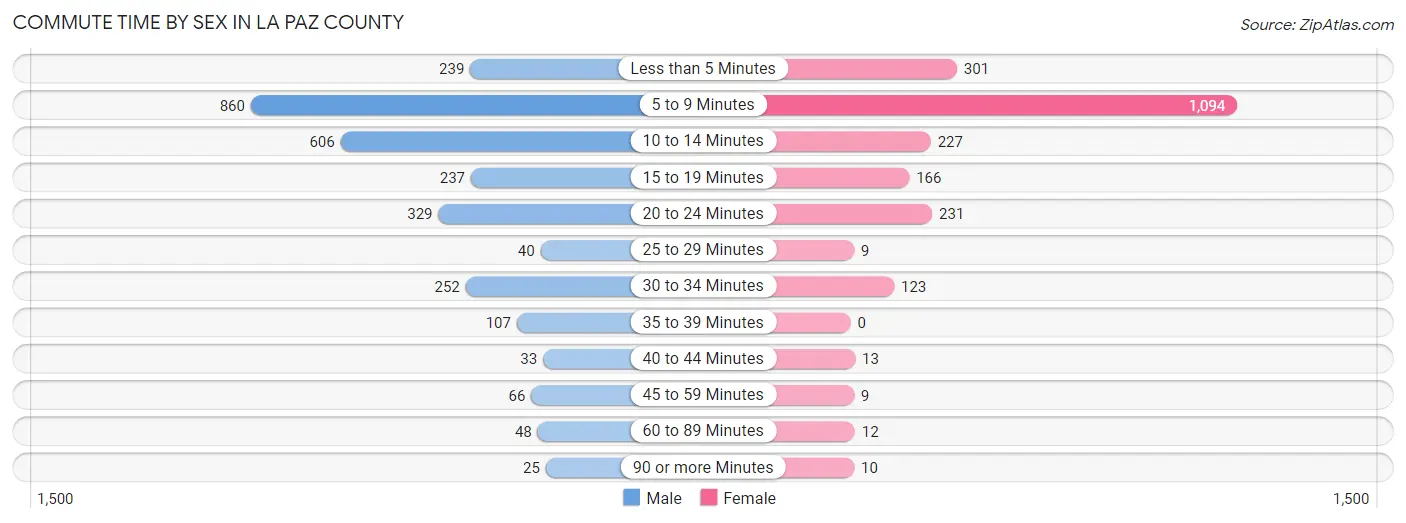
| Commute Time | Male | Female |
| Less than 5 Minutes | 239 (8.4%) | 301 (13.7%) |
| 5 to 9 Minutes | 860 (30.3%) | 1,094 (49.8%) |
| 10 to 14 Minutes | 606 (21.3%) | 227 (10.3%) |
| 15 to 19 Minutes | 237 (8.3%) | 166 (7.6%) |
| 20 to 24 Minutes | 329 (11.6%) | 231 (10.5%) |
| 25 to 29 Minutes | 40 (1.4%) | 9 (0.4%) |
| 30 to 34 Minutes | 252 (8.9%) | 123 (5.6%) |
| 35 to 39 Minutes | 107 (3.8%) | 0 (0.0%) |
| 40 to 44 Minutes | 33 (1.2%) | 13 (0.6%) |
| 45 to 59 Minutes | 66 (2.3%) | 9 (0.4%) |
| 60 to 89 Minutes | 48 (1.7%) | 12 (0.5%) |
| 90 or more Minutes | 25 (0.9%) | 10 (0.5%) |
Time of Departure to Work by Sex in La Paz County
The most frequent times of departure to work in La Paz County are 12:00 AM to 4:59 AM (400, 14.1%) for males and 7:30 AM to 7:59 AM (538, 24.5%) for females.
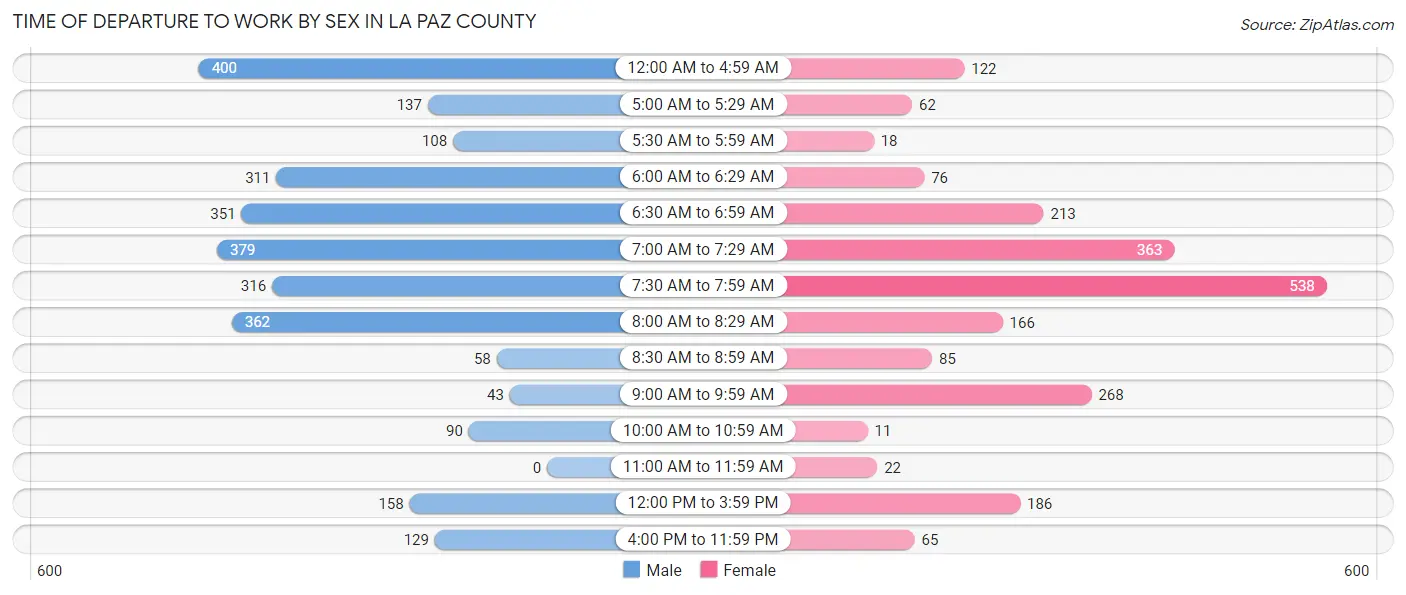
| Time of Departure | Male | Female |
| 12:00 AM to 4:59 AM | 400 (14.1%) | 122 (5.6%) |
| 5:00 AM to 5:29 AM | 137 (4.8%) | 62 (2.8%) |
| 5:30 AM to 5:59 AM | 108 (3.8%) | 18 (0.8%) |
| 6:00 AM to 6:29 AM | 311 (10.9%) | 76 (3.5%) |
| 6:30 AM to 6:59 AM | 351 (12.3%) | 213 (9.7%) |
| 7:00 AM to 7:29 AM | 379 (13.3%) | 363 (16.5%) |
| 7:30 AM to 7:59 AM | 316 (11.1%) | 538 (24.5%) |
| 8:00 AM to 8:29 AM | 362 (12.7%) | 166 (7.6%) |
| 8:30 AM to 8:59 AM | 58 (2.0%) | 85 (3.9%) |
| 9:00 AM to 9:59 AM | 43 (1.5%) | 268 (12.2%) |
| 10:00 AM to 10:59 AM | 90 (3.2%) | 11 (0.5%) |
| 11:00 AM to 11:59 AM | 0 (0.0%) | 22 (1.0%) |
| 12:00 PM to 3:59 PM | 158 (5.6%) | 186 (8.5%) |
| 4:00 PM to 11:59 PM | 129 (4.5%) | 65 (3.0%) |
| Total | 2,842 (100.0%) | 2,195 (100.0%) |
Housing Occupancy in La Paz County
Occupancy by Ownership in La Paz County
Of the total 8,911 dwellings in La Paz County, owner-occupied units account for 6,092 (68.4%), while renter-occupied units make up 2,819 (31.6%).
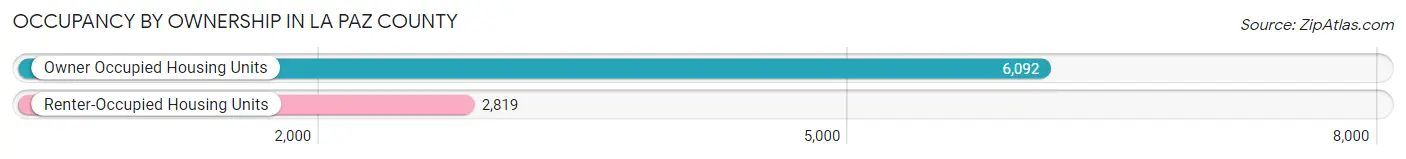
| Occupancy | # Housing Units | % Housing Units |
| Owner Occupied Housing Units | 6,092 | 68.4% |
| Renter-Occupied Housing Units | 2,819 | 31.6% |
| Total Occupied Housing Units | 8,911 | 100.0% |
Occupancy by Household Size in La Paz County
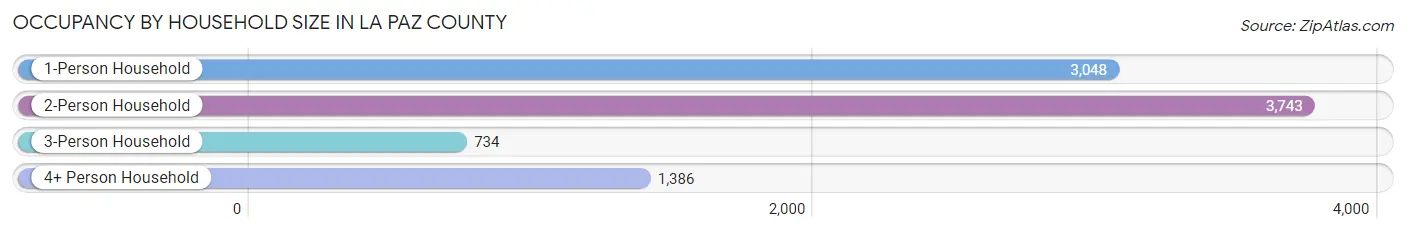
| Household Size | # Housing Units | % Housing Units |
| 1-Person Household | 3,048 | 34.2% |
| 2-Person Household | 3,743 | 42.0% |
| 3-Person Household | 734 | 8.2% |
| 4+ Person Household | 1,386 | 15.5% |
| Total Housing Units | 8,911 | 100.0% |
Occupancy by Ownership by Household Size in La Paz County
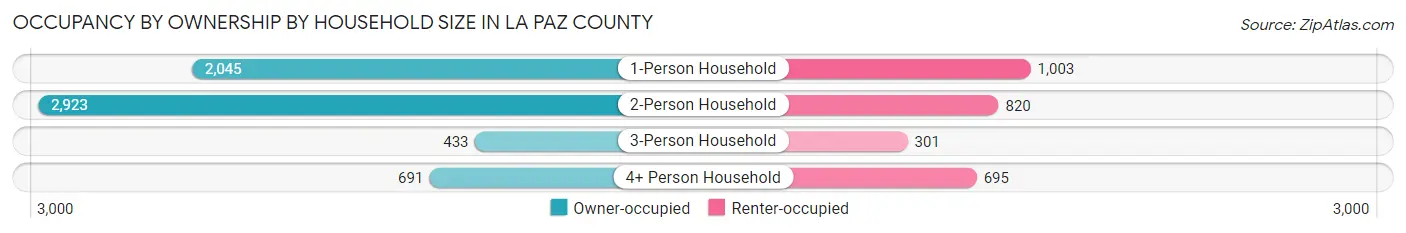
| Household Size | Owner-occupied | Renter-occupied |
| 1-Person Household | 2,045 (67.1%) | 1,003 (32.9%) |
| 2-Person Household | 2,923 (78.1%) | 820 (21.9%) |
| 3-Person Household | 433 (59.0%) | 301 (41.0%) |
| 4+ Person Household | 691 (49.9%) | 695 (50.1%) |
| Total Housing Units | 6,092 (68.4%) | 2,819 (31.6%) |
Occupancy by Educational Attainment in La Paz County
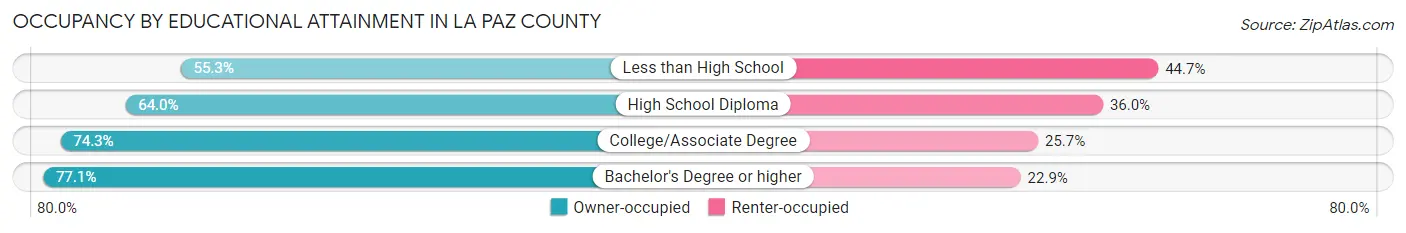
| Household Size | Owner-occupied | Renter-occupied |
| Less than High School | 846 (55.3%) | 685 (44.7%) |
| High School Diploma | 1,675 (64.0%) | 941 (36.0%) |
| College/Associate Degree | 2,720 (74.3%) | 940 (25.7%) |
| Bachelor's Degree or higher | 851 (77.1%) | 253 (22.9%) |
Occupancy by Age of Householder in La Paz County
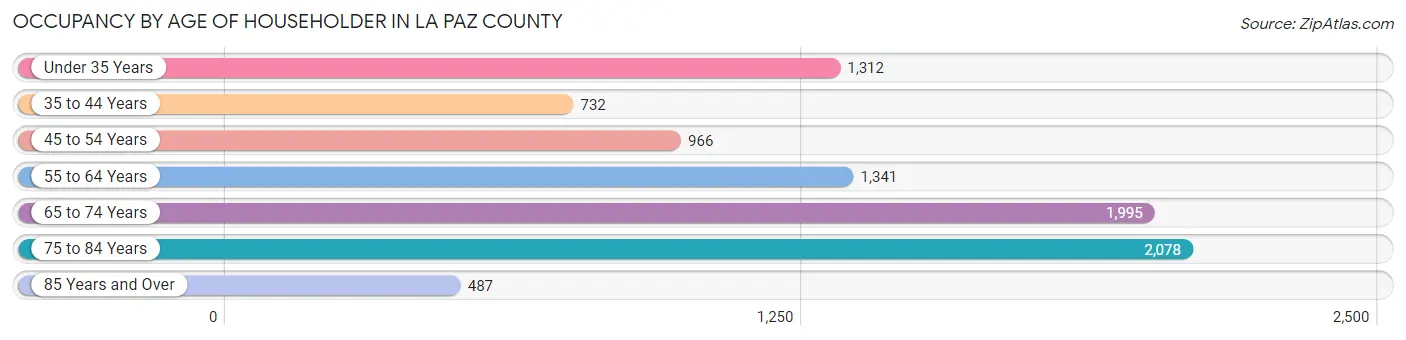
| Age Bracket | # Households | % Households |
| Under 35 Years | 1,312 | 14.7% |
| 35 to 44 Years | 732 | 8.2% |
| 45 to 54 Years | 966 | 10.8% |
| 55 to 64 Years | 1,341 | 15.0% |
| 65 to 74 Years | 1,995 | 22.4% |
| 75 to 84 Years | 2,078 | 23.3% |
| 85 Years and Over | 487 | 5.5% |
| Total | 8,911 | 100.0% |
Housing Finances in La Paz County
Median Income by Occupancy in La Paz County
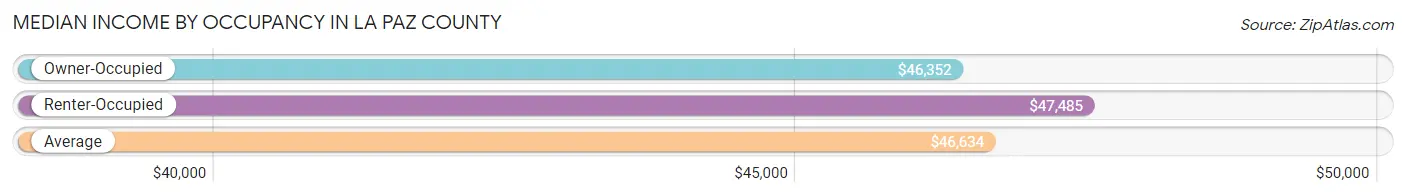
| Occupancy Type | # Households | Median Income |
| Owner-Occupied | 6,092 (68.4%) | $46,352 |
| Renter-Occupied | 2,819 (31.6%) | $47,485 |
| Average | 8,911 (100.0%) | $46,634 |
Occupancy by Householder Income Bracket in La Paz County
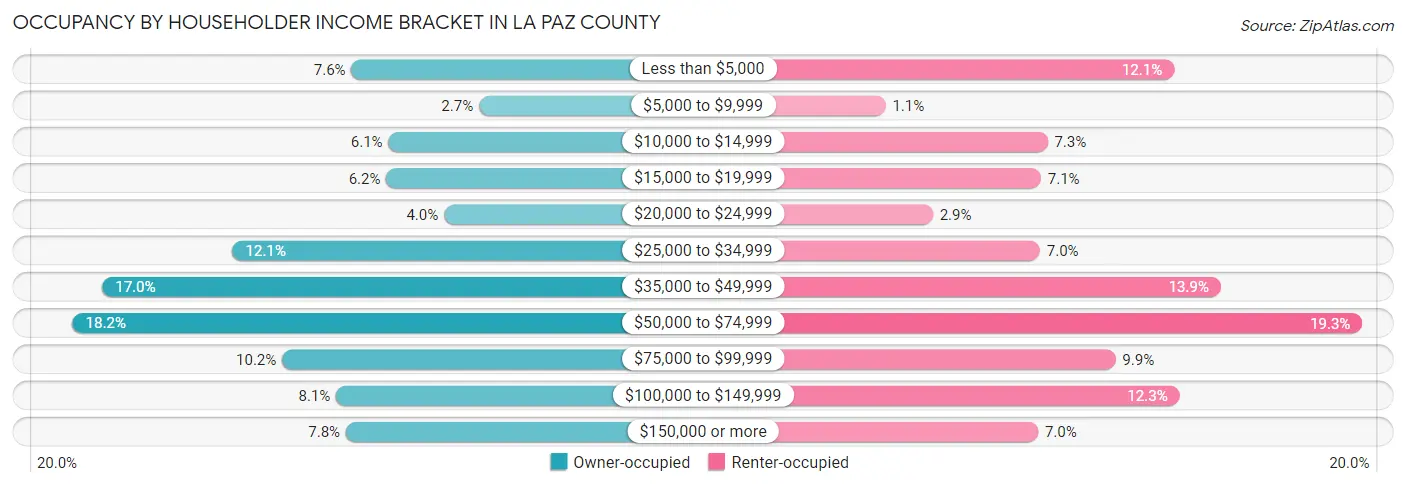
| Income Bracket | Owner-occupied | Renter-occupied |
| Less than $5,000 | 460 (7.5%) | 342 (12.1%) |
| $5,000 to $9,999 | 164 (2.7%) | 32 (1.1%) |
| $10,000 to $14,999 | 374 (6.1%) | 206 (7.3%) |
| $15,000 to $19,999 | 379 (6.2%) | 199 (7.1%) |
| $20,000 to $24,999 | 245 (4.0%) | 83 (2.9%) |
| $25,000 to $34,999 | 736 (12.1%) | 198 (7.0%) |
| $35,000 to $49,999 | 1,038 (17.0%) | 392 (13.9%) |
| $50,000 to $74,999 | 1,107 (18.2%) | 544 (19.3%) |
| $75,000 to $99,999 | 621 (10.2%) | 279 (9.9%) |
| $100,000 to $149,999 | 495 (8.1%) | 348 (12.3%) |
| $150,000 or more | 473 (7.8%) | 196 (7.0%) |
| Total | 6,092 (100.0%) | 2,819 (100.0%) |
Monthly Housing Cost Tiers in La Paz County
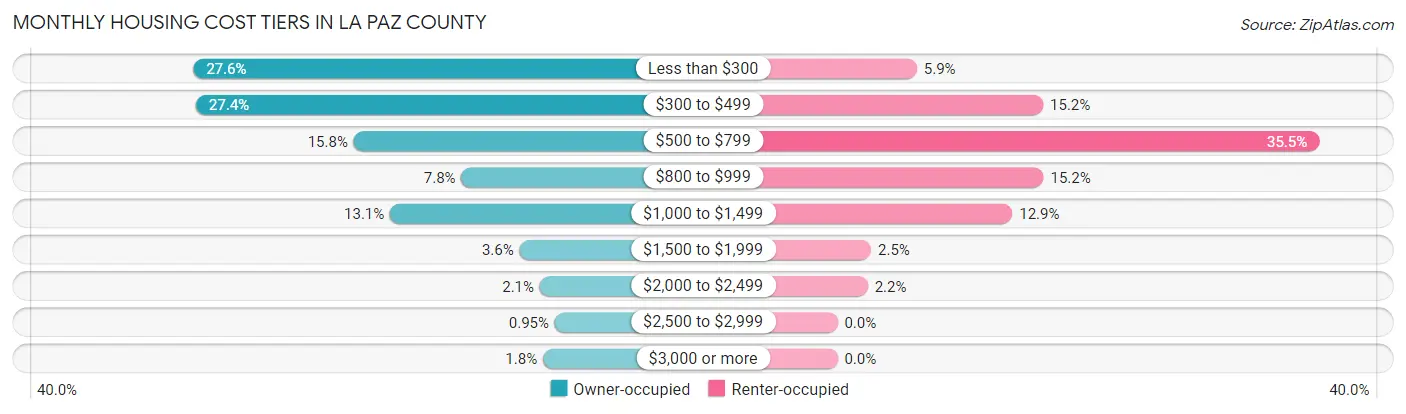
| Monthly Cost | Owner-occupied | Renter-occupied |
| Less than $300 | 1,680 (27.6%) | 165 (5.9%) |
| $300 to $499 | 1,668 (27.4%) | 427 (15.1%) |
| $500 to $799 | 960 (15.8%) | 1,000 (35.5%) |
| $800 to $999 | 477 (7.8%) | 428 (15.2%) |
| $1,000 to $1,499 | 797 (13.1%) | 363 (12.9%) |
| $1,500 to $1,999 | 216 (3.5%) | 70 (2.5%) |
| $2,000 to $2,499 | 125 (2.1%) | 63 (2.2%) |
| $2,500 to $2,999 | 58 (0.9%) | 0 (0.0%) |
| $3,000 or more | 111 (1.8%) | 0 (0.0%) |
| Total | 6,092 (100.0%) | 2,819 (100.0%) |
Physical Housing Characteristics in La Paz County
Housing Structures in La Paz County
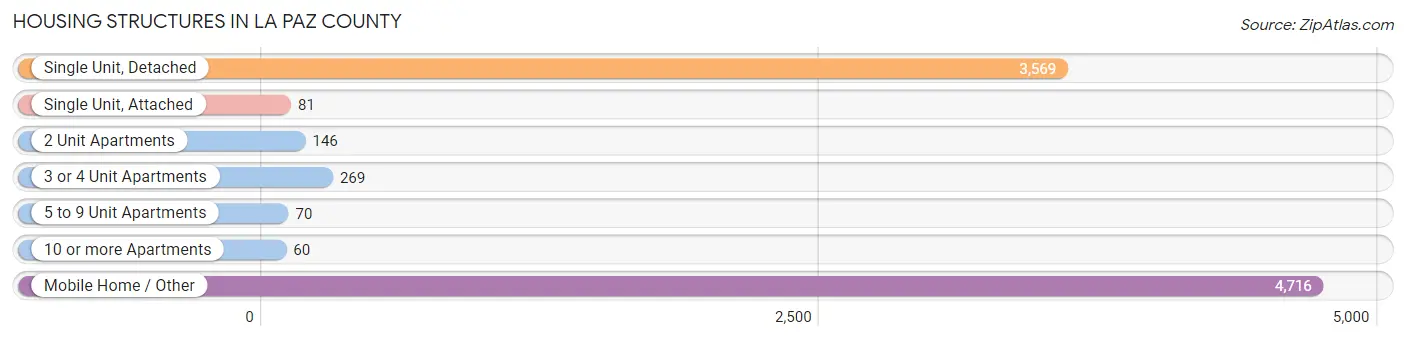
| Structure Type | # Housing Units | % Housing Units |
| Single Unit, Detached | 3,569 | 40.1% |
| Single Unit, Attached | 81 | 0.9% |
| 2 Unit Apartments | 146 | 1.6% |
| 3 or 4 Unit Apartments | 269 | 3.0% |
| 5 to 9 Unit Apartments | 70 | 0.8% |
| 10 or more Apartments | 60 | 0.7% |
| Mobile Home / Other | 4,716 | 52.9% |
| Total | 8,911 | 100.0% |
Housing Structures by Occupancy in La Paz County
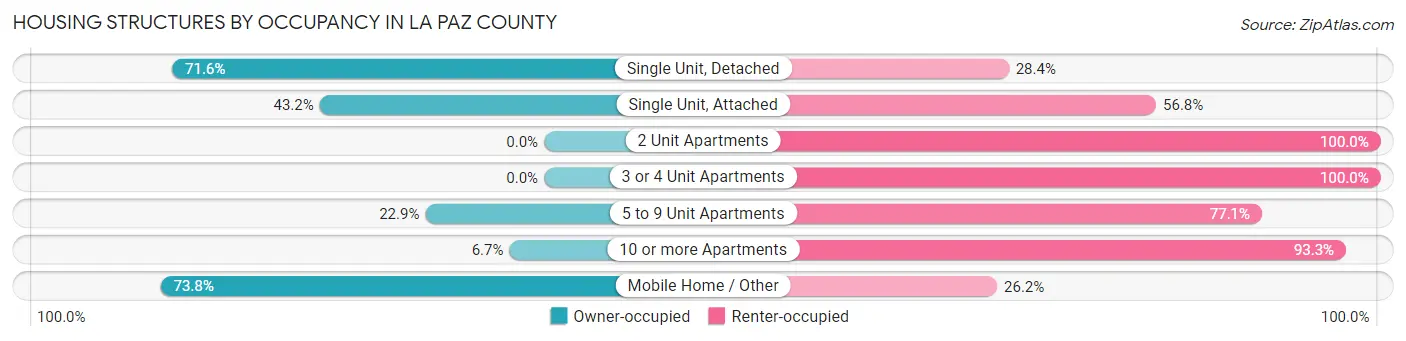
| Structure Type | Owner-occupied | Renter-occupied |
| Single Unit, Detached | 2,555 (71.6%) | 1,014 (28.4%) |
| Single Unit, Attached | 35 (43.2%) | 46 (56.8%) |
| 2 Unit Apartments | 0 (0.0%) | 146 (100.0%) |
| 3 or 4 Unit Apartments | 0 (0.0%) | 269 (100.0%) |
| 5 to 9 Unit Apartments | 16 (22.9%) | 54 (77.1%) |
| 10 or more Apartments | 4 (6.7%) | 56 (93.3%) |
| Mobile Home / Other | 3,482 (73.8%) | 1,234 (26.2%) |
| Total | 6,092 (68.4%) | 2,819 (31.6%) |
Housing Structures by Number of Rooms in La Paz County
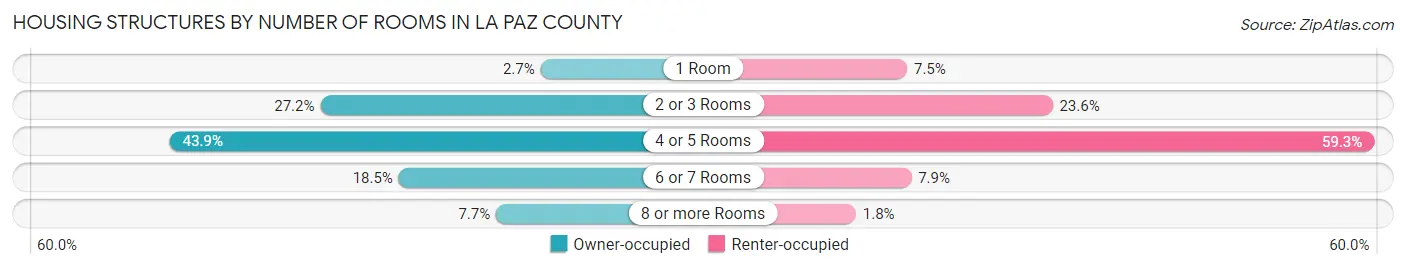
| Number of Rooms | Owner-occupied | Renter-occupied |
| 1 Room | 167 (2.7%) | 210 (7.4%) |
| 2 or 3 Rooms | 1,656 (27.2%) | 665 (23.6%) |
| 4 or 5 Rooms | 2,675 (43.9%) | 1,671 (59.3%) |
| 6 or 7 Rooms | 1,126 (18.5%) | 223 (7.9%) |
| 8 or more Rooms | 468 (7.7%) | 50 (1.8%) |
| Total | 6,092 (100.0%) | 2,819 (100.0%) |
Housing Structure by Heating Type in La Paz County
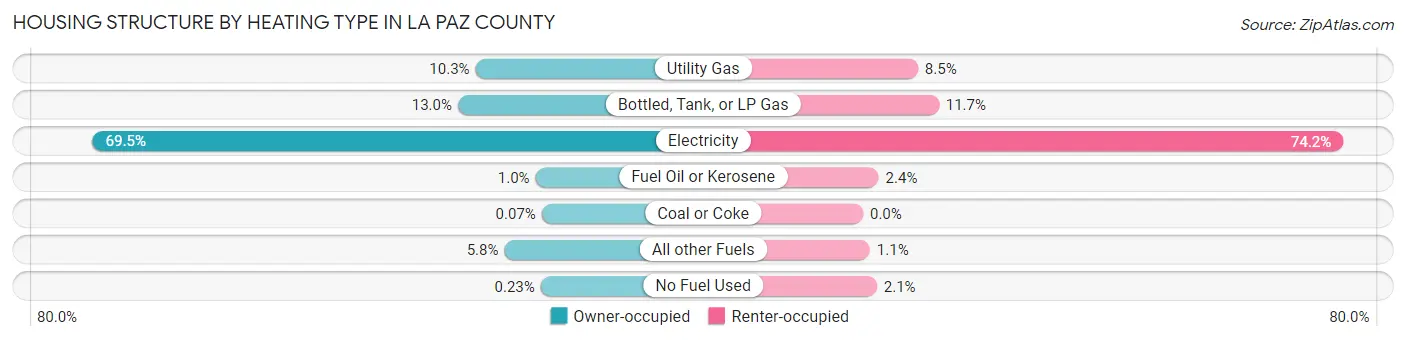
| Heating Type | Owner-occupied | Renter-occupied |
| Utility Gas | 628 (10.3%) | 239 (8.5%) |
| Bottled, Tank, or LP Gas | 794 (13.0%) | 330 (11.7%) |
| Electricity | 4,233 (69.5%) | 2,092 (74.2%) |
| Fuel Oil or Kerosene | 63 (1.0%) | 68 (2.4%) |
| Coal or Coke | 4 (0.1%) | 0 (0.0%) |
| All other Fuels | 356 (5.8%) | 30 (1.1%) |
| No Fuel Used | 14 (0.2%) | 60 (2.1%) |
| Total | 6,092 (100.0%) | 2,819 (100.0%) |
Household Vehicle Usage in La Paz County
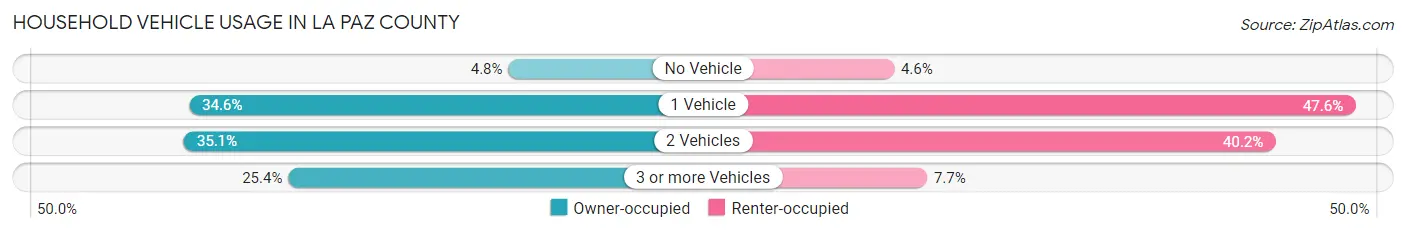
| Vehicles per Household | Owner-occupied | Renter-occupied |
| No Vehicle | 295 (4.8%) | 129 (4.6%) |
| 1 Vehicle | 2,110 (34.6%) | 1,342 (47.6%) |
| 2 Vehicles | 2,140 (35.1%) | 1,132 (40.2%) |
| 3 or more Vehicles | 1,547 (25.4%) | 216 (7.7%) |
| Total | 6,092 (100.0%) | 2,819 (100.0%) |
Real Estate & Mortgages in La Paz County
Real Estate and Mortgage Overview in La Paz County
| Characteristic | Without Mortgage | With Mortgage |
| Housing Units | 4,207 | 1,885 |
| Median Property Value | $105,200 | $143,800 |
| Median Household Income | $37,561 | $338 |
| Monthly Housing Costs | $339 | $107 |
| Real Estate Taxes | $634 | $356 |
Property Value by Mortgage Status in La Paz County
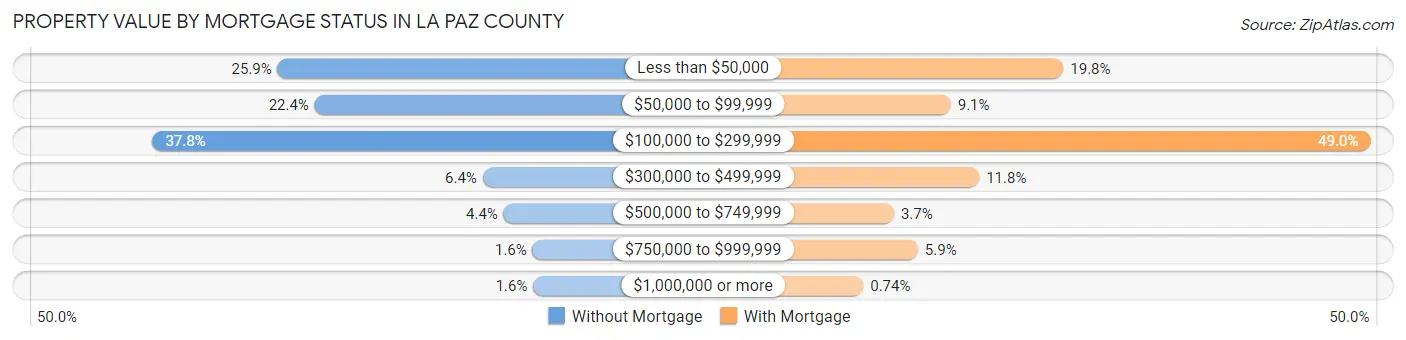
| Property Value | Without Mortgage | With Mortgage |
| Less than $50,000 | 1,090 (25.9%) | 373 (19.8%) |
| $50,000 to $99,999 | 941 (22.4%) | 171 (9.1%) |
| $100,000 to $299,999 | 1,591 (37.8%) | 924 (49.0%) |
| $300,000 to $499,999 | 268 (6.4%) | 222 (11.8%) |
| $500,000 to $749,999 | 184 (4.4%) | 69 (3.7%) |
| $750,000 to $999,999 | 68 (1.6%) | 112 (5.9%) |
| $1,000,000 or more | 65 (1.5%) | 14 (0.7%) |
| Total | 4,207 (100.0%) | 1,885 (100.0%) |
Household Income by Mortgage Status in La Paz County
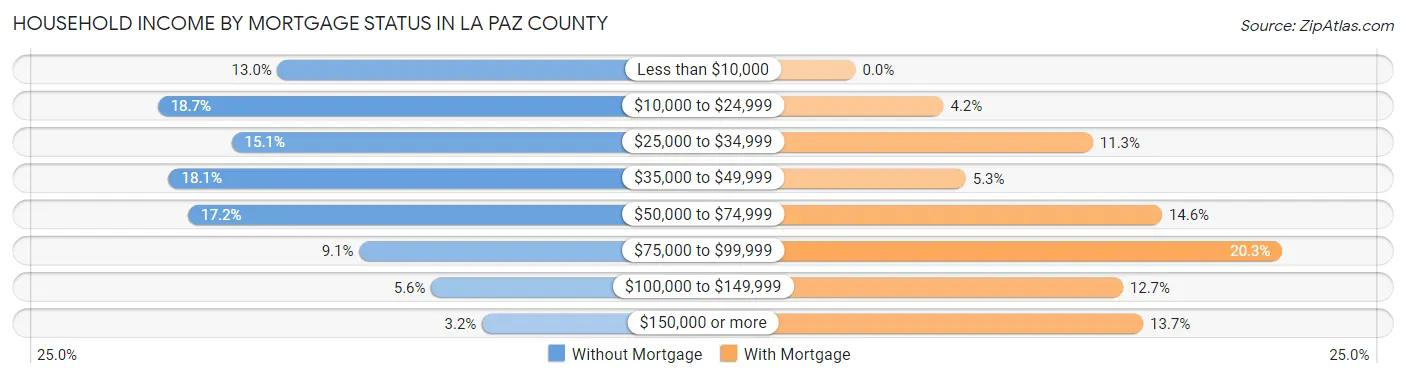
| Household Income | Without Mortgage | With Mortgage |
| Less than $10,000 | 545 (13.0%) | 0 (0.0%) |
| $10,000 to $24,999 | 785 (18.7%) | 79 (4.2%) |
| $25,000 to $34,999 | 637 (15.1%) | 213 (11.3%) |
| $35,000 to $49,999 | 763 (18.1%) | 99 (5.2%) |
| $50,000 to $74,999 | 724 (17.2%) | 275 (14.6%) |
| $75,000 to $99,999 | 381 (9.1%) | 383 (20.3%) |
| $100,000 to $149,999 | 237 (5.6%) | 240 (12.7%) |
| $150,000 or more | 135 (3.2%) | 258 (13.7%) |
| Total | 4,207 (100.0%) | 1,885 (100.0%) |
Property Value to Household Income Ratio in La Paz County
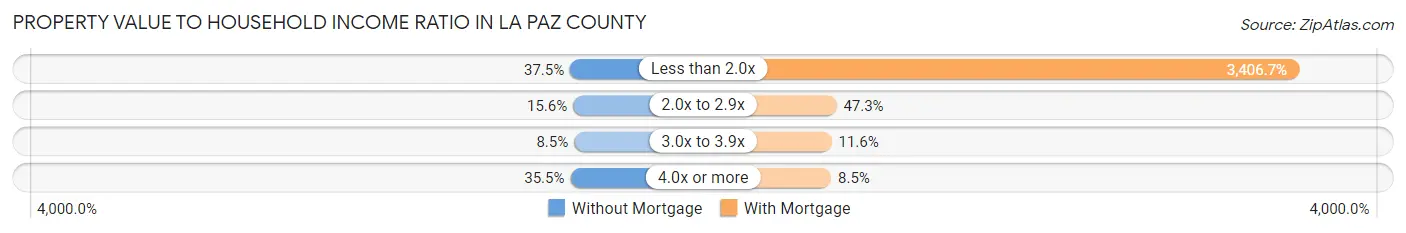
| Value-to-Income Ratio | Without Mortgage | With Mortgage |
| Less than 2.0x | 1,578 (37.5%) | 64,217 (3,406.7%) |
| 2.0x to 2.9x | 658 (15.6%) | 892 (47.3%) |
| 3.0x to 3.9x | 357 (8.5%) | 218 (11.6%) |
| 4.0x or more | 1,495 (35.5%) | 161 (8.5%) |
| Total | 4,207 (100.0%) | 1,885 (100.0%) |
Real Estate Taxes by Mortgage Status in La Paz County
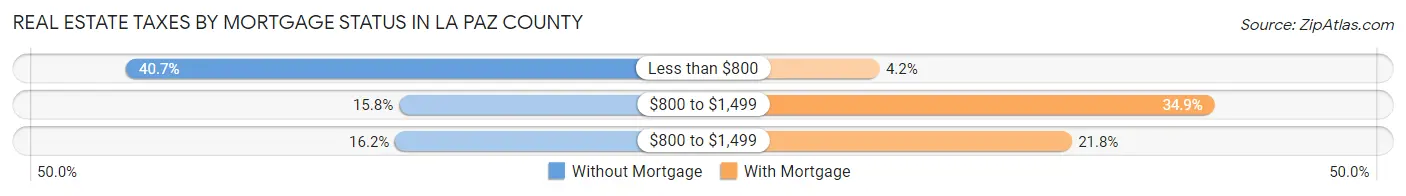
| Property Taxes | Without Mortgage | With Mortgage |
| Less than $800 | 1,713 (40.7%) | 79 (4.2%) |
| $800 to $1,499 | 665 (15.8%) | 657 (34.8%) |
| $800 to $1,499 | 680 (16.2%) | 410 (21.7%) |
| Total | 4,207 (100.0%) | 1,885 (100.0%) |
Health & Disability in La Paz County
Health Insurance Coverage by Age in La Paz County
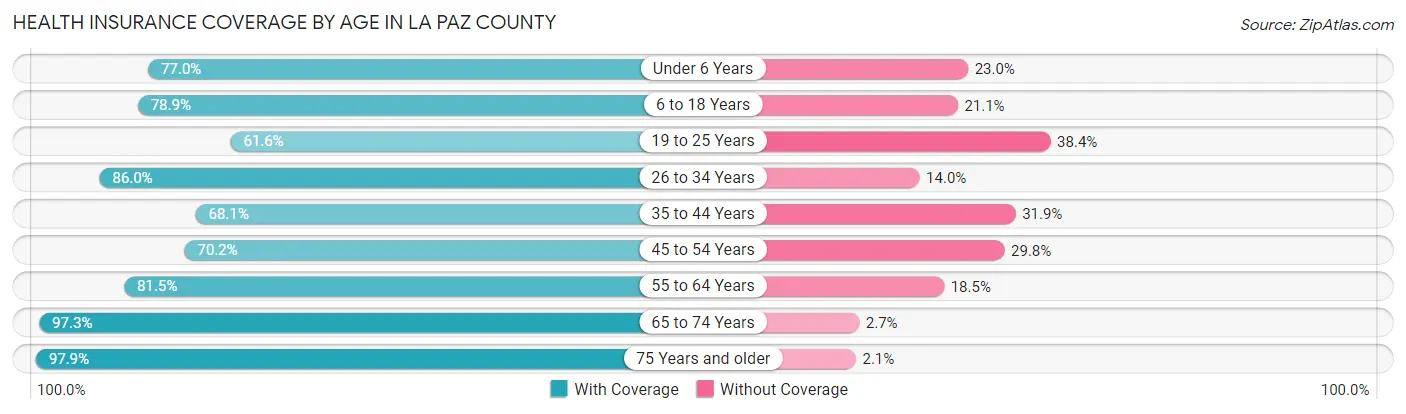
| Age Bracket | With Coverage | Without Coverage |
| Under 6 Years | 649 (77.0%) | 194 (23.0%) |
| 6 to 18 Years | 1,507 (78.9%) | 403 (21.1%) |
| 19 to 25 Years | 483 (61.6%) | 301 (38.4%) |
| 26 to 34 Years | 1,134 (86.0%) | 184 (14.0%) |
| 35 to 44 Years | 930 (68.1%) | 435 (31.9%) |
| 45 to 54 Years | 1,105 (70.2%) | 469 (29.8%) |
| 55 to 64 Years | 1,634 (81.5%) | 372 (18.5%) |
| 65 to 74 Years | 3,000 (97.3%) | 84 (2.7%) |
| 75 Years and older | 3,587 (97.9%) | 77 (2.1%) |
| Total | 14,029 (84.8%) | 2,519 (15.2%) |
Health Insurance Coverage by Citizenship Status in La Paz County
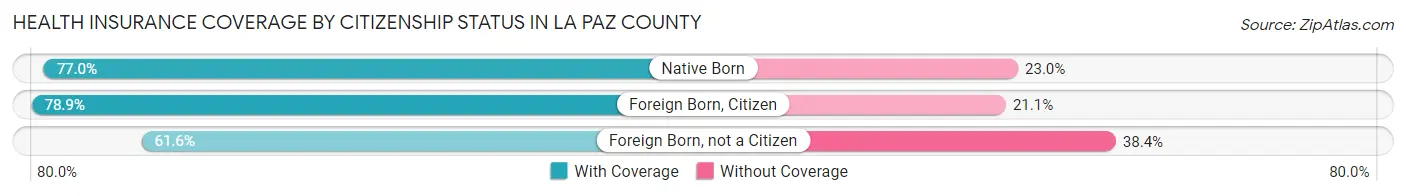
| Citizenship Status | With Coverage | Without Coverage |
| Native Born | 649 (77.0%) | 194 (23.0%) |
| Foreign Born, Citizen | 1,507 (78.9%) | 403 (21.1%) |
| Foreign Born, not a Citizen | 483 (61.6%) | 301 (38.4%) |
Health Insurance Coverage by Household Income in La Paz County
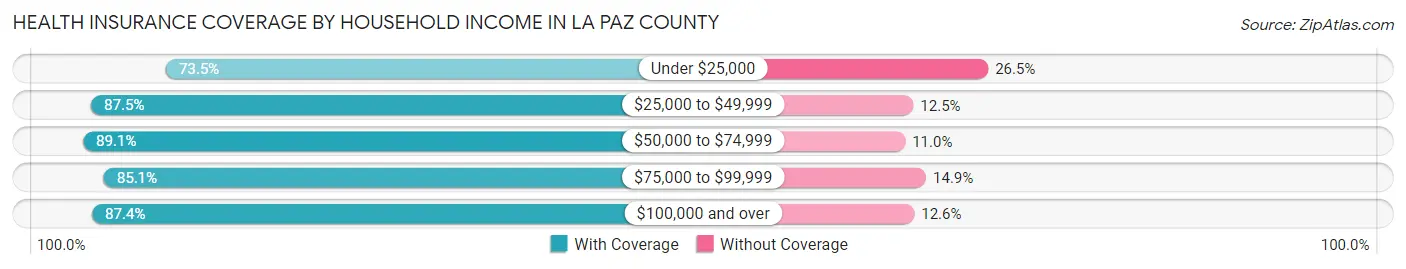
| Household Income | With Coverage | Without Coverage |
| Under $25,000 | 2,339 (73.5%) | 843 (26.5%) |
| $25,000 to $49,999 | 3,849 (87.5%) | 549 (12.5%) |
| $50,000 to $74,999 | 3,032 (89.0%) | 373 (11.0%) |
| $75,000 to $99,999 | 1,787 (85.1%) | 312 (14.9%) |
| $100,000 and over | 2,966 (87.4%) | 429 (12.6%) |
Public vs Private Health Insurance Coverage by Age in La Paz County
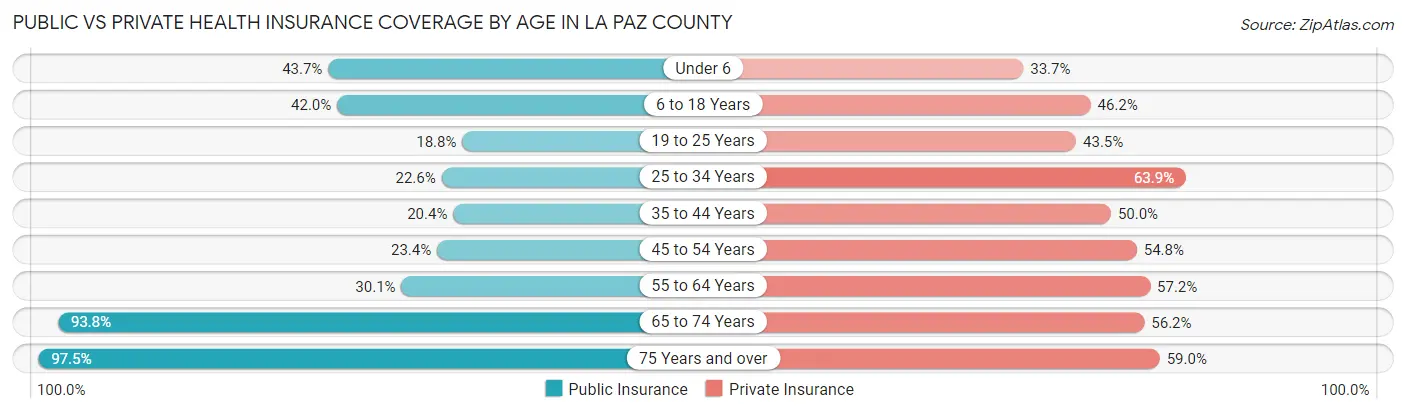
| Age Bracket | Public Insurance | Private Insurance |
| Under 6 | 368 (43.6%) | 284 (33.7%) |
| 6 to 18 Years | 802 (42.0%) | 882 (46.2%) |
| 19 to 25 Years | 147 (18.8%) | 341 (43.5%) |
| 25 to 34 Years | 298 (22.6%) | 842 (63.9%) |
| 35 to 44 Years | 279 (20.4%) | 682 (50.0%) |
| 45 to 54 Years | 369 (23.4%) | 862 (54.8%) |
| 55 to 64 Years | 603 (30.1%) | 1,148 (57.2%) |
| 65 to 74 Years | 2,894 (93.8%) | 1,732 (56.2%) |
| 75 Years and over | 3,571 (97.5%) | 2,162 (59.0%) |
| Total | 9,331 (56.4%) | 8,935 (54.0%) |
Disability Status by Sex by Age in La Paz County
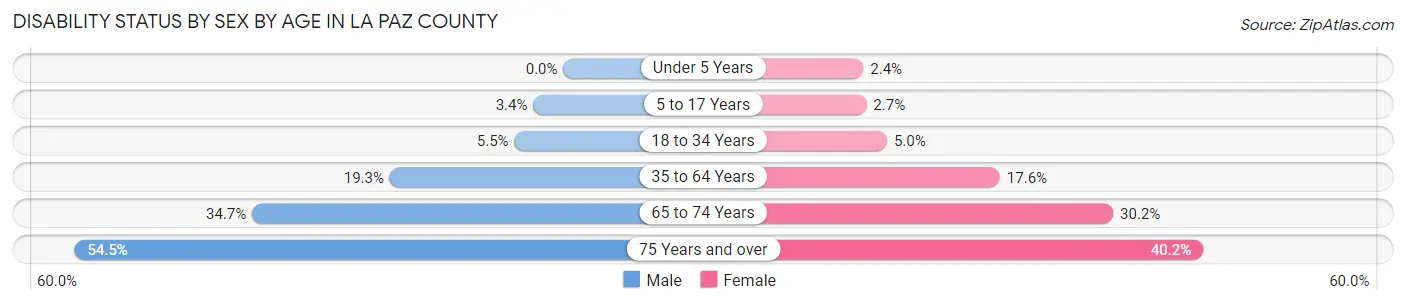
| Age Bracket | Male | Female |
| Under 5 Years | 0 (0.0%) | 9 (2.4%) |
| 5 to 17 Years | 37 (3.4%) | 24 (2.7%) |
| 18 to 34 Years | 66 (5.4%) | 47 (5.0%) |
| 35 to 64 Years | 442 (19.3%) | 468 (17.6%) |
| 65 to 74 Years | 545 (34.7%) | 457 (30.2%) |
| 75 Years and over | 1,065 (54.4%) | 687 (40.2%) |
Disability Class by Sex by Age in La Paz County
Disability Class: Hearing Difficulty
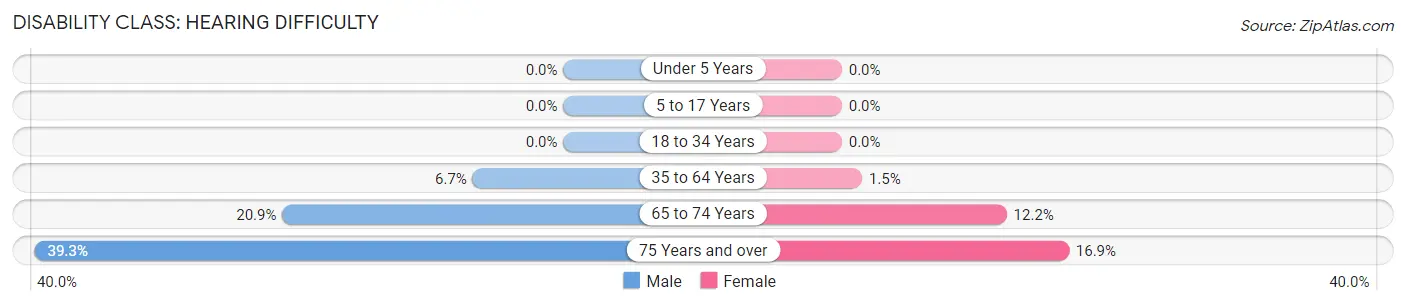
| Age Bracket | Male | Female |
| Under 5 Years | 0 (0.0%) | 0 (0.0%) |
| 5 to 17 Years | 0 (0.0%) | 0 (0.0%) |
| 18 to 34 Years | 0 (0.0%) | 0 (0.0%) |
| 35 to 64 Years | 154 (6.7%) | 40 (1.5%) |
| 65 to 74 Years | 328 (20.9%) | 185 (12.2%) |
| 75 Years and over | 768 (39.3%) | 288 (16.9%) |
Disability Class: Vision Difficulty
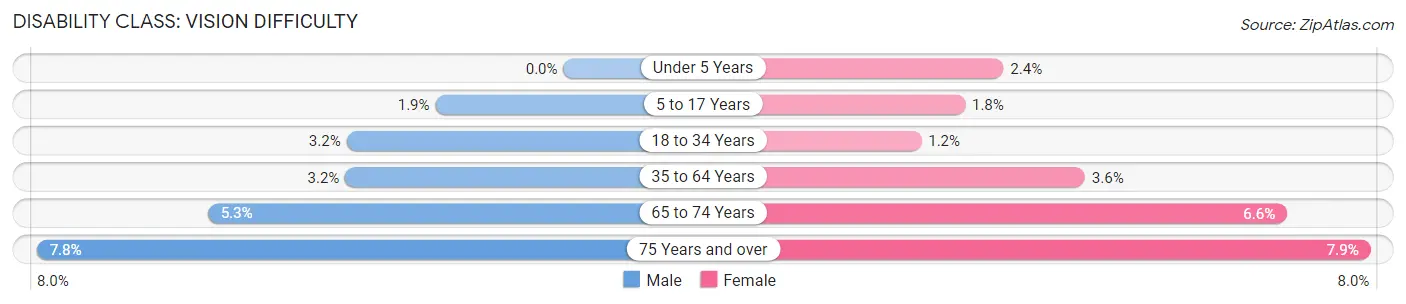
| Age Bracket | Male | Female |
| Under 5 Years | 0 (0.0%) | 9 (2.4%) |
| 5 to 17 Years | 21 (1.9%) | 16 (1.8%) |
| 18 to 34 Years | 39 (3.2%) | 11 (1.2%) |
| 35 to 64 Years | 74 (3.2%) | 96 (3.6%) |
| 65 to 74 Years | 83 (5.3%) | 100 (6.6%) |
| 75 Years and over | 153 (7.8%) | 134 (7.9%) |
Disability Class: Cognitive Difficulty
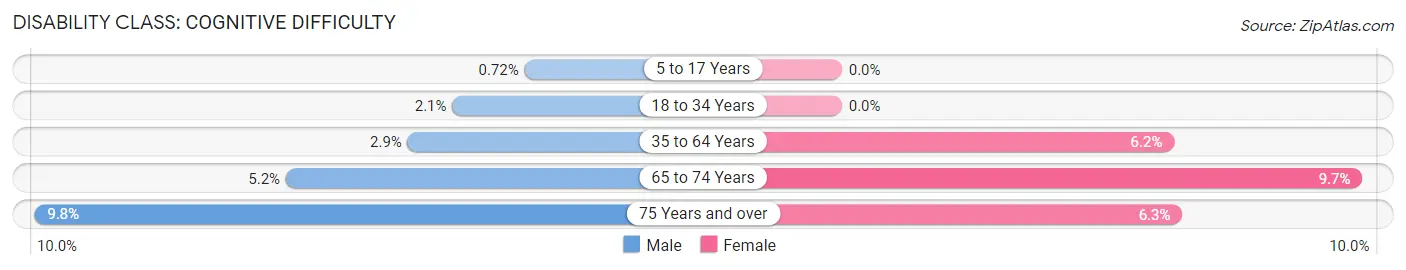
| Age Bracket | Male | Female |
| 5 to 17 Years | 8 (0.7%) | 0 (0.0%) |
| 18 to 34 Years | 25 (2.1%) | 0 (0.0%) |
| 35 to 64 Years | 66 (2.9%) | 164 (6.2%) |
| 65 to 74 Years | 81 (5.1%) | 146 (9.7%) |
| 75 Years and over | 192 (9.8%) | 108 (6.3%) |
Disability Class: Ambulatory Difficulty
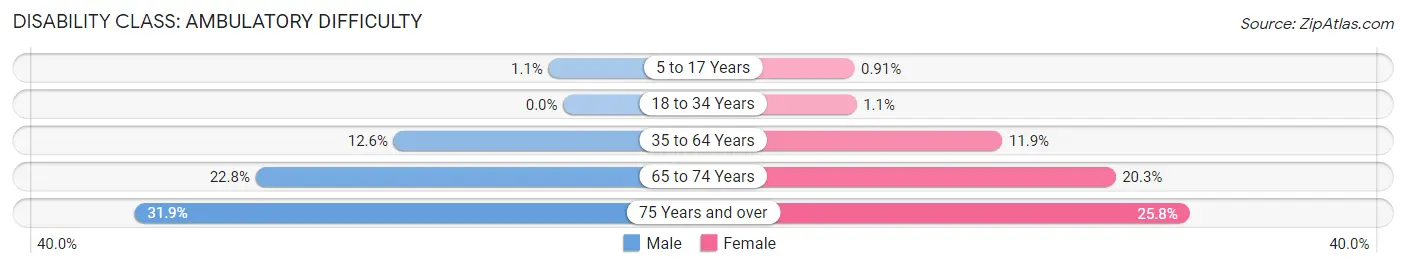
| Age Bracket | Male | Female |
| 5 to 17 Years | 12 (1.1%) | 8 (0.9%) |
| 18 to 34 Years | 0 (0.0%) | 10 (1.1%) |
| 35 to 64 Years | 288 (12.6%) | 316 (11.9%) |
| 65 to 74 Years | 359 (22.8%) | 307 (20.3%) |
| 75 Years and over | 623 (31.9%) | 441 (25.8%) |
Disability Class: Self-Care Difficulty
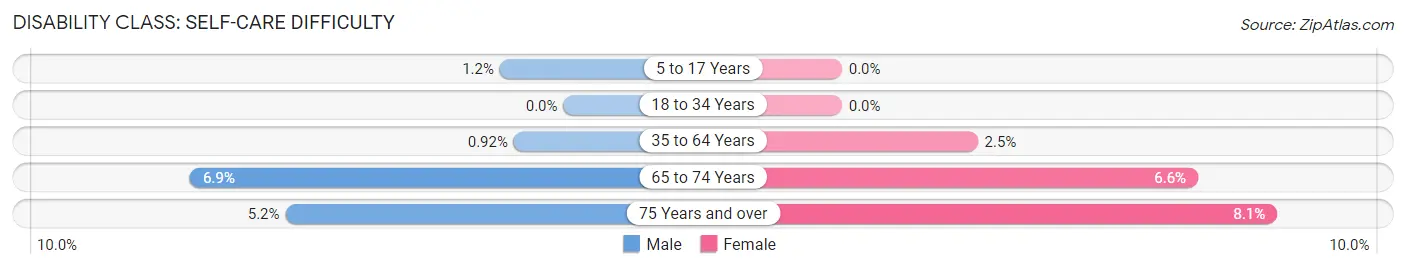
| Age Bracket | Male | Female |
| 5 to 17 Years | 13 (1.2%) | 0 (0.0%) |
| 18 to 34 Years | 0 (0.0%) | 0 (0.0%) |
| 35 to 64 Years | 21 (0.9%) | 67 (2.5%) |
| 65 to 74 Years | 109 (6.9%) | 100 (6.6%) |
| 75 Years and over | 101 (5.2%) | 138 (8.1%) |
Technology Access in La Paz County
Computing Device Access in La Paz County
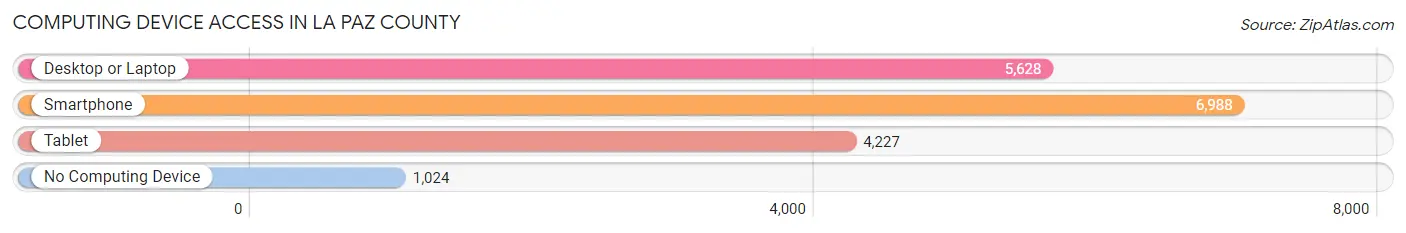
| Device Type | # Households | % Households |
| Desktop or Laptop | 5,628 | 63.2% |
| Smartphone | 6,988 | 78.4% |
| Tablet | 4,227 | 47.4% |
| No Computing Device | 1,024 | 11.5% |
| Total | 8,911 | 100.0% |
Internet Access in La Paz County
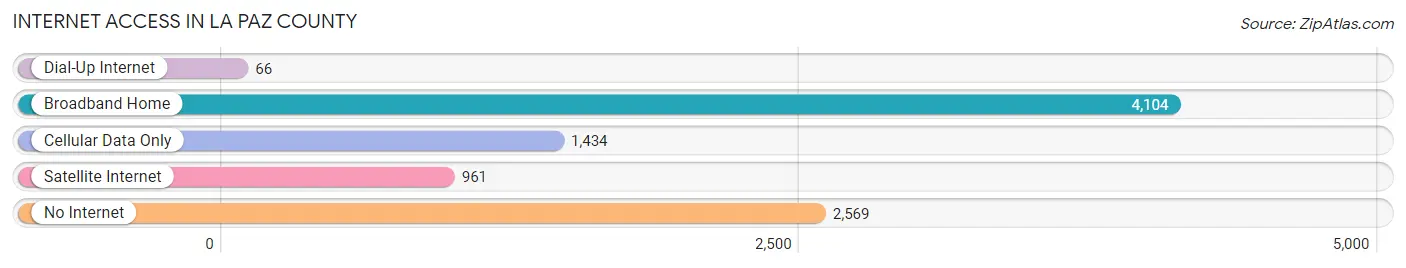
| Internet Type | # Households | % Households |
| Dial-Up Internet | 66 | 0.7% |
| Broadband Home | 4,104 | 46.1% |
| Cellular Data Only | 1,434 | 16.1% |
| Satellite Internet | 961 | 10.8% |
| No Internet | 2,569 | 28.8% |
| Total | 8,911 | 100.0% |
La Paz County Summary
La Paz County is located in the western part of the state of Arizona, in the United States. It is bordered by Yuma County to the west, Maricopa County to the north, and Yavapai County to the east. The county seat is Parker, and the largest city is Lake Havasu City. The county has a total area of 4,511 square miles, making it the second-largest county in Arizona.
Geography
La Paz County is located in the western part of the state of Arizona, in the United States. It is bordered by Yuma County to the west, Maricopa County to the north, and Yavapai County to the east. The county seat is Parker, and the largest city is Lake Havasu City. The county has a total area of 4,511 square miles, making it the second-largest county in Arizona.
The county is located in the Sonoran Desert, and is characterized by hot, dry summers and mild winters. The terrain is mostly flat, with some rolling hills and mountains in the northern and eastern parts of the county. The Colorado River forms the western border of the county, and the Bill Williams River flows through the county from north to south.
History
La Paz County was created in 1983 from parts of Yuma and Maricopa counties. The county was named after the city of La Paz, which was founded in 1863 by Mexican settlers. The city was named after the Mexican state of Baja California Sur, which was formerly known as La Paz.
The county was originally inhabited by the Yavapai and Mojave Native American tribes. The first non-native settlers arrived in the area in the late 19th century, and the county was officially established in 1983.
Economy
The economy of La Paz County is largely based on tourism, agriculture, and mining. The county is home to several tourist attractions, including Lake Havasu City, which is a popular destination for boating, fishing, and other outdoor activities. The county is also home to several agricultural operations, including cattle ranches, cotton farms, and date farms.
The county is also home to several mining operations, including copper, gold, and silver mines. The county is also home to several military installations, including the Marine Corps Air Station Yuma and the Yuma Proving Ground.
Demographics
As of the 2010 census, the population of La Paz County was 20,489. The racial makeup of the county was 75.3% White, 1.3% Black or African American, 1.2% Native American, 0.4% Asian, 0.1% Pacific Islander, 19.2% from other races, and 2.5% from two or more races. Hispanic or Latino of any race were 37.2% of the population.
The median income for a household in the county was $35,938, and the median income for a family was $41,919. The per capita income for the county was $17,945. About 17.2% of families and 22.2% of the population were below the poverty line, including 33.3% of those under age 18 and 11.2% of those age 65 or over.
Common Questions
What is Per Capita Income in La Paz County?
Per Capita income in La Paz County is $30,399.
What is the Median Family Income in La Paz County?
Median Family Income in La Paz County is $58,960.
What is the Median Household income in La Paz County?
Median Household Income in La Paz County is $46,634.
What is Income or Wage Gap in La Paz County?
Income or Wage Gap in La Paz County is 29.9%.
Women in La Paz County earn 70.1 cents for every dollar earned by a man.
What is Family Income Deficit in La Paz County?
Family Income Deficit in La Paz County is $9,669.
Families that are below poverty line in La Paz County earn $9,669 less on average than the poverty threshold level.
What is Inequality or Gini Index in La Paz County?
Inequality or Gini Index in La Paz County is 0.48.
What is the Total Population of La Paz County?
Total Population of La Paz County is 16,681.
What is the Total Male Population of La Paz County?
Total Male Population of La Paz County is 8,617.
What is the Total Female Population of La Paz County?
Total Female Population of La Paz County is 8,064.
What is the Ratio of Males per 100 Females in La Paz County?
There are 106.86 Males per 100 Females in La Paz County.
What is the Ratio of Females per 100 Males in La Paz County?
There are 93.58 Females per 100 Males in La Paz County.
What is the Median Population Age in La Paz County?
Median Population Age in La Paz County is 57.3 Years.
What is the Average Family Size in La Paz County
Average Family Size in La Paz County is 2.2 People.
What is the Average Household Size in La Paz County
Average Household Size in La Paz County is 1.9 People.
How Large is the Labor Force in La Paz County?
There are 6,136 People in the Labor Forcein in La Paz County.
What is the Percentage of People in the Labor Force in La Paz County?
43.0% of People are in the Labor Force in La Paz County.
What is the Unemployment Rate in La Paz County?
Unemployment Rate in La Paz County is 10.7%.