Graham County, AZ Map & Demographics
Graham County Map
Graham County Overview
$24,052
PER CAPITA INCOME
$71,035
AVG FAMILY INCOME
$64,089
AVG HOUSEHOLD INCOME
30.4%
WAGE / INCOME GAP [ % ]
69.6¢/ $1
WAGE / INCOME GAP [ $ ]
$13,777
FAMILY INCOME DEFICIT
0.41
INEQUALITY / GINI INDEX
38,453
TOTAL POPULATION
20,530
MALE POPULATION
17,923
FEMALE POPULATION
114.55
MALES / 100 FEMALES
87.30
FEMALES / 100 MALES
34.1
MEDIAN AGE
3.4
AVG FAMILY SIZE
2.9
AVG HOUSEHOLD SIZE
14,943
LABOR FORCE [ PEOPLE ]
50.6%
PERCENT IN LABOR FORCE
6.0%
UNEMPLOYMENT RATE
Graham County Area Codes
Income in Graham County
Income Overview in Graham County
Per Capita Income in Graham County is $24,052, while median incomes of families and households are $71,035 and $64,089 respectively.
| Characteristic | Number | Measure |
| Per Capita Income | 38,453 | $24,052 |
| Median Family Income | 8,643 | $71,035 |
| Mean Family Income | 8,643 | $81,713 |
| Median Household Income | 12,018 | $64,089 |
| Mean Household Income | 12,018 | $74,766 |
| Income Deficit | 8,643 | $13,777 |
| Wage / Income Gap (%) | 38,453 | 30.44% |
| Wage / Income Gap ($) | 38,453 | 69.56¢ per $1 |
| Gini / Inequality Index | 38,453 | 0.41 |
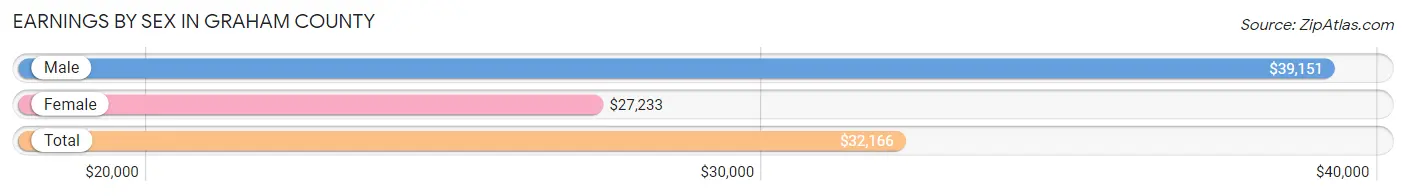
Earnings by Sex in Graham County
Average Earnings in Graham County are $32,166, $39,151 for men and $27,233 for women, a difference of 30.4%.
| Sex | Number | Average Earnings |
| Male | 9,394 (57.1%) | $39,151 |
| Female | 7,048 (42.9%) | $27,233 |
| Total | 16,442 (100.0%) | $32,166 |
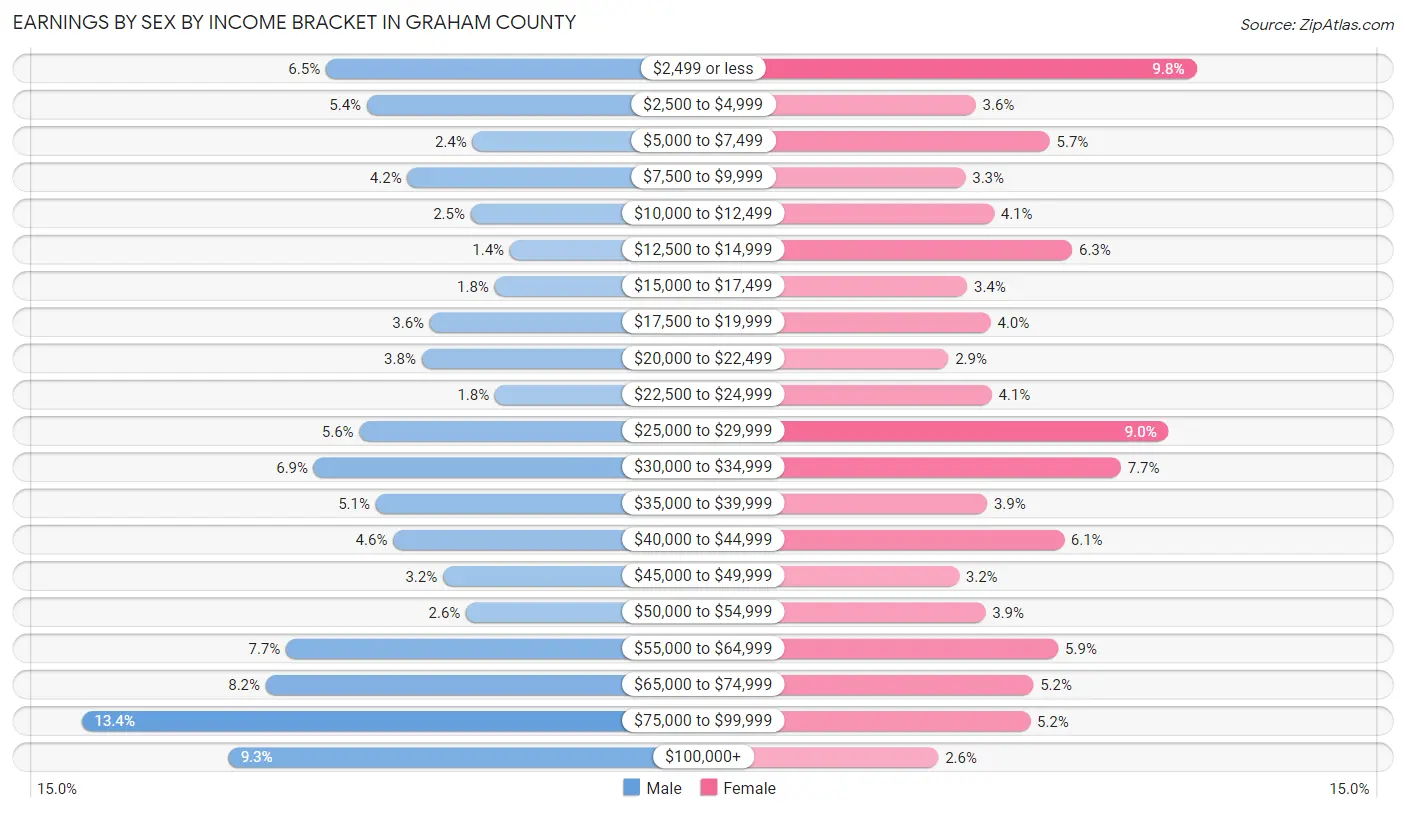
Earnings by Sex by Income Bracket in Graham County
The most common earnings brackets in Graham County are $75,000 to $99,999 for men (1,259 | 13.4%) and $2,499 or less for women (692 | 9.8%).
| Income | Male | Female |
| $2,499 or less | 613 (6.5%) | 692 (9.8%) |
| $2,500 to $4,999 | 505 (5.4%) | 255 (3.6%) |
| $5,000 to $7,499 | 226 (2.4%) | 402 (5.7%) |
| $7,500 to $9,999 | 398 (4.2%) | 235 (3.3%) |
| $10,000 to $12,499 | 231 (2.5%) | 291 (4.1%) |
| $12,500 to $14,999 | 128 (1.4%) | 446 (6.3%) |
| $15,000 to $17,499 | 168 (1.8%) | 238 (3.4%) |
| $17,500 to $19,999 | 339 (3.6%) | 285 (4.0%) |
| $20,000 to $22,499 | 361 (3.8%) | 201 (2.9%) |
| $22,500 to $24,999 | 167 (1.8%) | 287 (4.1%) |
| $25,000 to $29,999 | 525 (5.6%) | 637 (9.0%) |
| $30,000 to $34,999 | 645 (6.9%) | 543 (7.7%) |
| $35,000 to $39,999 | 482 (5.1%) | 278 (3.9%) |
| $40,000 to $44,999 | 436 (4.6%) | 430 (6.1%) |
| $45,000 to $49,999 | 304 (3.2%) | 222 (3.2%) |
| $50,000 to $54,999 | 243 (2.6%) | 274 (3.9%) |
| $55,000 to $64,999 | 719 (7.6%) | 419 (5.9%) |
| $65,000 to $74,999 | 772 (8.2%) | 369 (5.2%) |
| $75,000 to $99,999 | 1,259 (13.4%) | 363 (5.1%) |
| $100,000+ | 873 (9.3%) | 181 (2.6%) |
| Total | 9,394 (100.0%) | 7,048 (100.0%) |
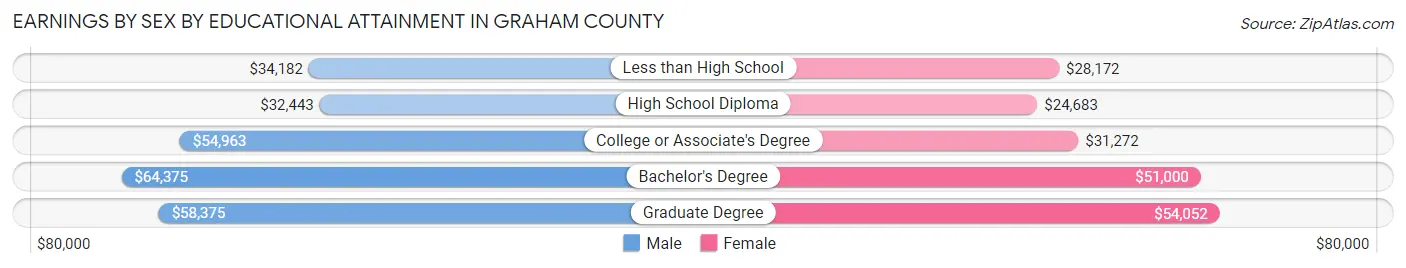
Earnings by Sex by Educational Attainment in Graham County
Average earnings in Graham County are $44,615 for men and $30,197 for women, a difference of 32.3%. Men with an educational attainment of bachelor's degree enjoy the highest average annual earnings of $64,375, while those with high school diploma education earn the least with $32,443. Women with an educational attainment of graduate degree earn the most with the average annual earnings of $54,052, while those with high school diploma education have the smallest earnings of $24,683.
| Educational Attainment | Male Income | Female Income |
| Less than High School | $34,182 | $28,172 |
| High School Diploma | $32,443 | $24,683 |
| College or Associate's Degree | $54,963 | $31,272 |
| Bachelor's Degree | $64,375 | $51,000 |
| Graduate Degree | $58,375 | $54,052 |
| Total | $44,615 | $30,197 |
Family Income in Graham County
Family Income Brackets in Graham County
According to the Graham County family income data, there are 1,755 families falling into the $50,000 to $74,999 income range, which is the most common income bracket and makes up 20.3% of all families. Conversely, the $10,000 to $14,999 income bracket is the least frequent group with only 225 families (2.6%) belonging to this category.
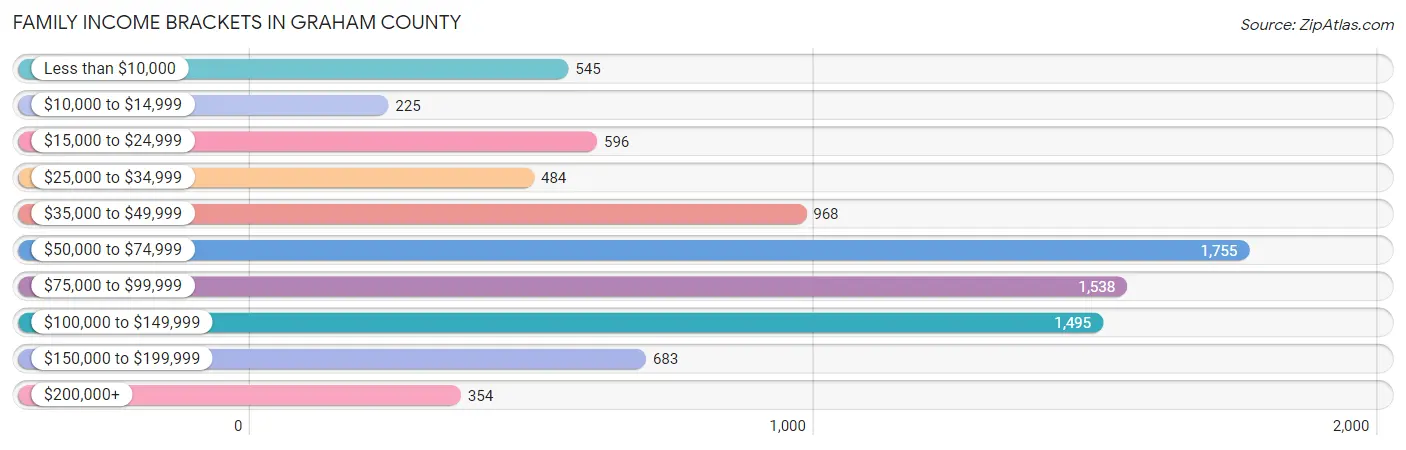
| Income Bracket | # Families | % Families |
| Less than $10,000 | 545 | 6.3% |
| $10,000 to $14,999 | 225 | 2.6% |
| $15,000 to $24,999 | 596 | 6.9% |
| $25,000 to $34,999 | 484 | 5.6% |
| $35,000 to $49,999 | 968 | 11.2% |
| $50,000 to $74,999 | 1,755 | 20.3% |
| $75,000 to $99,999 | 1,538 | 17.8% |
| $100,000 to $149,999 | 1,495 | 17.3% |
| $150,000 to $199,999 | 683 | 7.9% |
| $200,000+ | 354 | 4.1% |
Family Income by Famaliy Size in Graham County
6-person families (643 | 7.4%) account for the highest median family income in Graham County with $99,171 per family, while 2-person families (3,557 | 41.1%) have the highest median income of $29,600 per family member.
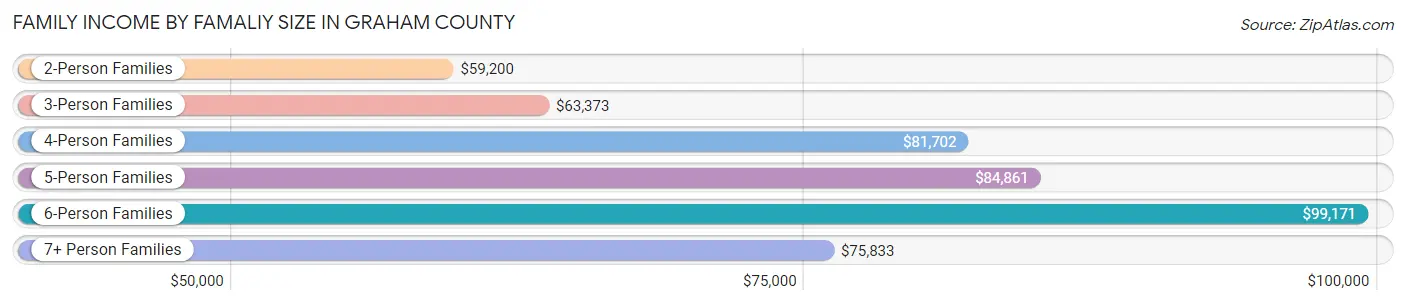
| Income Bracket | # Families | Median Income |
| 2-Person Families | 3,557 (41.1%) | $59,200 |
| 3-Person Families | 1,767 (20.4%) | $63,373 |
| 4-Person Families | 1,474 (17.1%) | $81,702 |
| 5-Person Families | 856 (9.9%) | $84,861 |
| 6-Person Families | 643 (7.4%) | $99,171 |
| 7+ Person Families | 346 (4.0%) | $75,833 |
| Total | 8,643 (100.0%) | $71,035 |
Family Income by Number of Earners in Graham County
The median family income in Graham County is $71,035, with families comprising 3+ earners (668) having the highest median family income of $112,396, while families with no earners (1,791) have the lowest median family income of $37,482, accounting for 7.7% and 20.7% of families, respectively.
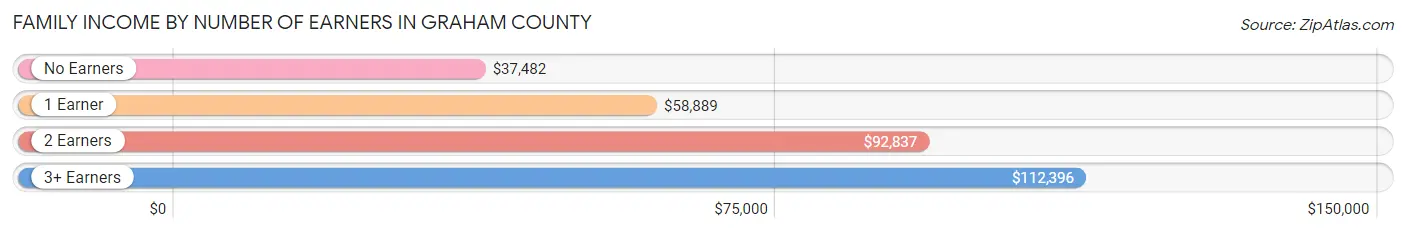
| Number of Earners | # Families | Median Income |
| No Earners | 1,791 (20.7%) | $37,482 |
| 1 Earner | 2,894 (33.5%) | $58,889 |
| 2 Earners | 3,290 (38.1%) | $92,837 |
| 3+ Earners | 668 (7.7%) | $112,396 |
| Total | 8,643 (100.0%) | $71,035 |
Household Income in Graham County
Household Income Brackets in Graham County
With 2,440 households falling in the category, the $50,000 to $74,999 income range is the most frequent in Graham County, accounting for 20.3% of all households. In contrast, only 409 households (3.4%) fall into the $200,000+ income bracket, making it the least populous group.
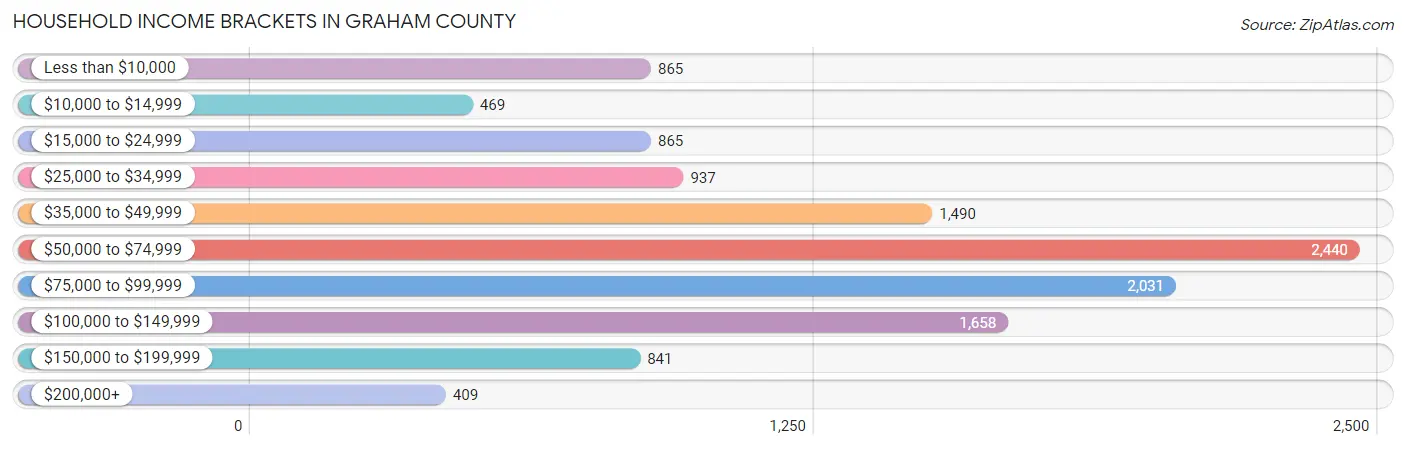
| Income Bracket | # Households | % Households |
| Less than $10,000 | 865 | 7.2% |
| $10,000 to $14,999 | 469 | 3.9% |
| $15,000 to $24,999 | 865 | 7.2% |
| $25,000 to $34,999 | 937 | 7.8% |
| $35,000 to $49,999 | 1,490 | 12.4% |
| $50,000 to $74,999 | 2,440 | 20.3% |
| $75,000 to $99,999 | 2,031 | 16.9% |
| $100,000 to $149,999 | 1,658 | 13.8% |
| $150,000 to $199,999 | 841 | 7.0% |
| $200,000+ | 409 | 3.4% |
Household Income by Householder Age in Graham County
The median household income in Graham County is $64,089, with the highest median household income of $75,208 found in the 25 to 44 years age bracket for the primary householder. A total of 4,163 households (34.6%) fall into this category. Meanwhile, the 15 to 24 years age bracket for the primary householder has the lowest median household income of $55,208, with 759 households (6.3%) in this group.
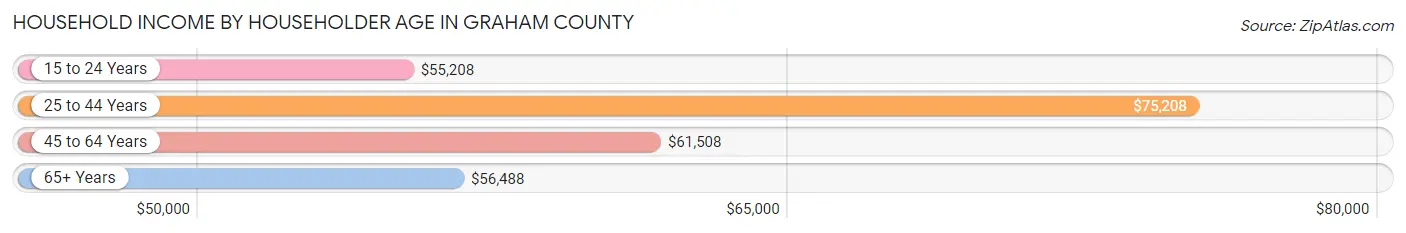
| Income Bracket | # Households | Median Income |
| 15 to 24 Years | 759 (6.3%) | $55,208 |
| 25 to 44 Years | 4,163 (34.6%) | $75,208 |
| 45 to 64 Years | 3,977 (33.1%) | $61,508 |
| 65+ Years | 3,119 (26.0%) | $56,488 |
| Total | 12,018 (100.0%) | $64,089 |
Poverty in Graham County
Income Below Poverty by Sex and Age in Graham County
With 15.0% poverty level for males and 20.3% for females among the residents of Graham County, 15 year old males and 18 to 24 year old females are the most vulnerable to poverty, with 93 males (39.4%) and 581 females (35.2%) in their respective age groups living below the poverty level.
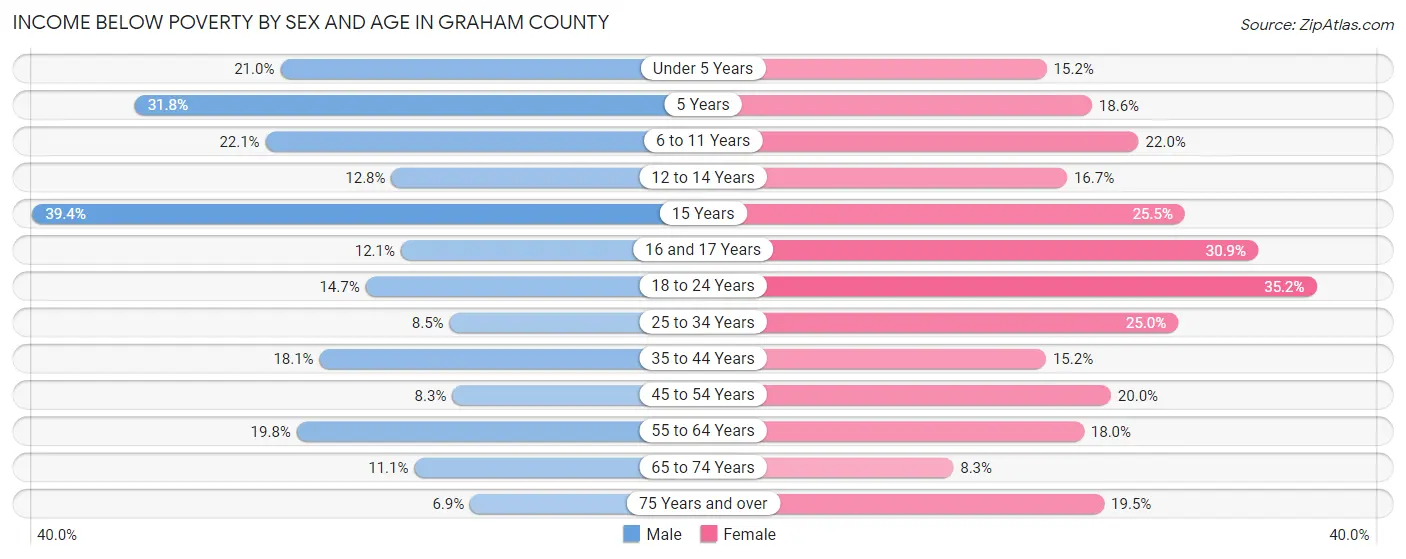
| Age Bracket | Male | Female |
| Under 5 Years | 267 (21.0%) | 188 (15.2%) |
| 5 Years | 84 (31.8%) | 39 (18.6%) |
| 6 to 11 Years | 399 (22.1%) | 365 (22.0%) |
| 12 to 14 Years | 111 (12.8%) | 160 (16.7%) |
| 15 Years | 93 (39.4%) | 83 (25.5%) |
| 16 and 17 Years | 74 (12.1%) | 177 (30.9%) |
| 18 to 24 Years | 286 (14.7%) | 581 (35.2%) |
| 25 to 34 Years | 205 (8.5%) | 603 (25.0%) |
| 35 to 44 Years | 392 (18.1%) | 328 (15.2%) |
| 45 to 54 Years | 150 (8.3%) | 364 (20.0%) |
| 55 to 64 Years | 341 (19.8%) | 341 (18.0%) |
| 65 to 74 Years | 163 (11.1%) | 127 (8.3%) |
| 75 Years and over | 68 (6.9%) | 241 (19.5%) |
| Total | 2,633 (15.0%) | 3,597 (20.3%) |
Income Above Poverty by Sex and Age in Graham County
According to the poverty statistics in Graham County, males aged 75 years and over and females aged 65 to 74 years are the age groups that are most secure financially, with 93.1% of males and 91.7% of females in these age groups living above the poverty line.
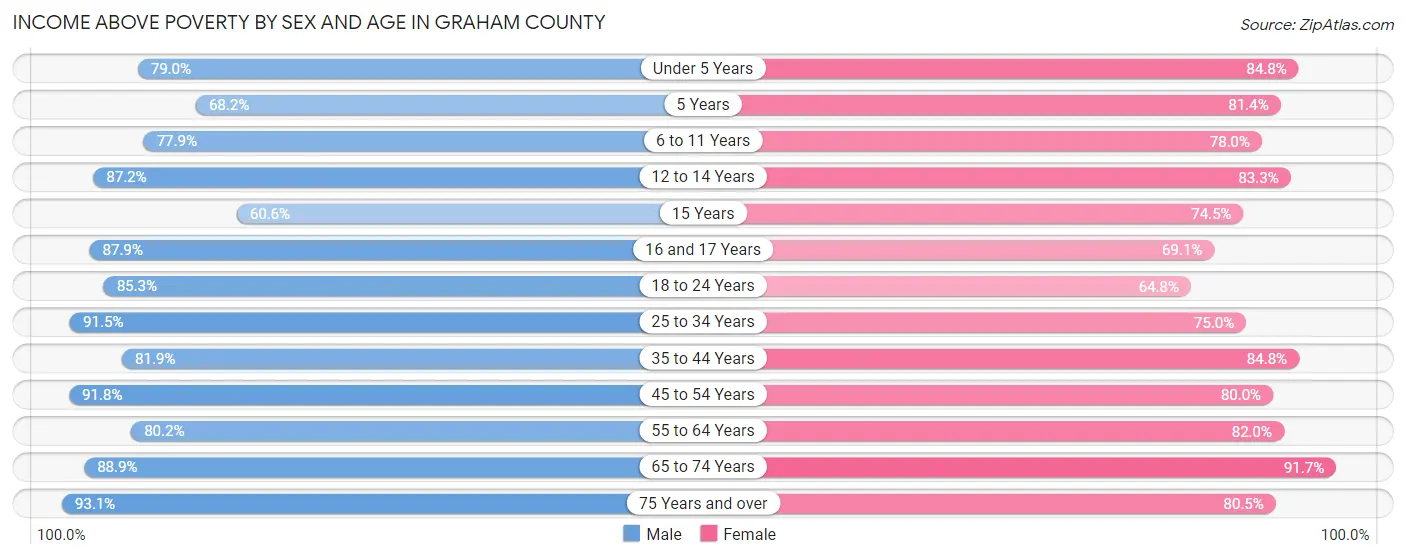
| Age Bracket | Male | Female |
| Under 5 Years | 1,003 (79.0%) | 1,048 (84.8%) |
| 5 Years | 180 (68.2%) | 171 (81.4%) |
| 6 to 11 Years | 1,405 (77.9%) | 1,291 (78.0%) |
| 12 to 14 Years | 758 (87.2%) | 797 (83.3%) |
| 15 Years | 143 (60.6%) | 243 (74.5%) |
| 16 and 17 Years | 539 (87.9%) | 396 (69.1%) |
| 18 to 24 Years | 1,661 (85.3%) | 1,068 (64.8%) |
| 25 to 34 Years | 2,218 (91.5%) | 1,813 (75.0%) |
| 35 to 44 Years | 1,773 (81.9%) | 1,836 (84.8%) |
| 45 to 54 Years | 1,668 (91.7%) | 1,458 (80.0%) |
| 55 to 64 Years | 1,381 (80.2%) | 1,557 (82.0%) |
| 65 to 74 Years | 1,310 (88.9%) | 1,406 (91.7%) |
| 75 Years and over | 913 (93.1%) | 996 (80.5%) |
| Total | 14,952 (85.0%) | 14,080 (79.6%) |
Income Below Poverty Among Married-Couple Families in Graham County
The poverty statistics for married-couple families in Graham County show that 6.0% or 348 of the total 5,776 families live below the poverty line. Families with 5 or more children have the highest poverty rate of 13.8%, comprising of 17 families. On the other hand, families with no children have the lowest poverty rate of 5.5%, which includes 167 families.
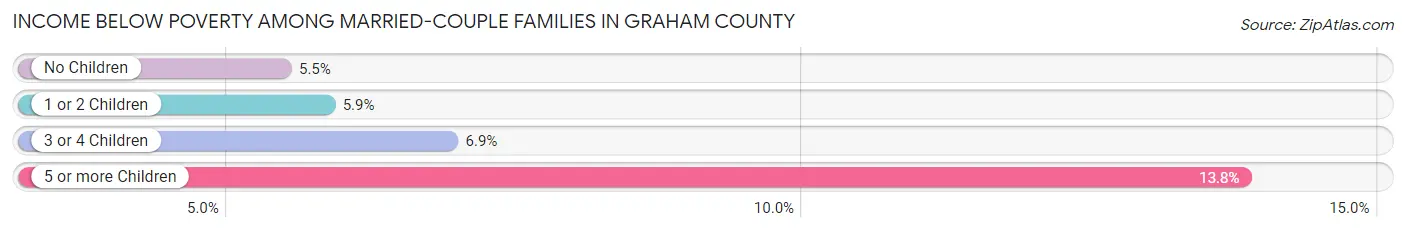
| Children | Above Poverty | Below Poverty |
| No Children | 2,885 (94.5%) | 167 (5.5%) |
| 1 or 2 Children | 1,401 (94.2%) | 87 (5.9%) |
| 3 or 4 Children | 1,036 (93.1%) | 77 (6.9%) |
| 5 or more Children | 106 (86.2%) | 17 (13.8%) |
| Total | 5,428 (94.0%) | 348 (6.0%) |
Income Below Poverty Among Single-Parent Households in Graham County
According to the poverty data in Graham County, 8.5% or 78 single-father households and 41.6% or 809 single-mother households are living below the poverty line. Among single-father households, those with 1 or 2 children have the highest poverty rate, with 63 households (16.1%) experiencing poverty. Likewise, among single-mother households, those with 3 or 4 children have the highest poverty rate, with 239 households (66.6%) falling below the poverty line.
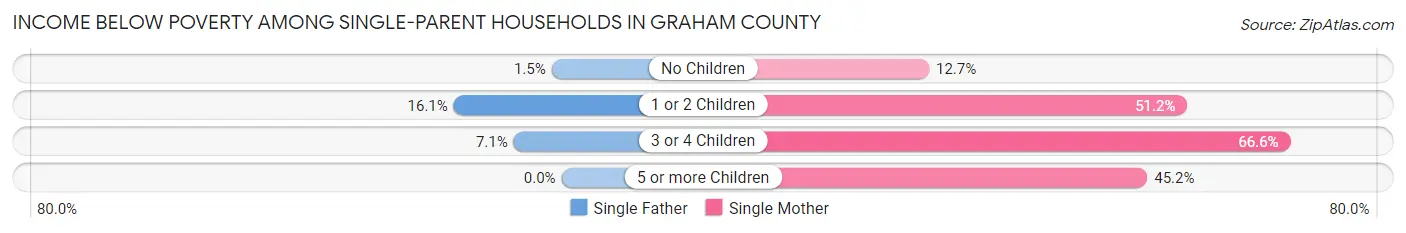
| Children | Single Father | Single Mother |
| No Children | 6 (1.5%) | 79 (12.7%) |
| 1 or 2 Children | 63 (16.1%) | 472 (51.2%) |
| 3 or 4 Children | 9 (7.1%) | 239 (66.6%) |
| 5 or more Children | 0 (0.0%) | 19 (45.2%) |
| Total | 78 (8.5%) | 809 (41.6%) |
Income Below Poverty Among Married-Couple vs Single-Parent Households in Graham County
The poverty data for Graham County shows that 348 of the married-couple family households (6.0%) and 887 of the single-parent households (30.9%) are living below the poverty level. Within the married-couple family households, those with 5 or more children have the highest poverty rate, with 17 households (13.8%) falling below the poverty line. Among the single-parent households, those with 3 or 4 children have the highest poverty rate, with 248 household (51.1%) living below poverty.
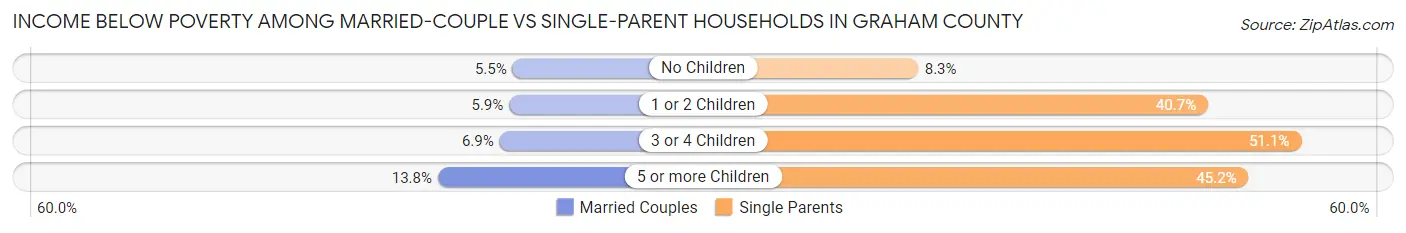
| Children | Married-Couple Families | Single-Parent Households |
| No Children | 167 (5.5%) | 85 (8.3%) |
| 1 or 2 Children | 87 (5.9%) | 535 (40.7%) |
| 3 or 4 Children | 77 (6.9%) | 248 (51.1%) |
| 5 or more Children | 17 (13.8%) | 19 (45.2%) |
| Total | 348 (6.0%) | 887 (30.9%) |
Race in Graham County
The most populous races in Graham County are White / Caucasian (26,349 | 68.5%), Hispanic or Latino (12,885 | 33.5%), and Two or more Races (4,822 | 12.5%).
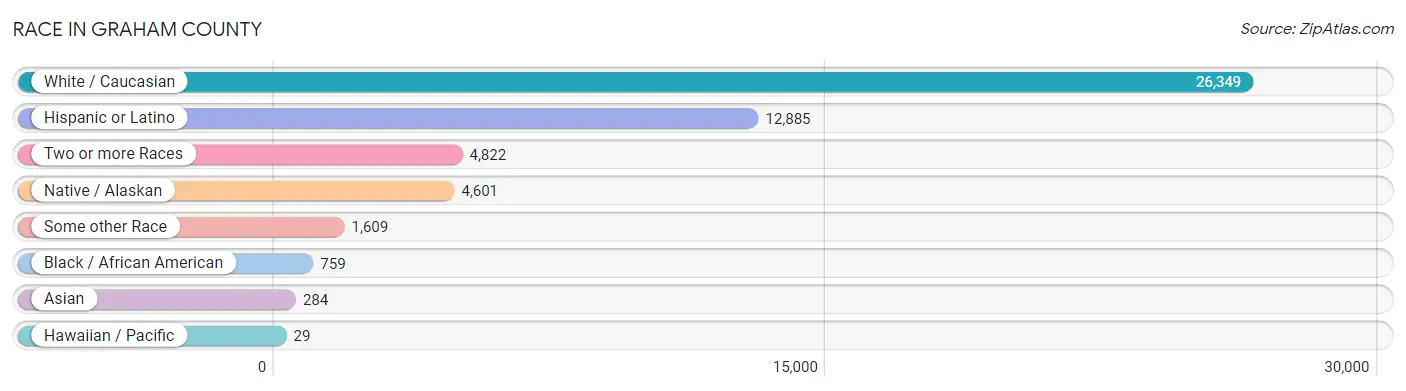
| Race | # Population | % Population |
| Asian | 284 | 0.7% |
| Black / African American | 759 | 2.0% |
| Hawaiian / Pacific | 29 | 0.1% |
| Hispanic or Latino | 12,885 | 33.5% |
| Native / Alaskan | 4,601 | 12.0% |
| White / Caucasian | 26,349 | 68.5% |
| Two or more Races | 4,822 | 12.5% |
| Some other Race | 1,609 | 4.2% |
| Total | 38,453 | 100.0% |
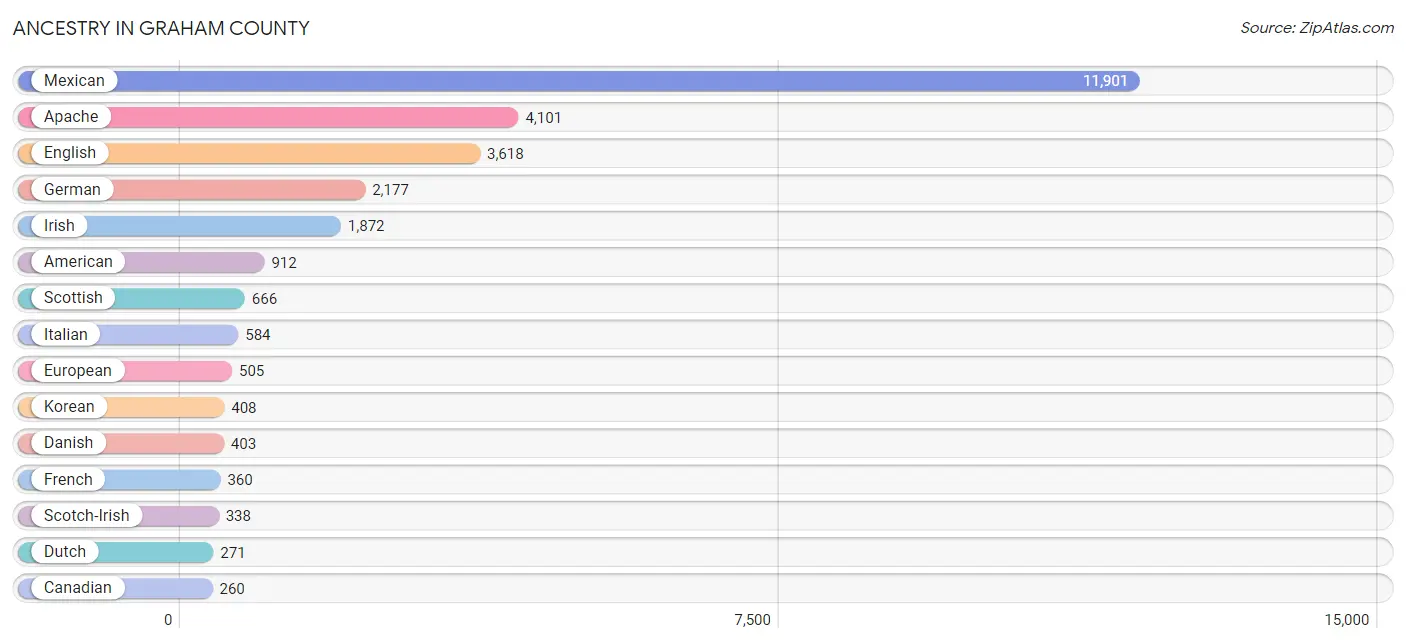
Ancestry in Graham County
The most populous ancestries reported in Graham County are Mexican (11,901 | 30.9%), Apache (4,101 | 10.7%), English (3,618 | 9.4%), German (2,177 | 5.7%), and Irish (1,872 | 4.9%), together accounting for 61.5% of all Graham County residents.
| Ancestry | # Population | % Population |
| African | 73 | 0.2% |
| American | 912 | 2.4% |
| Apache | 4,101 | 10.7% |
| Arab | 18 | 0.1% |
| Australian | 31 | 0.1% |
| Austrian | 11 | 0.0% |
| Basque | 4 | 0.0% |
| Bhutanese | 19 | 0.1% |
| Blackfeet | 50 | 0.1% |
| British | 196 | 0.5% |
| Burmese | 22 | 0.1% |
| Canadian | 260 | 0.7% |
| Celtic | 13 | 0.0% |
| Central American | 23 | 0.1% |
| Central American Indian | 19 | 0.1% |
| Cherokee | 77 | 0.2% |
| Cheyenne | 20 | 0.1% |
| Chippewa | 38 | 0.1% |
| Choctaw | 2 | 0.0% |
| Croatian | 17 | 0.0% |
| Czech | 28 | 0.1% |
| Czechoslovakian | 1 | 0.0% |
| Danish | 403 | 1.1% |
| Dutch | 271 | 0.7% |
| Dutch West Indian | 43 | 0.1% |
| Eastern European | 22 | 0.1% |
| English | 3,618 | 9.4% |
| European | 505 | 1.3% |
| Finnish | 12 | 0.0% |
| French | 360 | 0.9% |
| French Canadian | 8 | 0.0% |
| German | 2,177 | 5.7% |
| Greek | 5 | 0.0% |
| Guamanian / Chamorro | 65 | 0.2% |
| Guatemalan | 23 | 0.1% |
| Hopi | 12 | 0.0% |
| Indian (Asian) | 20 | 0.1% |
| Irish | 1,872 | 4.9% |
| Iroquois | 22 | 0.1% |
| Italian | 584 | 1.5% |
| Korean | 408 | 1.1% |
| Lebanese | 7 | 0.0% |
| Lithuanian | 22 | 0.1% |
| Mexican | 11,901 | 30.9% |
| Mexican American Indian | 152 | 0.4% |
| Moroccan | 11 | 0.0% |
| Native Hawaiian | 25 | 0.1% |
| Navajo | 157 | 0.4% |
| Northern European | 47 | 0.1% |
| Norwegian | 208 | 0.5% |
| Osage | 20 | 0.1% |
| Pima | 121 | 0.3% |
| Polish | 150 | 0.4% |
| Potawatomi | 24 | 0.1% |
| Puerto Rican | 118 | 0.3% |
| Russian | 26 | 0.1% |
| Samoan | 31 | 0.1% |
| Scandinavian | 185 | 0.5% |
| Scotch-Irish | 338 | 0.9% |
| Scottish | 666 | 1.7% |
| Serbian | 3 | 0.0% |
| Sioux | 23 | 0.1% |
| Slovak | 9 | 0.0% |
| South African | 50 | 0.1% |
| Spaniard | 123 | 0.3% |
| Spanish | 47 | 0.1% |
| Subsaharan African | 123 | 0.3% |
| Swedish | 169 | 0.4% |
| Swiss | 79 | 0.2% |
| Thai | 40 | 0.1% |
| Tohono O'Odham | 3 | 0.0% |
| Ukrainian | 83 | 0.2% |
| Welsh | 257 | 0.7% |
| Yaqui | 16 | 0.0% | View All 74 Rows |
Immigrants in Graham County
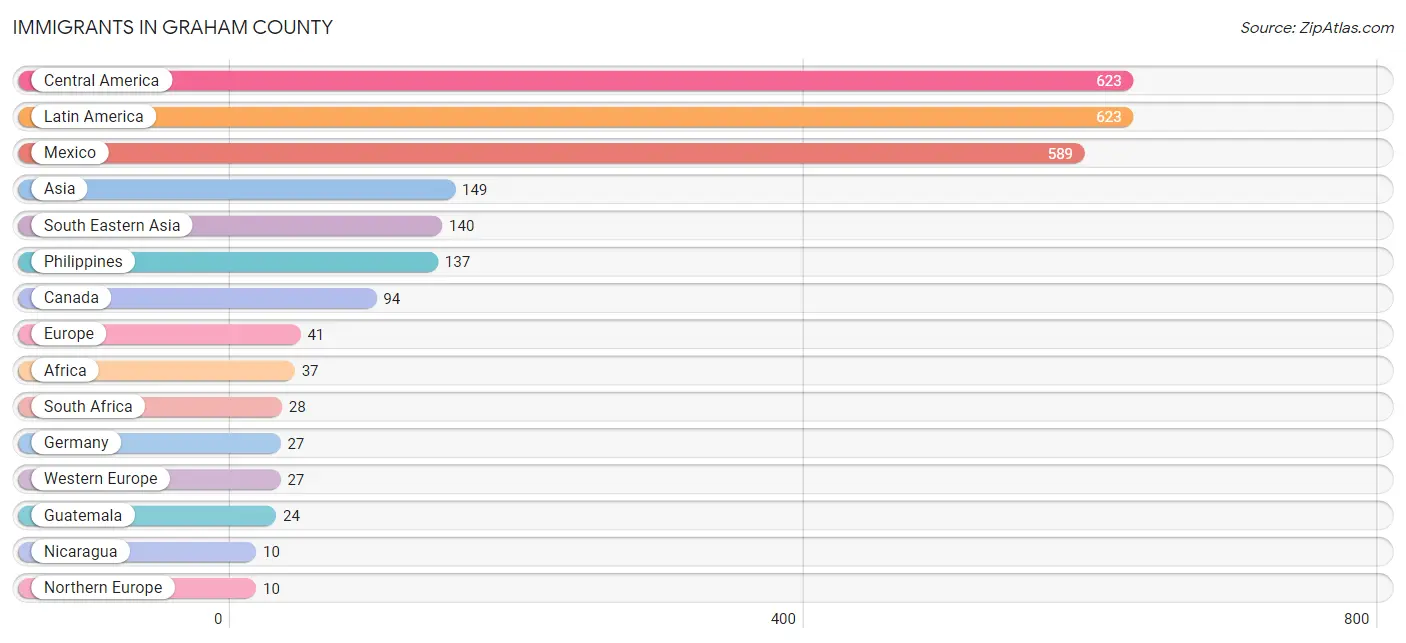
The most numerous immigrant groups reported in Graham County came from Central America (623 | 1.6%), Latin America (623 | 1.6%), Mexico (589 | 1.5%), Asia (149 | 0.4%), and South Eastern Asia (140 | 0.4%), together accounting for 5.5% of all Graham County residents.
| Immigration Origin | # Population | % Population |
| Africa | 37 | 0.1% |
| Asia | 149 | 0.4% |
| Australia | 4 | 0.0% |
| Canada | 94 | 0.2% |
| Central America | 623 | 1.6% |
| Europe | 41 | 0.1% |
| Germany | 27 | 0.1% |
| Guatemala | 24 | 0.1% |
| India | 9 | 0.0% |
| Indonesia | 3 | 0.0% |
| Latin America | 623 | 1.6% |
| Mexico | 589 | 1.5% |
| Nicaragua | 10 | 0.0% |
| Northern Europe | 10 | 0.0% |
| Norway | 1 | 0.0% |
| Oceania | 7 | 0.0% |
| Philippines | 137 | 0.4% |
| South Africa | 28 | 0.1% |
| South Central Asia | 9 | 0.0% |
| South Eastern Asia | 140 | 0.4% |
| Western Europe | 27 | 0.1% | View All 21 Rows |
Sex and Age in Graham County
Sex and Age in Graham County
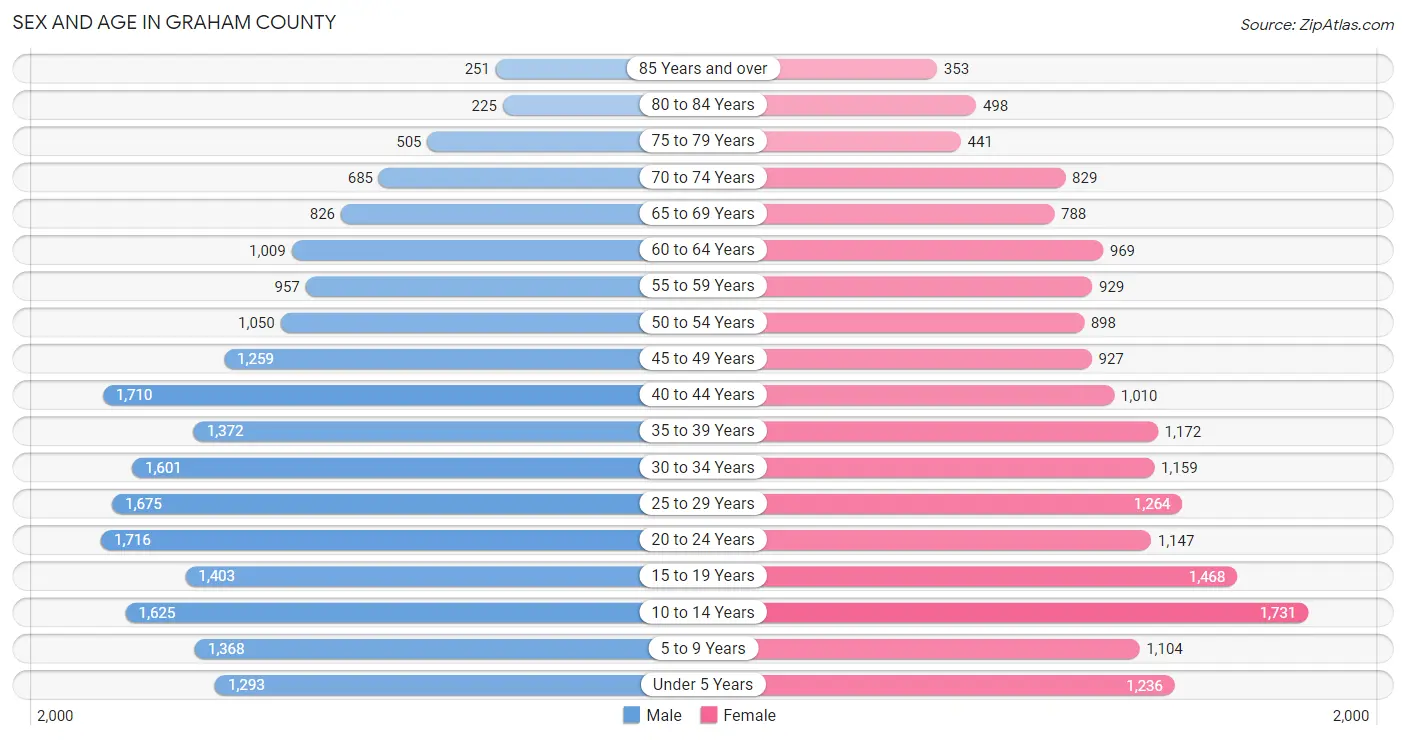
The most populous age groups in Graham County are 20 to 24 Years (1,716 | 8.4%) for men and 10 to 14 Years (1,731 | 9.7%) for women.
| Age Bracket | Male | Female |
| Under 5 Years | 1,293 (6.3%) | 1,236 (6.9%) |
| 5 to 9 Years | 1,368 (6.7%) | 1,104 (6.2%) |
| 10 to 14 Years | 1,625 (7.9%) | 1,731 (9.7%) |
| 15 to 19 Years | 1,403 (6.8%) | 1,468 (8.2%) |
| 20 to 24 Years | 1,716 (8.4%) | 1,147 (6.4%) |
| 25 to 29 Years | 1,675 (8.2%) | 1,264 (7.0%) |
| 30 to 34 Years | 1,601 (7.8%) | 1,159 (6.5%) |
| 35 to 39 Years | 1,372 (6.7%) | 1,172 (6.5%) |
| 40 to 44 Years | 1,710 (8.3%) | 1,010 (5.6%) |
| 45 to 49 Years | 1,259 (6.1%) | 927 (5.2%) |
| 50 to 54 Years | 1,050 (5.1%) | 898 (5.0%) |
| 55 to 59 Years | 957 (4.7%) | 929 (5.2%) |
| 60 to 64 Years | 1,009 (4.9%) | 969 (5.4%) |
| 65 to 69 Years | 826 (4.0%) | 788 (4.4%) |
| 70 to 74 Years | 685 (3.3%) | 829 (4.6%) |
| 75 to 79 Years | 505 (2.5%) | 441 (2.5%) |
| 80 to 84 Years | 225 (1.1%) | 498 (2.8%) |
| 85 Years and over | 251 (1.2%) | 353 (2.0%) |
| Total | 20,530 (100.0%) | 17,923 (100.0%) |
Families and Households in Graham County
Median Family Size in Graham County
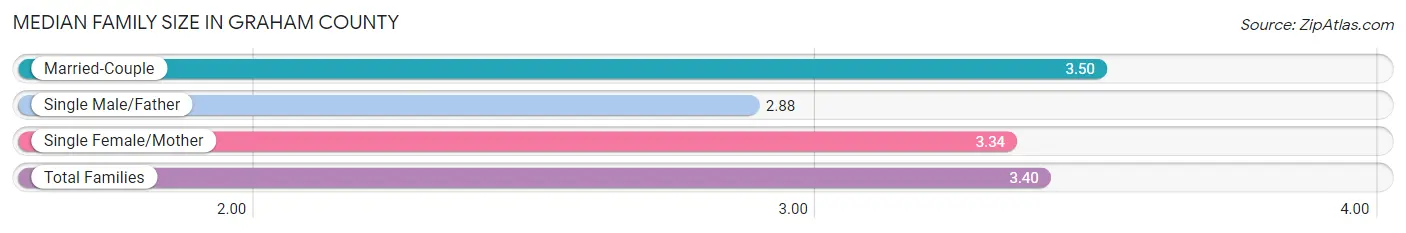
The median family size in Graham County is 3.40 persons per family, with married-couple families (5,776 | 66.8%) accounting for the largest median family size of 3.5 persons per family. On the other hand, single male/father families (923 | 10.7%) represent the smallest median family size with 2.88 persons per family.
| Family Type | # Families | Family Size |
| Married-Couple | 5,776 (66.8%) | 3.50 |
| Single Male/Father | 923 (10.7%) | 2.88 |
| Single Female/Mother | 1,944 (22.5%) | 3.34 |
| Total Families | 8,643 (100.0%) | 3.40 |
Median Household Size in Graham County
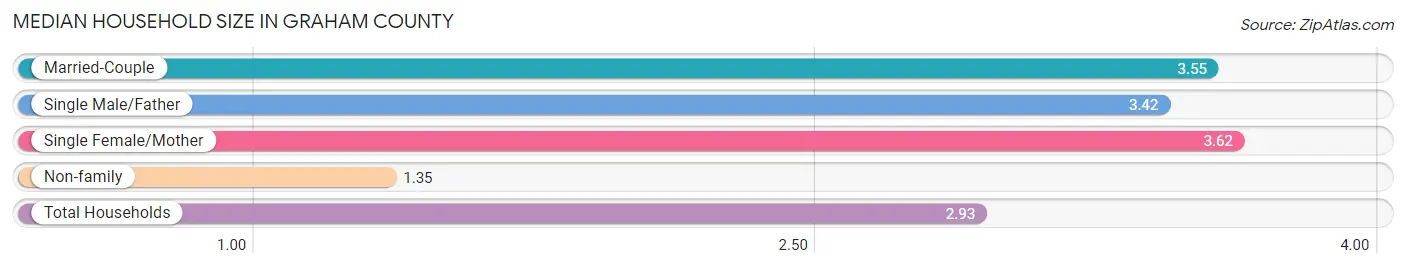
The median household size in Graham County is 2.93 persons per household, with single female/mother households (1,944 | 16.2%) accounting for the largest median household size of 3.62 persons per household. non-family households (3,375 | 28.1%) represent the smallest median household size with 1.35 persons per household.
| Household Type | # Households | Household Size |
| Married-Couple | 5,776 (48.1%) | 3.55 |
| Single Male/Father | 923 (7.7%) | 3.42 |
| Single Female/Mother | 1,944 (16.2%) | 3.62 |
| Non-family | 3,375 (28.1%) | 1.35 |
| Total Households | 12,018 (100.0%) | 2.93 |
Household Size by Marriage Status in Graham County
Out of a total of 12,018 households in Graham County, 8,643 (71.9%) are family households, while 3,375 (28.1%) are nonfamily households. The most numerous type of family households are 2-person households, comprising 3,161, and the most common type of nonfamily households are 1-person households, comprising 2,620.
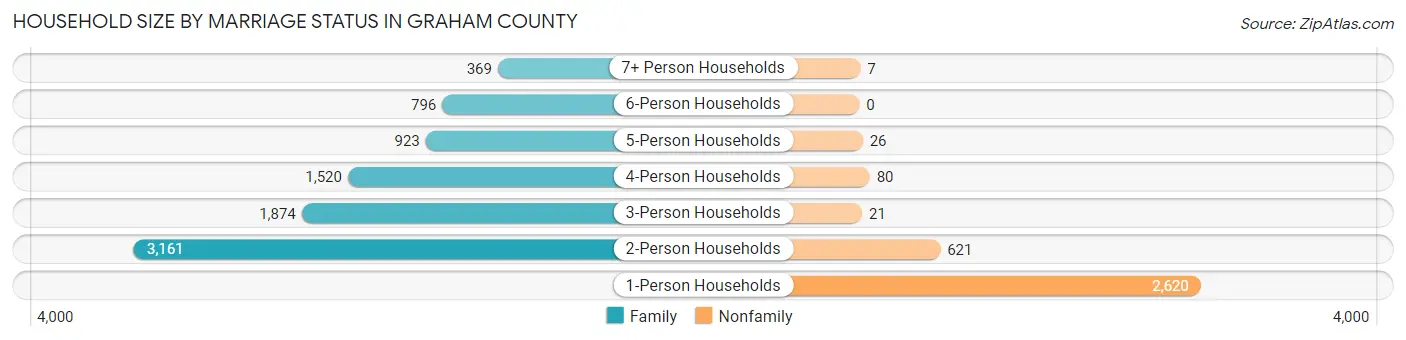
| Household Size | Family Households | Nonfamily Households |
| 1-Person Households | - | 2,620 (21.8%) |
| 2-Person Households | 3,161 (26.3%) | 621 (5.2%) |
| 3-Person Households | 1,874 (15.6%) | 21 (0.2%) |
| 4-Person Households | 1,520 (12.7%) | 80 (0.7%) |
| 5-Person Households | 923 (7.7%) | 26 (0.2%) |
| 6-Person Households | 796 (6.6%) | 0 (0.0%) |
| 7+ Person Households | 369 (3.1%) | 7 (0.1%) |
| Total | 8,643 (71.9%) | 3,375 (28.1%) |
Female Fertility in Graham County
Fertility by Age in Graham County
Average fertility rate in Graham County is 60.0 births per 1,000 women. Women in the age bracket of 20 to 34 years have the highest fertility rate with 121.0 births per 1,000 women. Women in the age bracket of 20 to 34 years acount for 85.7% of all women with births.
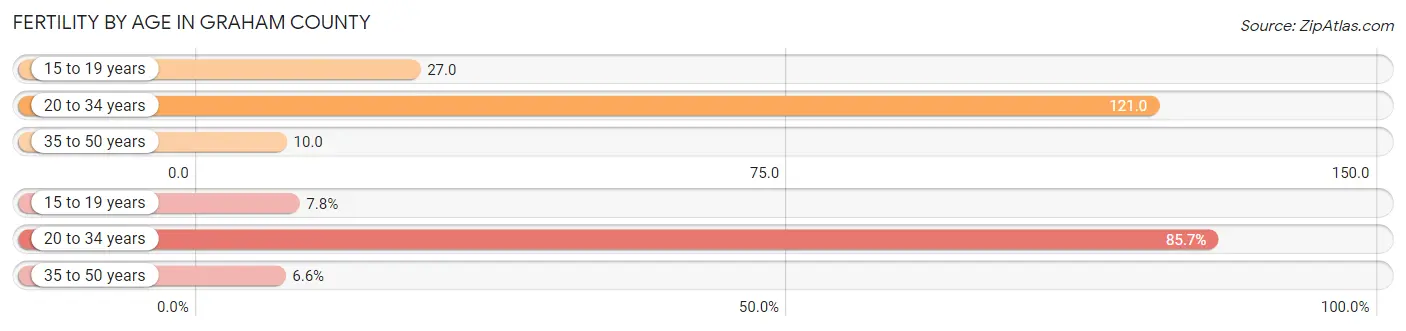
| Age Bracket | Women with Births | Births / 1,000 Women |
| 15 to 19 years | 39 (7.7%) | 27.0 |
| 20 to 34 years | 431 (85.7%) | 121.0 |
| 35 to 50 years | 33 (6.6%) | 10.0 |
| Total | 503 (100.0%) | 60.0 |
Fertility by Age by Marriage Status in Graham County
70.6% of women with births (503) in Graham County are married. The highest percentage of unmarried women with births falls into 15 to 19 years age bracket with 100.0% of them unmarried at the time of birth, while the lowest percentage of unmarried women with births belong to 20 to 34 years age bracket with 19.0% of them unmarried.
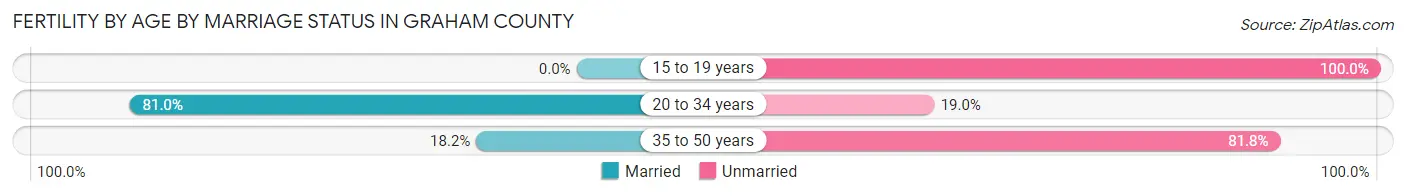
| Age Bracket | Married | Unmarried |
| 15 to 19 years | 0 (0.0%) | 39 (100.0%) |
| 20 to 34 years | 349 (81.0%) | 82 (19.0%) |
| 35 to 50 years | 6 (18.2%) | 27 (81.8%) |
| Total | 355 (70.6%) | 148 (29.4%) |
Fertility by Education in Graham County
Average fertility rate in Graham County is 60.0 births per 1,000 women. Women with the education attainment of college or associate's degree have the highest fertility rate of 82.0 births per 1,000 women, while women with the education attainment of bachelor's degree have the lowest fertility at 38.0 births per 1,000 women. Women with the education attainment of college or associate's degree represent 48.3% of all women with births.
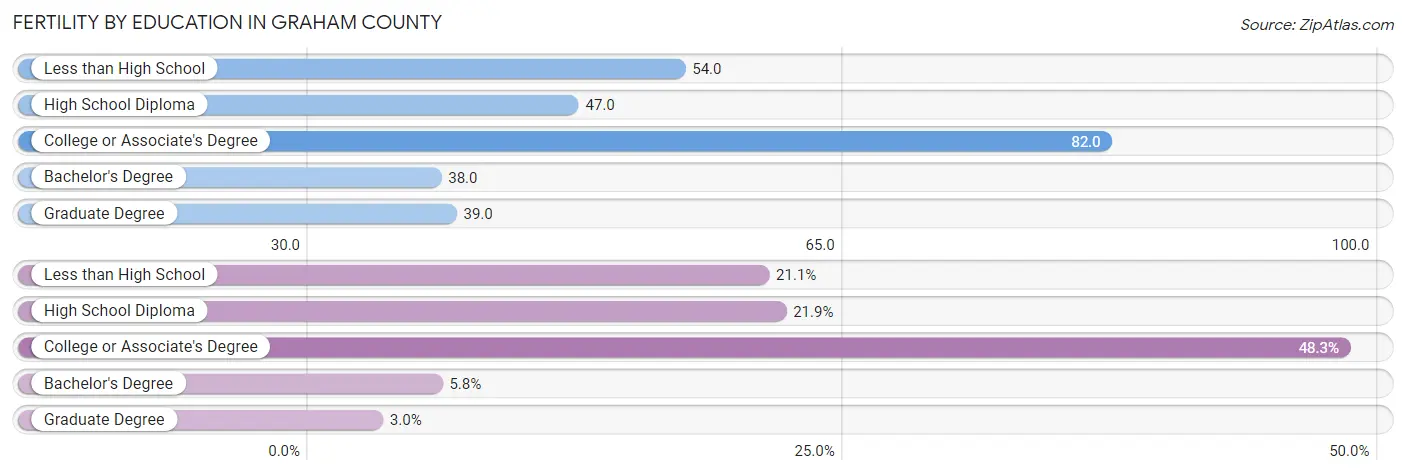
| Educational Attainment | Women with Births | Births / 1,000 Women |
| Less than High School | 106 (21.1%) | 54.0 |
| High School Diploma | 110 (21.9%) | 47.0 |
| College or Associate's Degree | 243 (48.3%) | 82.0 |
| Bachelor's Degree | 29 (5.8%) | 38.0 |
| Graduate Degree | 15 (3.0%) | 39.0 |
| Total | 503 (100.0%) | 60.0 |
Fertility by Education by Marriage Status in Graham County
29.4% of women with births in Graham County are unmarried. Women with the educational attainment of bachelor's degree are most likely to be married with 100.0% of them married at childbirth, while women with the educational attainment of less than high school are least likely to be married with 74.5% of them unmarried at childbirth.
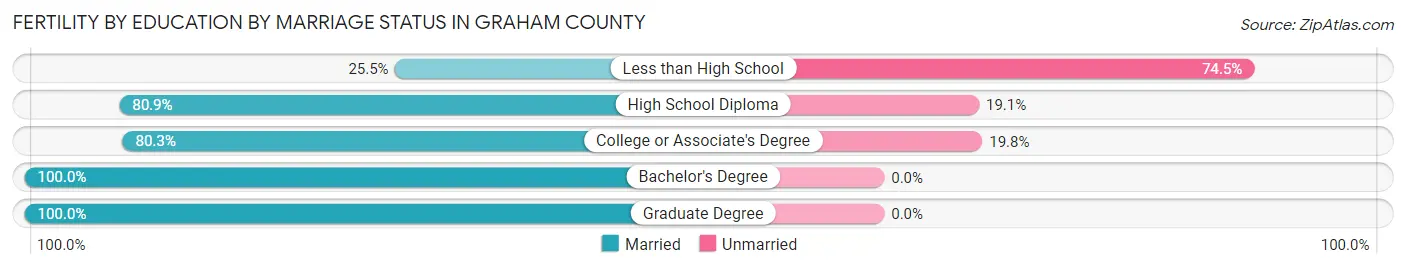
| Educational Attainment | Married | Unmarried |
| Less than High School | 27 (25.5%) | 79 (74.5%) |
| High School Diploma | 89 (80.9%) | 21 (19.1%) |
| College or Associate's Degree | 195 (80.2%) | 48 (19.8%) |
| Bachelor's Degree | 29 (100.0%) | 0 (0.0%) |
| Graduate Degree | 15 (100.0%) | 0 (0.0%) |
| Total | 355 (70.6%) | 148 (29.4%) |
Employment Characteristics in Graham County
Employment by Class of Employer in Graham County
Among the 13,864 employed individuals in Graham County, private company employees (9,546 | 68.9%), local government employees (1,211 | 8.7%), and state government employees (957 | 6.9%) make up the most common classes of employment.
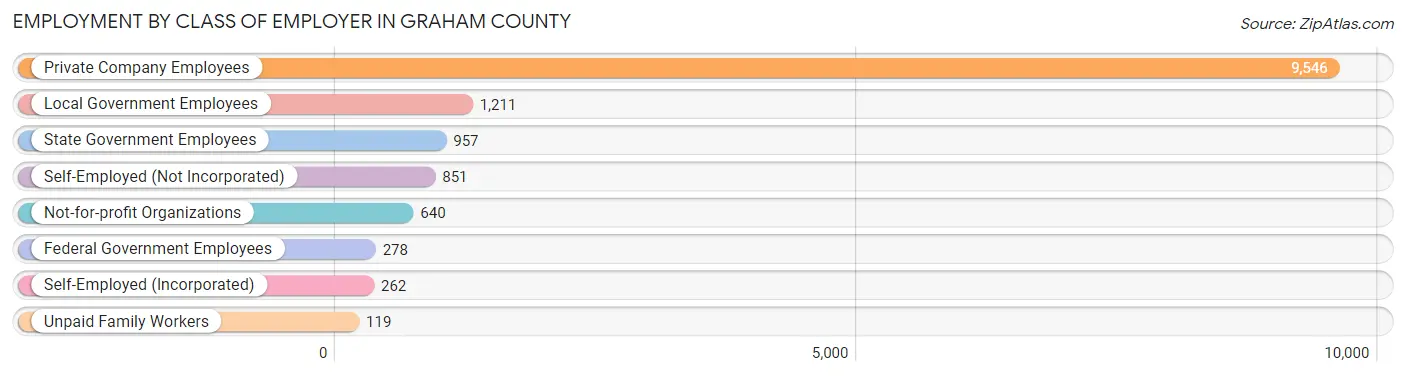
| Employer Class | # Employees | % Employees |
| Private Company Employees | 9,546 | 68.9% |
| Self-Employed (Incorporated) | 262 | 1.9% |
| Self-Employed (Not Incorporated) | 851 | 6.1% |
| Not-for-profit Organizations | 640 | 4.6% |
| Local Government Employees | 1,211 | 8.7% |
| State Government Employees | 957 | 6.9% |
| Federal Government Employees | 278 | 2.0% |
| Unpaid Family Workers | 119 | 0.9% |
| Total | 13,864 | 100.0% |
Employment Status by Age in Graham County
According to the labor force statistics for Graham County, out of the total population over 16 years of age (29,531), 50.6% or 14,943 individuals are in the labor force, with 6.0% or 897 of them unemployed. The age group with the highest labor force participation rate is 20 to 24 years, with 73.2% or 2,096 individuals in the labor force. Within the labor force, the 16 to 19 years age range has the highest percentage of unemployed individuals, with 11.6% or 83 of them being unemployed.
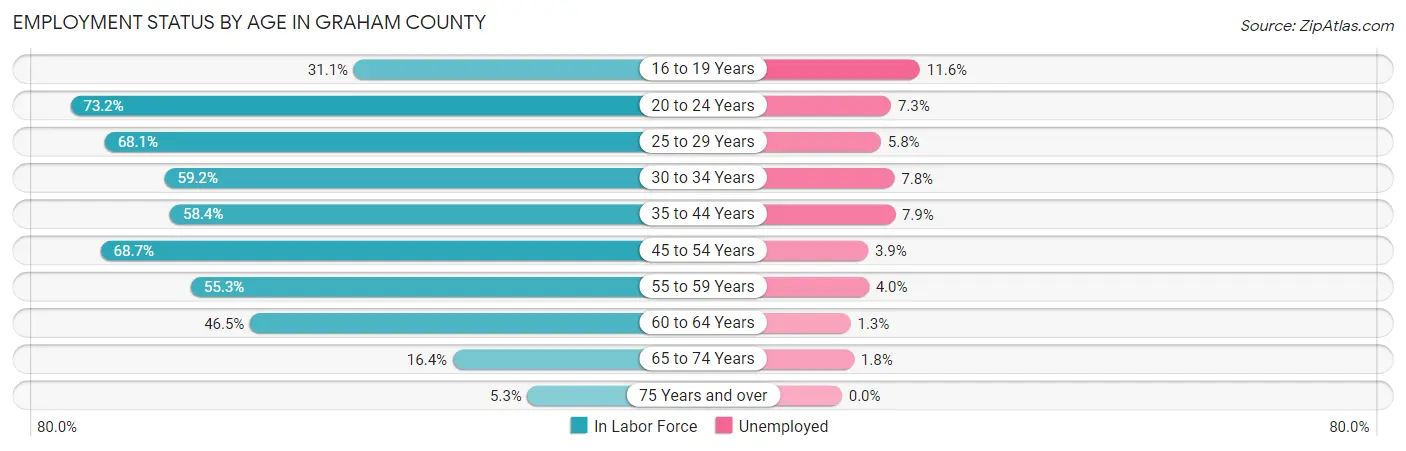
| Age Bracket | In Labor Force | Unemployed |
| 16 to 19 Years | 717 (31.1%) | 83 (11.6%) |
| 20 to 24 Years | 2,096 (73.2%) | 153 (7.3%) |
| 25 to 29 Years | 2,001 (68.1%) | 116 (5.8%) |
| 30 to 34 Years | 1,634 (59.2%) | 127 (7.8%) |
| 35 to 44 Years | 3,074 (58.4%) | 243 (7.9%) |
| 45 to 54 Years | 2,840 (68.7%) | 111 (3.9%) |
| 55 to 59 Years | 1,043 (55.3%) | 42 (4.0%) |
| 60 to 64 Years | 920 (46.5%) | 12 (1.3%) |
| 65 to 74 Years | 513 (16.4%) | 9 (1.8%) |
| 75 Years and over | 120 (5.3%) | 0 (0.0%) |
| Total | 14,943 (50.6%) | 897 (6.0%) |
Employment Status by Educational Attainment in Graham County
According to labor force statistics for Graham County, 60.7% of individuals (11,509) out of the total population between 25 and 64 years of age (18,961) are in the labor force, with 5.6% or 645 of them being unemployed. The group with the highest labor force participation rate are those with the educational attainment of bachelor's degree or higher, with 72.0% or 1,780 individuals in the labor force. Within the labor force, individuals with less than high school education have the highest percentage of unemployment, with 13.4% or 136 of them being unemployed.
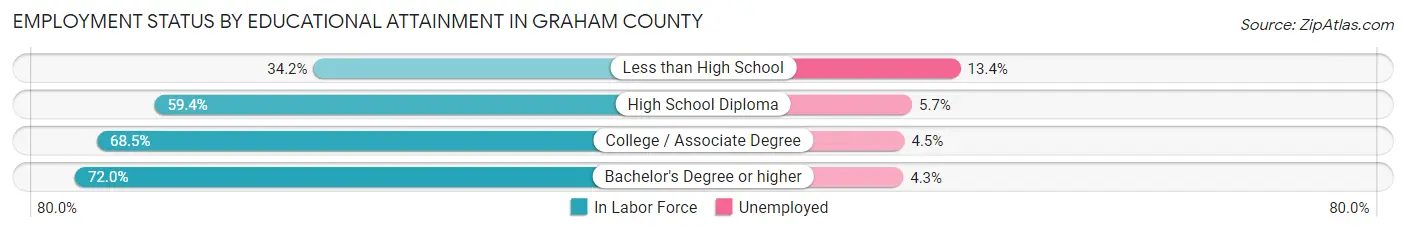
| Educational Attainment | In Labor Force | Unemployed |
| Less than High School | 1,014 (34.2%) | 397 (13.4%) |
| High School Diploma | 3,562 (59.4%) | 342 (5.7%) |
| College / Associate Degree | 5,156 (68.5%) | 339 (4.5%) |
| Bachelor's Degree or higher | 1,780 (72.0%) | 106 (4.3%) |
| Total | 11,509 (60.7%) | 1,062 (5.6%) |
Employment Occupations by Sex in Graham County
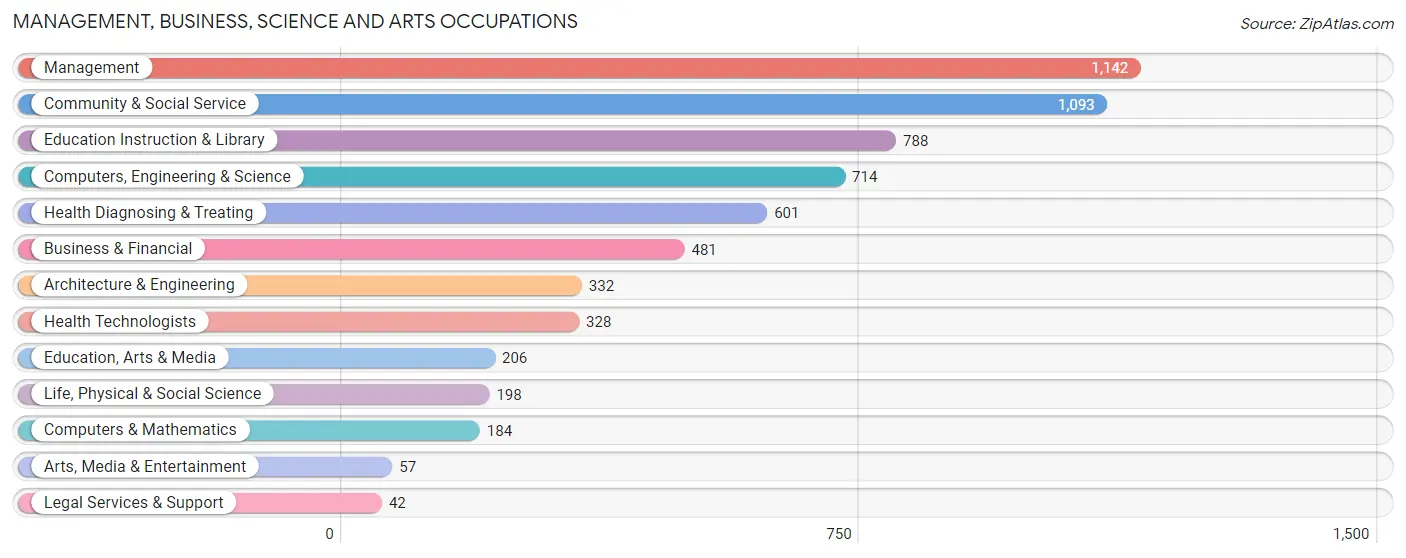
Management, Business, Science and Arts Occupations
The most common Management, Business, Science and Arts occupations in Graham County are Management (1,142 | 8.1%), Community & Social Service (1,093 | 7.8%), Education Instruction & Library (788 | 5.6%), Computers, Engineering & Science (714 | 5.1%), and Health Diagnosing & Treating (601 | 4.3%).
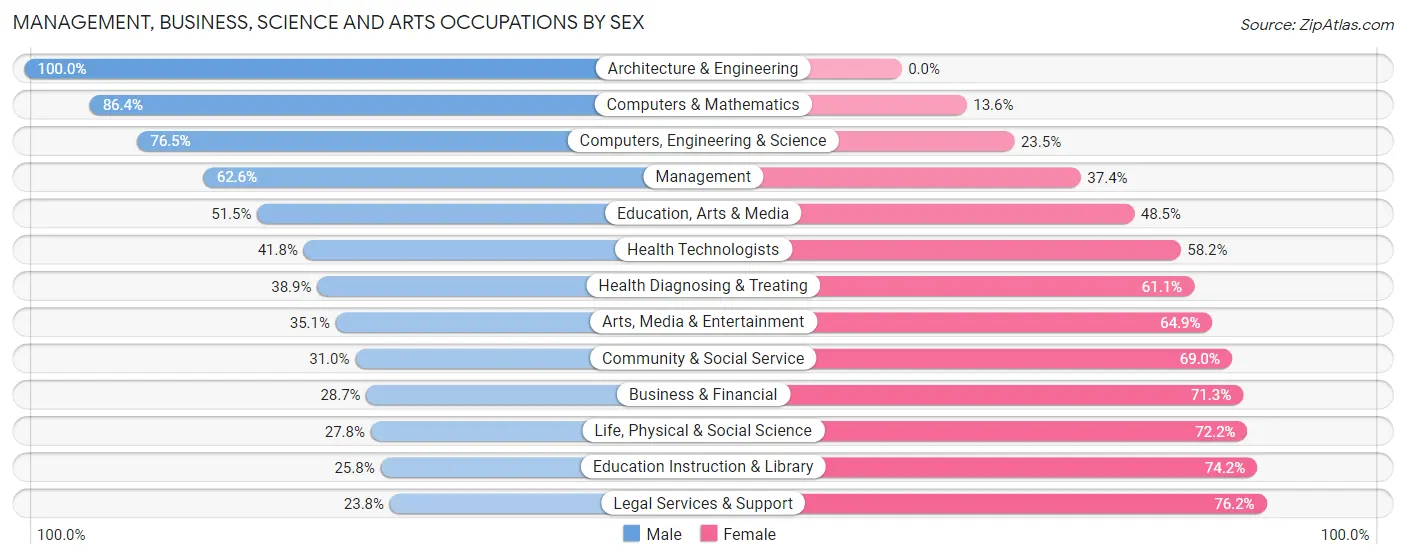
Management, Business, Science and Arts Occupations by Sex
Within the Management, Business, Science and Arts occupations in Graham County, the most male-oriented occupations are Architecture & Engineering (100.0%), Computers & Mathematics (86.4%), and Computers, Engineering & Science (76.5%), while the most female-oriented occupations are Legal Services & Support (76.2%), Education Instruction & Library (74.2%), and Life, Physical & Social Science (72.2%).
| Occupation | Male | Female |
| Management | 715 (62.6%) | 427 (37.4%) |
| Business & Financial | 138 (28.7%) | 343 (71.3%) |
| Computers, Engineering & Science | 546 (76.5%) | 168 (23.5%) |
| Computers & Mathematics | 159 (86.4%) | 25 (13.6%) |
| Architecture & Engineering | 332 (100.0%) | 0 (0.0%) |
| Life, Physical & Social Science | 55 (27.8%) | 143 (72.2%) |
| Community & Social Service | 339 (31.0%) | 754 (69.0%) |
| Education, Arts & Media | 106 (51.5%) | 100 (48.5%) |
| Legal Services & Support | 10 (23.8%) | 32 (76.2%) |
| Education Instruction & Library | 203 (25.8%) | 585 (74.2%) |
| Arts, Media & Entertainment | 20 (35.1%) | 37 (64.9%) |
| Health Diagnosing & Treating | 234 (38.9%) | 367 (61.1%) |
| Health Technologists | 137 (41.8%) | 191 (58.2%) |
| Total (Category) | 1,972 (48.9%) | 2,059 (51.1%) |
| Total (Overall) | 7,734 (55.0%) | 6,330 (45.0%) |
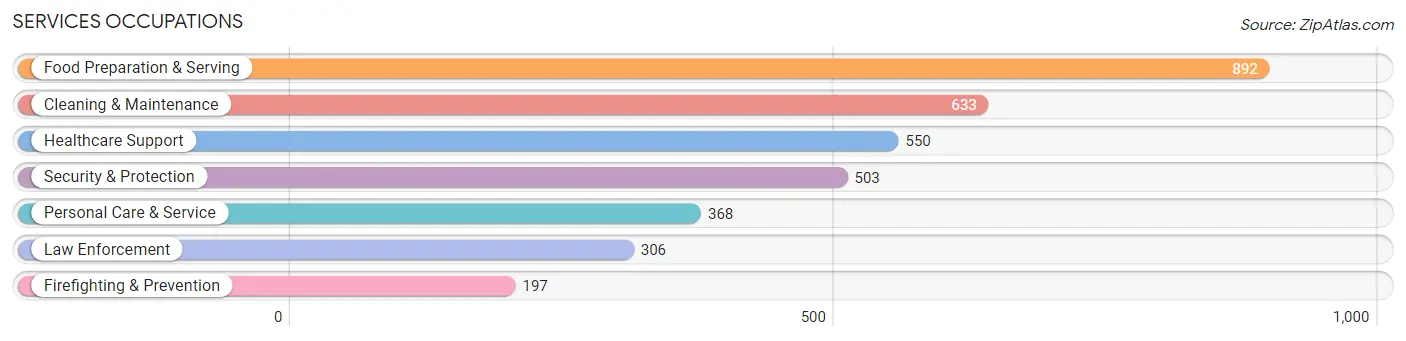
Services Occupations
The most common Services occupations in Graham County are Food Preparation & Serving (892 | 6.3%), Cleaning & Maintenance (633 | 4.5%), Healthcare Support (550 | 3.9%), Security & Protection (503 | 3.6%), and Personal Care & Service (368 | 2.6%).
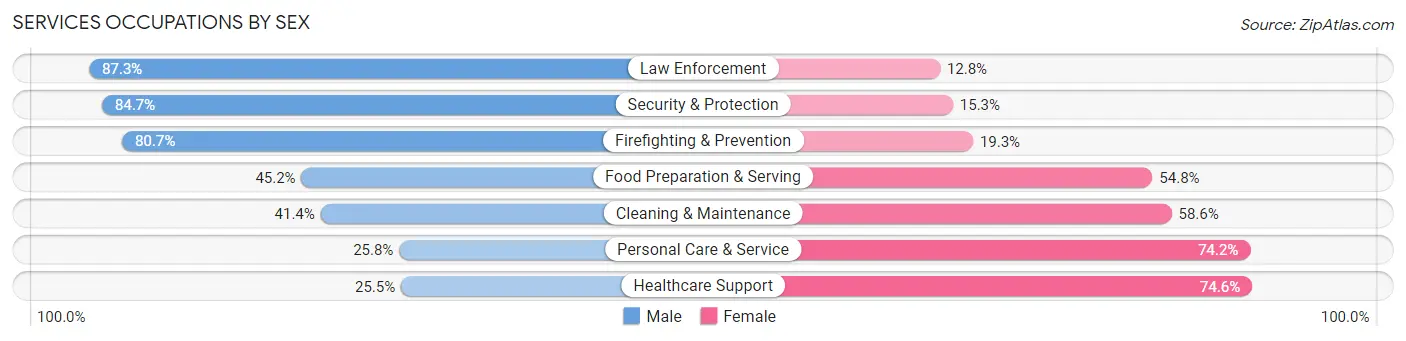
Services Occupations by Sex
Within the Services occupations in Graham County, the most male-oriented occupations are Law Enforcement (87.3%), Security & Protection (84.7%), and Firefighting & Prevention (80.7%), while the most female-oriented occupations are Healthcare Support (74.6%), Personal Care & Service (74.2%), and Cleaning & Maintenance (58.6%).
| Occupation | Male | Female |
| Healthcare Support | 140 (25.5%) | 410 (74.6%) |
| Security & Protection | 426 (84.7%) | 77 (15.3%) |
| Firefighting & Prevention | 159 (80.7%) | 38 (19.3%) |
| Law Enforcement | 267 (87.3%) | 39 (12.8%) |
| Food Preparation & Serving | 403 (45.2%) | 489 (54.8%) |
| Cleaning & Maintenance | 262 (41.4%) | 371 (58.6%) |
| Personal Care & Service | 95 (25.8%) | 273 (74.2%) |
| Total (Category) | 1,326 (45.0%) | 1,620 (55.0%) |
| Total (Overall) | 7,734 (55.0%) | 6,330 (45.0%) |
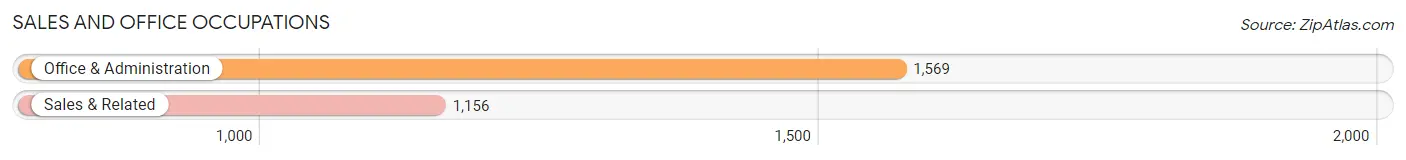
Sales and Office Occupations
The most common Sales and Office occupations in Graham County are Office & Administration (1,569 | 11.2%), and Sales & Related (1,156 | 8.2%).
Sales and Office Occupations by Sex
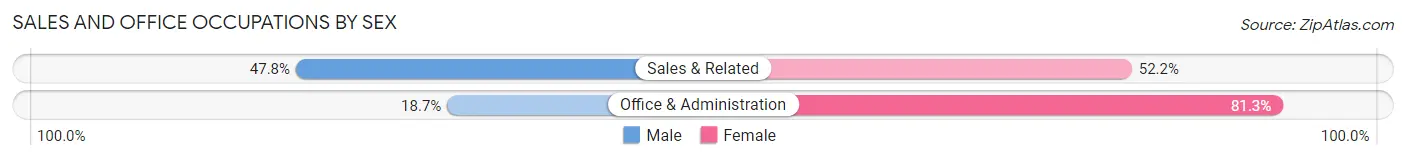
| Occupation | Male | Female |
| Sales & Related | 553 (47.8%) | 603 (52.2%) |
| Office & Administration | 294 (18.7%) | 1,275 (81.3%) |
| Total (Category) | 847 (31.1%) | 1,878 (68.9%) |
| Total (Overall) | 7,734 (55.0%) | 6,330 (45.0%) |
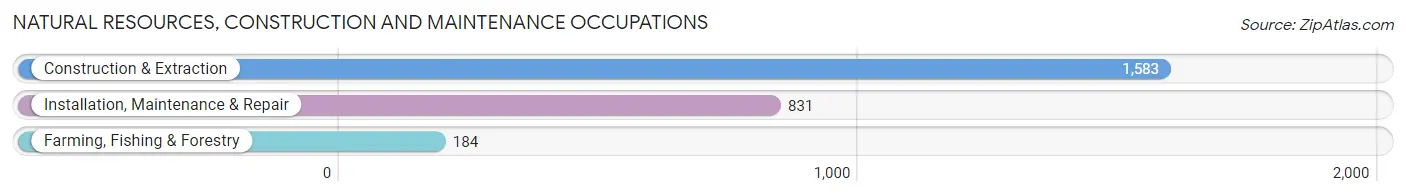
Natural Resources, Construction and Maintenance Occupations
The most common Natural Resources, Construction and Maintenance occupations in Graham County are Construction & Extraction (1,583 | 11.3%), Installation, Maintenance & Repair (831 | 5.9%), and Farming, Fishing & Forestry (184 | 1.3%).
Natural Resources, Construction and Maintenance Occupations by Sex
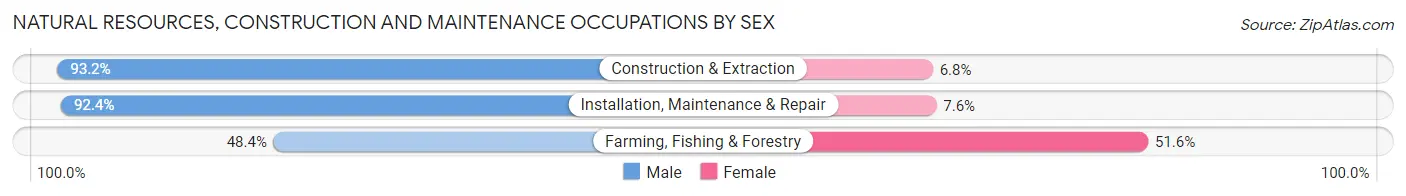
| Occupation | Male | Female |
| Farming, Fishing & Forestry | 89 (48.4%) | 95 (51.6%) |
| Construction & Extraction | 1,475 (93.2%) | 108 (6.8%) |
| Installation, Maintenance & Repair | 768 (92.4%) | 63 (7.6%) |
| Total (Category) | 2,332 (89.8%) | 266 (10.2%) |
| Total (Overall) | 7,734 (55.0%) | 6,330 (45.0%) |
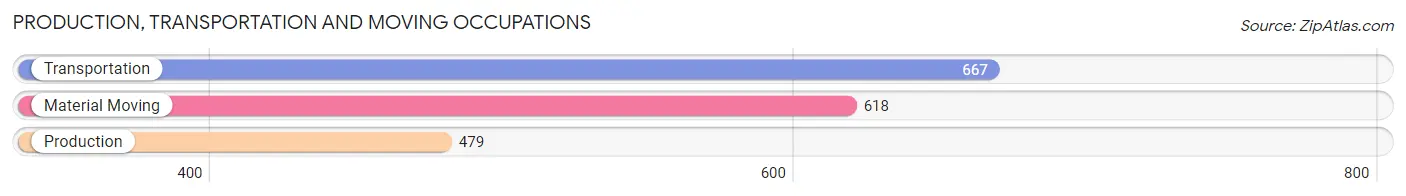
Production, Transportation and Moving Occupations
The most common Production, Transportation and Moving occupations in Graham County are Transportation (667 | 4.7%), Material Moving (618 | 4.4%), and Production (479 | 3.4%).
Production, Transportation and Moving Occupations by Sex
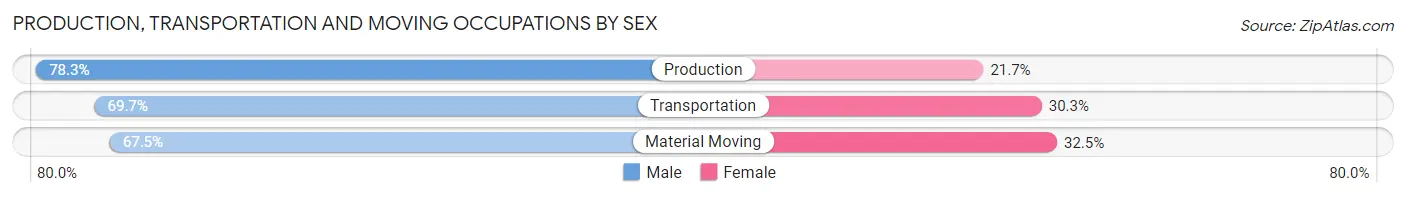
| Occupation | Male | Female |
| Production | 375 (78.3%) | 104 (21.7%) |
| Transportation | 465 (69.7%) | 202 (30.3%) |
| Material Moving | 417 (67.5%) | 201 (32.5%) |
| Total (Category) | 1,257 (71.3%) | 507 (28.7%) |
| Total (Overall) | 7,734 (55.0%) | 6,330 (45.0%) |
Employment Industries by Sex in Graham County
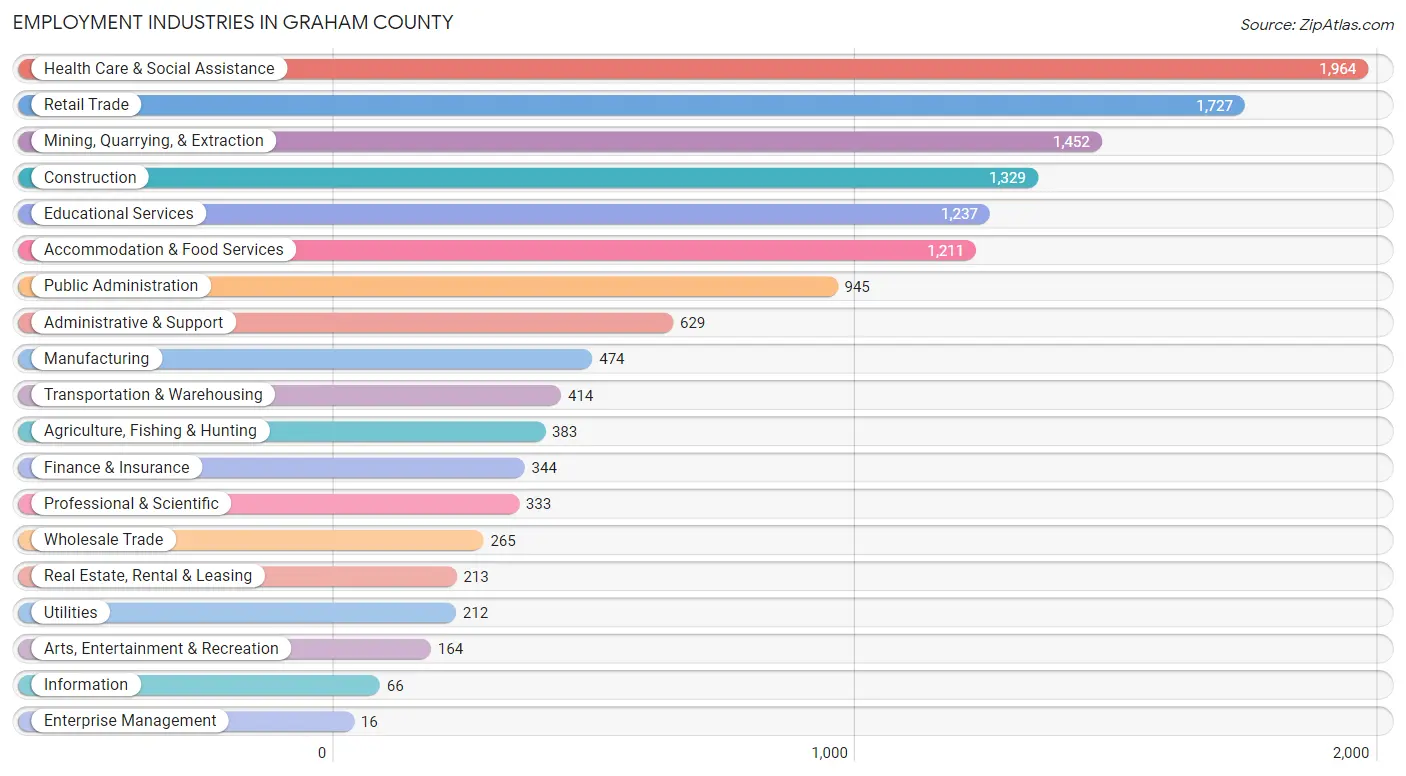
Employment Industries in Graham County
The major employment industries in Graham County include Health Care & Social Assistance (1,964 | 14.0%), Retail Trade (1,727 | 12.3%), Mining, Quarrying, & Extraction (1,452 | 10.3%), Construction (1,329 | 9.5%), and Educational Services (1,237 | 8.8%).
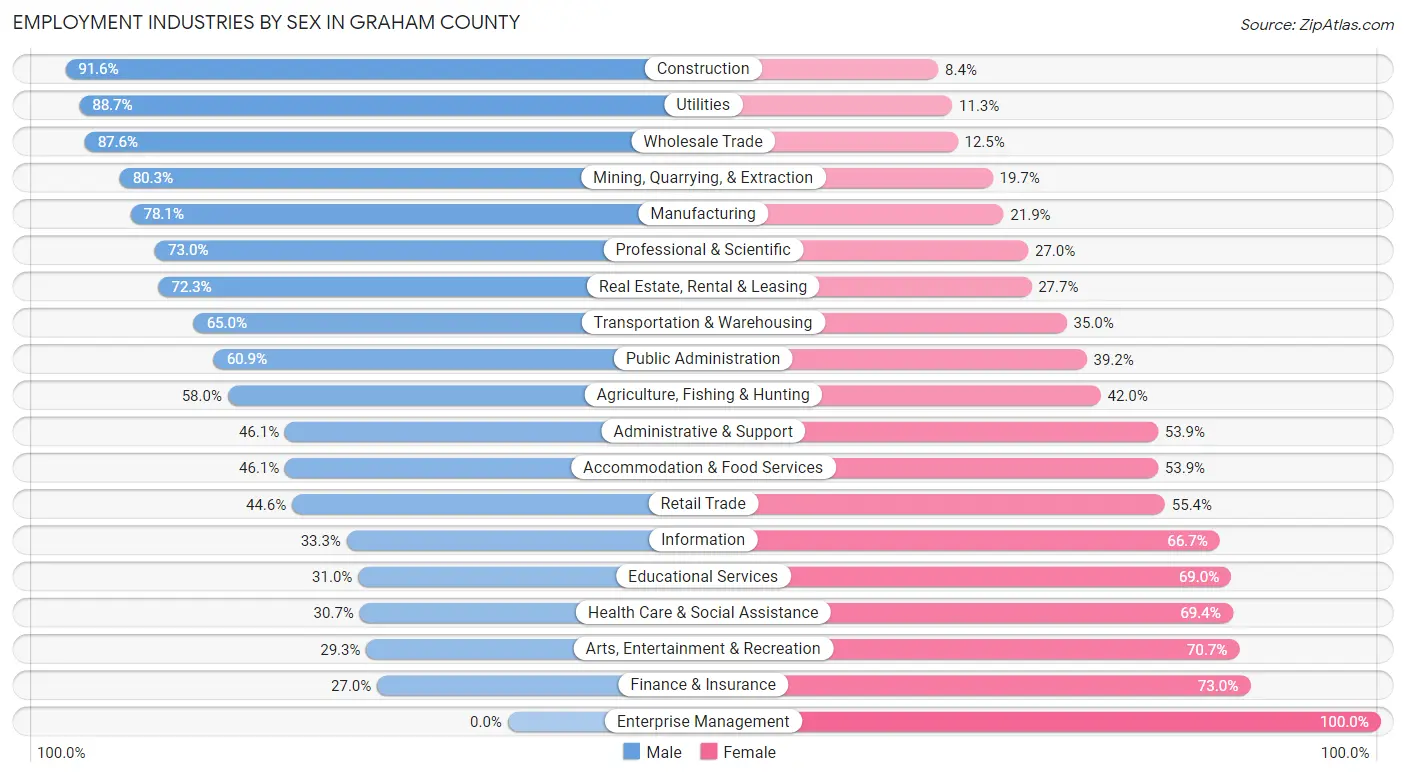
Employment Industries by Sex in Graham County
The Graham County industries that see more men than women are Construction (91.6%), Utilities (88.7%), and Wholesale Trade (87.5%), whereas the industries that tend to have a higher number of women are Enterprise Management (100.0%), Finance & Insurance (73.0%), and Arts, Entertainment & Recreation (70.7%).
| Industry | Male | Female |
| Agriculture, Fishing & Hunting | 222 (58.0%) | 161 (42.0%) |
| Mining, Quarrying, & Extraction | 1,166 (80.3%) | 286 (19.7%) |
| Construction | 1,217 (91.6%) | 112 (8.4%) |
| Manufacturing | 370 (78.1%) | 104 (21.9%) |
| Wholesale Trade | 232 (87.5%) | 33 (12.4%) |
| Retail Trade | 771 (44.6%) | 956 (55.4%) |
| Transportation & Warehousing | 269 (65.0%) | 145 (35.0%) |
| Utilities | 188 (88.7%) | 24 (11.3%) |
| Information | 22 (33.3%) | 44 (66.7%) |
| Finance & Insurance | 93 (27.0%) | 251 (73.0%) |
| Real Estate, Rental & Leasing | 154 (72.3%) | 59 (27.7%) |
| Professional & Scientific | 243 (73.0%) | 90 (27.0%) |
| Enterprise Management | 0 (0.0%) | 16 (100.0%) |
| Administrative & Support | 290 (46.1%) | 339 (53.9%) |
| Educational Services | 383 (31.0%) | 854 (69.0%) |
| Health Care & Social Assistance | 602 (30.6%) | 1,362 (69.4%) |
| Arts, Entertainment & Recreation | 48 (29.3%) | 116 (70.7%) |
| Accommodation & Food Services | 558 (46.1%) | 653 (53.9%) |
| Public Administration | 575 (60.9%) | 370 (39.2%) |
| Total | 7,734 (55.0%) | 6,330 (45.0%) |
Education in Graham County
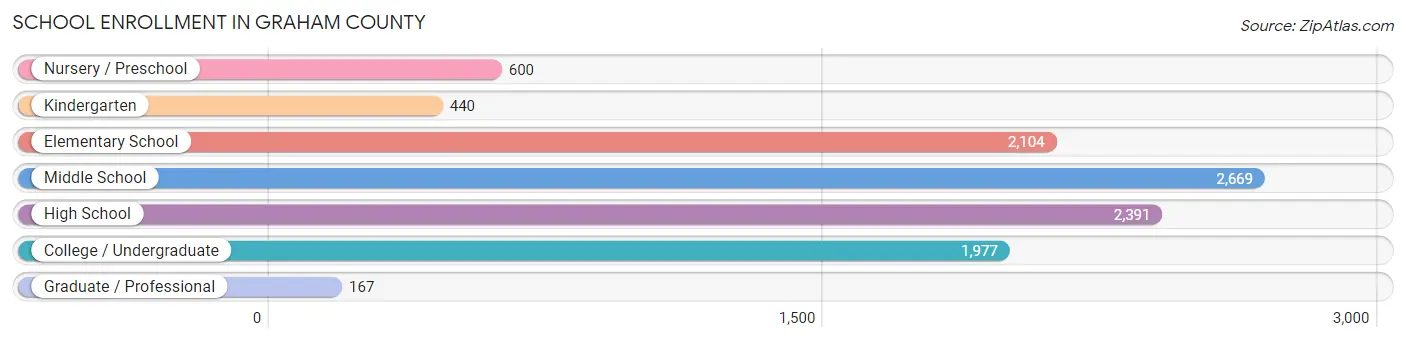
School Enrollment in Graham County
The most common levels of schooling among the 10,348 students in Graham County are middle school (2,669 | 25.8%), high school (2,391 | 23.1%), and elementary school (2,104 | 20.3%).
| School Level | # Students | % Students |
| Nursery / Preschool | 600 | 5.8% |
| Kindergarten | 440 | 4.3% |
| Elementary School | 2,104 | 20.3% |
| Middle School | 2,669 | 25.8% |
| High School | 2,391 | 23.1% |
| College / Undergraduate | 1,977 | 19.1% |
| Graduate / Professional | 167 | 1.6% |
| Total | 10,348 | 100.0% |
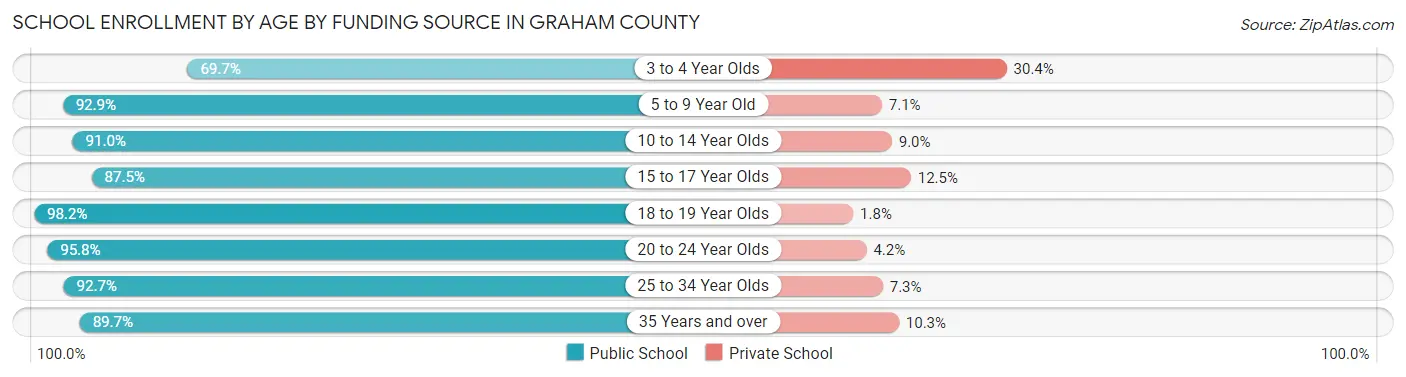
School Enrollment by Age by Funding Source in Graham County
Out of a total of 10,348 students who are enrolled in schools in Graham County, 942 (9.1%) attend a private institution, while the remaining 9,406 (90.9%) are enrolled in public schools. The age group of 3 to 4 year olds has the highest likelihood of being enrolled in private schools, with 129 (30.3% in the age bracket) enrolled. Conversely, the age group of 18 to 19 year olds has the lowest likelihood of being enrolled in a private school, with 723 (98.2% in the age bracket) attending a public institution.
| Age Bracket | Public School | Private School |
| 3 to 4 Year Olds | 296 (69.7%) | 129 (30.3%) |
| 5 to 9 Year Old | 2,183 (92.9%) | 167 (7.1%) |
| 10 to 14 Year Olds | 3,008 (91.0%) | 296 (9.0%) |
| 15 to 17 Year Olds | 1,456 (87.5%) | 208 (12.5%) |
| 18 to 19 Year Olds | 723 (98.2%) | 13 (1.8%) |
| 20 to 24 Year Olds | 722 (95.8%) | 32 (4.2%) |
| 25 to 34 Year Olds | 637 (92.7%) | 50 (7.3%) |
| 35 Years and over | 384 (89.7%) | 44 (10.3%) |
| Total | 9,406 (90.9%) | 942 (9.1%) |
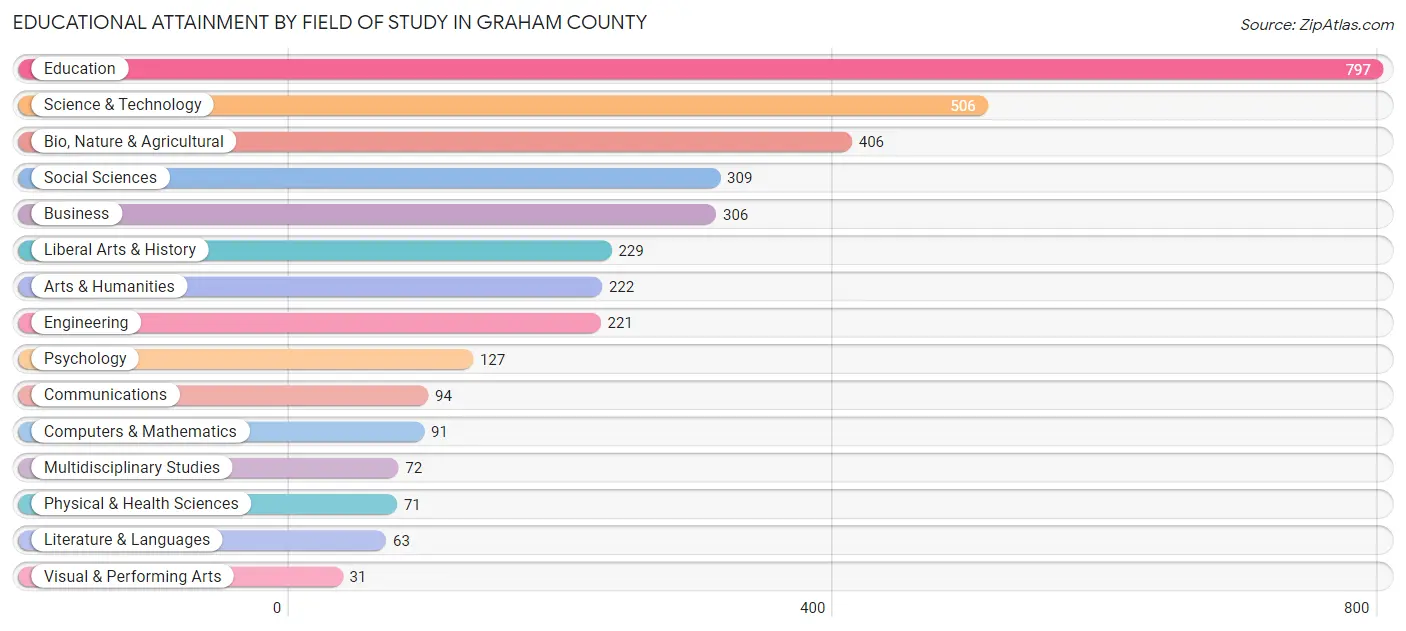
Educational Attainment by Field of Study in Graham County
Education (797 | 22.5%), science & technology (506 | 14.3%), bio, nature & agricultural (406 | 11.5%), social sciences (309 | 8.7%), and business (306 | 8.6%) are the most common fields of study among 3,545 individuals in Graham County who have obtained a bachelor's degree or higher.
| Field of Study | # Graduates | % Graduates |
| Computers & Mathematics | 91 | 2.6% |
| Bio, Nature & Agricultural | 406 | 11.5% |
| Physical & Health Sciences | 71 | 2.0% |
| Psychology | 127 | 3.6% |
| Social Sciences | 309 | 8.7% |
| Engineering | 221 | 6.2% |
| Multidisciplinary Studies | 72 | 2.0% |
| Science & Technology | 506 | 14.3% |
| Business | 306 | 8.6% |
| Education | 797 | 22.5% |
| Literature & Languages | 63 | 1.8% |
| Liberal Arts & History | 229 | 6.5% |
| Visual & Performing Arts | 31 | 0.9% |
| Communications | 94 | 2.6% |
| Arts & Humanities | 222 | 6.3% |
| Total | 3,545 | 100.0% |
Transportation & Commute in Graham County
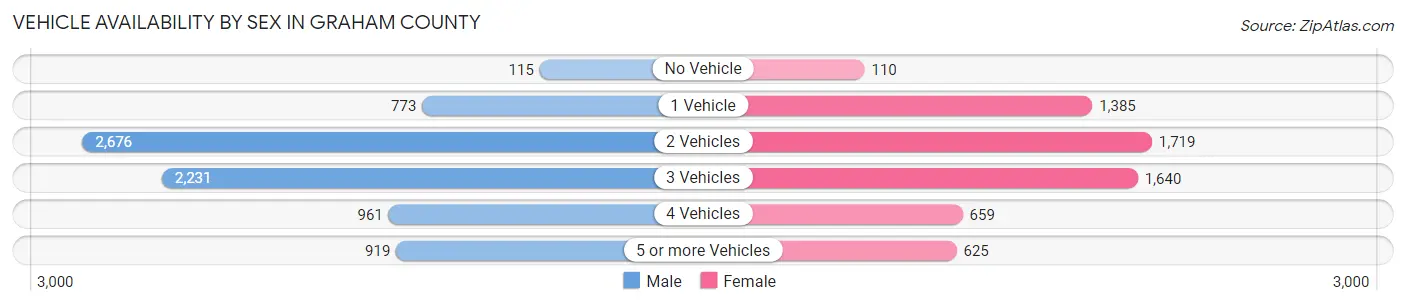
Vehicle Availability by Sex in Graham County
The most prevalent vehicle ownership categories in Graham County are males with 2 vehicles (2,676, accounting for 34.9%) and females with 2 vehicles (1,719, making up 43.6%).
| Vehicles Available | Male | Female |
| No Vehicle | 115 (1.5%) | 110 (1.8%) |
| 1 Vehicle | 773 (10.1%) | 1,385 (22.6%) |
| 2 Vehicles | 2,676 (34.9%) | 1,719 (28.0%) |
| 3 Vehicles | 2,231 (29.1%) | 1,640 (26.7%) |
| 4 Vehicles | 961 (12.5%) | 659 (10.7%) |
| 5 or more Vehicles | 919 (12.0%) | 625 (10.2%) |
| Total | 7,675 (100.0%) | 6,138 (100.0%) |
Commute Time in Graham County
The most frequently occuring commute durations in Graham County are 5 to 9 minutes (2,800 commuters, 21.1%), 10 to 14 minutes (2,368 commuters, 17.8%), and 15 to 19 minutes (2,319 commuters, 17.5%).
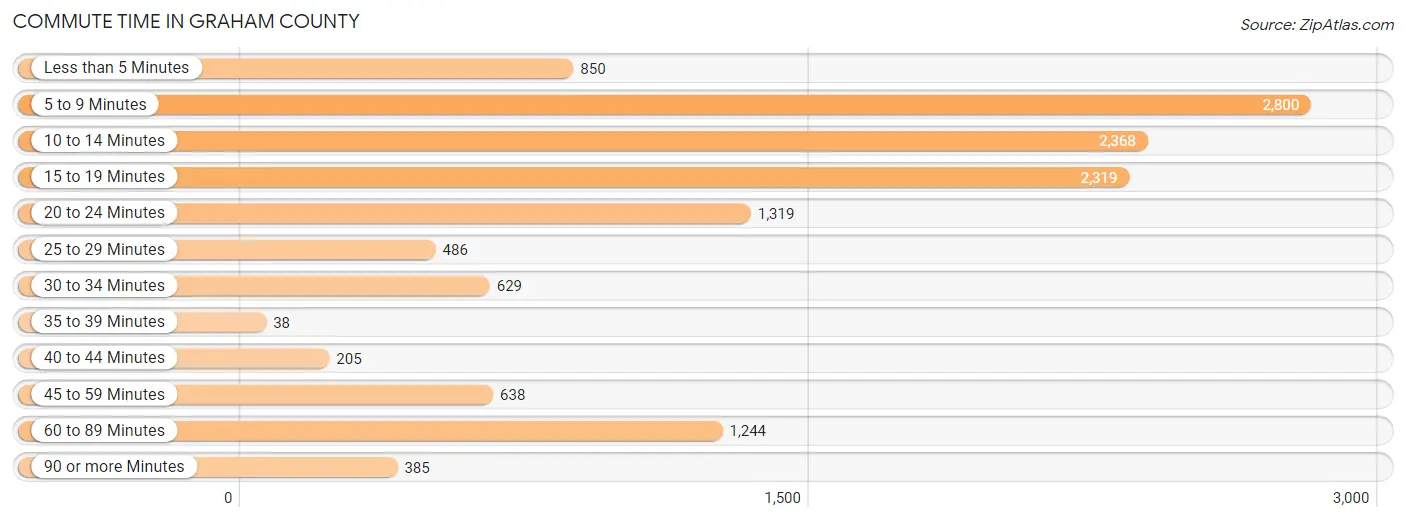
| Commute Time | # Commuters | % Commuters |
| Less than 5 Minutes | 850 | 6.4% |
| 5 to 9 Minutes | 2,800 | 21.1% |
| 10 to 14 Minutes | 2,368 | 17.8% |
| 15 to 19 Minutes | 2,319 | 17.5% |
| 20 to 24 Minutes | 1,319 | 9.9% |
| 25 to 29 Minutes | 486 | 3.7% |
| 30 to 34 Minutes | 629 | 4.7% |
| 35 to 39 Minutes | 38 | 0.3% |
| 40 to 44 Minutes | 205 | 1.5% |
| 45 to 59 Minutes | 638 | 4.8% |
| 60 to 89 Minutes | 1,244 | 9.4% |
| 90 or more Minutes | 385 | 2.9% |
Commute Time by Sex in Graham County
The most common commute times in Graham County are 5 to 9 minutes (1,237 commuters, 16.9%) for males and 5 to 9 minutes (1,563 commuters, 26.3%) for females.
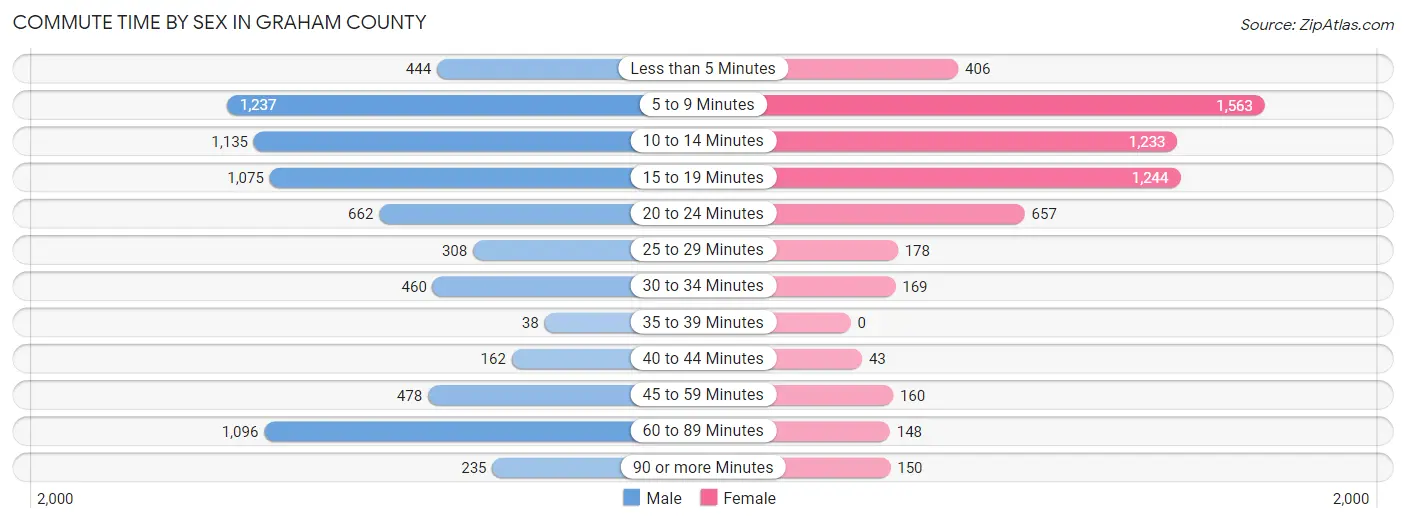
| Commute Time | Male | Female |
| Less than 5 Minutes | 444 (6.1%) | 406 (6.8%) |
| 5 to 9 Minutes | 1,237 (16.9%) | 1,563 (26.3%) |
| 10 to 14 Minutes | 1,135 (15.5%) | 1,233 (20.7%) |
| 15 to 19 Minutes | 1,075 (14.7%) | 1,244 (20.9%) |
| 20 to 24 Minutes | 662 (9.0%) | 657 (11.0%) |
| 25 to 29 Minutes | 308 (4.2%) | 178 (3.0%) |
| 30 to 34 Minutes | 460 (6.3%) | 169 (2.8%) |
| 35 to 39 Minutes | 38 (0.5%) | 0 (0.0%) |
| 40 to 44 Minutes | 162 (2.2%) | 43 (0.7%) |
| 45 to 59 Minutes | 478 (6.5%) | 160 (2.7%) |
| 60 to 89 Minutes | 1,096 (14.9%) | 148 (2.5%) |
| 90 or more Minutes | 235 (3.2%) | 150 (2.5%) |
Time of Departure to Work by Sex in Graham County
The most frequent times of departure to work in Graham County are 12:00 AM to 4:59 AM (2,327, 31.8%) for males and 7:30 AM to 7:59 AM (1,395, 23.4%) for females.
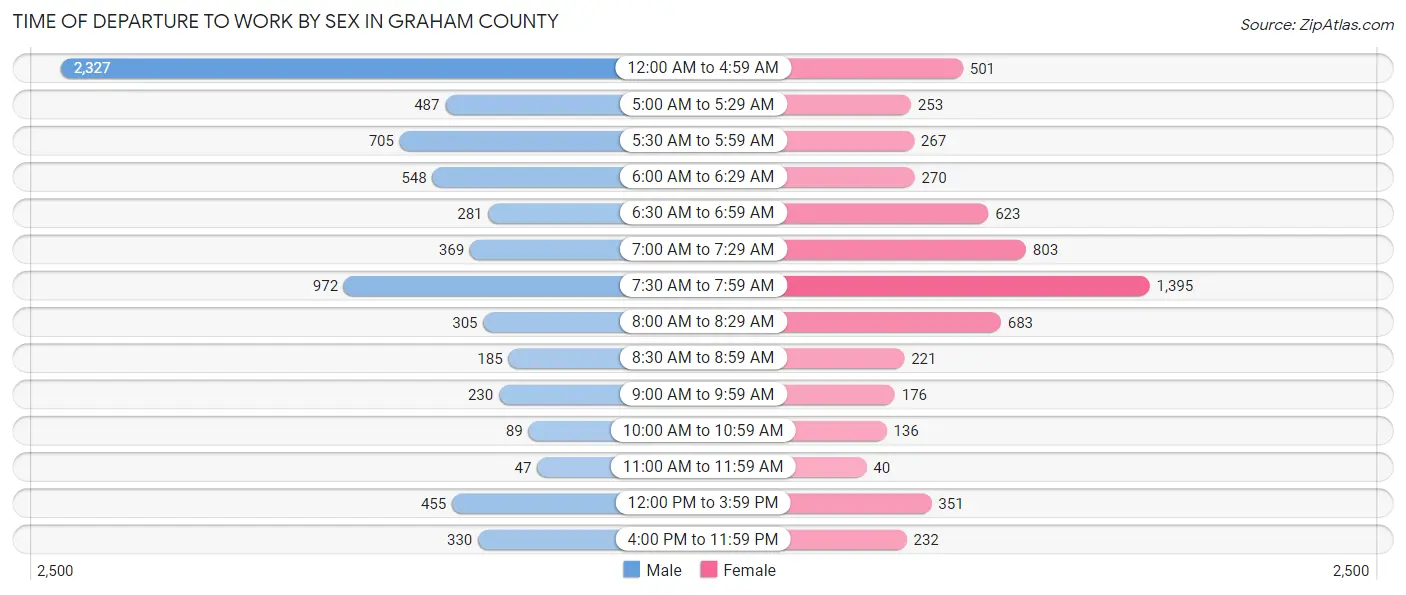
| Time of Departure | Male | Female |
| 12:00 AM to 4:59 AM | 2,327 (31.8%) | 501 (8.4%) |
| 5:00 AM to 5:29 AM | 487 (6.6%) | 253 (4.3%) |
| 5:30 AM to 5:59 AM | 705 (9.6%) | 267 (4.5%) |
| 6:00 AM to 6:29 AM | 548 (7.5%) | 270 (4.5%) |
| 6:30 AM to 6:59 AM | 281 (3.8%) | 623 (10.5%) |
| 7:00 AM to 7:29 AM | 369 (5.0%) | 803 (13.5%) |
| 7:30 AM to 7:59 AM | 972 (13.3%) | 1,395 (23.4%) |
| 8:00 AM to 8:29 AM | 305 (4.2%) | 683 (11.5%) |
| 8:30 AM to 8:59 AM | 185 (2.5%) | 221 (3.7%) |
| 9:00 AM to 9:59 AM | 230 (3.1%) | 176 (3.0%) |
| 10:00 AM to 10:59 AM | 89 (1.2%) | 136 (2.3%) |
| 11:00 AM to 11:59 AM | 47 (0.6%) | 40 (0.7%) |
| 12:00 PM to 3:59 PM | 455 (6.2%) | 351 (5.9%) |
| 4:00 PM to 11:59 PM | 330 (4.5%) | 232 (3.9%) |
| Total | 7,330 (100.0%) | 5,951 (100.0%) |
Housing Occupancy in Graham County
Occupancy by Ownership in Graham County
Of the total 12,018 dwellings in Graham County, owner-occupied units account for 8,824 (73.4%), while renter-occupied units make up 3,194 (26.6%).
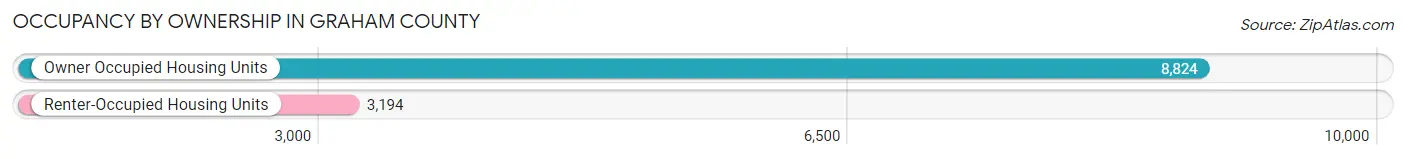
| Occupancy | # Housing Units | % Housing Units |
| Owner Occupied Housing Units | 8,824 | 73.4% |
| Renter-Occupied Housing Units | 3,194 | 26.6% |
| Total Occupied Housing Units | 12,018 | 100.0% |
Occupancy by Household Size in Graham County
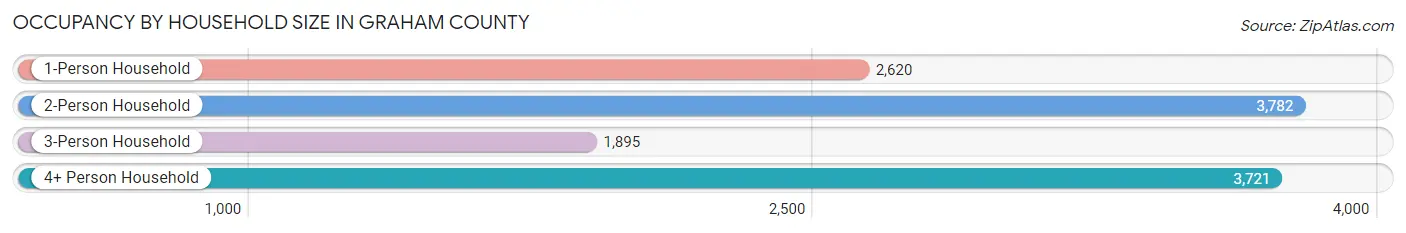
| Household Size | # Housing Units | % Housing Units |
| 1-Person Household | 2,620 | 21.8% |
| 2-Person Household | 3,782 | 31.5% |
| 3-Person Household | 1,895 | 15.8% |
| 4+ Person Household | 3,721 | 31.0% |
| Total Housing Units | 12,018 | 100.0% |
Occupancy by Ownership by Household Size in Graham County
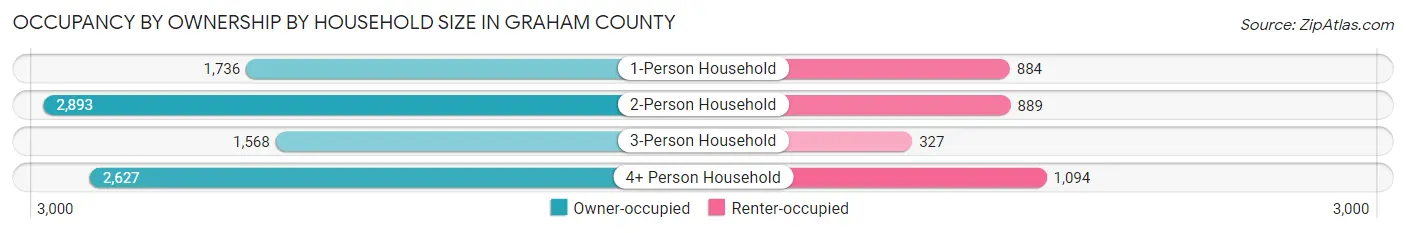
| Household Size | Owner-occupied | Renter-occupied |
| 1-Person Household | 1,736 (66.3%) | 884 (33.7%) |
| 2-Person Household | 2,893 (76.5%) | 889 (23.5%) |
| 3-Person Household | 1,568 (82.7%) | 327 (17.3%) |
| 4+ Person Household | 2,627 (70.6%) | 1,094 (29.4%) |
| Total Housing Units | 8,824 (73.4%) | 3,194 (26.6%) |
Occupancy by Educational Attainment in Graham County
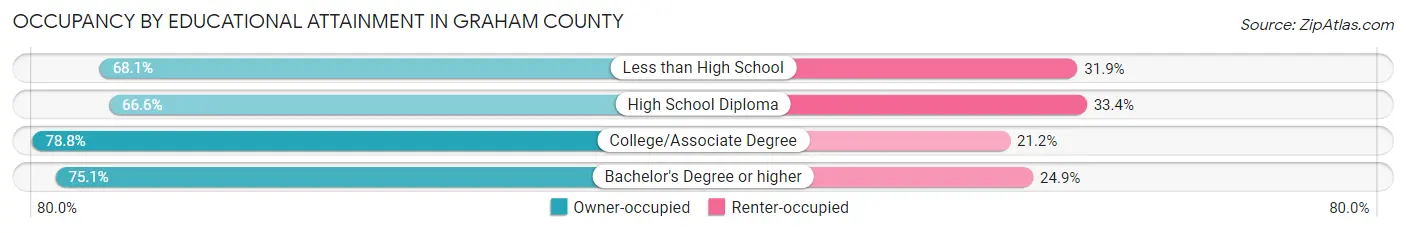
| Household Size | Owner-occupied | Renter-occupied |
| Less than High School | 1,041 (68.1%) | 488 (31.9%) |
| High School Diploma | 2,215 (66.6%) | 1,111 (33.4%) |
| College/Associate Degree | 4,057 (78.8%) | 1,094 (21.2%) |
| Bachelor's Degree or higher | 1,511 (75.1%) | 501 (24.9%) |
Occupancy by Age of Householder in Graham County
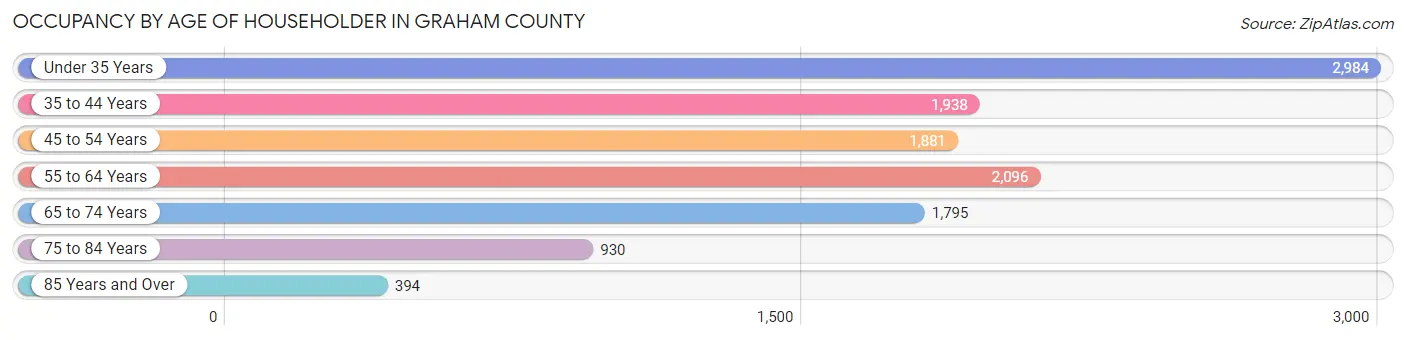
| Age Bracket | # Households | % Households |
| Under 35 Years | 2,984 | 24.8% |
| 35 to 44 Years | 1,938 | 16.1% |
| 45 to 54 Years | 1,881 | 15.7% |
| 55 to 64 Years | 2,096 | 17.4% |
| 65 to 74 Years | 1,795 | 14.9% |
| 75 to 84 Years | 930 | 7.7% |
| 85 Years and Over | 394 | 3.3% |
| Total | 12,018 | 100.0% |
Housing Finances in Graham County
Median Income by Occupancy in Graham County
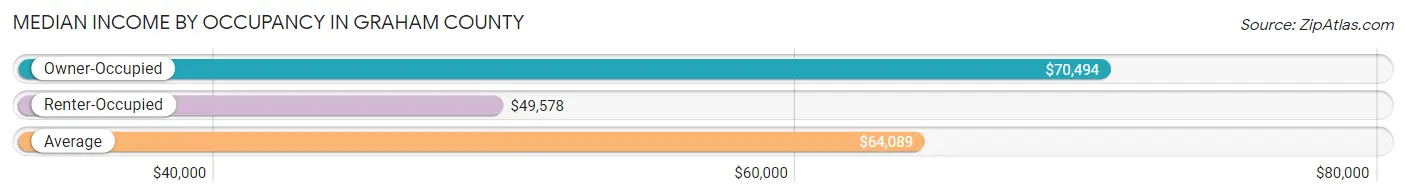
| Occupancy Type | # Households | Median Income |
| Owner-Occupied | 8,824 (73.4%) | $70,494 |
| Renter-Occupied | 3,194 (26.6%) | $49,578 |
| Average | 12,018 (100.0%) | $64,089 |
Occupancy by Householder Income Bracket in Graham County
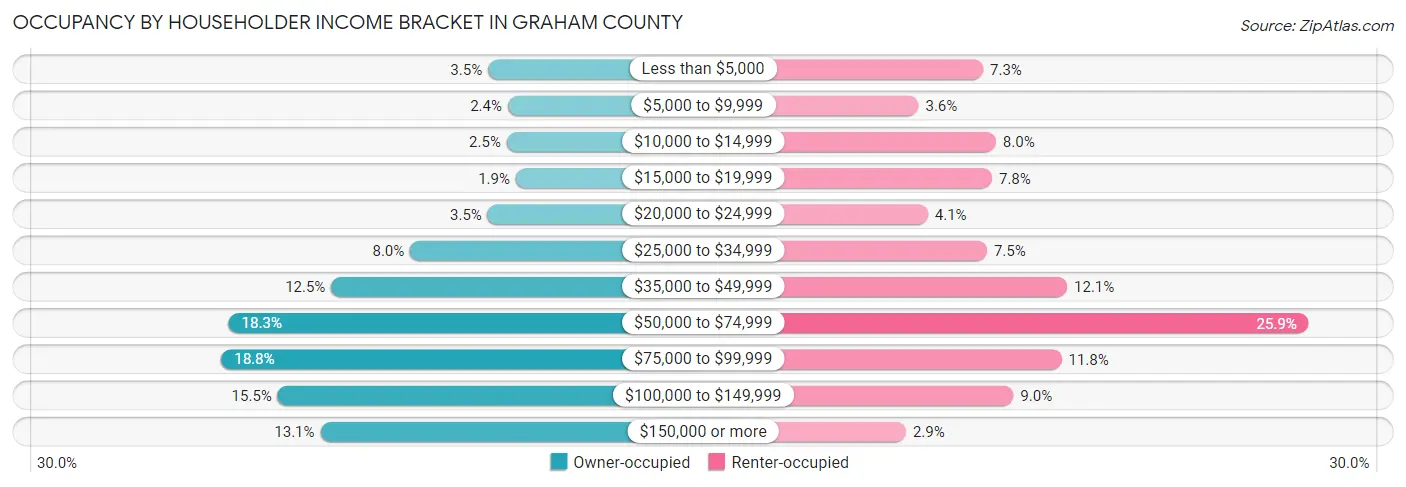
| Income Bracket | Owner-occupied | Renter-occupied |
| Less than $5,000 | 311 (3.5%) | 233 (7.3%) |
| $5,000 to $9,999 | 211 (2.4%) | 115 (3.6%) |
| $10,000 to $14,999 | 216 (2.5%) | 256 (8.0%) |
| $15,000 to $19,999 | 170 (1.9%) | 249 (7.8%) |
| $20,000 to $24,999 | 312 (3.5%) | 132 (4.1%) |
| $25,000 to $34,999 | 703 (8.0%) | 240 (7.5%) |
| $35,000 to $49,999 | 1,101 (12.5%) | 386 (12.1%) |
| $50,000 to $74,999 | 1,618 (18.3%) | 827 (25.9%) |
| $75,000 to $99,999 | 1,655 (18.8%) | 376 (11.8%) |
| $100,000 to $149,999 | 1,371 (15.5%) | 288 (9.0%) |
| $150,000 or more | 1,156 (13.1%) | 92 (2.9%) |
| Total | 8,824 (100.0%) | 3,194 (100.0%) |
Monthly Housing Cost Tiers in Graham County
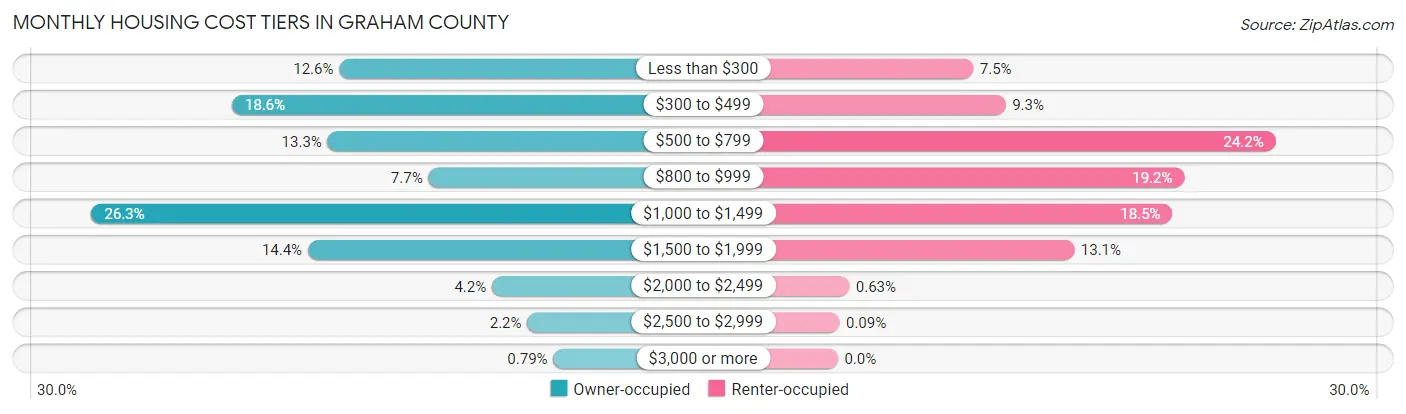
| Monthly Cost | Owner-occupied | Renter-occupied |
| Less than $300 | 1,114 (12.6%) | 239 (7.5%) |
| $300 to $499 | 1,637 (18.5%) | 296 (9.3%) |
| $500 to $799 | 1,170 (13.3%) | 773 (24.2%) |
| $800 to $999 | 679 (7.7%) | 612 (19.2%) |
| $1,000 to $1,499 | 2,322 (26.3%) | 591 (18.5%) |
| $1,500 to $1,999 | 1,266 (14.3%) | 417 (13.1%) |
| $2,000 to $2,499 | 369 (4.2%) | 20 (0.6%) |
| $2,500 to $2,999 | 197 (2.2%) | 3 (0.1%) |
| $3,000 or more | 70 (0.8%) | 0 (0.0%) |
| Total | 8,824 (100.0%) | 3,194 (100.0%) |
Physical Housing Characteristics in Graham County
Housing Structures in Graham County
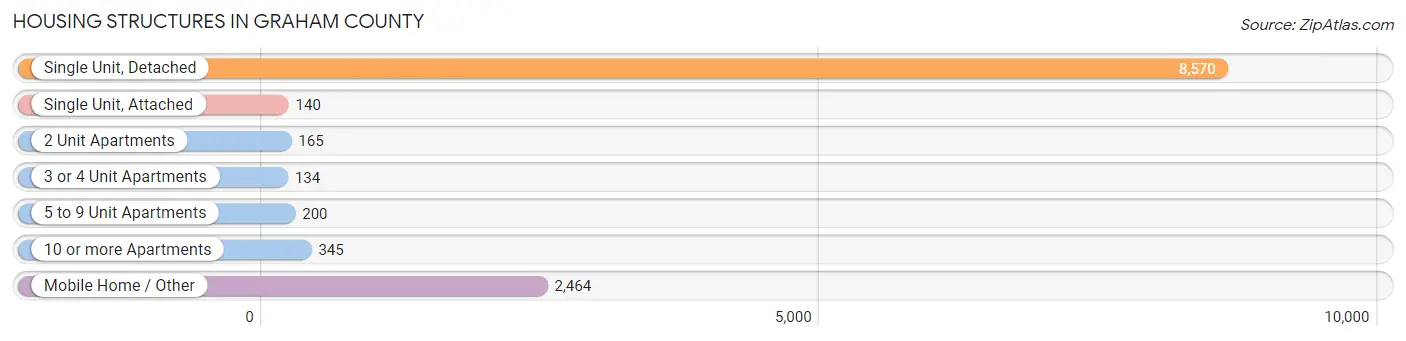
| Structure Type | # Housing Units | % Housing Units |
| Single Unit, Detached | 8,570 | 71.3% |
| Single Unit, Attached | 140 | 1.2% |
| 2 Unit Apartments | 165 | 1.4% |
| 3 or 4 Unit Apartments | 134 | 1.1% |
| 5 to 9 Unit Apartments | 200 | 1.7% |
| 10 or more Apartments | 345 | 2.9% |
| Mobile Home / Other | 2,464 | 20.5% |
| Total | 12,018 | 100.0% |
Housing Structures by Occupancy in Graham County
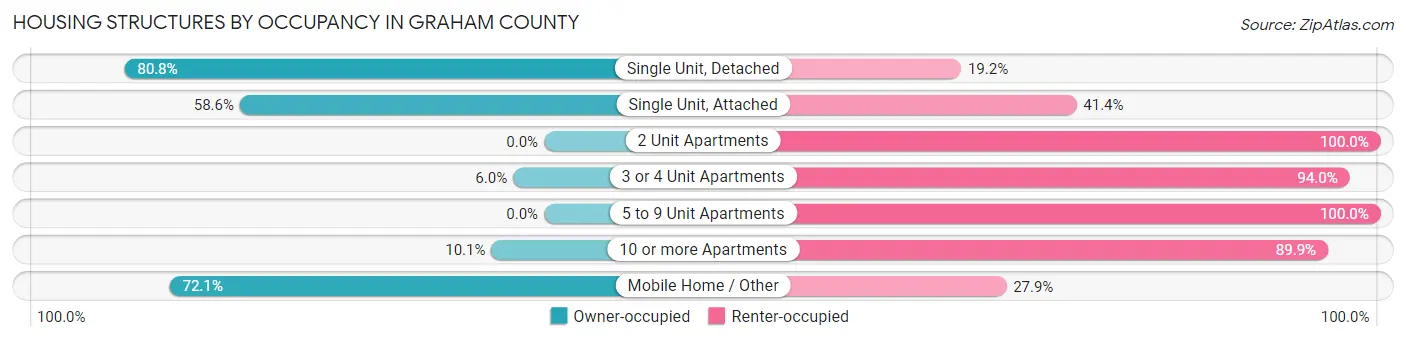
| Structure Type | Owner-occupied | Renter-occupied |
| Single Unit, Detached | 6,923 (80.8%) | 1,647 (19.2%) |
| Single Unit, Attached | 82 (58.6%) | 58 (41.4%) |
| 2 Unit Apartments | 0 (0.0%) | 165 (100.0%) |
| 3 or 4 Unit Apartments | 8 (6.0%) | 126 (94.0%) |
| 5 to 9 Unit Apartments | 0 (0.0%) | 200 (100.0%) |
| 10 or more Apartments | 35 (10.1%) | 310 (89.9%) |
| Mobile Home / Other | 1,776 (72.1%) | 688 (27.9%) |
| Total | 8,824 (73.4%) | 3,194 (26.6%) |
Housing Structures by Number of Rooms in Graham County
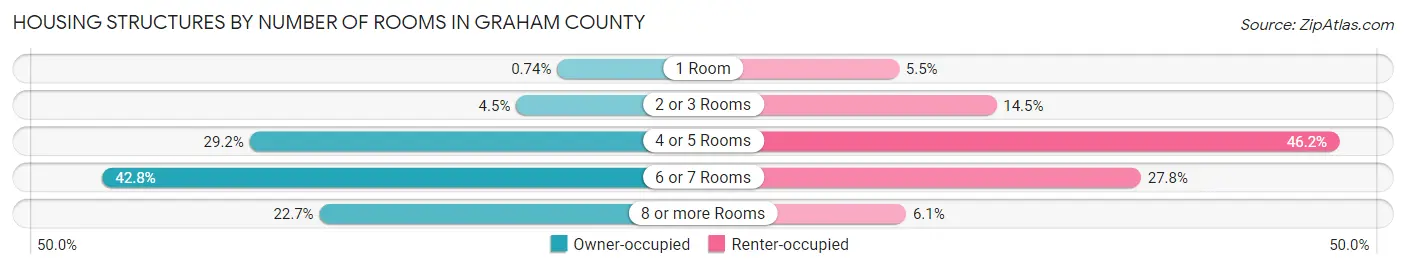
| Number of Rooms | Owner-occupied | Renter-occupied |
| 1 Room | 65 (0.7%) | 174 (5.4%) |
| 2 or 3 Rooms | 400 (4.5%) | 462 (14.5%) |
| 4 or 5 Rooms | 2,576 (29.2%) | 1,474 (46.2%) |
| 6 or 7 Rooms | 3,777 (42.8%) | 889 (27.8%) |
| 8 or more Rooms | 2,006 (22.7%) | 195 (6.1%) |
| Total | 8,824 (100.0%) | 3,194 (100.0%) |
Housing Structure by Heating Type in Graham County
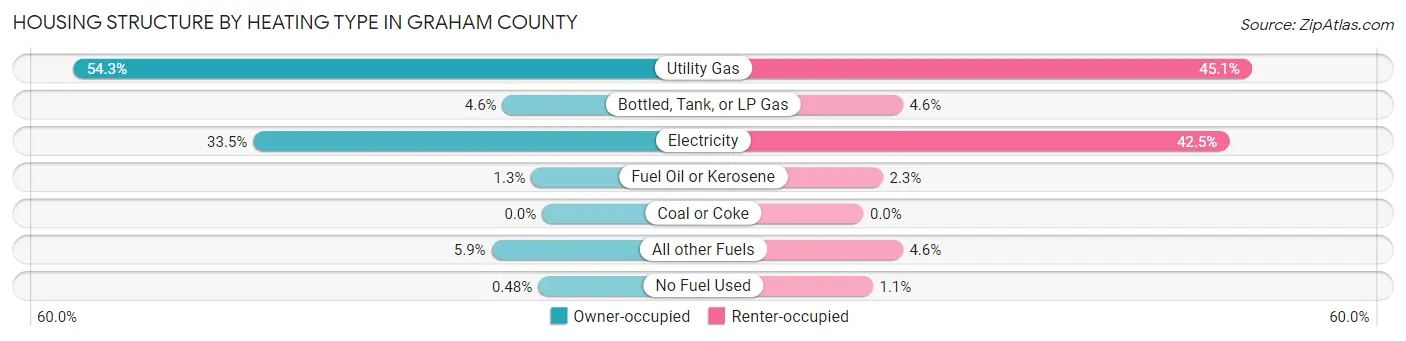
| Heating Type | Owner-occupied | Renter-occupied |
| Utility Gas | 4,791 (54.3%) | 1,439 (45.1%) |
| Bottled, Tank, or LP Gas | 406 (4.6%) | 146 (4.6%) |
| Electricity | 2,956 (33.5%) | 1,356 (42.4%) |
| Fuel Oil or Kerosene | 111 (1.3%) | 72 (2.2%) |
| Coal or Coke | 0 (0.0%) | 0 (0.0%) |
| All other Fuels | 518 (5.9%) | 146 (4.6%) |
| No Fuel Used | 42 (0.5%) | 35 (1.1%) |
| Total | 8,824 (100.0%) | 3,194 (100.0%) |
Household Vehicle Usage in Graham County
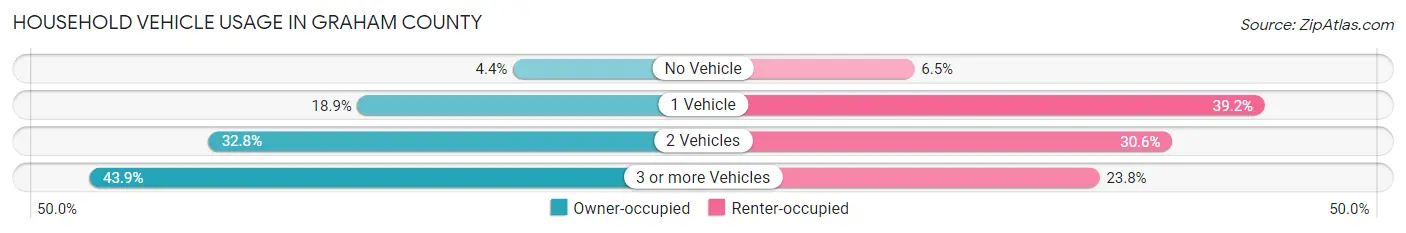
| Vehicles per Household | Owner-occupied | Renter-occupied |
| No Vehicle | 387 (4.4%) | 207 (6.5%) |
| 1 Vehicle | 1,669 (18.9%) | 1,252 (39.2%) |
| 2 Vehicles | 2,895 (32.8%) | 976 (30.6%) |
| 3 or more Vehicles | 3,873 (43.9%) | 759 (23.8%) |
| Total | 8,824 (100.0%) | 3,194 (100.0%) |
Real Estate & Mortgages in Graham County
Real Estate and Mortgage Overview in Graham County
| Characteristic | Without Mortgage | With Mortgage |
| Housing Units | 3,749 | 5,075 |
| Median Property Value | $111,800 | $204,300 |
| Median Household Income | $53,913 | $931 |
| Monthly Housing Costs | $393 | $70 |
| Real Estate Taxes | $877 | $321 |
Property Value by Mortgage Status in Graham County
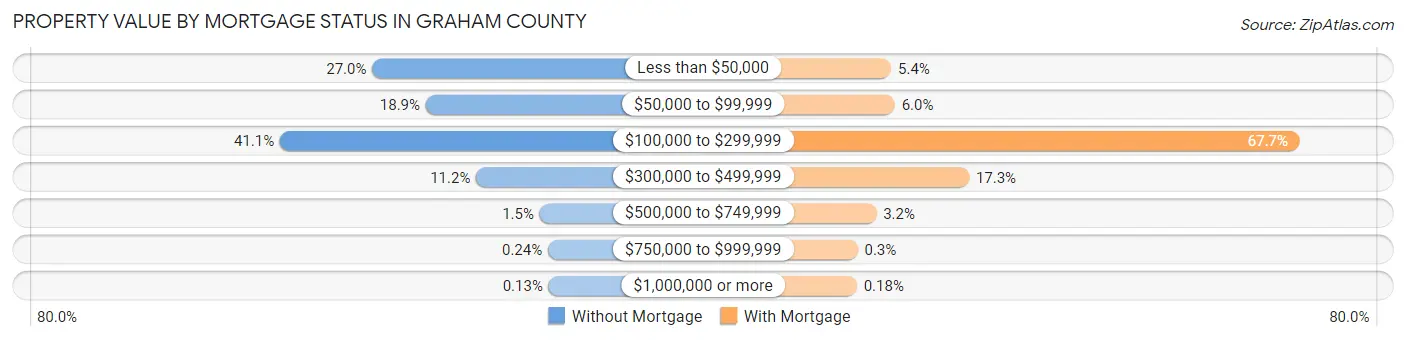
| Property Value | Without Mortgage | With Mortgage |
| Less than $50,000 | 1,013 (27.0%) | 275 (5.4%) |
| $50,000 to $99,999 | 707 (18.9%) | 303 (6.0%) |
| $100,000 to $299,999 | 1,540 (41.1%) | 3,436 (67.7%) |
| $300,000 to $499,999 | 419 (11.2%) | 877 (17.3%) |
| $500,000 to $749,999 | 56 (1.5%) | 160 (3.2%) |
| $750,000 to $999,999 | 9 (0.2%) | 15 (0.3%) |
| $1,000,000 or more | 5 (0.1%) | 9 (0.2%) |
| Total | 3,749 (100.0%) | 5,075 (100.0%) |
Household Income by Mortgage Status in Graham County
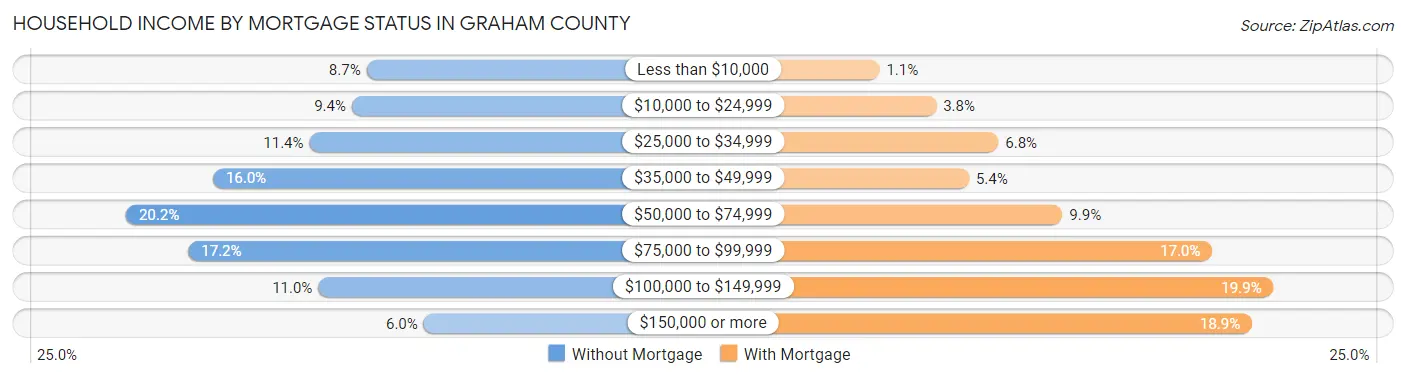
| Household Income | Without Mortgage | With Mortgage |
| Less than $10,000 | 327 (8.7%) | 58 (1.1%) |
| $10,000 to $24,999 | 353 (9.4%) | 195 (3.8%) |
| $25,000 to $34,999 | 429 (11.4%) | 345 (6.8%) |
| $35,000 to $49,999 | 601 (16.0%) | 274 (5.4%) |
| $50,000 to $74,999 | 756 (20.2%) | 500 (9.9%) |
| $75,000 to $99,999 | 645 (17.2%) | 862 (17.0%) |
| $100,000 to $149,999 | 413 (11.0%) | 1,010 (19.9%) |
| $150,000 or more | 225 (6.0%) | 958 (18.9%) |
| Total | 3,749 (100.0%) | 5,075 (100.0%) |
Property Value to Household Income Ratio in Graham County
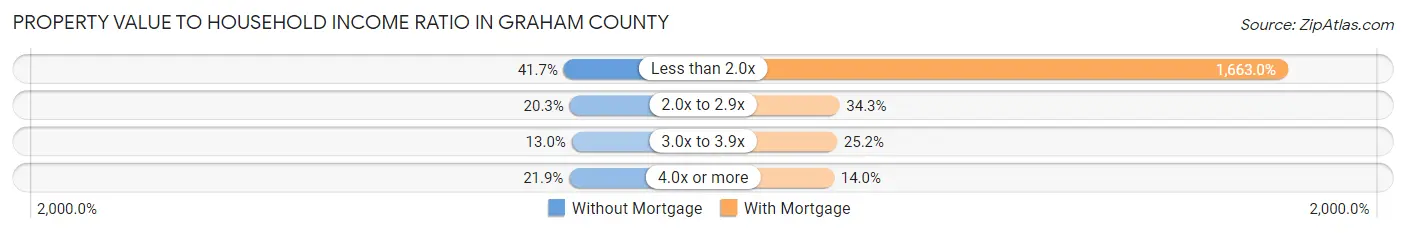
| Value-to-Income Ratio | Without Mortgage | With Mortgage |
| Less than 2.0x | 1,565 (41.7%) | 84,395 (1,663.0%) |
| 2.0x to 2.9x | 761 (20.3%) | 1,739 (34.3%) |
| 3.0x to 3.9x | 489 (13.0%) | 1,281 (25.2%) |
| 4.0x or more | 822 (21.9%) | 708 (14.0%) |
| Total | 3,749 (100.0%) | 5,075 (100.0%) |
Real Estate Taxes by Mortgage Status in Graham County
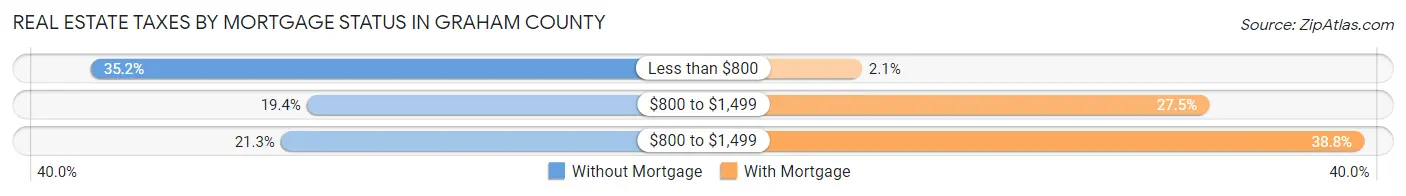
| Property Taxes | Without Mortgage | With Mortgage |
| Less than $800 | 1,318 (35.2%) | 107 (2.1%) |
| $800 to $1,499 | 727 (19.4%) | 1,394 (27.5%) |
| $800 to $1,499 | 798 (21.3%) | 1,968 (38.8%) |
| Total | 3,749 (100.0%) | 5,075 (100.0%) |
Health & Disability in Graham County
Health Insurance Coverage by Age in Graham County
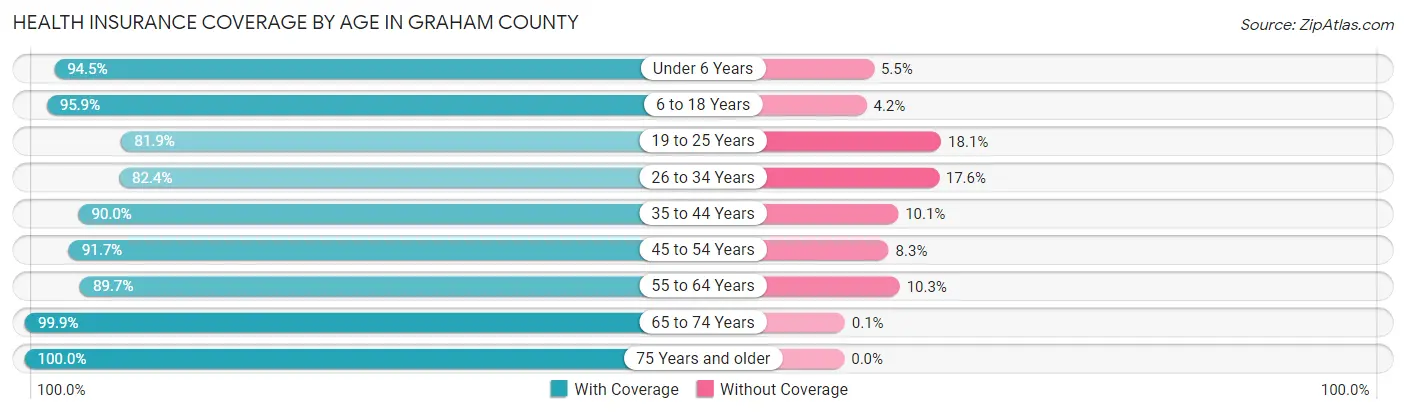
| Age Bracket | With Coverage | Without Coverage |
| Under 6 Years | 2,854 (94.5%) | 167 (5.5%) |
| 6 to 18 Years | 7,395 (95.9%) | 320 (4.2%) |
| 19 to 25 Years | 2,900 (81.9%) | 639 (18.1%) |
| 26 to 34 Years | 3,647 (82.4%) | 780 (17.6%) |
| 35 to 44 Years | 3,902 (89.9%) | 436 (10.1%) |
| 45 to 54 Years | 3,339 (91.7%) | 301 (8.3%) |
| 55 to 64 Years | 3,246 (89.7%) | 374 (10.3%) |
| 65 to 74 Years | 3,003 (99.9%) | 3 (0.1%) |
| 75 Years and older | 2,218 (100.0%) | 0 (0.0%) |
| Total | 32,504 (91.5%) | 3,020 (8.5%) |
Health Insurance Coverage by Citizenship Status in Graham County
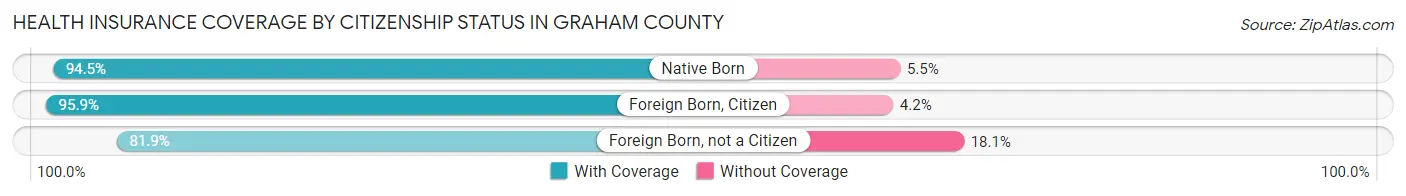
| Citizenship Status | With Coverage | Without Coverage |
| Native Born | 2,854 (94.5%) | 167 (5.5%) |
| Foreign Born, Citizen | 7,395 (95.9%) | 320 (4.2%) |
| Foreign Born, not a Citizen | 2,900 (81.9%) | 639 (18.1%) |
Health Insurance Coverage by Household Income in Graham County
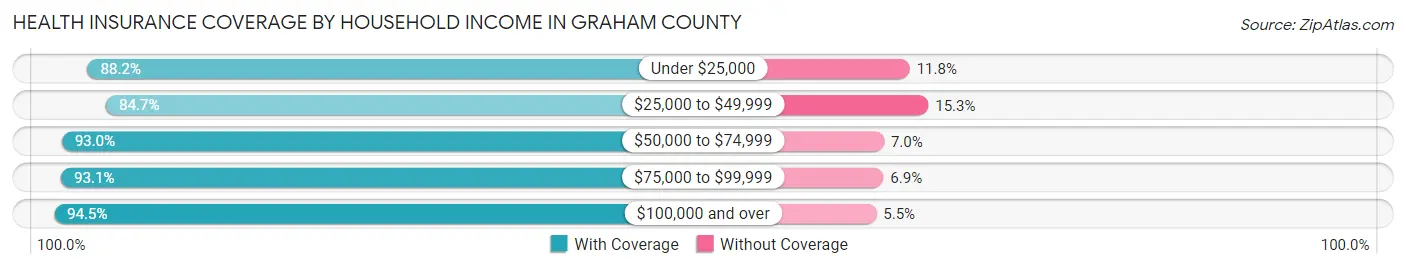
| Household Income | With Coverage | Without Coverage |
| Under $25,000 | 4,452 (88.2%) | 595 (11.8%) |
| $25,000 to $49,999 | 4,454 (84.7%) | 803 (15.3%) |
| $50,000 to $74,999 | 7,088 (93.0%) | 530 (7.0%) |
| $75,000 to $99,999 | 6,205 (93.1%) | 457 (6.9%) |
| $100,000 and over | 10,088 (94.5%) | 590 (5.5%) |
Public vs Private Health Insurance Coverage by Age in Graham County
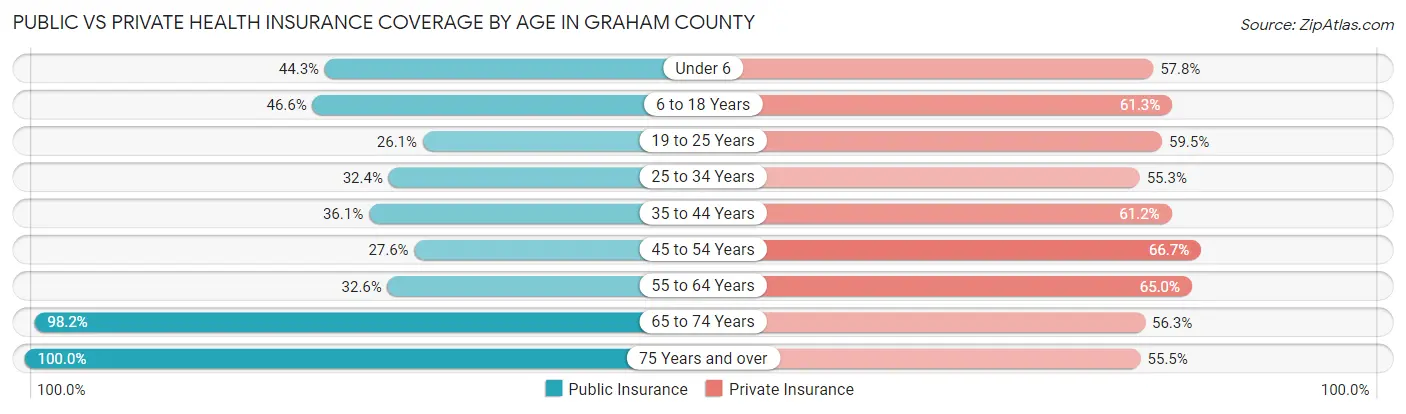
| Age Bracket | Public Insurance | Private Insurance |
| Under 6 | 1,337 (44.3%) | 1,746 (57.8%) |
| 6 to 18 Years | 3,591 (46.6%) | 4,730 (61.3%) |
| 19 to 25 Years | 923 (26.1%) | 2,104 (59.5%) |
| 25 to 34 Years | 1,435 (32.4%) | 2,448 (55.3%) |
| 35 to 44 Years | 1,565 (36.1%) | 2,654 (61.2%) |
| 45 to 54 Years | 1,006 (27.6%) | 2,427 (66.7%) |
| 55 to 64 Years | 1,181 (32.6%) | 2,352 (65.0%) |
| 65 to 74 Years | 2,951 (98.2%) | 1,692 (56.3%) |
| 75 Years and over | 2,218 (100.0%) | 1,230 (55.5%) |
| Total | 16,207 (45.6%) | 21,383 (60.2%) |
Disability Status by Sex by Age in Graham County
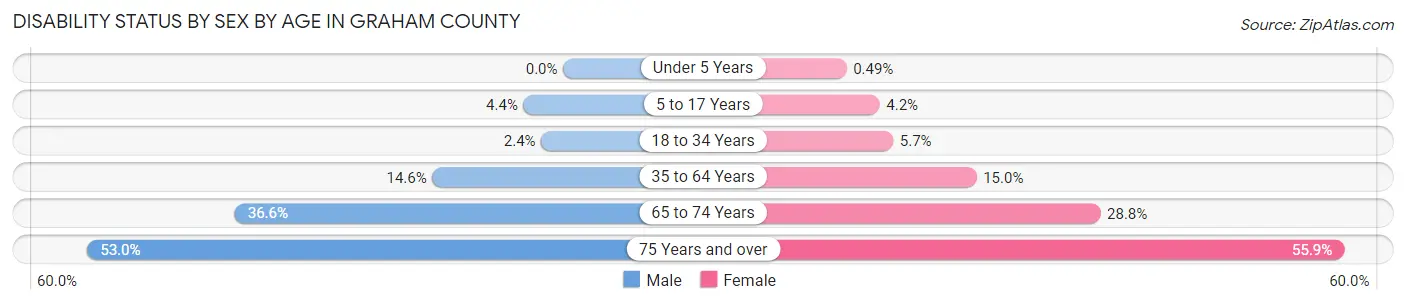
| Age Bracket | Male | Female |
| Under 5 Years | 0 (0.0%) | 6 (0.5%) |
| 5 to 17 Years | 169 (4.4%) | 156 (4.2%) |
| 18 to 34 Years | 109 (2.4%) | 235 (5.7%) |
| 35 to 64 Years | 831 (14.6%) | 882 (15.0%) |
| 65 to 74 Years | 539 (36.6%) | 441 (28.8%) |
| 75 Years and over | 520 (53.0%) | 692 (55.9%) |
Disability Class by Sex by Age in Graham County
Disability Class: Hearing Difficulty
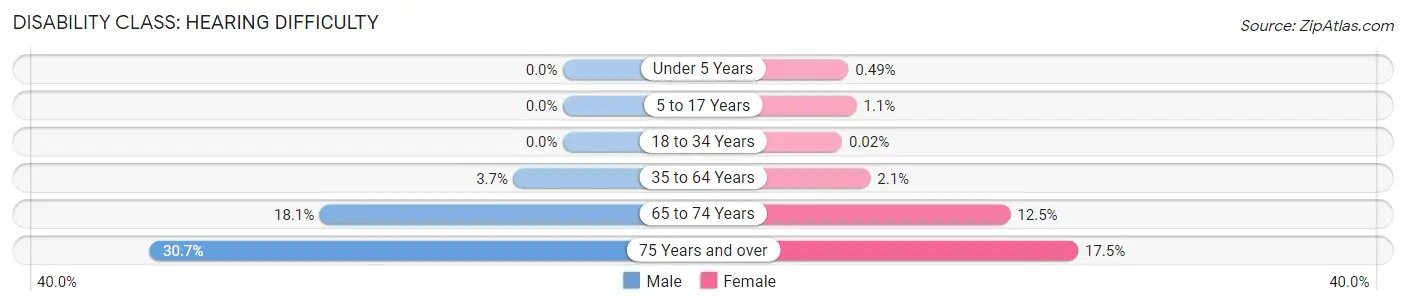
| Age Bracket | Male | Female |
| Under 5 Years | 0 (0.0%) | 6 (0.5%) |
| 5 to 17 Years | 0 (0.0%) | 41 (1.1%) |
| 18 to 34 Years | 0 (0.0%) | 1 (0.0%) |
| 35 to 64 Years | 210 (3.7%) | 125 (2.1%) |
| 65 to 74 Years | 266 (18.1%) | 192 (12.5%) |
| 75 Years and over | 301 (30.7%) | 217 (17.5%) |
Disability Class: Vision Difficulty
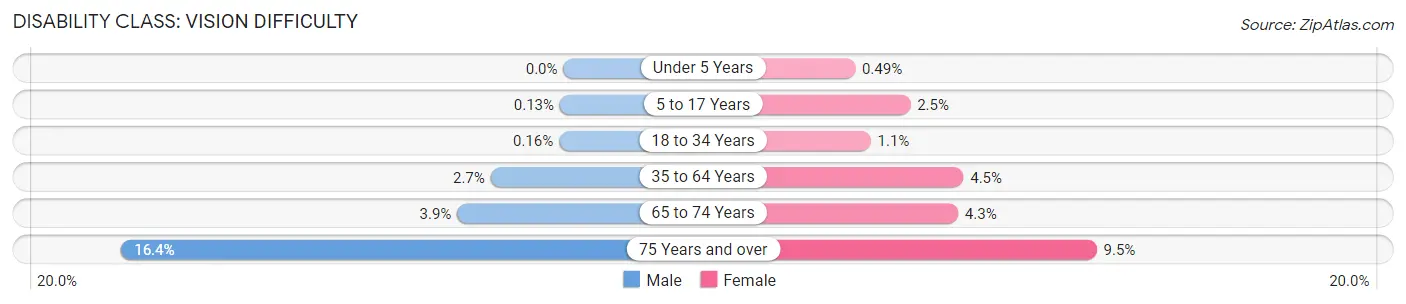
| Age Bracket | Male | Female |
| Under 5 Years | 0 (0.0%) | 6 (0.5%) |
| 5 to 17 Years | 5 (0.1%) | 95 (2.5%) |
| 18 to 34 Years | 7 (0.2%) | 44 (1.1%) |
| 35 to 64 Years | 154 (2.7%) | 266 (4.5%) |
| 65 to 74 Years | 58 (3.9%) | 66 (4.3%) |
| 75 Years and over | 161 (16.4%) | 117 (9.5%) |
Disability Class: Cognitive Difficulty
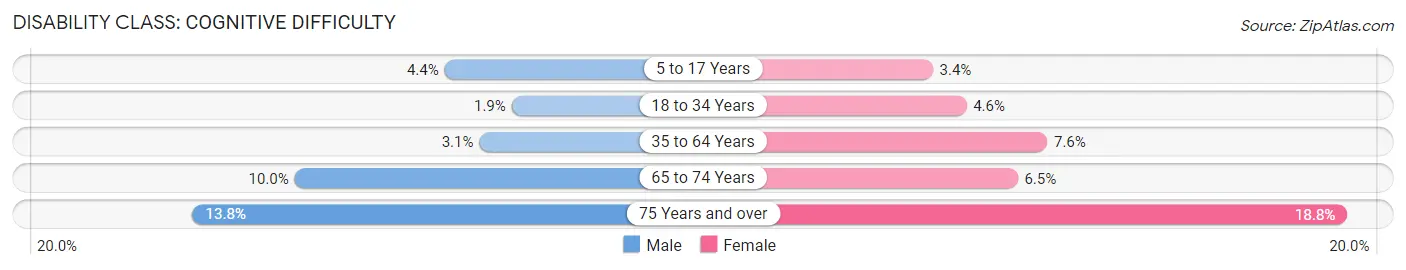
| Age Bracket | Male | Female |
| 5 to 17 Years | 169 (4.4%) | 126 (3.4%) |
| 18 to 34 Years | 86 (1.9%) | 191 (4.6%) |
| 35 to 64 Years | 178 (3.1%) | 449 (7.6%) |
| 65 to 74 Years | 147 (10.0%) | 100 (6.5%) |
| 75 Years and over | 135 (13.8%) | 232 (18.8%) |
Disability Class: Ambulatory Difficulty
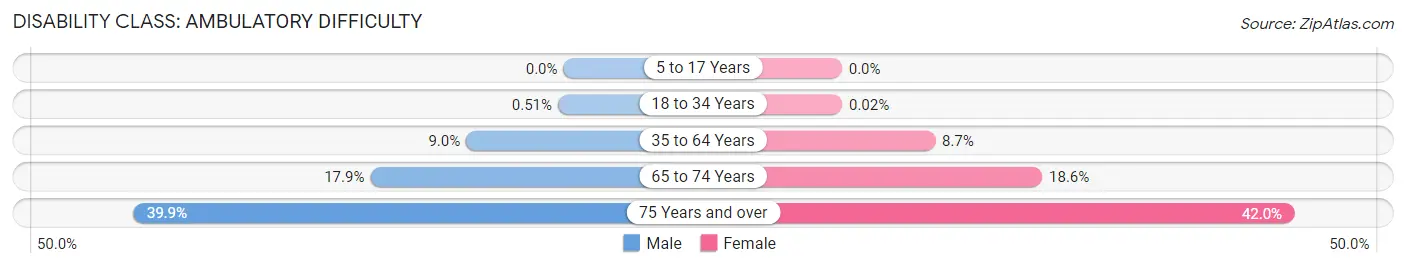
| Age Bracket | Male | Female |
| 5 to 17 Years | 0 (0.0%) | 0 (0.0%) |
| 18 to 34 Years | 23 (0.5%) | 1 (0.0%) |
| 35 to 64 Years | 515 (9.0%) | 510 (8.6%) |
| 65 to 74 Years | 264 (17.9%) | 285 (18.6%) |
| 75 Years and over | 391 (39.9%) | 519 (42.0%) |
Disability Class: Self-Care Difficulty
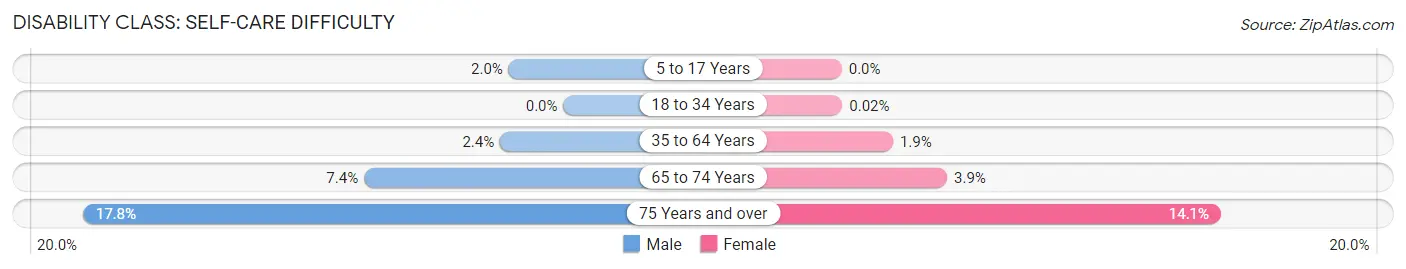
| Age Bracket | Male | Female |
| 5 to 17 Years | 78 (2.0%) | 0 (0.0%) |
| 18 to 34 Years | 0 (0.0%) | 1 (0.0%) |
| 35 to 64 Years | 134 (2.4%) | 112 (1.9%) |
| 65 to 74 Years | 109 (7.4%) | 60 (3.9%) |
| 75 Years and over | 175 (17.8%) | 174 (14.1%) |
Technology Access in Graham County
Computing Device Access in Graham County
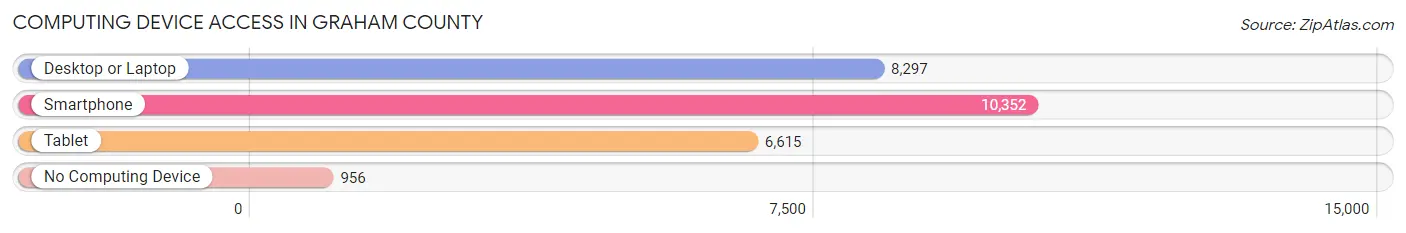
| Device Type | # Households | % Households |
| Desktop or Laptop | 8,297 | 69.0% |
| Smartphone | 10,352 | 86.1% |
| Tablet | 6,615 | 55.0% |
| No Computing Device | 956 | 8.0% |
| Total | 12,018 | 100.0% |
Internet Access in Graham County
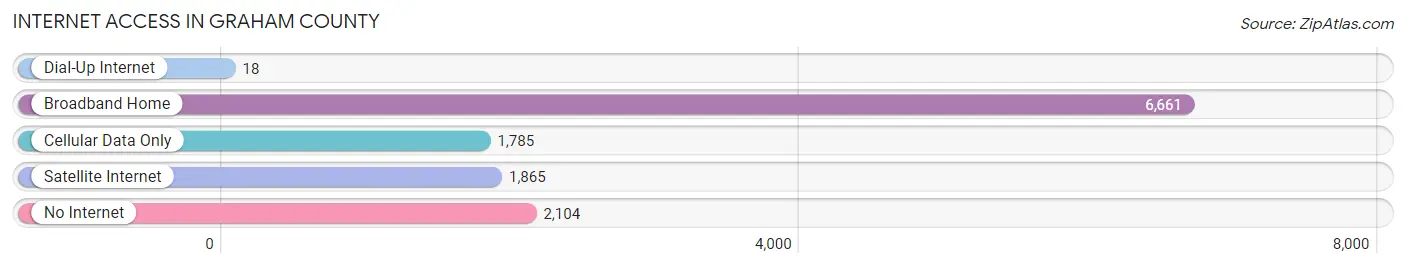
| Internet Type | # Households | % Households |
| Dial-Up Internet | 18 | 0.2% |
| Broadband Home | 6,661 | 55.4% |
| Cellular Data Only | 1,785 | 14.8% |
| Satellite Internet | 1,865 | 15.5% |
| No Internet | 2,104 | 17.5% |
| Total | 12,018 | 100.0% |
Graham County Summary
History
Graham County, Arizona is located in the southeastern corner of the state and is bordered by New Mexico to the east and Mexico to the south. The county was established in 1881 and was named after James Graham, a former Arizona territorial legislator. The county seat is Safford, which was founded in 1874.
The area that is now Graham County was originally inhabited by the Chiricahua Apache, who were forcibly removed from the area in the late 19th century. The first settlers in the area were ranchers and miners, who were attracted to the area by the abundance of natural resources. The county was officially established in 1881 and the first county seat was located in Solomonville. In 1884, the county seat was moved to Safford, which remains the county seat today.
The economy of Graham County has historically been based on agriculture and mining. The county is home to several large copper mines, including the Morenci Mine, which is the largest copper mine in North America. The county is also home to several large cattle ranches, which produce beef, dairy, and other agricultural products.
Geography
Graham County is located in the southeastern corner of Arizona and is bordered by New Mexico to the east and Mexico to the south. The county covers an area of 4,641 square miles and is the fifth largest county in the state. The county is divided into two distinct regions: the high desert plateau of the Gila River Valley to the west and the rugged mountain ranges of the Coronado National Forest to the east.
The county is home to several mountain ranges, including the Pinaleno Mountains, the Santa Teresa Mountains, and the Chiricahua Mountains. The highest point in the county is Mount Graham, which rises to an elevation of 10,720 feet. The county is also home to several rivers, including the Gila River, the San Francisco River, and the San Carlos River.
Economy
The economy of Graham County is largely based on agriculture and mining. The county is home to several large copper mines, including the Morenci Mine, which is the largest copper mine in North America. The county is also home to several large cattle ranches, which produce beef, dairy, and other agricultural products.
The county is also home to several manufacturing companies, including a paper mill, a furniture factory, and a plastics factory. The county is also home to several retail stores, including a Walmart Supercenter and a Lowe’s Home Improvement store.
Demographics
As of the 2010 census, the population of Graham County was 37,220. The population is largely white (83.3%), with smaller percentages of Hispanic (14.2%), Native American (1.3%), and African American (0.7%) residents. The median household income in the county is $41,945, and the median age is 36.7 years.
The largest city in the county is Safford, which has a population of 9,541. Other cities in the county include Thatcher (5,908), Pima (2,837), and Solomonville (1,945). The county is also home to several small towns, including Fort Thomas (1,072), Central (845), and Eden (717).
Common Questions
What is Per Capita Income in Graham County?
Per Capita income in Graham County is $24,052.
What is the Median Family Income in Graham County?
Median Family Income in Graham County is $71,035.
What is the Median Household income in Graham County?
Median Household Income in Graham County is $64,089.
What is Income or Wage Gap in Graham County?
Income or Wage Gap in Graham County is 30.4%.
Women in Graham County earn 69.6 cents for every dollar earned by a man.
What is Family Income Deficit in Graham County?
Family Income Deficit in Graham County is $13,777.
Families that are below poverty line in Graham County earn $13,777 less on average than the poverty threshold level.
What is Inequality or Gini Index in Graham County?
Inequality or Gini Index in Graham County is 0.41.
What is the Total Population of Graham County?
Total Population of Graham County is 38,453.
What is the Total Male Population of Graham County?
Total Male Population of Graham County is 20,530.
What is the Total Female Population of Graham County?
Total Female Population of Graham County is 17,923.
What is the Ratio of Males per 100 Females in Graham County?
There are 114.55 Males per 100 Females in Graham County.
What is the Ratio of Females per 100 Males in Graham County?
There are 87.30 Females per 100 Males in Graham County.
What is the Median Population Age in Graham County?
Median Population Age in Graham County is 34.1 Years.
What is the Average Family Size in Graham County
Average Family Size in Graham County is 3.4 People.
What is the Average Household Size in Graham County
Average Household Size in Graham County is 2.9 People.
How Large is the Labor Force in Graham County?
There are 14,943 People in the Labor Forcein in Graham County.
What is the Percentage of People in the Labor Force in Graham County?
50.6% of People are in the Labor Force in Graham County.
What is the Unemployment Rate in Graham County?
Unemployment Rate in Graham County is 6.0%.