Apache County, AZ Map & Demographics
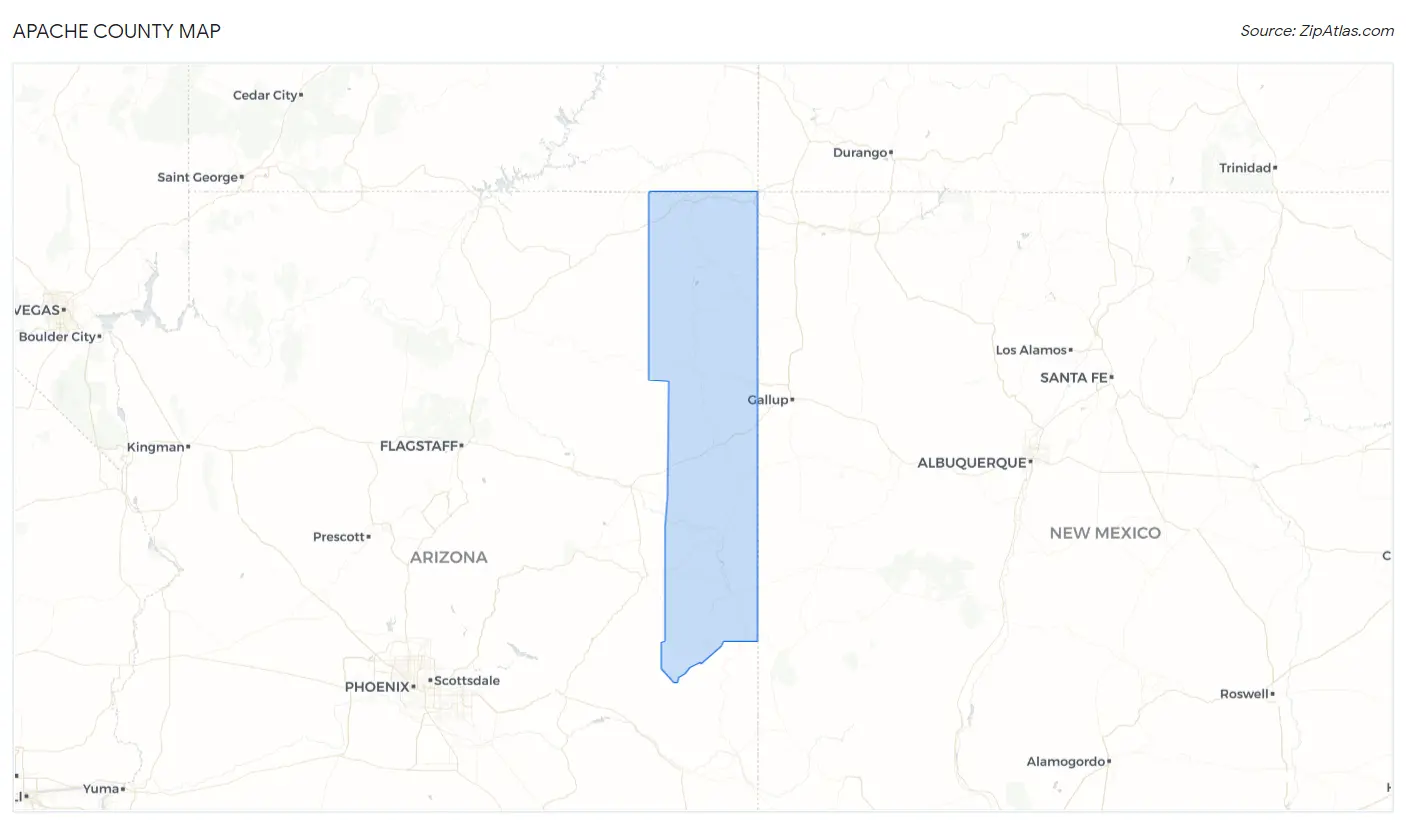
Apache County Map
Apache County Overview
$18,930
PER CAPITA INCOME
$46,534
AVG FAMILY INCOME
$37,483
AVG HOUSEHOLD INCOME
9.8%
WAGE / INCOME GAP [ % ]
90.2¢/ $1
WAGE / INCOME GAP [ $ ]
$15,187
FAMILY INCOME DEFICIT
0.51
INEQUALITY / GINI INDEX
66,054
TOTAL POPULATION
32,843
MALE POPULATION
33,211
FEMALE POPULATION
98.89
MALES / 100 FEMALES
101.12
FEMALES / 100 MALES
35.6
MEDIAN AGE
4.3
AVG FAMILY SIZE
3.3
AVG HOUSEHOLD SIZE
20,140
LABOR FORCE [ PEOPLE ]
39.7%
PERCENT IN LABOR FORCE
9.5%
UNEMPLOYMENT RATE
Apache County Area Codes
Income in Apache County
Income Overview in Apache County
Per Capita Income in Apache County is $18,930, while median incomes of families and households are $46,534 and $37,483 respectively.
| Characteristic | Number | Measure |
| Per Capita Income | 66,054 | $18,930 |
| Median Family Income | 12,899 | $46,534 |
| Mean Family Income | 12,899 | $62,325 |
| Median Household Income | 19,786 | $37,483 |
| Mean Household Income | 19,786 | $53,624 |
| Income Deficit | 12,899 | $15,187 |
| Wage / Income Gap (%) | 66,054 | 9.76% |
| Wage / Income Gap ($) | 66,054 | 90.24¢ per $1 |
| Gini / Inequality Index | 66,054 | 0.51 |
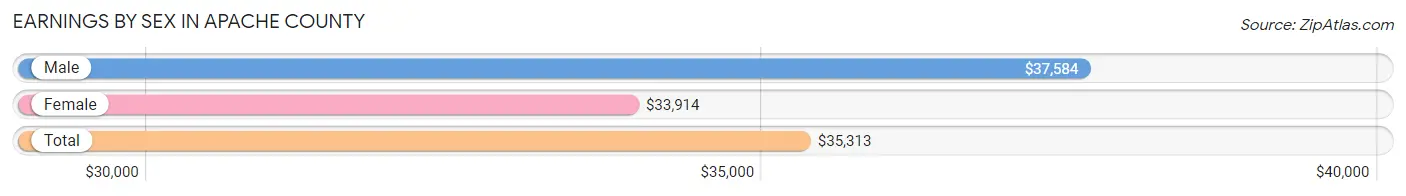
Earnings by Sex in Apache County
Average Earnings in Apache County are $35,313, $37,584 for men and $33,914 for women, a difference of 9.8%.
| Sex | Number | Average Earnings |
| Male | 10,534 (50.8%) | $37,584 |
| Female | 10,188 (49.2%) | $33,914 |
| Total | 20,722 (100.0%) | $35,313 |
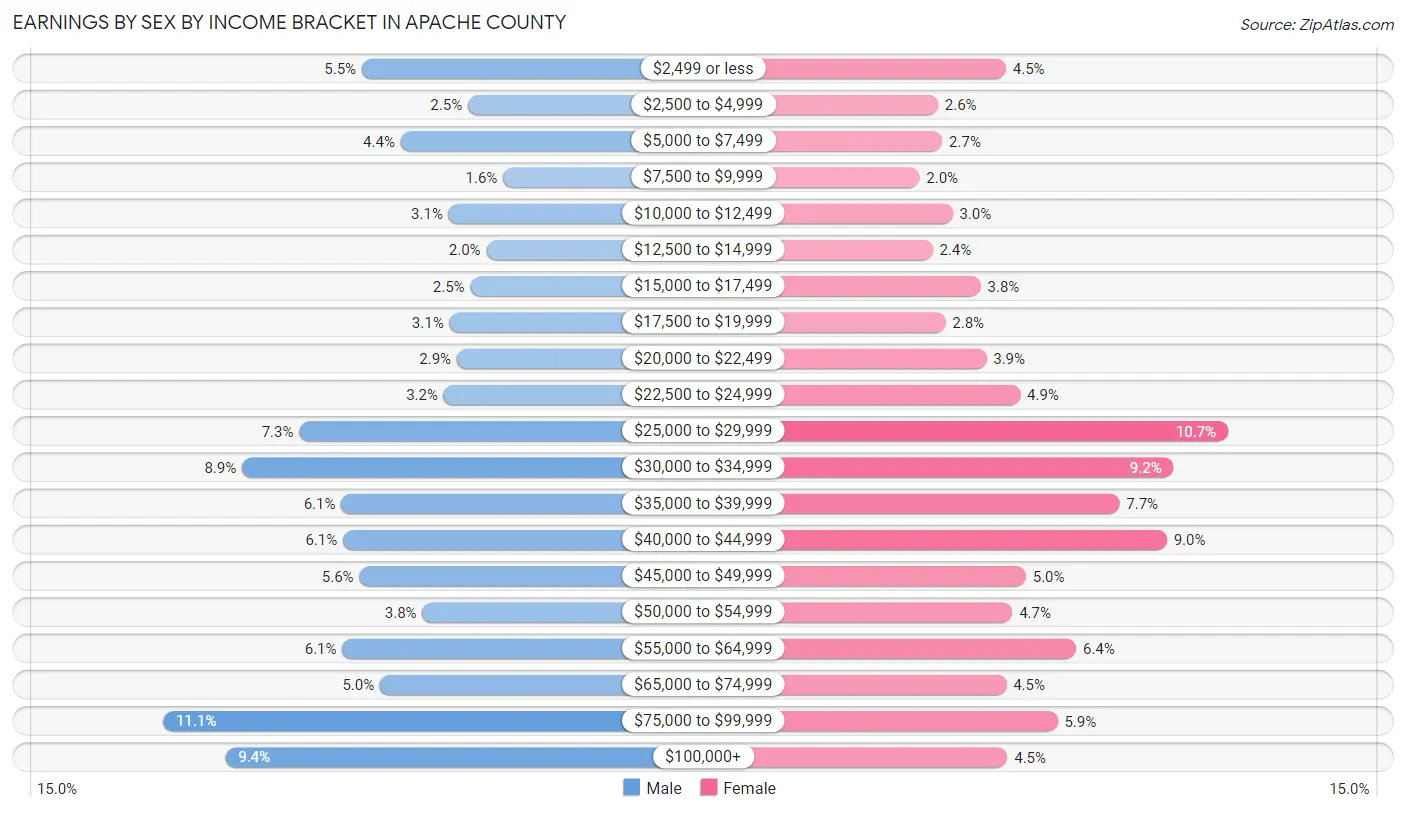
Earnings by Sex by Income Bracket in Apache County
The most common earnings brackets in Apache County are $75,000 to $99,999 for men (1,170 | 11.1%) and $25,000 to $29,999 for women (1,091 | 10.7%).
| Income | Male | Female |
| $2,499 or less | 581 (5.5%) | 455 (4.5%) |
| $2,500 to $4,999 | 268 (2.5%) | 261 (2.6%) |
| $5,000 to $7,499 | 467 (4.4%) | 273 (2.7%) |
| $7,500 to $9,999 | 163 (1.5%) | 208 (2.0%) |
| $10,000 to $12,499 | 324 (3.1%) | 303 (3.0%) |
| $12,500 to $14,999 | 213 (2.0%) | 246 (2.4%) |
| $15,000 to $17,499 | 260 (2.5%) | 383 (3.8%) |
| $17,500 to $19,999 | 322 (3.1%) | 282 (2.8%) |
| $20,000 to $22,499 | 300 (2.9%) | 399 (3.9%) |
| $22,500 to $24,999 | 339 (3.2%) | 496 (4.9%) |
| $25,000 to $29,999 | 767 (7.3%) | 1,091 (10.7%) |
| $30,000 to $34,999 | 936 (8.9%) | 935 (9.2%) |
| $35,000 to $39,999 | 643 (6.1%) | 780 (7.7%) |
| $40,000 to $44,999 | 637 (6.0%) | 916 (9.0%) |
| $45,000 to $49,999 | 589 (5.6%) | 512 (5.0%) |
| $50,000 to $54,999 | 402 (3.8%) | 474 (4.6%) |
| $55,000 to $64,999 | 639 (6.1%) | 656 (6.4%) |
| $65,000 to $74,999 | 528 (5.0%) | 456 (4.5%) |
| $75,000 to $99,999 | 1,170 (11.1%) | 603 (5.9%) |
| $100,000+ | 986 (9.4%) | 459 (4.5%) |
| Total | 10,534 (100.0%) | 10,188 (100.0%) |
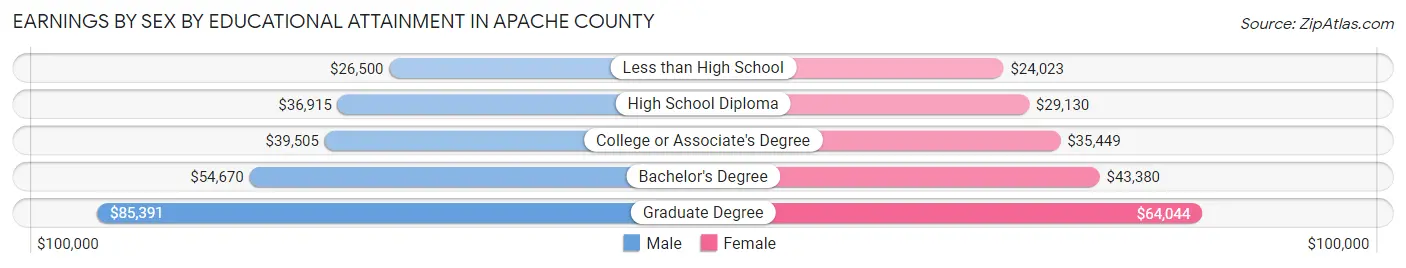
Earnings by Sex by Educational Attainment in Apache County
Average earnings in Apache County are $41,285 for men and $35,951 for women, a difference of 12.9%. Men with an educational attainment of graduate degree enjoy the highest average annual earnings of $85,391, while those with less than high school education earn the least with $26,500. Women with an educational attainment of graduate degree earn the most with the average annual earnings of $64,044, while those with less than high school education have the smallest earnings of $24,023.
| Educational Attainment | Male Income | Female Income |
| Less than High School | $26,500 | $24,023 |
| High School Diploma | $36,915 | $29,130 |
| College or Associate's Degree | $39,505 | $35,449 |
| Bachelor's Degree | $54,670 | $43,380 |
| Graduate Degree | $85,391 | $64,044 |
| Total | $41,285 | $35,951 |
Family Income in Apache County
Family Income Brackets in Apache County
According to the Apache County family income data, there are 2,128 families falling into the $50,000 to $74,999 income range, which is the most common income bracket and makes up 16.5% of all families. Conversely, the $200,000+ income bracket is the least frequent group with only 335 families (2.6%) belonging to this category.
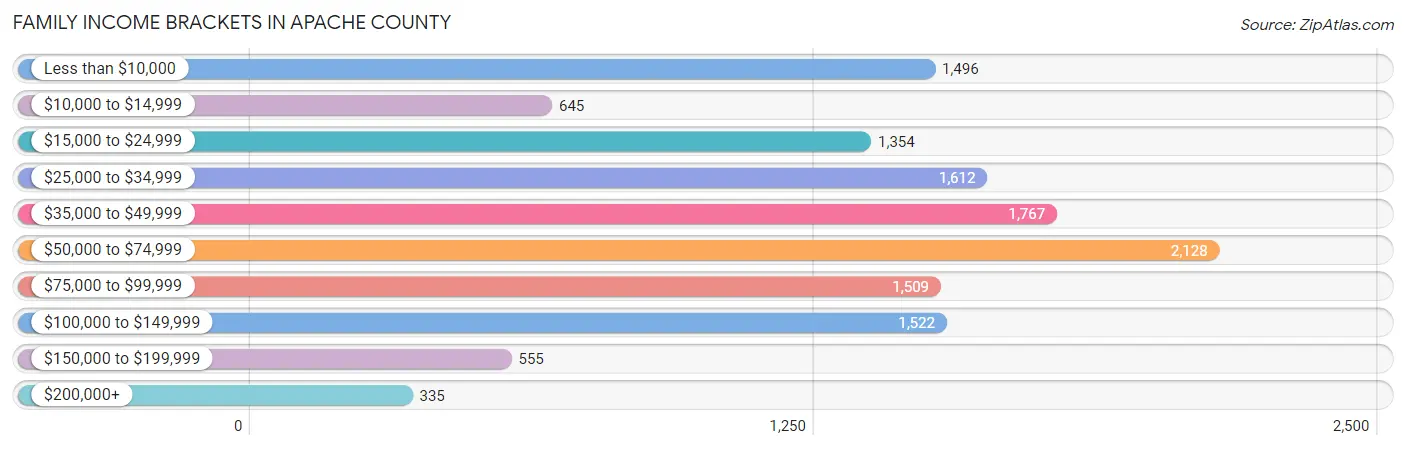
| Income Bracket | # Families | % Families |
| Less than $10,000 | 1,496 | 11.6% |
| $10,000 to $14,999 | 645 | 5.0% |
| $15,000 to $24,999 | 1,354 | 10.5% |
| $25,000 to $34,999 | 1,612 | 12.5% |
| $35,000 to $49,999 | 1,767 | 13.7% |
| $50,000 to $74,999 | 2,128 | 16.5% |
| $75,000 to $99,999 | 1,509 | 11.7% |
| $100,000 to $149,999 | 1,522 | 11.8% |
| $150,000 to $199,999 | 555 | 4.3% |
| $200,000+ | 335 | 2.6% |
Family Income by Famaliy Size in Apache County
6-person families (905 | 7.0%) account for the highest median family income in Apache County with $62,250 per family, while 2-person families (5,417 | 42.0%) have the highest median income of $22,324 per family member.
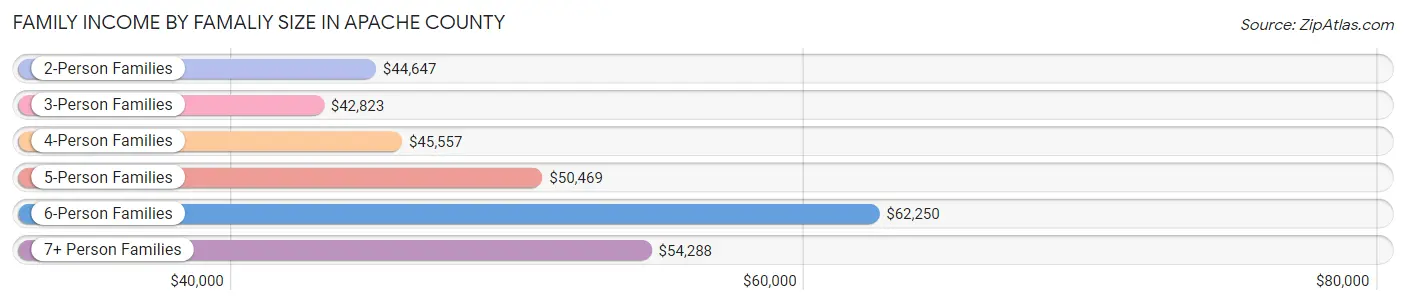
| Income Bracket | # Families | Median Income |
| 2-Person Families | 5,417 (42.0%) | $44,647 |
| 3-Person Families | 2,522 (19.6%) | $42,823 |
| 4-Person Families | 2,015 (15.6%) | $45,557 |
| 5-Person Families | 1,175 (9.1%) | $50,469 |
| 6-Person Families | 905 (7.0%) | $62,250 |
| 7+ Person Families | 865 (6.7%) | $54,288 |
| Total | 12,899 (100.0%) | $46,534 |
Family Income by Number of Earners in Apache County
The median family income in Apache County is $46,534, with families comprising 3+ earners (781) having the highest median family income of $129,196, while families with no earners (4,289) have the lowest median family income of $21,710, accounting for 6.0% and 33.3% of families, respectively.
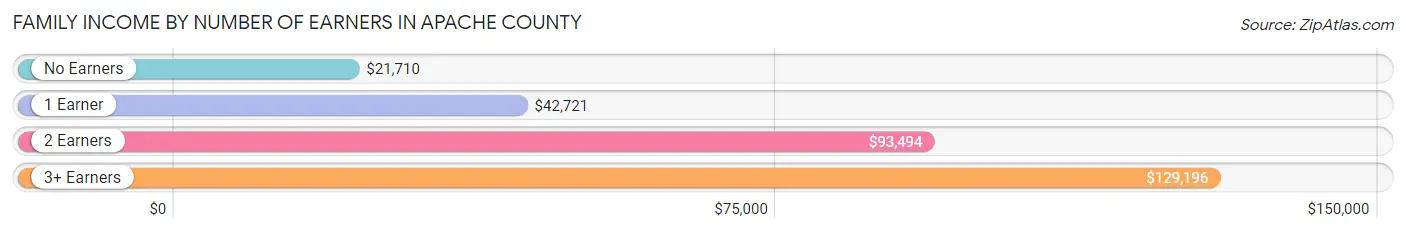
| Number of Earners | # Families | Median Income |
| No Earners | 4,289 (33.3%) | $21,710 |
| 1 Earner | 5,056 (39.2%) | $42,721 |
| 2 Earners | 2,773 (21.5%) | $93,494 |
| 3+ Earners | 781 (6.0%) | $129,196 |
| Total | 12,899 (100.0%) | $46,534 |
Household Income in Apache County
Household Income Brackets in Apache County
With 3,443 households falling in the category, the less than $10,000 income range is the most frequent in Apache County, accounting for 17.4% of all households. In contrast, only 396 households (2.0%) fall into the $200,000+ income bracket, making it the least populous group.
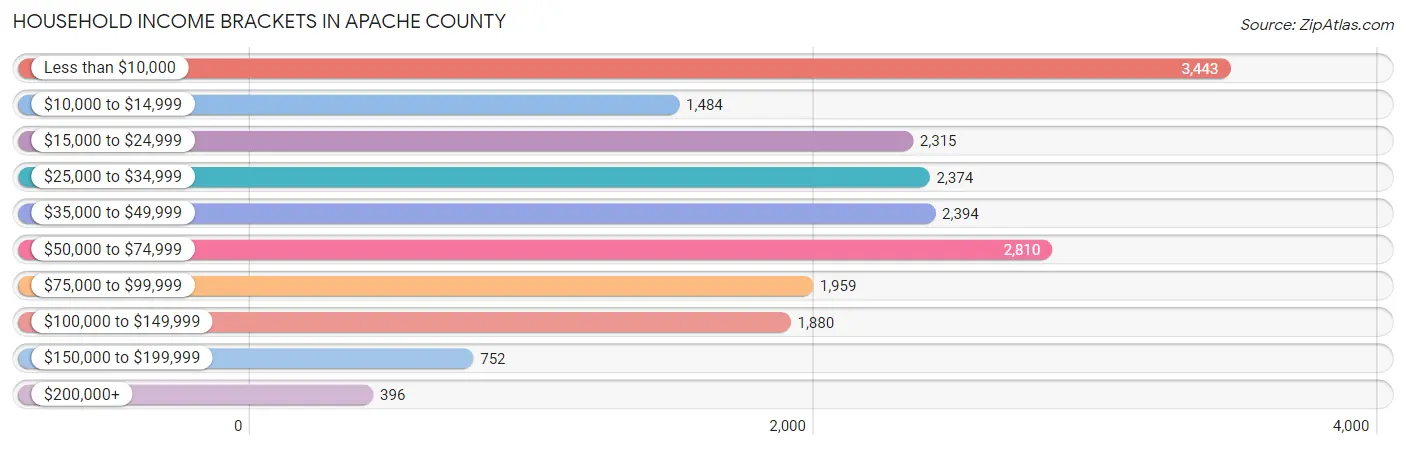
| Income Bracket | # Households | % Households |
| Less than $10,000 | 3,443 | 17.4% |
| $10,000 to $14,999 | 1,484 | 7.5% |
| $15,000 to $24,999 | 2,315 | 11.7% |
| $25,000 to $34,999 | 2,374 | 12.0% |
| $35,000 to $49,999 | 2,394 | 12.1% |
| $50,000 to $74,999 | 2,810 | 14.2% |
| $75,000 to $99,999 | 1,959 | 9.9% |
| $100,000 to $149,999 | 1,880 | 9.5% |
| $150,000 to $199,999 | 752 | 3.8% |
| $200,000+ | 396 | 2.0% |
Household Income by Householder Age in Apache County
The median household income in Apache County is $37,483, with the highest median household income of $42,694 found in the 45 to 64 years age bracket for the primary householder. A total of 8,549 households (43.2%) fall into this category. Meanwhile, the 15 to 24 years age bracket for the primary householder has the lowest median household income of $0, with 204 households (1.0%) in this group.
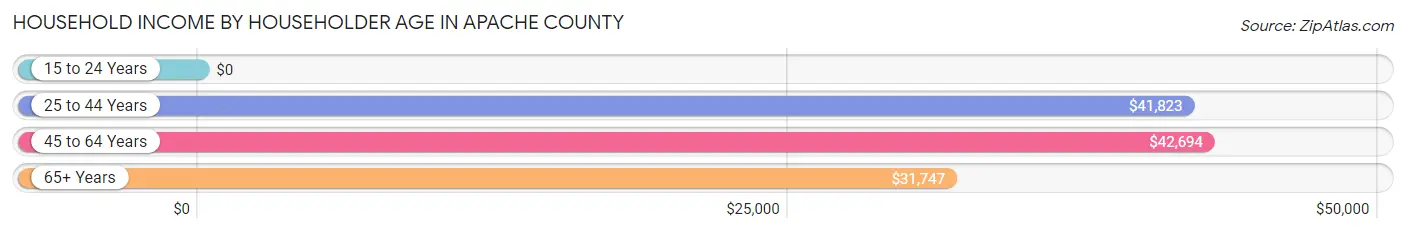
| Income Bracket | # Households | Median Income |
| 15 to 24 Years | 204 (1.0%) | $0 |
| 25 to 44 Years | 4,439 (22.4%) | $41,823 |
| 45 to 64 Years | 8,549 (43.2%) | $42,694 |
| 65+ Years | 6,594 (33.3%) | $31,747 |
| Total | 19,786 (100.0%) | $37,483 |
Poverty in Apache County
Income Below Poverty by Sex and Age in Apache County
With 32.6% poverty level for males and 32.5% for females among the residents of Apache County, under 5 year old males and under 5 year old females are the most vulnerable to poverty, with 1,112 males (53.3%) and 1,045 females (52.9%) in their respective age groups living below the poverty level.
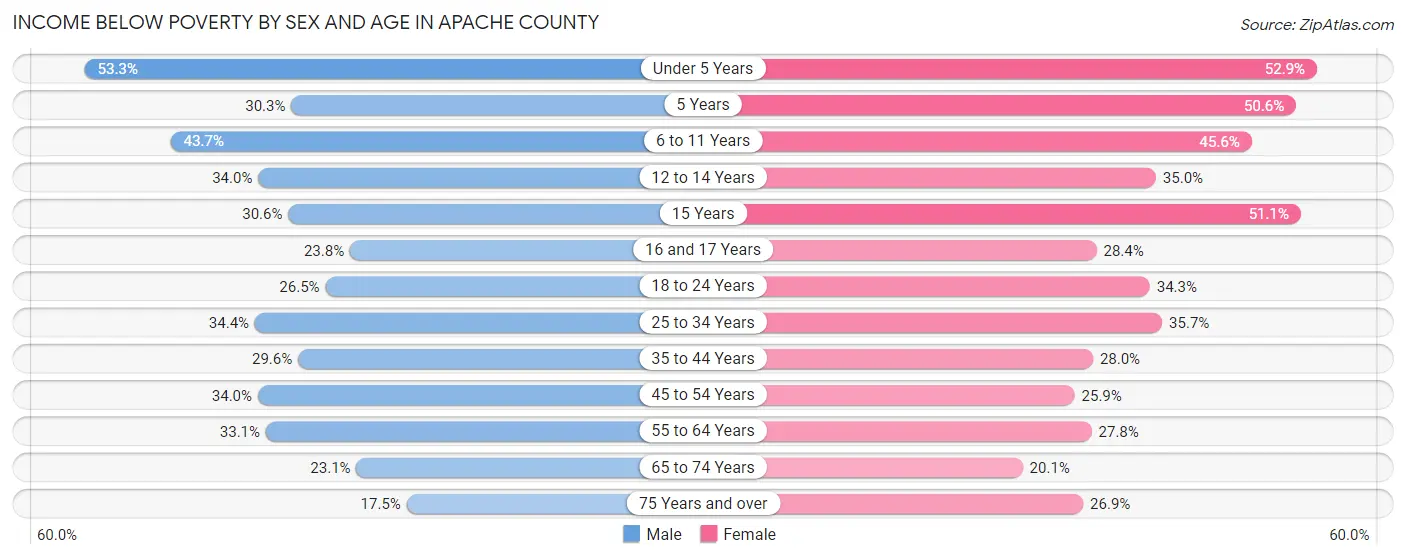
| Age Bracket | Male | Female |
| Under 5 Years | 1,112 (53.3%) | 1,045 (52.9%) |
| 5 Years | 110 (30.3%) | 216 (50.6%) |
| 6 to 11 Years | 1,367 (43.7%) | 1,366 (45.6%) |
| 12 to 14 Years | 544 (34.0%) | 568 (35.0%) |
| 15 Years | 140 (30.6%) | 254 (51.1%) |
| 16 and 17 Years | 259 (23.8%) | 307 (28.4%) |
| 18 to 24 Years | 765 (26.5%) | 1,003 (34.3%) |
| 25 to 34 Years | 1,455 (34.4%) | 1,477 (35.7%) |
| 35 to 44 Years | 1,105 (29.5%) | 963 (28.0%) |
| 45 to 54 Years | 1,180 (34.0%) | 965 (25.9%) |
| 55 to 64 Years | 1,356 (33.1%) | 1,220 (27.8%) |
| 65 to 74 Years | 681 (23.1%) | 684 (20.1%) |
| 75 Years and over | 299 (17.4%) | 617 (26.9%) |
| Total | 10,373 (32.6%) | 10,685 (32.5%) |
Income Above Poverty by Sex and Age in Apache County
According to the poverty statistics in Apache County, males aged 75 years and over and females aged 65 to 74 years are the age groups that are most secure financially, with 82.6% of males and 79.9% of females in these age groups living above the poverty line.
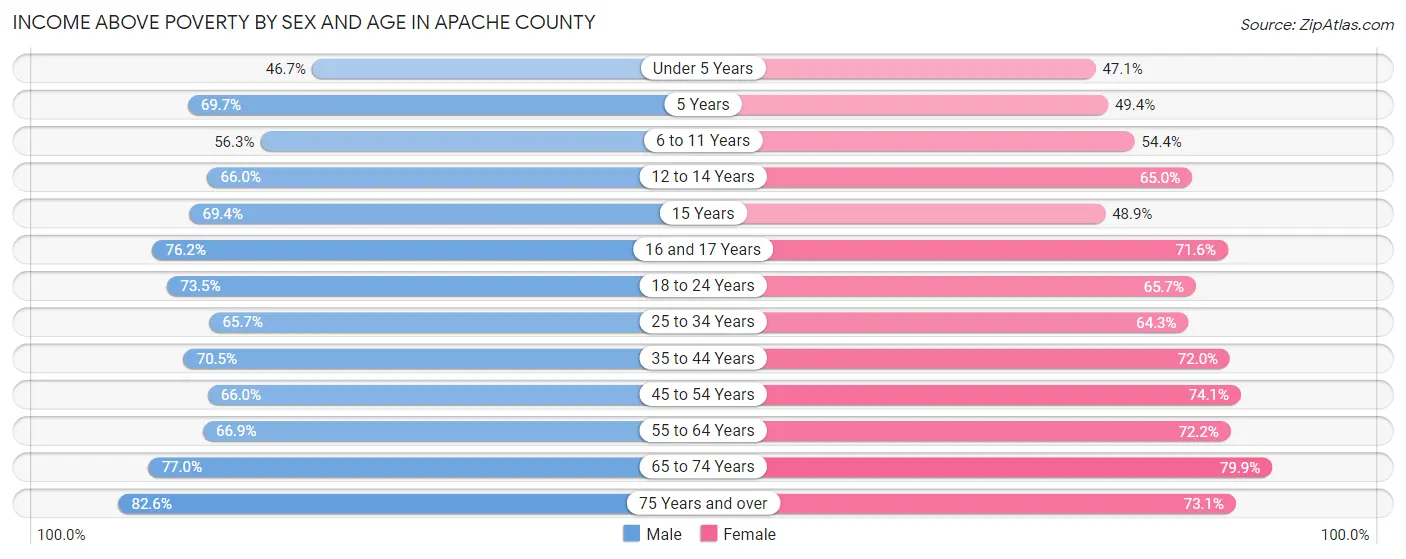
| Age Bracket | Male | Female |
| Under 5 Years | 974 (46.7%) | 930 (47.1%) |
| 5 Years | 253 (69.7%) | 211 (49.4%) |
| 6 to 11 Years | 1,758 (56.3%) | 1,627 (54.4%) |
| 12 to 14 Years | 1,057 (66.0%) | 1,056 (65.0%) |
| 15 Years | 317 (69.4%) | 243 (48.9%) |
| 16 and 17 Years | 831 (76.2%) | 775 (71.6%) |
| 18 to 24 Years | 2,122 (73.5%) | 1,921 (65.7%) |
| 25 to 34 Years | 2,781 (65.6%) | 2,662 (64.3%) |
| 35 to 44 Years | 2,635 (70.5%) | 2,480 (72.0%) |
| 45 to 54 Years | 2,289 (66.0%) | 2,757 (74.1%) |
| 55 to 64 Years | 2,737 (66.9%) | 3,165 (72.2%) |
| 65 to 74 Years | 2,273 (76.9%) | 2,712 (79.9%) |
| 75 Years and over | 1,414 (82.6%) | 1,678 (73.1%) |
| Total | 21,441 (67.4%) | 22,217 (67.5%) |
Income Below Poverty Among Married-Couple Families in Apache County
The poverty statistics for married-couple families in Apache County show that 15.7% or 1,166 of the total 7,409 families live below the poverty line. Families with 5 or more children have the highest poverty rate of 48.1%, comprising of 76 families. On the other hand, families with no children have the lowest poverty rate of 10.5%, which includes 471 families.
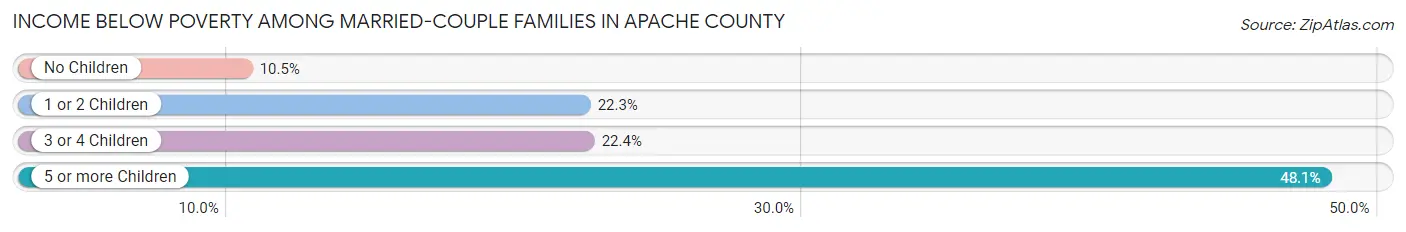
| Children | Above Poverty | Below Poverty |
| No Children | 4,009 (89.5%) | 471 (10.5%) |
| 1 or 2 Children | 1,287 (77.7%) | 369 (22.3%) |
| 3 or 4 Children | 865 (77.6%) | 250 (22.4%) |
| 5 or more Children | 82 (51.9%) | 76 (48.1%) |
| Total | 6,243 (84.3%) | 1,166 (15.7%) |
Income Below Poverty Among Single-Parent Households in Apache County
According to the poverty data in Apache County, 35.7% or 421 single-father households and 42.1% or 1,814 single-mother households are living below the poverty line. Among single-father households, those with 5 or more children have the highest poverty rate, with 17 households (80.9%) experiencing poverty. Likewise, among single-mother households, those with 5 or more children have the highest poverty rate, with 119 households (89.5%) falling below the poverty line.
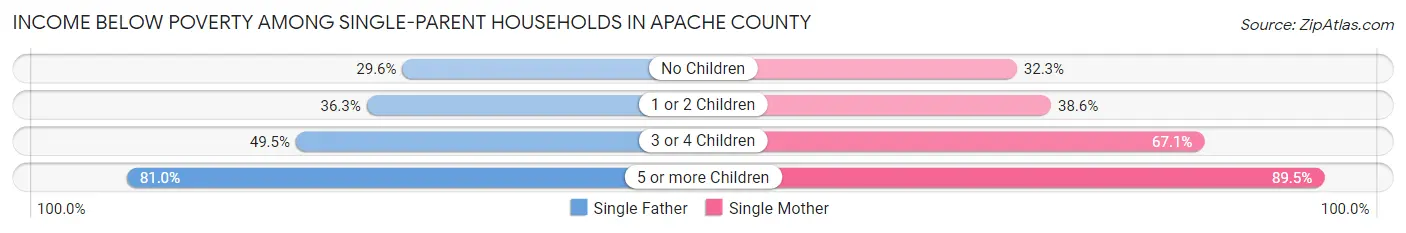
| Children | Single Father | Single Mother |
| No Children | 187 (29.6%) | 502 (32.3%) |
| 1 or 2 Children | 122 (36.3%) | 768 (38.6%) |
| 3 or 4 Children | 95 (49.5%) | 425 (67.1%) |
| 5 or more Children | 17 (80.9%) | 119 (89.5%) |
| Total | 421 (35.7%) | 1,814 (42.1%) |
Income Below Poverty Among Married-Couple vs Single-Parent Households in Apache County
The poverty data for Apache County shows that 1,166 of the married-couple family households (15.7%) and 2,235 of the single-parent households (40.7%) are living below the poverty level. Within the married-couple family households, those with 5 or more children have the highest poverty rate, with 76 households (48.1%) falling below the poverty line. Among the single-parent households, those with 5 or more children have the highest poverty rate, with 136 household (88.3%) living below poverty.
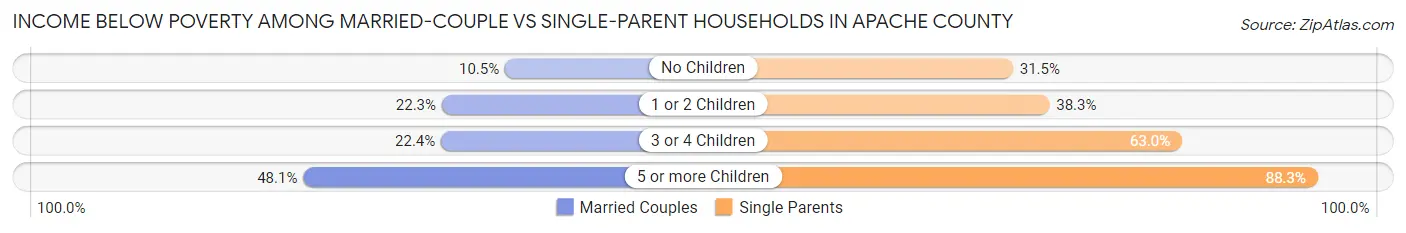
| Children | Married-Couple Families | Single-Parent Households |
| No Children | 471 (10.5%) | 689 (31.5%) |
| 1 or 2 Children | 369 (22.3%) | 890 (38.3%) |
| 3 or 4 Children | 250 (22.4%) | 520 (63.0%) |
| 5 or more Children | 76 (48.1%) | 136 (88.3%) |
| Total | 1,166 (15.7%) | 2,235 (40.7%) |
Race in Apache County
The most populous races in Apache County are Native / Alaskan (48,176 | 72.9%), White / Caucasian (13,556 | 20.5%), and Hispanic or Latino (4,634 | 7.0%).
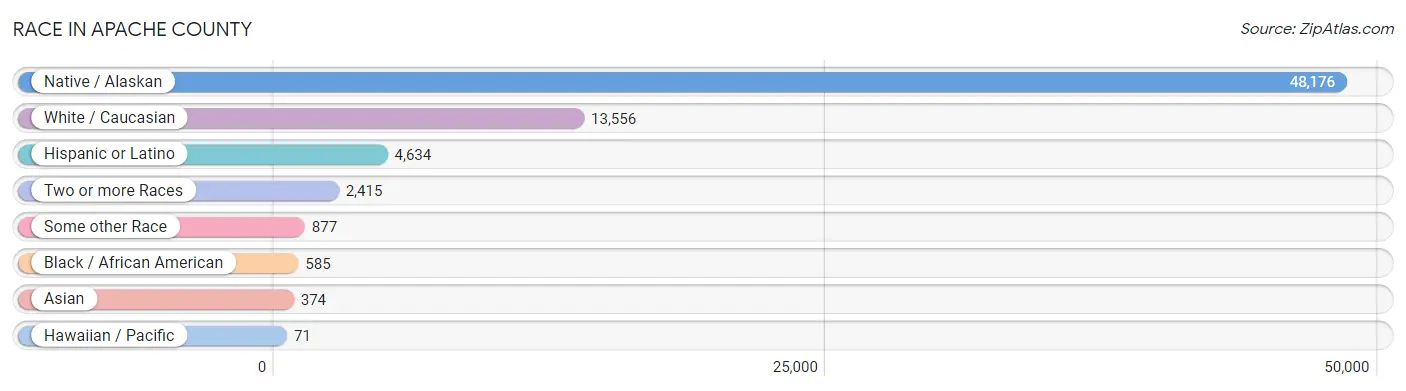
| Race | # Population | % Population |
| Asian | 374 | 0.6% |
| Black / African American | 585 | 0.9% |
| Hawaiian / Pacific | 71 | 0.1% |
| Hispanic or Latino | 4,634 | 7.0% |
| Native / Alaskan | 48,176 | 72.9% |
| White / Caucasian | 13,556 | 20.5% |
| Two or more Races | 2,415 | 3.7% |
| Some other Race | 877 | 1.3% |
| Total | 66,054 | 100.0% |
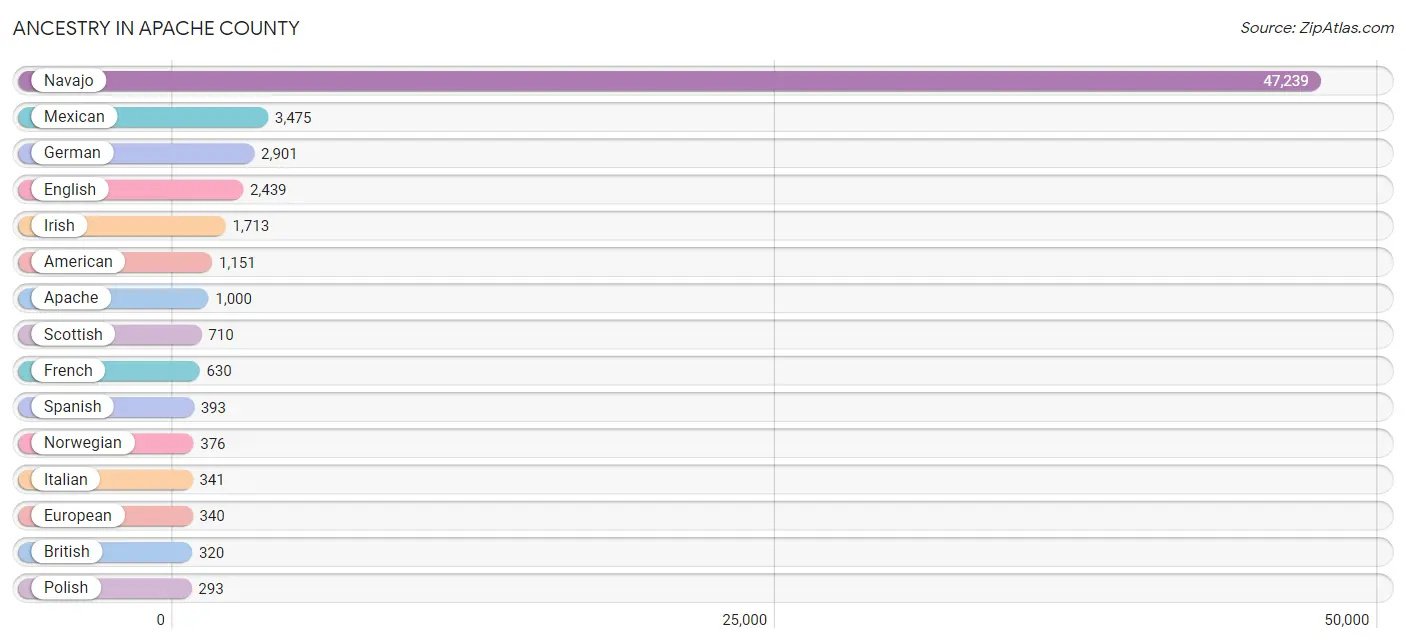
Ancestry in Apache County
The most populous ancestries reported in Apache County are Navajo (47,239 | 71.5%), Mexican (3,475 | 5.3%), German (2,901 | 4.4%), English (2,439 | 3.7%), and Irish (1,713 | 2.6%), together accounting for 87.5% of all Apache County residents.
| Ancestry | # Population | % Population |
| African | 32 | 0.1% |
| American | 1,151 | 1.7% |
| Apache | 1,000 | 1.5% |
| Arab | 12 | 0.0% |
| Arapaho | 12 | 0.0% |
| Armenian | 16 | 0.0% |
| Austrian | 6 | 0.0% |
| Bhutanese | 34 | 0.1% |
| Blackfeet | 21 | 0.0% |
| Bolivian | 4 | 0.0% |
| British | 320 | 0.5% |
| Burmese | 2 | 0.0% |
| Canadian | 16 | 0.0% |
| Central American | 25 | 0.0% |
| Cherokee | 61 | 0.1% |
| Cheyenne | 82 | 0.1% |
| Chickasaw | 9 | 0.0% |
| Chippewa | 1 | 0.0% |
| Choctaw | 31 | 0.1% |
| Colombian | 3 | 0.0% |
| Creek | 34 | 0.1% |
| Crow | 2 | 0.0% |
| Cuban | 29 | 0.0% |
| Czech | 19 | 0.0% |
| Danish | 166 | 0.3% |
| Dominican | 6 | 0.0% |
| Dutch | 264 | 0.4% |
| Dutch West Indian | 12 | 0.0% |
| Eastern European | 49 | 0.1% |
| English | 2,439 | 3.7% |
| European | 340 | 0.5% |
| Finnish | 80 | 0.1% |
| French | 630 | 0.9% |
| French Canadian | 65 | 0.1% |
| German | 2,901 | 4.4% |
| Greek | 30 | 0.1% |
| Guatemalan | 14 | 0.0% |
| Haitian | 52 | 0.1% |
| Honduran | 8 | 0.0% |
| Hopi | 155 | 0.2% |
| Hungarian | 19 | 0.0% |
| Indian (Asian) | 90 | 0.1% |
| Inupiat | 9 | 0.0% |
| Iranian | 3 | 0.0% |
| Irish | 1,713 | 2.6% |
| Iroquois | 5 | 0.0% |
| Italian | 341 | 0.5% |
| Kenyan | 36 | 0.1% |
| Kiowa | 10 | 0.0% |
| Korean | 207 | 0.3% |
| Lebanese | 12 | 0.0% |
| Mexican | 3,475 | 5.3% |
| Mexican American Indian | 6 | 0.0% |
| Native Hawaiian | 43 | 0.1% |
| Navajo | 47,239 | 71.5% |
| Nigerian | 30 | 0.1% |
| Northern European | 62 | 0.1% |
| Norwegian | 376 | 0.6% |
| Osage | 9 | 0.0% |
| Panamanian | 3 | 0.0% |
| Pima | 76 | 0.1% |
| Polish | 293 | 0.4% |
| Portuguese | 5 | 0.0% |
| Potawatomi | 6 | 0.0% |
| Pueblo | 230 | 0.4% |
| Puerto Rican | 130 | 0.2% |
| Russian | 162 | 0.3% |
| Samoan | 36 | 0.1% |
| Scandinavian | 67 | 0.1% |
| Scotch-Irish | 278 | 0.4% |
| Scottish | 710 | 1.1% |
| Serbian | 31 | 0.1% |
| Shoshone | 22 | 0.0% |
| Sioux | 33 | 0.1% |
| South American | 7 | 0.0% |
| Spaniard | 59 | 0.1% |
| Spanish | 393 | 0.6% |
| Spanish American | 8 | 0.0% |
| Sri Lankan | 54 | 0.1% |
| Subsaharan African | 109 | 0.2% |
| Sudanese | 11 | 0.0% |
| Swedish | 126 | 0.2% |
| Swiss | 79 | 0.1% |
| Thai | 61 | 0.1% |
| Tohono O'Odham | 155 | 0.2% |
| Ukrainian | 22 | 0.0% |
| Ute | 17 | 0.0% |
| Welsh | 120 | 0.2% |
| Yaqui | 15 | 0.0% |
| Yuman | 39 | 0.1% | View All 90 Rows |
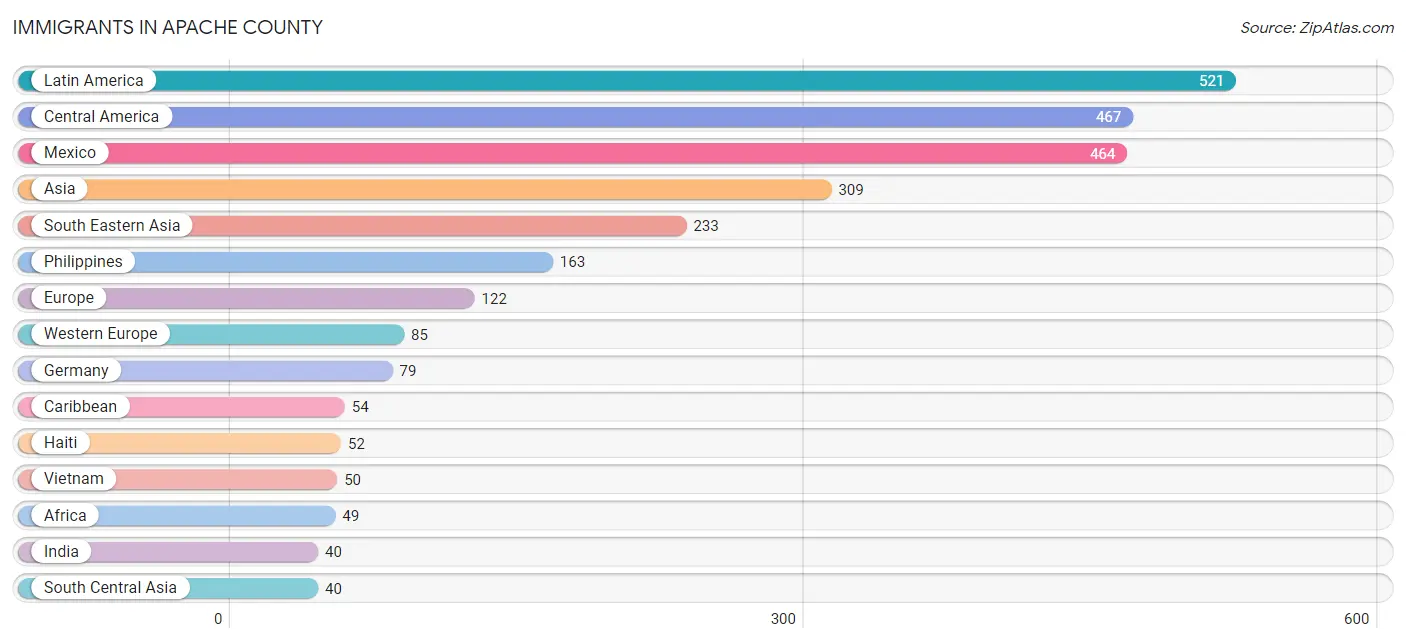
Immigrants in Apache County
The most numerous immigrant groups reported in Apache County came from Latin America (521 | 0.8%), Central America (467 | 0.7%), Mexico (464 | 0.7%), Asia (309 | 0.5%), and South Eastern Asia (233 | 0.4%), together accounting for 3.0% of all Apache County residents.
| Immigration Origin | # Population | % Population |
| Africa | 49 | 0.1% |
| Asia | 309 | 0.5% |
| Austria | 6 | 0.0% |
| Canada | 24 | 0.0% |
| Caribbean | 54 | 0.1% |
| Central America | 467 | 0.7% |
| China | 22 | 0.0% |
| Dominican Republic | 2 | 0.0% |
| Eastern Africa | 36 | 0.1% |
| Eastern Asia | 36 | 0.1% |
| Eastern Europe | 2 | 0.0% |
| Egypt | 2 | 0.0% |
| England | 21 | 0.0% |
| Europe | 122 | 0.2% |
| Germany | 79 | 0.1% |
| Haiti | 52 | 0.1% |
| India | 40 | 0.1% |
| Indonesia | 20 | 0.0% |
| Italy | 13 | 0.0% |
| Japan | 12 | 0.0% |
| Kenya | 36 | 0.1% |
| Korea | 2 | 0.0% |
| Latin America | 521 | 0.8% |
| Mexico | 464 | 0.7% |
| Northern Africa | 13 | 0.0% |
| Northern Europe | 22 | 0.0% |
| Panama | 3 | 0.0% |
| Philippines | 163 | 0.3% |
| Russia | 2 | 0.0% |
| South Central Asia | 40 | 0.1% |
| South Eastern Asia | 233 | 0.4% |
| Southern Europe | 13 | 0.0% |
| Sudan | 11 | 0.0% |
| Vietnam | 50 | 0.1% |
| Western Europe | 85 | 0.1% | View All 35 Rows |
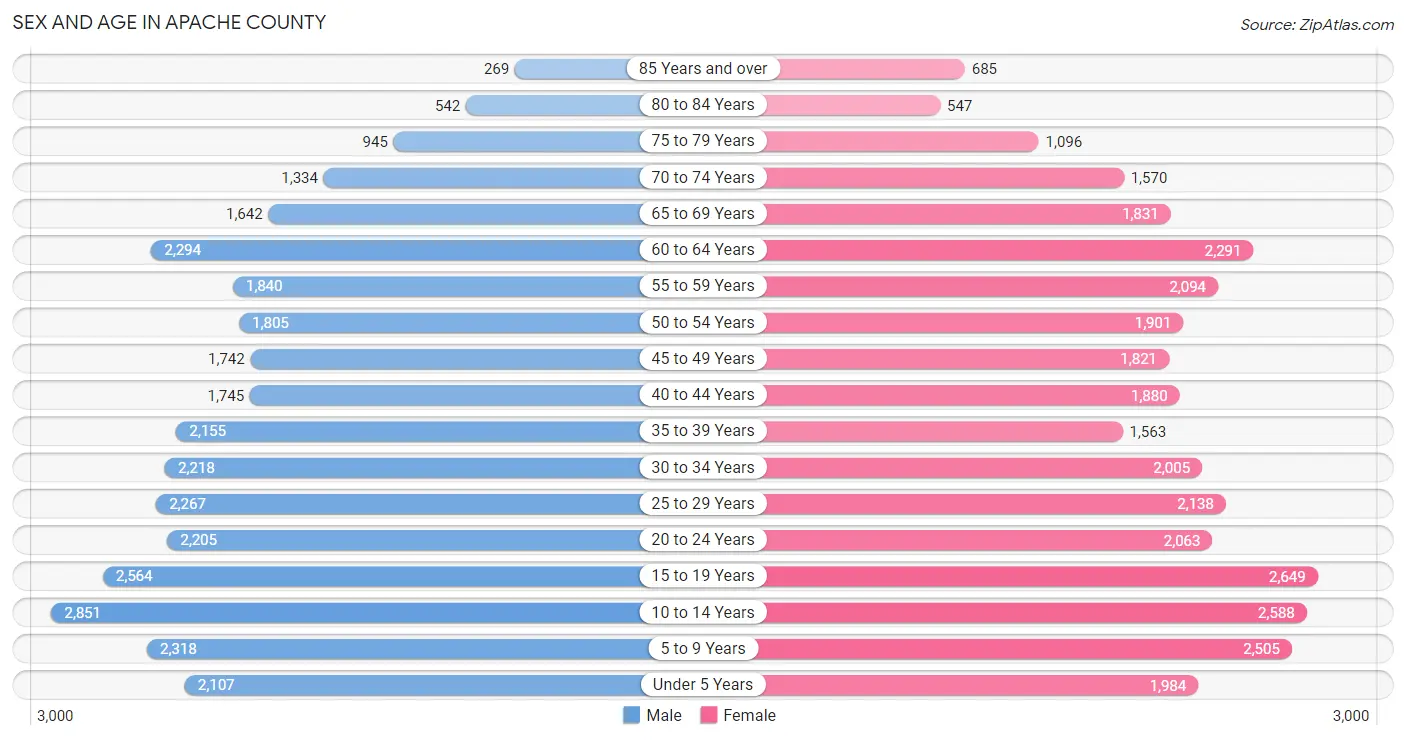
Sex and Age in Apache County
Sex and Age in Apache County
The most populous age groups in Apache County are 10 to 14 Years (2,851 | 8.7%) for men and 15 to 19 Years (2,649 | 8.0%) for women.
| Age Bracket | Male | Female |
| Under 5 Years | 2,107 (6.4%) | 1,984 (6.0%) |
| 5 to 9 Years | 2,318 (7.1%) | 2,505 (7.5%) |
| 10 to 14 Years | 2,851 (8.7%) | 2,588 (7.8%) |
| 15 to 19 Years | 2,564 (7.8%) | 2,649 (8.0%) |
| 20 to 24 Years | 2,205 (6.7%) | 2,063 (6.2%) |
| 25 to 29 Years | 2,267 (6.9%) | 2,138 (6.4%) |
| 30 to 34 Years | 2,218 (6.8%) | 2,005 (6.0%) |
| 35 to 39 Years | 2,155 (6.6%) | 1,563 (4.7%) |
| 40 to 44 Years | 1,745 (5.3%) | 1,880 (5.7%) |
| 45 to 49 Years | 1,742 (5.3%) | 1,821 (5.5%) |
| 50 to 54 Years | 1,805 (5.5%) | 1,901 (5.7%) |
| 55 to 59 Years | 1,840 (5.6%) | 2,094 (6.3%) |
| 60 to 64 Years | 2,294 (7.0%) | 2,291 (6.9%) |
| 65 to 69 Years | 1,642 (5.0%) | 1,831 (5.5%) |
| 70 to 74 Years | 1,334 (4.1%) | 1,570 (4.7%) |
| 75 to 79 Years | 945 (2.9%) | 1,096 (3.3%) |
| 80 to 84 Years | 542 (1.7%) | 547 (1.7%) |
| 85 Years and over | 269 (0.8%) | 685 (2.1%) |
| Total | 32,843 (100.0%) | 33,211 (100.0%) |
Families and Households in Apache County
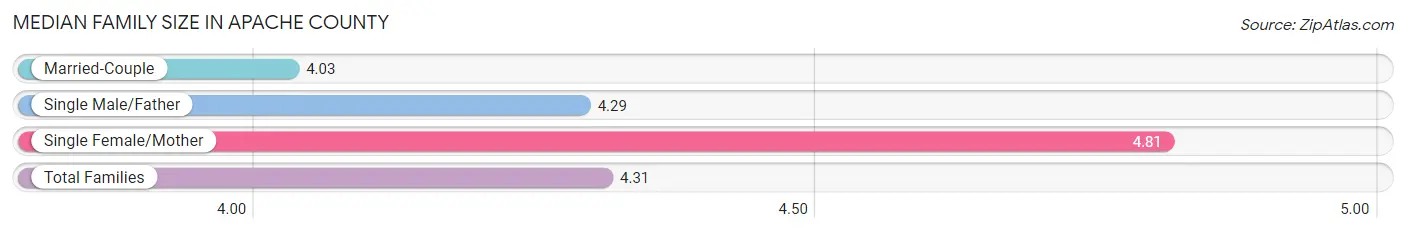
Median Family Size in Apache County
The median family size in Apache County is 4.31 persons per family, with single female/mother families (4,310 | 33.4%) accounting for the largest median family size of 4.81 persons per family. On the other hand, married-couple families (7,409 | 57.4%) represent the smallest median family size with 4.03 persons per family.
| Family Type | # Families | Family Size |
| Married-Couple | 7,409 (57.4%) | 4.03 |
| Single Male/Father | 1,180 (9.1%) | 4.29 |
| Single Female/Mother | 4,310 (33.4%) | 4.81 |
| Total Families | 12,899 (100.0%) | 4.31 |
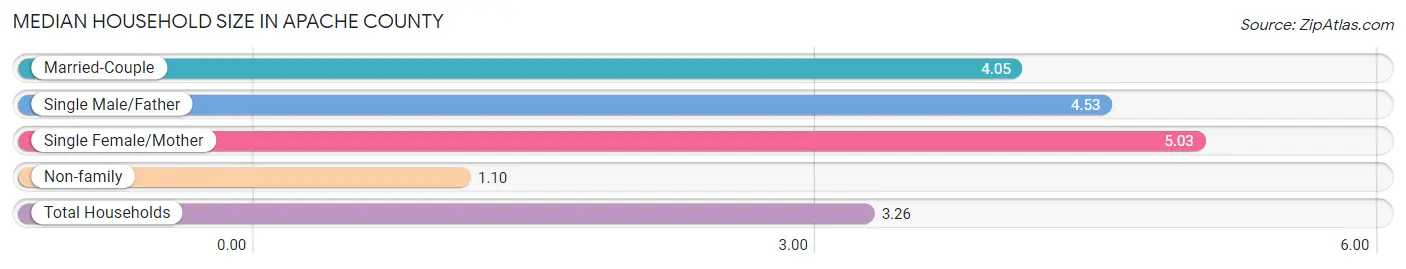
Median Household Size in Apache County
The median household size in Apache County is 3.26 persons per household, with single female/mother households (4,310 | 21.8%) accounting for the largest median household size of 5.03 persons per household. non-family households (6,887 | 34.8%) represent the smallest median household size with 1.10 persons per household.
| Household Type | # Households | Household Size |
| Married-Couple | 7,409 (37.4%) | 4.05 |
| Single Male/Father | 1,180 (6.0%) | 4.53 |
| Single Female/Mother | 4,310 (21.8%) | 5.03 |
| Non-family | 6,887 (34.8%) | 1.10 |
| Total Households | 19,786 (100.0%) | 3.26 |
Household Size by Marriage Status in Apache County
Out of a total of 19,786 households in Apache County, 12,899 (65.2%) are family households, while 6,887 (34.8%) are nonfamily households. The most numerous type of family households are 2-person households, comprising 5,139, and the most common type of nonfamily households are 1-person households, comprising 6,380.
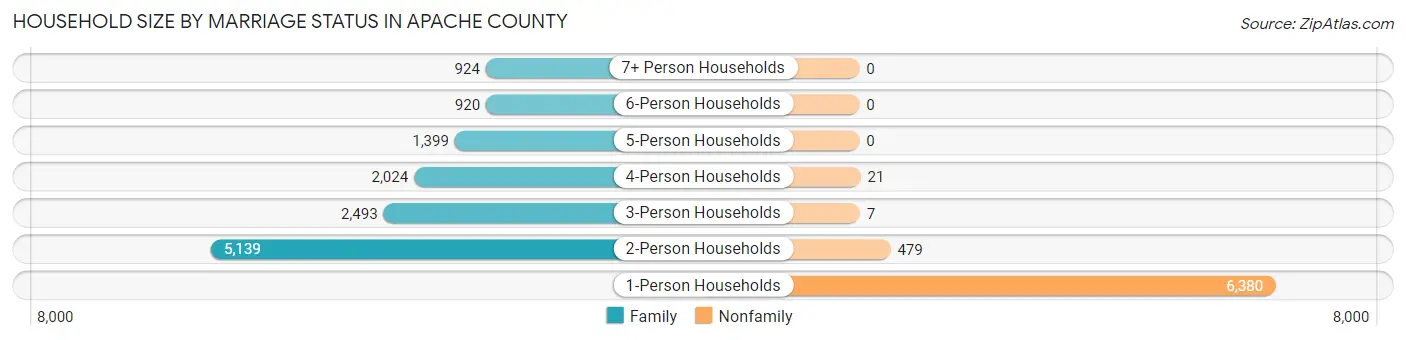
| Household Size | Family Households | Nonfamily Households |
| 1-Person Households | - | 6,380 (32.3%) |
| 2-Person Households | 5,139 (26.0%) | 479 (2.4%) |
| 3-Person Households | 2,493 (12.6%) | 7 (0.0%) |
| 4-Person Households | 2,024 (10.2%) | 21 (0.1%) |
| 5-Person Households | 1,399 (7.1%) | 0 (0.0%) |
| 6-Person Households | 920 (4.6%) | 0 (0.0%) |
| 7+ Person Households | 924 (4.7%) | 0 (0.0%) |
| Total | 12,899 (65.2%) | 6,887 (34.8%) |
Female Fertility in Apache County
Fertility by Age in Apache County
Average fertility rate in Apache County is 54.0 births per 1,000 women. Women in the age bracket of 20 to 34 years have the highest fertility rate with 87.0 births per 1,000 women. Women in the age bracket of 20 to 34 years acount for 68.1% of all women with births.
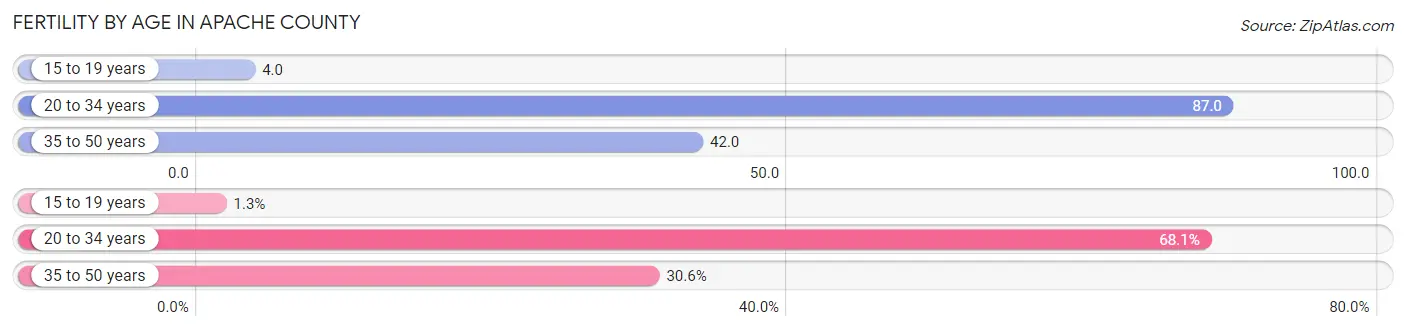
| Age Bracket | Women with Births | Births / 1,000 Women |
| 15 to 19 years | 10 (1.3%) | 4.0 |
| 20 to 34 years | 540 (68.1%) | 87.0 |
| 35 to 50 years | 243 (30.6%) | 42.0 |
| Total | 793 (100.0%) | 54.0 |
Fertility by Age by Marriage Status in Apache County
52.7% of women with births (793) in Apache County are married. The highest percentage of unmarried women with births falls into 20 to 34 years age bracket with 58.2% of them unmarried at the time of birth, while the lowest percentage of unmarried women with births belong to 15 to 19 years age bracket with 0.0% of them unmarried.
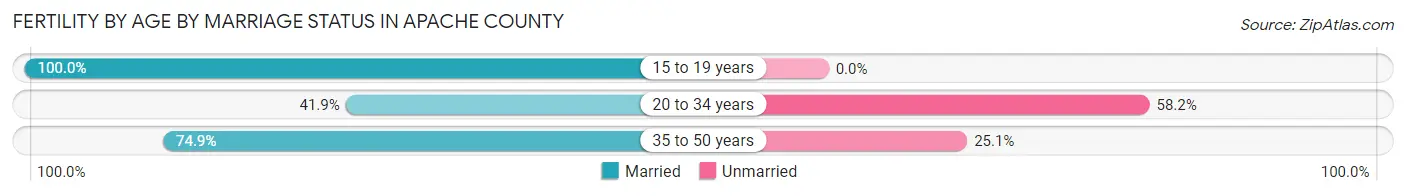
| Age Bracket | Married | Unmarried |
| 15 to 19 years | 10 (100.0%) | 0 (0.0%) |
| 20 to 34 years | 226 (41.8%) | 314 (58.2%) |
| 35 to 50 years | 182 (74.9%) | 61 (25.1%) |
| Total | 418 (52.7%) | 375 (47.3%) |
Fertility by Education in Apache County
Average fertility rate in Apache County is 54.0 births per 1,000 women. Women with the education attainment of college or associate's degree have the highest fertility rate of 79.0 births per 1,000 women, while women with the education attainment of less than high school have the lowest fertility at 10.0 births per 1,000 women. Women with the education attainment of college or associate's degree represent 64.7% of all women with births.
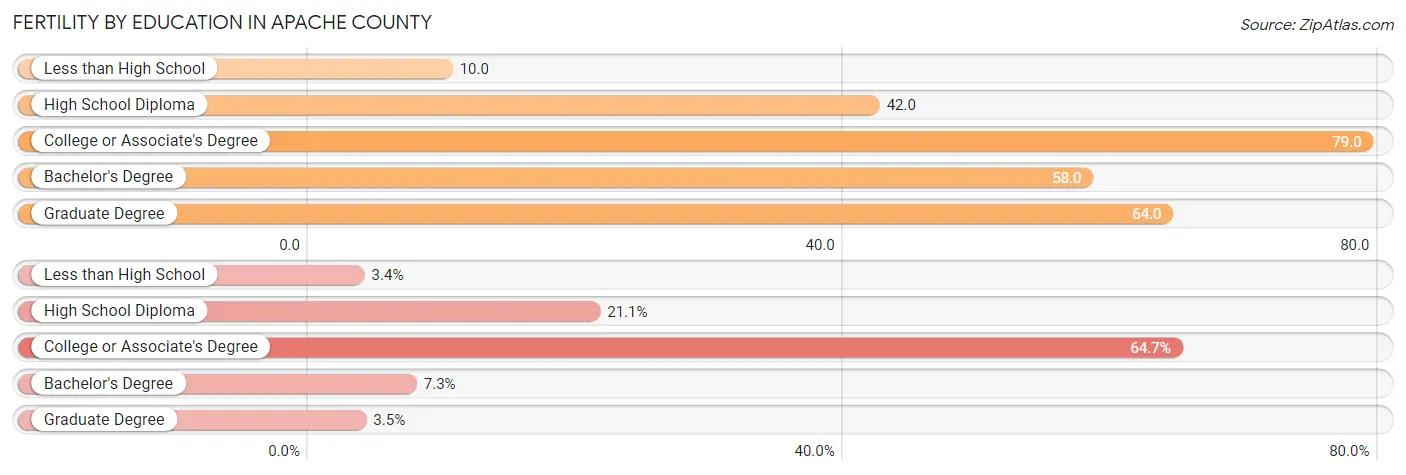
| Educational Attainment | Women with Births | Births / 1,000 Women |
| Less than High School | 27 (3.4%) | 10.0 |
| High School Diploma | 167 (21.1%) | 42.0 |
| College or Associate's Degree | 513 (64.7%) | 79.0 |
| Bachelor's Degree | 58 (7.3%) | 58.0 |
| Graduate Degree | 28 (3.5%) | 64.0 |
| Total | 793 (100.0%) | 54.0 |
Fertility by Education by Marriage Status in Apache County
47.3% of women with births in Apache County are unmarried. Women with the educational attainment of bachelor's degree are most likely to be married with 100.0% of them married at childbirth, while women with the educational attainment of less than high school are least likely to be married with 88.9% of them unmarried at childbirth.
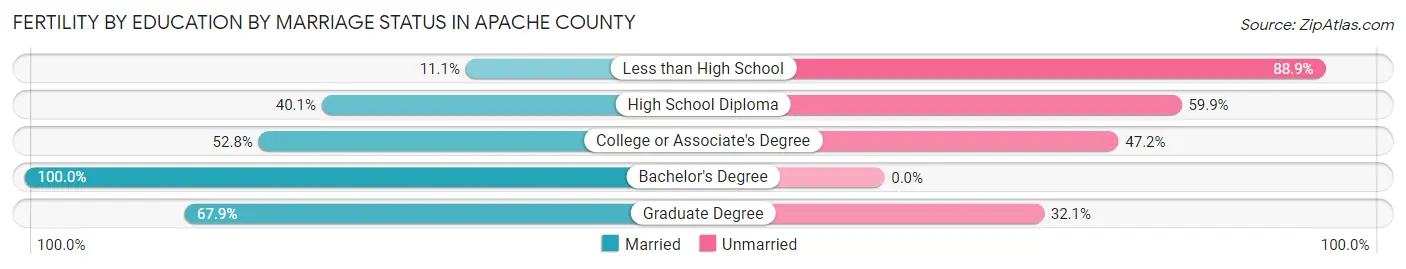
| Educational Attainment | Married | Unmarried |
| Less than High School | 3 (11.1%) | 24 (88.9%) |
| High School Diploma | 67 (40.1%) | 100 (59.9%) |
| College or Associate's Degree | 271 (52.8%) | 242 (47.2%) |
| Bachelor's Degree | 58 (100.0%) | 0 (0.0%) |
| Graduate Degree | 19 (67.9%) | 9 (32.1%) |
| Total | 418 (52.7%) | 375 (47.3%) |
Employment Characteristics in Apache County
Employment by Class of Employer in Apache County
Among the 18,073 employed individuals in Apache County, private company employees (7,893 | 43.7%), local government employees (3,247 | 18.0%), and federal government employees (2,729 | 15.1%) make up the most common classes of employment.
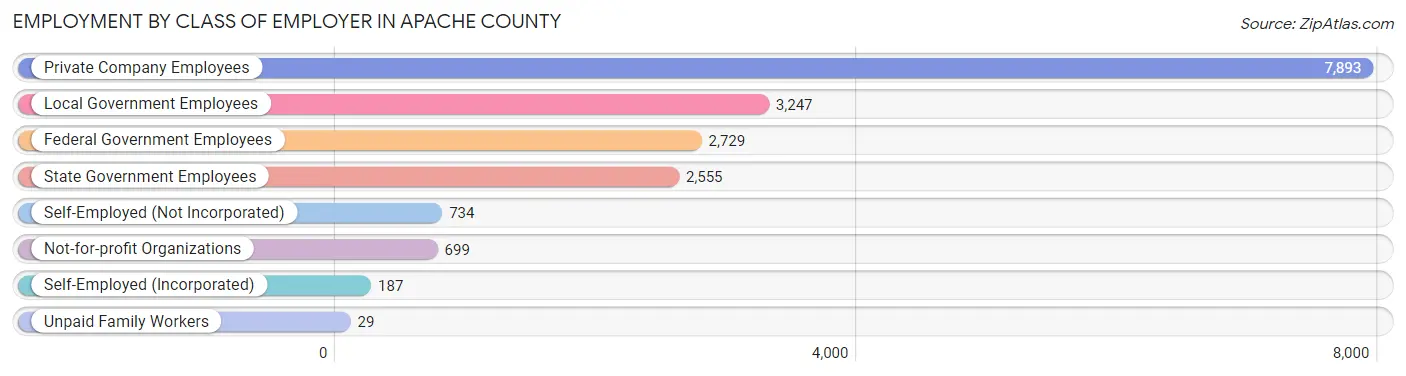
| Employer Class | # Employees | % Employees |
| Private Company Employees | 7,893 | 43.7% |
| Self-Employed (Incorporated) | 187 | 1.0% |
| Self-Employed (Not Incorporated) | 734 | 4.1% |
| Not-for-profit Organizations | 699 | 3.9% |
| Local Government Employees | 3,247 | 18.0% |
| State Government Employees | 2,555 | 14.1% |
| Federal Government Employees | 2,729 | 15.1% |
| Unpaid Family Workers | 29 | 0.2% |
| Total | 18,073 | 100.0% |
Employment Status by Age in Apache County
According to the labor force statistics for Apache County, out of the total population over 16 years of age (50,731), 39.7% or 20,140 individuals are in the labor force, with 9.5% or 1,913 of them unemployed. The age group with the highest labor force participation rate is 35 to 44 years, with 61.3% or 4,501 individuals in the labor force. Within the labor force, the 16 to 19 years age range has the highest percentage of unemployed individuals, with 24.6% or 128 of them being unemployed.
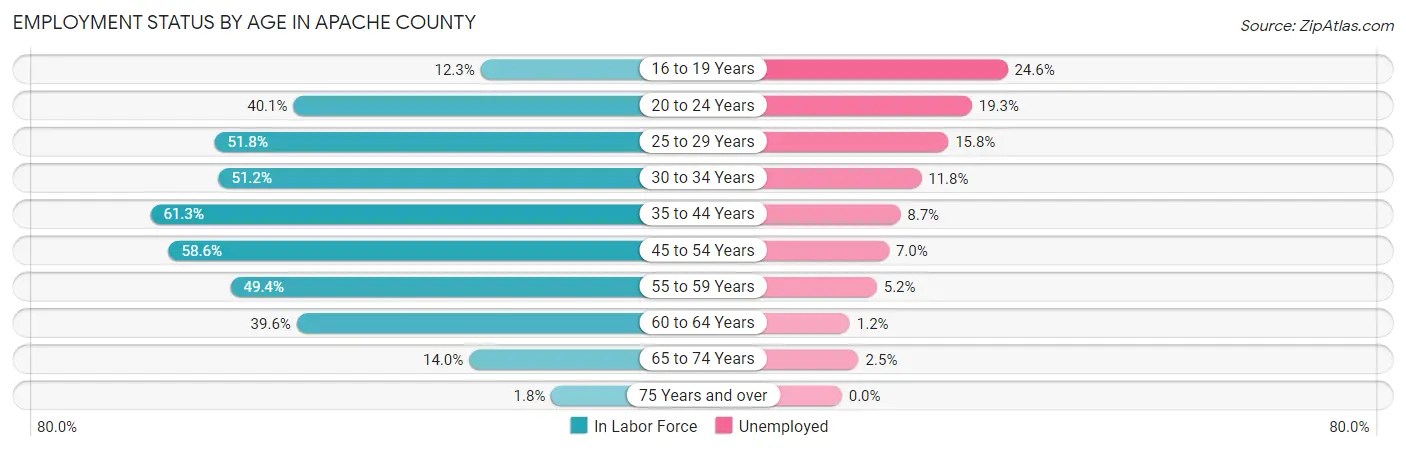
| Age Bracket | In Labor Force | Unemployed |
| 16 to 19 Years | 522 (12.3%) | 128 (24.6%) |
| 20 to 24 Years | 1,711 (40.1%) | 330 (19.3%) |
| 25 to 29 Years | 2,282 (51.8%) | 361 (15.8%) |
| 30 to 34 Years | 2,162 (51.2%) | 255 (11.8%) |
| 35 to 44 Years | 4,501 (61.3%) | 392 (8.7%) |
| 45 to 54 Years | 4,260 (58.6%) | 298 (7.0%) |
| 55 to 59 Years | 1,943 (49.4%) | 101 (5.2%) |
| 60 to 64 Years | 1,816 (39.6%) | 22 (1.2%) |
| 65 to 74 Years | 893 (14.0%) | 22 (2.5%) |
| 75 Years and over | 74 (1.8%) | 0 (0.0%) |
| Total | 20,140 (39.7%) | 1,913 (9.5%) |
Employment Status by Educational Attainment in Apache County
According to labor force statistics for Apache County, 53.4% of individuals (16,959) out of the total population between 25 and 64 years of age (31,759) are in the labor force, with 8.4% or 1,425 of them being unemployed. The group with the highest labor force participation rate are those with the educational attainment of bachelor's degree or higher, with 82.6% or 3,268 individuals in the labor force. Within the labor force, individuals with less than high school education have the highest percentage of unemployment, with 14.1% or 163 of them being unemployed.
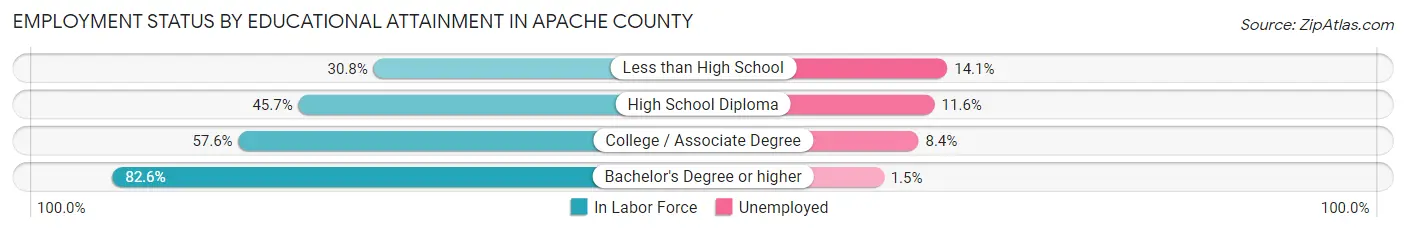
| Educational Attainment | In Labor Force | Unemployed |
| Less than High School | 1,153 (30.8%) | 528 (14.1%) |
| High School Diploma | 5,110 (45.7%) | 1,297 (11.6%) |
| College / Associate Degree | 7,417 (57.6%) | 1,082 (8.4%) |
| Bachelor's Degree or higher | 3,268 (82.6%) | 59 (1.5%) |
| Total | 16,959 (53.4%) | 2,668 (8.4%) |
Employment Occupations by Sex in Apache County
Management, Business, Science and Arts Occupations
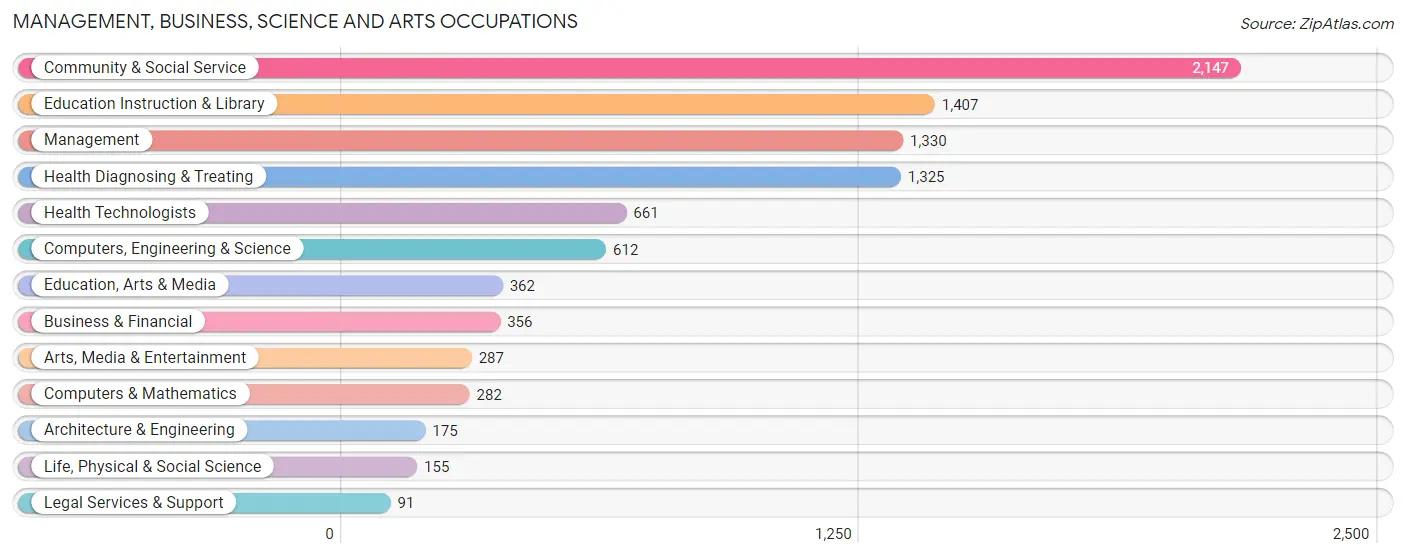
The most common Management, Business, Science and Arts occupations in Apache County are Community & Social Service (2,147 | 11.8%), Education Instruction & Library (1,407 | 7.7%), Management (1,330 | 7.3%), Health Diagnosing & Treating (1,325 | 7.3%), and Health Technologists (661 | 3.6%).
Management, Business, Science and Arts Occupations by Sex
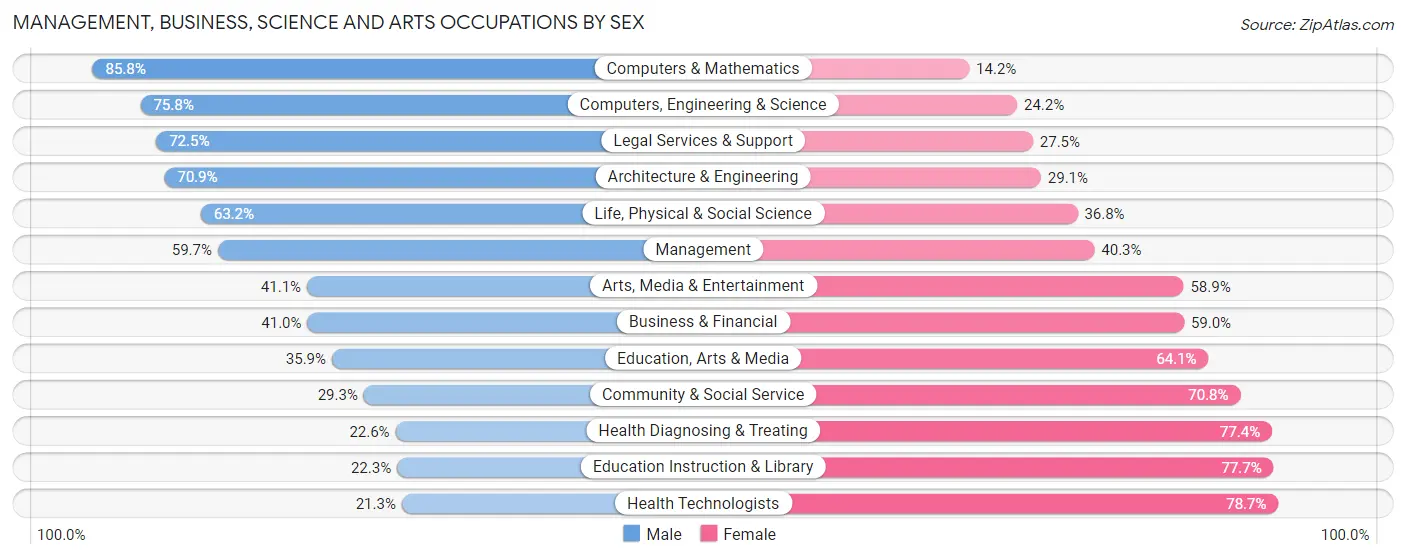
Within the Management, Business, Science and Arts occupations in Apache County, the most male-oriented occupations are Computers & Mathematics (85.8%), Computers, Engineering & Science (75.8%), and Legal Services & Support (72.5%), while the most female-oriented occupations are Health Technologists (78.7%), Education Instruction & Library (77.7%), and Health Diagnosing & Treating (77.4%).
| Occupation | Male | Female |
| Management | 794 (59.7%) | 536 (40.3%) |
| Business & Financial | 146 (41.0%) | 210 (59.0%) |
| Computers, Engineering & Science | 464 (75.8%) | 148 (24.2%) |
| Computers & Mathematics | 242 (85.8%) | 40 (14.2%) |
| Architecture & Engineering | 124 (70.9%) | 51 (29.1%) |
| Life, Physical & Social Science | 98 (63.2%) | 57 (36.8%) |
| Community & Social Service | 628 (29.2%) | 1,519 (70.8%) |
| Education, Arts & Media | 130 (35.9%) | 232 (64.1%) |
| Legal Services & Support | 66 (72.5%) | 25 (27.5%) |
| Education Instruction & Library | 314 (22.3%) | 1,093 (77.7%) |
| Arts, Media & Entertainment | 118 (41.1%) | 169 (58.9%) |
| Health Diagnosing & Treating | 300 (22.6%) | 1,025 (77.4%) |
| Health Technologists | 141 (21.3%) | 520 (78.7%) |
| Total (Category) | 2,332 (40.4%) | 3,438 (59.6%) |
| Total (Overall) | 8,990 (49.3%) | 9,252 (50.7%) |
Services Occupations
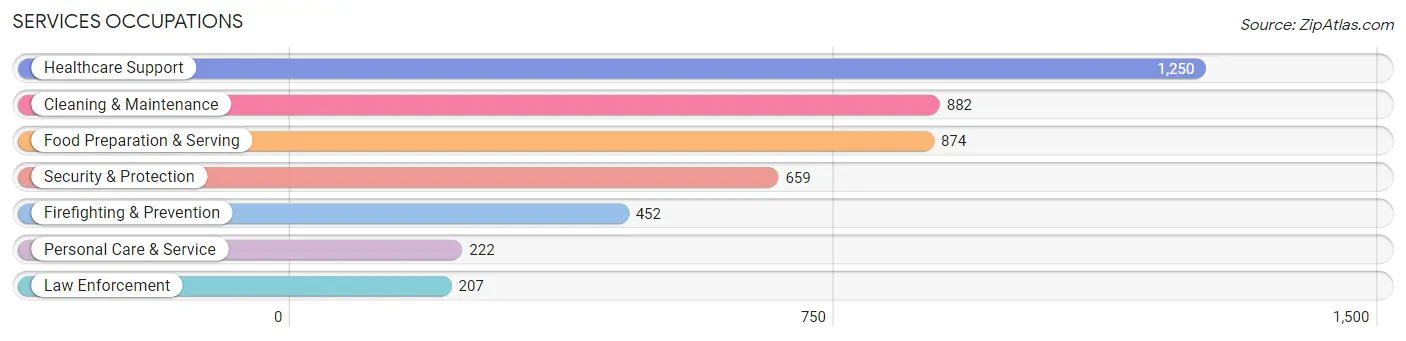
The most common Services occupations in Apache County are Healthcare Support (1,250 | 6.9%), Cleaning & Maintenance (882 | 4.8%), Food Preparation & Serving (874 | 4.8%), Security & Protection (659 | 3.6%), and Firefighting & Prevention (452 | 2.5%).
Services Occupations by Sex
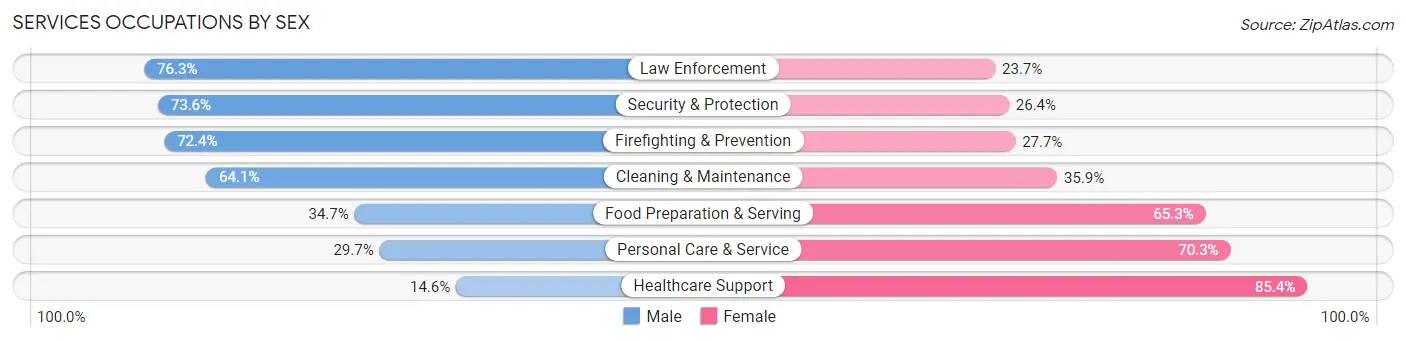
Within the Services occupations in Apache County, the most male-oriented occupations are Law Enforcement (76.3%), Security & Protection (73.6%), and Firefighting & Prevention (72.4%), while the most female-oriented occupations are Healthcare Support (85.4%), Personal Care & Service (70.3%), and Food Preparation & Serving (65.3%).
| Occupation | Male | Female |
| Healthcare Support | 182 (14.6%) | 1,068 (85.4%) |
| Security & Protection | 485 (73.6%) | 174 (26.4%) |
| Firefighting & Prevention | 327 (72.4%) | 125 (27.7%) |
| Law Enforcement | 158 (76.3%) | 49 (23.7%) |
| Food Preparation & Serving | 303 (34.7%) | 571 (65.3%) |
| Cleaning & Maintenance | 565 (64.1%) | 317 (35.9%) |
| Personal Care & Service | 66 (29.7%) | 156 (70.3%) |
| Total (Category) | 1,601 (41.2%) | 2,286 (58.8%) |
| Total (Overall) | 8,990 (49.3%) | 9,252 (50.7%) |
Sales and Office Occupations
The most common Sales and Office occupations in Apache County are Office & Administration (2,645 | 14.5%), and Sales & Related (1,225 | 6.7%).

Sales and Office Occupations by Sex
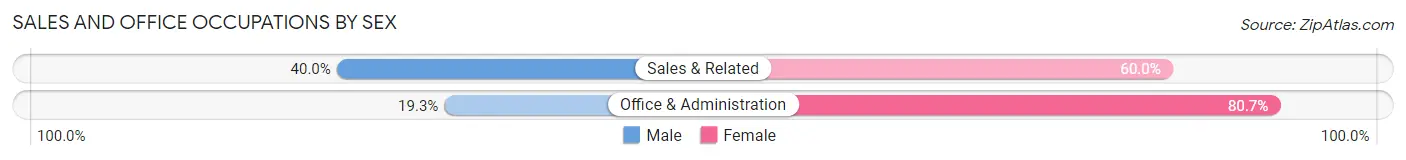
| Occupation | Male | Female |
| Sales & Related | 490 (40.0%) | 735 (60.0%) |
| Office & Administration | 511 (19.3%) | 2,134 (80.7%) |
| Total (Category) | 1,001 (25.9%) | 2,869 (74.1%) |
| Total (Overall) | 8,990 (49.3%) | 9,252 (50.7%) |
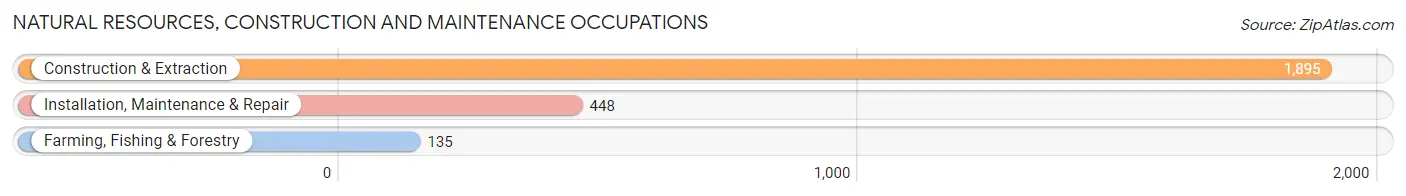
Natural Resources, Construction and Maintenance Occupations
The most common Natural Resources, Construction and Maintenance occupations in Apache County are Construction & Extraction (1,895 | 10.4%), Installation, Maintenance & Repair (448 | 2.5%), and Farming, Fishing & Forestry (135 | 0.7%).
Natural Resources, Construction and Maintenance Occupations by Sex
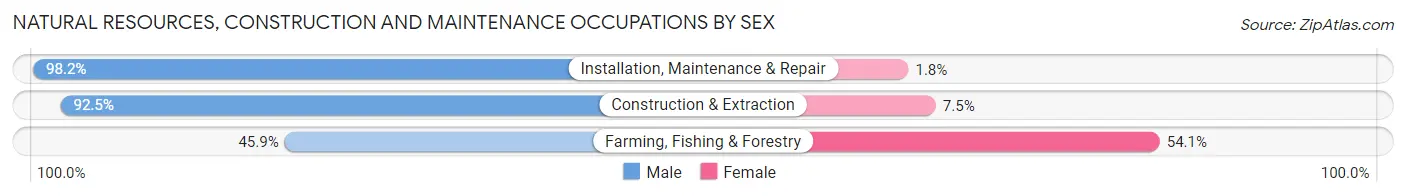
| Occupation | Male | Female |
| Farming, Fishing & Forestry | 62 (45.9%) | 73 (54.1%) |
| Construction & Extraction | 1,753 (92.5%) | 142 (7.5%) |
| Installation, Maintenance & Repair | 440 (98.2%) | 8 (1.8%) |
| Total (Category) | 2,255 (91.0%) | 223 (9.0%) |
| Total (Overall) | 8,990 (49.3%) | 9,252 (50.7%) |
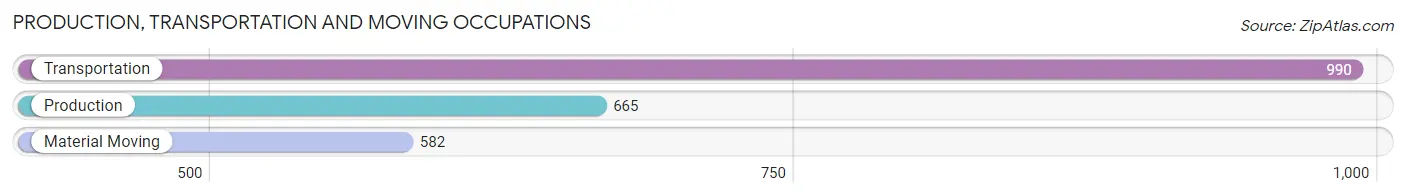
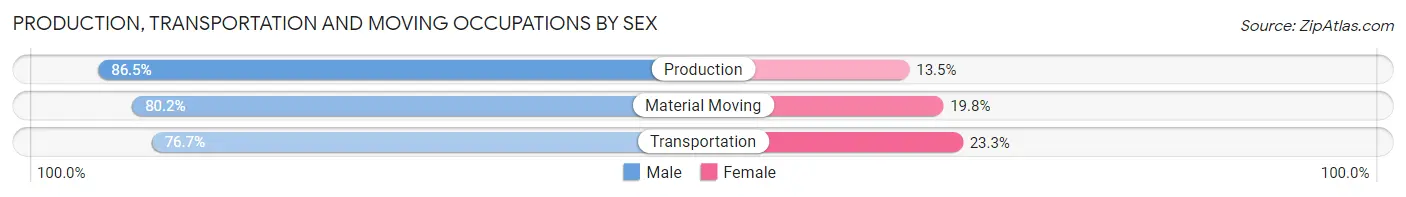
Production, Transportation and Moving Occupations
The most common Production, Transportation and Moving occupations in Apache County are Transportation (990 | 5.4%), Production (665 | 3.6%), and Material Moving (582 | 3.2%).
Production, Transportation and Moving Occupations by Sex
| Occupation | Male | Female |
| Production | 575 (86.5%) | 90 (13.5%) |
| Transportation | 759 (76.7%) | 231 (23.3%) |
| Material Moving | 467 (80.2%) | 115 (19.8%) |
| Total (Category) | 1,801 (80.5%) | 436 (19.5%) |
| Total (Overall) | 8,990 (49.3%) | 9,252 (50.7%) |
Employment Industries by Sex in Apache County
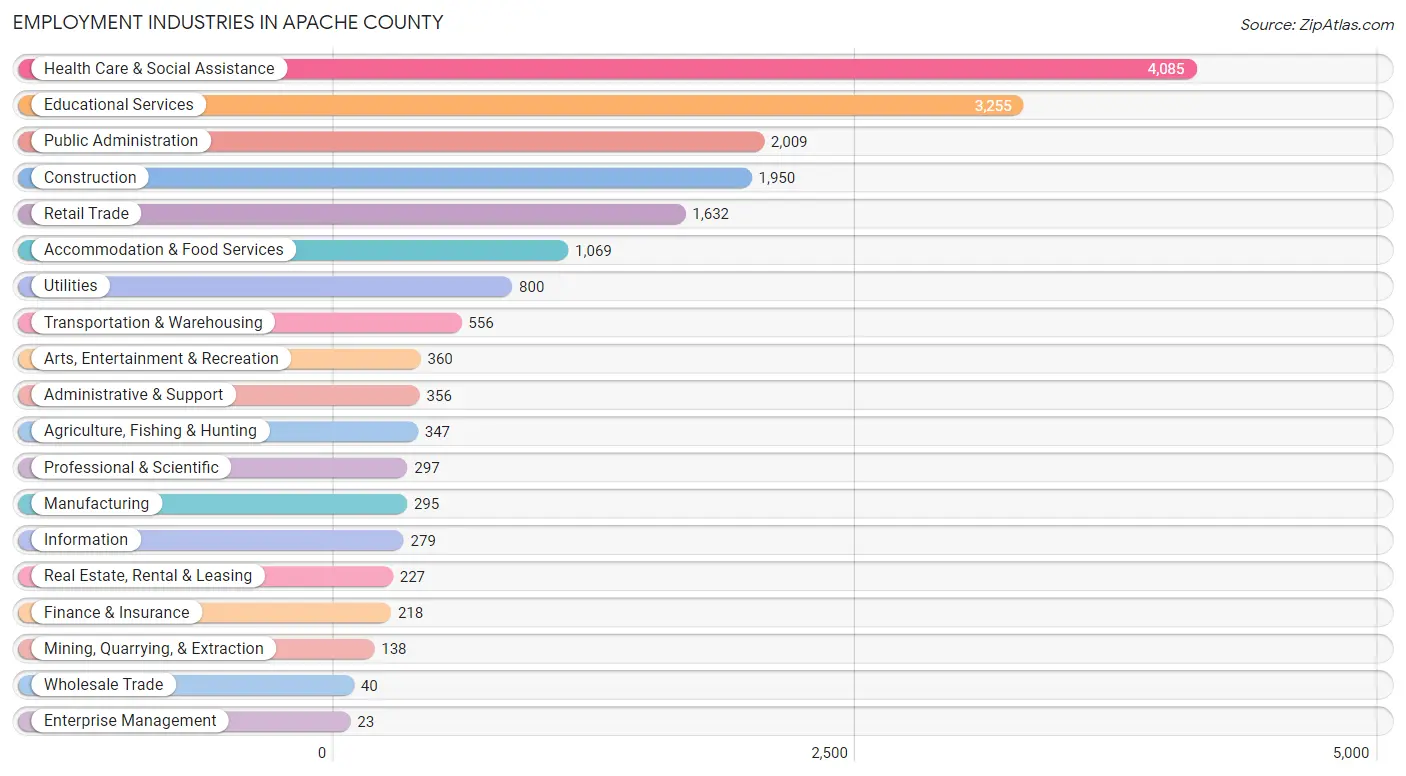
Employment Industries in Apache County
The major employment industries in Apache County include Health Care & Social Assistance (4,085 | 22.4%), Educational Services (3,255 | 17.8%), Public Administration (2,009 | 11.0%), Construction (1,950 | 10.7%), and Retail Trade (1,632 | 8.9%).
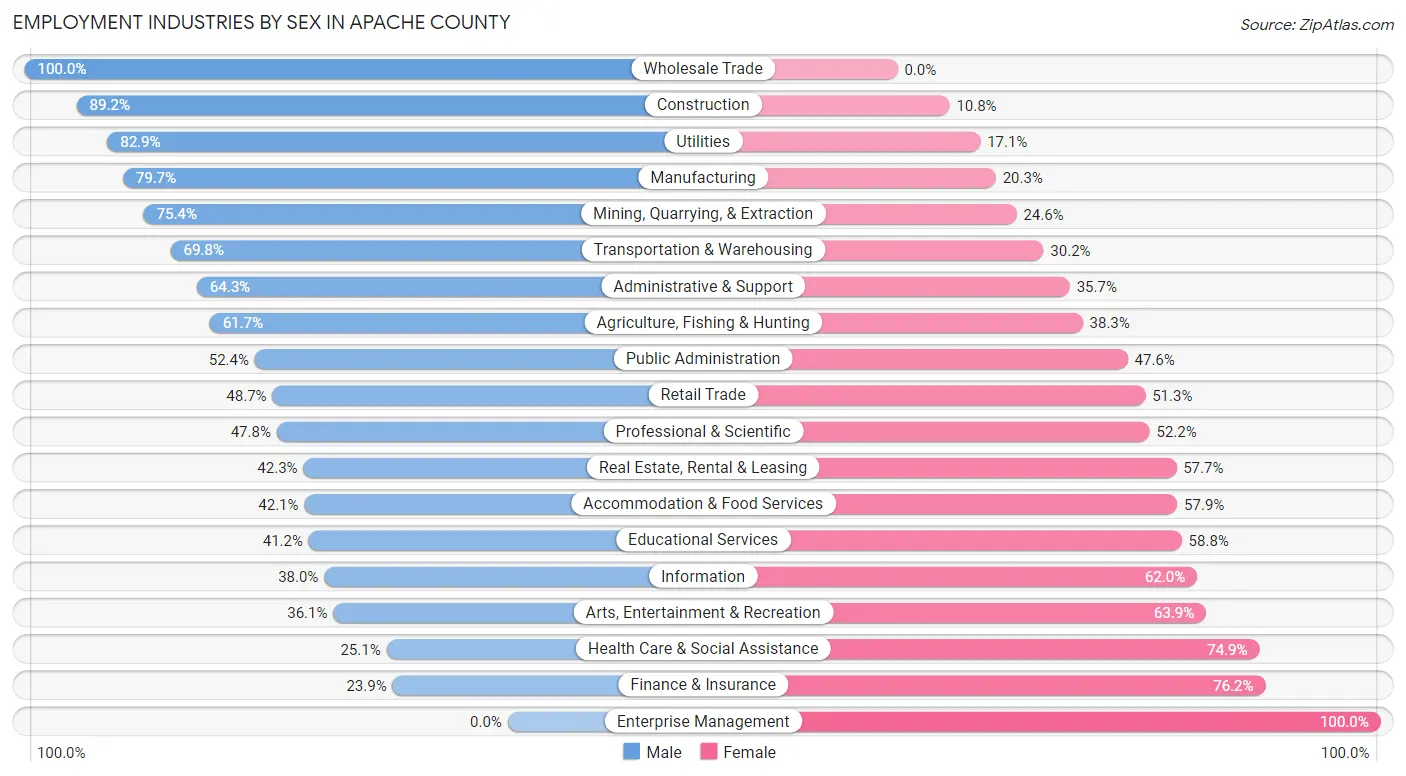
Employment Industries by Sex in Apache County
The Apache County industries that see more men than women are Wholesale Trade (100.0%), Construction (89.2%), and Utilities (82.9%), whereas the industries that tend to have a higher number of women are Enterprise Management (100.0%), Finance & Insurance (76.1%), and Health Care & Social Assistance (74.9%).
| Industry | Male | Female |
| Agriculture, Fishing & Hunting | 214 (61.7%) | 133 (38.3%) |
| Mining, Quarrying, & Extraction | 104 (75.4%) | 34 (24.6%) |
| Construction | 1,740 (89.2%) | 210 (10.8%) |
| Manufacturing | 235 (79.7%) | 60 (20.3%) |
| Wholesale Trade | 40 (100.0%) | 0 (0.0%) |
| Retail Trade | 795 (48.7%) | 837 (51.3%) |
| Transportation & Warehousing | 388 (69.8%) | 168 (30.2%) |
| Utilities | 663 (82.9%) | 137 (17.1%) |
| Information | 106 (38.0%) | 173 (62.0%) |
| Finance & Insurance | 52 (23.8%) | 166 (76.1%) |
| Real Estate, Rental & Leasing | 96 (42.3%) | 131 (57.7%) |
| Professional & Scientific | 142 (47.8%) | 155 (52.2%) |
| Enterprise Management | 0 (0.0%) | 23 (100.0%) |
| Administrative & Support | 229 (64.3%) | 127 (35.7%) |
| Educational Services | 1,340 (41.2%) | 1,915 (58.8%) |
| Health Care & Social Assistance | 1,025 (25.1%) | 3,060 (74.9%) |
| Arts, Entertainment & Recreation | 130 (36.1%) | 230 (63.9%) |
| Accommodation & Food Services | 450 (42.1%) | 619 (57.9%) |
| Public Administration | 1,052 (52.4%) | 957 (47.6%) |
| Total | 8,990 (49.3%) | 9,252 (50.7%) |
Education in Apache County
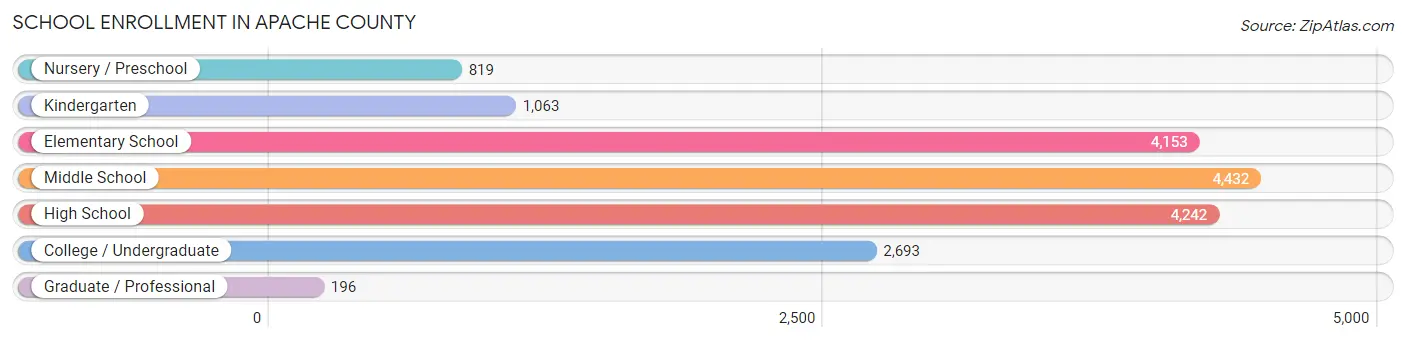
School Enrollment in Apache County
The most common levels of schooling among the 17,598 students in Apache County are middle school (4,432 | 25.2%), high school (4,242 | 24.1%), and elementary school (4,153 | 23.6%).
| School Level | # Students | % Students |
| Nursery / Preschool | 819 | 4.6% |
| Kindergarten | 1,063 | 6.0% |
| Elementary School | 4,153 | 23.6% |
| Middle School | 4,432 | 25.2% |
| High School | 4,242 | 24.1% |
| College / Undergraduate | 2,693 | 15.3% |
| Graduate / Professional | 196 | 1.1% |
| Total | 17,598 | 100.0% |
School Enrollment by Age by Funding Source in Apache County
Out of a total of 17,598 students who are enrolled in schools in Apache County, 968 (5.5%) attend a private institution, while the remaining 16,630 (94.5%) are enrolled in public schools. The age group of 35 years and over has the highest likelihood of being enrolled in private schools, with 181 (31.7% in the age bracket) enrolled. Conversely, the age group of 18 to 19 year olds has the lowest likelihood of being enrolled in a private school, with 1,185 (98.8% in the age bracket) attending a public institution.
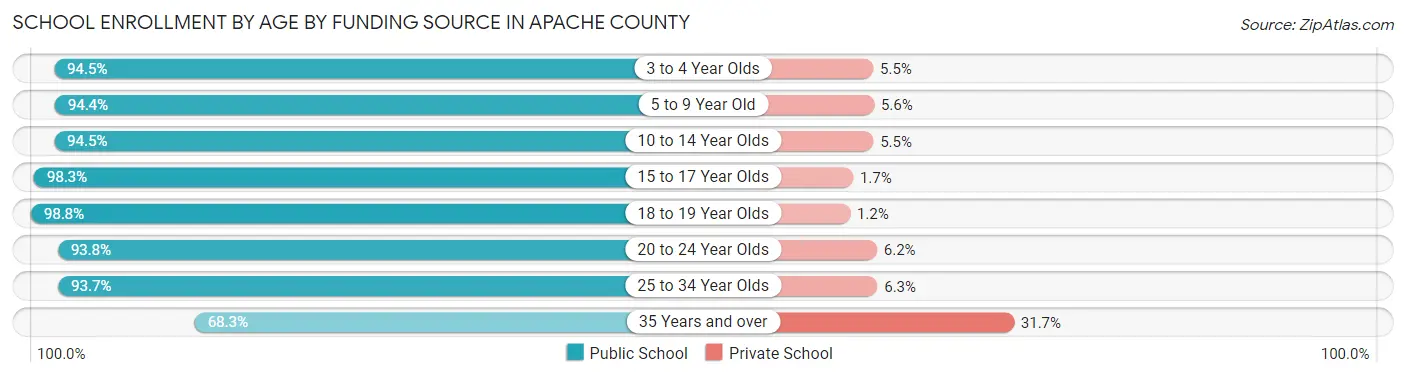
| Age Bracket | Public School | Private School |
| 3 to 4 Year Olds | 742 (94.5%) | 43 (5.5%) |
| 5 to 9 Year Old | 4,369 (94.4%) | 261 (5.6%) |
| 10 to 14 Year Olds | 5,091 (94.5%) | 297 (5.5%) |
| 15 to 17 Year Olds | 2,960 (98.3%) | 52 (1.7%) |
| 18 to 19 Year Olds | 1,185 (98.8%) | 14 (1.2%) |
| 20 to 24 Year Olds | 1,169 (93.8%) | 77 (6.2%) |
| 25 to 34 Year Olds | 719 (93.7%) | 48 (6.3%) |
| 35 Years and over | 390 (68.3%) | 181 (31.7%) |
| Total | 16,630 (94.5%) | 968 (5.5%) |
Educational Attainment by Field of Study in Apache County
Education (1,905 | 31.5%), business (864 | 14.3%), science & technology (725 | 12.0%), bio, nature & agricultural (397 | 6.6%), and arts & humanities (368 | 6.1%) are the most common fields of study among 6,050 individuals in Apache County who have obtained a bachelor's degree or higher.
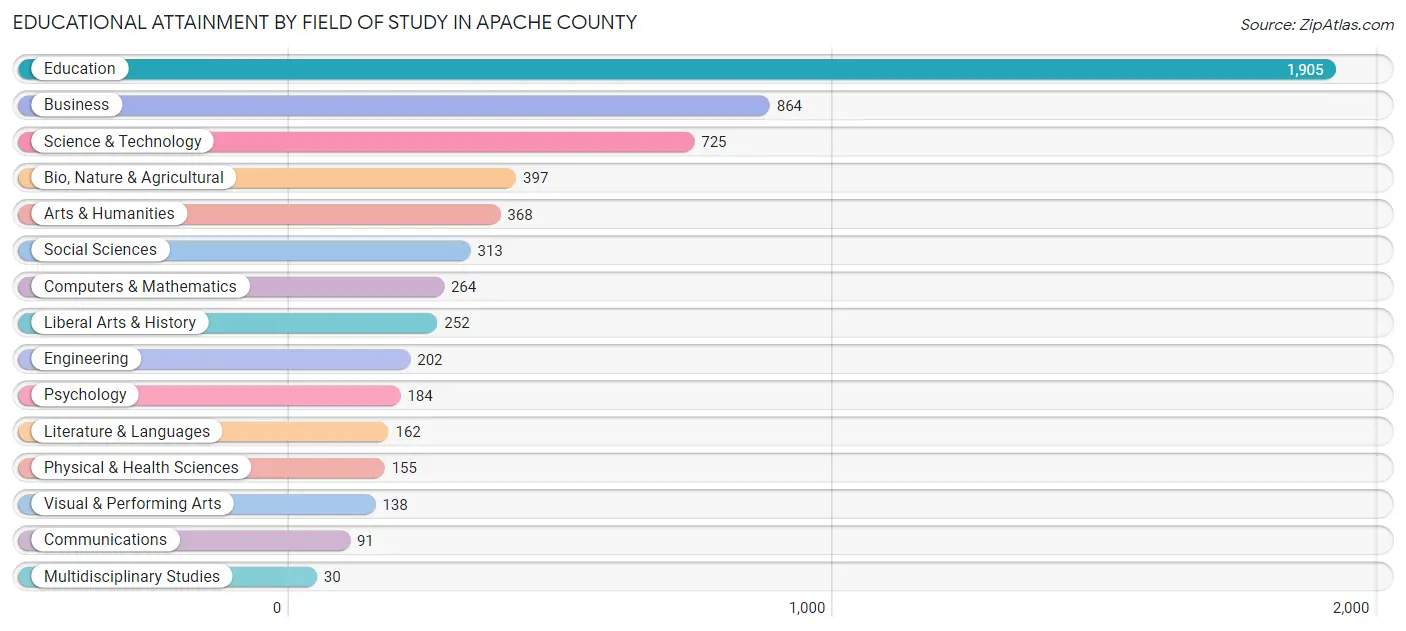
| Field of Study | # Graduates | % Graduates |
| Computers & Mathematics | 264 | 4.4% |
| Bio, Nature & Agricultural | 397 | 6.6% |
| Physical & Health Sciences | 155 | 2.6% |
| Psychology | 184 | 3.0% |
| Social Sciences | 313 | 5.2% |
| Engineering | 202 | 3.3% |
| Multidisciplinary Studies | 30 | 0.5% |
| Science & Technology | 725 | 12.0% |
| Business | 864 | 14.3% |
| Education | 1,905 | 31.5% |
| Literature & Languages | 162 | 2.7% |
| Liberal Arts & History | 252 | 4.2% |
| Visual & Performing Arts | 138 | 2.3% |
| Communications | 91 | 1.5% |
| Arts & Humanities | 368 | 6.1% |
| Total | 6,050 | 100.0% |
Transportation & Commute in Apache County
Vehicle Availability by Sex in Apache County
The most prevalent vehicle ownership categories in Apache County are males with 2 vehicles (2,796, accounting for 32.3%) and females with 2 vehicles (2,773, making up 30.7%).
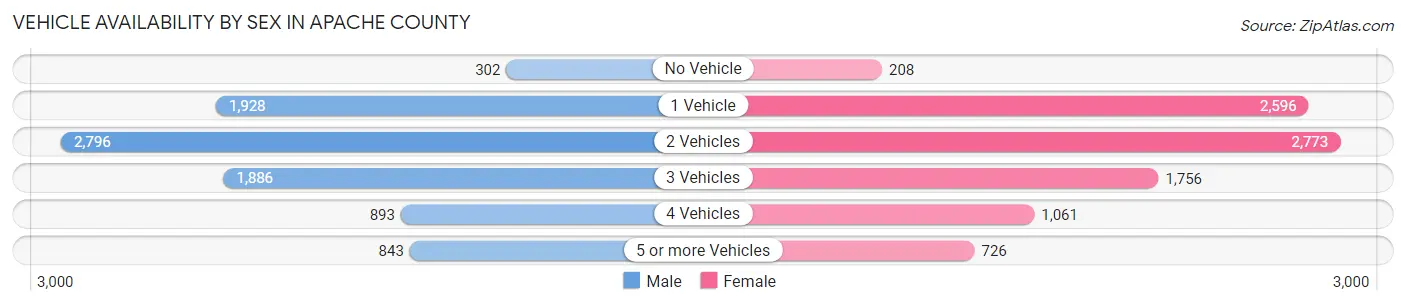
| Vehicles Available | Male | Female |
| No Vehicle | 302 (3.5%) | 208 (2.3%) |
| 1 Vehicle | 1,928 (22.3%) | 2,596 (28.5%) |
| 2 Vehicles | 2,796 (32.3%) | 2,773 (30.4%) |
| 3 Vehicles | 1,886 (21.8%) | 1,756 (19.3%) |
| 4 Vehicles | 893 (10.3%) | 1,061 (11.6%) |
| 5 or more Vehicles | 843 (9.8%) | 726 (8.0%) |
| Total | 8,648 (100.0%) | 9,120 (100.0%) |
Commute Time in Apache County
The most frequently occuring commute durations in Apache County are 30 to 34 minutes (3,148 commuters, 19.2%), 5 to 9 minutes (2,797 commuters, 17.1%), and 15 to 19 minutes (2,423 commuters, 14.8%).
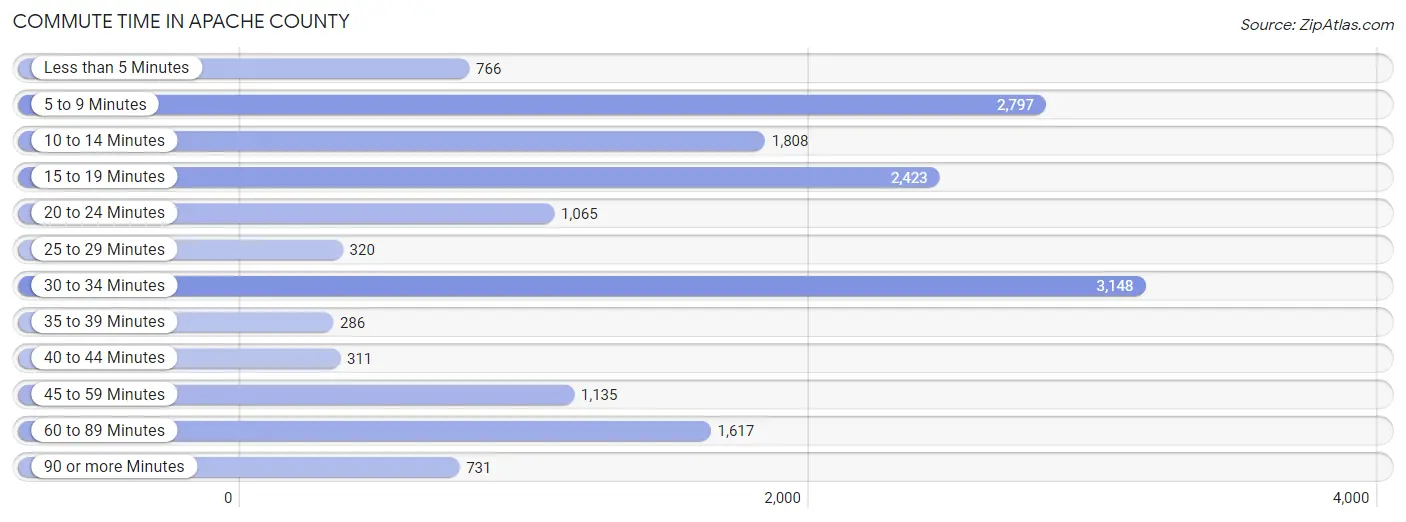
| Commute Time | # Commuters | % Commuters |
| Less than 5 Minutes | 766 | 4.7% |
| 5 to 9 Minutes | 2,797 | 17.1% |
| 10 to 14 Minutes | 1,808 | 11.0% |
| 15 to 19 Minutes | 2,423 | 14.8% |
| 20 to 24 Minutes | 1,065 | 6.5% |
| 25 to 29 Minutes | 320 | 1.9% |
| 30 to 34 Minutes | 3,148 | 19.2% |
| 35 to 39 Minutes | 286 | 1.7% |
| 40 to 44 Minutes | 311 | 1.9% |
| 45 to 59 Minutes | 1,135 | 6.9% |
| 60 to 89 Minutes | 1,617 | 9.9% |
| 90 or more Minutes | 731 | 4.5% |
Commute Time by Sex in Apache County
The most common commute times in Apache County are 30 to 34 minutes (1,720 commuters, 21.3%) for males and 5 to 9 minutes (1,539 commuters, 18.5%) for females.
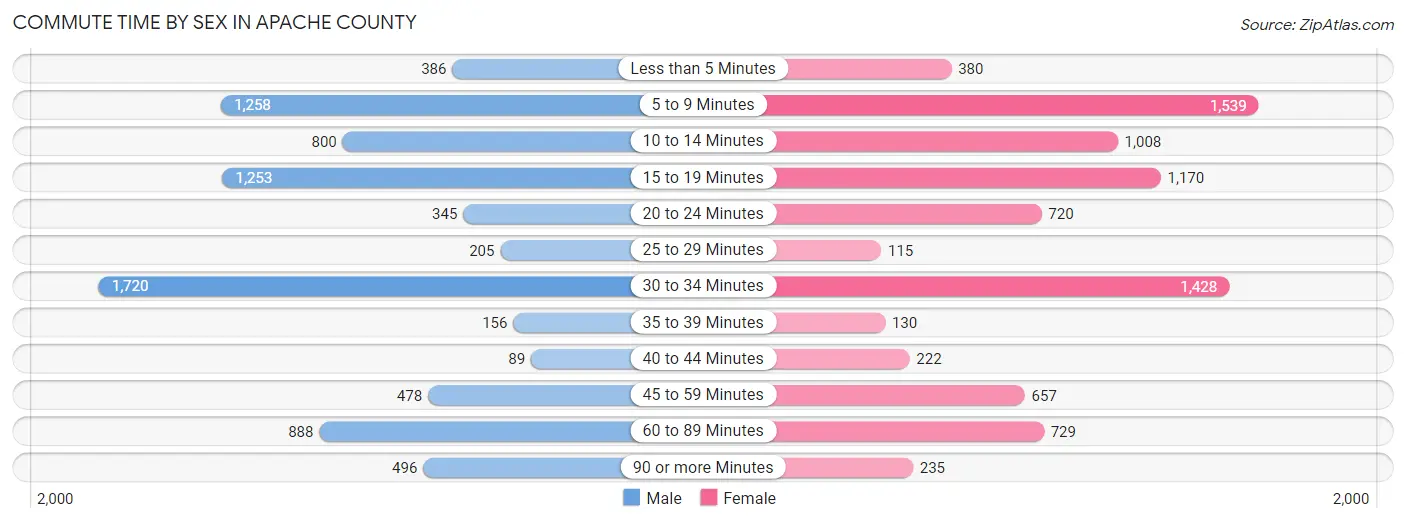
| Commute Time | Male | Female |
| Less than 5 Minutes | 386 (4.8%) | 380 (4.6%) |
| 5 to 9 Minutes | 1,258 (15.6%) | 1,539 (18.5%) |
| 10 to 14 Minutes | 800 (9.9%) | 1,008 (12.1%) |
| 15 to 19 Minutes | 1,253 (15.5%) | 1,170 (14.0%) |
| 20 to 24 Minutes | 345 (4.3%) | 720 (8.6%) |
| 25 to 29 Minutes | 205 (2.5%) | 115 (1.4%) |
| 30 to 34 Minutes | 1,720 (21.3%) | 1,428 (17.1%) |
| 35 to 39 Minutes | 156 (1.9%) | 130 (1.6%) |
| 40 to 44 Minutes | 89 (1.1%) | 222 (2.7%) |
| 45 to 59 Minutes | 478 (5.9%) | 657 (7.9%) |
| 60 to 89 Minutes | 888 (11.0%) | 729 (8.7%) |
| 90 or more Minutes | 496 (6.1%) | 235 (2.8%) |
Time of Departure to Work by Sex in Apache County
The most frequent times of departure to work in Apache County are 7:30 AM to 7:59 AM (2,323, 28.8%) for males and 7:30 AM to 7:59 AM (2,587, 31.0%) for females.
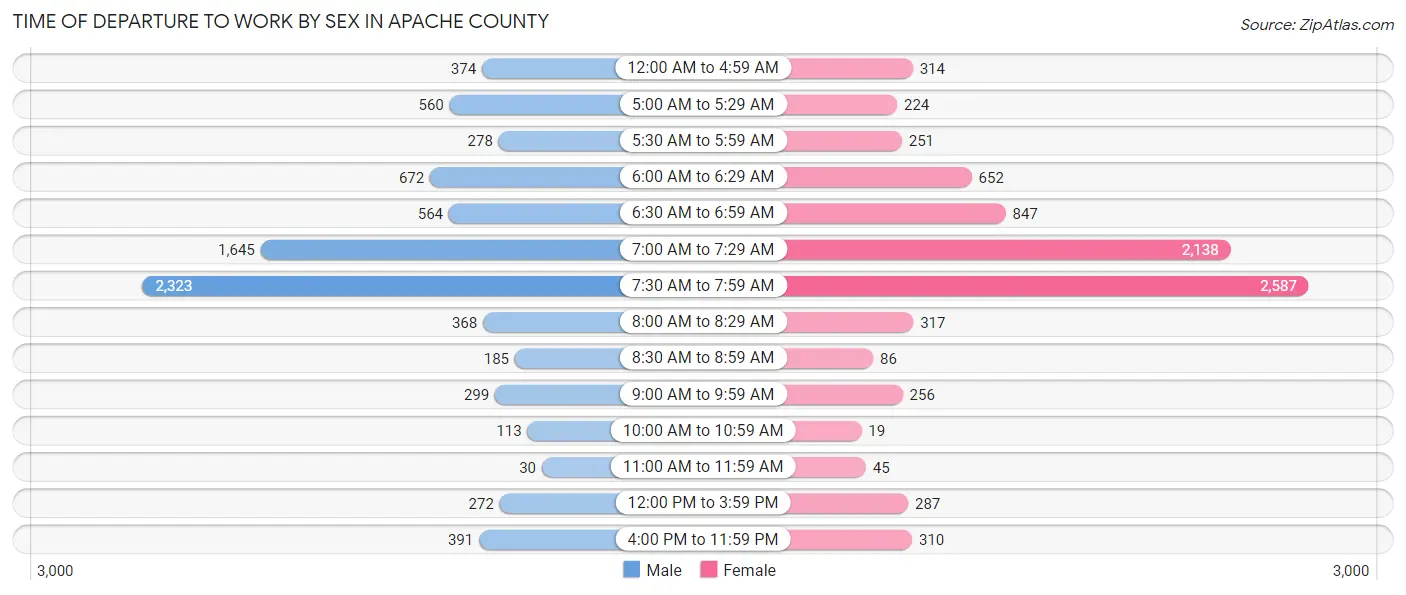
| Time of Departure | Male | Female |
| 12:00 AM to 4:59 AM | 374 (4.6%) | 314 (3.8%) |
| 5:00 AM to 5:29 AM | 560 (6.9%) | 224 (2.7%) |
| 5:30 AM to 5:59 AM | 278 (3.4%) | 251 (3.0%) |
| 6:00 AM to 6:29 AM | 672 (8.3%) | 652 (7.8%) |
| 6:30 AM to 6:59 AM | 564 (7.0%) | 847 (10.2%) |
| 7:00 AM to 7:29 AM | 1,645 (20.4%) | 2,138 (25.7%) |
| 7:30 AM to 7:59 AM | 2,323 (28.8%) | 2,587 (31.0%) |
| 8:00 AM to 8:29 AM | 368 (4.6%) | 317 (3.8%) |
| 8:30 AM to 8:59 AM | 185 (2.3%) | 86 (1.0%) |
| 9:00 AM to 9:59 AM | 299 (3.7%) | 256 (3.1%) |
| 10:00 AM to 10:59 AM | 113 (1.4%) | 19 (0.2%) |
| 11:00 AM to 11:59 AM | 30 (0.4%) | 45 (0.5%) |
| 12:00 PM to 3:59 PM | 272 (3.4%) | 287 (3.4%) |
| 4:00 PM to 11:59 PM | 391 (4.8%) | 310 (3.7%) |
| Total | 8,074 (100.0%) | 8,333 (100.0%) |
Housing Occupancy in Apache County
Occupancy by Ownership in Apache County
Of the total 19,786 dwellings in Apache County, owner-occupied units account for 15,838 (80.0%), while renter-occupied units make up 3,948 (20.0%).
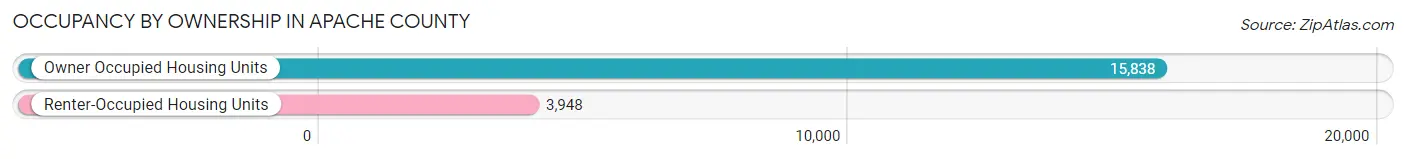
| Occupancy | # Housing Units | % Housing Units |
| Owner Occupied Housing Units | 15,838 | 80.0% |
| Renter-Occupied Housing Units | 3,948 | 20.0% |
| Total Occupied Housing Units | 19,786 | 100.0% |
Occupancy by Household Size in Apache County
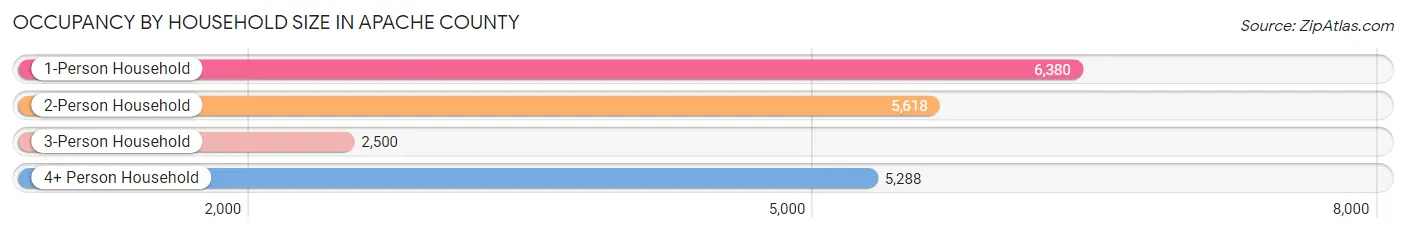
| Household Size | # Housing Units | % Housing Units |
| 1-Person Household | 6,380 | 32.3% |
| 2-Person Household | 5,618 | 28.4% |
| 3-Person Household | 2,500 | 12.6% |
| 4+ Person Household | 5,288 | 26.7% |
| Total Housing Units | 19,786 | 100.0% |
Occupancy by Ownership by Household Size in Apache County
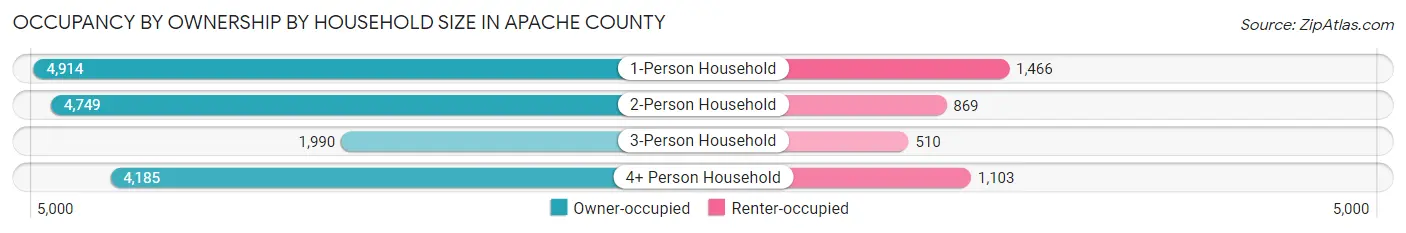
| Household Size | Owner-occupied | Renter-occupied |
| 1-Person Household | 4,914 (77.0%) | 1,466 (23.0%) |
| 2-Person Household | 4,749 (84.5%) | 869 (15.5%) |
| 3-Person Household | 1,990 (79.6%) | 510 (20.4%) |
| 4+ Person Household | 4,185 (79.1%) | 1,103 (20.9%) |
| Total Housing Units | 15,838 (80.0%) | 3,948 (20.0%) |
Occupancy by Educational Attainment in Apache County
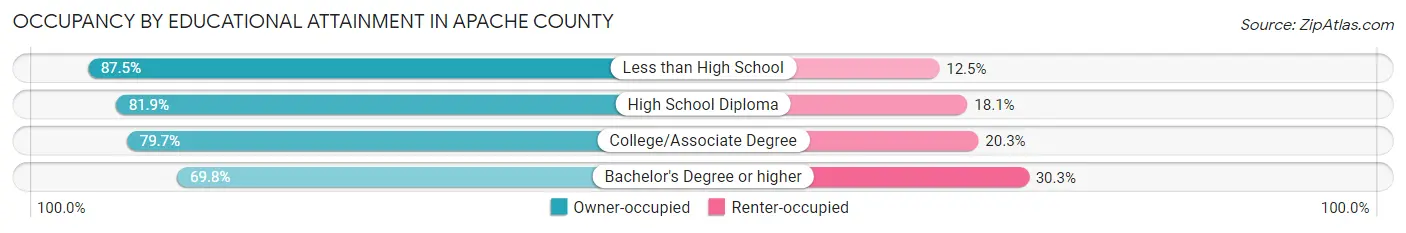
| Household Size | Owner-occupied | Renter-occupied |
| Less than High School | 3,213 (87.5%) | 460 (12.5%) |
| High School Diploma | 4,203 (81.9%) | 928 (18.1%) |
| College/Associate Degree | 6,088 (79.7%) | 1,548 (20.3%) |
| Bachelor's Degree or higher | 2,334 (69.8%) | 1,012 (30.2%) |
Occupancy by Age of Householder in Apache County
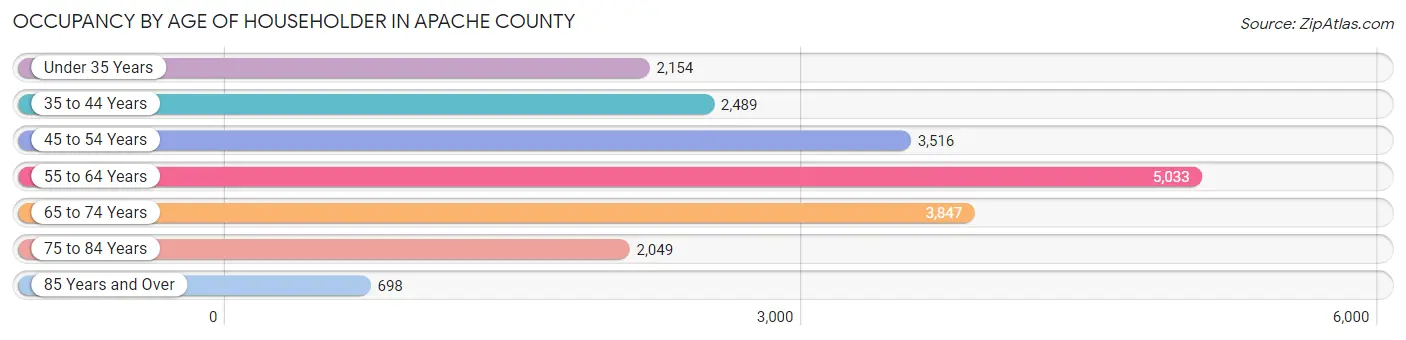
| Age Bracket | # Households | % Households |
| Under 35 Years | 2,154 | 10.9% |
| 35 to 44 Years | 2,489 | 12.6% |
| 45 to 54 Years | 3,516 | 17.8% |
| 55 to 64 Years | 5,033 | 25.4% |
| 65 to 74 Years | 3,847 | 19.4% |
| 75 to 84 Years | 2,049 | 10.4% |
| 85 Years and Over | 698 | 3.5% |
| Total | 19,786 | 100.0% |
Housing Finances in Apache County
Median Income by Occupancy in Apache County
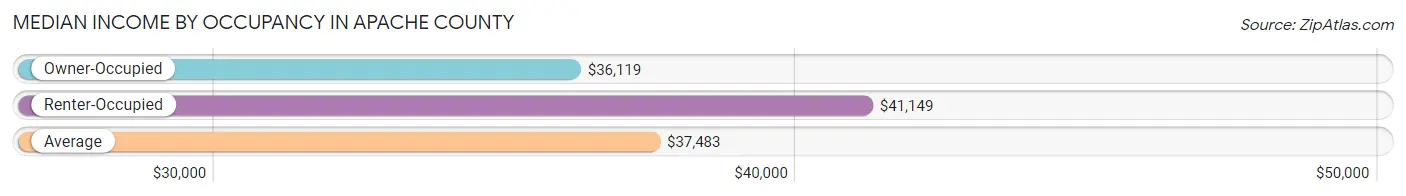
| Occupancy Type | # Households | Median Income |
| Owner-Occupied | 15,838 (80.0%) | $36,119 |
| Renter-Occupied | 3,948 (20.0%) | $41,149 |
| Average | 19,786 (100.0%) | $37,483 |
Occupancy by Householder Income Bracket in Apache County
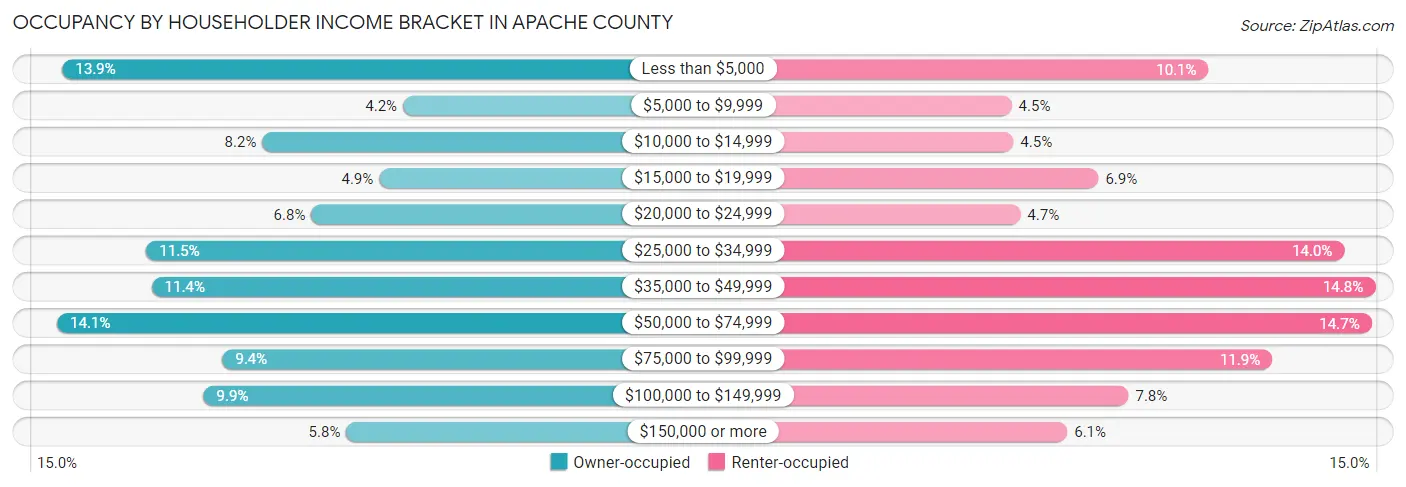
| Income Bracket | Owner-occupied | Renter-occupied |
| Less than $5,000 | 2,204 (13.9%) | 398 (10.1%) |
| $5,000 to $9,999 | 663 (4.2%) | 176 (4.5%) |
| $10,000 to $14,999 | 1,300 (8.2%) | 178 (4.5%) |
| $15,000 to $19,999 | 772 (4.9%) | 274 (6.9%) |
| $20,000 to $24,999 | 1,079 (6.8%) | 186 (4.7%) |
| $25,000 to $34,999 | 1,824 (11.5%) | 551 (14.0%) |
| $35,000 to $49,999 | 1,800 (11.4%) | 586 (14.8%) |
| $50,000 to $74,999 | 2,228 (14.1%) | 582 (14.7%) |
| $75,000 to $99,999 | 1,481 (9.3%) | 470 (11.9%) |
| $100,000 to $149,999 | 1,567 (9.9%) | 308 (7.8%) |
| $150,000 or more | 920 (5.8%) | 239 (6.0%) |
| Total | 15,838 (100.0%) | 3,948 (100.0%) |
Monthly Housing Cost Tiers in Apache County
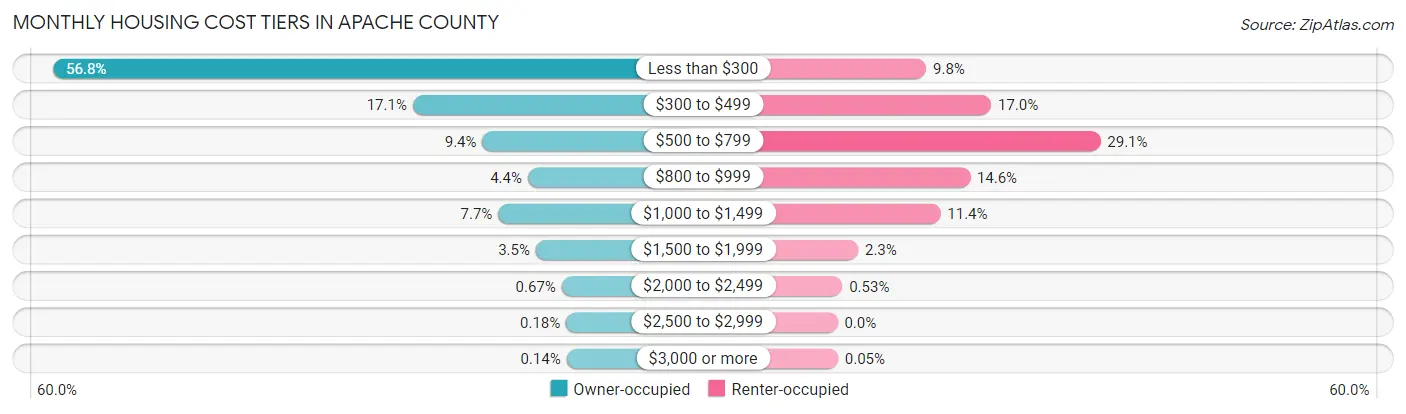
| Monthly Cost | Owner-occupied | Renter-occupied |
| Less than $300 | 9,002 (56.8%) | 387 (9.8%) |
| $300 to $499 | 2,712 (17.1%) | 670 (17.0%) |
| $500 to $799 | 1,494 (9.4%) | 1,147 (29.0%) |
| $800 to $999 | 698 (4.4%) | 578 (14.6%) |
| $1,000 to $1,499 | 1,216 (7.7%) | 449 (11.4%) |
| $1,500 to $1,999 | 559 (3.5%) | 90 (2.3%) |
| $2,000 to $2,499 | 106 (0.7%) | 21 (0.5%) |
| $2,500 to $2,999 | 29 (0.2%) | 0 (0.0%) |
| $3,000 or more | 22 (0.1%) | 2 (0.1%) |
| Total | 15,838 (100.0%) | 3,948 (100.0%) |
Physical Housing Characteristics in Apache County
Housing Structures in Apache County
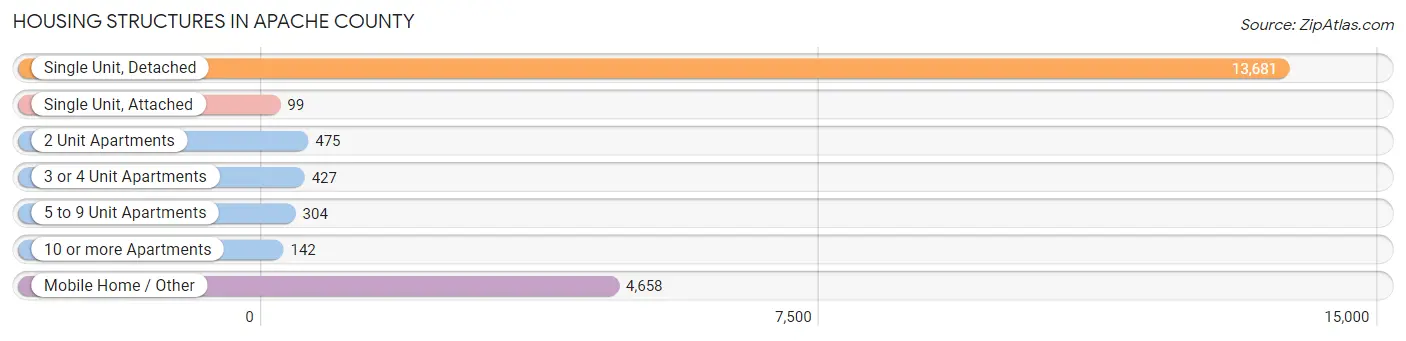
| Structure Type | # Housing Units | % Housing Units |
| Single Unit, Detached | 13,681 | 69.1% |
| Single Unit, Attached | 99 | 0.5% |
| 2 Unit Apartments | 475 | 2.4% |
| 3 or 4 Unit Apartments | 427 | 2.2% |
| 5 to 9 Unit Apartments | 304 | 1.5% |
| 10 or more Apartments | 142 | 0.7% |
| Mobile Home / Other | 4,658 | 23.5% |
| Total | 19,786 | 100.0% |
Housing Structures by Occupancy in Apache County
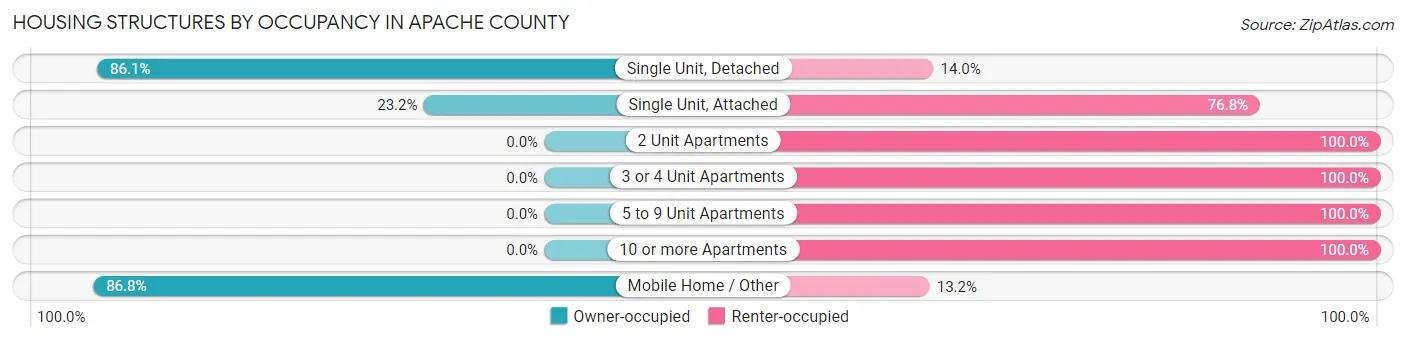
| Structure Type | Owner-occupied | Renter-occupied |
| Single Unit, Detached | 11,773 (86.1%) | 1,908 (14.0%) |
| Single Unit, Attached | 23 (23.2%) | 76 (76.8%) |
| 2 Unit Apartments | 0 (0.0%) | 475 (100.0%) |
| 3 or 4 Unit Apartments | 0 (0.0%) | 427 (100.0%) |
| 5 to 9 Unit Apartments | 0 (0.0%) | 304 (100.0%) |
| 10 or more Apartments | 0 (0.0%) | 142 (100.0%) |
| Mobile Home / Other | 4,042 (86.8%) | 616 (13.2%) |
| Total | 15,838 (80.0%) | 3,948 (20.0%) |
Housing Structures by Number of Rooms in Apache County
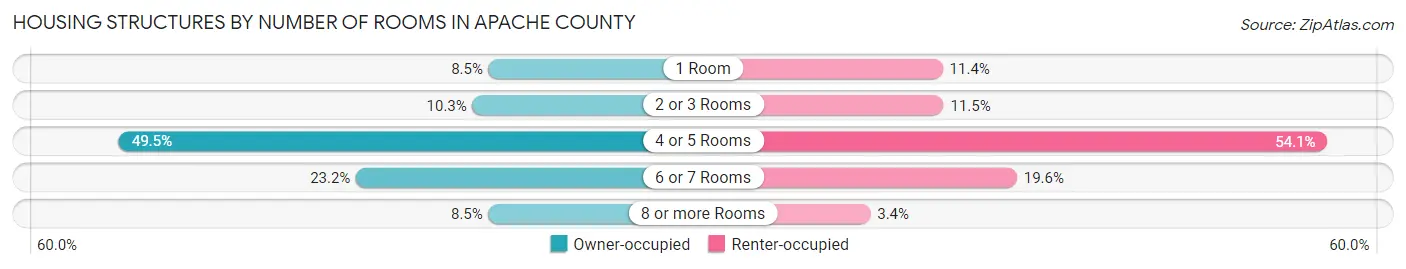
| Number of Rooms | Owner-occupied | Renter-occupied |
| 1 Room | 1,343 (8.5%) | 450 (11.4%) |
| 2 or 3 Rooms | 1,628 (10.3%) | 454 (11.5%) |
| 4 or 5 Rooms | 7,846 (49.5%) | 2,136 (54.1%) |
| 6 or 7 Rooms | 3,674 (23.2%) | 775 (19.6%) |
| 8 or more Rooms | 1,347 (8.5%) | 133 (3.4%) |
| Total | 15,838 (100.0%) | 3,948 (100.0%) |
Housing Structure by Heating Type in Apache County
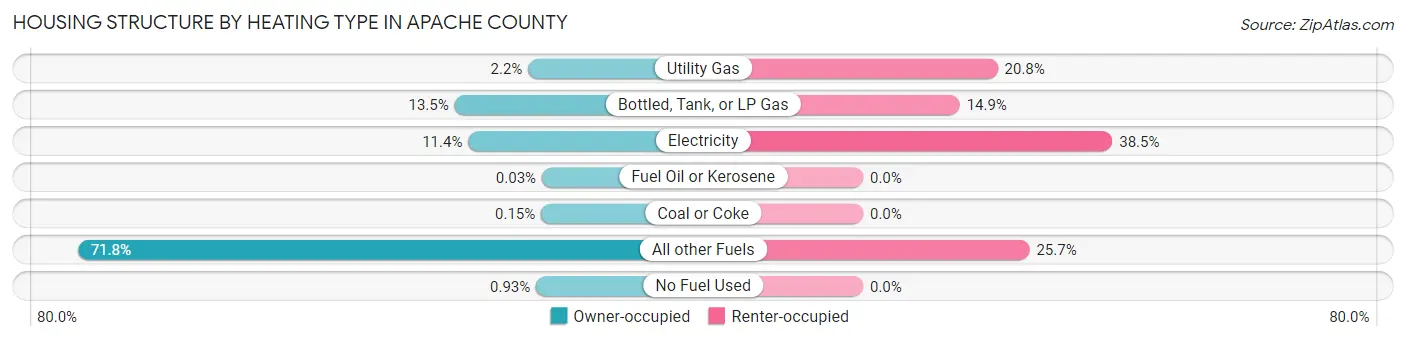
| Heating Type | Owner-occupied | Renter-occupied |
| Utility Gas | 341 (2.1%) | 821 (20.8%) |
| Bottled, Tank, or LP Gas | 2,144 (13.5%) | 590 (14.9%) |
| Electricity | 1,809 (11.4%) | 1,521 (38.5%) |
| Fuel Oil or Kerosene | 5 (0.0%) | 0 (0.0%) |
| Coal or Coke | 23 (0.2%) | 0 (0.0%) |
| All other Fuels | 11,368 (71.8%) | 1,016 (25.7%) |
| No Fuel Used | 148 (0.9%) | 0 (0.0%) |
| Total | 15,838 (100.0%) | 3,948 (100.0%) |
Household Vehicle Usage in Apache County
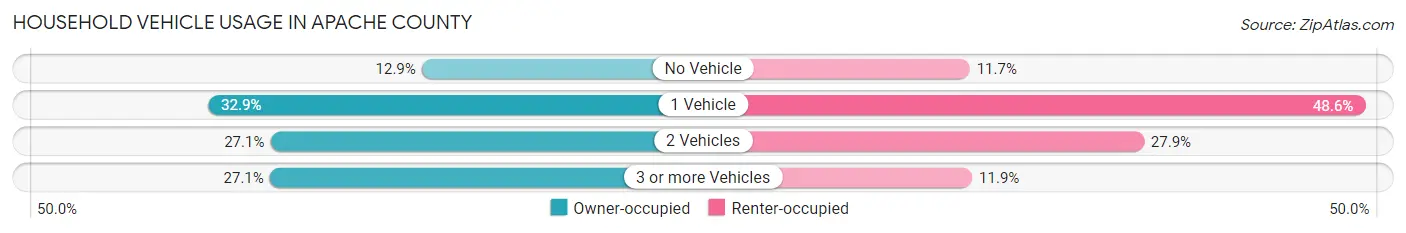
| Vehicles per Household | Owner-occupied | Renter-occupied |
| No Vehicle | 2,049 (12.9%) | 460 (11.7%) |
| 1 Vehicle | 5,205 (32.9%) | 1,917 (48.6%) |
| 2 Vehicles | 4,287 (27.1%) | 1,102 (27.9%) |
| 3 or more Vehicles | 4,297 (27.1%) | 469 (11.9%) |
| Total | 15,838 (100.0%) | 3,948 (100.0%) |
Real Estate & Mortgages in Apache County
Real Estate and Mortgage Overview in Apache County
| Characteristic | Without Mortgage | With Mortgage |
| Housing Units | 13,107 | 2,731 |
| Median Property Value | $51,200 | $193,400 |
| Median Household Income | $29,598 | $356 |
| Monthly Housing Costs | $225 | $18 |
| Real Estate Taxes | $461 | $578 |
Property Value by Mortgage Status in Apache County
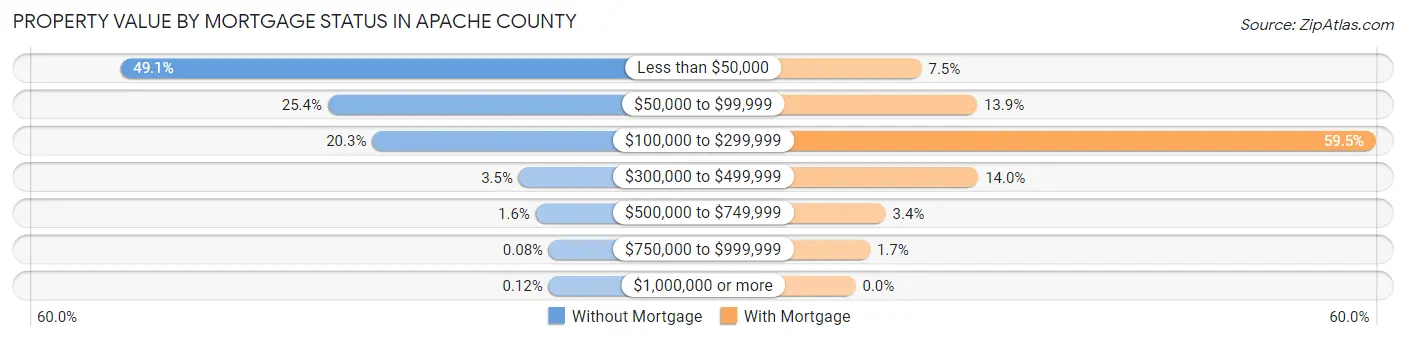
| Property Value | Without Mortgage | With Mortgage |
| Less than $50,000 | 6,430 (49.1%) | 206 (7.5%) |
| $50,000 to $99,999 | 3,322 (25.4%) | 379 (13.9%) |
| $100,000 to $299,999 | 2,657 (20.3%) | 1,624 (59.5%) |
| $300,000 to $499,999 | 462 (3.5%) | 383 (14.0%) |
| $500,000 to $749,999 | 209 (1.6%) | 94 (3.4%) |
| $750,000 to $999,999 | 11 (0.1%) | 45 (1.7%) |
| $1,000,000 or more | 16 (0.1%) | 0 (0.0%) |
| Total | 13,107 (100.0%) | 2,731 (100.0%) |
Household Income by Mortgage Status in Apache County
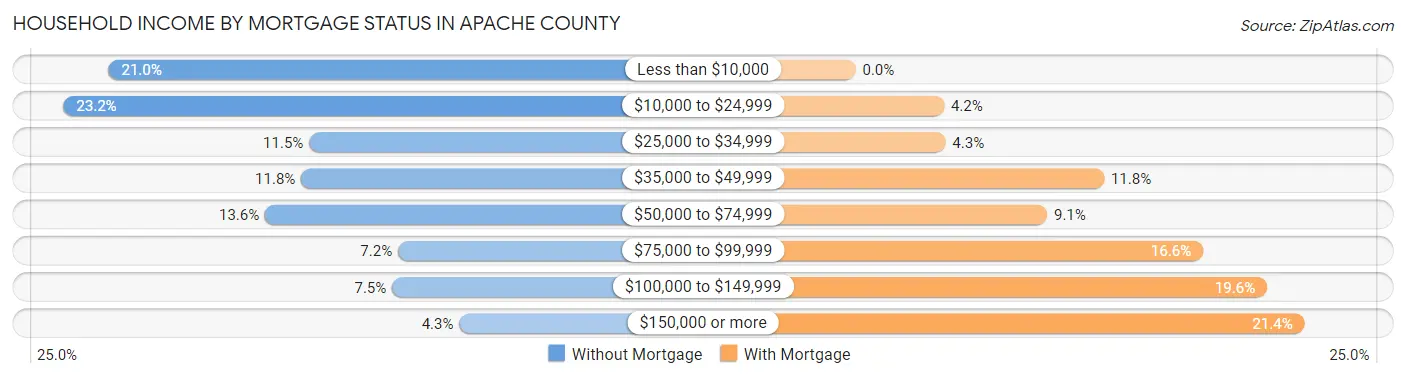
| Household Income | Without Mortgage | With Mortgage |
| Less than $10,000 | 2,752 (21.0%) | 0 (0.0%) |
| $10,000 to $24,999 | 3,034 (23.2%) | 115 (4.2%) |
| $25,000 to $34,999 | 1,501 (11.5%) | 117 (4.3%) |
| $35,000 to $49,999 | 1,551 (11.8%) | 323 (11.8%) |
| $50,000 to $74,999 | 1,776 (13.6%) | 249 (9.1%) |
| $75,000 to $99,999 | 946 (7.2%) | 452 (16.6%) |
| $100,000 to $149,999 | 983 (7.5%) | 535 (19.6%) |
| $150,000 or more | 564 (4.3%) | 584 (21.4%) |
| Total | 13,107 (100.0%) | 2,731 (100.0%) |
Property Value to Household Income Ratio in Apache County
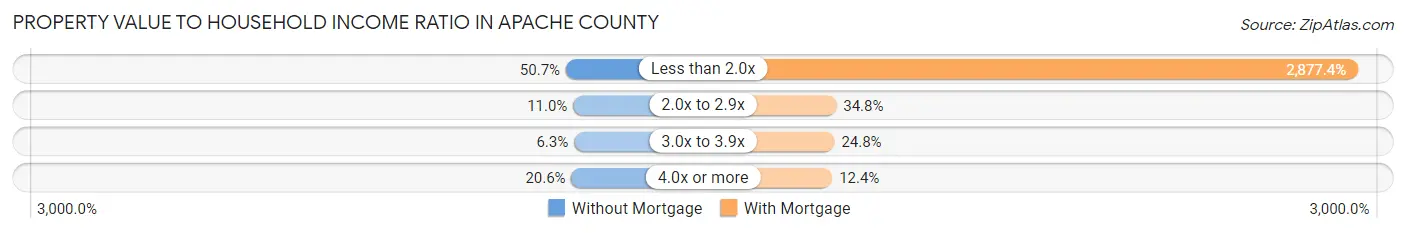
| Value-to-Income Ratio | Without Mortgage | With Mortgage |
| Less than 2.0x | 6,650 (50.7%) | 78,581 (2,877.4%) |
| 2.0x to 2.9x | 1,446 (11.0%) | 951 (34.8%) |
| 3.0x to 3.9x | 831 (6.3%) | 677 (24.8%) |
| 4.0x or more | 2,695 (20.6%) | 339 (12.4%) |
| Total | 13,107 (100.0%) | 2,731 (100.0%) |
Real Estate Taxes by Mortgage Status in Apache County
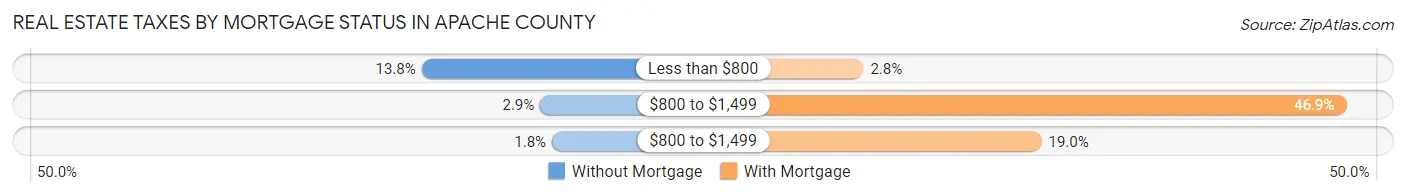
| Property Taxes | Without Mortgage | With Mortgage |
| Less than $800 | 1,802 (13.8%) | 76 (2.8%) |
| $800 to $1,499 | 383 (2.9%) | 1,280 (46.9%) |
| $800 to $1,499 | 241 (1.8%) | 520 (19.0%) |
| Total | 13,107 (100.0%) | 2,731 (100.0%) |
Health & Disability in Apache County
Health Insurance Coverage by Age in Apache County
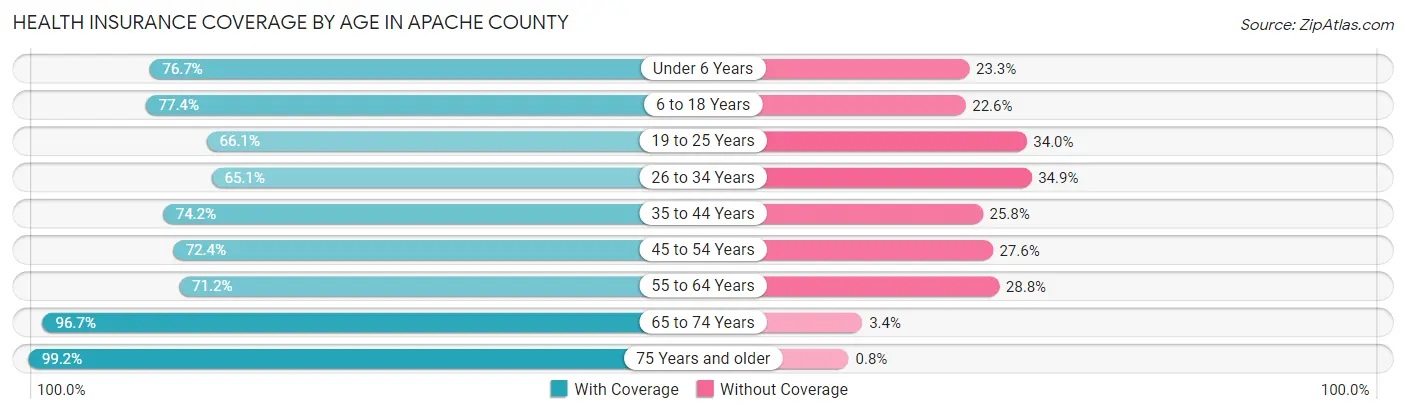
| Age Bracket | With Coverage | Without Coverage |
| Under 6 Years | 3,786 (76.7%) | 1,149 (23.3%) |
| 6 to 18 Years | 10,512 (77.4%) | 3,065 (22.6%) |
| 19 to 25 Years | 3,809 (66.0%) | 1,958 (34.0%) |
| 26 to 34 Years | 5,099 (65.1%) | 2,729 (34.9%) |
| 35 to 44 Years | 5,331 (74.2%) | 1,852 (25.8%) |
| 45 to 54 Years | 5,204 (72.4%) | 1,987 (27.6%) |
| 55 to 64 Years | 6,034 (71.2%) | 2,444 (28.8%) |
| 65 to 74 Years | 6,137 (96.7%) | 213 (3.4%) |
| 75 Years and older | 3,976 (99.2%) | 32 (0.8%) |
| Total | 49,888 (76.4%) | 15,429 (23.6%) |
Health Insurance Coverage by Citizenship Status in Apache County
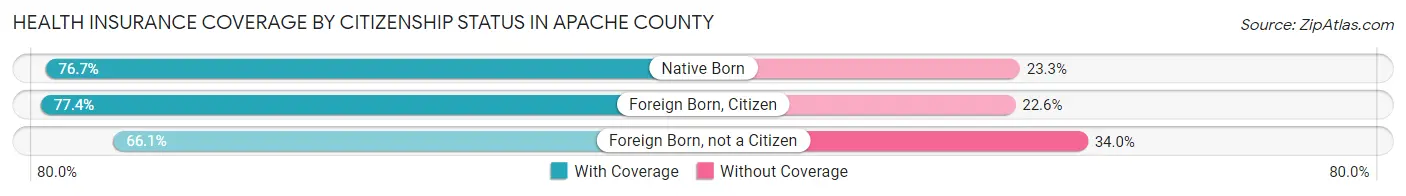
| Citizenship Status | With Coverage | Without Coverage |
| Native Born | 3,786 (76.7%) | 1,149 (23.3%) |
| Foreign Born, Citizen | 10,512 (77.4%) | 3,065 (22.6%) |
| Foreign Born, not a Citizen | 3,809 (66.0%) | 1,958 (34.0%) |
Health Insurance Coverage by Household Income in Apache County
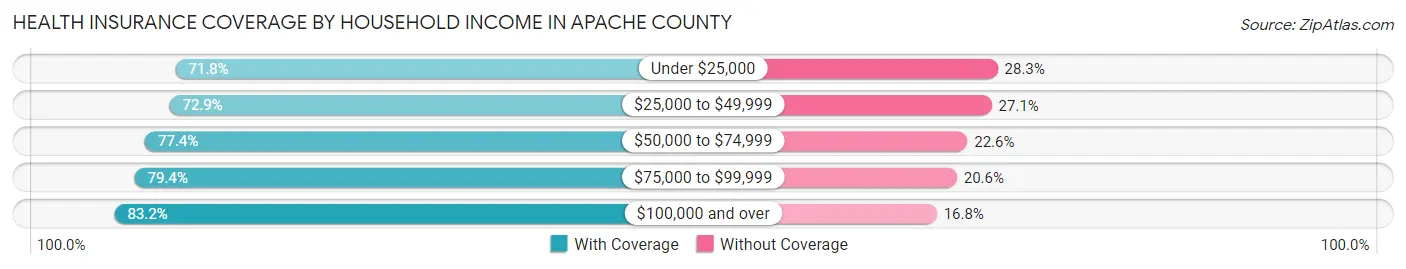
| Household Income | With Coverage | Without Coverage |
| Under $25,000 | 13,347 (71.8%) | 5,256 (28.2%) |
| $25,000 to $49,999 | 10,626 (72.9%) | 3,958 (27.1%) |
| $50,000 to $74,999 | 7,639 (77.4%) | 2,228 (22.6%) |
| $75,000 to $99,999 | 5,650 (79.4%) | 1,467 (20.6%) |
| $100,000 and over | 11,980 (83.2%) | 2,426 (16.8%) |
Public vs Private Health Insurance Coverage by Age in Apache County
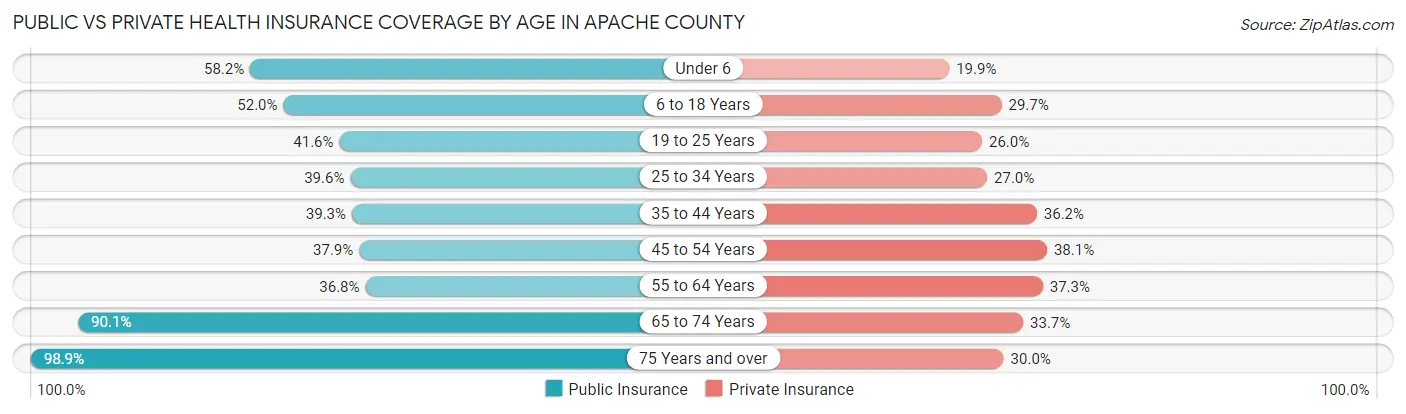
| Age Bracket | Public Insurance | Private Insurance |
| Under 6 | 2,870 (58.2%) | 984 (19.9%) |
| 6 to 18 Years | 7,056 (52.0%) | 4,026 (29.6%) |
| 19 to 25 Years | 2,398 (41.6%) | 1,501 (26.0%) |
| 25 to 34 Years | 3,097 (39.6%) | 2,111 (27.0%) |
| 35 to 44 Years | 2,820 (39.3%) | 2,601 (36.2%) |
| 45 to 54 Years | 2,726 (37.9%) | 2,739 (38.1%) |
| 55 to 64 Years | 3,116 (36.7%) | 3,163 (37.3%) |
| 65 to 74 Years | 5,718 (90.0%) | 2,137 (33.7%) |
| 75 Years and over | 3,962 (98.9%) | 1,204 (30.0%) |
| Total | 33,763 (51.7%) | 20,466 (31.3%) |
Disability Status by Sex by Age in Apache County
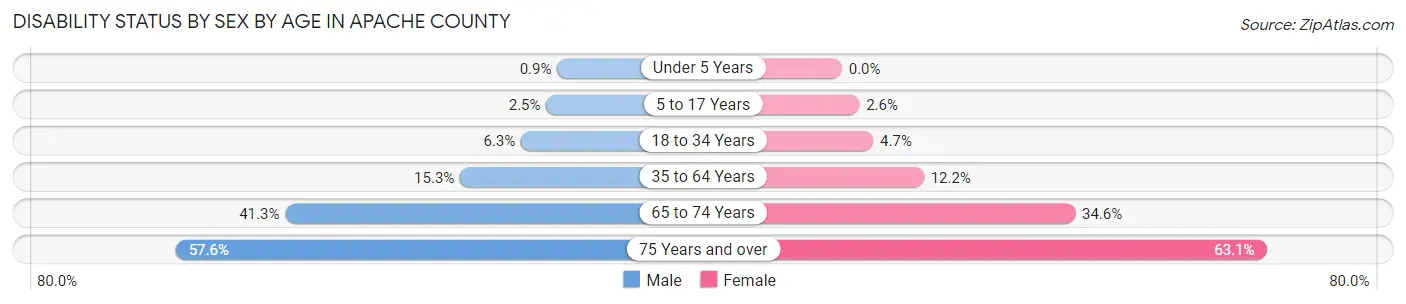
| Age Bracket | Male | Female |
| Under 5 Years | 19 (0.9%) | 0 (0.0%) |
| 5 to 17 Years | 169 (2.5%) | 173 (2.6%) |
| 18 to 34 Years | 465 (6.3%) | 336 (4.7%) |
| 35 to 64 Years | 1,731 (15.3%) | 1,404 (12.2%) |
| 65 to 74 Years | 1,220 (41.3%) | 1,176 (34.6%) |
| 75 Years and over | 986 (57.6%) | 1,447 (63.0%) |
Disability Class by Sex by Age in Apache County
Disability Class: Hearing Difficulty
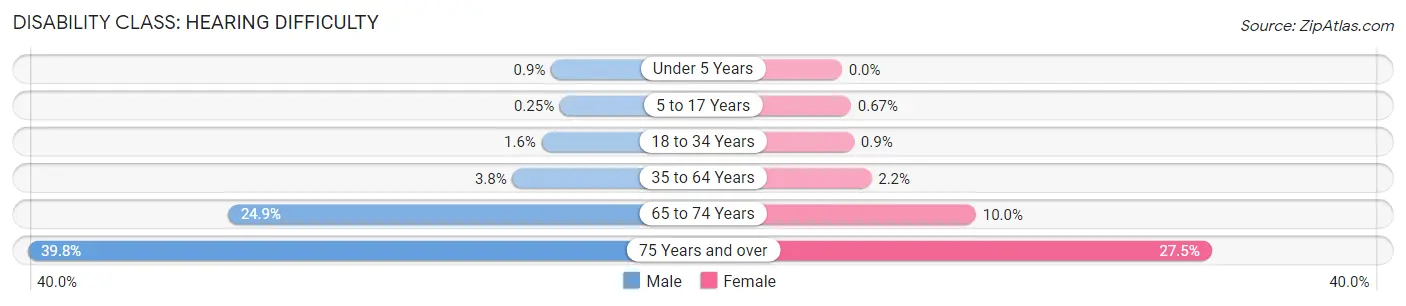
| Age Bracket | Male | Female |
| Under 5 Years | 19 (0.9%) | 0 (0.0%) |
| 5 to 17 Years | 17 (0.3%) | 45 (0.7%) |
| 18 to 34 Years | 119 (1.6%) | 65 (0.9%) |
| 35 to 64 Years | 426 (3.8%) | 253 (2.2%) |
| 65 to 74 Years | 736 (24.9%) | 338 (10.0%) |
| 75 Years and over | 681 (39.8%) | 630 (27.5%) |
Disability Class: Vision Difficulty
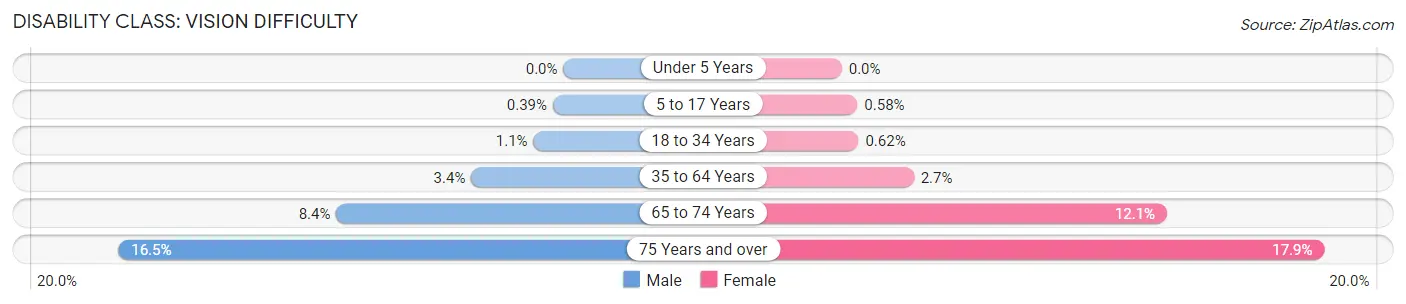
| Age Bracket | Male | Female |
| Under 5 Years | 0 (0.0%) | 0 (0.0%) |
| 5 to 17 Years | 26 (0.4%) | 39 (0.6%) |
| 18 to 34 Years | 82 (1.1%) | 45 (0.6%) |
| 35 to 64 Years | 387 (3.4%) | 308 (2.7%) |
| 65 to 74 Years | 249 (8.4%) | 410 (12.1%) |
| 75 Years and over | 283 (16.5%) | 411 (17.9%) |
Disability Class: Cognitive Difficulty
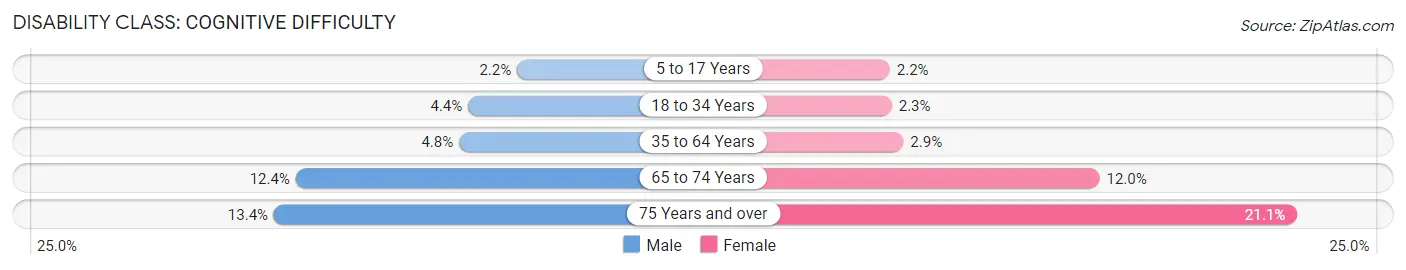
| Age Bracket | Male | Female |
| 5 to 17 Years | 144 (2.1%) | 149 (2.2%) |
| 18 to 34 Years | 328 (4.4%) | 167 (2.3%) |
| 35 to 64 Years | 547 (4.8%) | 330 (2.9%) |
| 65 to 74 Years | 367 (12.4%) | 406 (12.0%) |
| 75 Years and over | 230 (13.4%) | 485 (21.1%) |
Disability Class: Ambulatory Difficulty
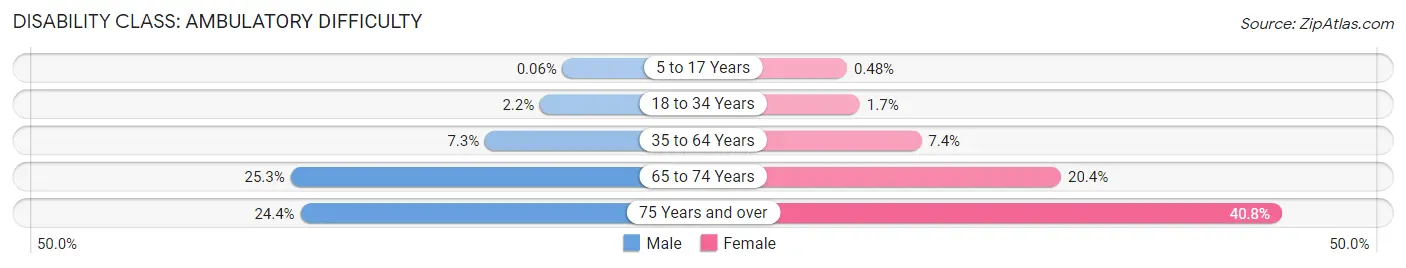
| Age Bracket | Male | Female |
| 5 to 17 Years | 4 (0.1%) | 32 (0.5%) |
| 18 to 34 Years | 160 (2.2%) | 121 (1.7%) |
| 35 to 64 Years | 822 (7.3%) | 852 (7.4%) |
| 65 to 74 Years | 748 (25.3%) | 691 (20.3%) |
| 75 Years and over | 418 (24.4%) | 937 (40.8%) |
Disability Class: Self-Care Difficulty
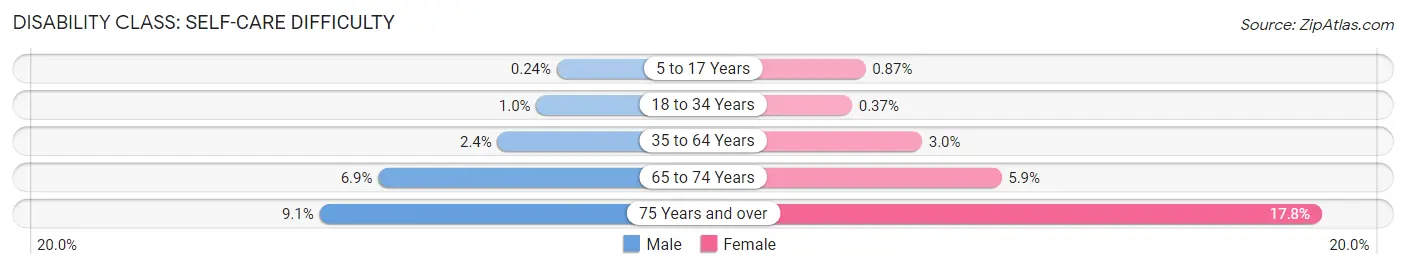
| Age Bracket | Male | Female |
| 5 to 17 Years | 16 (0.2%) | 58 (0.9%) |
| 18 to 34 Years | 74 (1.0%) | 27 (0.4%) |
| 35 to 64 Years | 276 (2.4%) | 343 (3.0%) |
| 65 to 74 Years | 203 (6.9%) | 201 (5.9%) |
| 75 Years and over | 155 (9.0%) | 409 (17.8%) |
Technology Access in Apache County
Computing Device Access in Apache County
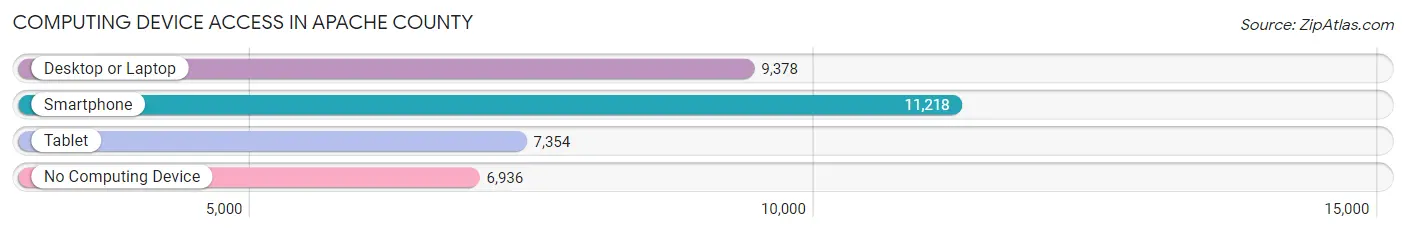
| Device Type | # Households | % Households |
| Desktop or Laptop | 9,378 | 47.4% |
| Smartphone | 11,218 | 56.7% |
| Tablet | 7,354 | 37.2% |
| No Computing Device | 6,936 | 35.1% |
| Total | 19,786 | 100.0% |
Internet Access in Apache County
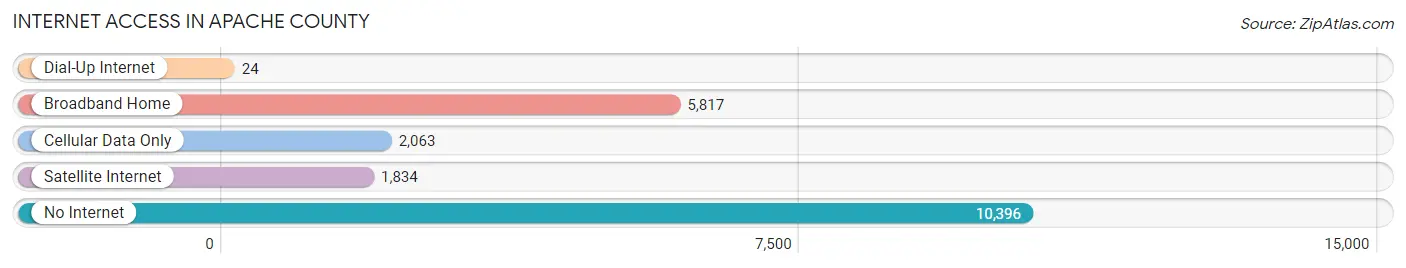
| Internet Type | # Households | % Households |
| Dial-Up Internet | 24 | 0.1% |
| Broadband Home | 5,817 | 29.4% |
| Cellular Data Only | 2,063 | 10.4% |
| Satellite Internet | 1,834 | 9.3% |
| No Internet | 10,396 | 52.5% |
| Total | 19,786 | 100.0% |
Apache County Summary
Apache County, Arizona is located in the northeastern corner of the state and is the largest county in Arizona. It is bordered by New Mexico to the east, Utah to the north, Navajo County to the west, and Coconino County to the south. Apache County is home to the Navajo Nation, the largest Native American reservation in the United States. The county seat is St. Johns, and the largest city is Show Low.
History
Apache County was established in 1879, and was named after the Apache people who lived in the area. The county was originally part of the New Mexico Territory, and was later annexed to the Arizona Territory in 1863. The county was created to provide a government for the Apache people, and to provide a place for them to live and work.
The county was home to many different Native American tribes, including the Apache, Navajo, Hopi, and Zuni. The Apache were the dominant tribe in the area, and they were known for their fierce warriors and their ability to survive in the harsh desert environment.
The first settlers in Apache County were ranchers and miners, who came to the area in search of gold and silver. The county was also home to many cattle ranches, and the area was known for its cattle drives.
Geography
Apache County is located in the northeastern corner of Arizona, and covers an area of 11,218 square miles. The county is bordered by New Mexico to the east, Utah to the north, Navajo County to the west, and Coconino County to the south.
The county is mostly made up of desert and semi-arid land, with some mountainous areas in the north. The highest point in the county is the summit of Mount Baldy, which is 11,403 feet above sea level. The county is home to several national parks and monuments, including Petrified Forest National Park, Canyon de Chelly National Monument, and Chiricahua National Monument.
Economy
Apache County has a diverse economy, with a mix of agriculture, mining, tourism, and government services. The county is home to several large ranches, and the area is known for its cattle drives. The county is also home to several large mining operations, including copper, uranium, and coal.
Tourism is an important part of the economy, and the county is home to several national parks and monuments. The county is also home to several ski resorts, and the area is known for its outdoor recreation opportunities.
The county is also home to several government services, including the Navajo Nation government, the Bureau of Indian Affairs, and the U.S. Forest Service.
Demographics
As of the 2010 census, Apache County had a population of 71,518. The population is mostly Native American, with the Navajo Nation making up the majority of the population. The county also has a large Hispanic population, and a small white population.
The median household income in Apache County is $35,945, and the median family income is $41,945. The poverty rate in the county is 28.3%, and the unemployment rate is 8.2%.
Conclusion
Apache County, Arizona is a large county located in the northeastern corner of the state. The county is home to the Navajo Nation, and is known for its cattle ranches, mining operations, and outdoor recreation opportunities. The county has a diverse economy, and the population is mostly Native American. The median household income in the county is $35,945, and the poverty rate is 28.3%.
Common Questions
What is Per Capita Income in Apache County?
Per Capita income in Apache County is $18,930.
What is the Median Family Income in Apache County?
Median Family Income in Apache County is $46,534.
What is the Median Household income in Apache County?
Median Household Income in Apache County is $37,483.
What is Income or Wage Gap in Apache County?
Income or Wage Gap in Apache County is 9.8%.
Women in Apache County earn 90.2 cents for every dollar earned by a man.
What is Family Income Deficit in Apache County?
Family Income Deficit in Apache County is $15,187.
Families that are below poverty line in Apache County earn $15,187 less on average than the poverty threshold level.
What is Inequality or Gini Index in Apache County?
Inequality or Gini Index in Apache County is 0.51.
What is the Total Population of Apache County?
Total Population of Apache County is 66,054.
What is the Total Male Population of Apache County?
Total Male Population of Apache County is 32,843.
What is the Total Female Population of Apache County?
Total Female Population of Apache County is 33,211.
What is the Ratio of Males per 100 Females in Apache County?
There are 98.89 Males per 100 Females in Apache County.
What is the Ratio of Females per 100 Males in Apache County?
There are 101.12 Females per 100 Males in Apache County.
What is the Median Population Age in Apache County?
Median Population Age in Apache County is 35.6 Years.
What is the Average Family Size in Apache County
Average Family Size in Apache County is 4.3 People.
What is the Average Household Size in Apache County
Average Household Size in Apache County is 3.3 People.
How Large is the Labor Force in Apache County?
There are 20,140 People in the Labor Forcein in Apache County.
What is the Percentage of People in the Labor Force in Apache County?
39.7% of People are in the Labor Force in Apache County.
What is the Unemployment Rate in Apache County?
Unemployment Rate in Apache County is 9.5%.