Bylas, AZ Map & Demographics
Bylas Map
Bylas Overview
$15,985
PER CAPITA INCOME
$46,111
AVG FAMILY INCOME
$39,688
AVG HOUSEHOLD INCOME
29.6%
WAGE / INCOME GAP [ % ]
70.4¢/ $1
WAGE / INCOME GAP [ $ ]
$21,505
FAMILY INCOME DEFICIT
0.49
INEQUALITY / GINI INDEX
1,552
TOTAL POPULATION
769
MALE POPULATION
783
FEMALE POPULATION
98.21
MALES / 100 FEMALES
101.82
FEMALES / 100 MALES
30.2
MEDIAN AGE
3.7
AVG FAMILY SIZE
3.1
AVG HOUSEHOLD SIZE
403
LABOR FORCE [ PEOPLE ]
35.2%
PERCENT IN LABOR FORCE
12.2%
UNEMPLOYMENT RATE
Bylas Zip Codes
Bylas Area Codes
Income in Bylas
Income Overview in Bylas
Per Capita Income in Bylas is $15,985, while median incomes of families and households are $46,111 and $39,688 respectively.
| Characteristic | Number | Measure |
| Per Capita Income | 1,552 | $15,985 |
| Median Family Income | 370 | $46,111 |
| Mean Family Income | 370 | $58,319 |
| Median Household Income | 499 | $39,688 |
| Mean Household Income | 499 | $50,768 |
| Income Deficit | 370 | $21,505 |
| Wage / Income Gap (%) | 1,552 | 29.59% |
| Wage / Income Gap ($) | 1,552 | 70.41¢ per $1 |
| Gini / Inequality Index | 1,552 | 0.49 |
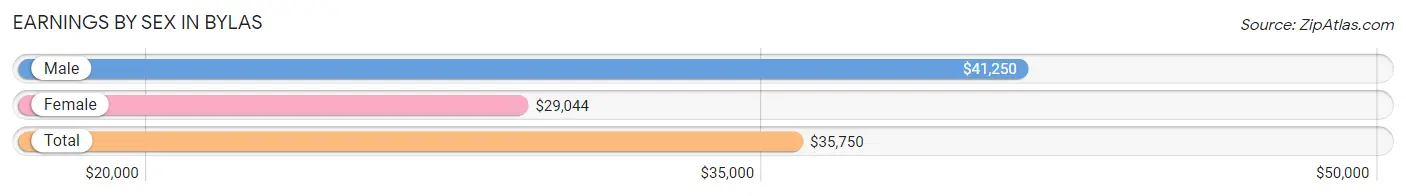
Earnings by Sex in Bylas
Average Earnings in Bylas are $35,750, $41,250 for men and $29,044 for women, a difference of 29.6%.
| Sex | Number | Average Earnings |
| Male | 198 (50.4%) | $41,250 |
| Female | 195 (49.6%) | $29,044 |
| Total | 393 (100.0%) | $35,750 |
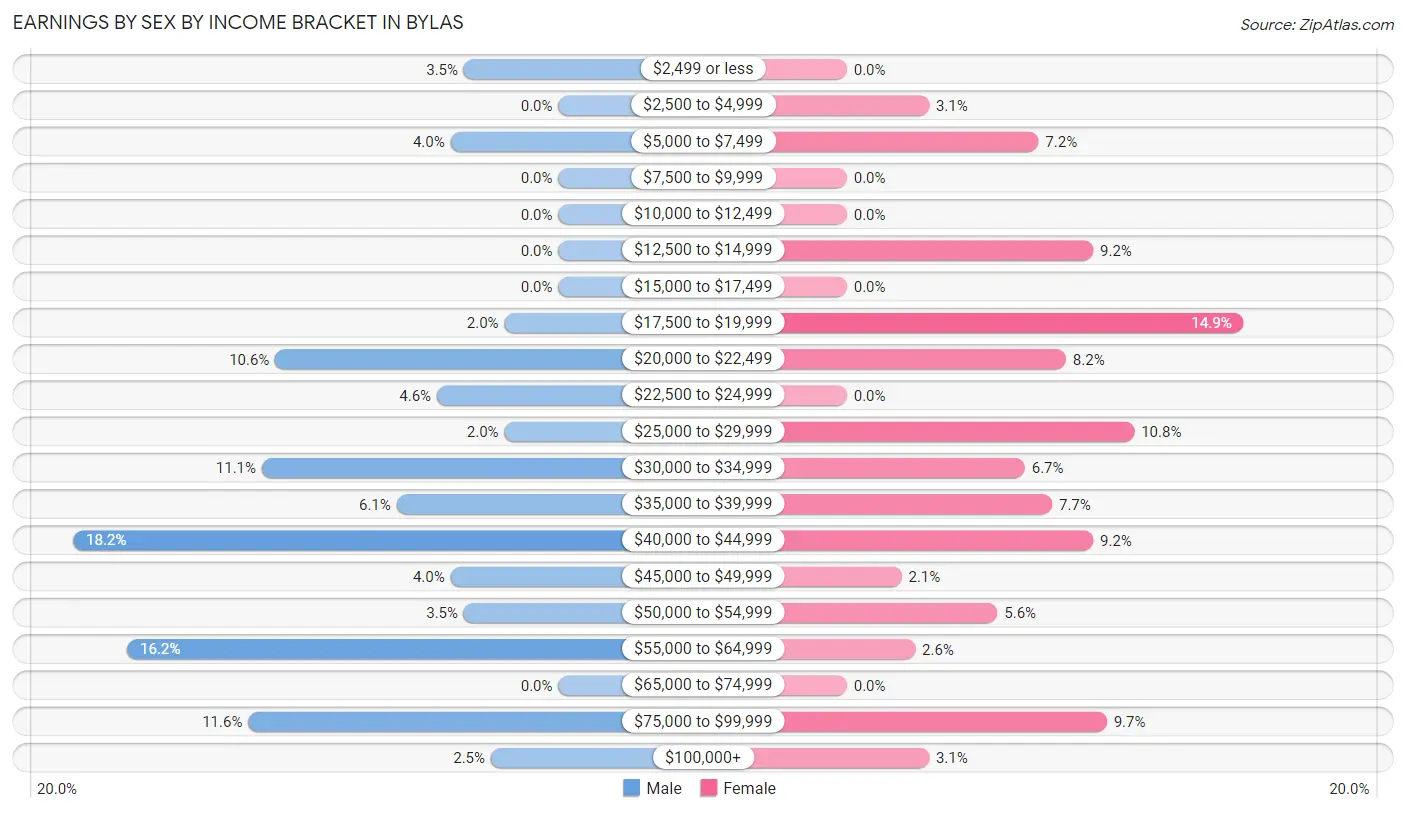
Earnings by Sex by Income Bracket in Bylas
The most common earnings brackets in Bylas are $40,000 to $44,999 for men (36 | 18.2%) and $17,500 to $19,999 for women (29 | 14.9%).
| Income | Male | Female |
| $2,499 or less | 7 (3.5%) | 0 (0.0%) |
| $2,500 to $4,999 | 0 (0.0%) | 6 (3.1%) |
| $5,000 to $7,499 | 8 (4.0%) | 14 (7.2%) |
| $7,500 to $9,999 | 0 (0.0%) | 0 (0.0%) |
| $10,000 to $12,499 | 0 (0.0%) | 0 (0.0%) |
| $12,500 to $14,999 | 0 (0.0%) | 18 (9.2%) |
| $15,000 to $17,499 | 0 (0.0%) | 0 (0.0%) |
| $17,500 to $19,999 | 4 (2.0%) | 29 (14.9%) |
| $20,000 to $22,499 | 21 (10.6%) | 16 (8.2%) |
| $22,500 to $24,999 | 9 (4.5%) | 0 (0.0%) |
| $25,000 to $29,999 | 4 (2.0%) | 21 (10.8%) |
| $30,000 to $34,999 | 22 (11.1%) | 13 (6.7%) |
| $35,000 to $39,999 | 12 (6.1%) | 15 (7.7%) |
| $40,000 to $44,999 | 36 (18.2%) | 18 (9.2%) |
| $45,000 to $49,999 | 8 (4.0%) | 4 (2.1%) |
| $50,000 to $54,999 | 7 (3.5%) | 11 (5.6%) |
| $55,000 to $64,999 | 32 (16.2%) | 5 (2.6%) |
| $65,000 to $74,999 | 0 (0.0%) | 0 (0.0%) |
| $75,000 to $99,999 | 23 (11.6%) | 19 (9.7%) |
| $100,000+ | 5 (2.5%) | 6 (3.1%) |
| Total | 198 (100.0%) | 195 (100.0%) |
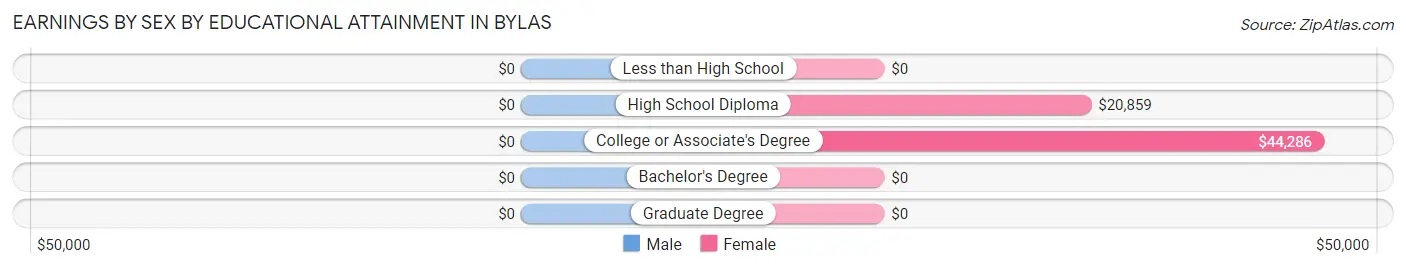
Earnings by Sex by Educational Attainment in Bylas
| Educational Attainment | Male Income | Female Income |
| Less than High School | - | - |
| High School Diploma | - | - |
| College or Associate's Degree | - | - |
| Bachelor's Degree | - | - |
| Graduate Degree | - | - |
| Total | $42,917 | $29,044 |
Family Income in Bylas
Family Income Brackets in Bylas
According to the Bylas family income data, there are 70 families falling into the $35,000 to $49,999 income range, which is the most common income bracket and makes up 18.9% of all families. Conversely, the $200,000+ income bracket is the least frequent group with only 6 families (1.6%) belonging to this category.
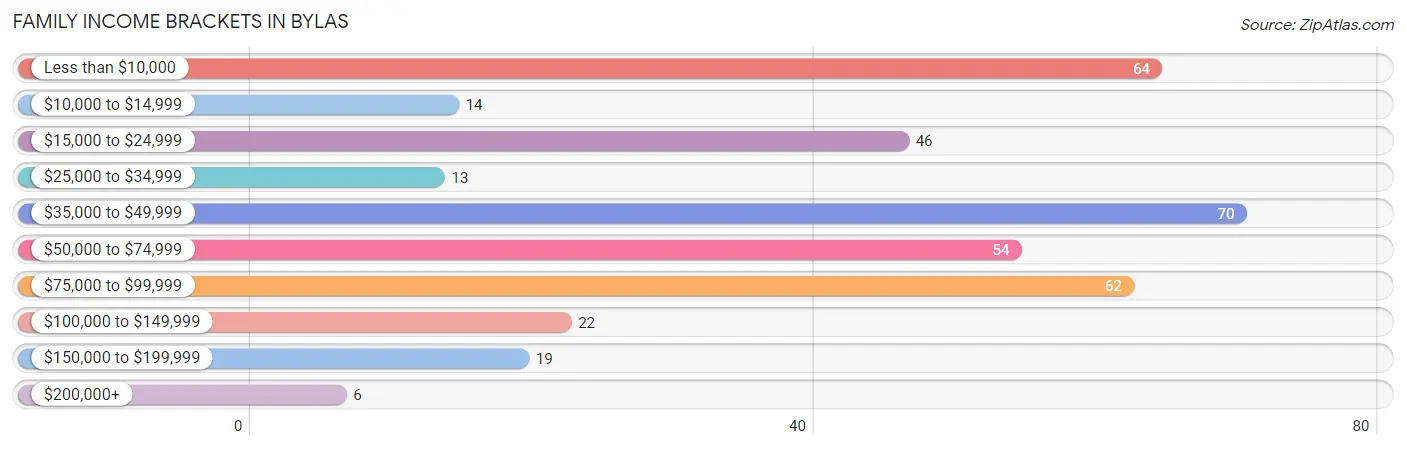
| Income Bracket | # Families | % Families |
| Less than $10,000 | 64 | 17.3% |
| $10,000 to $14,999 | 14 | 3.8% |
| $15,000 to $24,999 | 46 | 12.4% |
| $25,000 to $34,999 | 13 | 3.5% |
| $35,000 to $49,999 | 70 | 18.9% |
| $50,000 to $74,999 | 54 | 14.6% |
| $75,000 to $99,999 | 62 | 16.8% |
| $100,000 to $149,999 | 22 | 5.9% |
| $150,000 to $199,999 | 19 | 5.1% |
| $200,000+ | 6 | 1.6% |
Family Income by Famaliy Size in Bylas
3-person families (102 | 27.6%) account for the highest median family income in Bylas with $77,892 per family, while 3-person families (102 | 27.6%) have the highest median income of $25,964 per family member.
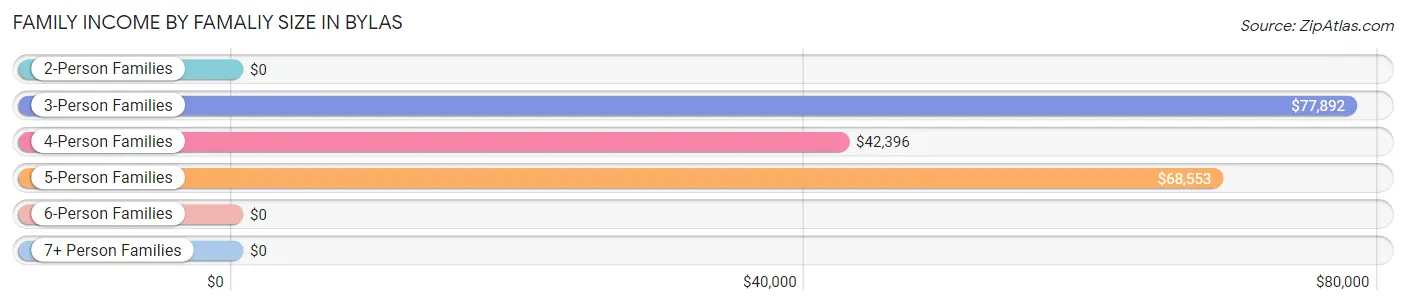
| Income Bracket | # Families | Median Income |
| 2-Person Families | 74 (20.0%) | $0 |
| 3-Person Families | 102 (27.6%) | $77,892 |
| 4-Person Families | 90 (24.3%) | $42,396 |
| 5-Person Families | 36 (9.7%) | $68,553 |
| 6-Person Families | 19 (5.1%) | $0 |
| 7+ Person Families | 49 (13.2%) | $0 |
| Total | 370 (100.0%) | $46,111 |
Family Income by Number of Earners in Bylas
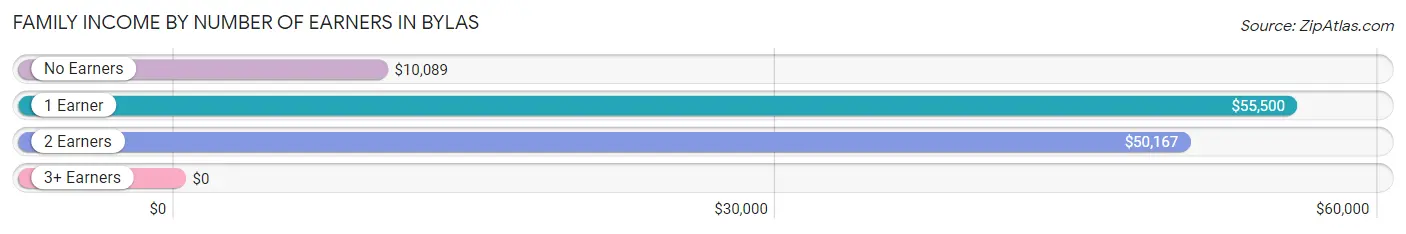
| Number of Earners | # Families | Median Income |
| No Earners | 99 (26.8%) | $10,089 |
| 1 Earner | 186 (50.3%) | $55,500 |
| 2 Earners | 66 (17.8%) | $50,167 |
| 3+ Earners | 19 (5.1%) | $0 |
| Total | 370 (100.0%) | $46,111 |
Household Income in Bylas
Household Income Brackets in Bylas
With 87 households falling in the category, the less than $10,000 income range is the most frequent in Bylas, accounting for 17.4% of all households. In contrast, only 6 households (1.2%) fall into the $200,000+ income bracket, making it the least populous group.
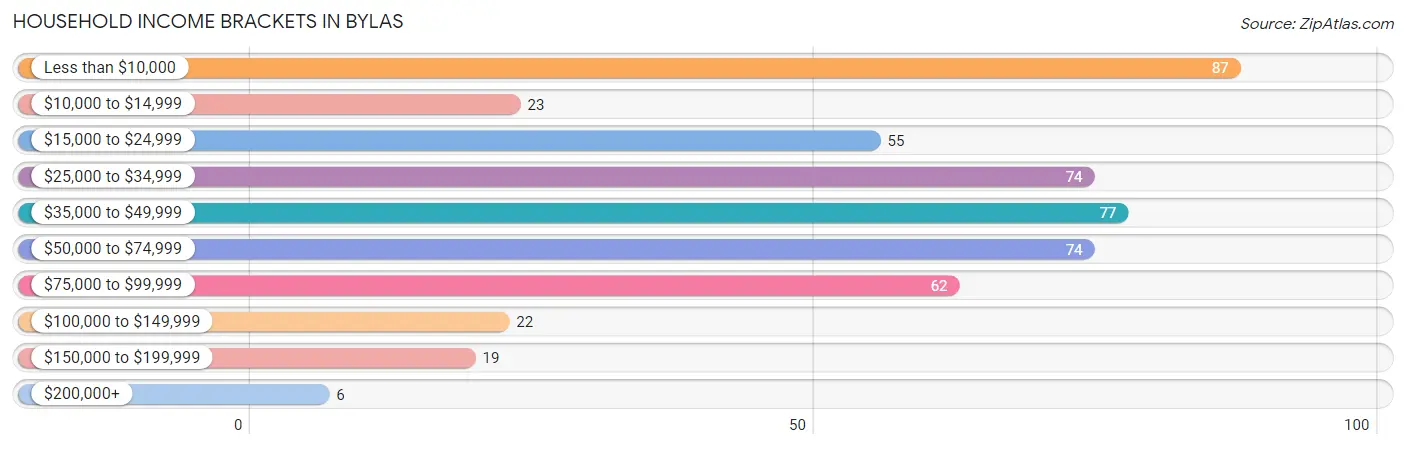
| Income Bracket | # Households | % Households |
| Less than $10,000 | 87 | 17.4% |
| $10,000 to $14,999 | 23 | 4.6% |
| $15,000 to $24,999 | 55 | 11.0% |
| $25,000 to $34,999 | 74 | 14.8% |
| $35,000 to $49,999 | 77 | 15.4% |
| $50,000 to $74,999 | 74 | 14.8% |
| $75,000 to $99,999 | 62 | 12.4% |
| $100,000 to $149,999 | 22 | 4.4% |
| $150,000 to $199,999 | 19 | 3.8% |
| $200,000+ | 6 | 1.2% |
Household Income by Householder Age in Bylas
The median household income in Bylas is $39,688, with the highest median household income of $44,643 found in the 25 to 44 years age bracket for the primary householder. A total of 114 households (22.9%) fall into this category. Meanwhile, the 15 to 24 years age bracket for the primary householder has the lowest median household income of $0, with 26 households (5.2%) in this group.
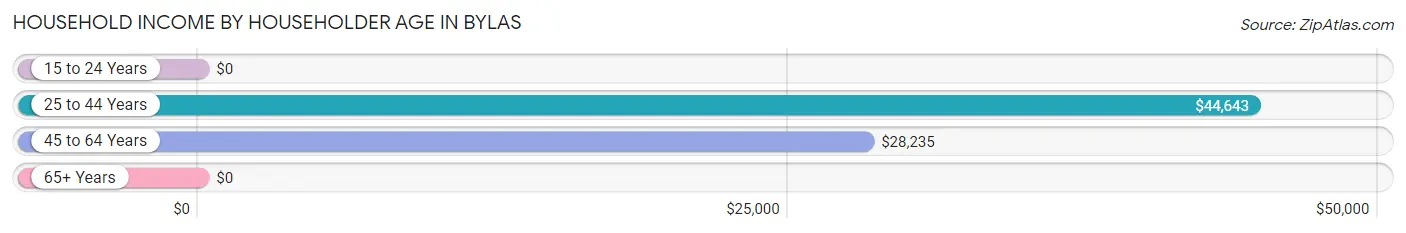
| Income Bracket | # Households | Median Income |
| 15 to 24 Years | 26 (5.2%) | $0 |
| 25 to 44 Years | 114 (22.9%) | $44,643 |
| 45 to 64 Years | 150 (30.1%) | $28,235 |
| 65+ Years | 209 (41.9%) | $0 |
| Total | 499 (100.0%) | $39,688 |
Poverty in Bylas
Income Below Poverty by Sex and Age in Bylas
With 36.9% poverty level for males and 42.3% for females among the residents of Bylas, 5 year old males and 18 to 24 year old females are the most vulnerable to poverty, with 8 males (100.0%) and 58 females (100.0%) in their respective age groups living below the poverty level.
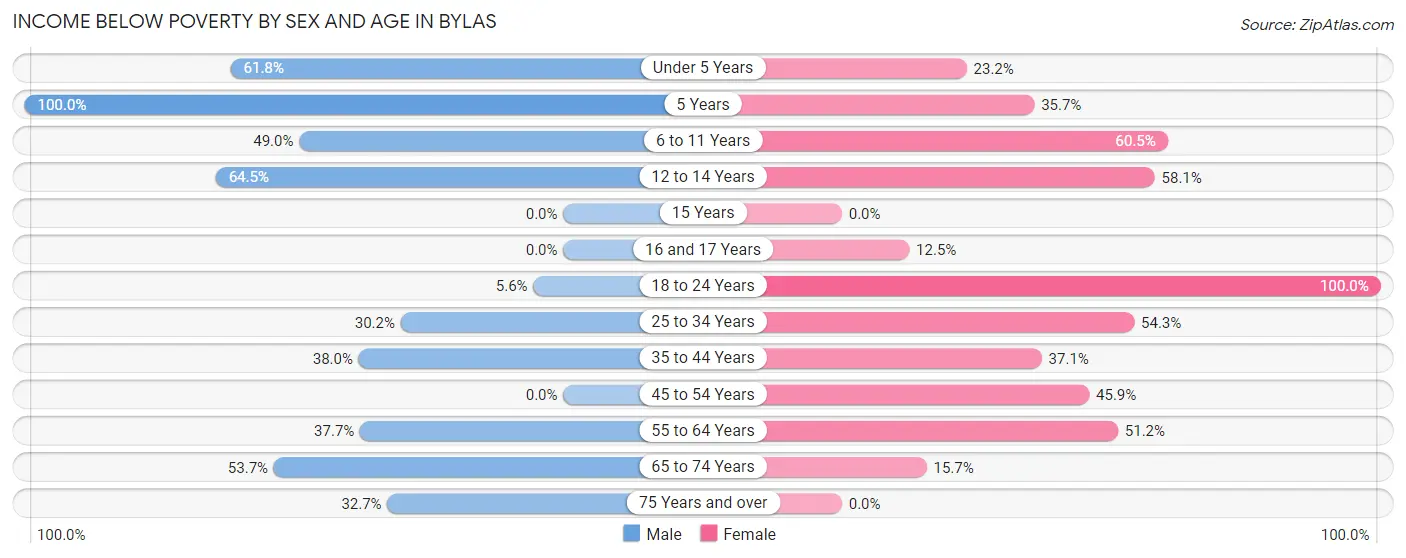
| Age Bracket | Male | Female |
| Under 5 Years | 42 (61.8%) | 19 (23.2%) |
| 5 Years | 8 (100.0%) | 10 (35.7%) |
| 6 to 11 Years | 50 (49.0%) | 26 (60.5%) |
| 12 to 14 Years | 20 (64.5%) | 18 (58.1%) |
| 15 Years | 0 (0.0%) | 0 (0.0%) |
| 16 and 17 Years | 0 (0.0%) | 3 (12.5%) |
| 18 to 24 Years | 4 (5.6%) | 58 (100.0%) |
| 25 to 34 Years | 35 (30.2%) | 70 (54.3%) |
| 35 to 44 Years | 30 (38.0%) | 23 (37.1%) |
| 45 to 54 Years | 0 (0.0%) | 28 (45.9%) |
| 55 to 64 Years | 43 (37.7%) | 62 (51.2%) |
| 65 to 74 Years | 36 (53.7%) | 14 (15.7%) |
| 75 Years and over | 16 (32.7%) | 0 (0.0%) |
| Total | 284 (36.9%) | 331 (42.3%) |
Income Above Poverty by Sex and Age in Bylas
According to the poverty statistics in Bylas, males aged 15 years and females aged 15 years are the age groups that are most secure financially, with 100.0% of males and 100.0% of females in these age groups living above the poverty line.
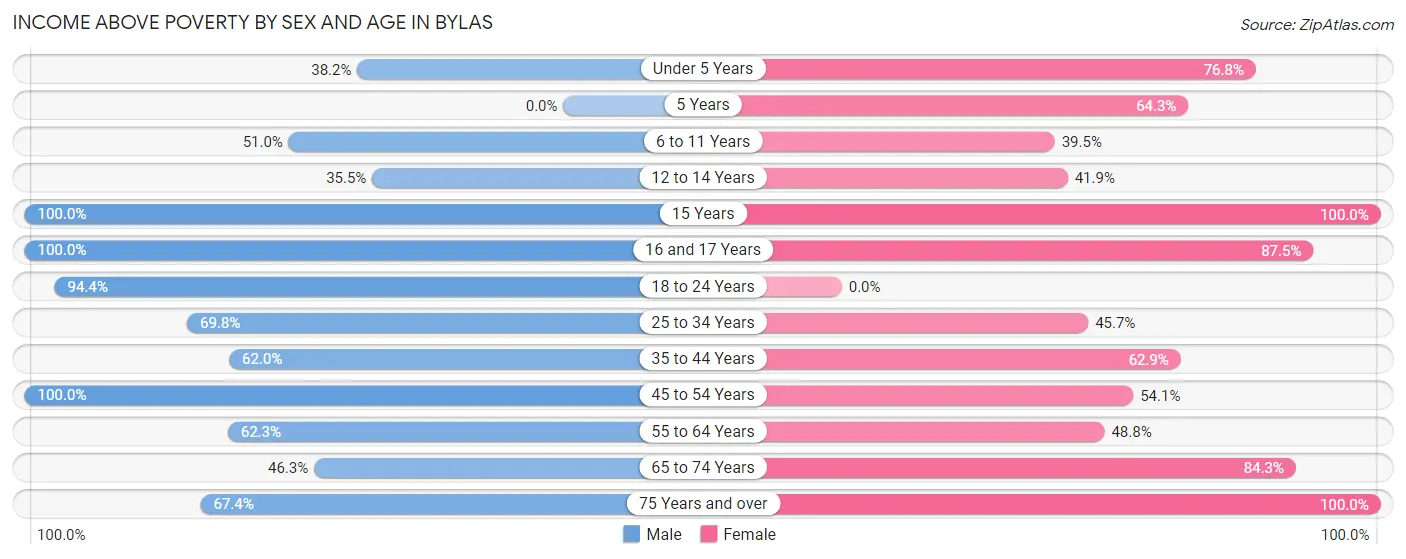
| Age Bracket | Male | Female |
| Under 5 Years | 26 (38.2%) | 63 (76.8%) |
| 5 Years | 0 (0.0%) | 18 (64.3%) |
| 6 to 11 Years | 52 (51.0%) | 17 (39.5%) |
| 12 to 14 Years | 11 (35.5%) | 13 (41.9%) |
| 15 Years | 10 (100.0%) | 4 (100.0%) |
| 16 and 17 Years | 4 (100.0%) | 21 (87.5%) |
| 18 to 24 Years | 68 (94.4%) | 0 (0.0%) |
| 25 to 34 Years | 81 (69.8%) | 59 (45.7%) |
| 35 to 44 Years | 49 (62.0%) | 39 (62.9%) |
| 45 to 54 Years | 49 (100.0%) | 33 (54.1%) |
| 55 to 64 Years | 71 (62.3%) | 59 (48.8%) |
| 65 to 74 Years | 31 (46.3%) | 75 (84.3%) |
| 75 Years and over | 33 (67.3%) | 51 (100.0%) |
| Total | 485 (63.1%) | 452 (57.7%) |
Income Below Poverty Among Married-Couple Families in Bylas
The poverty statistics for married-couple families in Bylas show that 29.4% or 32 of the total 109 families live below the poverty line. Families with 3 or 4 children have the highest poverty rate of 42.9%, comprising of 12 families. On the other hand, families with 1 or 2 children have the lowest poverty rate of 18.6%, which includes 8 families.
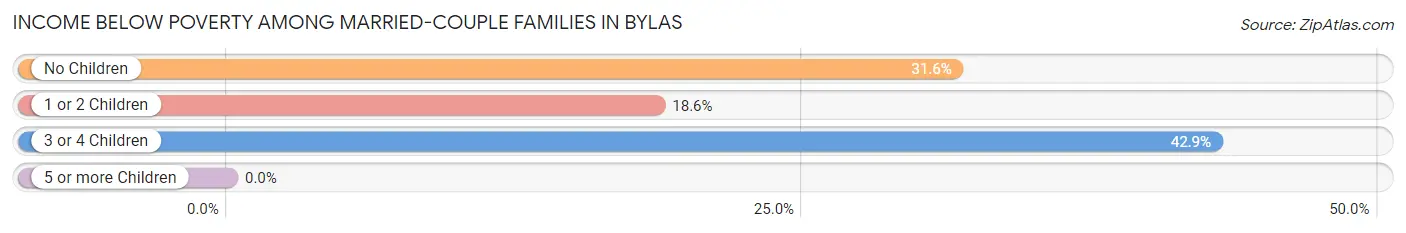
| Children | Above Poverty | Below Poverty |
| No Children | 26 (68.4%) | 12 (31.6%) |
| 1 or 2 Children | 35 (81.4%) | 8 (18.6%) |
| 3 or 4 Children | 16 (57.1%) | 12 (42.9%) |
| 5 or more Children | 0 (0.0%) | 0 (0.0%) |
| Total | 77 (70.6%) | 32 (29.4%) |
Income Below Poverty Among Single-Parent Households in Bylas
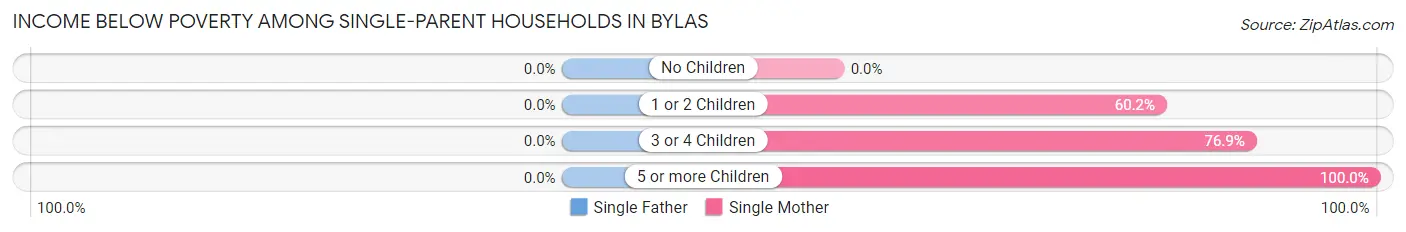
| Children | Single Father | Single Mother |
| No Children | 0 (0.0%) | 0 (0.0%) |
| 1 or 2 Children | 0 (0.0%) | 62 (60.2%) |
| 3 or 4 Children | 0 (0.0%) | 20 (76.9%) |
| 5 or more Children | 0 (0.0%) | 6 (100.0%) |
| Total | 0 (0.0%) | 88 (40.7%) |
Income Below Poverty Among Married-Couple vs Single-Parent Households in Bylas
The poverty data for Bylas shows that 32 of the married-couple family households (29.4%) and 88 of the single-parent households (33.7%) are living below the poverty level. Within the married-couple family households, those with 3 or 4 children have the highest poverty rate, with 12 households (42.9%) falling below the poverty line. Among the single-parent households, those with 5 or more children have the highest poverty rate, with 6 household (100.0%) living below poverty.
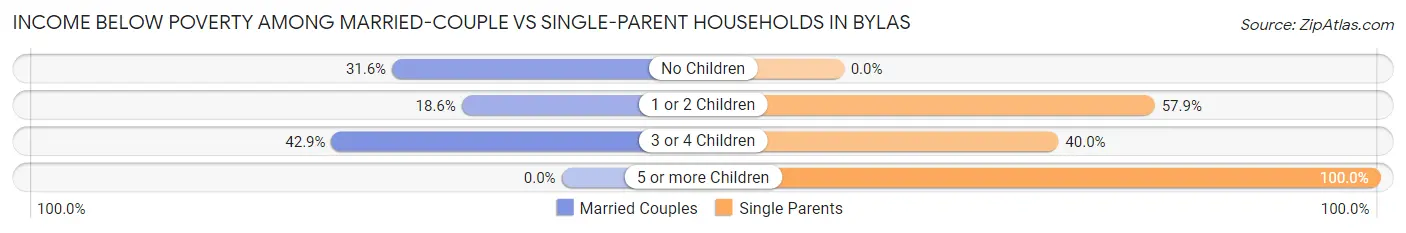
| Children | Married-Couple Families | Single-Parent Households |
| No Children | 12 (31.6%) | 0 (0.0%) |
| 1 or 2 Children | 8 (18.6%) | 62 (57.9%) |
| 3 or 4 Children | 12 (42.9%) | 20 (40.0%) |
| 5 or more Children | 0 (0.0%) | 6 (100.0%) |
| Total | 32 (29.4%) | 88 (33.7%) |
Race in Bylas
The most populous races in Bylas are Native / Alaskan (1,522 | 98.1%), Two or more Races (19 | 1.2%), and White / Caucasian (11 | 0.7%).
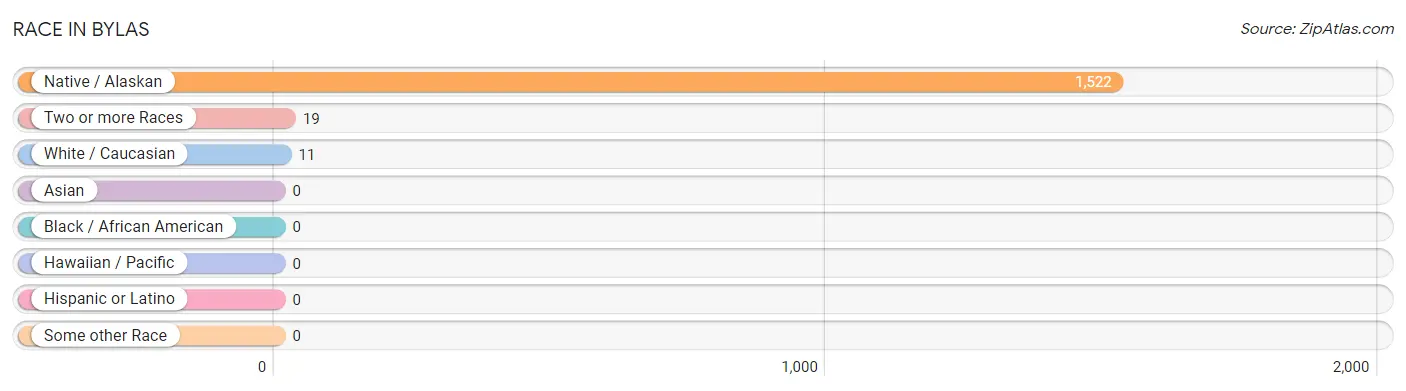
| Race | # Population | % Population |
| Asian | 0 | 0.0% |
| Black / African American | 0 | 0.0% |
| Hawaiian / Pacific | 0 | 0.0% |
| Hispanic or Latino | 0 | 0.0% |
| Native / Alaskan | 1,522 | 98.1% |
| White / Caucasian | 11 | 0.7% |
| Two or more Races | 19 | 1.2% |
| Some other Race | 0 | 0.0% |
| Total | 1,552 | 100.0% |
Ancestry in Bylas
The most populous ancestries reported in Bylas are Apache (1,527 | 98.4%), Hopi (12 | 0.8%), and Pima (7 | 0.4%), together accounting for 99.6% of all Bylas residents.
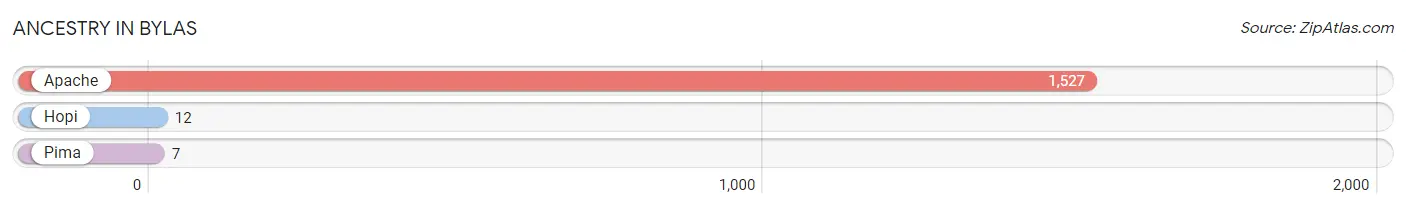
| Ancestry | # Population | % Population |
| Apache | 1,527 | 98.4% |
| Hopi | 12 | 0.8% |
| Pima | 7 | 0.4% | View All 3 Rows |
Immigrants in Bylas

| Immigration Origin | # Population | % Population | View All 0 Rows |
Sex and Age in Bylas
Sex and Age in Bylas
The most populous age groups in Bylas are 25 to 29 Years (107 | 13.9%) for men and 25 to 29 Years (100 | 12.8%) for women.
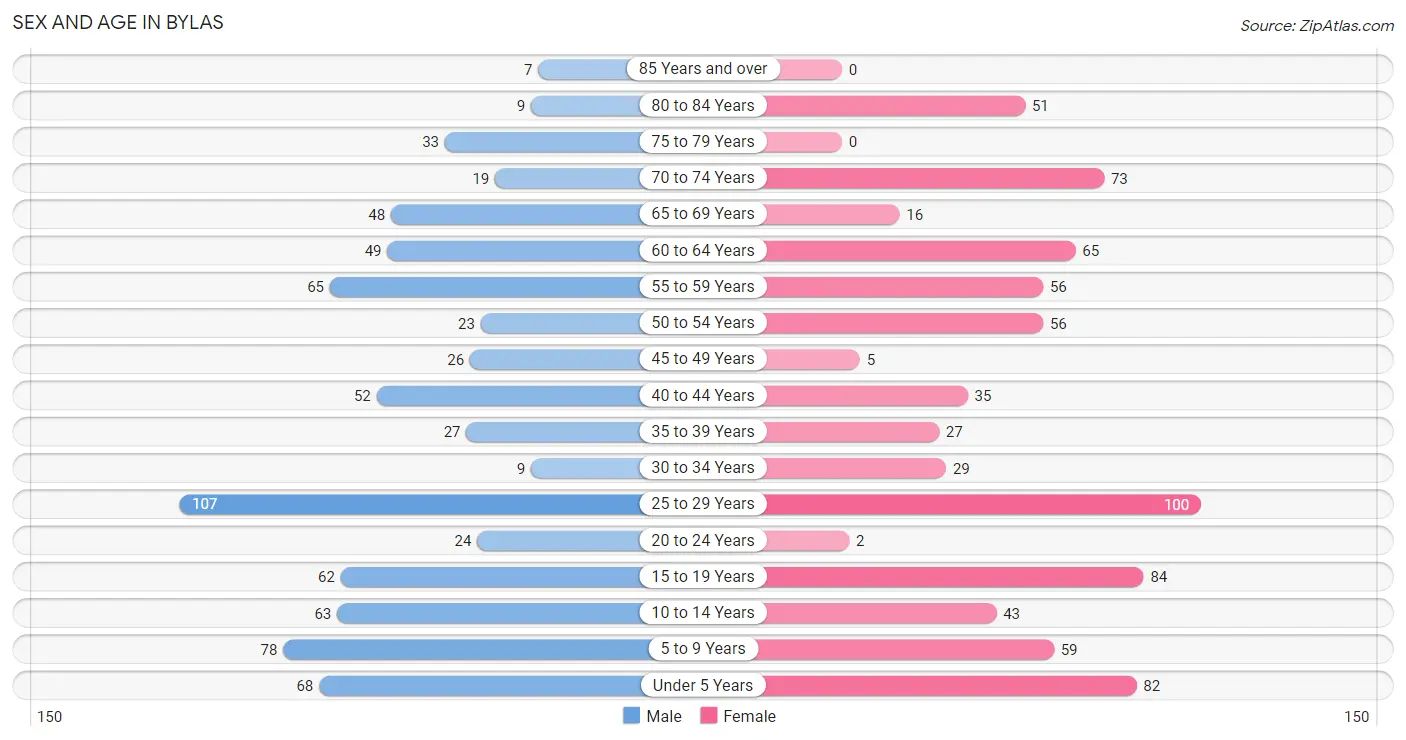
| Age Bracket | Male | Female |
| Under 5 Years | 68 (8.8%) | 82 (10.5%) |
| 5 to 9 Years | 78 (10.1%) | 59 (7.5%) |
| 10 to 14 Years | 63 (8.2%) | 43 (5.5%) |
| 15 to 19 Years | 62 (8.1%) | 84 (10.7%) |
| 20 to 24 Years | 24 (3.1%) | 2 (0.3%) |
| 25 to 29 Years | 107 (13.9%) | 100 (12.8%) |
| 30 to 34 Years | 9 (1.2%) | 29 (3.7%) |
| 35 to 39 Years | 27 (3.5%) | 27 (3.5%) |
| 40 to 44 Years | 52 (6.8%) | 35 (4.5%) |
| 45 to 49 Years | 26 (3.4%) | 5 (0.6%) |
| 50 to 54 Years | 23 (3.0%) | 56 (7.1%) |
| 55 to 59 Years | 65 (8.5%) | 56 (7.1%) |
| 60 to 64 Years | 49 (6.4%) | 65 (8.3%) |
| 65 to 69 Years | 48 (6.2%) | 16 (2.0%) |
| 70 to 74 Years | 19 (2.5%) | 73 (9.3%) |
| 75 to 79 Years | 33 (4.3%) | 0 (0.0%) |
| 80 to 84 Years | 9 (1.2%) | 51 (6.5%) |
| 85 Years and over | 7 (0.9%) | 0 (0.0%) |
| Total | 769 (100.0%) | 783 (100.0%) |
Families and Households in Bylas
Median Family Size in Bylas
The median family size in Bylas is 3.68 persons per family, with married-couple families (109 | 29.5%) accounting for the largest median family size of 4.98 persons per family. On the other hand, single male/father families (45 | 12.2%) represent the smallest median family size with 3.00 persons per family.
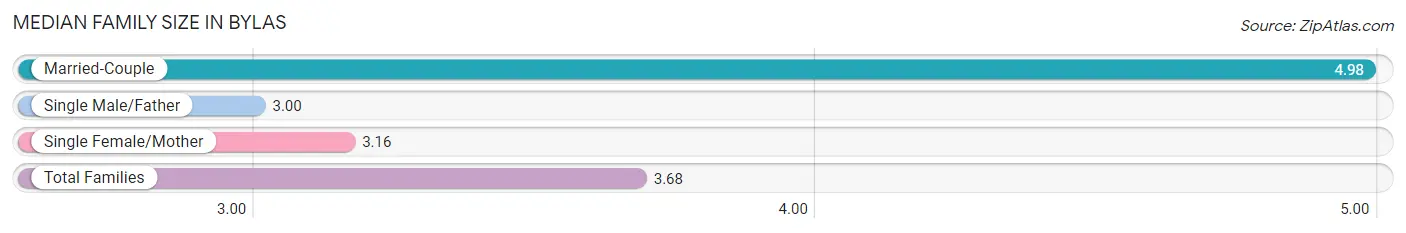
| Family Type | # Families | Family Size |
| Married-Couple | 109 (29.5%) | 4.98 |
| Single Male/Father | 45 (12.2%) | 3.00 |
| Single Female/Mother | 216 (58.4%) | 3.16 |
| Total Families | 370 (100.0%) | 3.68 |
Median Household Size in Bylas
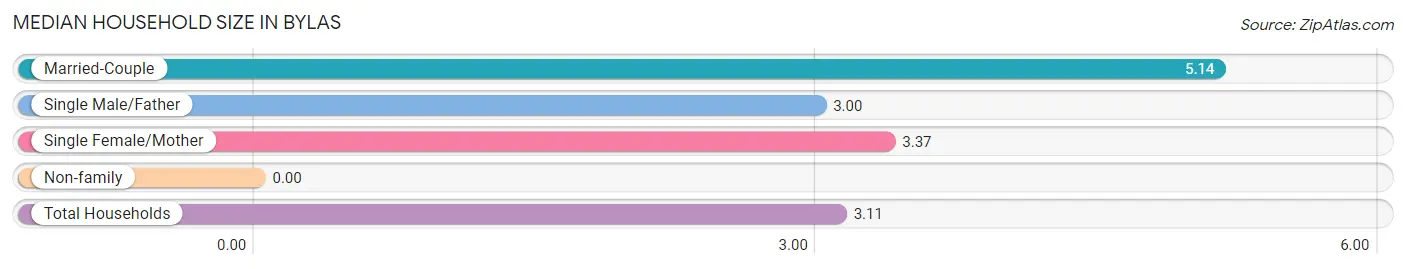
| Household Type | # Households | Household Size |
| Married-Couple | 109 (21.8%) | 5.14 |
| Single Male/Father | 45 (9.0%) | 3.00 |
| Single Female/Mother | 216 (43.3%) | 3.37 |
| Non-family | 129 (25.9%) | - |
| Total Households | 499 (100.0%) | 3.11 |
Household Size by Marriage Status in Bylas
Out of a total of 499 households in Bylas, 370 (74.2%) are family households, while 129 (25.9%) are nonfamily households. The most numerous type of family households are 3-person households, comprising 116, and the most common type of nonfamily households are 1-person households, comprising 129.
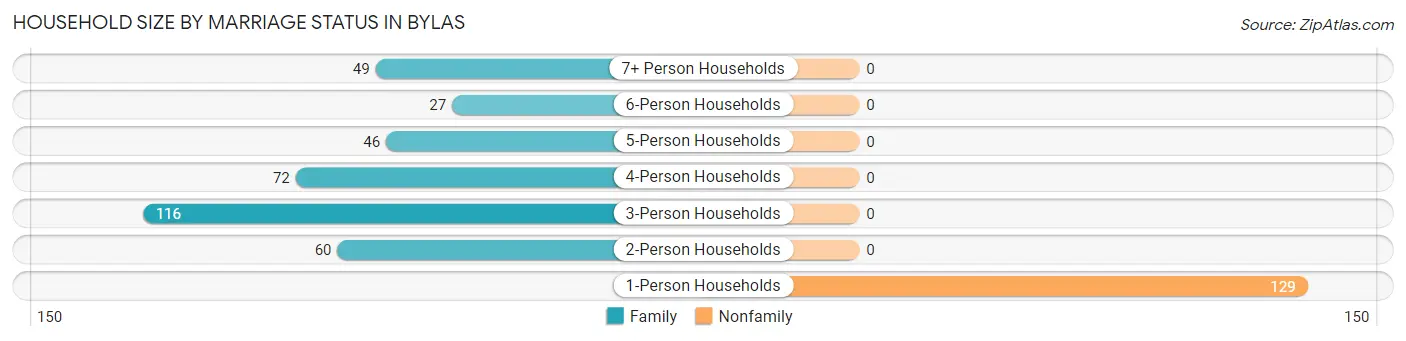
| Household Size | Family Households | Nonfamily Households |
| 1-Person Households | - | 129 (25.9%) |
| 2-Person Households | 60 (12.0%) | 0 (0.0%) |
| 3-Person Households | 116 (23.3%) | 0 (0.0%) |
| 4-Person Households | 72 (14.4%) | 0 (0.0%) |
| 5-Person Households | 46 (9.2%) | 0 (0.0%) |
| 6-Person Households | 27 (5.4%) | 0 (0.0%) |
| 7+ Person Households | 49 (9.8%) | 0 (0.0%) |
| Total | 370 (74.2%) | 129 (25.9%) |
Female Fertility in Bylas
Fertility by Age in Bylas
Average fertility rate in Bylas is 35.0 births per 1,000 women. Women in the age bracket of 20 to 34 years have the highest fertility rate with 76.0 births per 1,000 women. Women in the age bracket of 20 to 34 years acount for 100.0% of all women with births.
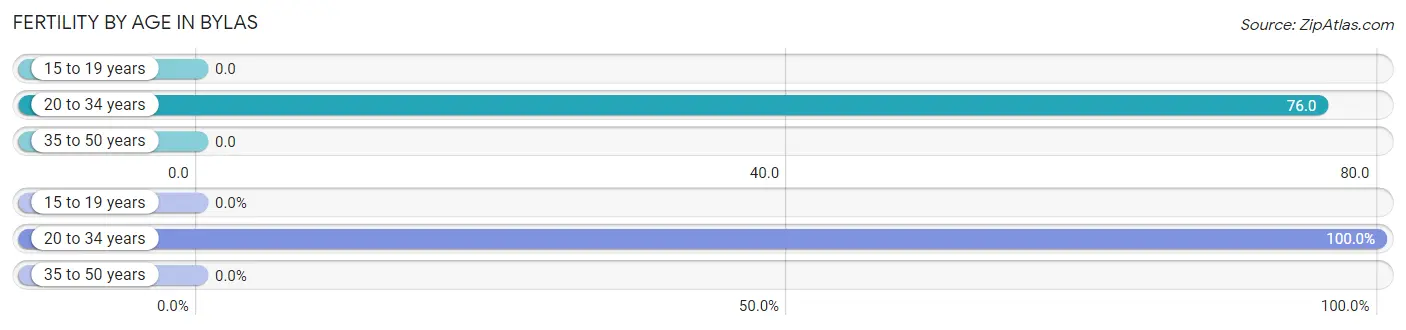
| Age Bracket | Women with Births | Births / 1,000 Women |
| 15 to 19 years | 0 (0.0%) | 0.0 |
| 20 to 34 years | 10 (100.0%) | 76.0 |
| 35 to 50 years | 0 (0.0%) | 0.0 |
| Total | 10 (100.0%) | 35.0 |
Fertility by Age by Marriage Status in Bylas
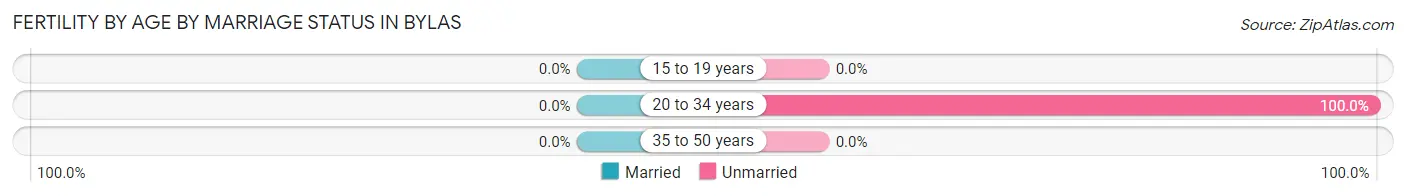
| Age Bracket | Married | Unmarried |
| 15 to 19 years | 0 (0.0%) | 0 (0.0%) |
| 20 to 34 years | 0 (0.0%) | 10 (100.0%) |
| 35 to 50 years | 0 (0.0%) | 0 (0.0%) |
| Total | 0 (0.0%) | 10 (100.0%) |
Fertility by Education in Bylas
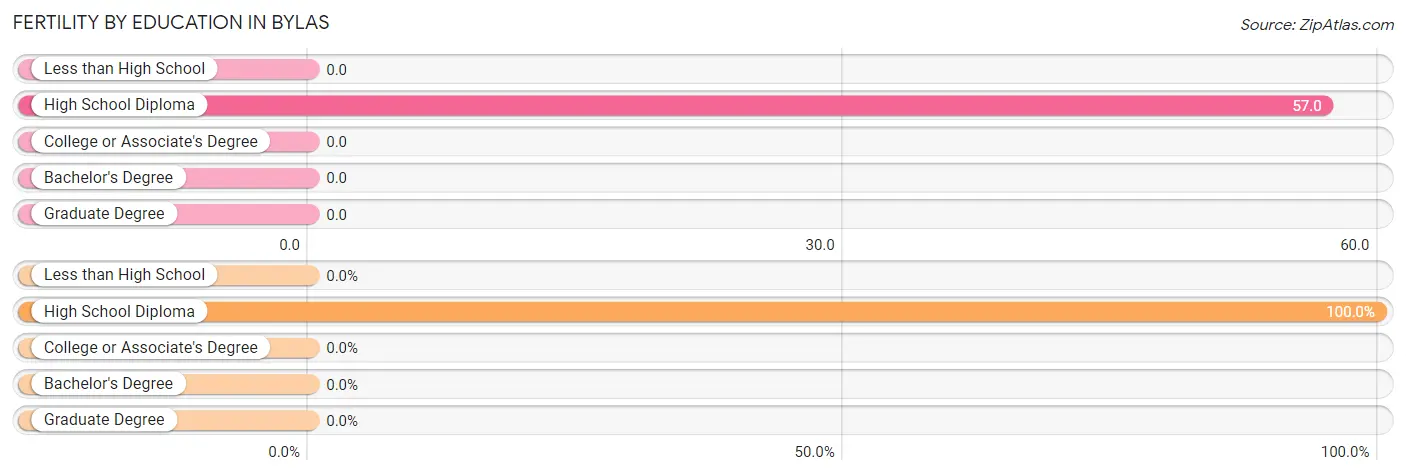
| Educational Attainment | Women with Births | Births / 1,000 Women |
| Less than High School | 0 (0.0%) | 0.0 |
| High School Diploma | 10 (100.0%) | 57.0 |
| College or Associate's Degree | 0 (0.0%) | 0.0 |
| Bachelor's Degree | 0 (0.0%) | 0.0 |
| Graduate Degree | 0 (0.0%) | 0.0 |
| Total | 10 (100.0%) | 35.0 |
Fertility by Education by Marriage Status in Bylas
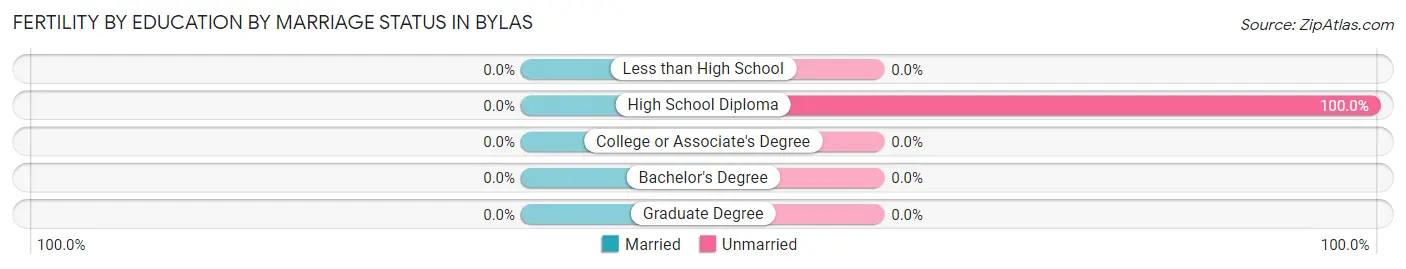
| Educational Attainment | Married | Unmarried |
| Less than High School | 0 (0.0%) | 0 (0.0%) |
| High School Diploma | 0 (0.0%) | 10 (100.0%) |
| College or Associate's Degree | 0 (0.0%) | 0 (0.0%) |
| Bachelor's Degree | 0 (0.0%) | 0 (0.0%) |
| Graduate Degree | 0 (0.0%) | 0 (0.0%) |
| Total | 0 (0.0%) | 10 (100.0%) |
Employment Characteristics in Bylas
Employment by Class of Employer in Bylas
Among the 354 employed individuals in Bylas, private company employees (225 | 63.6%), local government employees (60 | 17.0%), and state government employees (44 | 12.4%) make up the most common classes of employment.
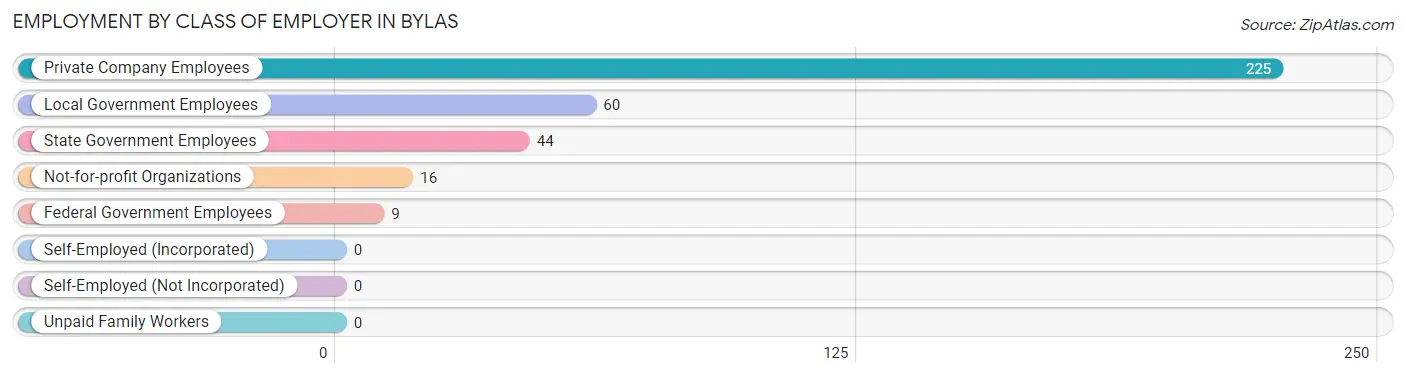
| Employer Class | # Employees | % Employees |
| Private Company Employees | 225 | 63.6% |
| Self-Employed (Incorporated) | 0 | 0.0% |
| Self-Employed (Not Incorporated) | 0 | 0.0% |
| Not-for-profit Organizations | 16 | 4.5% |
| Local Government Employees | 60 | 17.0% |
| State Government Employees | 44 | 12.4% |
| Federal Government Employees | 9 | 2.5% |
| Unpaid Family Workers | 0 | 0.0% |
| Total | 354 | 100.0% |
Employment Status by Age in Bylas
According to the labor force statistics for Bylas, out of the total population over 16 years of age (1,145), 35.2% or 403 individuals are in the labor force, with 12.2% or 49 of them unemployed. The age group with the highest labor force participation rate is 20 to 24 years, with 100.0% or 26 individuals in the labor force. Within the labor force, the 25 to 29 years age range has the highest percentage of unemployed individuals, with 36.5% or 35 of them being unemployed.
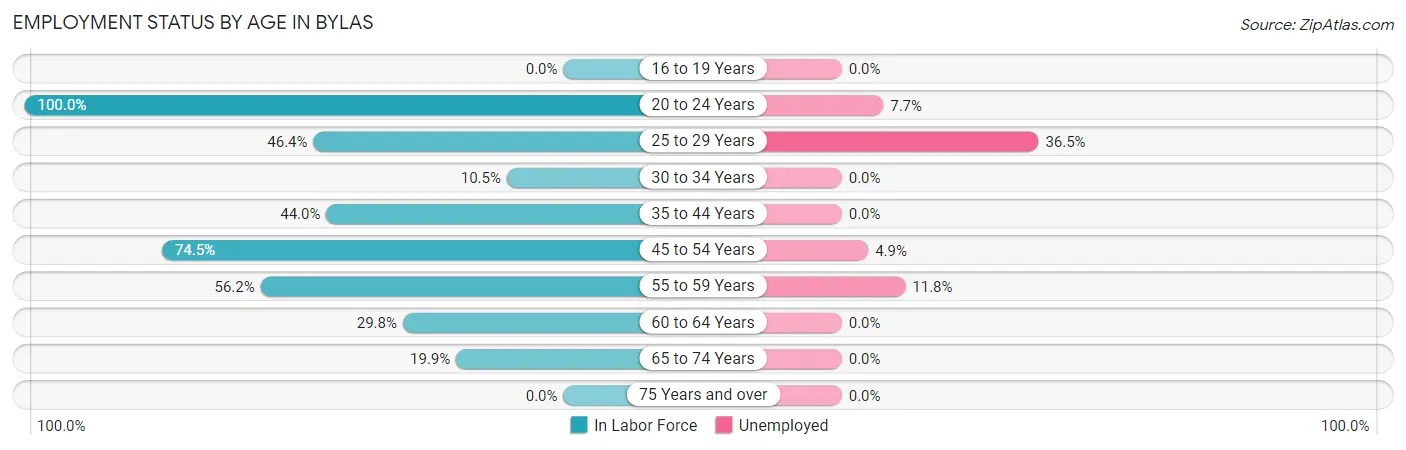
| Age Bracket | In Labor Force | Unemployed |
| 16 to 19 Years | 0 (0.0%) | 0 (0.0%) |
| 20 to 24 Years | 26 (100.0%) | 2 (7.7%) |
| 25 to 29 Years | 96 (46.4%) | 35 (36.5%) |
| 30 to 34 Years | 4 (10.5%) | 0 (0.0%) |
| 35 to 44 Years | 62 (44.0%) | 0 (0.0%) |
| 45 to 54 Years | 82 (74.5%) | 4 (4.9%) |
| 55 to 59 Years | 68 (56.2%) | 8 (11.8%) |
| 60 to 64 Years | 34 (29.8%) | 0 (0.0%) |
| 65 to 74 Years | 31 (19.9%) | 0 (0.0%) |
| 75 Years and over | 0 (0.0%) | 0 (0.0%) |
| Total | 403 (35.2%) | 49 (12.2%) |
Employment Status by Educational Attainment in Bylas
According to labor force statistics for Bylas, 47.3% of individuals (346) out of the total population between 25 and 64 years of age (731) are in the labor force, with 13.6% or 47 of them being unemployed. The group with the highest labor force participation rate are those with the educational attainment of bachelor's degree or higher, with 63.6% or 7 individuals in the labor force. Within the labor force, individuals with less than high school education have the highest percentage of unemployment, with 50.8% or 30 of them being unemployed.
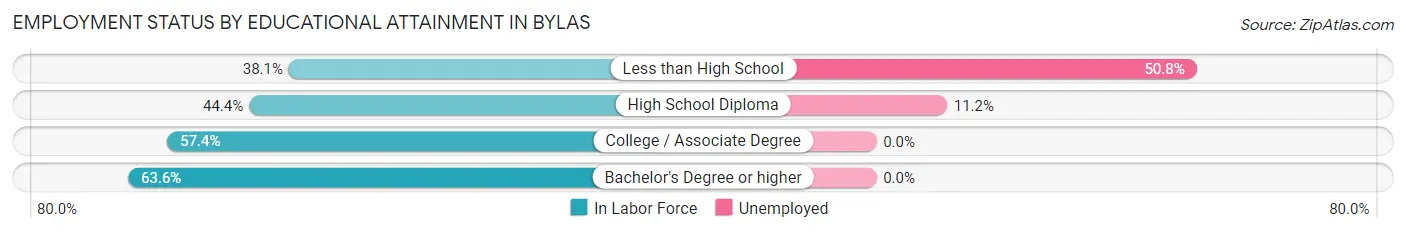
| Educational Attainment | In Labor Force | Unemployed |
| Less than High School | 59 (38.1%) | 79 (50.8%) |
| High School Diploma | 152 (44.4%) | 38 (11.2%) |
| College / Associate Degree | 128 (57.4%) | 0 (0.0%) |
| Bachelor's Degree or higher | 7 (63.6%) | 0 (0.0%) |
| Total | 346 (47.3%) | 99 (13.6%) |
Employment Occupations by Sex in Bylas
Management, Business, Science and Arts Occupations
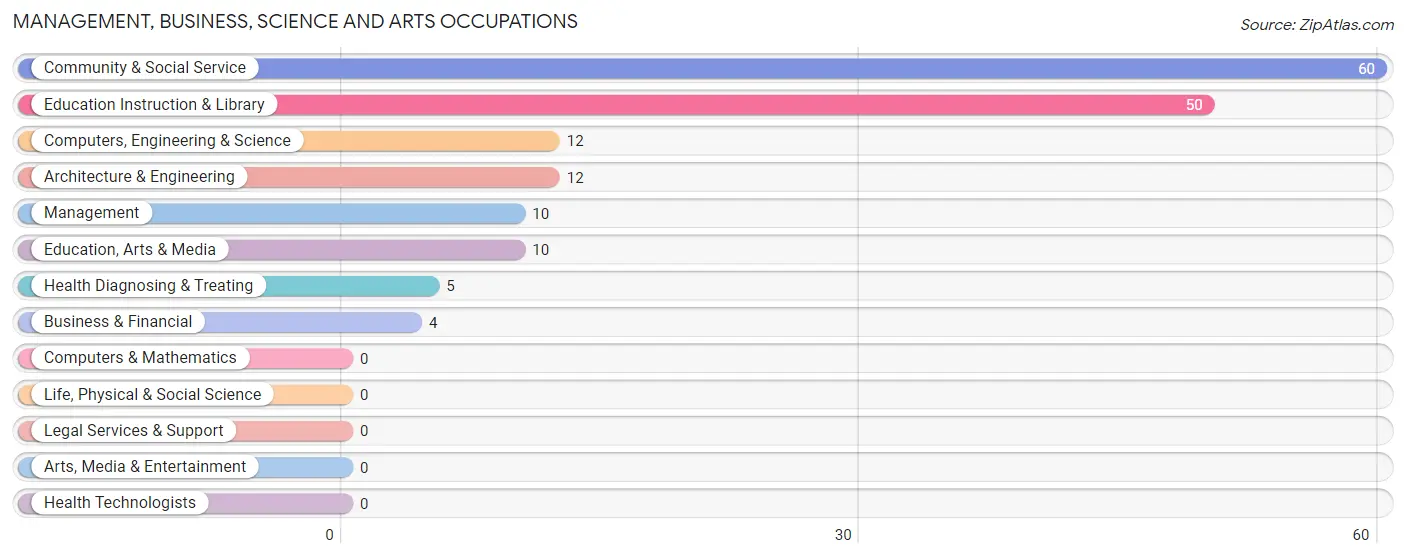
The most common Management, Business, Science and Arts occupations in Bylas are Community & Social Service (60 | 17.0%), Education Instruction & Library (50 | 14.1%), Computers, Engineering & Science (12 | 3.4%), Architecture & Engineering (12 | 3.4%), and Management (10 | 2.8%).
Management, Business, Science and Arts Occupations by Sex
Within the Management, Business, Science and Arts occupations in Bylas, the most male-oriented occupations are Computers, Engineering & Science (100.0%), Architecture & Engineering (100.0%), and Health Diagnosing & Treating (100.0%), while the most female-oriented occupations are Business & Financial (100.0%), Management (60.0%), and Education, Arts & Media (50.0%).
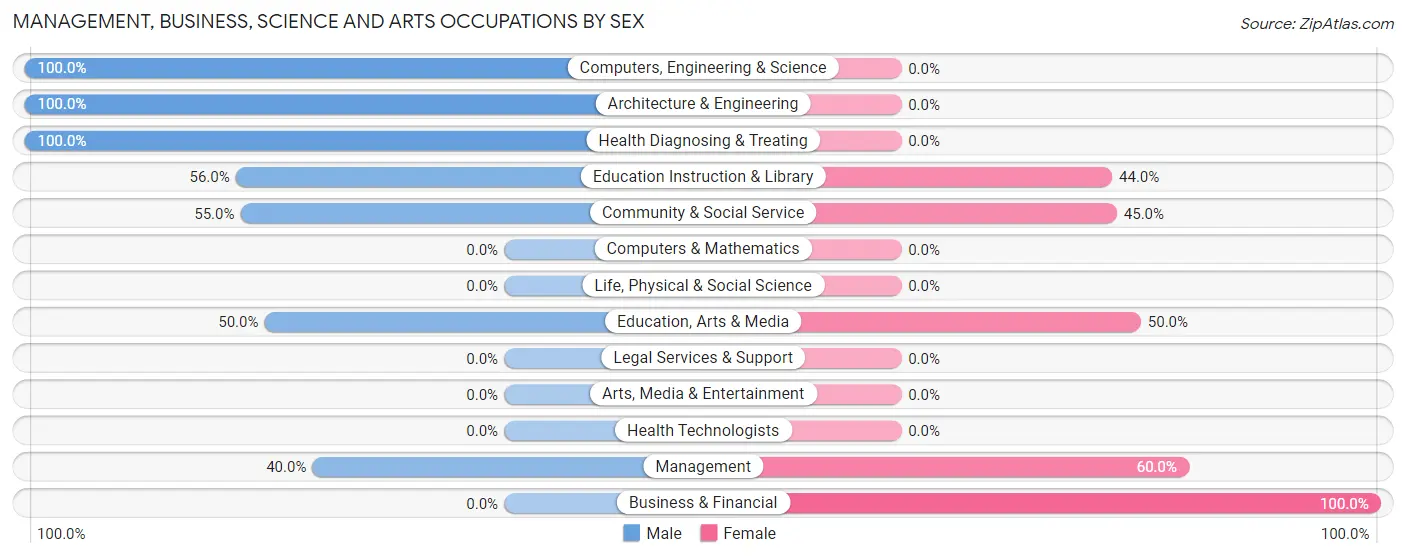
| Occupation | Male | Female |
| Management | 4 (40.0%) | 6 (60.0%) |
| Business & Financial | 0 (0.0%) | 4 (100.0%) |
| Computers, Engineering & Science | 12 (100.0%) | 0 (0.0%) |
| Computers & Mathematics | 0 (0.0%) | 0 (0.0%) |
| Architecture & Engineering | 12 (100.0%) | 0 (0.0%) |
| Life, Physical & Social Science | 0 (0.0%) | 0 (0.0%) |
| Community & Social Service | 33 (55.0%) | 27 (45.0%) |
| Education, Arts & Media | 5 (50.0%) | 5 (50.0%) |
| Legal Services & Support | 0 (0.0%) | 0 (0.0%) |
| Education Instruction & Library | 28 (56.0%) | 22 (44.0%) |
| Arts, Media & Entertainment | 0 (0.0%) | 0 (0.0%) |
| Health Diagnosing & Treating | 5 (100.0%) | 0 (0.0%) |
| Health Technologists | 0 (0.0%) | 0 (0.0%) |
| Total (Category) | 54 (59.3%) | 37 (40.7%) |
| Total (Overall) | 179 (50.6%) | 175 (49.4%) |
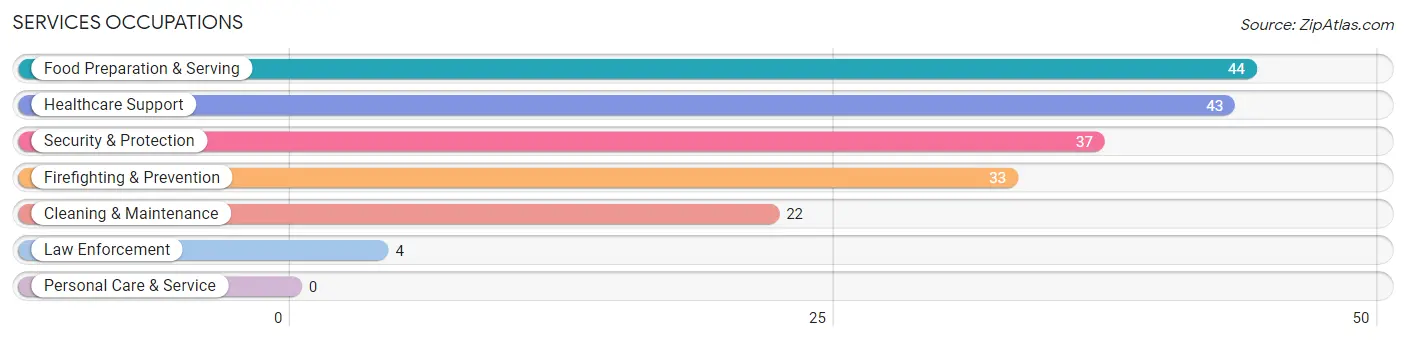
Services Occupations
The most common Services occupations in Bylas are Food Preparation & Serving (44 | 12.4%), Healthcare Support (43 | 12.1%), Security & Protection (37 | 10.4%), Firefighting & Prevention (33 | 9.3%), and Cleaning & Maintenance (22 | 6.2%).
Services Occupations by Sex
Within the Services occupations in Bylas, the most male-oriented occupations are Security & Protection (100.0%), Firefighting & Prevention (100.0%), and Law Enforcement (100.0%), while the most female-oriented occupations are Healthcare Support (100.0%), Food Preparation & Serving (100.0%), and Cleaning & Maintenance (40.9%).
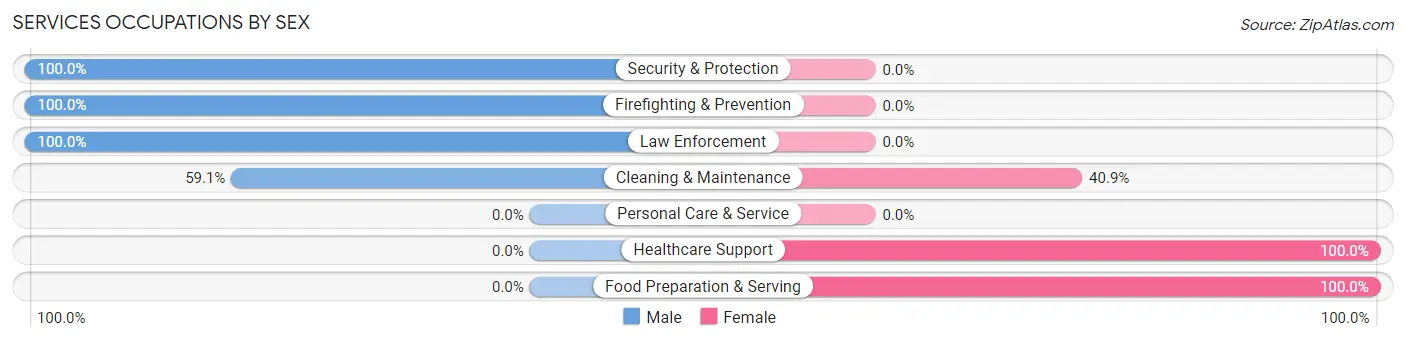
| Occupation | Male | Female |
| Healthcare Support | 0 (0.0%) | 43 (100.0%) |
| Security & Protection | 37 (100.0%) | 0 (0.0%) |
| Firefighting & Prevention | 33 (100.0%) | 0 (0.0%) |
| Law Enforcement | 4 (100.0%) | 0 (0.0%) |
| Food Preparation & Serving | 0 (0.0%) | 44 (100.0%) |
| Cleaning & Maintenance | 13 (59.1%) | 9 (40.9%) |
| Personal Care & Service | 0 (0.0%) | 0 (0.0%) |
| Total (Category) | 50 (34.3%) | 96 (65.7%) |
| Total (Overall) | 179 (50.6%) | 175 (49.4%) |
Sales and Office Occupations
The most common Sales and Office occupations in Bylas are , and Office & Administration (28 | 7.9%).
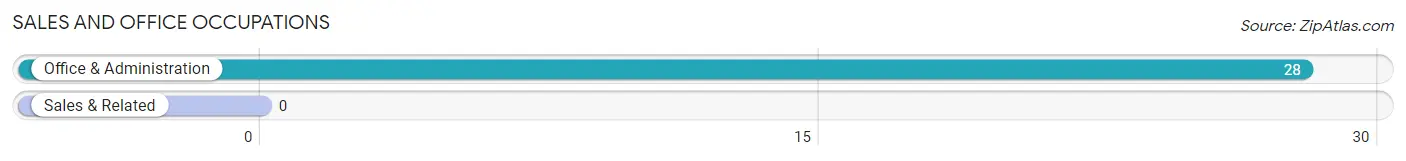
Sales and Office Occupations by Sex
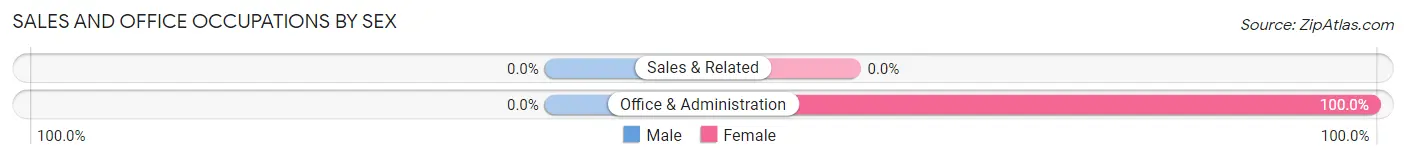
| Occupation | Male | Female |
| Sales & Related | 0 (0.0%) | 0 (0.0%) |
| Office & Administration | 0 (0.0%) | 28 (100.0%) |
| Total (Category) | 0 (0.0%) | 28 (100.0%) |
| Total (Overall) | 179 (50.6%) | 175 (49.4%) |
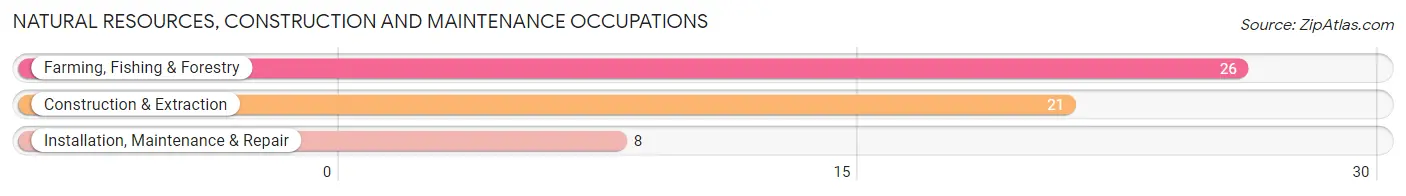
Natural Resources, Construction and Maintenance Occupations
The most common Natural Resources, Construction and Maintenance occupations in Bylas are Farming, Fishing & Forestry (26 | 7.3%), Construction & Extraction (21 | 5.9%), and Installation, Maintenance & Repair (8 | 2.3%).
Natural Resources, Construction and Maintenance Occupations by Sex
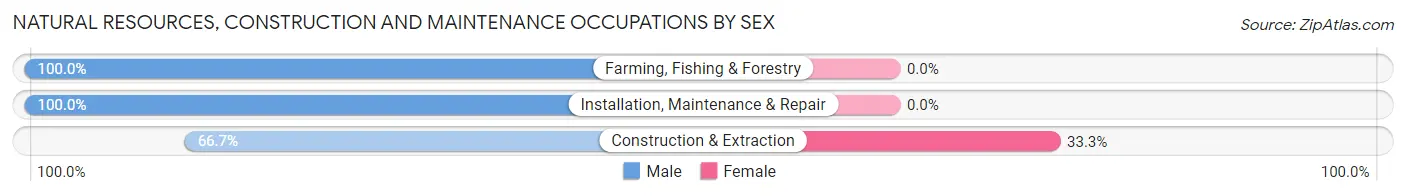
| Occupation | Male | Female |
| Farming, Fishing & Forestry | 26 (100.0%) | 0 (0.0%) |
| Construction & Extraction | 14 (66.7%) | 7 (33.3%) |
| Installation, Maintenance & Repair | 8 (100.0%) | 0 (0.0%) |
| Total (Category) | 48 (87.3%) | 7 (12.7%) |
| Total (Overall) | 179 (50.6%) | 175 (49.4%) |
Production, Transportation and Moving Occupations
The most common Production, Transportation and Moving occupations in Bylas are Production (30 | 8.5%), and Transportation (4 | 1.1%).
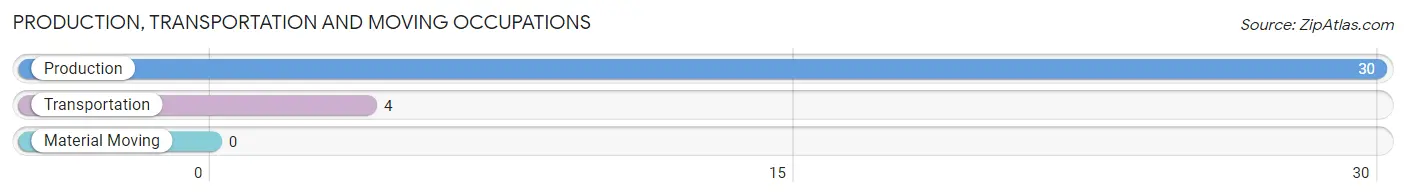
Production, Transportation and Moving Occupations by Sex
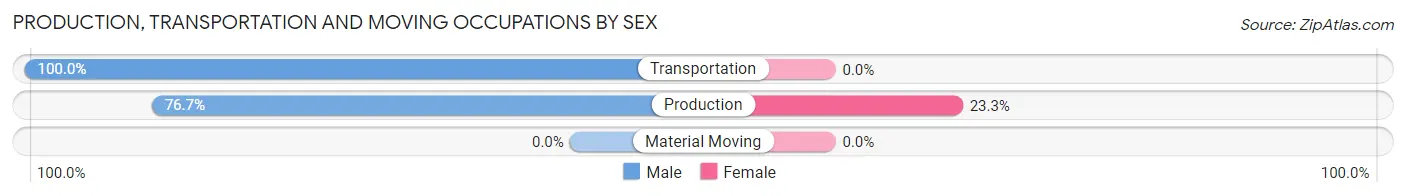
| Occupation | Male | Female |
| Production | 23 (76.7%) | 7 (23.3%) |
| Transportation | 4 (100.0%) | 0 (0.0%) |
| Material Moving | 0 (0.0%) | 0 (0.0%) |
| Total (Category) | 27 (79.4%) | 7 (20.6%) |
| Total (Overall) | 179 (50.6%) | 175 (49.4%) |
Employment Industries by Sex in Bylas
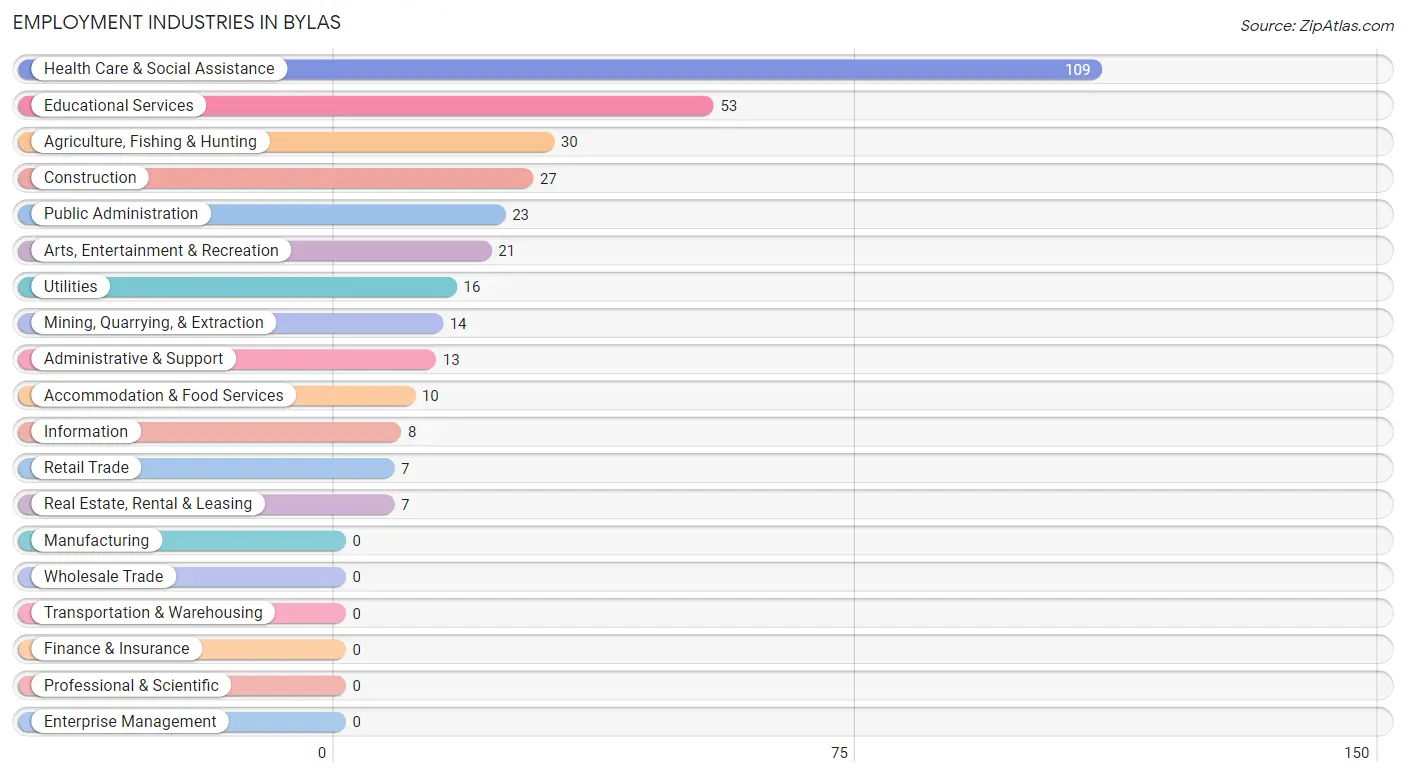
Employment Industries in Bylas
The major employment industries in Bylas include Health Care & Social Assistance (109 | 30.8%), Educational Services (53 | 15.0%), Agriculture, Fishing & Hunting (30 | 8.5%), Construction (27 | 7.6%), and Public Administration (23 | 6.5%).
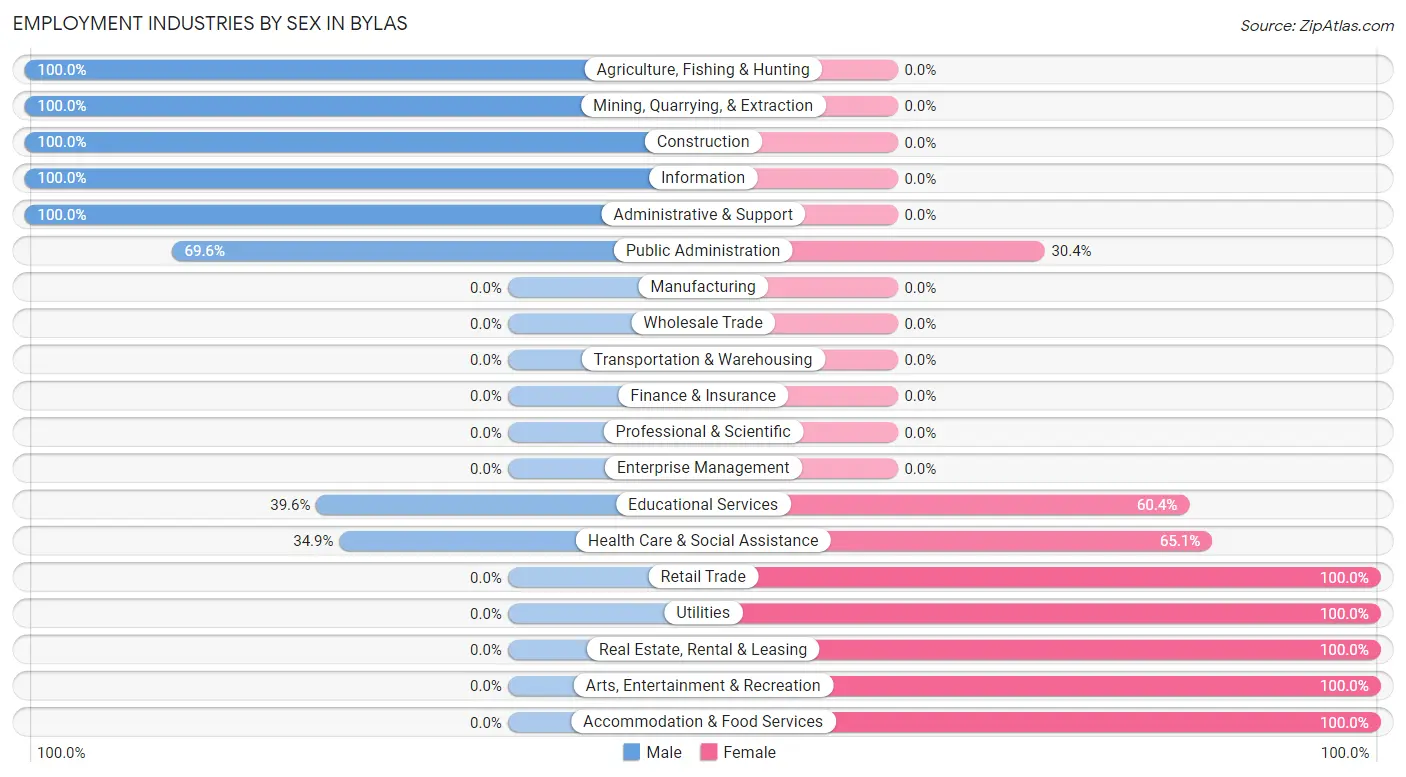
Employment Industries by Sex in Bylas
The Bylas industries that see more men than women are Agriculture, Fishing & Hunting (100.0%), Mining, Quarrying, & Extraction (100.0%), and Construction (100.0%), whereas the industries that tend to have a higher number of women are Retail Trade (100.0%), Utilities (100.0%), and Real Estate, Rental & Leasing (100.0%).
| Industry | Male | Female |
| Agriculture, Fishing & Hunting | 30 (100.0%) | 0 (0.0%) |
| Mining, Quarrying, & Extraction | 14 (100.0%) | 0 (0.0%) |
| Construction | 27 (100.0%) | 0 (0.0%) |
| Manufacturing | 0 (0.0%) | 0 (0.0%) |
| Wholesale Trade | 0 (0.0%) | 0 (0.0%) |
| Retail Trade | 0 (0.0%) | 7 (100.0%) |
| Transportation & Warehousing | 0 (0.0%) | 0 (0.0%) |
| Utilities | 0 (0.0%) | 16 (100.0%) |
| Information | 8 (100.0%) | 0 (0.0%) |
| Finance & Insurance | 0 (0.0%) | 0 (0.0%) |
| Real Estate, Rental & Leasing | 0 (0.0%) | 7 (100.0%) |
| Professional & Scientific | 0 (0.0%) | 0 (0.0%) |
| Enterprise Management | 0 (0.0%) | 0 (0.0%) |
| Administrative & Support | 13 (100.0%) | 0 (0.0%) |
| Educational Services | 21 (39.6%) | 32 (60.4%) |
| Health Care & Social Assistance | 38 (34.9%) | 71 (65.1%) |
| Arts, Entertainment & Recreation | 0 (0.0%) | 21 (100.0%) |
| Accommodation & Food Services | 0 (0.0%) | 10 (100.0%) |
| Public Administration | 16 (69.6%) | 7 (30.4%) |
| Total | 179 (50.6%) | 175 (49.4%) |
Education in Bylas
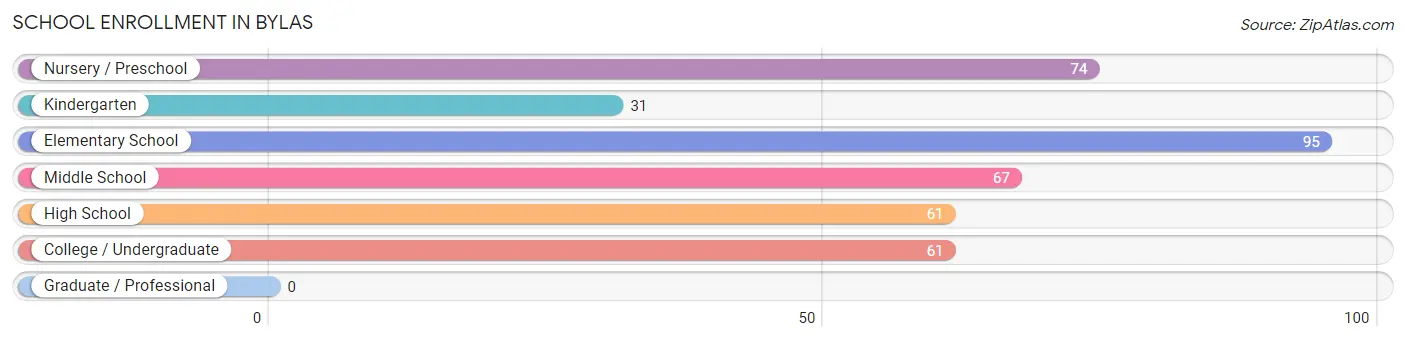
School Enrollment in Bylas
The most common levels of schooling among the 389 students in Bylas are elementary school (95 | 24.4%), nursery / preschool (74 | 19.0%), and middle school (67 | 17.2%).
| School Level | # Students | % Students |
| Nursery / Preschool | 74 | 19.0% |
| Kindergarten | 31 | 8.0% |
| Elementary School | 95 | 24.4% |
| Middle School | 67 | 17.2% |
| High School | 61 | 15.7% |
| College / Undergraduate | 61 | 15.7% |
| Graduate / Professional | 0 | 0.0% |
| Total | 389 | 100.0% |
School Enrollment by Age by Funding Source in Bylas
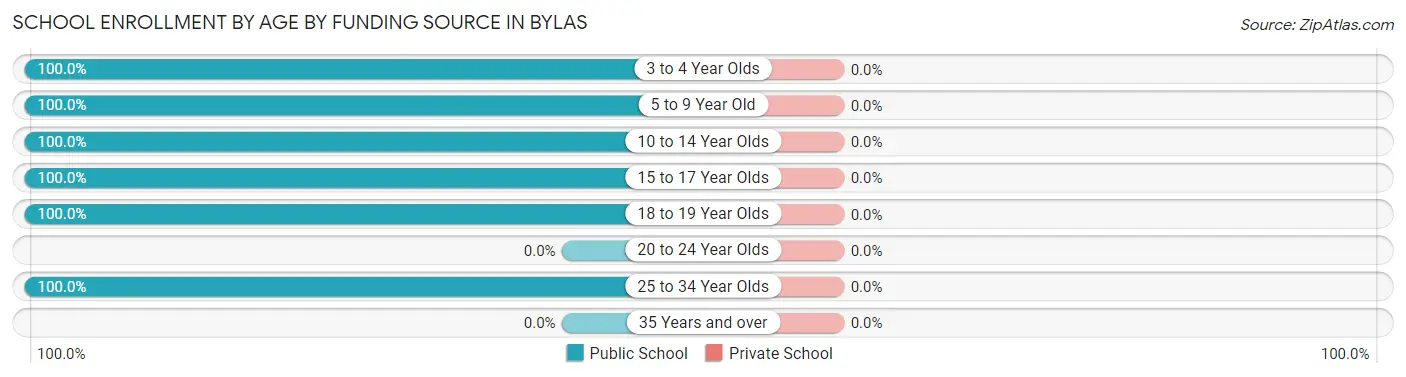
| Age Bracket | Public School | Private School |
| 3 to 4 Year Olds | 63 (100.0%) | 0 (0.0%) |
| 5 to 9 Year Old | 114 (100.0%) | 0 (0.0%) |
| 10 to 14 Year Olds | 96 (100.0%) | 0 (0.0%) |
| 15 to 17 Year Olds | 42 (100.0%) | 0 (0.0%) |
| 18 to 19 Year Olds | 44 (100.0%) | 0 (0.0%) |
| 20 to 24 Year Olds | 0 (0.0%) | 0 (0.0%) |
| 25 to 34 Year Olds | 30 (100.0%) | 0 (0.0%) |
| 35 Years and over | 0 (0.0%) | 0 (0.0%) |
| Total | 389 (100.0%) | 0 (0.0%) |
Educational Attainment by Field of Study in Bylas
Education (11 | 47.8%), social sciences (8 | 34.8%), and business (4 | 17.4%) are the most common fields of study among 23 individuals in Bylas who have obtained a bachelor's degree or higher.
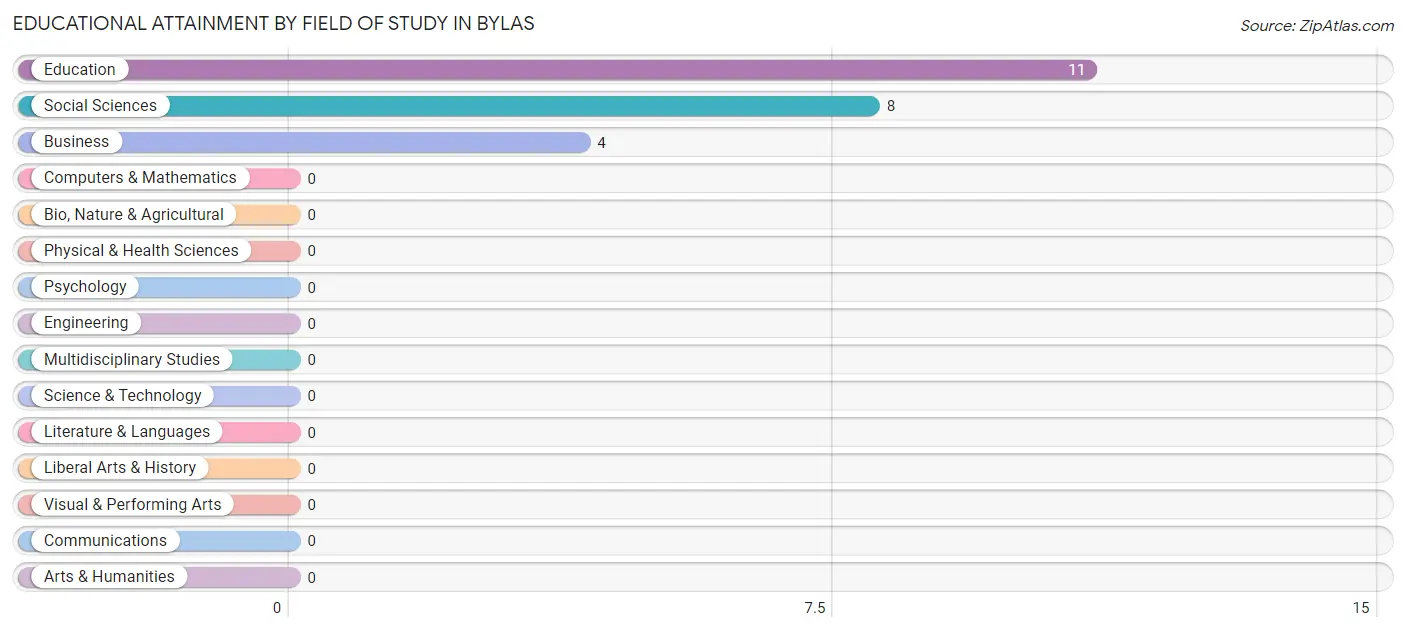
| Field of Study | # Graduates | % Graduates |
| Computers & Mathematics | 0 | 0.0% |
| Bio, Nature & Agricultural | 0 | 0.0% |
| Physical & Health Sciences | 0 | 0.0% |
| Psychology | 0 | 0.0% |
| Social Sciences | 8 | 34.8% |
| Engineering | 0 | 0.0% |
| Multidisciplinary Studies | 0 | 0.0% |
| Science & Technology | 0 | 0.0% |
| Business | 4 | 17.4% |
| Education | 11 | 47.8% |
| Literature & Languages | 0 | 0.0% |
| Liberal Arts & History | 0 | 0.0% |
| Visual & Performing Arts | 0 | 0.0% |
| Communications | 0 | 0.0% |
| Arts & Humanities | 0 | 0.0% |
| Total | 23 | 100.0% |
Transportation & Commute in Bylas
Vehicle Availability by Sex in Bylas
The most prevalent vehicle ownership categories in Bylas are males with 1 vehicle (81, accounting for 45.3%) and females with 1 vehicle (72, making up 46.3%).
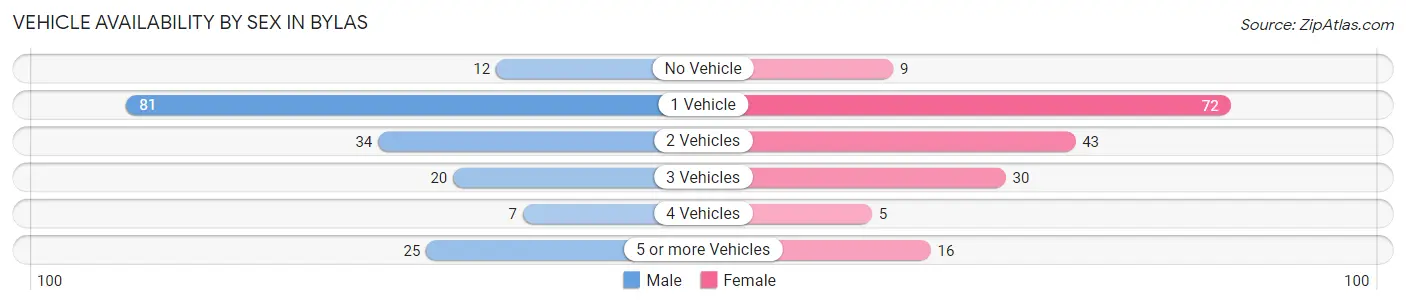
| Vehicles Available | Male | Female |
| No Vehicle | 12 (6.7%) | 9 (5.1%) |
| 1 Vehicle | 81 (45.3%) | 72 (41.1%) |
| 2 Vehicles | 34 (19.0%) | 43 (24.6%) |
| 3 Vehicles | 20 (11.2%) | 30 (17.1%) |
| 4 Vehicles | 7 (3.9%) | 5 (2.9%) |
| 5 or more Vehicles | 25 (14.0%) | 16 (9.1%) |
| Total | 179 (100.0%) | 175 (100.0%) |
Commute Time in Bylas
The most frequently occuring commute durations in Bylas are 15 to 19 minutes (69 commuters, 20.6%), 30 to 34 minutes (67 commuters, 20.0%), and 5 to 9 minutes (52 commuters, 15.5%).
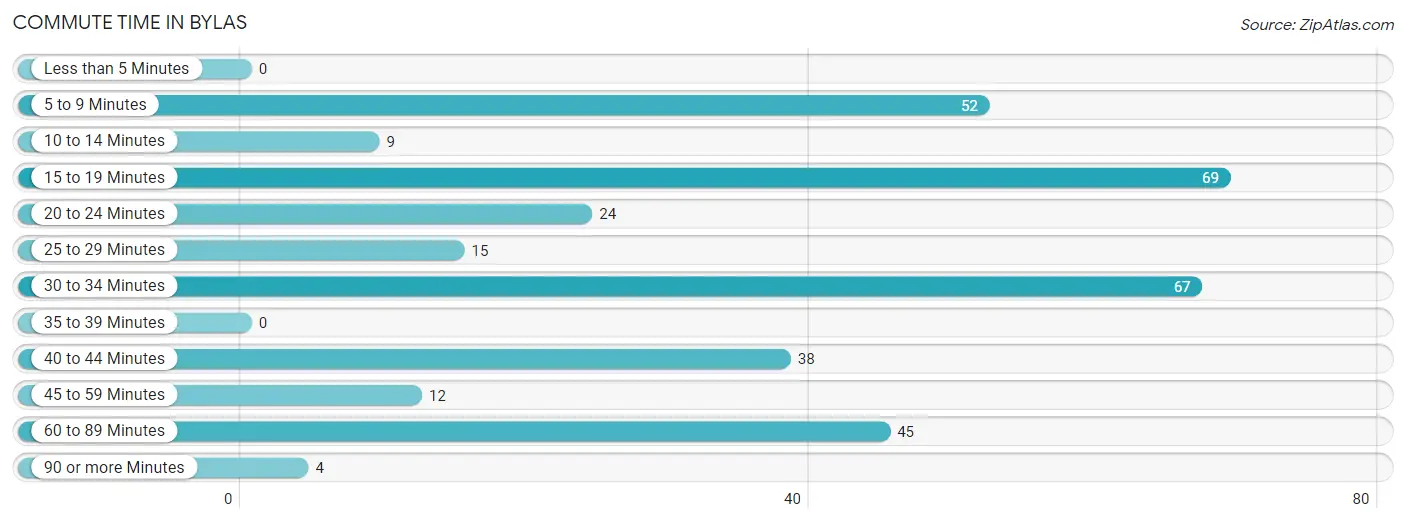
| Commute Time | # Commuters | % Commuters |
| Less than 5 Minutes | 0 | 0.0% |
| 5 to 9 Minutes | 52 | 15.5% |
| 10 to 14 Minutes | 9 | 2.7% |
| 15 to 19 Minutes | 69 | 20.6% |
| 20 to 24 Minutes | 24 | 7.2% |
| 25 to 29 Minutes | 15 | 4.5% |
| 30 to 34 Minutes | 67 | 20.0% |
| 35 to 39 Minutes | 0 | 0.0% |
| 40 to 44 Minutes | 38 | 11.3% |
| 45 to 59 Minutes | 12 | 3.6% |
| 60 to 89 Minutes | 45 | 13.4% |
| 90 or more Minutes | 4 | 1.2% |
Commute Time by Sex in Bylas
The most common commute times in Bylas are 15 to 19 minutes (65 commuters, 36.3%) for males and 5 to 9 minutes (48 commuters, 30.8%) for females.
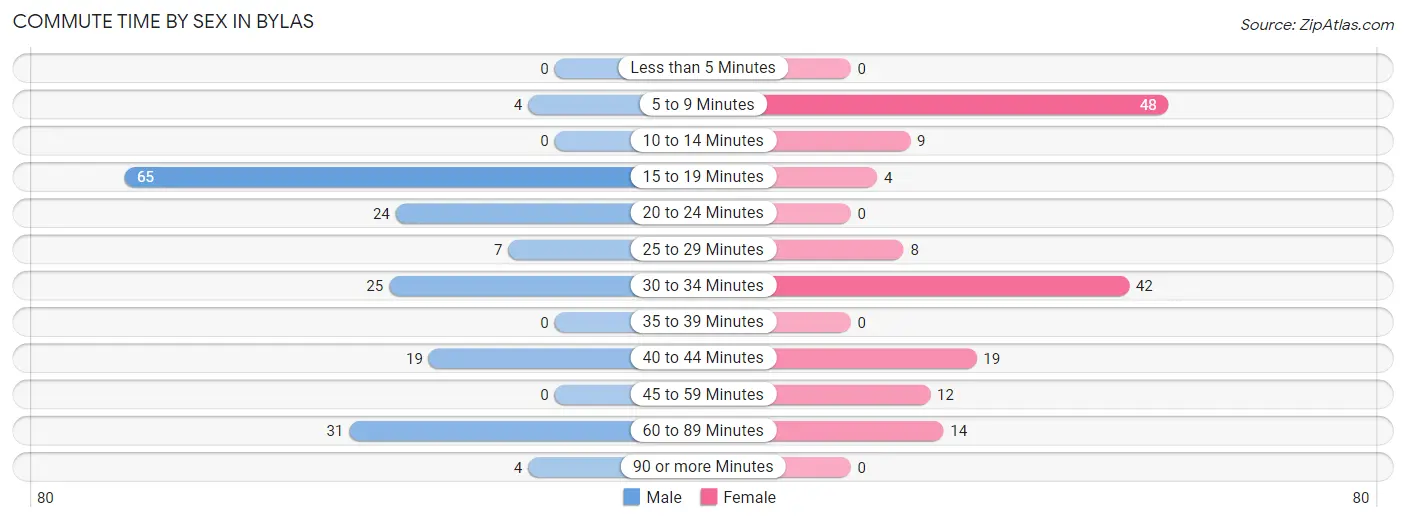
| Commute Time | Male | Female |
| Less than 5 Minutes | 0 (0.0%) | 0 (0.0%) |
| 5 to 9 Minutes | 4 (2.2%) | 48 (30.8%) |
| 10 to 14 Minutes | 0 (0.0%) | 9 (5.8%) |
| 15 to 19 Minutes | 65 (36.3%) | 4 (2.6%) |
| 20 to 24 Minutes | 24 (13.4%) | 0 (0.0%) |
| 25 to 29 Minutes | 7 (3.9%) | 8 (5.1%) |
| 30 to 34 Minutes | 25 (14.0%) | 42 (26.9%) |
| 35 to 39 Minutes | 0 (0.0%) | 0 (0.0%) |
| 40 to 44 Minutes | 19 (10.6%) | 19 (12.2%) |
| 45 to 59 Minutes | 0 (0.0%) | 12 (7.7%) |
| 60 to 89 Minutes | 31 (17.3%) | 14 (9.0%) |
| 90 or more Minutes | 4 (2.2%) | 0 (0.0%) |
Time of Departure to Work by Sex in Bylas
The most frequent times of departure to work in Bylas are 6:00 AM to 6:29 AM (41, 22.9%) for males and 8:00 AM to 8:29 AM (54, 34.6%) for females.
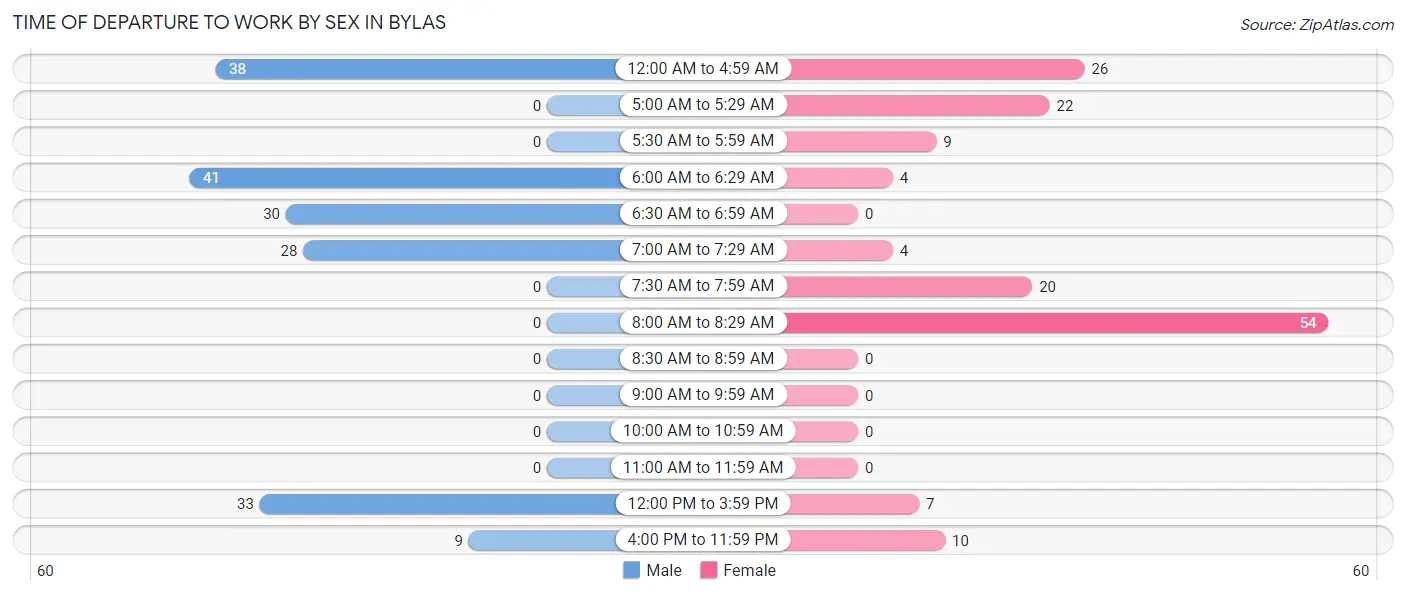
| Time of Departure | Male | Female |
| 12:00 AM to 4:59 AM | 38 (21.2%) | 26 (16.7%) |
| 5:00 AM to 5:29 AM | 0 (0.0%) | 22 (14.1%) |
| 5:30 AM to 5:59 AM | 0 (0.0%) | 9 (5.8%) |
| 6:00 AM to 6:29 AM | 41 (22.9%) | 4 (2.6%) |
| 6:30 AM to 6:59 AM | 30 (16.8%) | 0 (0.0%) |
| 7:00 AM to 7:29 AM | 28 (15.6%) | 4 (2.6%) |
| 7:30 AM to 7:59 AM | 0 (0.0%) | 20 (12.8%) |
| 8:00 AM to 8:29 AM | 0 (0.0%) | 54 (34.6%) |
| 8:30 AM to 8:59 AM | 0 (0.0%) | 0 (0.0%) |
| 9:00 AM to 9:59 AM | 0 (0.0%) | 0 (0.0%) |
| 10:00 AM to 10:59 AM | 0 (0.0%) | 0 (0.0%) |
| 11:00 AM to 11:59 AM | 0 (0.0%) | 0 (0.0%) |
| 12:00 PM to 3:59 PM | 33 (18.4%) | 7 (4.5%) |
| 4:00 PM to 11:59 PM | 9 (5.0%) | 10 (6.4%) |
| Total | 179 (100.0%) | 156 (100.0%) |
Housing Occupancy in Bylas
Occupancy by Ownership in Bylas
Of the total 499 dwellings in Bylas, owner-occupied units account for 434 (87.0%), while renter-occupied units make up 65 (13.0%).
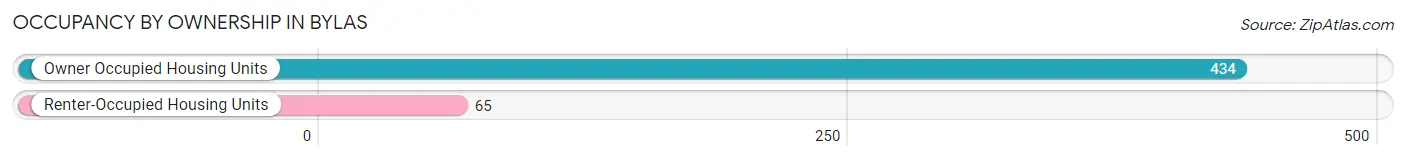
| Occupancy | # Housing Units | % Housing Units |
| Owner Occupied Housing Units | 434 | 87.0% |
| Renter-Occupied Housing Units | 65 | 13.0% |
| Total Occupied Housing Units | 499 | 100.0% |
Occupancy by Household Size in Bylas
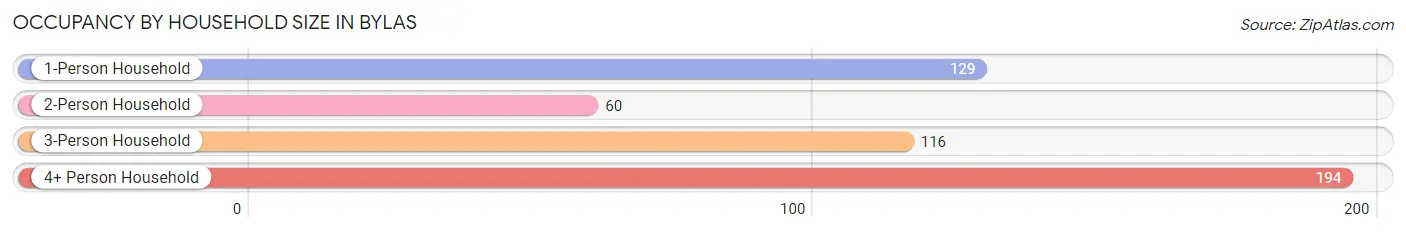
| Household Size | # Housing Units | % Housing Units |
| 1-Person Household | 129 | 25.9% |
| 2-Person Household | 60 | 12.0% |
| 3-Person Household | 116 | 23.3% |
| 4+ Person Household | 194 | 38.9% |
| Total Housing Units | 499 | 100.0% |
Occupancy by Ownership by Household Size in Bylas
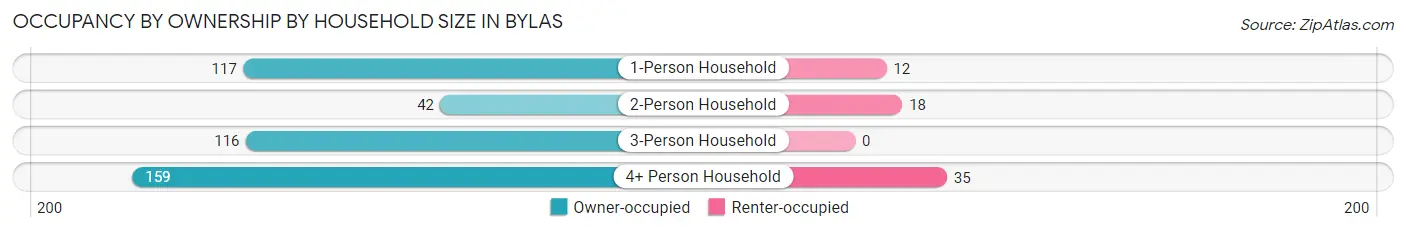
| Household Size | Owner-occupied | Renter-occupied |
| 1-Person Household | 117 (90.7%) | 12 (9.3%) |
| 2-Person Household | 42 (70.0%) | 18 (30.0%) |
| 3-Person Household | 116 (100.0%) | 0 (0.0%) |
| 4+ Person Household | 159 (82.0%) | 35 (18.0%) |
| Total Housing Units | 434 (87.0%) | 65 (13.0%) |
Occupancy by Educational Attainment in Bylas
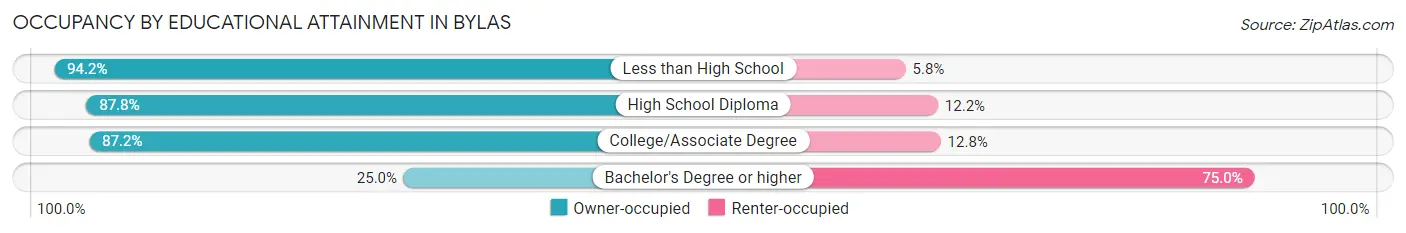
| Household Size | Owner-occupied | Renter-occupied |
| Less than High School | 97 (94.2%) | 6 (5.8%) |
| High School Diploma | 258 (87.8%) | 36 (12.2%) |
| College/Associate Degree | 75 (87.2%) | 11 (12.8%) |
| Bachelor's Degree or higher | 4 (25.0%) | 12 (75.0%) |
Occupancy by Age of Householder in Bylas
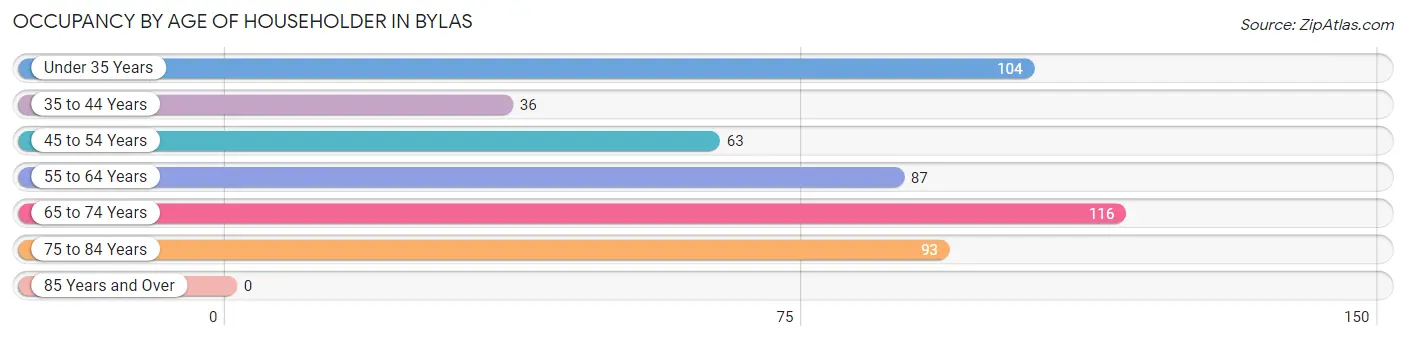
| Age Bracket | # Households | % Households |
| Under 35 Years | 104 | 20.8% |
| 35 to 44 Years | 36 | 7.2% |
| 45 to 54 Years | 63 | 12.6% |
| 55 to 64 Years | 87 | 17.4% |
| 65 to 74 Years | 116 | 23.3% |
| 75 to 84 Years | 93 | 18.6% |
| 85 Years and Over | 0 | 0.0% |
| Total | 499 | 100.0% |
Housing Finances in Bylas
Median Income by Occupancy in Bylas
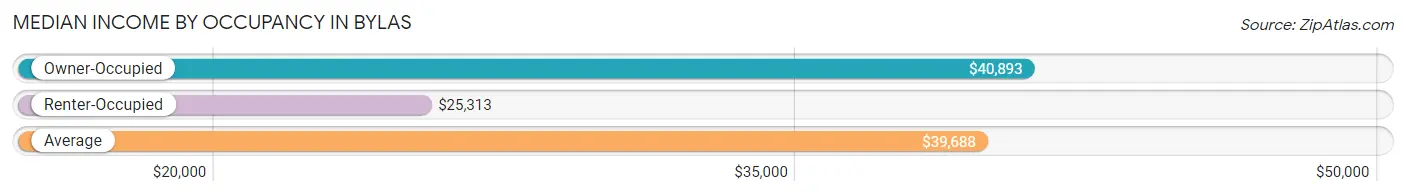
| Occupancy Type | # Households | Median Income |
| Owner-Occupied | 434 (87.0%) | $40,893 |
| Renter-Occupied | 65 (13.0%) | $25,313 |
| Average | 499 (100.0%) | $39,688 |
Occupancy by Householder Income Bracket in Bylas
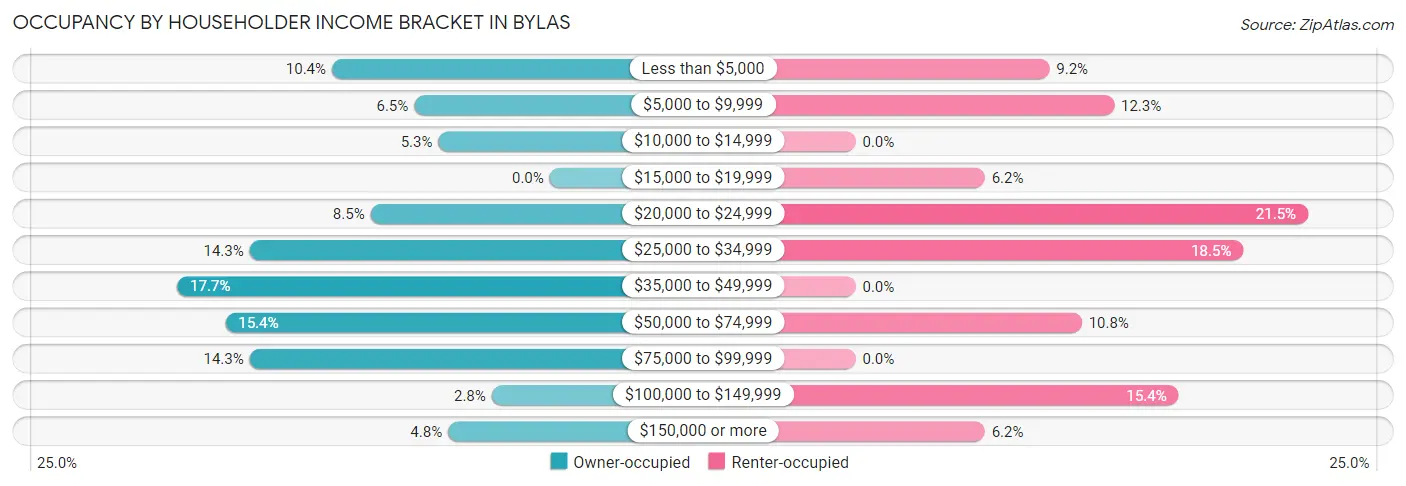
| Income Bracket | Owner-occupied | Renter-occupied |
| Less than $5,000 | 45 (10.4%) | 6 (9.2%) |
| $5,000 to $9,999 | 28 (6.5%) | 8 (12.3%) |
| $10,000 to $14,999 | 23 (5.3%) | 0 (0.0%) |
| $15,000 to $19,999 | 0 (0.0%) | 4 (6.1%) |
| $20,000 to $24,999 | 37 (8.5%) | 14 (21.5%) |
| $25,000 to $34,999 | 62 (14.3%) | 12 (18.5%) |
| $35,000 to $49,999 | 77 (17.7%) | 0 (0.0%) |
| $50,000 to $74,999 | 67 (15.4%) | 7 (10.8%) |
| $75,000 to $99,999 | 62 (14.3%) | 0 (0.0%) |
| $100,000 to $149,999 | 12 (2.8%) | 10 (15.4%) |
| $150,000 or more | 21 (4.8%) | 4 (6.1%) |
| Total | 434 (100.0%) | 65 (100.0%) |
Monthly Housing Cost Tiers in Bylas
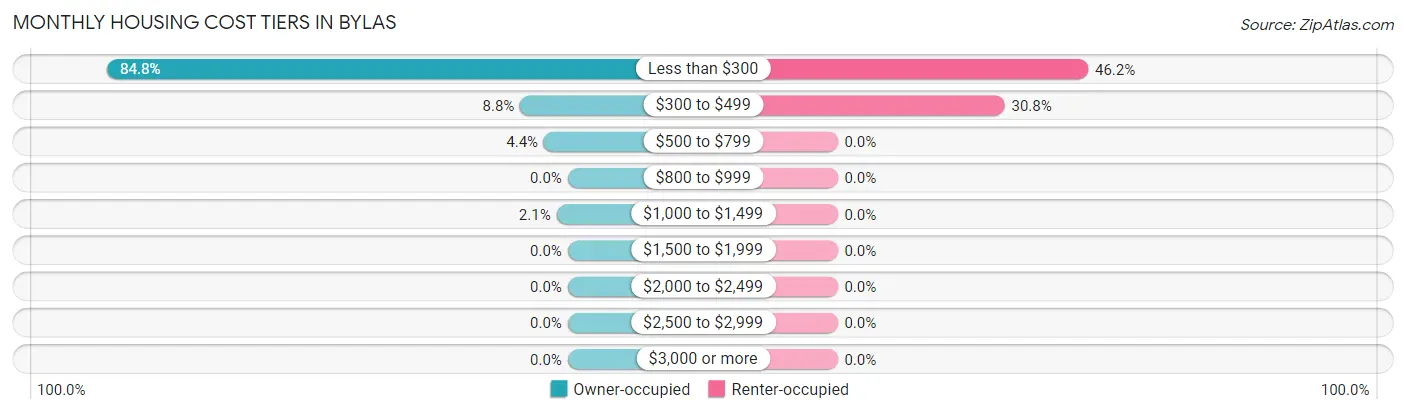
| Monthly Cost | Owner-occupied | Renter-occupied |
| Less than $300 | 368 (84.8%) | 30 (46.2%) |
| $300 to $499 | 38 (8.8%) | 20 (30.8%) |
| $500 to $799 | 19 (4.4%) | 0 (0.0%) |
| $800 to $999 | 0 (0.0%) | 0 (0.0%) |
| $1,000 to $1,499 | 9 (2.1%) | 0 (0.0%) |
| $1,500 to $1,999 | 0 (0.0%) | 0 (0.0%) |
| $2,000 to $2,499 | 0 (0.0%) | 0 (0.0%) |
| $2,500 to $2,999 | 0 (0.0%) | 0 (0.0%) |
| $3,000 or more | 0 (0.0%) | 0 (0.0%) |
| Total | 434 (100.0%) | 65 (100.0%) |
Physical Housing Characteristics in Bylas
Housing Structures in Bylas
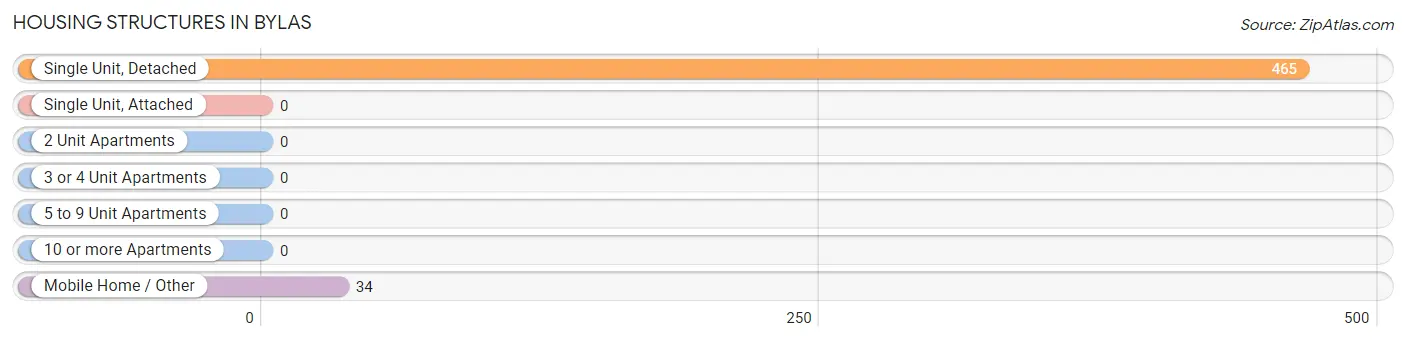
| Structure Type | # Housing Units | % Housing Units |
| Single Unit, Detached | 465 | 93.2% |
| Single Unit, Attached | 0 | 0.0% |
| 2 Unit Apartments | 0 | 0.0% |
| 3 or 4 Unit Apartments | 0 | 0.0% |
| 5 to 9 Unit Apartments | 0 | 0.0% |
| 10 or more Apartments | 0 | 0.0% |
| Mobile Home / Other | 34 | 6.8% |
| Total | 499 | 100.0% |
Housing Structures by Occupancy in Bylas
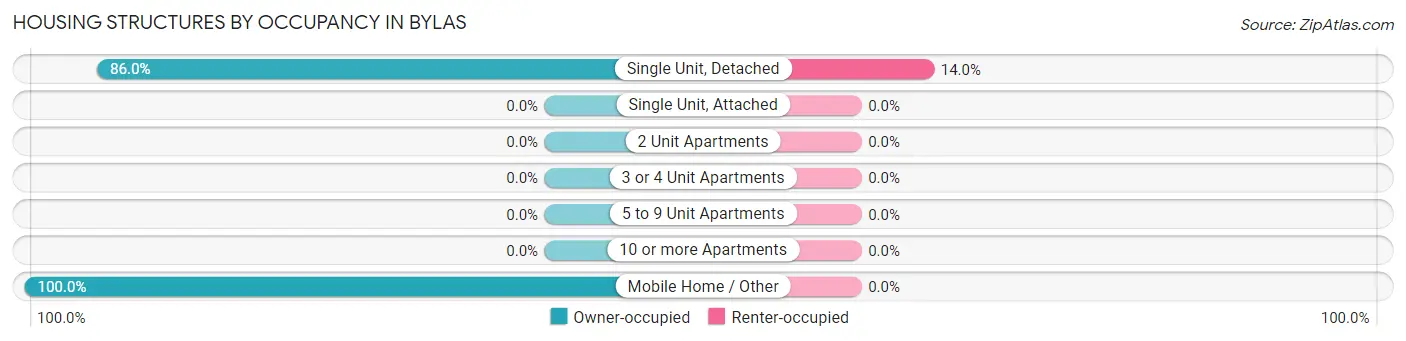
| Structure Type | Owner-occupied | Renter-occupied |
| Single Unit, Detached | 400 (86.0%) | 65 (14.0%) |
| Single Unit, Attached | 0 (0.0%) | 0 (0.0%) |
| 2 Unit Apartments | 0 (0.0%) | 0 (0.0%) |
| 3 or 4 Unit Apartments | 0 (0.0%) | 0 (0.0%) |
| 5 to 9 Unit Apartments | 0 (0.0%) | 0 (0.0%) |
| 10 or more Apartments | 0 (0.0%) | 0 (0.0%) |
| Mobile Home / Other | 34 (100.0%) | 0 (0.0%) |
| Total | 434 (87.0%) | 65 (13.0%) |
Housing Structures by Number of Rooms in Bylas
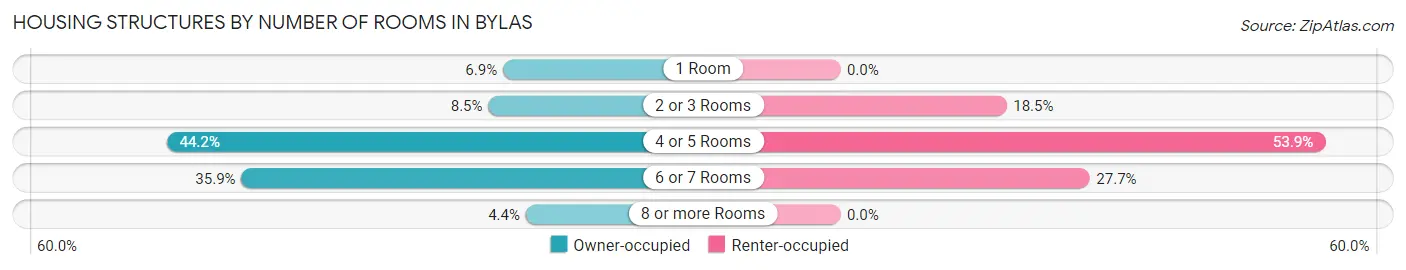
| Number of Rooms | Owner-occupied | Renter-occupied |
| 1 Room | 30 (6.9%) | 0 (0.0%) |
| 2 or 3 Rooms | 37 (8.5%) | 12 (18.5%) |
| 4 or 5 Rooms | 192 (44.2%) | 35 (53.8%) |
| 6 or 7 Rooms | 156 (35.9%) | 18 (27.7%) |
| 8 or more Rooms | 19 (4.4%) | 0 (0.0%) |
| Total | 434 (100.0%) | 65 (100.0%) |
Housing Structure by Heating Type in Bylas
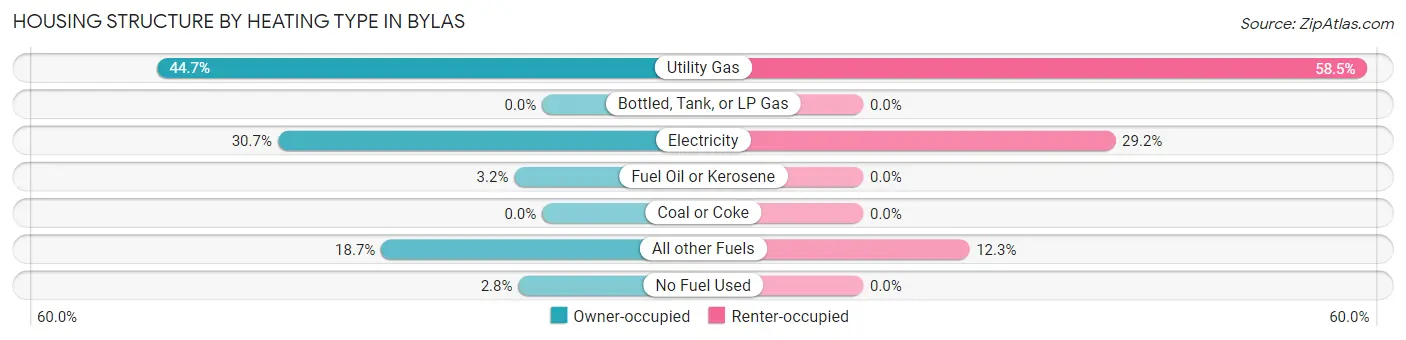
| Heating Type | Owner-occupied | Renter-occupied |
| Utility Gas | 194 (44.7%) | 38 (58.5%) |
| Bottled, Tank, or LP Gas | 0 (0.0%) | 0 (0.0%) |
| Electricity | 133 (30.6%) | 19 (29.2%) |
| Fuel Oil or Kerosene | 14 (3.2%) | 0 (0.0%) |
| Coal or Coke | 0 (0.0%) | 0 (0.0%) |
| All other Fuels | 81 (18.7%) | 8 (12.3%) |
| No Fuel Used | 12 (2.8%) | 0 (0.0%) |
| Total | 434 (100.0%) | 65 (100.0%) |
Household Vehicle Usage in Bylas
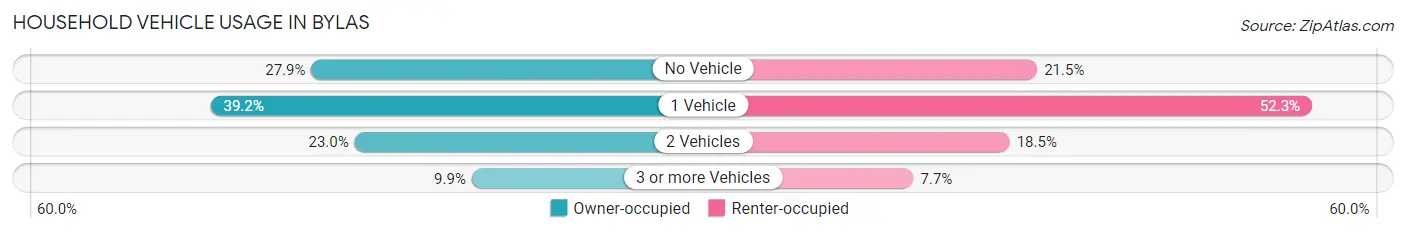
| Vehicles per Household | Owner-occupied | Renter-occupied |
| No Vehicle | 121 (27.9%) | 14 (21.5%) |
| 1 Vehicle | 170 (39.2%) | 34 (52.3%) |
| 2 Vehicles | 100 (23.0%) | 12 (18.5%) |
| 3 or more Vehicles | 43 (9.9%) | 5 (7.7%) |
| Total | 434 (100.0%) | 65 (100.0%) |
Real Estate & Mortgages in Bylas
Real Estate and Mortgage Overview in Bylas
| Characteristic | Without Mortgage | With Mortgage |
| Housing Units | 406 | 28 |
| Median Property Value | $33,300 | $97,400 |
| Median Household Income | $39,167 | $0 |
| Monthly Housing Costs | $154 | $0 |
| Real Estate Taxes | $199 | $24 |
Property Value by Mortgage Status in Bylas
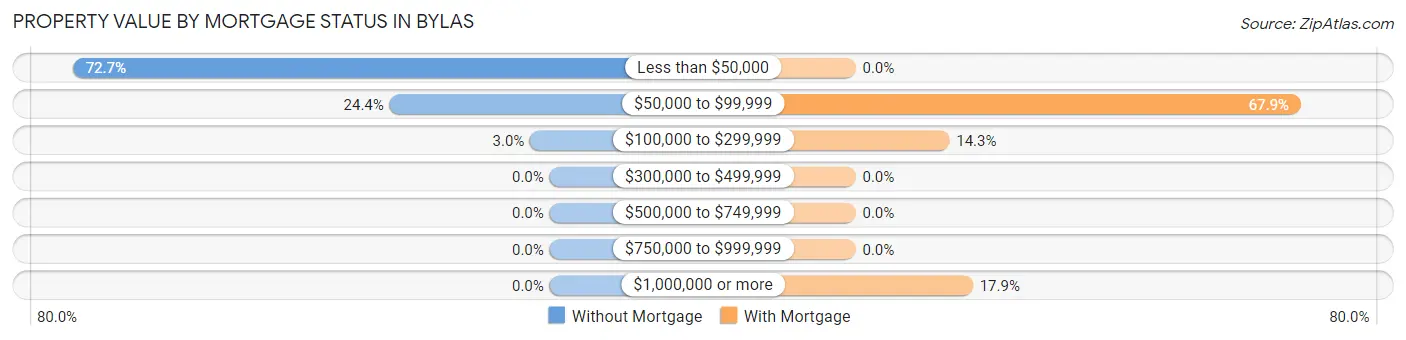
| Property Value | Without Mortgage | With Mortgage |
| Less than $50,000 | 295 (72.7%) | 0 (0.0%) |
| $50,000 to $99,999 | 99 (24.4%) | 19 (67.9%) |
| $100,000 to $299,999 | 12 (3.0%) | 4 (14.3%) |
| $300,000 to $499,999 | 0 (0.0%) | 0 (0.0%) |
| $500,000 to $749,999 | 0 (0.0%) | 0 (0.0%) |
| $750,000 to $999,999 | 0 (0.0%) | 0 (0.0%) |
| $1,000,000 or more | 0 (0.0%) | 5 (17.9%) |
| Total | 406 (100.0%) | 28 (100.0%) |
Household Income by Mortgage Status in Bylas
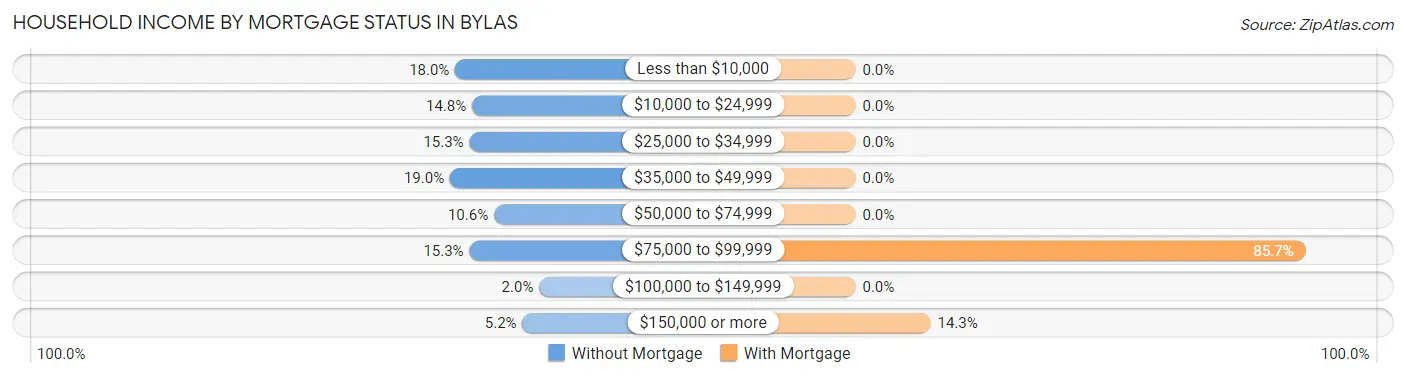
| Household Income | Without Mortgage | With Mortgage |
| Less than $10,000 | 73 (18.0%) | 0 (0.0%) |
| $10,000 to $24,999 | 60 (14.8%) | 0 (0.0%) |
| $25,000 to $34,999 | 62 (15.3%) | 0 (0.0%) |
| $35,000 to $49,999 | 77 (19.0%) | 0 (0.0%) |
| $50,000 to $74,999 | 43 (10.6%) | 0 (0.0%) |
| $75,000 to $99,999 | 62 (15.3%) | 24 (85.7%) |
| $100,000 to $149,999 | 8 (2.0%) | 0 (0.0%) |
| $150,000 or more | 21 (5.2%) | 4 (14.3%) |
| Total | 406 (100.0%) | 28 (100.0%) |
Property Value to Household Income Ratio in Bylas
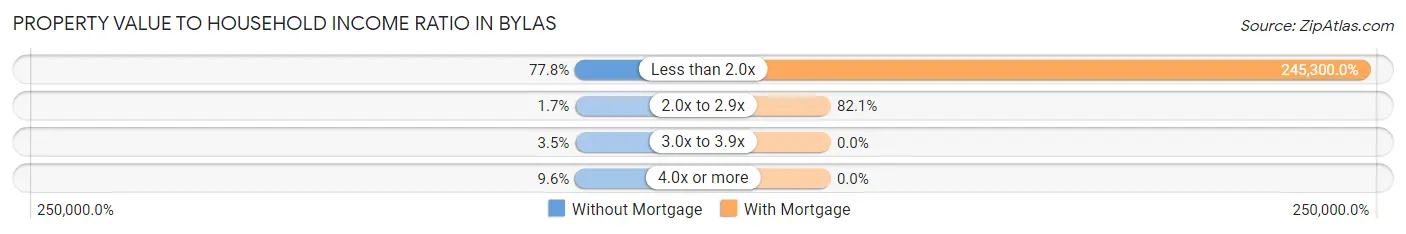
| Value-to-Income Ratio | Without Mortgage | With Mortgage |
| Less than 2.0x | 316 (77.8%) | 68,684 (245,300.0%) |
| 2.0x to 2.9x | 7 (1.7%) | 23 (82.1%) |
| 3.0x to 3.9x | 14 (3.5%) | 0 (0.0%) |
| 4.0x or more | 39 (9.6%) | 0 (0.0%) |
| Total | 406 (100.0%) | 28 (100.0%) |
Real Estate Taxes by Mortgage Status in Bylas
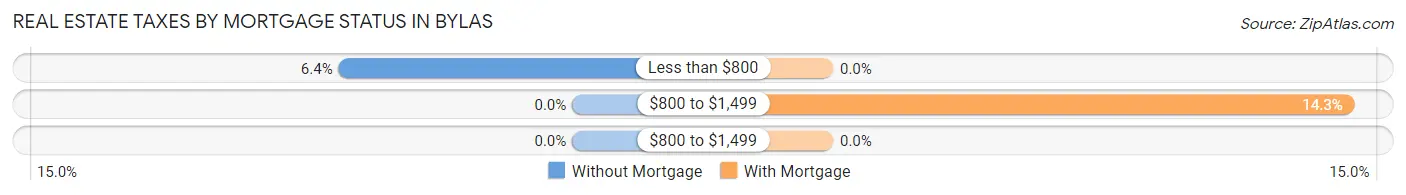
| Property Taxes | Without Mortgage | With Mortgage |
| Less than $800 | 26 (6.4%) | 0 (0.0%) |
| $800 to $1,499 | 0 (0.0%) | 4 (14.3%) |
| $800 to $1,499 | 0 (0.0%) | 0 (0.0%) |
| Total | 406 (100.0%) | 28 (100.0%) |
Health & Disability in Bylas
Health Insurance Coverage by Age in Bylas
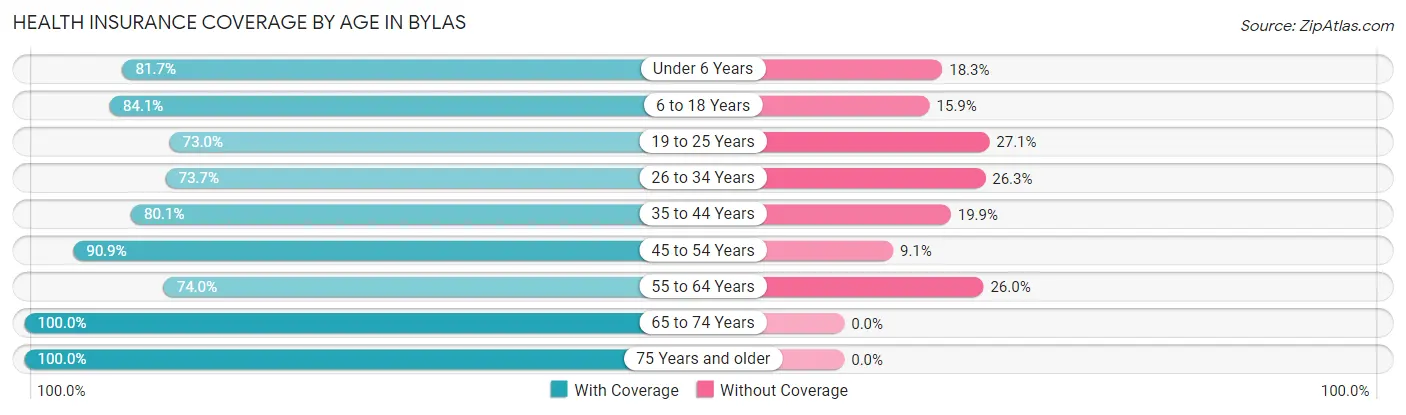
| Age Bracket | With Coverage | Without Coverage |
| Under 6 Years | 152 (81.7%) | 34 (18.3%) |
| 6 to 18 Years | 259 (84.1%) | 49 (15.9%) |
| 19 to 25 Years | 89 (73.0%) | 33 (27.1%) |
| 26 to 34 Years | 143 (73.7%) | 51 (26.3%) |
| 35 to 44 Years | 113 (80.1%) | 28 (19.9%) |
| 45 to 54 Years | 100 (90.9%) | 10 (9.1%) |
| 55 to 64 Years | 174 (74.0%) | 61 (26.0%) |
| 65 to 74 Years | 156 (100.0%) | 0 (0.0%) |
| 75 Years and older | 100 (100.0%) | 0 (0.0%) |
| Total | 1,286 (82.9%) | 266 (17.1%) |
Health Insurance Coverage by Citizenship Status in Bylas
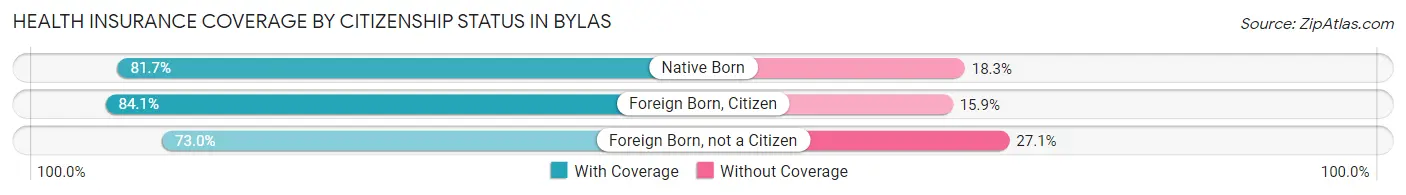
| Citizenship Status | With Coverage | Without Coverage |
| Native Born | 152 (81.7%) | 34 (18.3%) |
| Foreign Born, Citizen | 259 (84.1%) | 49 (15.9%) |
| Foreign Born, not a Citizen | 89 (73.0%) | 33 (27.1%) |
Health Insurance Coverage by Household Income in Bylas
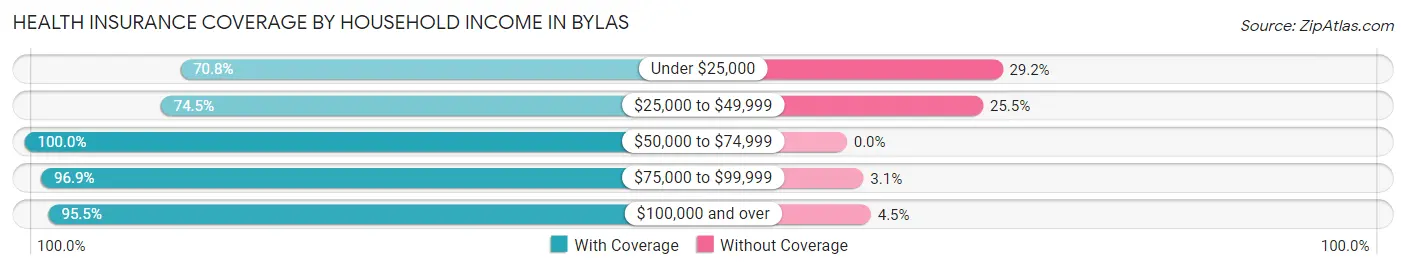
| Household Income | With Coverage | Without Coverage |
| Under $25,000 | 396 (70.8%) | 163 (29.2%) |
| $25,000 to $49,999 | 251 (74.5%) | 86 (25.5%) |
| $50,000 to $74,999 | 228 (100.0%) | 0 (0.0%) |
| $75,000 to $99,999 | 156 (96.9%) | 5 (3.1%) |
| $100,000 and over | 255 (95.5%) | 12 (4.5%) |
Public vs Private Health Insurance Coverage by Age in Bylas
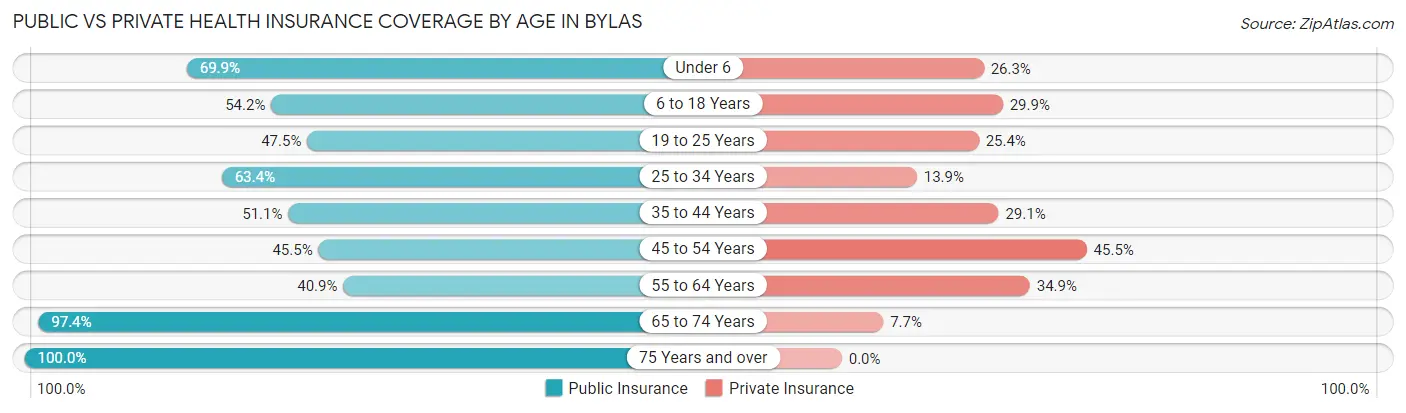
| Age Bracket | Public Insurance | Private Insurance |
| Under 6 | 130 (69.9%) | 49 (26.3%) |
| 6 to 18 Years | 167 (54.2%) | 92 (29.9%) |
| 19 to 25 Years | 58 (47.5%) | 31 (25.4%) |
| 25 to 34 Years | 123 (63.4%) | 27 (13.9%) |
| 35 to 44 Years | 72 (51.1%) | 41 (29.1%) |
| 45 to 54 Years | 50 (45.5%) | 50 (45.5%) |
| 55 to 64 Years | 96 (40.8%) | 82 (34.9%) |
| 65 to 74 Years | 152 (97.4%) | 12 (7.7%) |
| 75 Years and over | 100 (100.0%) | 0 (0.0%) |
| Total | 948 (61.1%) | 384 (24.7%) |
Disability Status by Sex by Age in Bylas
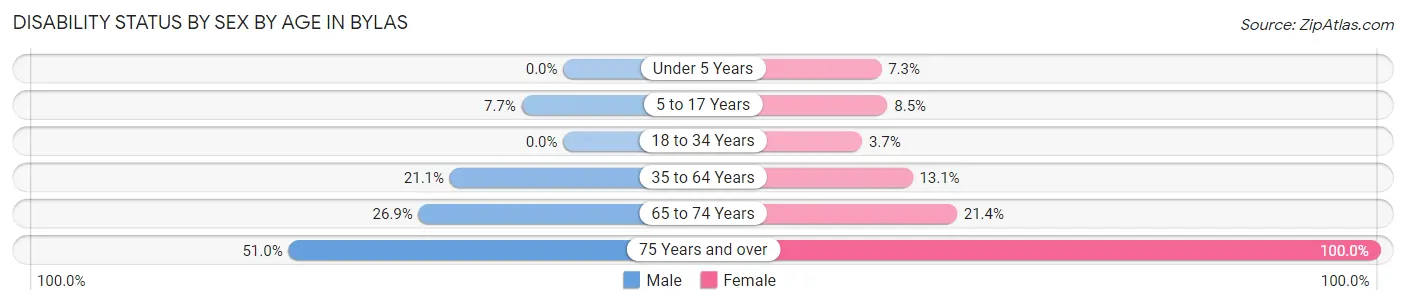
| Age Bracket | Male | Female |
| Under 5 Years | 0 (0.0%) | 6 (7.3%) |
| 5 to 17 Years | 12 (7.7%) | 11 (8.5%) |
| 18 to 34 Years | 0 (0.0%) | 7 (3.7%) |
| 35 to 64 Years | 51 (21.1%) | 32 (13.1%) |
| 65 to 74 Years | 18 (26.9%) | 19 (21.3%) |
| 75 Years and over | 25 (51.0%) | 51 (100.0%) |
Disability Class by Sex by Age in Bylas
Disability Class: Hearing Difficulty
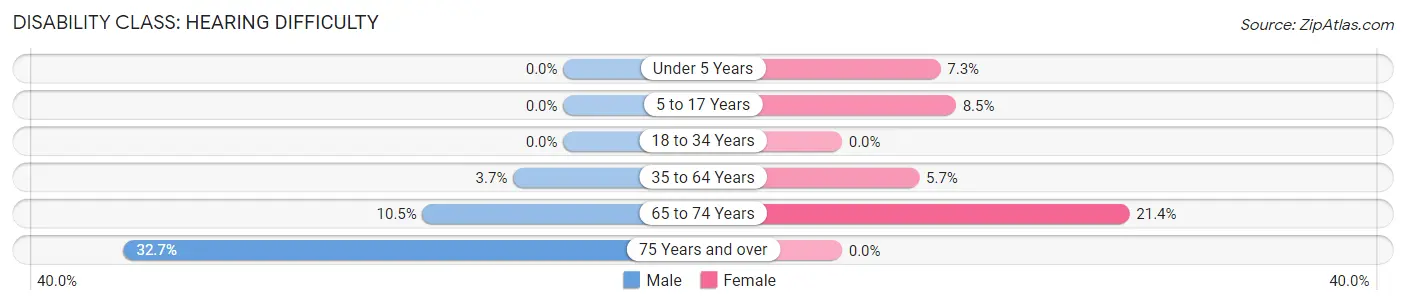
| Age Bracket | Male | Female |
| Under 5 Years | 0 (0.0%) | 6 (7.3%) |
| 5 to 17 Years | 0 (0.0%) | 11 (8.5%) |
| 18 to 34 Years | 0 (0.0%) | 0 (0.0%) |
| 35 to 64 Years | 9 (3.7%) | 14 (5.7%) |
| 65 to 74 Years | 7 (10.4%) | 19 (21.3%) |
| 75 Years and over | 16 (32.7%) | 0 (0.0%) |
Disability Class: Vision Difficulty
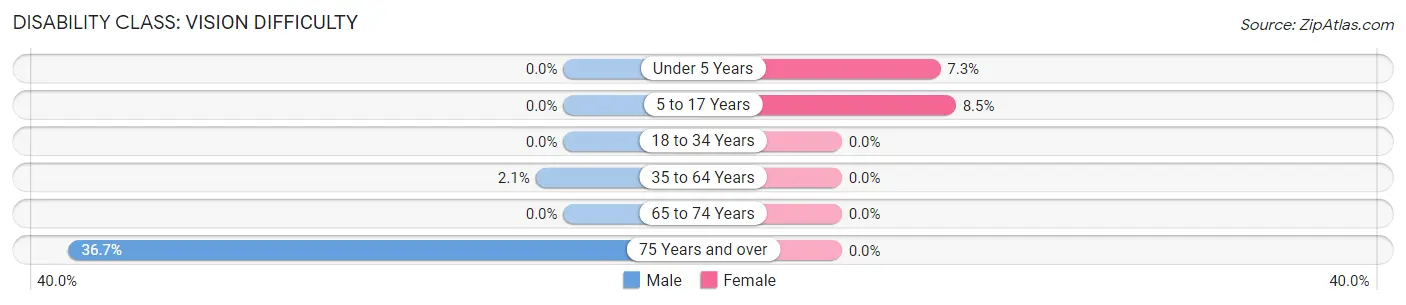
| Age Bracket | Male | Female |
| Under 5 Years | 0 (0.0%) | 6 (7.3%) |
| 5 to 17 Years | 0 (0.0%) | 11 (8.5%) |
| 18 to 34 Years | 0 (0.0%) | 0 (0.0%) |
| 35 to 64 Years | 5 (2.1%) | 0 (0.0%) |
| 65 to 74 Years | 0 (0.0%) | 0 (0.0%) |
| 75 Years and over | 18 (36.7%) | 0 (0.0%) |
Disability Class: Cognitive Difficulty
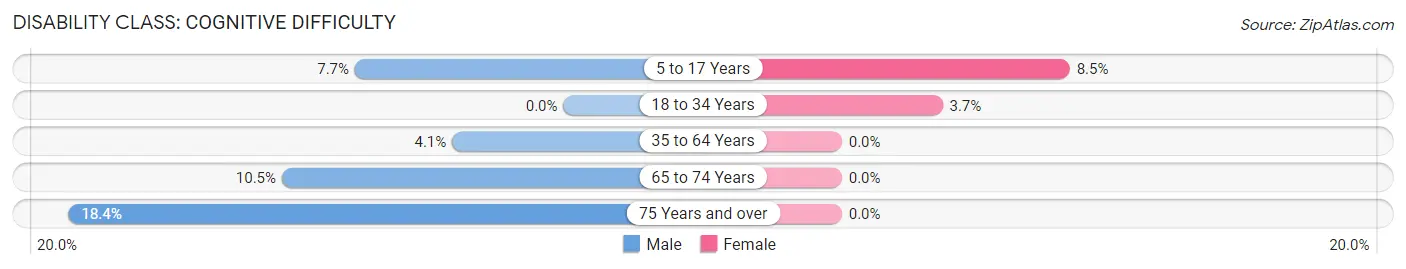
| Age Bracket | Male | Female |
| 5 to 17 Years | 12 (7.7%) | 11 (8.5%) |
| 18 to 34 Years | 0 (0.0%) | 7 (3.7%) |
| 35 to 64 Years | 10 (4.1%) | 0 (0.0%) |
| 65 to 74 Years | 7 (10.4%) | 0 (0.0%) |
| 75 Years and over | 9 (18.4%) | 0 (0.0%) |
Disability Class: Ambulatory Difficulty
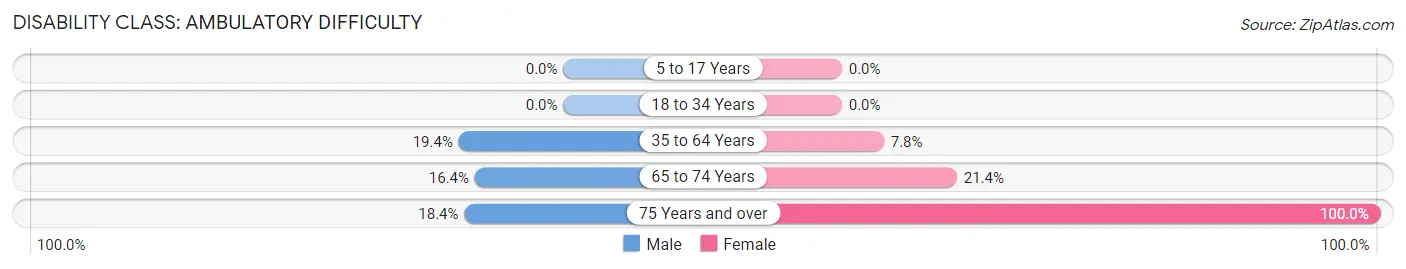
| Age Bracket | Male | Female |
| 5 to 17 Years | 0 (0.0%) | 0 (0.0%) |
| 18 to 34 Years | 0 (0.0%) | 0 (0.0%) |
| 35 to 64 Years | 47 (19.4%) | 19 (7.8%) |
| 65 to 74 Years | 11 (16.4%) | 19 (21.3%) |
| 75 Years and over | 9 (18.4%) | 51 (100.0%) |
Disability Class: Self-Care Difficulty
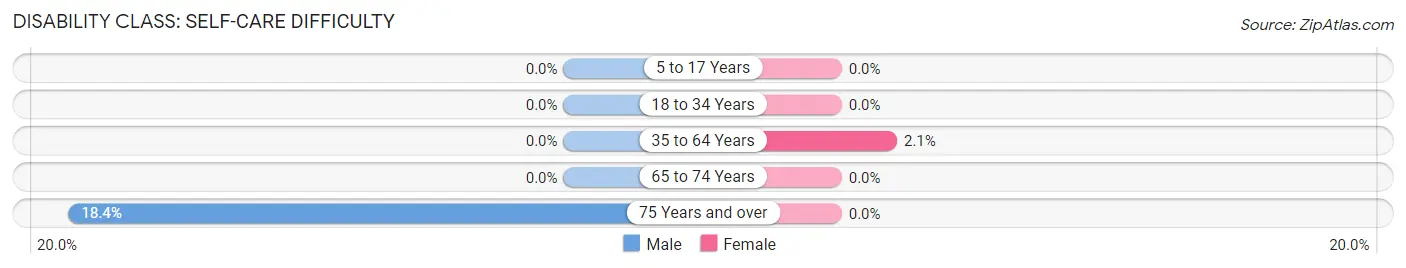
| Age Bracket | Male | Female |
| 5 to 17 Years | 0 (0.0%) | 0 (0.0%) |
| 18 to 34 Years | 0 (0.0%) | 0 (0.0%) |
| 35 to 64 Years | 0 (0.0%) | 5 (2.1%) |
| 65 to 74 Years | 0 (0.0%) | 0 (0.0%) |
| 75 Years and over | 9 (18.4%) | 0 (0.0%) |
Technology Access in Bylas
Computing Device Access in Bylas
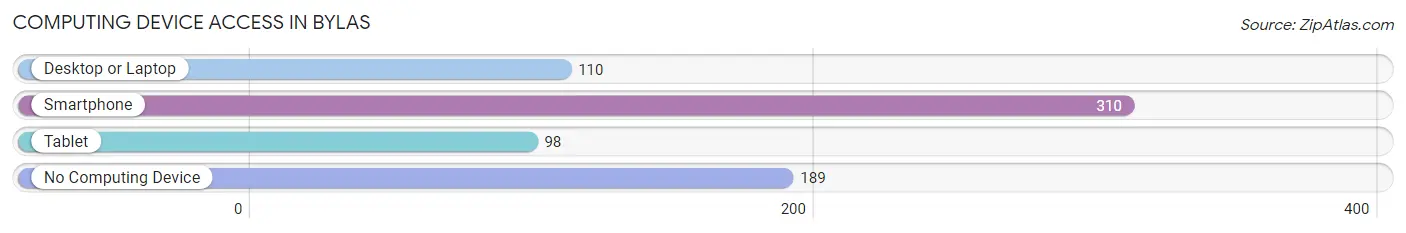
| Device Type | # Households | % Households |
| Desktop or Laptop | 110 | 22.0% |
| Smartphone | 310 | 62.1% |
| Tablet | 98 | 19.6% |
| No Computing Device | 189 | 37.9% |
| Total | 499 | 100.0% |
Internet Access in Bylas
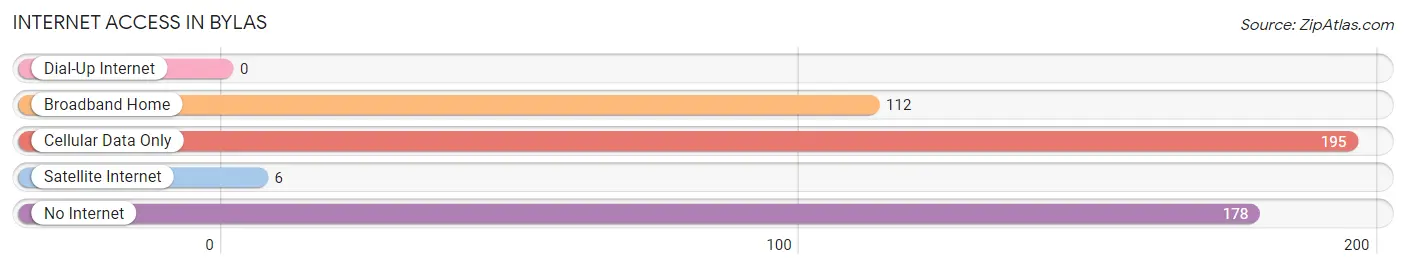
| Internet Type | # Households | % Households |
| Dial-Up Internet | 0 | 0.0% |
| Broadband Home | 112 | 22.4% |
| Cellular Data Only | 195 | 39.1% |
| Satellite Internet | 6 | 1.2% |
| No Internet | 178 | 35.7% |
| Total | 499 | 100.0% |
Bylas Summary
Bylas is a small unincorporated community located in the Gila River Indian Community in Graham County, Arizona. It is located about 25 miles south of Safford, Arizona, and is home to about 1,000 people. The community is located in the foothills of the Pinal Mountains, and is surrounded by the San Carlos Apache Indian Reservation.
History
The area around Bylas has been inhabited by Native Americans for centuries. The San Carlos Apache Tribe has lived in the area since the late 1800s. The tribe was relocated to the San Carlos Reservation in 1871, and the area around Bylas was part of the reservation.
In the early 1900s, the area around Bylas was settled by non-Native Americans. The first settlers were ranchers and farmers, and the area was known as the Bylas Valley. The town of Bylas was established in the early 1920s, and the first post office was established in 1923.
Geography
Bylas is located in the Gila River Indian Community in Graham County, Arizona. It is located about 25 miles south of Safford, Arizona, and is surrounded by the San Carlos Apache Indian Reservation. The town is situated in the foothills of the Pinal Mountains, and is located at an elevation of 3,400 feet. The climate in Bylas is semi-arid, with hot summers and mild winters.
Economy
The economy of Bylas is largely based on agriculture and tourism. The area is known for its pecan orchards, and the town is home to several pecan farms. The town is also home to several tourist attractions, including the Bylas Museum, which features artifacts from the area's Native American history.
The town is also home to several businesses, including a grocery store, a gas station, and a few restaurants. The town is also home to a post office, a library, and a fire station.
Demographics
As of the 2010 census, the population of Bylas was 1,039. The racial makeup of the town was 94.3% Native American, 4.2% White, 0.2% African American, 0.2% Asian, and 0.9% from other races. The median household income in Bylas was $20,938, and the median age was 28.7 years.
Conclusion
Bylas is a small unincorporated community located in the Gila River Indian Community in Graham County, Arizona. It is located about 25 miles south of Safford, Arizona, and is home to about 1,000 people. The town is situated in the foothills of the Pinal Mountains, and is surrounded by the San Carlos Apache Indian Reservation. The economy of Bylas is largely based on agriculture and tourism, and the town is home to several businesses, including a grocery store, a gas station, and a few restaurants. As of the 2010 census, the population of Bylas was 1,039, and the median household income was $20,938.
Common Questions
What is Per Capita Income in Bylas?
Per Capita income in Bylas is $15,985.
What is the Median Family Income in Bylas?
Median Family Income in Bylas is $46,111.
What is the Median Household income in Bylas?
Median Household Income in Bylas is $39,688.
What is Income or Wage Gap in Bylas?
Income or Wage Gap in Bylas is 29.6%.
Women in Bylas earn 70.4 cents for every dollar earned by a man.
What is Family Income Deficit in Bylas?
Family Income Deficit in Bylas is $21,505.
Families that are below poverty line in Bylas earn $21,505 less on average than the poverty threshold level.
What is Inequality or Gini Index in Bylas?
Inequality or Gini Index in Bylas is 0.49.
What is the Total Population of Bylas?
Total Population of Bylas is 1,552.
What is the Total Male Population of Bylas?
Total Male Population of Bylas is 769.
What is the Total Female Population of Bylas?
Total Female Population of Bylas is 783.
What is the Ratio of Males per 100 Females in Bylas?
There are 98.21 Males per 100 Females in Bylas.
What is the Ratio of Females per 100 Males in Bylas?
There are 101.82 Females per 100 Males in Bylas.
What is the Median Population Age in Bylas?
Median Population Age in Bylas is 30.2 Years.
What is the Average Family Size in Bylas
Average Family Size in Bylas is 3.7 People.
What is the Average Household Size in Bylas
Average Household Size in Bylas is 3.1 People.
How Large is the Labor Force in Bylas?
There are 403 People in the Labor Forcein in Bylas.
What is the Percentage of People in the Labor Force in Bylas?
35.2% of People are in the Labor Force in Bylas.
What is the Unemployment Rate in Bylas?
Unemployment Rate in Bylas is 12.2%.