Zip Codes with the Highest Percentage of Population Employed in Agriculture, Fishing & Hunting in Fort Smith, AR
RELATED REPORTS & OPTIONS
Agriculture, Fishing & Hunting
Fort Smith
Compare Zip Codes
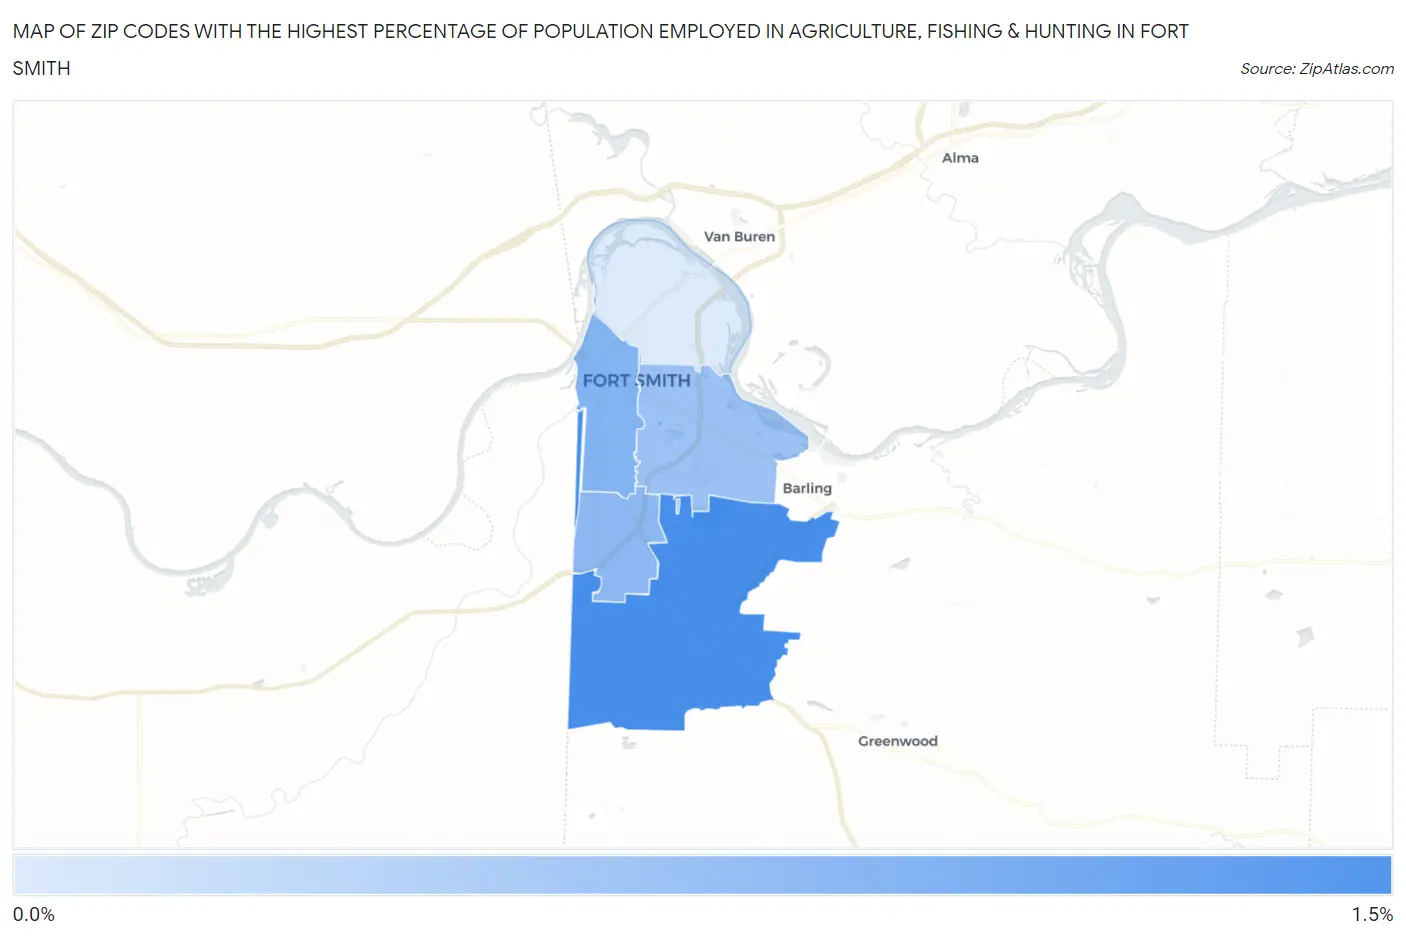
Map of Zip Codes with the Highest Percentage of Population Employed in Agriculture, Fishing & Hunting in Fort Smith
0.0%
1.5%
Zip Codes with the Highest Percentage of Population Employed in Agriculture, Fishing & Hunting in Fort Smith, AR
| Zip Code | % Employed | vs State | vs National | |
| 1. | 72916 | 1.1% | 2.2%(-1.07)#352 | 1.2%(-0.087)#15,751 |
| 2. | 72901 | 0.85% | 2.2%(-1.34)#372 | 1.2%(-0.351)#16,985 |
| 3. | 72908 | 0.80% | 2.2%(-1.39)#377 | 1.2%(-0.399)#17,234 |
| 4. | 72903 | 0.74% | 2.2%(-1.44)#381 | 1.2%(-0.456)#17,578 |
| 5. | 72904 | 0.45% | 2.2%(-1.74)#404 | 1.2%(-0.754)#19,740 |
1
Common Questions
What are the Top 3 Zip Codes with the Highest Percentage of Population Employed in Agriculture, Fishing & Hunting in Fort Smith, AR?
Top 3 Zip Codes with the Highest Percentage of Population Employed in Agriculture, Fishing & Hunting in Fort Smith, AR are:
What zip code has the Highest Percentage of Population Employed in Agriculture, Fishing & Hunting in Fort Smith, AR?
72916 has the Highest Percentage of Population Employed in Agriculture, Fishing & Hunting in Fort Smith, AR with 1.1%.
What is the Percentage of Population Employed in Agriculture, Fishing & Hunting in Fort Smith, AR?
Percentage of Population Employed in Agriculture, Fishing & Hunting in Fort Smith is 0.79%.
What is the Percentage of Population Employed in Agriculture, Fishing & Hunting in Arkansas?
Percentage of Population Employed in Agriculture, Fishing & Hunting in Arkansas is 2.2%.
What is the Percentage of Population Employed in Agriculture, Fishing & Hunting in the United States?
Percentage of Population Employed in Agriculture, Fishing & Hunting in the United States is 1.2%.