Zip Codes with the Highest Percentage of Renter-Occupied Units in Fort Smith, AR
RELATED REPORTS & OPTIONS
Highest Renter-Occupied
Fort Smith
Compare Zip Codes
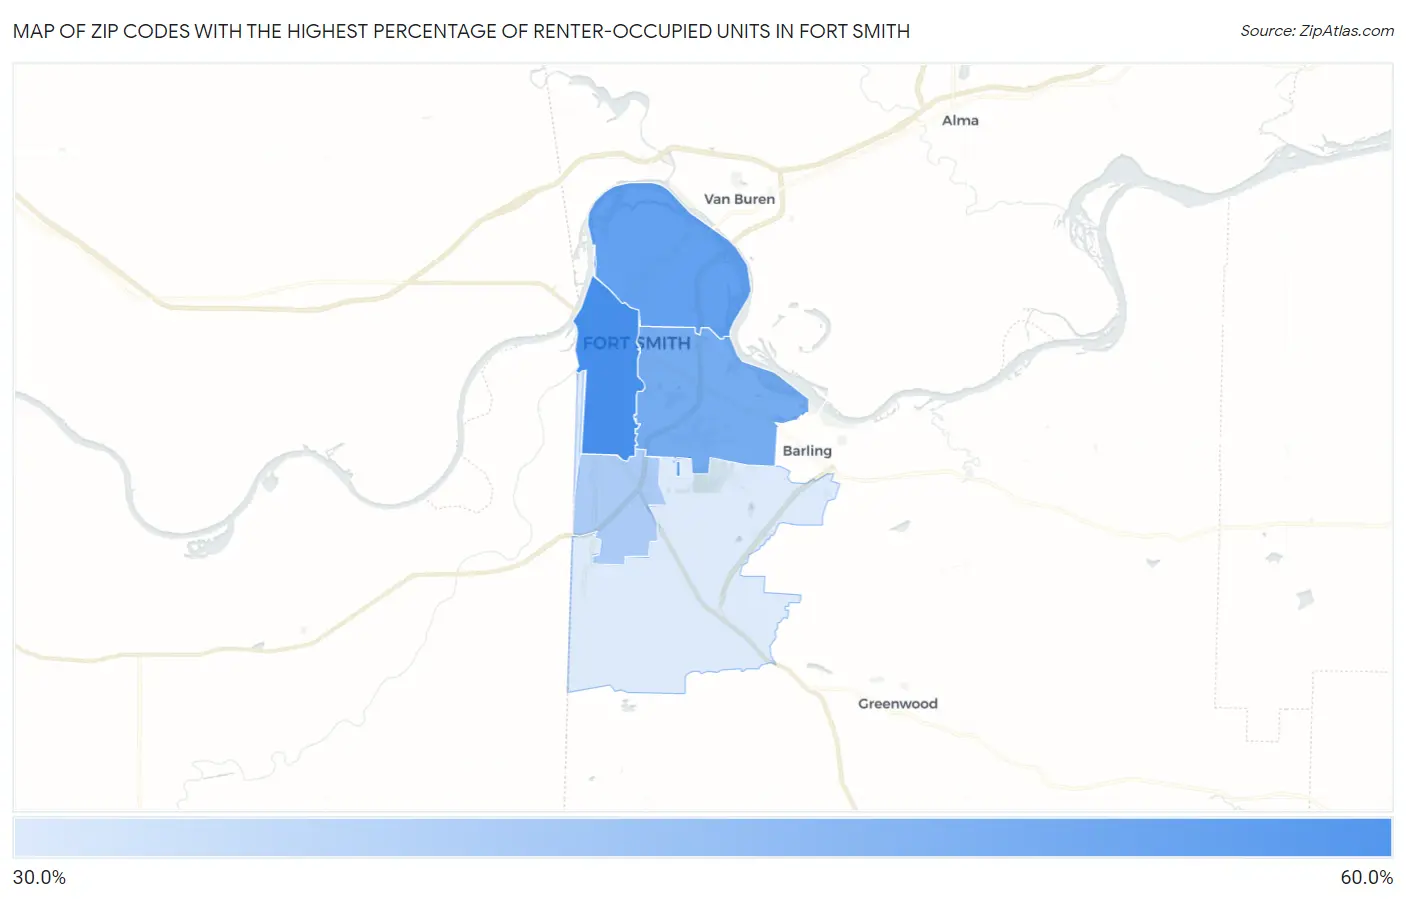
Map of Zip Codes with the Highest Percentage of Renter-Occupied Units in Fort Smith
0.0%
60.0%
Zip Codes with the Highest Percentage of Renter-Occupied Units in Fort Smith, AR
| Zip Code | % Renter-Occupied | vs State | vs National | |
| 1. | 72901 | 55.1% | 33.8%(+21.3)#30 | 35.2%(+19.9)#2,324 |
| 2. | 72904 | 50.7% | 33.8%(+16.9)#41 | 35.2%(+15.5)#2,981 |
| 3. | 72903 | 47.7% | 33.8%(+13.9)#47 | 35.2%(+12.5)#3,509 |
| 4. | 72908 | 39.7% | 33.8%(+5.88)#82 | 35.2%(+4.47)#5,508 |
| 5. | 72916 | 32.4% | 33.8%(-1.37)#157 | 35.2%(-2.78)#8,626 |
1
Common Questions
What are the Top 3 Zip Codes with the Highest Percentage of Renter-Occupied Units in Fort Smith, AR?
Top 3 Zip Codes with the Highest Percentage of Renter-Occupied Units in Fort Smith, AR are:
What zip code has the Highest Percentage of Renter-Occupied Units in Fort Smith, AR?
72901 has the Highest Percentage of Renter-Occupied Units in Fort Smith, AR with 55.1%.
What is the Percentage of Renter-Occupied Units in Fort Smith, AR?
Percentage of Renter-Occupied Units in Fort Smith is 48.6%.
What is the Percentage of Renter-Occupied Units in Arkansas?
Percentage of Renter-Occupied Units in Arkansas is 33.8%.
What is the Percentage of Renter-Occupied Units in the United States?
Percentage of Renter-Occupied Units in the United States is 35.2%.