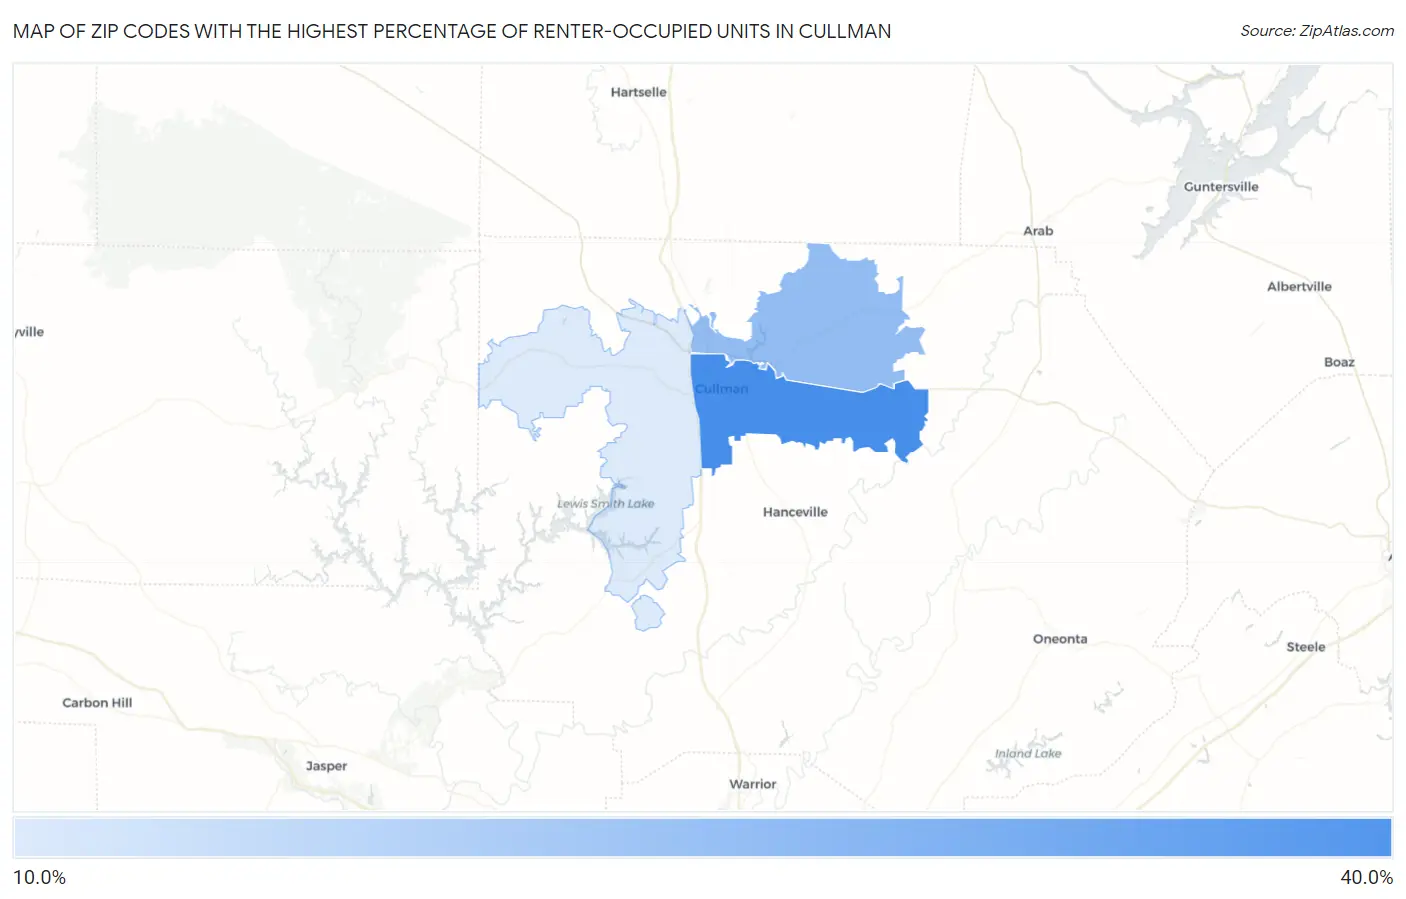
Zip Codes with the Highest Percentage of Renter-Occupied Units in Cullman, AL
RELATED REPORTS & OPTIONS
Highest Renter-Occupied
Cullman
Compare Zip Codes
Map of Zip Codes with the Highest Percentage of Renter-Occupied Units in Cullman
0.0%
40.0%
Zip Codes with the Highest Percentage of Renter-Occupied Units in Cullman, AL
| Zip Code | % Renter-Occupied | vs State | vs National | |
| 1. | 35055 | 34.6% | 30.3%(+4.35)#129 | 35.2%(-0.557)#7,545 |
| 2. | 35058 | 25.5% | 30.3%(-4.78)#235 | 35.2%(-9.69)#13,212 |
| 3. | 35057 | 17.2% | 30.3%(-13.1)#415 | 35.2%(-18.0)#20,958 |
1
Common Questions
What are the Top Zip Codes with the Highest Percentage of Renter-Occupied Units in Cullman, AL?
Top Zip Codes with the Highest Percentage of Renter-Occupied Units in Cullman, AL are:
What zip code has the Highest Percentage of Renter-Occupied Units in Cullman, AL?
35055 has the Highest Percentage of Renter-Occupied Units in Cullman, AL with 34.6%.
What is the Percentage of Renter-Occupied Units in Cullman, AL?
Percentage of Renter-Occupied Units in Cullman is 38.4%.
What is the Percentage of Renter-Occupied Units in Alabama?
Percentage of Renter-Occupied Units in Alabama is 30.3%.
What is the Percentage of Renter-Occupied Units in the United States?
Percentage of Renter-Occupied Units in the United States is 35.2%.