Zip Codes with the Highest Percentage of Population Employed in Farming, Fishing & Forestry in Wyoming
RELATED REPORTS & OPTIONS
Farming, Fishing & Forestry
Wyoming
Compare Zip Codes
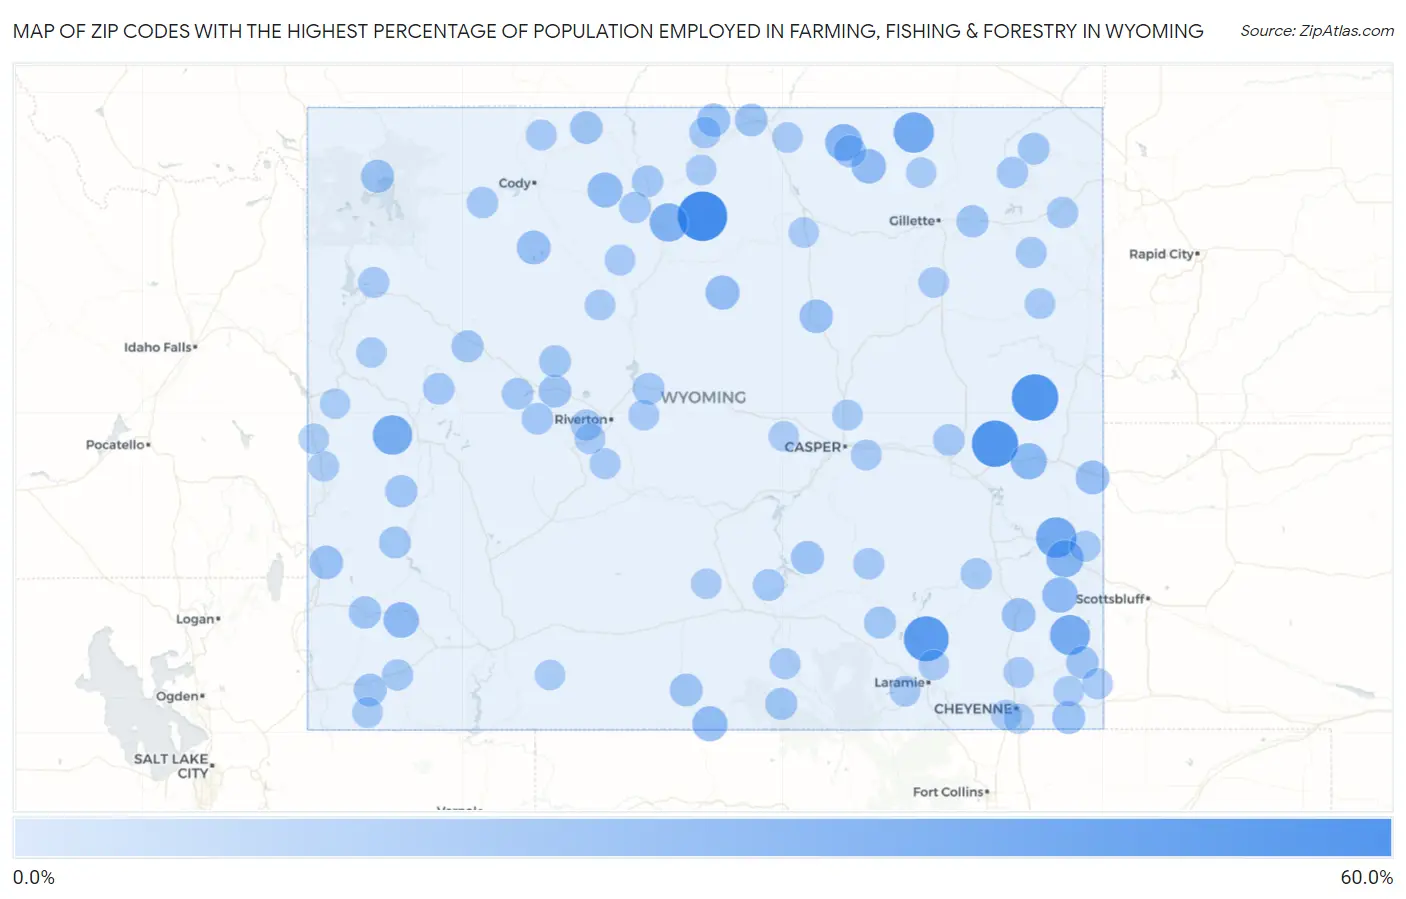
Map of Zip Codes with the Highest Percentage of Population Employed in Farming, Fishing & Forestry in Wyoming
0.0%
60.0%
Zip Codes with the Highest Percentage of Population Employed in Farming, Fishing & Forestry in Wyoming
| Zip Code | % Employed | vs State | vs National | |
| 1. | 82428 | 52.2% | 1.2%(+51.0)#1 | 0.61%(+51.6)#46 |
| 2. | 82222 | 43.8% | 1.2%(+42.6)#2 | 0.61%(+43.2)#81 |
| 3. | 82229 | 43.3% | 1.2%(+42.2)#3 | 0.61%(+42.7)#85 |
| 4. | 82051 | 39.3% | 1.2%(+38.1)#4 | 0.61%(+38.7)#106 |
| 5. | 82725 | 27.5% | 1.2%(+26.3)#5 | 0.61%(+26.8)#232 |
| 6. | 82212 | 27.0% | 1.2%(+25.9)#6 | 0.61%(+26.4)#240 |
| 7. | 82221 | 26.2% | 1.2%(+25.0)#7 | 0.61%(+25.6)#259 |
| 8. | 83115 | 24.6% | 1.2%(+23.5)#8 | 0.61%(+24.0)#291 |
| 9. | 82432 | 21.3% | 1.2%(+20.1)#9 | 0.61%(+20.7)#363 |
| 10. | 82223 | 18.2% | 1.2%(+17.0)#10 | 0.61%(+17.6)#465 |
| 11. | 82835 | 17.5% | 1.2%(+16.3)#11 | 0.61%(+16.9)#506 |
| 12. | 82227 | 15.6% | 1.2%(+14.4)#12 | 0.61%(+15.0)#613 |
| 13. | 83124 | 13.8% | 1.2%(+12.6)#13 | 0.61%(+13.2)#737 |
| 14. | 82244 | 13.6% | 1.2%(+12.4)#14 | 0.61%(+13.0)#762 |
| 15. | 82323 | 12.7% | 1.2%(+11.5)#15 | 0.61%(+12.1)#843 |
| 16. | 82411 | 12.5% | 1.2%(+11.3)#16 | 0.61%(+11.9)#878 |
| 17. | 82831 | 11.2% | 1.2%(+10.1)#17 | 0.61%(+10.6)#1,026 |
| 18. | 82442 | 10.2% | 1.2%(+9.01)#18 | 0.61%(+9.56)#1,187 |
| 19. | 82433 | 9.3% | 1.2%(+8.12)#19 | 0.61%(+8.66)#1,345 |
| 20. | 82242 | 9.1% | 1.2%(+7.94)#20 | 0.61%(+8.49)#1,384 |
| 21. | 82210 | 9.0% | 1.2%(+7.84)#21 | 0.61%(+8.38)#1,409 |
| 22. | 83114 | 8.6% | 1.2%(+7.48)#22 | 0.61%(+8.03)#1,495 |
| 23. | 82639 | 8.5% | 1.2%(+7.40)#23 | 0.61%(+7.94)#1,516 |
| 24. | 82327 | 7.5% | 1.2%(+6.30)#24 | 0.61%(+6.85)#1,833 |
| 25. | 82190 | 7.3% | 1.2%(+6.19)#25 | 0.61%(+6.74)#1,872 |
| 26. | 82838 | 7.3% | 1.2%(+6.10)#26 | 0.61%(+6.65)#1,893 |
| 27. | 82054 | 7.0% | 1.2%(+5.81)#27 | 0.61%(+6.36)#1,991 |
| 28. | 82321 | 6.5% | 1.2%(+5.32)#28 | 0.61%(+5.86)#2,175 |
| 29. | 82933 | 6.1% | 1.2%(+4.93)#29 | 0.61%(+5.48)#2,351 |
| 30. | 82839 | 6.0% | 1.2%(+4.86)#30 | 0.61%(+5.40)#2,385 |
| 31. | 82050 | 5.9% | 1.2%(+4.79)#31 | 0.61%(+5.34)#2,423 |
| 32. | 82421 | 5.9% | 1.2%(+4.78)#32 | 0.61%(+5.33)#2,426 |
| 33. | 82516 | 5.9% | 1.2%(+4.77)#33 | 0.61%(+5.32)#2,429 |
| 34. | 82837 | 5.3% | 1.2%(+4.11)#34 | 0.61%(+4.66)#2,764 |
| 35. | 83116 | 5.2% | 1.2%(+4.06)#35 | 0.61%(+4.60)#2,790 |
| 36. | 83113 | 5.0% | 1.2%(+3.88)#36 | 0.61%(+4.42)#2,912 |
| 37. | 82727 | 4.9% | 1.2%(+3.80)#37 | 0.61%(+4.34)#2,960 |
| 38. | 82325 | 4.4% | 1.2%(+3.26)#38 | 0.61%(+3.81)#3,370 |
| 39. | 82513 | 4.1% | 1.2%(+3.00)#39 | 0.61%(+3.54)#3,586 |
| 40. | 82523 | 4.1% | 1.2%(+2.91)#40 | 0.61%(+3.46)#3,673 |
| 41. | 82720 | 3.9% | 1.2%(+2.72)#41 | 0.61%(+3.27)#3,834 |
| 42. | 82083 | 3.8% | 1.2%(+2.67)#42 | 0.61%(+3.22)#3,882 |
| 43. | 83123 | 3.8% | 1.2%(+2.66)#43 | 0.61%(+3.20)#3,896 |
| 44. | 82334 | 3.7% | 1.2%(+2.55)#44 | 0.61%(+3.10)#3,995 |
| 45. | 82649 | 3.7% | 1.2%(+2.52)#45 | 0.61%(+3.07)#4,027 |
| 46. | 82514 | 3.5% | 1.2%(+2.36)#46 | 0.61%(+2.90)#4,189 |
| 47. | 82925 | 3.4% | 1.2%(+2.30)#47 | 0.61%(+2.84)#4,261 |
| 48. | 82512 | 3.2% | 1.2%(+2.09)#48 | 0.61%(+2.64)#4,497 |
| 49. | 82426 | 3.1% | 1.2%(+1.92)#49 | 0.61%(+2.46)#4,724 |
| 50. | 82633 | 3.0% | 1.2%(+1.90)#50 | 0.61%(+2.44)#4,745 |
| 51. | 82836 | 3.0% | 1.2%(+1.86)#51 | 0.61%(+2.41)#4,793 |
| 52. | 82410 | 2.9% | 1.2%(+1.74)#52 | 0.61%(+2.29)#4,966 |
| 53. | 82721 | 2.7% | 1.2%(+1.56)#53 | 0.61%(+2.10)#5,226 |
| 54. | 82729 | 2.6% | 1.2%(+1.45)#54 | 0.61%(+2.00)#5,377 |
| 55. | 82414 | 2.5% | 1.2%(+1.38)#55 | 0.61%(+1.92)#5,505 |
| 56. | 82329 | 2.5% | 1.2%(+1.35)#56 | 0.61%(+1.89)#5,549 |
| 57. | 82201 | 2.4% | 1.2%(+1.27)#57 | 0.61%(+1.81)#5,697 |
| 58. | 82937 | 2.2% | 1.2%(+1.09)#58 | 0.61%(+1.64)#6,034 |
| 59. | 82730 | 2.2% | 1.2%(+1.03)#59 | 0.61%(+1.57)#6,168 |
| 60. | 82240 | 2.0% | 1.2%(+0.869)#60 | 0.61%(+1.42)#6,503 |
| 61. | 82510 | 1.9% | 1.2%(+0.755)#61 | 0.61%(+1.30)#6,759 |
| 62. | 82520 | 1.7% | 1.2%(+0.505)#62 | 0.61%(+1.05)#7,417 |
| 63. | 83013 | 1.7% | 1.2%(+0.498)#63 | 0.61%(+1.04)#7,434 |
| 64. | 82331 | 1.6% | 1.2%(+0.459)#64 | 0.61%(+1.01)#7,551 |
| 65. | 82082 | 1.5% | 1.2%(+0.365)#65 | 0.61%(+0.911)#7,831 |
| 66. | 82435 | 1.4% | 1.2%(+0.252)#66 | 0.61%(+0.798)#8,196 |
| 67. | 82636 | 1.4% | 1.2%(+0.212)#67 | 0.61%(+0.758)#8,334 |
| 68. | 82501 | 1.3% | 1.2%(+0.159)#68 | 0.61%(+0.706)#8,531 |
| 69. | 82401 | 1.3% | 1.2%(+0.118)#69 | 0.61%(+0.664)#8,686 |
| 70. | 82515 | 1.3% | 1.2%(+0.114)#70 | 0.61%(+0.660)#8,698 |
| 71. | 82070 | 0.96% | 1.2%(-0.194)#71 | 0.61%(+0.353)#9,936 |
| 72. | 82601 | 0.90% | 1.2%(-0.249)#72 | 0.61%(+0.298)#10,212 |
| 73. | 82701 | 0.82% | 1.2%(-0.334)#73 | 0.61%(+0.213)#10,664 |
| 74. | 82443 | 0.82% | 1.2%(-0.335)#74 | 0.61%(+0.211)#10,674 |
| 75. | 82441 | 0.75% | 1.2%(-0.406)#75 | 0.61%(+0.141)#11,095 |
| 76. | 82072 | 0.72% | 1.2%(-0.436)#76 | 0.61%(+0.111)#11,273 |
| 77. | 82053 | 0.68% | 1.2%(-0.468)#77 | 0.61%(+0.078)#11,487 |
| 78. | 82009 | 0.68% | 1.2%(-0.470)#78 | 0.61%(+0.076)#11,502 |
| 79. | 82801 | 0.65% | 1.2%(-0.503)#79 | 0.61%(+0.044)#11,697 |
| 80. | 82718 | 0.64% | 1.2%(-0.514)#80 | 0.61%(+0.033)#11,771 |
| 81. | 82001 | 0.58% | 1.2%(-0.571)#81 | 0.61%(-0.024)#12,196 |
| 82. | 82930 | 0.53% | 1.2%(-0.618)#82 | 0.61%(-0.071)#12,563 |
| 83. | 83110 | 0.51% | 1.2%(-0.643)#83 | 0.61%(-0.097)#12,771 |
| 84. | 83127 | 0.44% | 1.2%(-0.707)#84 | 0.61%(-0.161)#13,337 |
| 85. | 83001 | 0.38% | 1.2%(-0.770)#85 | 0.61%(-0.223)#13,927 |
| 86. | 82301 | 0.38% | 1.2%(-0.772)#86 | 0.61%(-0.226)#13,950 |
| 87. | 82834 | 0.38% | 1.2%(-0.777)#87 | 0.61%(-0.230)#13,995 |
| 88. | 82716 | 0.33% | 1.2%(-0.824)#88 | 0.61%(-0.278)#14,503 |
| 89. | 82604 | 0.27% | 1.2%(-0.883)#89 | 0.61%(-0.337)#15,178 |
| 90. | 82901 | 0.16% | 1.2%(-0.992)#90 | 0.61%(-0.446)#16,753 |
| 91. | 82007 | 0.12% | 1.2%(-1.03)#91 | 0.61%(-0.482)#17,372 |
| 92. | 83128 | 0.10% | 1.2%(-1.05)#92 | 0.61%(-0.502)#17,698 |
1
2Common Questions
What are the Top 10 Zip Codes with the Highest Percentage of Population Employed in Farming, Fishing & Forestry in Wyoming?
Top 10 Zip Codes with the Highest Percentage of Population Employed in Farming, Fishing & Forestry in Wyoming are:
What zip code has the Highest Percentage of Population Employed in Farming, Fishing & Forestry in Wyoming?
82428 has the Highest Percentage of Population Employed in Farming, Fishing & Forestry in Wyoming with 52.2%.
What is the Percentage of Population Employed in Farming, Fishing & Forestry in the State of Wyoming?
Percentage of Population Employed in Farming, Fishing & Forestry in Wyoming is 1.2%.
What is the Percentage of Population Employed in Farming, Fishing & Forestry in the United States?
Percentage of Population Employed in Farming, Fishing & Forestry in the United States is 0.61%.