Upton, WY Map & Demographics
Upton Map
Upton Overview
$41,344
PER CAPITA INCOME
$97,716
AVG FAMILY INCOME
$65,664
AVG HOUSEHOLD INCOME
86.1%
WAGE / INCOME GAP [ % ]
13.9¢/ $1
WAGE / INCOME GAP [ $ ]
0.45
INEQUALITY / GINI INDEX
943
TOTAL POPULATION
421
MALE POPULATION
522
FEMALE POPULATION
80.65
MALES / 100 FEMALES
123.99
FEMALES / 100 MALES
50.4
MEDIAN AGE
2.6
AVG FAMILY SIZE
1.9
AVG HOUSEHOLD SIZE
521
LABOR FORCE [ PEOPLE ]
62.8%
PERCENT IN LABOR FORCE
2.9%
UNEMPLOYMENT RATE
Upton Zip Codes
Upton Area Codes
Income in Upton
Income Overview in Upton
Per Capita Income in Upton is $41,344, while median incomes of families and households are $97,716 and $65,664 respectively.
| Characteristic | Number | Measure |
| Per Capita Income | 943 | $41,344 |
| Median Family Income | 268 | $97,716 |
| Mean Family Income | 268 | $103,778 |
| Median Household Income | 489 | $65,664 |
| Mean Household Income | 489 | $80,725 |
| Income Deficit | 268 | $0 |
| Wage / Income Gap (%) | 943 | 86.05% |
| Wage / Income Gap ($) | 943 | 13.95¢ per $1 |
| Gini / Inequality Index | 943 | 0.45 |
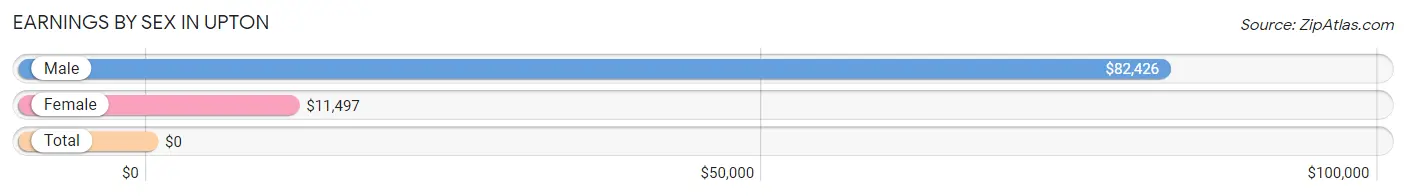
Earnings by Sex in Upton
| Sex | Number | Average Earnings |
| Male | 305 (56.7%) | $82,426 |
| Female | 233 (43.3%) | $11,497 |
| Total | 538 (100.0%) | $0 |
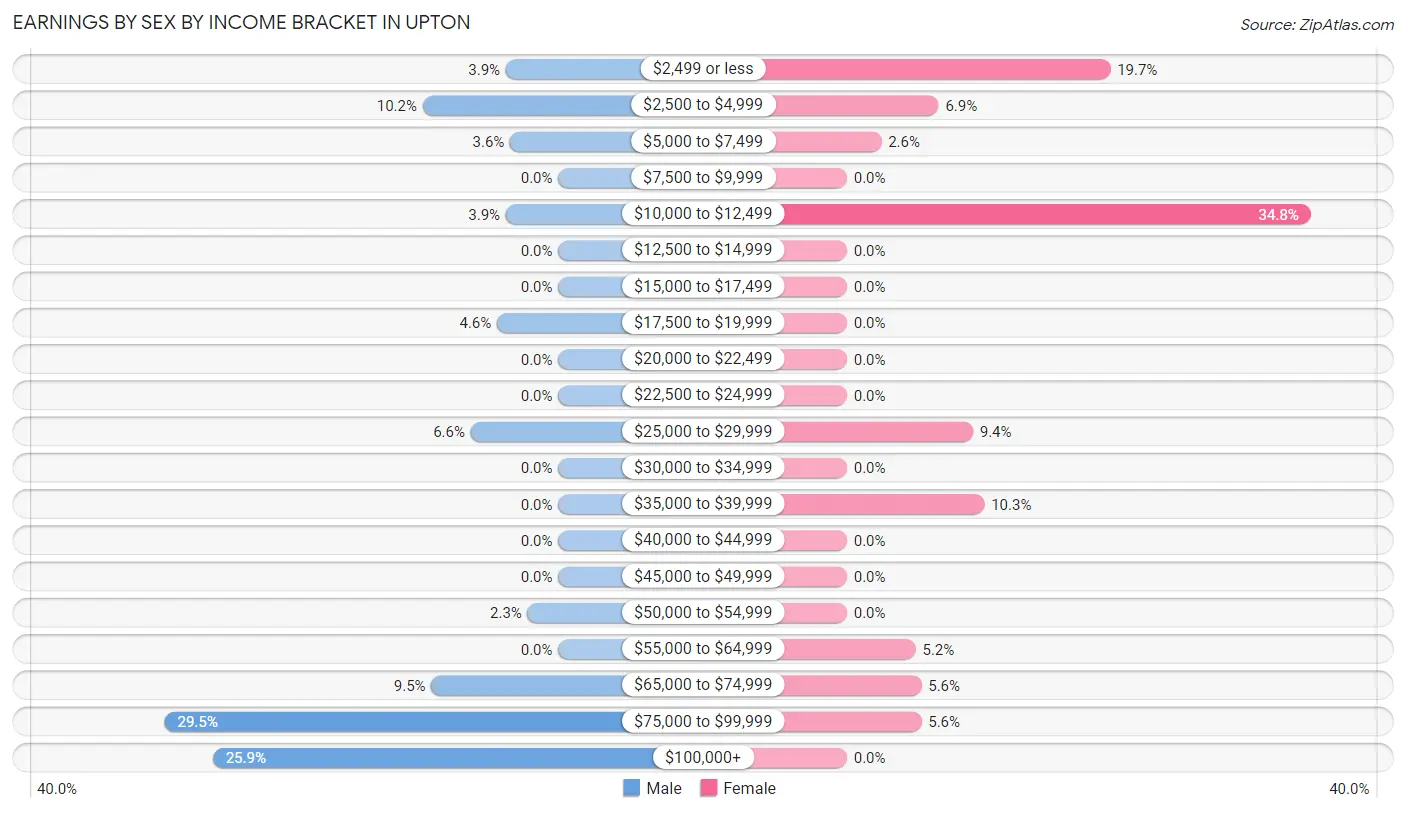
Earnings by Sex by Income Bracket in Upton
The most common earnings brackets in Upton are $75,000 to $99,999 for men (90 | 29.5%) and $10,000 to $12,499 for women (81 | 34.8%).
| Income | Male | Female |
| $2,499 or less | 12 (3.9%) | 46 (19.7%) |
| $2,500 to $4,999 | 31 (10.2%) | 16 (6.9%) |
| $5,000 to $7,499 | 11 (3.6%) | 6 (2.6%) |
| $7,500 to $9,999 | 0 (0.0%) | 0 (0.0%) |
| $10,000 to $12,499 | 12 (3.9%) | 81 (34.8%) |
| $12,500 to $14,999 | 0 (0.0%) | 0 (0.0%) |
| $15,000 to $17,499 | 0 (0.0%) | 0 (0.0%) |
| $17,500 to $19,999 | 14 (4.6%) | 0 (0.0%) |
| $20,000 to $22,499 | 0 (0.0%) | 0 (0.0%) |
| $22,500 to $24,999 | 0 (0.0%) | 0 (0.0%) |
| $25,000 to $29,999 | 20 (6.6%) | 22 (9.4%) |
| $30,000 to $34,999 | 0 (0.0%) | 0 (0.0%) |
| $35,000 to $39,999 | 0 (0.0%) | 24 (10.3%) |
| $40,000 to $44,999 | 0 (0.0%) | 0 (0.0%) |
| $45,000 to $49,999 | 0 (0.0%) | 0 (0.0%) |
| $50,000 to $54,999 | 7 (2.3%) | 0 (0.0%) |
| $55,000 to $64,999 | 0 (0.0%) | 12 (5.1%) |
| $65,000 to $74,999 | 29 (9.5%) | 13 (5.6%) |
| $75,000 to $99,999 | 90 (29.5%) | 13 (5.6%) |
| $100,000+ | 79 (25.9%) | 0 (0.0%) |
| Total | 305 (100.0%) | 233 (100.0%) |
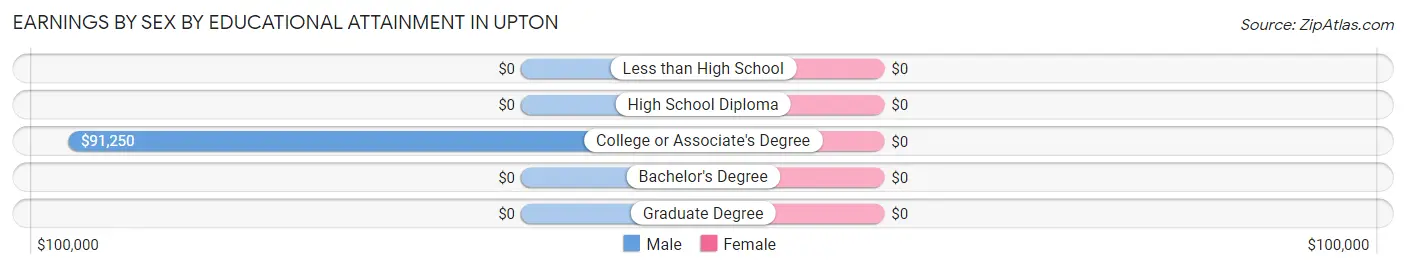
Earnings by Sex by Educational Attainment in Upton
| Educational Attainment | Male Income | Female Income |
| Less than High School | - | - |
| High School Diploma | - | - |
| College or Associate's Degree | $91,250 | $0 |
| Bachelor's Degree | - | - |
| Graduate Degree | - | - |
| Total | $85,216 | $0 |
Family Income in Upton
Family Income Brackets in Upton
According to the Upton family income data, there are 72 families falling into the $75,000 to $99,999 income range, which is the most common income bracket and makes up 26.9% of all families.
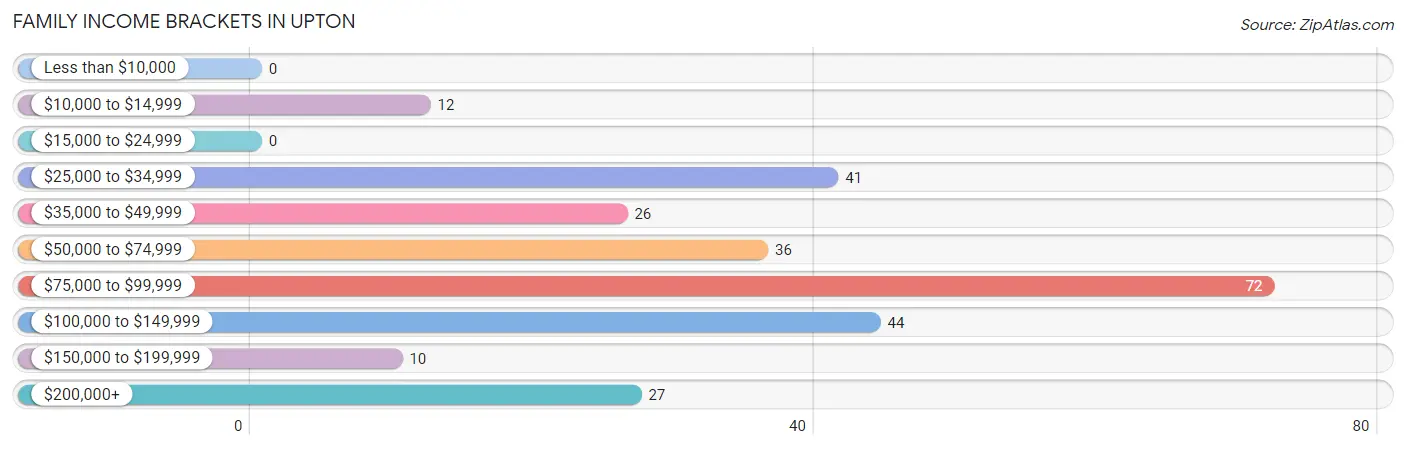
| Income Bracket | # Families | % Families |
| Less than $10,000 | 0 | 0.0% |
| $10,000 to $14,999 | 12 | 4.5% |
| $15,000 to $24,999 | 0 | 0.0% |
| $25,000 to $34,999 | 41 | 15.3% |
| $35,000 to $49,999 | 26 | 9.7% |
| $50,000 to $74,999 | 36 | 13.4% |
| $75,000 to $99,999 | 72 | 26.9% |
| $100,000 to $149,999 | 44 | 16.4% |
| $150,000 to $199,999 | 10 | 3.7% |
| $200,000+ | 27 | 10.1% |
Family Income by Famaliy Size in Upton
2-person families (180 | 67.2%) account for the highest median family income in Upton with $98,060 per family, while 2-person families (180 | 67.2%) have the highest median income of $49,030 per family member.
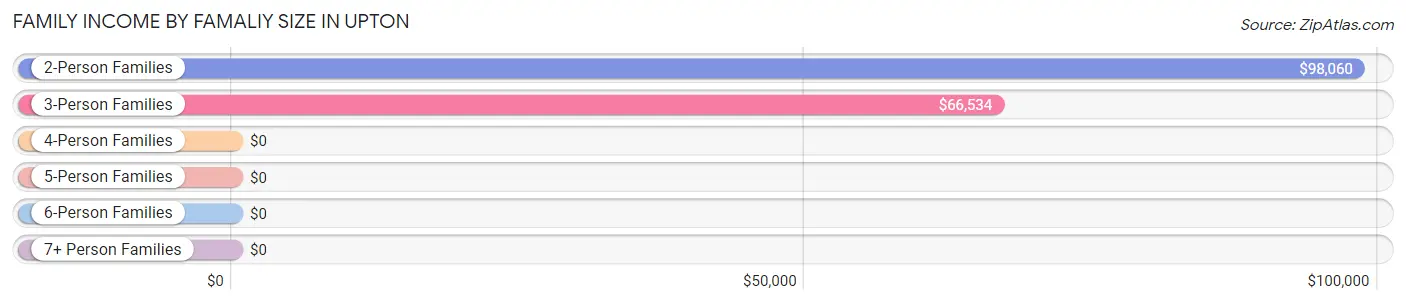
| Income Bracket | # Families | Median Income |
| 2-Person Families | 180 (67.2%) | $98,060 |
| 3-Person Families | 59 (22.0%) | $66,534 |
| 4-Person Families | 23 (8.6%) | $0 |
| 5-Person Families | 6 (2.2%) | $0 |
| 6-Person Families | 0 (0.0%) | $0 |
| 7+ Person Families | 0 (0.0%) | $0 |
| Total | 268 (100.0%) | $97,716 |
Family Income by Number of Earners in Upton
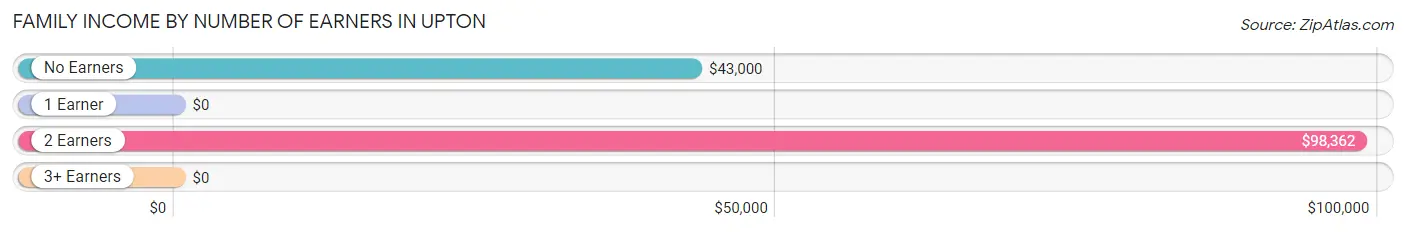
| Number of Earners | # Families | Median Income |
| No Earners | 44 (16.4%) | $43,000 |
| 1 Earner | 100 (37.3%) | $0 |
| 2 Earners | 100 (37.3%) | $98,362 |
| 3+ Earners | 24 (9.0%) | $0 |
| Total | 268 (100.0%) | $97,716 |
Household Income in Upton
Household Income Brackets in Upton
With 96 households falling in the category, the $100,000 to $149,999 income range is the most frequent in Upton, accounting for 19.6% of all households. In contrast, only 9 households (1.8%) fall into the $15,000 to $24,999 income bracket, making it the least populous group.
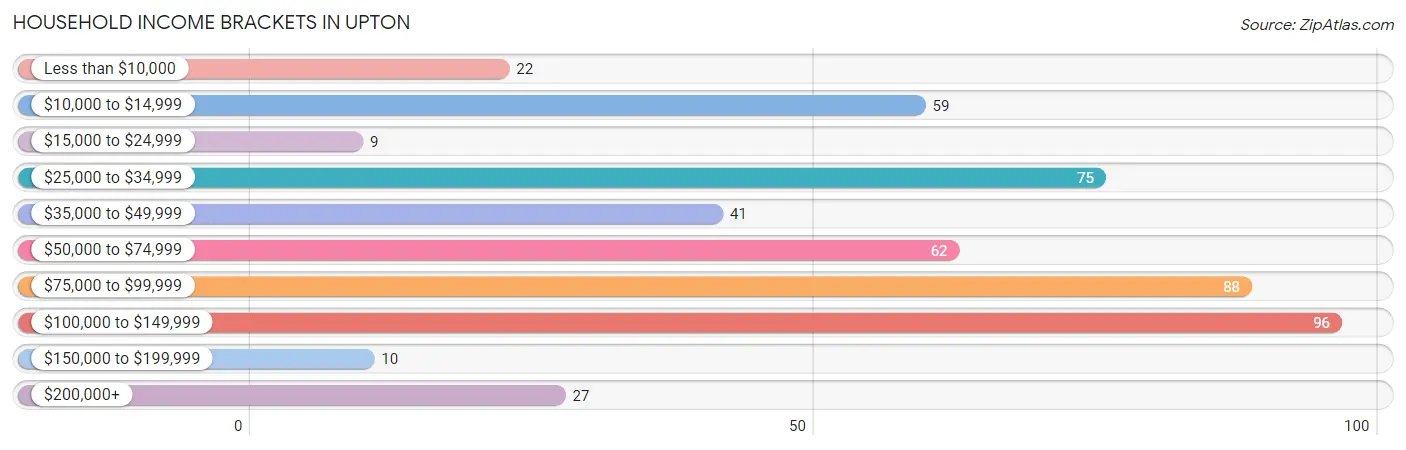
| Income Bracket | # Households | % Households |
| Less than $10,000 | 22 | 4.5% |
| $10,000 to $14,999 | 59 | 12.1% |
| $15,000 to $24,999 | 9 | 1.8% |
| $25,000 to $34,999 | 75 | 15.3% |
| $35,000 to $49,999 | 41 | 8.4% |
| $50,000 to $74,999 | 62 | 12.7% |
| $75,000 to $99,999 | 88 | 18.0% |
| $100,000 to $149,999 | 96 | 19.6% |
| $150,000 to $199,999 | 10 | 2.0% |
| $200,000+ | 27 | 5.5% |
Household Income by Householder Age in Upton
The median household income in Upton is $65,664, with the highest median household income of $98,901 found in the 45 to 64 years age bracket for the primary householder. A total of 231 households (47.2%) fall into this category. Meanwhile, the 15 to 24 years age bracket for the primary householder has the lowest median household income of $0, with 9 households (1.8%) in this group.
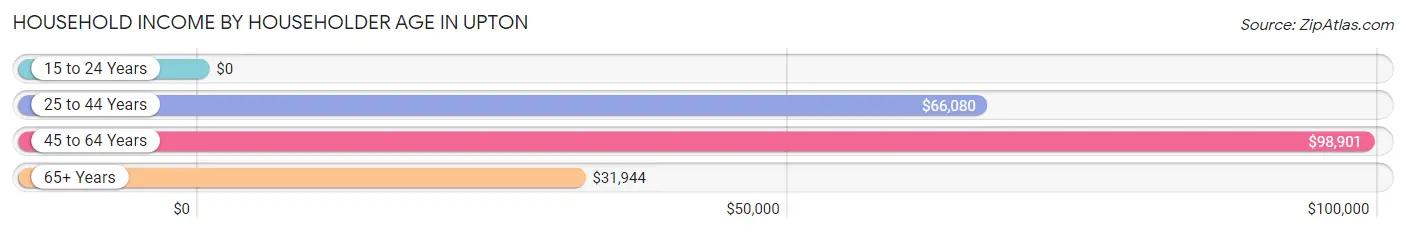
| Income Bracket | # Households | Median Income |
| 15 to 24 Years | 9 (1.8%) | $0 |
| 25 to 44 Years | 69 (14.1%) | $66,080 |
| 45 to 64 Years | 231 (47.2%) | $98,901 |
| 65+ Years | 180 (36.8%) | $31,944 |
| Total | 489 (100.0%) | $65,664 |
Poverty in Upton
Income Below Poverty by Sex and Age in Upton
With 13.1% poverty level for males and 9.8% for females among the residents of Upton, 25 to 34 year old males and 65 to 74 year old females are the most vulnerable to poverty, with 31 males (100.0%) and 35 females (50.0%) in their respective age groups living below the poverty level.
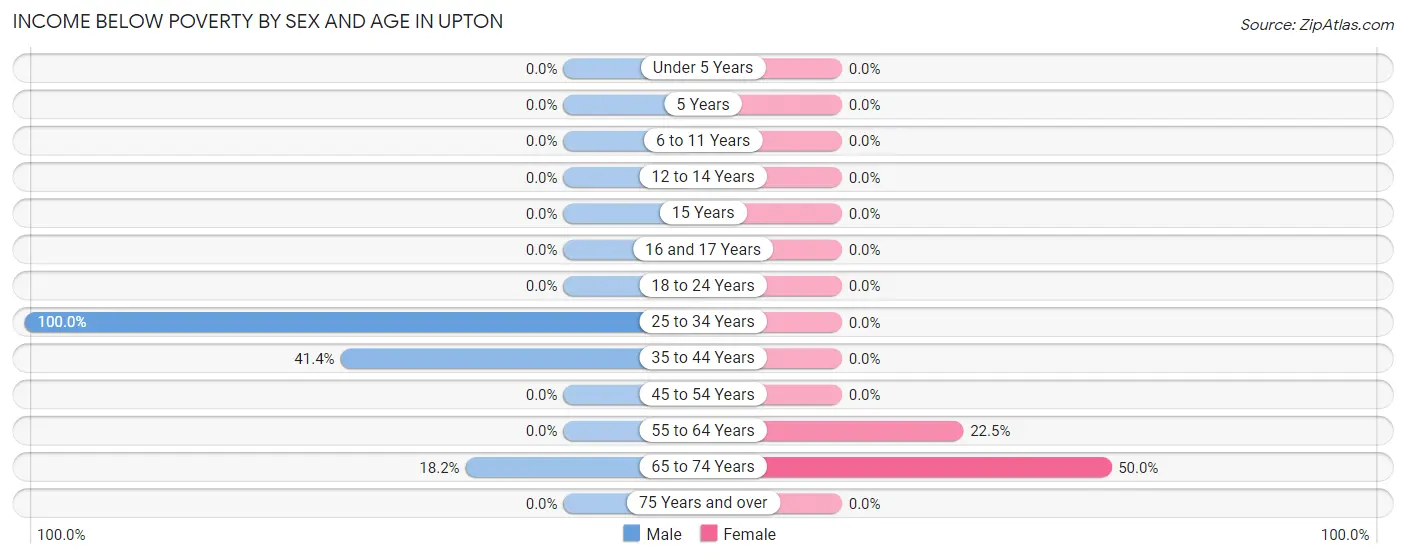
| Age Bracket | Male | Female |
| Under 5 Years | 0 (0.0%) | 0 (0.0%) |
| 5 Years | 0 (0.0%) | 0 (0.0%) |
| 6 to 11 Years | 0 (0.0%) | 0 (0.0%) |
| 12 to 14 Years | 0 (0.0%) | 0 (0.0%) |
| 15 Years | 0 (0.0%) | 0 (0.0%) |
| 16 and 17 Years | 0 (0.0%) | 0 (0.0%) |
| 18 to 24 Years | 0 (0.0%) | 0 (0.0%) |
| 25 to 34 Years | 31 (100.0%) | 0 (0.0%) |
| 35 to 44 Years | 12 (41.4%) | 0 (0.0%) |
| 45 to 54 Years | 0 (0.0%) | 0 (0.0%) |
| 55 to 64 Years | 0 (0.0%) | 16 (22.5%) |
| 65 to 74 Years | 12 (18.2%) | 35 (50.0%) |
| 75 Years and over | 0 (0.0%) | 0 (0.0%) |
| Total | 55 (13.1%) | 51 (9.8%) |
Income Above Poverty by Sex and Age in Upton
According to the poverty statistics in Upton, males aged 5 years and females aged under 5 years are the age groups that are most secure financially, with 100.0% of males and 100.0% of females in these age groups living above the poverty line.
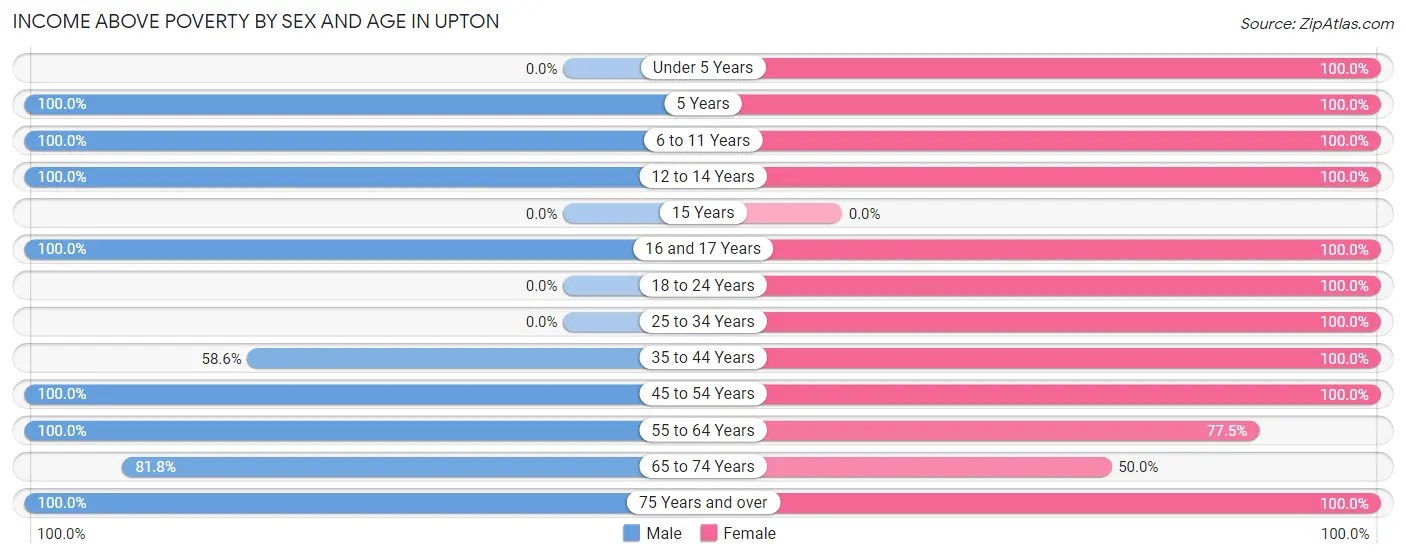
| Age Bracket | Male | Female |
| Under 5 Years | 0 (0.0%) | 32 (100.0%) |
| 5 Years | 11 (100.0%) | 33 (100.0%) |
| 6 to 11 Years | 17 (100.0%) | 5 (100.0%) |
| 12 to 14 Years | 5 (100.0%) | 10 (100.0%) |
| 15 Years | 0 (0.0%) | 0 (0.0%) |
| 16 and 17 Years | 11 (100.0%) | 17 (100.0%) |
| 18 to 24 Years | 0 (0.0%) | 40 (100.0%) |
| 25 to 34 Years | 0 (0.0%) | 22 (100.0%) |
| 35 to 44 Years | 17 (58.6%) | 31 (100.0%) |
| 45 to 54 Years | 145 (100.0%) | 115 (100.0%) |
| 55 to 64 Years | 48 (100.0%) | 55 (77.5%) |
| 65 to 74 Years | 54 (81.8%) | 35 (50.0%) |
| 75 Years and over | 58 (100.0%) | 76 (100.0%) |
| Total | 366 (86.9%) | 471 (90.2%) |
Income Below Poverty Among Married-Couple Families in Upton
The poverty statistics for married-couple families in Upton show that 5.4% or 12 of the total 223 families live below the poverty line. Families with no children have the highest poverty rate of 7.0%, comprising of 12 families. On the other hand, families with 1 or 2 children have the lowest poverty rate of 0.0%, which includes 0 families.
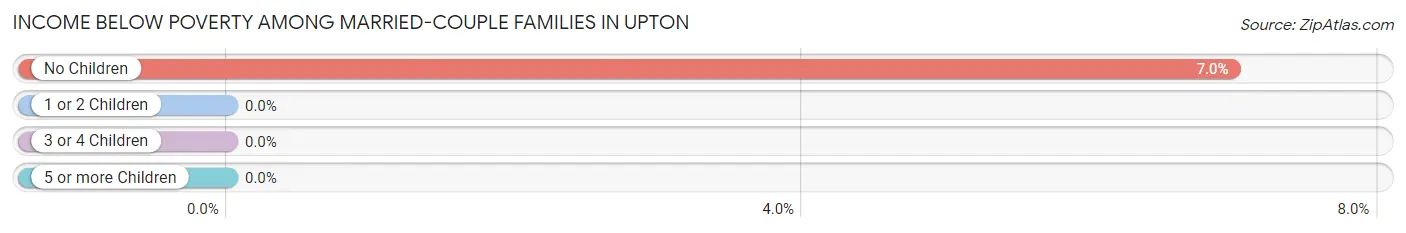
| Children | Above Poverty | Below Poverty |
| No Children | 160 (93.0%) | 12 (7.0%) |
| 1 or 2 Children | 45 (100.0%) | 0 (0.0%) |
| 3 or 4 Children | 6 (100.0%) | 0 (0.0%) |
| 5 or more Children | 0 (0.0%) | 0 (0.0%) |
| Total | 211 (94.6%) | 12 (5.4%) |
Income Below Poverty Among Single-Parent Households in Upton
| Children | Single Father | Single Mother |
| No Children | 0 (0.0%) | 0 (0.0%) |
| 1 or 2 Children | 0 (0.0%) | 0 (0.0%) |
| 3 or 4 Children | 0 (0.0%) | 0 (0.0%) |
| 5 or more Children | 0 (0.0%) | 0 (0.0%) |
| Total | 0 (0.0%) | 0 (0.0%) |
Income Below Poverty Among Married-Couple vs Single-Parent Households in Upton
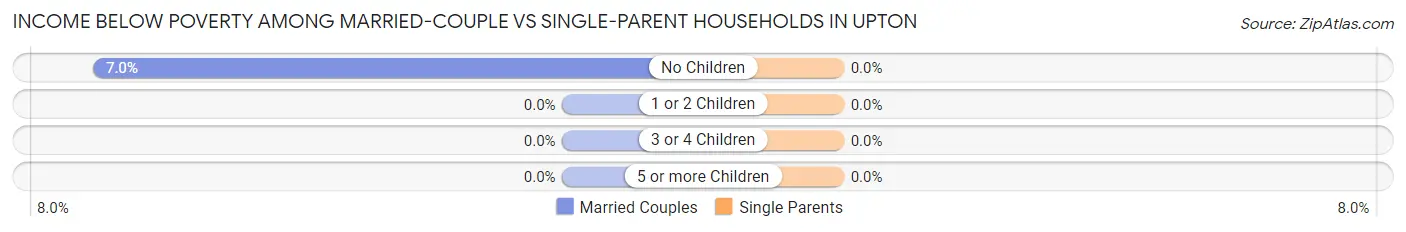
| Children | Married-Couple Families | Single-Parent Households |
| No Children | 12 (7.0%) | 0 (0.0%) |
| 1 or 2 Children | 0 (0.0%) | 0 (0.0%) |
| 3 or 4 Children | 0 (0.0%) | 0 (0.0%) |
| 5 or more Children | 0 (0.0%) | 0 (0.0%) |
| Total | 12 (5.4%) | 0 (0.0%) |
Race in Upton
The most populous races in Upton are White / Caucasian (865 | 91.7%), Two or more Races (70 | 7.4%), and Hispanic or Latino (20 | 2.1%).
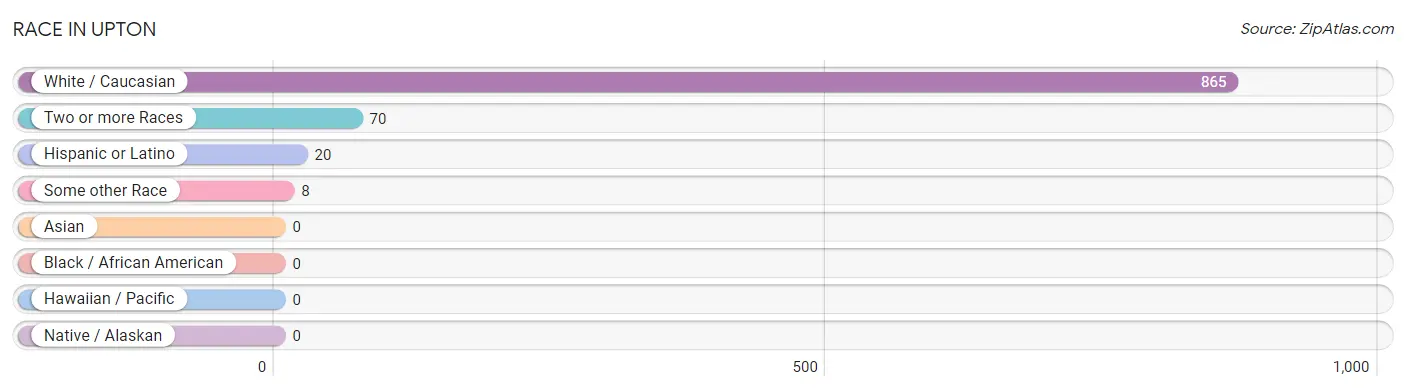
| Race | # Population | % Population |
| Asian | 0 | 0.0% |
| Black / African American | 0 | 0.0% |
| Hawaiian / Pacific | 0 | 0.0% |
| Hispanic or Latino | 20 | 2.1% |
| Native / Alaskan | 0 | 0.0% |
| White / Caucasian | 865 | 91.7% |
| Two or more Races | 70 | 7.4% |
| Some other Race | 8 | 0.9% |
| Total | 943 | 100.0% |
Ancestry in Upton
The most populous ancestries reported in Upton are German (428 | 45.4%), Irish (150 | 15.9%), English (106 | 11.2%), Cherokee (70 | 7.4%), and Dutch (56 | 5.9%), together accounting for 85.9% of all Upton residents.
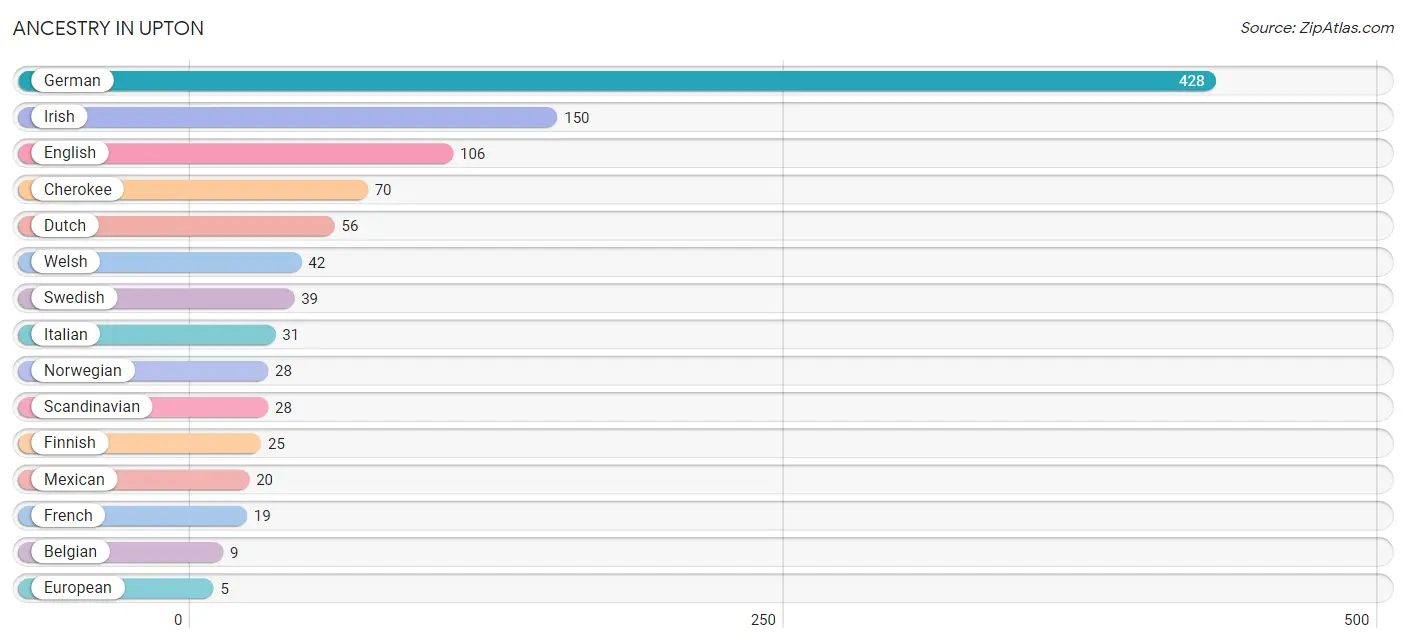
| Ancestry | # Population | % Population |
| American | 4 | 0.4% |
| Belgian | 9 | 0.9% |
| Cherokee | 70 | 7.4% |
| Dutch | 56 | 5.9% |
| English | 106 | 11.2% |
| European | 5 | 0.5% |
| Finnish | 25 | 2.6% |
| French | 19 | 2.0% |
| German | 428 | 45.4% |
| Irish | 150 | 15.9% |
| Italian | 31 | 3.3% |
| Mexican | 20 | 2.1% |
| Norwegian | 28 | 3.0% |
| Scandinavian | 28 | 3.0% |
| Swedish | 39 | 4.1% |
| Welsh | 42 | 4.4% | View All 16 Rows |
Immigrants in Upton

| Immigration Origin | # Population | % Population | View All 0 Rows |
Sex and Age in Upton
Sex and Age in Upton
The most populous age groups in Upton are 45 to 49 Years (91 | 21.6%) for men and 50 to 54 Years (72 | 13.8%) for women.
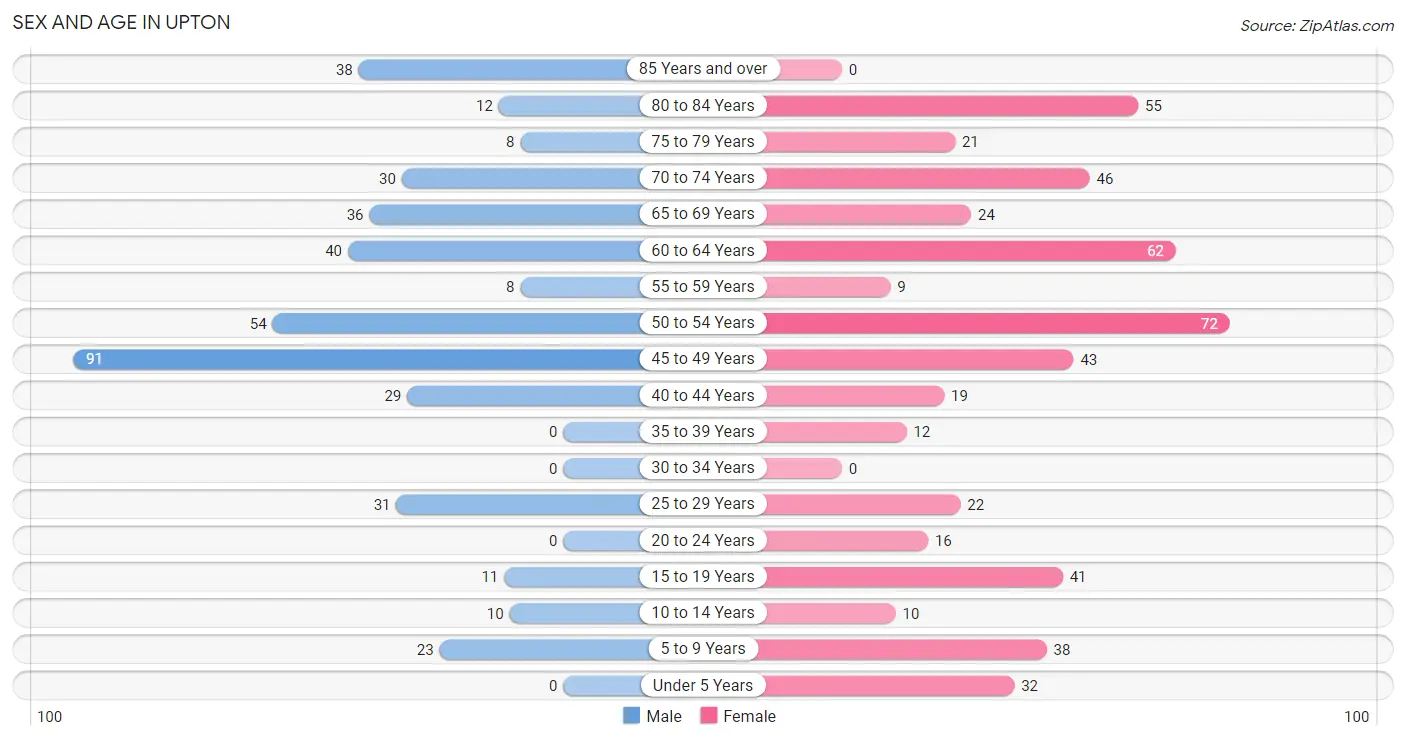
| Age Bracket | Male | Female |
| Under 5 Years | 0 (0.0%) | 32 (6.1%) |
| 5 to 9 Years | 23 (5.5%) | 38 (7.3%) |
| 10 to 14 Years | 10 (2.4%) | 10 (1.9%) |
| 15 to 19 Years | 11 (2.6%) | 41 (7.9%) |
| 20 to 24 Years | 0 (0.0%) | 16 (3.1%) |
| 25 to 29 Years | 31 (7.4%) | 22 (4.2%) |
| 30 to 34 Years | 0 (0.0%) | 0 (0.0%) |
| 35 to 39 Years | 0 (0.0%) | 12 (2.3%) |
| 40 to 44 Years | 29 (6.9%) | 19 (3.6%) |
| 45 to 49 Years | 91 (21.6%) | 43 (8.2%) |
| 50 to 54 Years | 54 (12.8%) | 72 (13.8%) |
| 55 to 59 Years | 8 (1.9%) | 9 (1.7%) |
| 60 to 64 Years | 40 (9.5%) | 62 (11.9%) |
| 65 to 69 Years | 36 (8.6%) | 24 (4.6%) |
| 70 to 74 Years | 30 (7.1%) | 46 (8.8%) |
| 75 to 79 Years | 8 (1.9%) | 21 (4.0%) |
| 80 to 84 Years | 12 (2.9%) | 55 (10.5%) |
| 85 Years and over | 38 (9.0%) | 0 (0.0%) |
| Total | 421 (100.0%) | 522 (100.0%) |
Families and Households in Upton
Median Family Size in Upton
The median family size in Upton is 2.56 persons per family, with single male/father families (16 | 6.0%) accounting for the largest median family size of 3.19 persons per family. On the other hand, single female/mother families (29 | 10.8%) represent the smallest median family size with 2.38 persons per family.
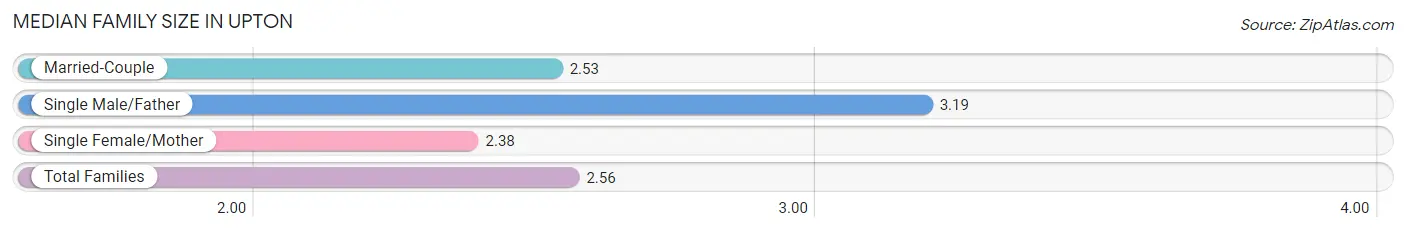
| Family Type | # Families | Family Size |
| Married-Couple | 223 (83.2%) | 2.53 |
| Single Male/Father | 16 (6.0%) | 3.19 |
| Single Female/Mother | 29 (10.8%) | 2.38 |
| Total Families | 268 (100.0%) | 2.56 |
Median Household Size in Upton
The median household size in Upton is 1.93 persons per household, with single female/mother households (29 | 5.9%) accounting for the largest median household size of 3.45 persons per household. non-family households (221 | 45.2%) represent the smallest median household size with 1.03 persons per household.
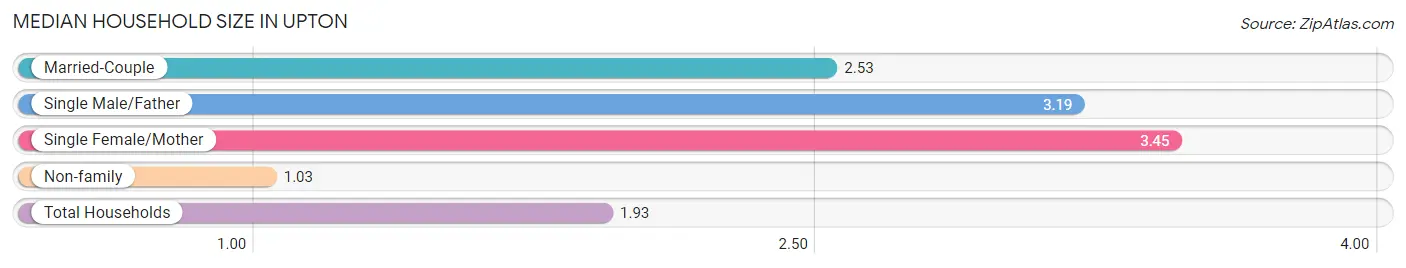
| Household Type | # Households | Household Size |
| Married-Couple | 223 (45.6%) | 2.53 |
| Single Male/Father | 16 (3.3%) | 3.19 |
| Single Female/Mother | 29 (5.9%) | 3.45 |
| Non-family | 221 (45.2%) | 1.03 |
| Total Households | 489 (100.0%) | 1.93 |
Household Size by Marriage Status in Upton
Out of a total of 489 households in Upton, 268 (54.8%) are family households, while 221 (45.2%) are nonfamily households. The most numerous type of family households are 2-person households, comprising 167, and the most common type of nonfamily households are 1-person households, comprising 214.
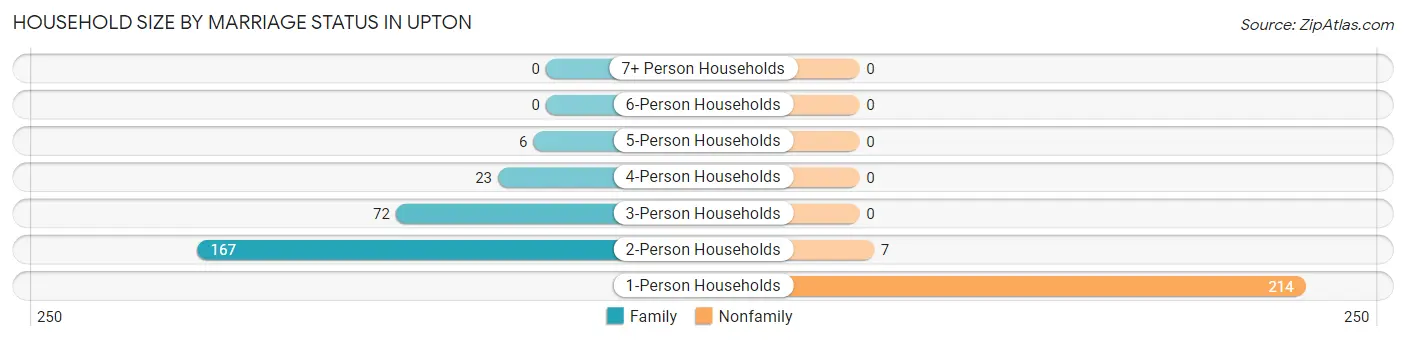
| Household Size | Family Households | Nonfamily Households |
| 1-Person Households | - | 214 (43.8%) |
| 2-Person Households | 167 (34.2%) | 7 (1.4%) |
| 3-Person Households | 72 (14.7%) | 0 (0.0%) |
| 4-Person Households | 23 (4.7%) | 0 (0.0%) |
| 5-Person Households | 6 (1.2%) | 0 (0.0%) |
| 6-Person Households | 0 (0.0%) | 0 (0.0%) |
| 7+ Person Households | 0 (0.0%) | 0 (0.0%) |
| Total | 268 (54.8%) | 221 (45.2%) |
Female Fertility in Upton
Fertility by Age in Upton
Average fertility rate in Upton is 71.0 births per 1,000 women. Women in the age bracket of 20 to 34 years have the highest fertility rate with 421.0 births per 1,000 women. Women in the age bracket of 20 to 34 years acount for 100.0% of all women with births.
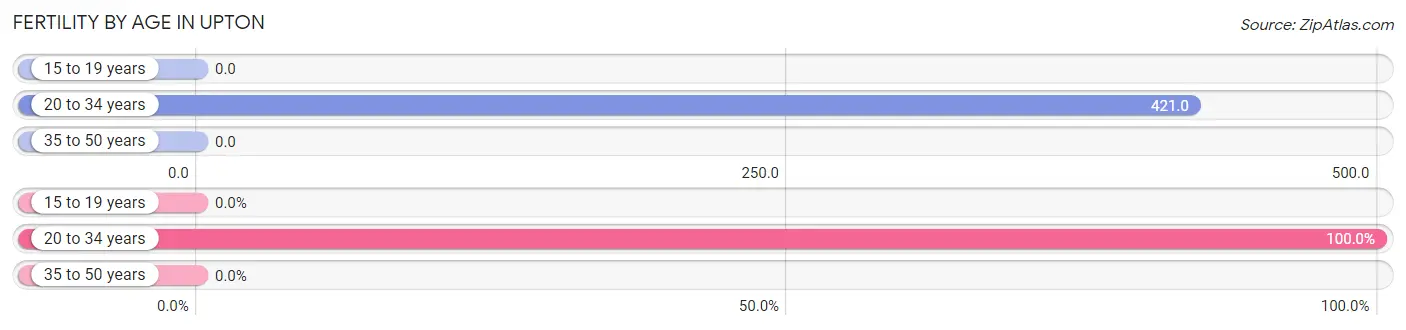
| Age Bracket | Women with Births | Births / 1,000 Women |
| 15 to 19 years | 0 (0.0%) | 0.0 |
| 20 to 34 years | 16 (100.0%) | 421.0 |
| 35 to 50 years | 0 (0.0%) | 0.0 |
| Total | 16 (100.0%) | 71.0 |
Fertility by Age by Marriage Status in Upton
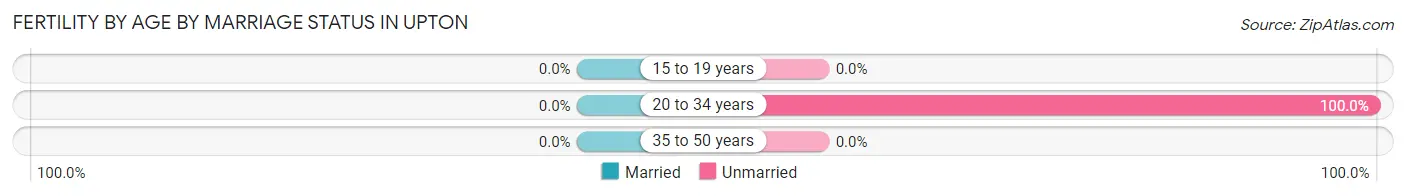
| Age Bracket | Married | Unmarried |
| 15 to 19 years | 0 (0.0%) | 0 (0.0%) |
| 20 to 34 years | 0 (0.0%) | 16 (100.0%) |
| 35 to 50 years | 0 (0.0%) | 0 (0.0%) |
| Total | 0 (0.0%) | 16 (100.0%) |
Fertility by Education in Upton
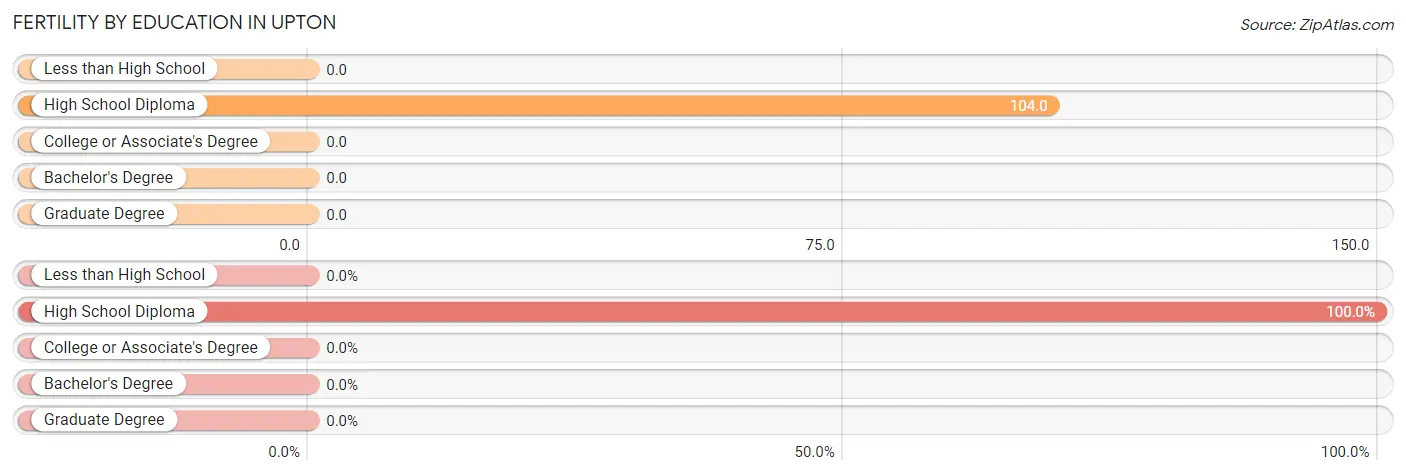
| Educational Attainment | Women with Births | Births / 1,000 Women |
| Less than High School | 0 (0.0%) | 0.0 |
| High School Diploma | 16 (100.0%) | 104.0 |
| College or Associate's Degree | 0 (0.0%) | 0.0 |
| Bachelor's Degree | 0 (0.0%) | 0.0 |
| Graduate Degree | 0 (0.0%) | 0.0 |
| Total | 16 (100.0%) | 71.0 |
Fertility by Education by Marriage Status in Upton
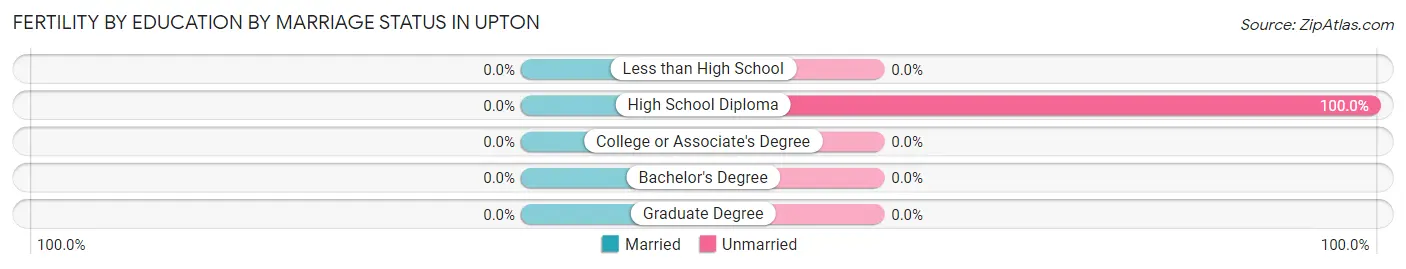
| Educational Attainment | Married | Unmarried |
| Less than High School | 0 (0.0%) | 0 (0.0%) |
| High School Diploma | 0 (0.0%) | 16 (100.0%) |
| College or Associate's Degree | 0 (0.0%) | 0 (0.0%) |
| Bachelor's Degree | 0 (0.0%) | 0 (0.0%) |
| Graduate Degree | 0 (0.0%) | 0 (0.0%) |
| Total | 0 (0.0%) | 16 (100.0%) |
Employment Characteristics in Upton
Employment by Class of Employer in Upton
Among the 461 employed individuals in Upton, private company employees (331 | 71.8%), local government employees (54 | 11.7%), and self-employed (not incorporated) (39 | 8.5%) make up the most common classes of employment.
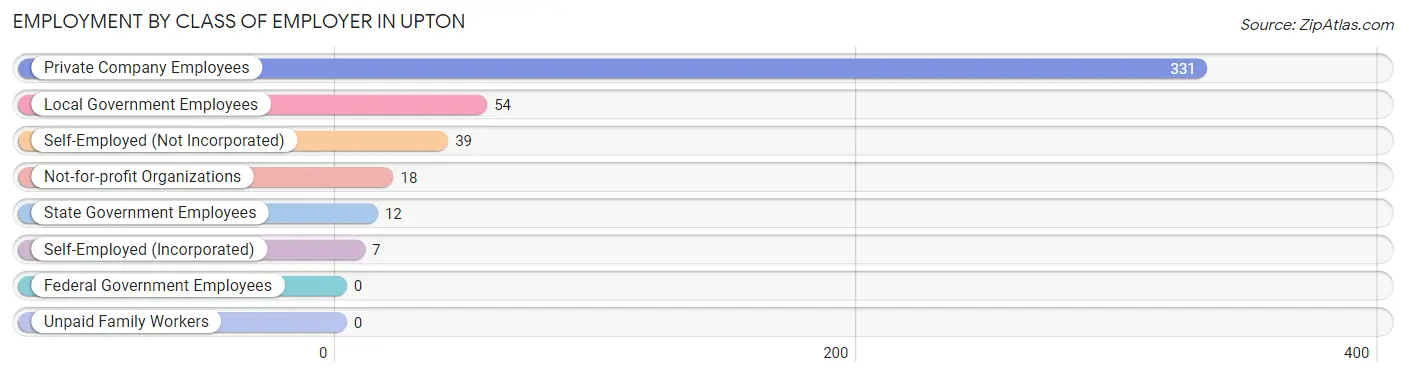
| Employer Class | # Employees | % Employees |
| Private Company Employees | 331 | 71.8% |
| Self-Employed (Incorporated) | 7 | 1.5% |
| Self-Employed (Not Incorporated) | 39 | 8.5% |
| Not-for-profit Organizations | 18 | 3.9% |
| Local Government Employees | 54 | 11.7% |
| State Government Employees | 12 | 2.6% |
| Federal Government Employees | 0 | 0.0% |
| Unpaid Family Workers | 0 | 0.0% |
| Total | 461 | 100.0% |
Employment Status by Age in Upton
According to the labor force statistics for Upton, out of the total population over 16 years of age (830), 62.8% or 521 individuals are in the labor force, with 2.9% or 15 of them unemployed. The age group with the highest labor force participation rate is 20 to 24 years, with 100.0% or 16 individuals in the labor force. Within the labor force, the 16 to 19 years age range has the highest percentage of unemployed individuals, with 42.9% or 15 of them being unemployed.
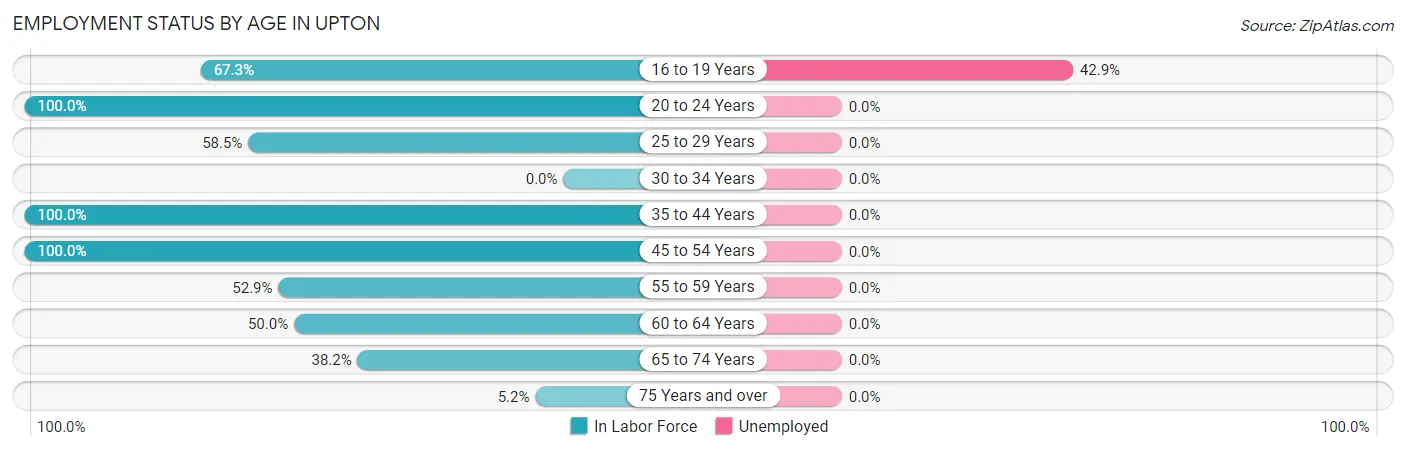
| Age Bracket | In Labor Force | Unemployed |
| 16 to 19 Years | 35 (67.3%) | 15 (42.9%) |
| 20 to 24 Years | 16 (100.0%) | 0 (0.0%) |
| 25 to 29 Years | 31 (58.5%) | 0 (0.0%) |
| 30 to 34 Years | 0 (0.0%) | 0 (0.0%) |
| 35 to 44 Years | 60 (100.0%) | 0 (0.0%) |
| 45 to 54 Years | 260 (100.0%) | 0 (0.0%) |
| 55 to 59 Years | 9 (52.9%) | 0 (0.0%) |
| 60 to 64 Years | 51 (50.0%) | 0 (0.0%) |
| 65 to 74 Years | 52 (38.2%) | 0 (0.0%) |
| 75 Years and over | 7 (5.2%) | 0 (0.0%) |
| Total | 521 (62.8%) | 15 (2.9%) |
Employment Status by Educational Attainment in Upton
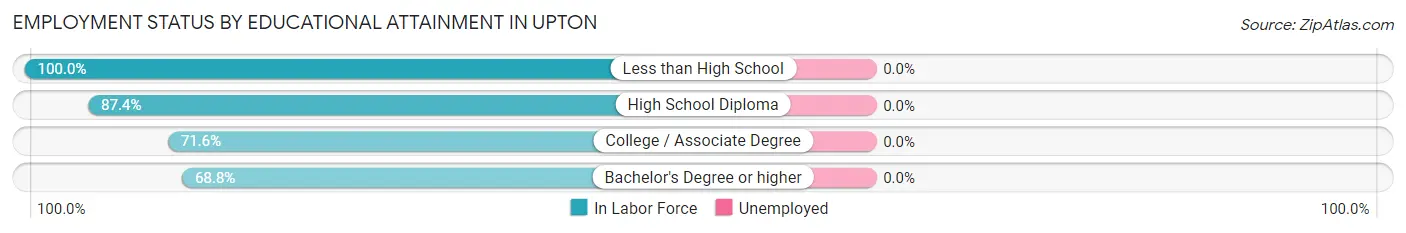
| Educational Attainment | In Labor Force | Unemployed |
| Less than High School | 81 (100.0%) | 0 (0.0%) |
| High School Diploma | 208 (87.4%) | 0 (0.0%) |
| College / Associate Degree | 78 (71.6%) | 0 (0.0%) |
| Bachelor's Degree or higher | 44 (68.8%) | 0 (0.0%) |
| Total | 411 (83.5%) | 0 (0.0%) |
Employment Occupations by Sex in Upton
Management, Business, Science and Arts Occupations
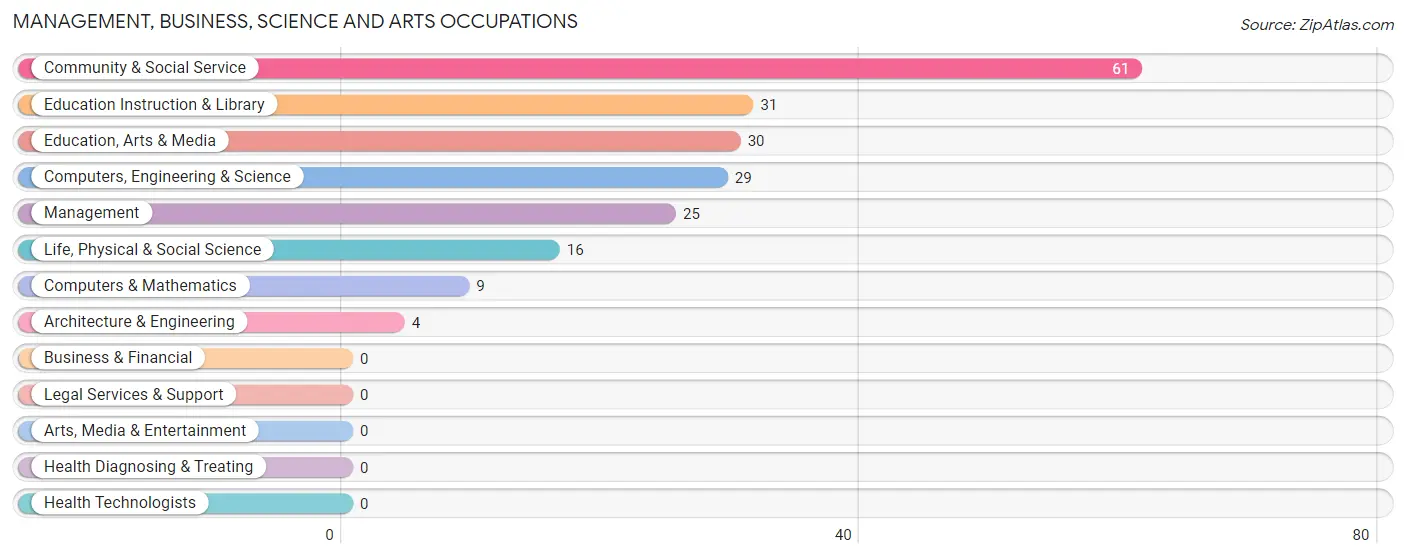
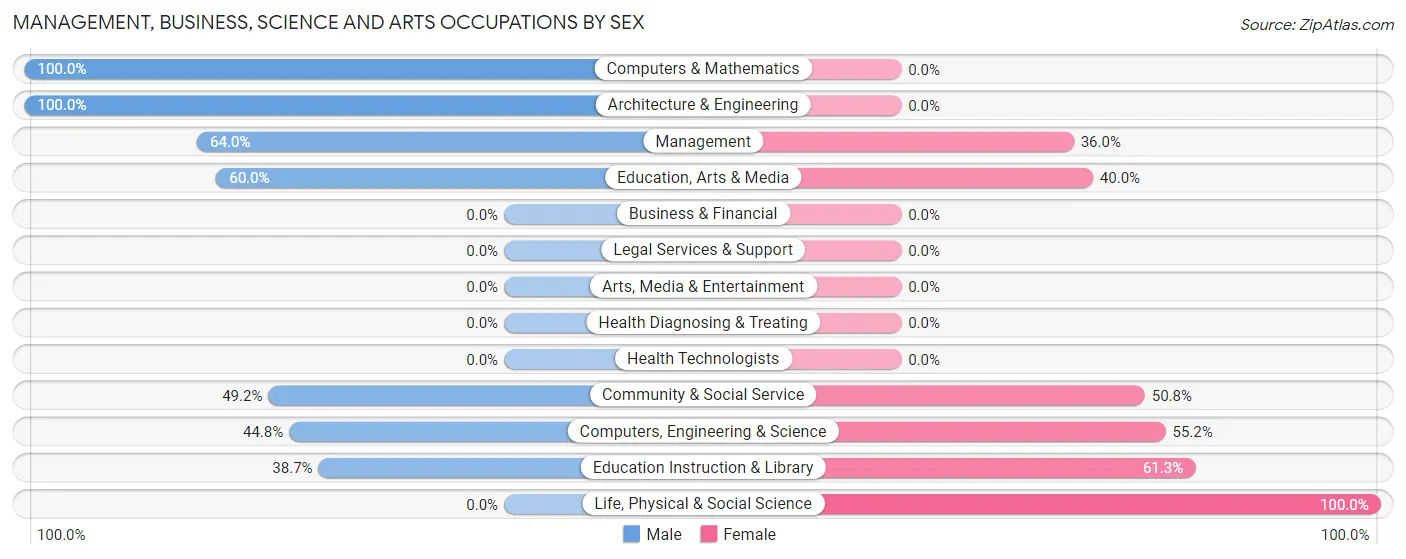
The most common Management, Business, Science and Arts occupations in Upton are Community & Social Service (61 | 12.1%), Education Instruction & Library (31 | 6.1%), Education, Arts & Media (30 | 5.9%), Computers, Engineering & Science (29 | 5.7%), and Management (25 | 4.9%).
Management, Business, Science and Arts Occupations by Sex
Within the Management, Business, Science and Arts occupations in Upton, the most male-oriented occupations are Computers & Mathematics (100.0%), Architecture & Engineering (100.0%), and Management (64.0%), while the most female-oriented occupations are Life, Physical & Social Science (100.0%), Education Instruction & Library (61.3%), and Computers, Engineering & Science (55.2%).
| Occupation | Male | Female |
| Management | 16 (64.0%) | 9 (36.0%) |
| Business & Financial | 0 (0.0%) | 0 (0.0%) |
| Computers, Engineering & Science | 13 (44.8%) | 16 (55.2%) |
| Computers & Mathematics | 9 (100.0%) | 0 (0.0%) |
| Architecture & Engineering | 4 (100.0%) | 0 (0.0%) |
| Life, Physical & Social Science | 0 (0.0%) | 16 (100.0%) |
| Community & Social Service | 30 (49.2%) | 31 (50.8%) |
| Education, Arts & Media | 18 (60.0%) | 12 (40.0%) |
| Legal Services & Support | 0 (0.0%) | 0 (0.0%) |
| Education Instruction & Library | 12 (38.7%) | 19 (61.3%) |
| Arts, Media & Entertainment | 0 (0.0%) | 0 (0.0%) |
| Health Diagnosing & Treating | 0 (0.0%) | 0 (0.0%) |
| Health Technologists | 0 (0.0%) | 0 (0.0%) |
| Total (Category) | 59 (51.3%) | 56 (48.7%) |
| Total (Overall) | 305 (60.3%) | 201 (39.7%) |
Services Occupations
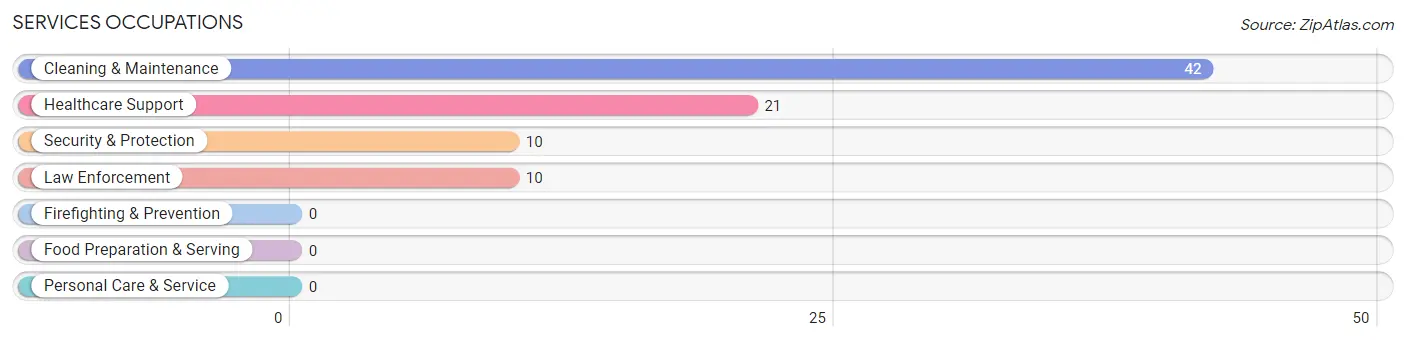
The most common Services occupations in Upton are Cleaning & Maintenance (42 | 8.3%), Healthcare Support (21 | 4.2%), Security & Protection (10 | 2.0%), and Law Enforcement (10 | 2.0%).
Services Occupations by Sex
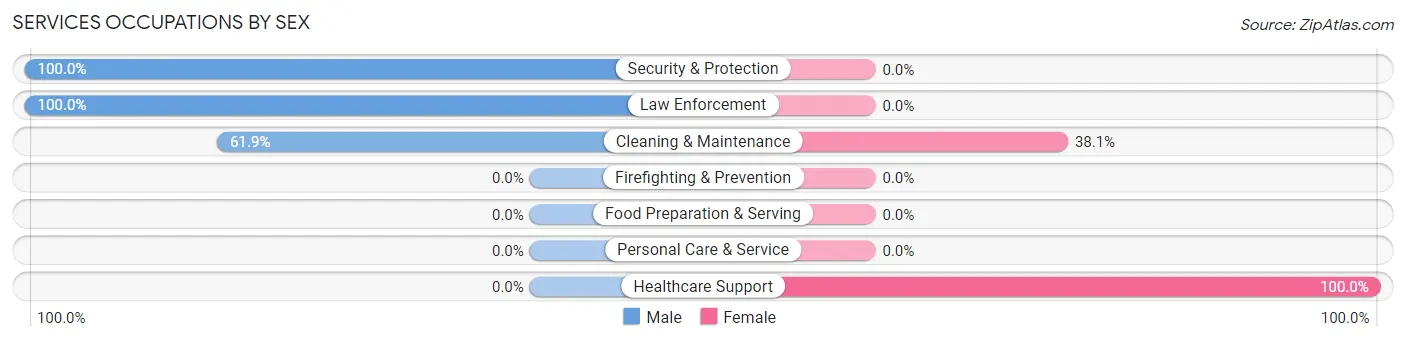
Within the Services occupations in Upton, the most male-oriented occupations are Security & Protection (100.0%), Law Enforcement (100.0%), and Cleaning & Maintenance (61.9%), while the most female-oriented occupations are Healthcare Support (100.0%), and Cleaning & Maintenance (38.1%).
| Occupation | Male | Female |
| Healthcare Support | 0 (0.0%) | 21 (100.0%) |
| Security & Protection | 10 (100.0%) | 0 (0.0%) |
| Firefighting & Prevention | 0 (0.0%) | 0 (0.0%) |
| Law Enforcement | 10 (100.0%) | 0 (0.0%) |
| Food Preparation & Serving | 0 (0.0%) | 0 (0.0%) |
| Cleaning & Maintenance | 26 (61.9%) | 16 (38.1%) |
| Personal Care & Service | 0 (0.0%) | 0 (0.0%) |
| Total (Category) | 36 (49.3%) | 37 (50.7%) |
| Total (Overall) | 305 (60.3%) | 201 (39.7%) |
Sales and Office Occupations
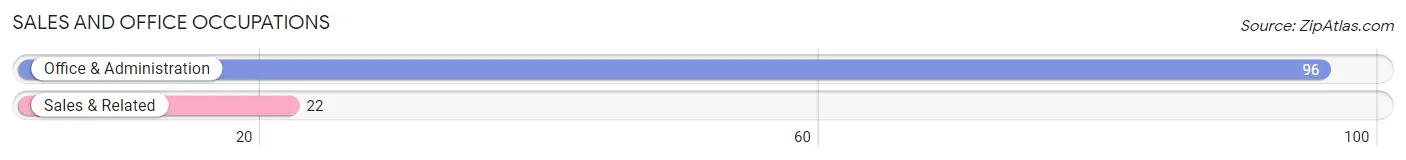
The most common Sales and Office occupations in Upton are Office & Administration (96 | 19.0%), and Sales & Related (22 | 4.3%).
Sales and Office Occupations by Sex
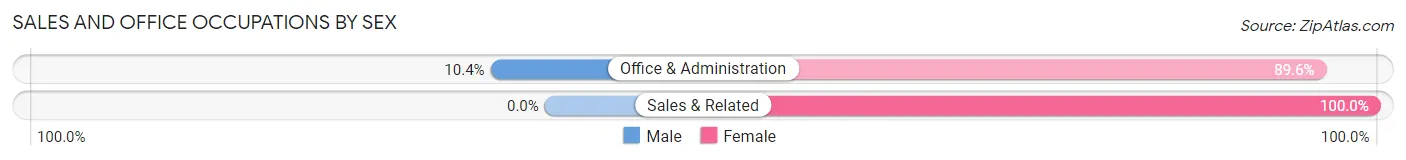
| Occupation | Male | Female |
| Sales & Related | 0 (0.0%) | 22 (100.0%) |
| Office & Administration | 10 (10.4%) | 86 (89.6%) |
| Total (Category) | 10 (8.5%) | 108 (91.5%) |
| Total (Overall) | 305 (60.3%) | 201 (39.7%) |
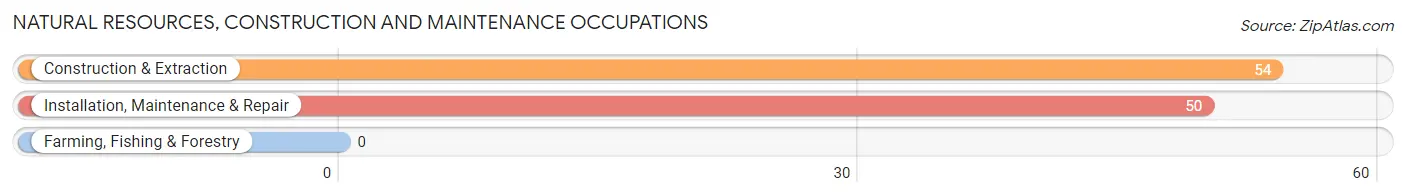
Natural Resources, Construction and Maintenance Occupations
The most common Natural Resources, Construction and Maintenance occupations in Upton are Construction & Extraction (54 | 10.7%), and Installation, Maintenance & Repair (50 | 9.9%).
Natural Resources, Construction and Maintenance Occupations by Sex
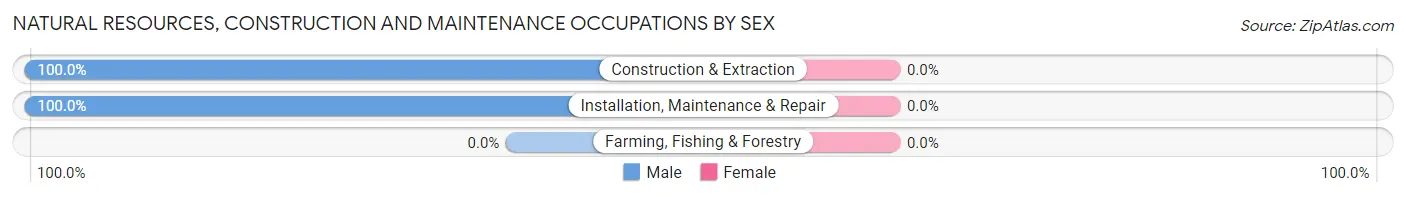
| Occupation | Male | Female |
| Farming, Fishing & Forestry | 0 (0.0%) | 0 (0.0%) |
| Construction & Extraction | 54 (100.0%) | 0 (0.0%) |
| Installation, Maintenance & Repair | 50 (100.0%) | 0 (0.0%) |
| Total (Category) | 104 (100.0%) | 0 (0.0%) |
| Total (Overall) | 305 (60.3%) | 201 (39.7%) |
Production, Transportation and Moving Occupations
The most common Production, Transportation and Moving occupations in Upton are Transportation (65 | 12.9%), and Production (31 | 6.1%).
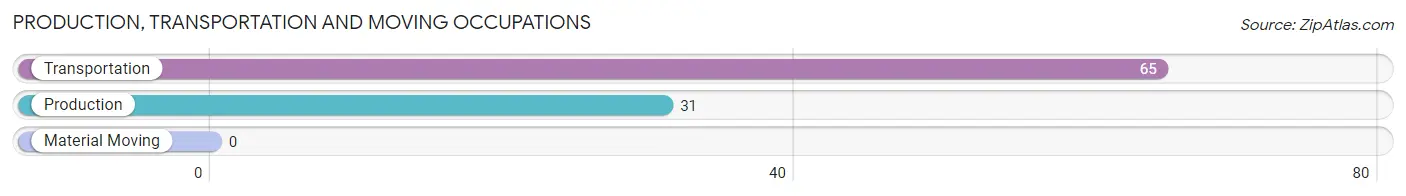
Production, Transportation and Moving Occupations by Sex
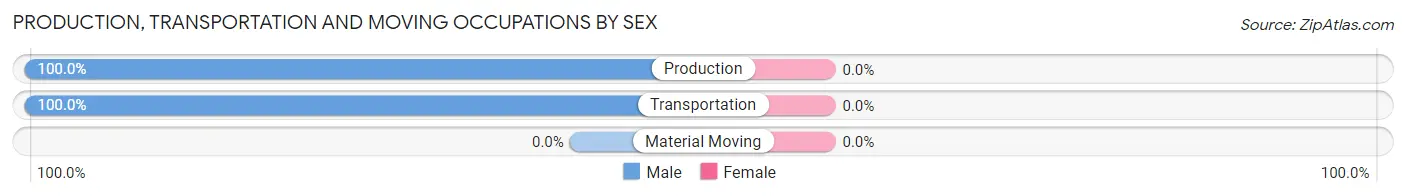
| Occupation | Male | Female |
| Production | 31 (100.0%) | 0 (0.0%) |
| Transportation | 65 (100.0%) | 0 (0.0%) |
| Material Moving | 0 (0.0%) | 0 (0.0%) |
| Total (Category) | 96 (100.0%) | 0 (0.0%) |
| Total (Overall) | 305 (60.3%) | 201 (39.7%) |
Employment Industries by Sex in Upton
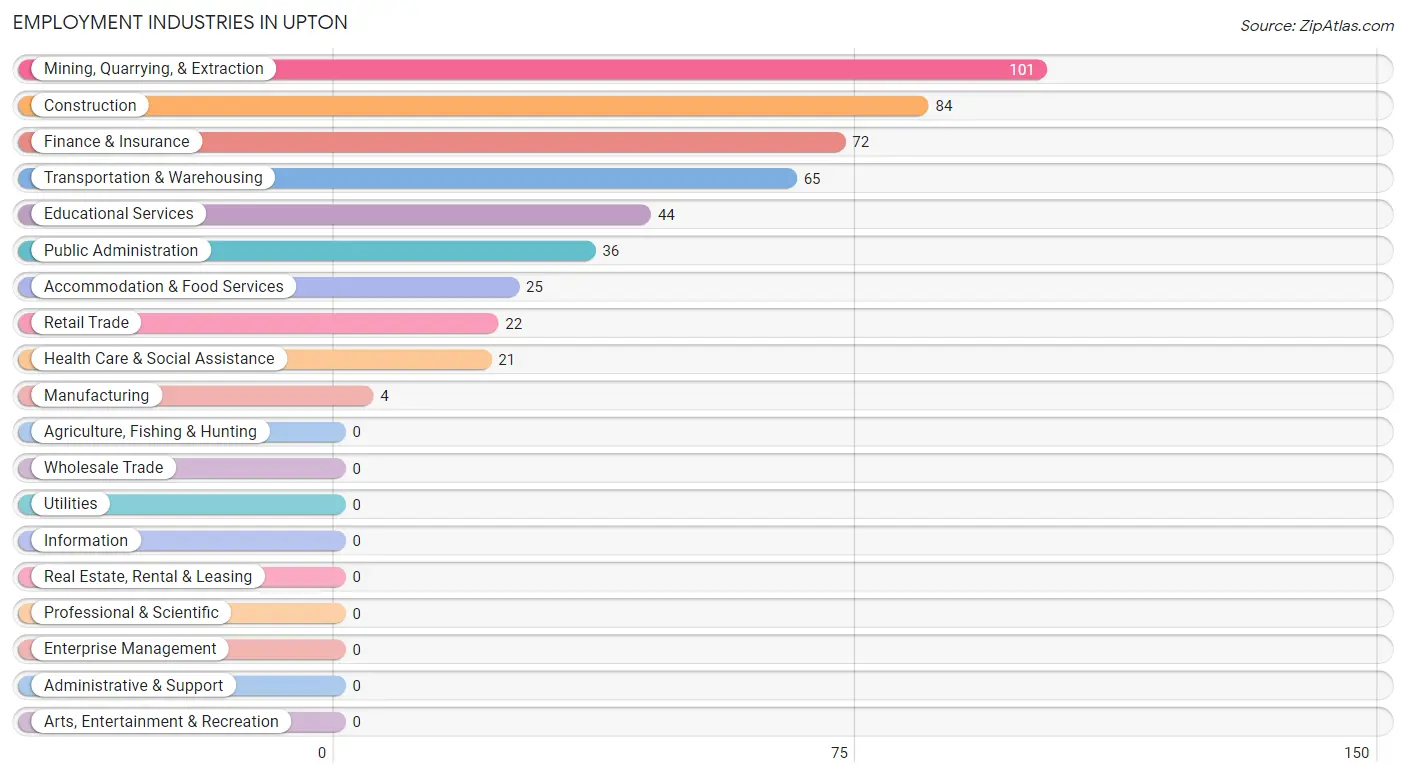
Employment Industries in Upton
The major employment industries in Upton include Mining, Quarrying, & Extraction (101 | 20.0%), Construction (84 | 16.6%), Finance & Insurance (72 | 14.2%), Transportation & Warehousing (65 | 12.9%), and Educational Services (44 | 8.7%).
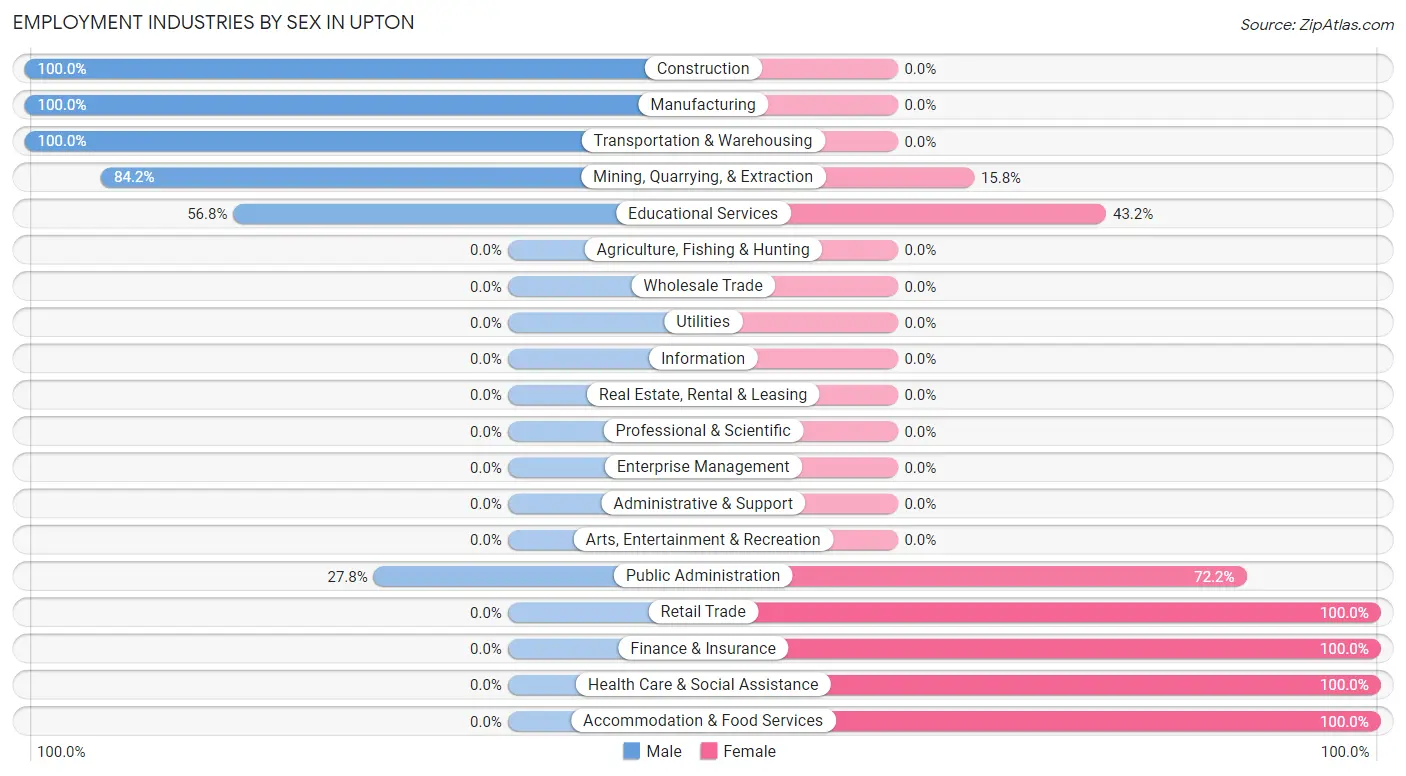
Employment Industries by Sex in Upton
The Upton industries that see more men than women are Construction (100.0%), Manufacturing (100.0%), and Transportation & Warehousing (100.0%), whereas the industries that tend to have a higher number of women are Retail Trade (100.0%), Finance & Insurance (100.0%), and Health Care & Social Assistance (100.0%).
| Industry | Male | Female |
| Agriculture, Fishing & Hunting | 0 (0.0%) | 0 (0.0%) |
| Mining, Quarrying, & Extraction | 85 (84.2%) | 16 (15.8%) |
| Construction | 84 (100.0%) | 0 (0.0%) |
| Manufacturing | 4 (100.0%) | 0 (0.0%) |
| Wholesale Trade | 0 (0.0%) | 0 (0.0%) |
| Retail Trade | 0 (0.0%) | 22 (100.0%) |
| Transportation & Warehousing | 65 (100.0%) | 0 (0.0%) |
| Utilities | 0 (0.0%) | 0 (0.0%) |
| Information | 0 (0.0%) | 0 (0.0%) |
| Finance & Insurance | 0 (0.0%) | 72 (100.0%) |
| Real Estate, Rental & Leasing | 0 (0.0%) | 0 (0.0%) |
| Professional & Scientific | 0 (0.0%) | 0 (0.0%) |
| Enterprise Management | 0 (0.0%) | 0 (0.0%) |
| Administrative & Support | 0 (0.0%) | 0 (0.0%) |
| Educational Services | 25 (56.8%) | 19 (43.2%) |
| Health Care & Social Assistance | 0 (0.0%) | 21 (100.0%) |
| Arts, Entertainment & Recreation | 0 (0.0%) | 0 (0.0%) |
| Accommodation & Food Services | 0 (0.0%) | 25 (100.0%) |
| Public Administration | 10 (27.8%) | 26 (72.2%) |
| Total | 305 (60.3%) | 201 (39.7%) |
Education in Upton
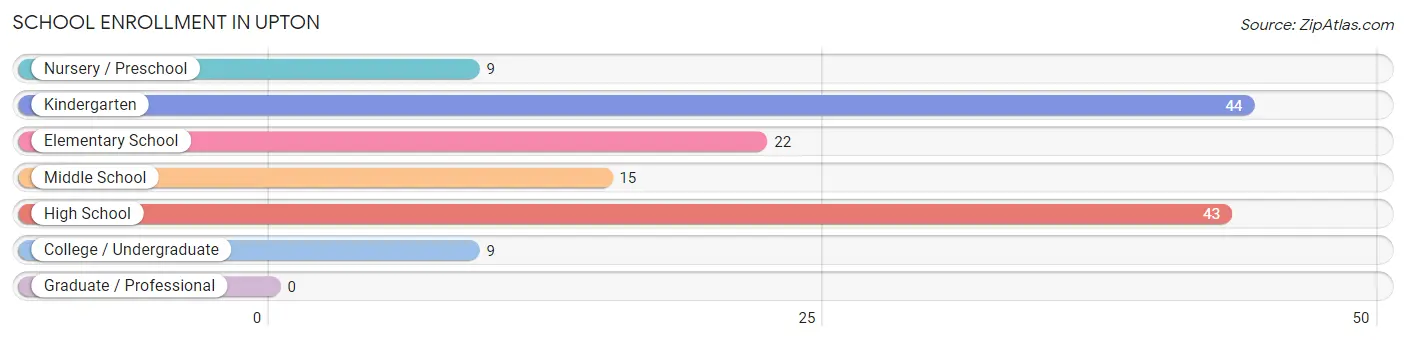
School Enrollment in Upton
The most common levels of schooling among the 142 students in Upton are kindergarten (44 | 31.0%), high school (43 | 30.3%), and elementary school (22 | 15.5%).
| School Level | # Students | % Students |
| Nursery / Preschool | 9 | 6.3% |
| Kindergarten | 44 | 31.0% |
| Elementary School | 22 | 15.5% |
| Middle School | 15 | 10.6% |
| High School | 43 | 30.3% |
| College / Undergraduate | 9 | 6.3% |
| Graduate / Professional | 0 | 0.0% |
| Total | 142 | 100.0% |
School Enrollment by Age by Funding Source in Upton
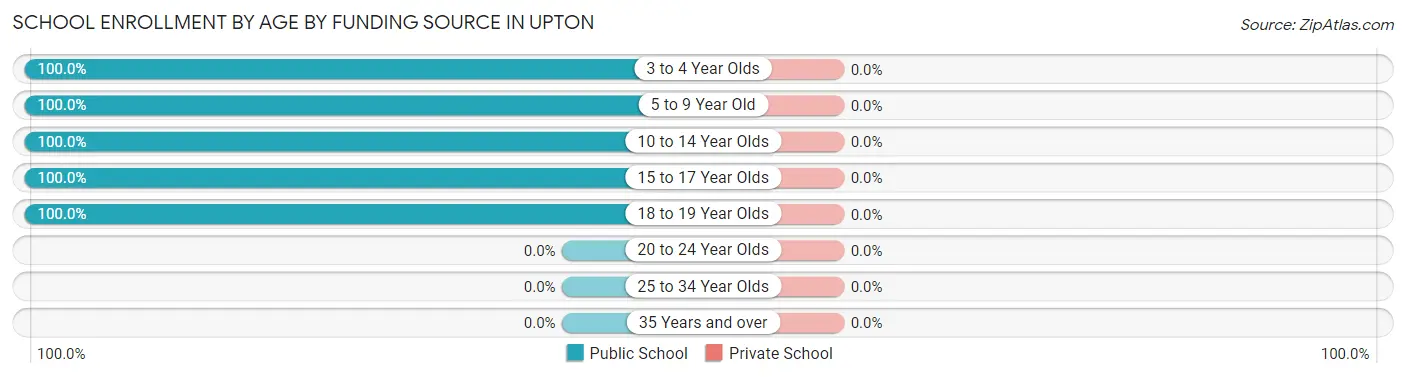
| Age Bracket | Public School | Private School |
| 3 to 4 Year Olds | 9 (100.0%) | 0 (0.0%) |
| 5 to 9 Year Old | 61 (100.0%) | 0 (0.0%) |
| 10 to 14 Year Olds | 20 (100.0%) | 0 (0.0%) |
| 15 to 17 Year Olds | 28 (100.0%) | 0 (0.0%) |
| 18 to 19 Year Olds | 24 (100.0%) | 0 (0.0%) |
| 20 to 24 Year Olds | 0 (0.0%) | 0 (0.0%) |
| 25 to 34 Year Olds | 0 (0.0%) | 0 (0.0%) |
| 35 Years and over | 0 (0.0%) | 0 (0.0%) |
| Total | 142 (100.0%) | 0 (0.0%) |
Educational Attainment by Field of Study in Upton
Education (61 | 53.5%), business (16 | 14.0%), social sciences (12 | 10.5%), visual & performing arts (11 | 9.7%), and arts & humanities (10 | 8.8%) are the most common fields of study among 114 individuals in Upton who have obtained a bachelor's degree or higher.
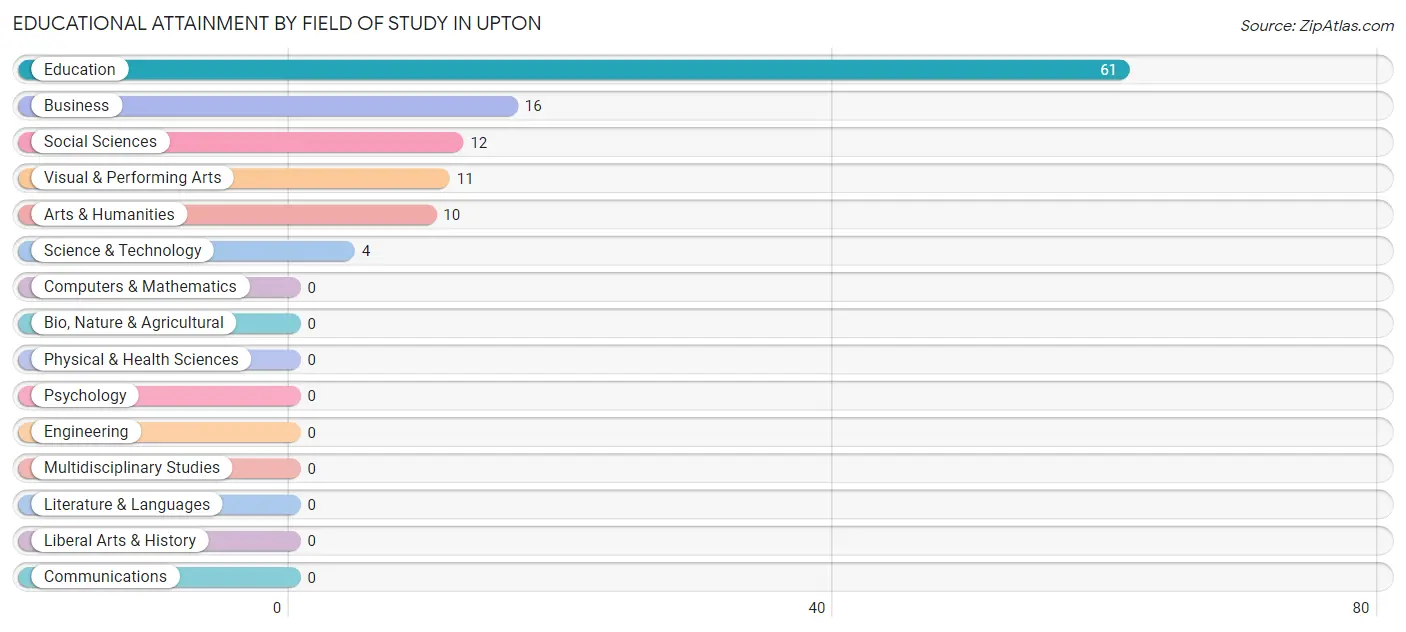
| Field of Study | # Graduates | % Graduates |
| Computers & Mathematics | 0 | 0.0% |
| Bio, Nature & Agricultural | 0 | 0.0% |
| Physical & Health Sciences | 0 | 0.0% |
| Psychology | 0 | 0.0% |
| Social Sciences | 12 | 10.5% |
| Engineering | 0 | 0.0% |
| Multidisciplinary Studies | 0 | 0.0% |
| Science & Technology | 4 | 3.5% |
| Business | 16 | 14.0% |
| Education | 61 | 53.5% |
| Literature & Languages | 0 | 0.0% |
| Liberal Arts & History | 0 | 0.0% |
| Visual & Performing Arts | 11 | 9.7% |
| Communications | 0 | 0.0% |
| Arts & Humanities | 10 | 8.8% |
| Total | 114 | 100.0% |
Transportation & Commute in Upton
Vehicle Availability by Sex in Upton
The most prevalent vehicle ownership categories in Upton are males with 2 vehicles (185, accounting for 67.5%) and females with 2 vehicles (86, making up 98.9%).
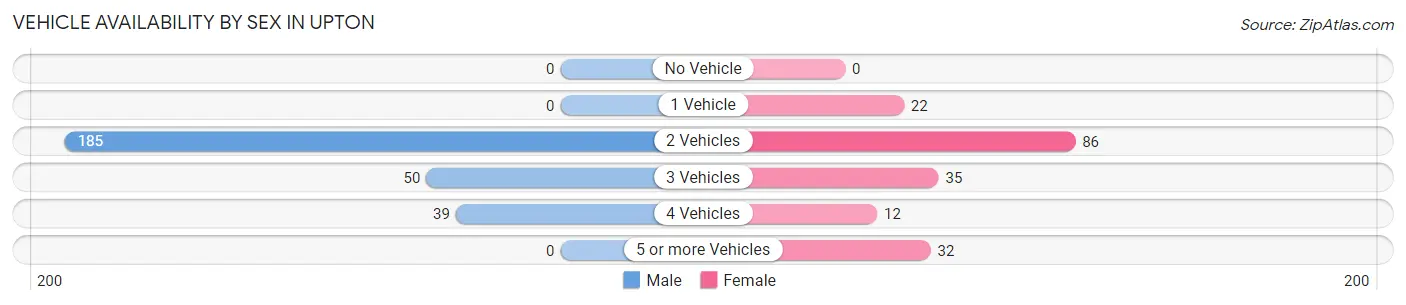
| Vehicles Available | Male | Female |
| No Vehicle | 0 (0.0%) | 0 (0.0%) |
| 1 Vehicle | 0 (0.0%) | 22 (11.8%) |
| 2 Vehicles | 185 (67.5%) | 86 (46.0%) |
| 3 Vehicles | 50 (18.2%) | 35 (18.7%) |
| 4 Vehicles | 39 (14.2%) | 12 (6.4%) |
| 5 or more Vehicles | 0 (0.0%) | 32 (17.1%) |
| Total | 274 (100.0%) | 187 (100.0%) |
Commute Time in Upton
The most frequently occuring commute durations in Upton are less than 5 minutes (121 commuters, 27.4%), 5 to 9 minutes (114 commuters, 25.9%), and 15 to 19 minutes (52 commuters, 11.8%).
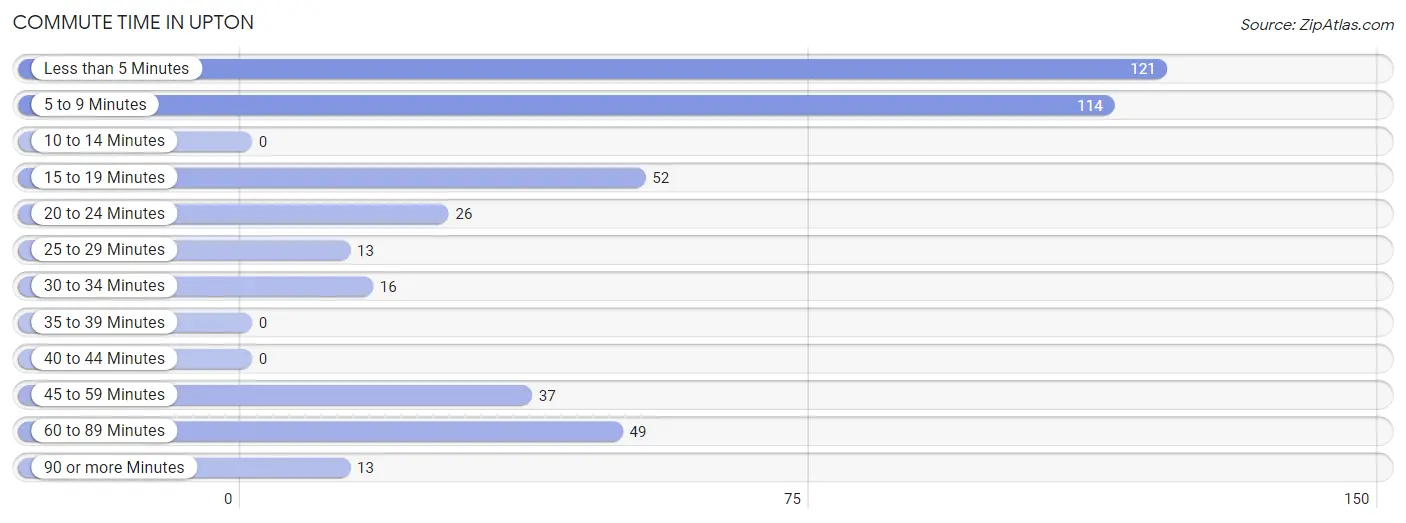
| Commute Time | # Commuters | % Commuters |
| Less than 5 Minutes | 121 | 27.4% |
| 5 to 9 Minutes | 114 | 25.9% |
| 10 to 14 Minutes | 0 | 0.0% |
| 15 to 19 Minutes | 52 | 11.8% |
| 20 to 24 Minutes | 26 | 5.9% |
| 25 to 29 Minutes | 13 | 2.9% |
| 30 to 34 Minutes | 16 | 3.6% |
| 35 to 39 Minutes | 0 | 0.0% |
| 40 to 44 Minutes | 0 | 0.0% |
| 45 to 59 Minutes | 37 | 8.4% |
| 60 to 89 Minutes | 49 | 11.1% |
| 90 or more Minutes | 13 | 2.9% |
Commute Time by Sex in Upton
The most common commute times in Upton are less than 5 minutes (97 commuters, 36.3%) for males and 5 to 9 minutes (72 commuters, 41.4%) for females.
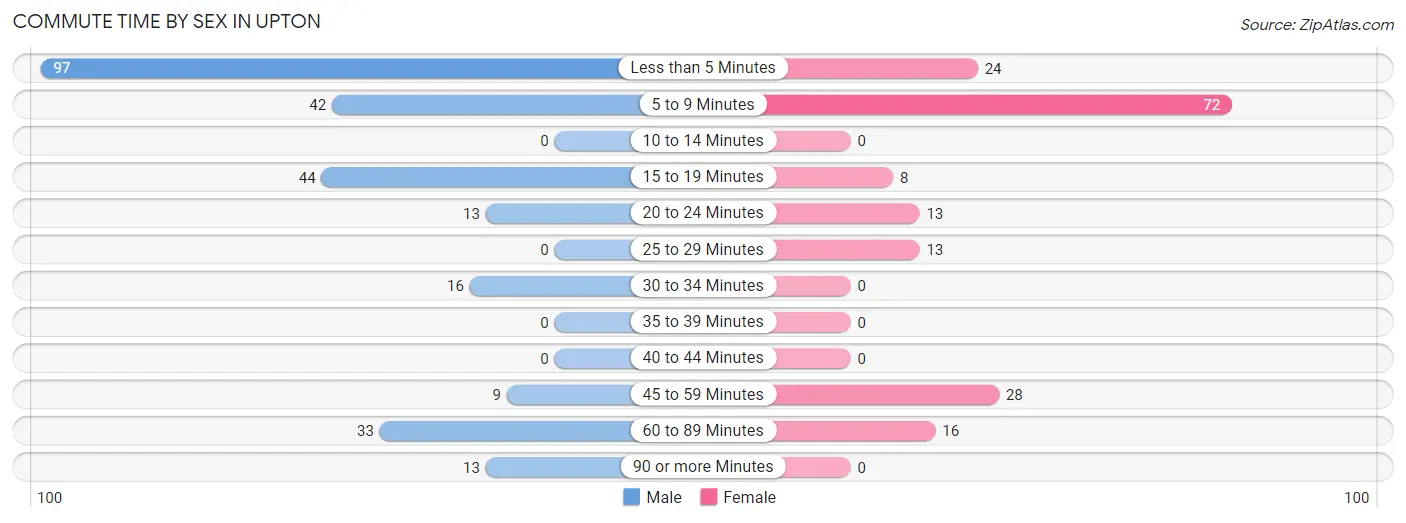
| Commute Time | Male | Female |
| Less than 5 Minutes | 97 (36.3%) | 24 (13.8%) |
| 5 to 9 Minutes | 42 (15.7%) | 72 (41.4%) |
| 10 to 14 Minutes | 0 (0.0%) | 0 (0.0%) |
| 15 to 19 Minutes | 44 (16.5%) | 8 (4.6%) |
| 20 to 24 Minutes | 13 (4.9%) | 13 (7.5%) |
| 25 to 29 Minutes | 0 (0.0%) | 13 (7.5%) |
| 30 to 34 Minutes | 16 (6.0%) | 0 (0.0%) |
| 35 to 39 Minutes | 0 (0.0%) | 0 (0.0%) |
| 40 to 44 Minutes | 0 (0.0%) | 0 (0.0%) |
| 45 to 59 Minutes | 9 (3.4%) | 28 (16.1%) |
| 60 to 89 Minutes | 33 (12.4%) | 16 (9.2%) |
| 90 or more Minutes | 13 (4.9%) | 0 (0.0%) |
Time of Departure to Work by Sex in Upton
The most frequent times of departure to work in Upton are 5:00 AM to 5:29 AM (90, 33.7%) for males and 8:30 AM to 8:59 AM (72, 41.4%) for females.
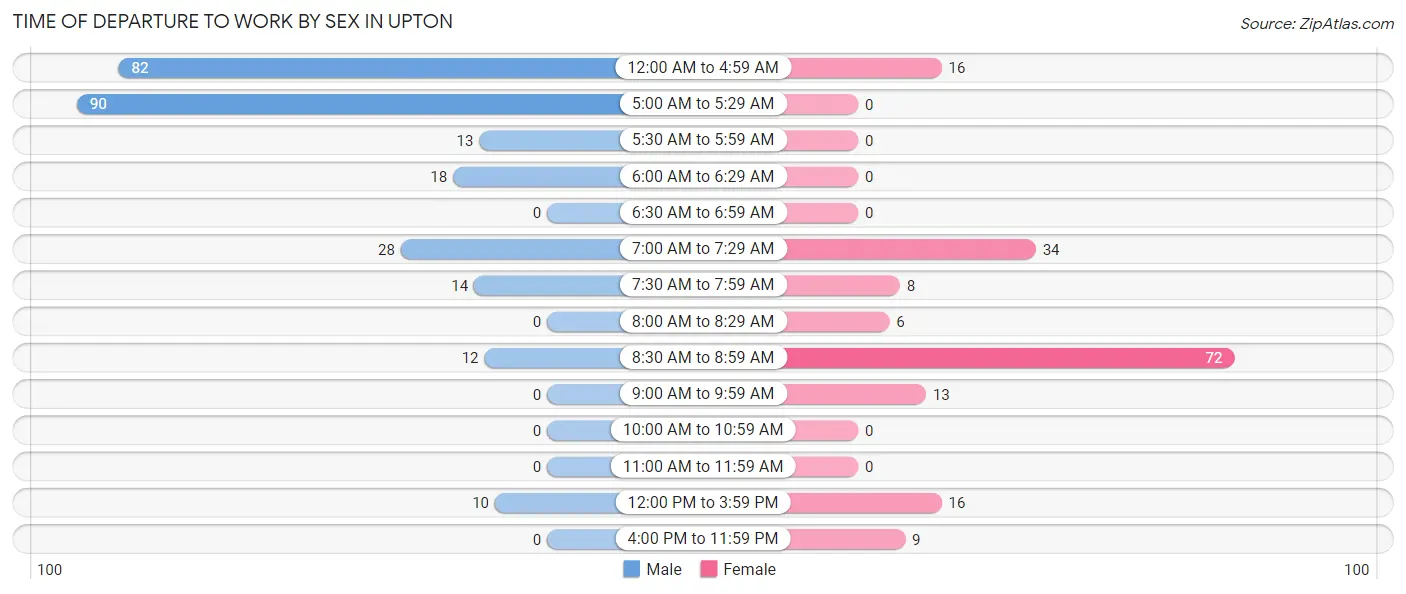
| Time of Departure | Male | Female |
| 12:00 AM to 4:59 AM | 82 (30.7%) | 16 (9.2%) |
| 5:00 AM to 5:29 AM | 90 (33.7%) | 0 (0.0%) |
| 5:30 AM to 5:59 AM | 13 (4.9%) | 0 (0.0%) |
| 6:00 AM to 6:29 AM | 18 (6.7%) | 0 (0.0%) |
| 6:30 AM to 6:59 AM | 0 (0.0%) | 0 (0.0%) |
| 7:00 AM to 7:29 AM | 28 (10.5%) | 34 (19.5%) |
| 7:30 AM to 7:59 AM | 14 (5.2%) | 8 (4.6%) |
| 8:00 AM to 8:29 AM | 0 (0.0%) | 6 (3.5%) |
| 8:30 AM to 8:59 AM | 12 (4.5%) | 72 (41.4%) |
| 9:00 AM to 9:59 AM | 0 (0.0%) | 13 (7.5%) |
| 10:00 AM to 10:59 AM | 0 (0.0%) | 0 (0.0%) |
| 11:00 AM to 11:59 AM | 0 (0.0%) | 0 (0.0%) |
| 12:00 PM to 3:59 PM | 10 (3.7%) | 16 (9.2%) |
| 4:00 PM to 11:59 PM | 0 (0.0%) | 9 (5.2%) |
| Total | 267 (100.0%) | 174 (100.0%) |
Housing Occupancy in Upton
Occupancy by Ownership in Upton
Of the total 489 dwellings in Upton, owner-occupied units account for 401 (82.0%), while renter-occupied units make up 88 (18.0%).
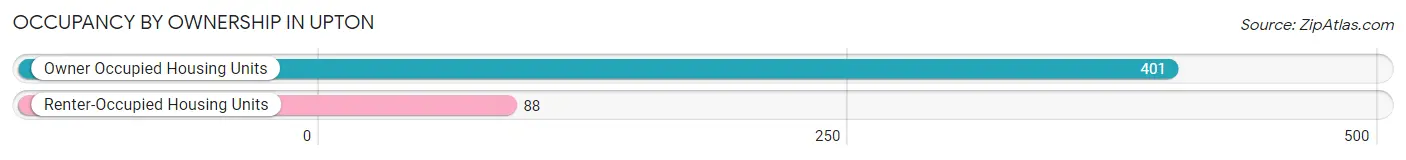
| Occupancy | # Housing Units | % Housing Units |
| Owner Occupied Housing Units | 401 | 82.0% |
| Renter-Occupied Housing Units | 88 | 18.0% |
| Total Occupied Housing Units | 489 | 100.0% |
Occupancy by Household Size in Upton
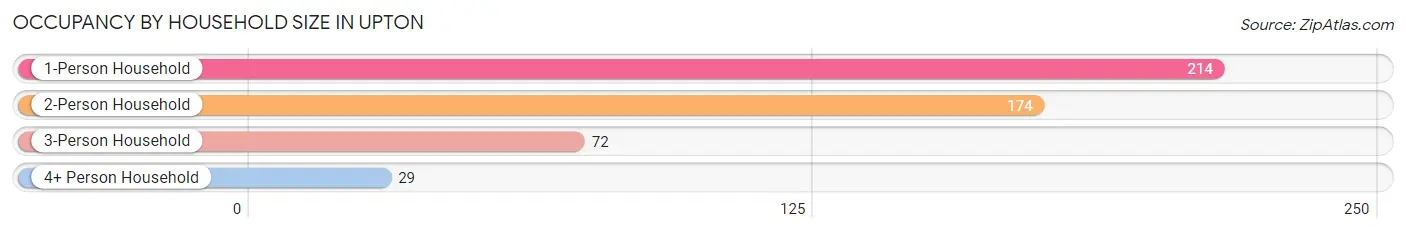
| Household Size | # Housing Units | % Housing Units |
| 1-Person Household | 214 | 43.8% |
| 2-Person Household | 174 | 35.6% |
| 3-Person Household | 72 | 14.7% |
| 4+ Person Household | 29 | 5.9% |
| Total Housing Units | 489 | 100.0% |
Occupancy by Ownership by Household Size in Upton
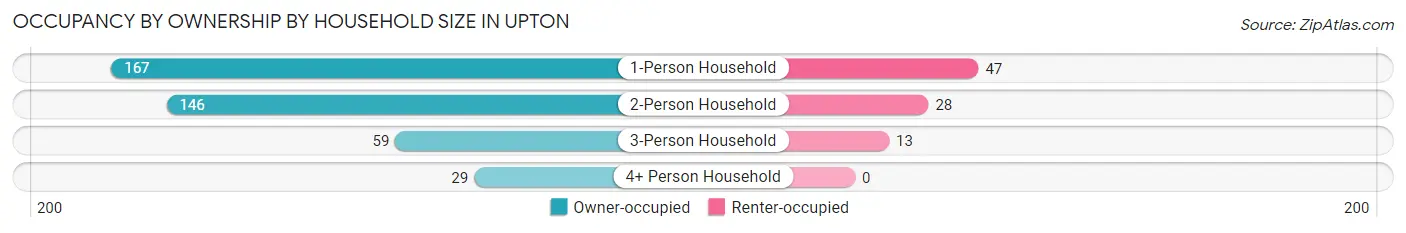
| Household Size | Owner-occupied | Renter-occupied |
| 1-Person Household | 167 (78.0%) | 47 (22.0%) |
| 2-Person Household | 146 (83.9%) | 28 (16.1%) |
| 3-Person Household | 59 (81.9%) | 13 (18.1%) |
| 4+ Person Household | 29 (100.0%) | 0 (0.0%) |
| Total Housing Units | 401 (82.0%) | 88 (18.0%) |
Occupancy by Educational Attainment in Upton
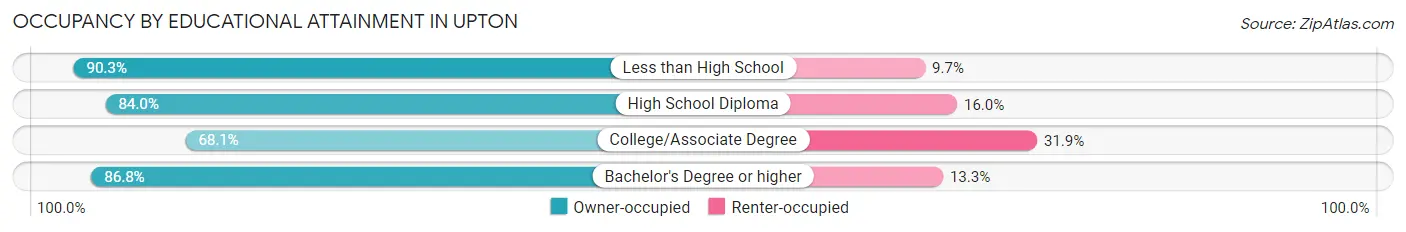
| Household Size | Owner-occupied | Renter-occupied |
| Less than High School | 93 (90.3%) | 10 (9.7%) |
| High School Diploma | 157 (84.0%) | 30 (16.0%) |
| College/Associate Degree | 79 (68.1%) | 37 (31.9%) |
| Bachelor's Degree or higher | 72 (86.8%) | 11 (13.3%) |
Occupancy by Age of Householder in Upton
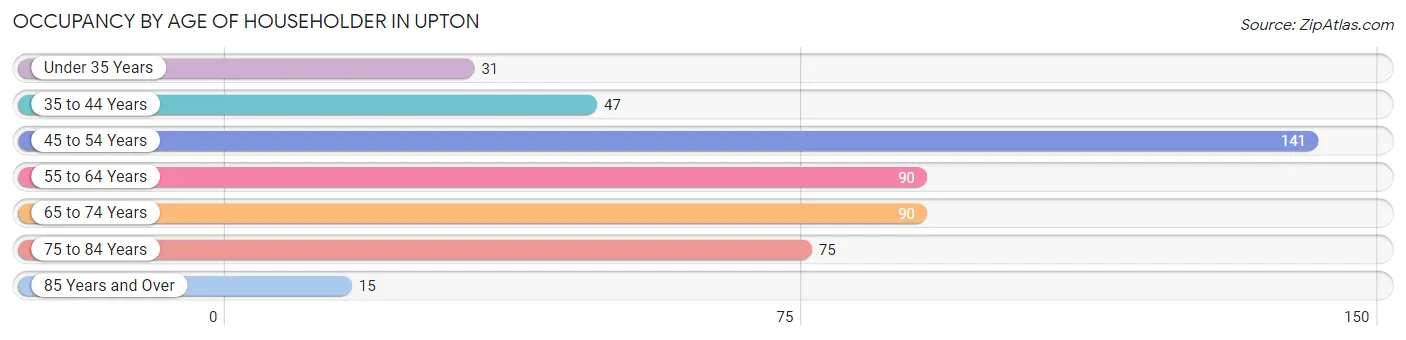
| Age Bracket | # Households | % Households |
| Under 35 Years | 31 | 6.3% |
| 35 to 44 Years | 47 | 9.6% |
| 45 to 54 Years | 141 | 28.8% |
| 55 to 64 Years | 90 | 18.4% |
| 65 to 74 Years | 90 | 18.4% |
| 75 to 84 Years | 75 | 15.3% |
| 85 Years and Over | 15 | 3.1% |
| Total | 489 | 100.0% |
Housing Finances in Upton
Median Income by Occupancy in Upton
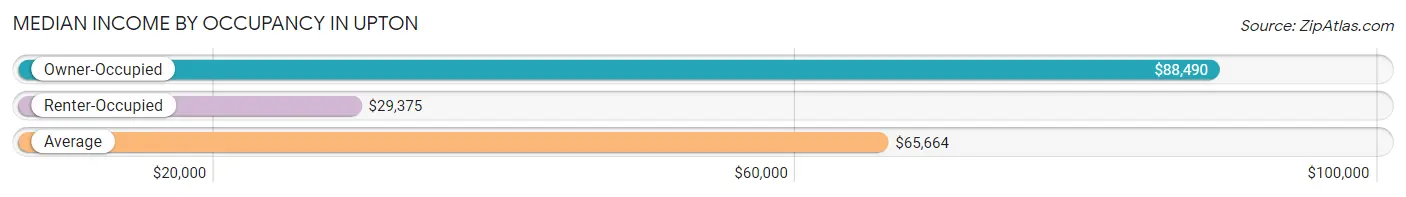
| Occupancy Type | # Households | Median Income |
| Owner-Occupied | 401 (82.0%) | $88,490 |
| Renter-Occupied | 88 (18.0%) | $29,375 |
| Average | 489 (100.0%) | $65,664 |
Occupancy by Householder Income Bracket in Upton
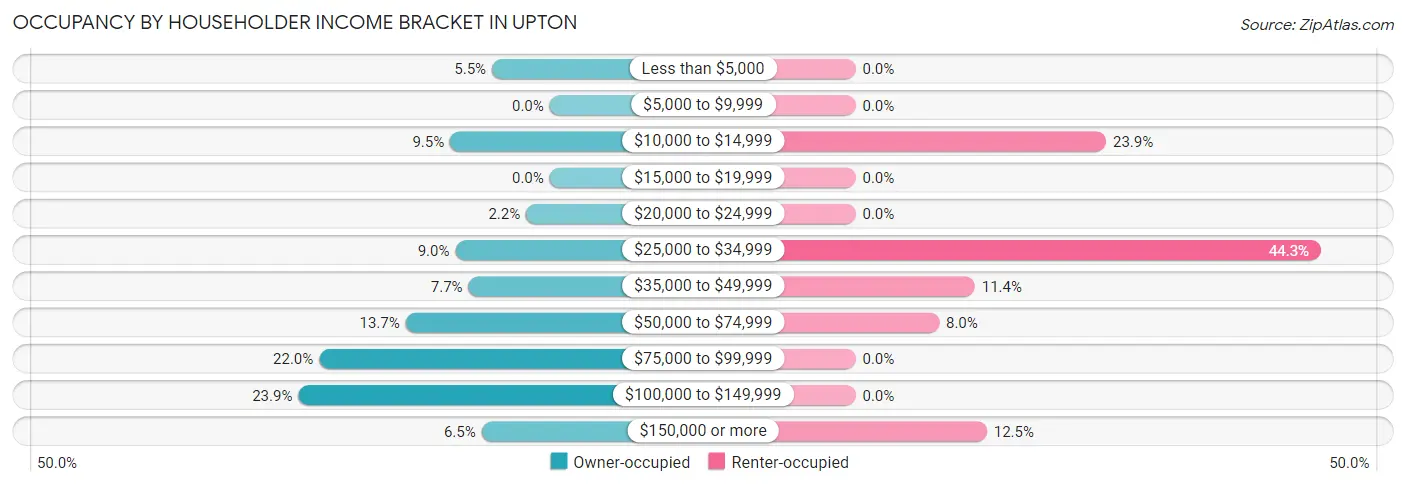
| Income Bracket | Owner-occupied | Renter-occupied |
| Less than $5,000 | 22 (5.5%) | 0 (0.0%) |
| $5,000 to $9,999 | 0 (0.0%) | 0 (0.0%) |
| $10,000 to $14,999 | 38 (9.5%) | 21 (23.9%) |
| $15,000 to $19,999 | 0 (0.0%) | 0 (0.0%) |
| $20,000 to $24,999 | 9 (2.2%) | 0 (0.0%) |
| $25,000 to $34,999 | 36 (9.0%) | 39 (44.3%) |
| $35,000 to $49,999 | 31 (7.7%) | 10 (11.4%) |
| $50,000 to $74,999 | 55 (13.7%) | 7 (8.0%) |
| $75,000 to $99,999 | 88 (22.0%) | 0 (0.0%) |
| $100,000 to $149,999 | 96 (23.9%) | 0 (0.0%) |
| $150,000 or more | 26 (6.5%) | 11 (12.5%) |
| Total | 401 (100.0%) | 88 (100.0%) |
Monthly Housing Cost Tiers in Upton
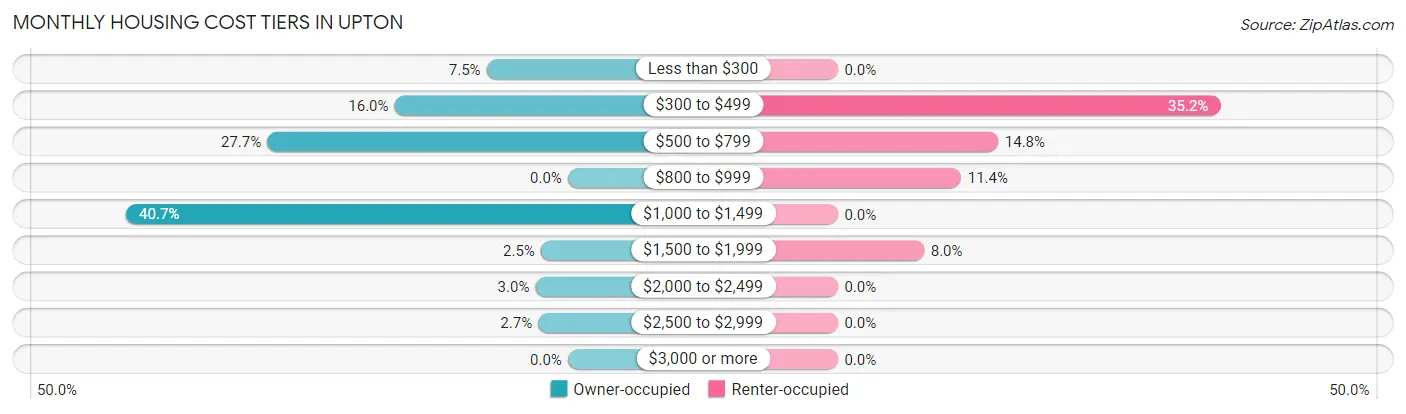
| Monthly Cost | Owner-occupied | Renter-occupied |
| Less than $300 | 30 (7.5%) | 0 (0.0%) |
| $300 to $499 | 64 (16.0%) | 31 (35.2%) |
| $500 to $799 | 111 (27.7%) | 13 (14.8%) |
| $800 to $999 | 0 (0.0%) | 10 (11.4%) |
| $1,000 to $1,499 | 163 (40.6%) | 0 (0.0%) |
| $1,500 to $1,999 | 10 (2.5%) | 7 (8.0%) |
| $2,000 to $2,499 | 12 (3.0%) | 0 (0.0%) |
| $2,500 to $2,999 | 11 (2.7%) | 0 (0.0%) |
| $3,000 or more | 0 (0.0%) | 0 (0.0%) |
| Total | 401 (100.0%) | 88 (100.0%) |
Physical Housing Characteristics in Upton
Housing Structures in Upton
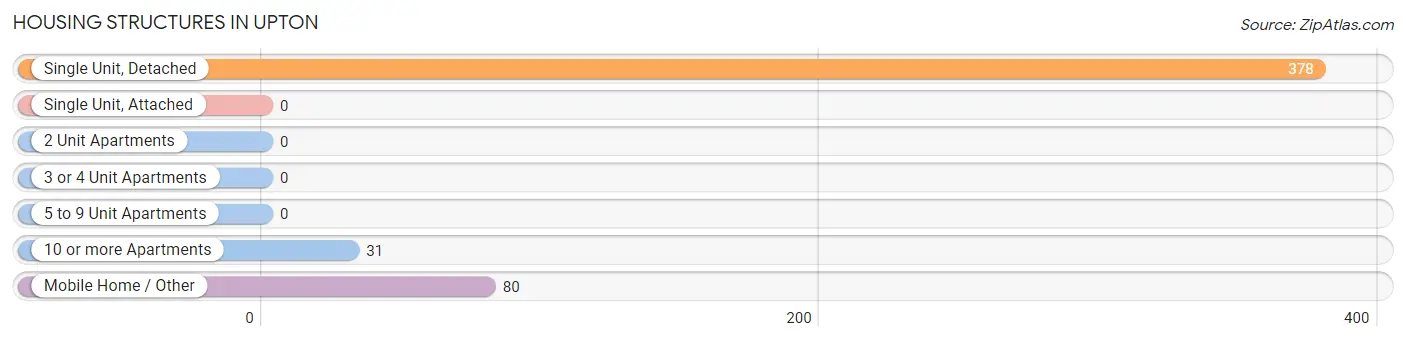
| Structure Type | # Housing Units | % Housing Units |
| Single Unit, Detached | 378 | 77.3% |
| Single Unit, Attached | 0 | 0.0% |
| 2 Unit Apartments | 0 | 0.0% |
| 3 or 4 Unit Apartments | 0 | 0.0% |
| 5 to 9 Unit Apartments | 0 | 0.0% |
| 10 or more Apartments | 31 | 6.3% |
| Mobile Home / Other | 80 | 16.4% |
| Total | 489 | 100.0% |
Housing Structures by Occupancy in Upton
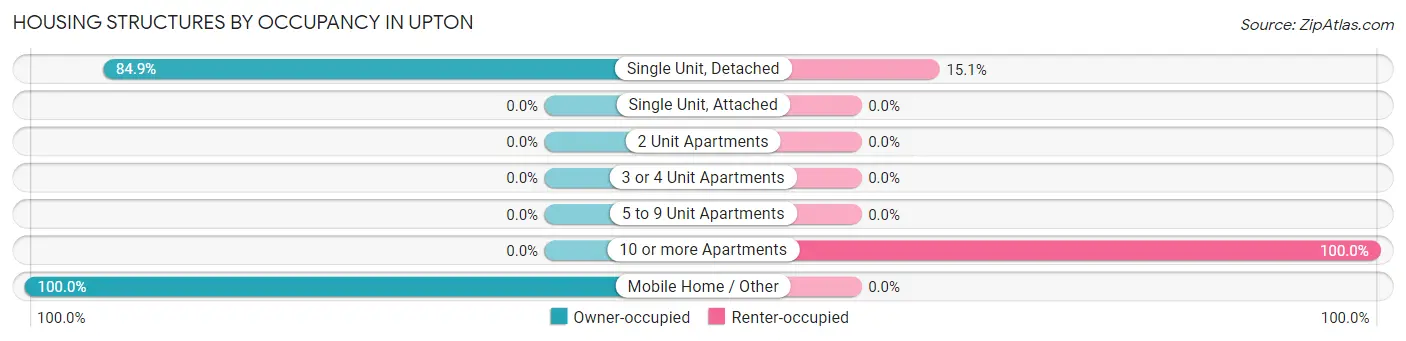
| Structure Type | Owner-occupied | Renter-occupied |
| Single Unit, Detached | 321 (84.9%) | 57 (15.1%) |
| Single Unit, Attached | 0 (0.0%) | 0 (0.0%) |
| 2 Unit Apartments | 0 (0.0%) | 0 (0.0%) |
| 3 or 4 Unit Apartments | 0 (0.0%) | 0 (0.0%) |
| 5 to 9 Unit Apartments | 0 (0.0%) | 0 (0.0%) |
| 10 or more Apartments | 0 (0.0%) | 31 (100.0%) |
| Mobile Home / Other | 80 (100.0%) | 0 (0.0%) |
| Total | 401 (82.0%) | 88 (18.0%) |
Housing Structures by Number of Rooms in Upton
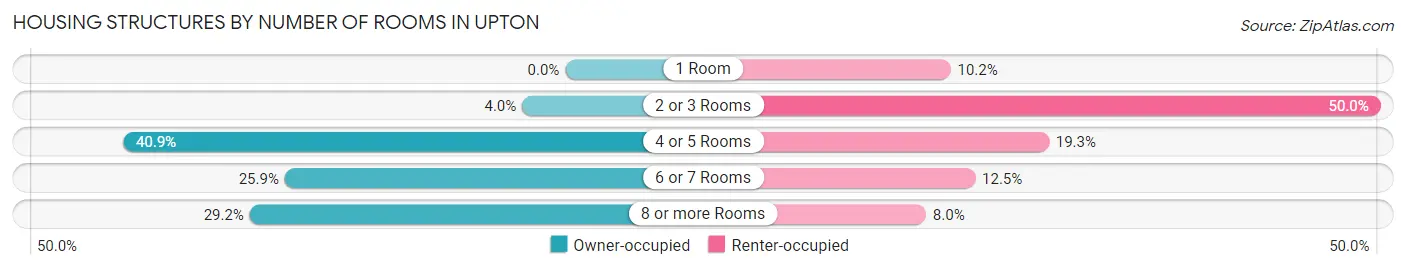
| Number of Rooms | Owner-occupied | Renter-occupied |
| 1 Room | 0 (0.0%) | 9 (10.2%) |
| 2 or 3 Rooms | 16 (4.0%) | 44 (50.0%) |
| 4 or 5 Rooms | 164 (40.9%) | 17 (19.3%) |
| 6 or 7 Rooms | 104 (25.9%) | 11 (12.5%) |
| 8 or more Rooms | 117 (29.2%) | 7 (8.0%) |
| Total | 401 (100.0%) | 88 (100.0%) |
Housing Structure by Heating Type in Upton
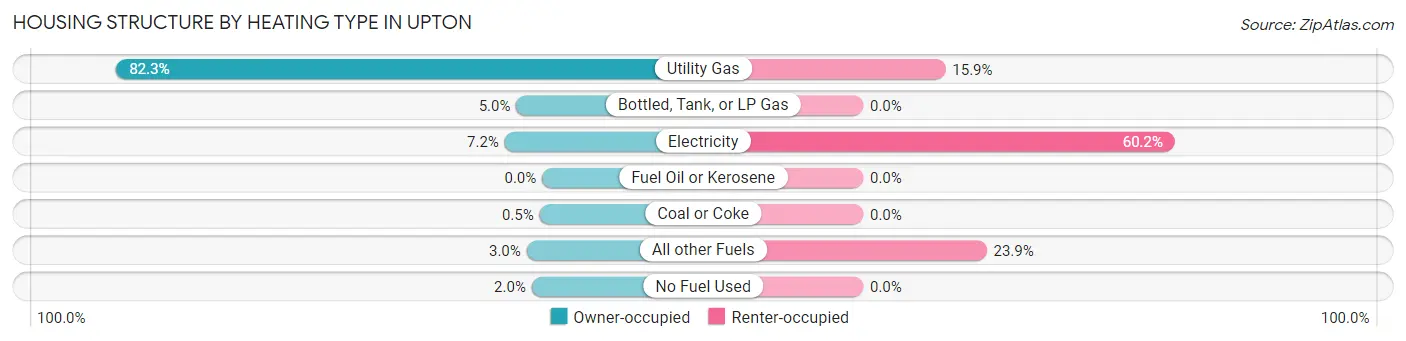
| Heating Type | Owner-occupied | Renter-occupied |
| Utility Gas | 330 (82.3%) | 14 (15.9%) |
| Bottled, Tank, or LP Gas | 20 (5.0%) | 0 (0.0%) |
| Electricity | 29 (7.2%) | 53 (60.2%) |
| Fuel Oil or Kerosene | 0 (0.0%) | 0 (0.0%) |
| Coal or Coke | 2 (0.5%) | 0 (0.0%) |
| All other Fuels | 12 (3.0%) | 21 (23.9%) |
| No Fuel Used | 8 (2.0%) | 0 (0.0%) |
| Total | 401 (100.0%) | 88 (100.0%) |
Household Vehicle Usage in Upton
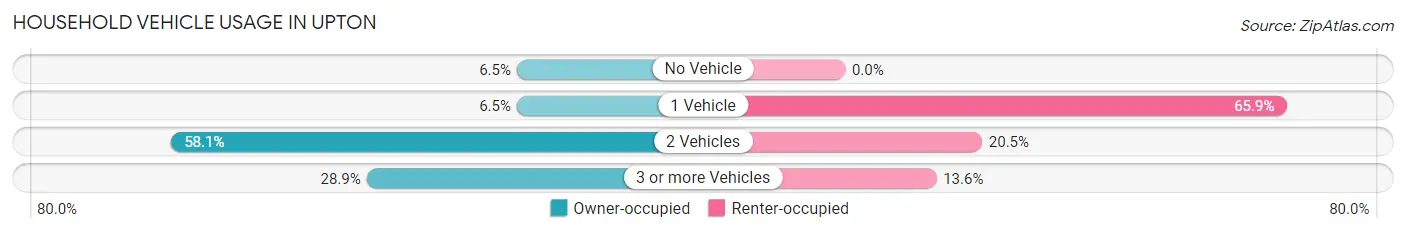
| Vehicles per Household | Owner-occupied | Renter-occupied |
| No Vehicle | 26 (6.5%) | 0 (0.0%) |
| 1 Vehicle | 26 (6.5%) | 58 (65.9%) |
| 2 Vehicles | 233 (58.1%) | 18 (20.4%) |
| 3 or more Vehicles | 116 (28.9%) | 12 (13.6%) |
| Total | 401 (100.0%) | 88 (100.0%) |
Real Estate & Mortgages in Upton
Real Estate and Mortgage Overview in Upton
| Characteristic | Without Mortgage | With Mortgage |
| Housing Units | 190 | 211 |
| Median Property Value | $117,600 | $179,300 |
| Median Household Income | $34,500 | $0 |
| Monthly Housing Costs | $502 | $0 |
| Real Estate Taxes | $808 | $0 |
Property Value by Mortgage Status in Upton
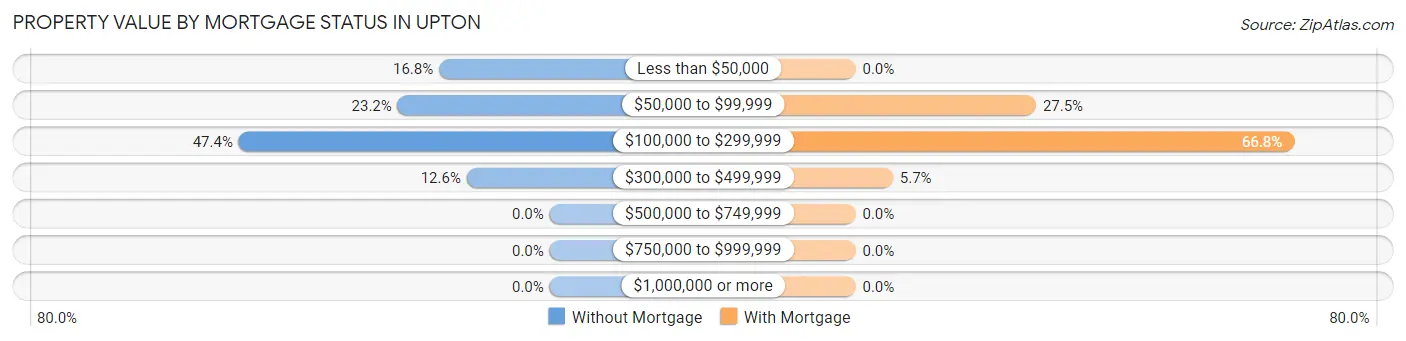
| Property Value | Without Mortgage | With Mortgage |
| Less than $50,000 | 32 (16.8%) | 0 (0.0%) |
| $50,000 to $99,999 | 44 (23.2%) | 58 (27.5%) |
| $100,000 to $299,999 | 90 (47.4%) | 141 (66.8%) |
| $300,000 to $499,999 | 24 (12.6%) | 12 (5.7%) |
| $500,000 to $749,999 | 0 (0.0%) | 0 (0.0%) |
| $750,000 to $999,999 | 0 (0.0%) | 0 (0.0%) |
| $1,000,000 or more | 0 (0.0%) | 0 (0.0%) |
| Total | 190 (100.0%) | 211 (100.0%) |
Household Income by Mortgage Status in Upton
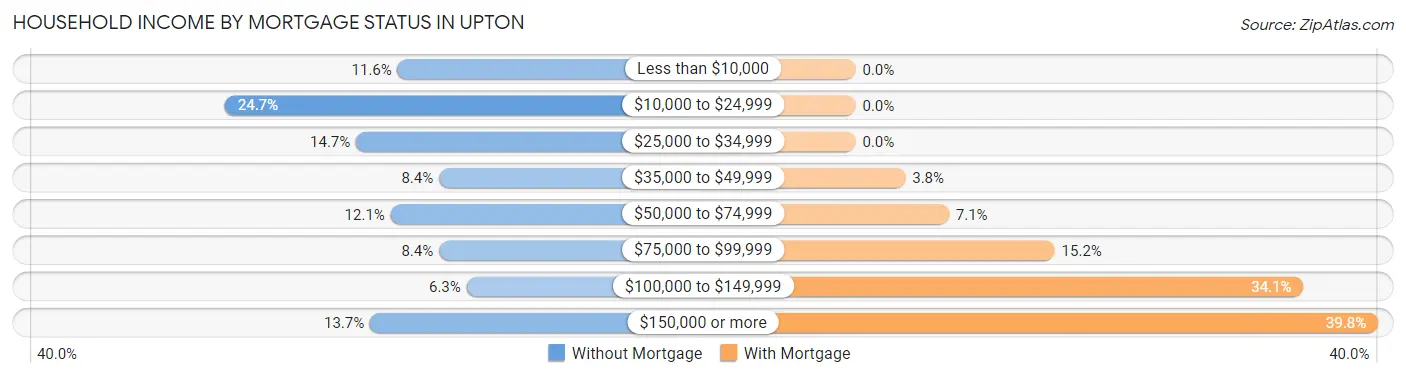
| Household Income | Without Mortgage | With Mortgage |
| Less than $10,000 | 22 (11.6%) | 0 (0.0%) |
| $10,000 to $24,999 | 47 (24.7%) | 0 (0.0%) |
| $25,000 to $34,999 | 28 (14.7%) | 0 (0.0%) |
| $35,000 to $49,999 | 16 (8.4%) | 8 (3.8%) |
| $50,000 to $74,999 | 23 (12.1%) | 15 (7.1%) |
| $75,000 to $99,999 | 16 (8.4%) | 32 (15.2%) |
| $100,000 to $149,999 | 12 (6.3%) | 72 (34.1%) |
| $150,000 or more | 26 (13.7%) | 84 (39.8%) |
| Total | 190 (100.0%) | 211 (100.0%) |
Property Value to Household Income Ratio in Upton
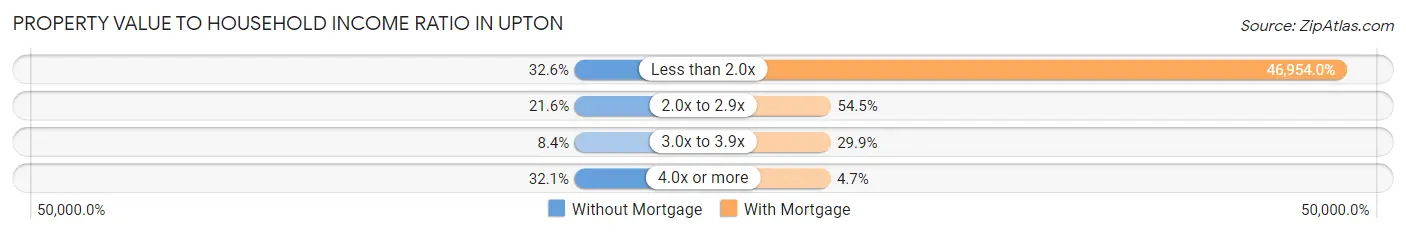
| Value-to-Income Ratio | Without Mortgage | With Mortgage |
| Less than 2.0x | 62 (32.6%) | 99,073 (46,954.0%) |
| 2.0x to 2.9x | 41 (21.6%) | 115 (54.5%) |
| 3.0x to 3.9x | 16 (8.4%) | 63 (29.9%) |
| 4.0x or more | 61 (32.1%) | 10 (4.7%) |
| Total | 190 (100.0%) | 211 (100.0%) |
Real Estate Taxes by Mortgage Status in Upton
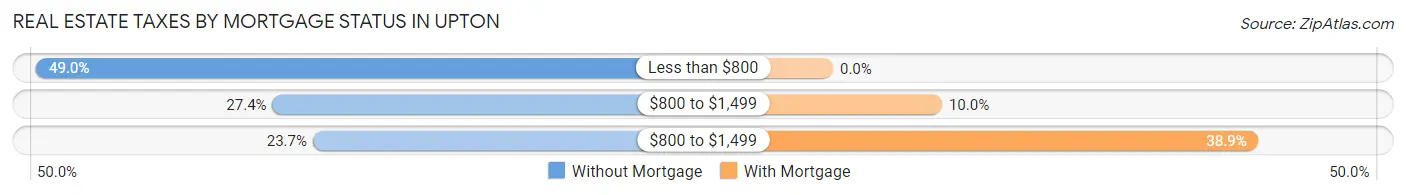
| Property Taxes | Without Mortgage | With Mortgage |
| Less than $800 | 93 (48.9%) | 0 (0.0%) |
| $800 to $1,499 | 52 (27.4%) | 21 (10.0%) |
| $800 to $1,499 | 45 (23.7%) | 82 (38.9%) |
| Total | 190 (100.0%) | 211 (100.0%) |
Health & Disability in Upton
Health Insurance Coverage by Age in Upton
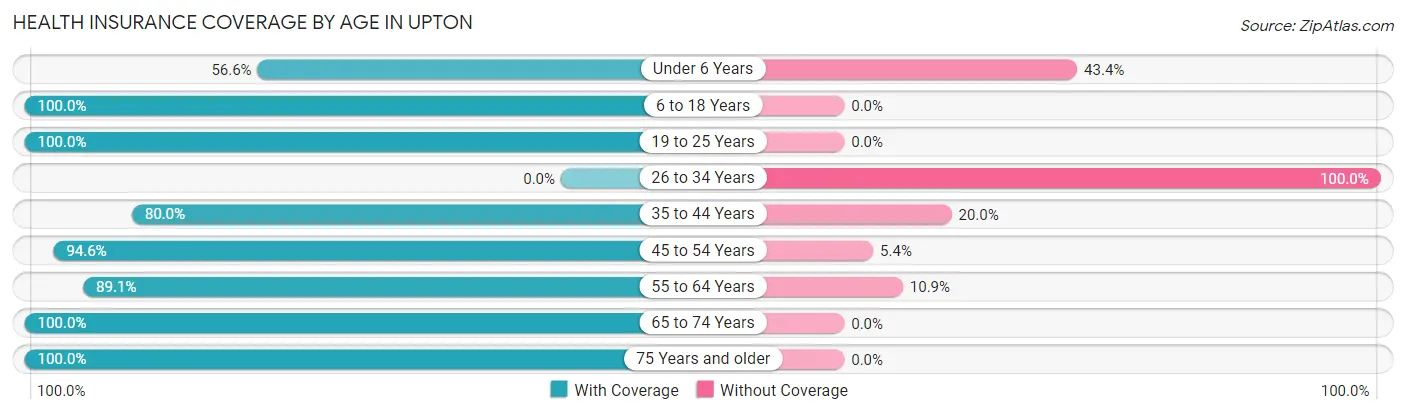
| Age Bracket | With Coverage | Without Coverage |
| Under 6 Years | 43 (56.6%) | 33 (43.4%) |
| 6 to 18 Years | 80 (100.0%) | 0 (0.0%) |
| 19 to 25 Years | 25 (100.0%) | 0 (0.0%) |
| 26 to 34 Years | 0 (0.0%) | 53 (100.0%) |
| 35 to 44 Years | 48 (80.0%) | 12 (20.0%) |
| 45 to 54 Years | 246 (94.6%) | 14 (5.4%) |
| 55 to 64 Years | 106 (89.1%) | 13 (10.9%) |
| 65 to 74 Years | 136 (100.0%) | 0 (0.0%) |
| 75 Years and older | 134 (100.0%) | 0 (0.0%) |
| Total | 818 (86.7%) | 125 (13.3%) |
Health Insurance Coverage by Citizenship Status in Upton
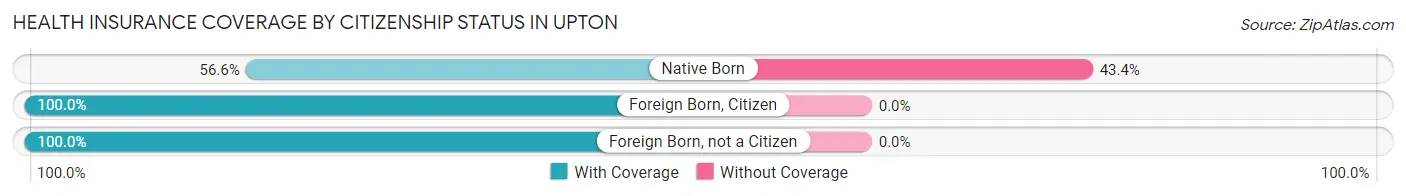
| Citizenship Status | With Coverage | Without Coverage |
| Native Born | 43 (56.6%) | 33 (43.4%) |
| Foreign Born, Citizen | 80 (100.0%) | 0 (0.0%) |
| Foreign Born, not a Citizen | 25 (100.0%) | 0 (0.0%) |
Health Insurance Coverage by Household Income in Upton
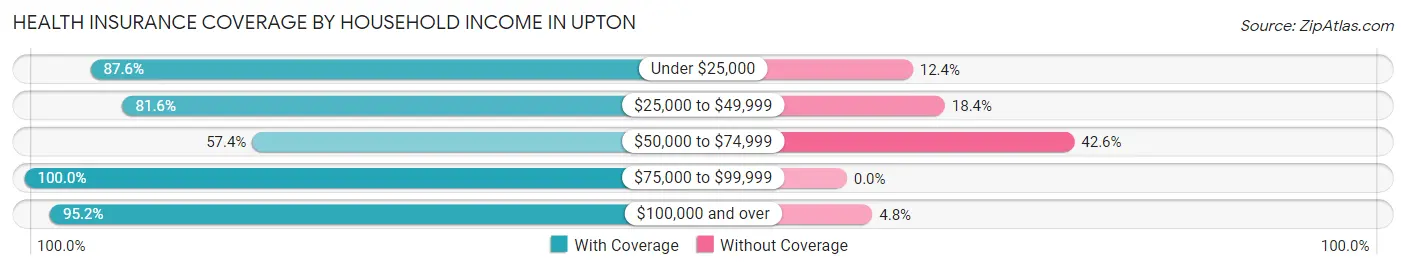
| Household Income | With Coverage | Without Coverage |
| Under $25,000 | 85 (87.6%) | 12 (12.4%) |
| $25,000 to $49,999 | 200 (81.6%) | 45 (18.4%) |
| $50,000 to $74,999 | 74 (57.4%) | 55 (42.6%) |
| $75,000 to $99,999 | 200 (100.0%) | 0 (0.0%) |
| $100,000 and over | 259 (95.2%) | 13 (4.8%) |
Public vs Private Health Insurance Coverage by Age in Upton
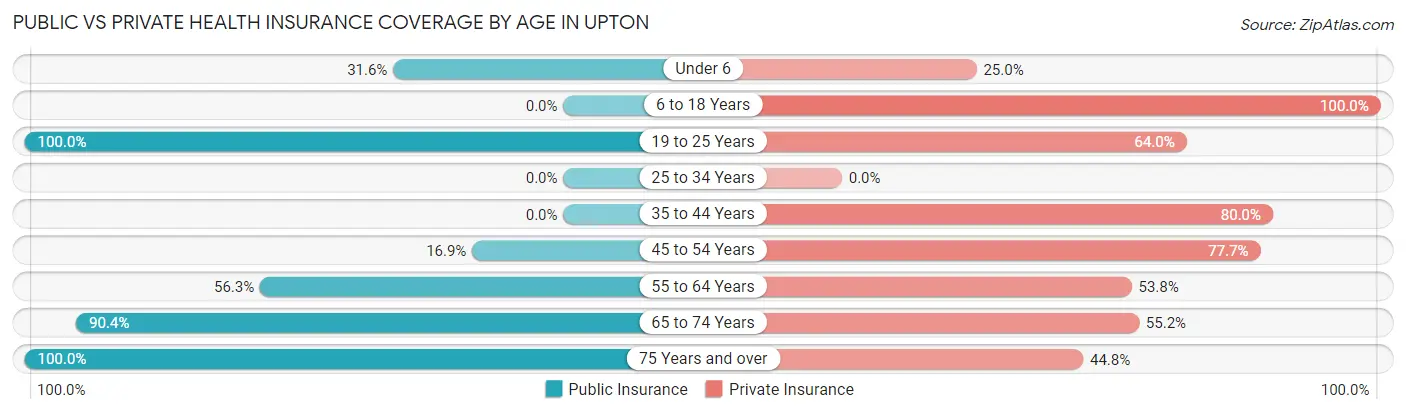
| Age Bracket | Public Insurance | Private Insurance |
| Under 6 | 24 (31.6%) | 19 (25.0%) |
| 6 to 18 Years | 0 (0.0%) | 80 (100.0%) |
| 19 to 25 Years | 25 (100.0%) | 16 (64.0%) |
| 25 to 34 Years | 0 (0.0%) | 0 (0.0%) |
| 35 to 44 Years | 0 (0.0%) | 48 (80.0%) |
| 45 to 54 Years | 44 (16.9%) | 202 (77.7%) |
| 55 to 64 Years | 67 (56.3%) | 64 (53.8%) |
| 65 to 74 Years | 123 (90.4%) | 75 (55.1%) |
| 75 Years and over | 134 (100.0%) | 60 (44.8%) |
| Total | 417 (44.2%) | 564 (59.8%) |
Disability Status by Sex by Age in Upton
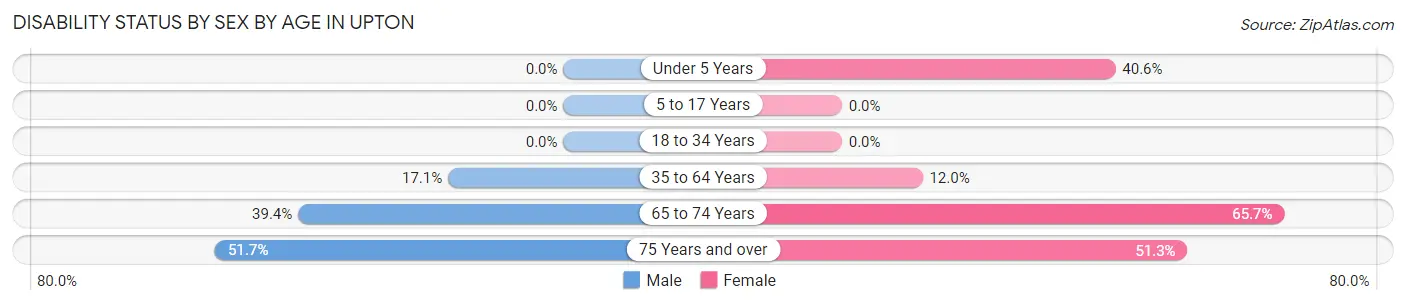
| Age Bracket | Male | Female |
| Under 5 Years | 0 (0.0%) | 13 (40.6%) |
| 5 to 17 Years | 0 (0.0%) | 0 (0.0%) |
| 18 to 34 Years | 0 (0.0%) | 0 (0.0%) |
| 35 to 64 Years | 38 (17.1%) | 26 (12.0%) |
| 65 to 74 Years | 26 (39.4%) | 46 (65.7%) |
| 75 Years and over | 30 (51.7%) | 39 (51.3%) |
Disability Class by Sex by Age in Upton
Disability Class: Hearing Difficulty
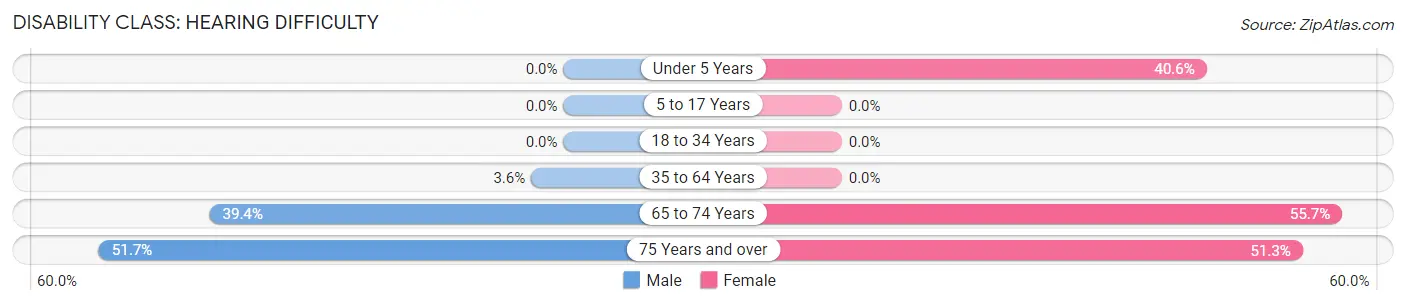
| Age Bracket | Male | Female |
| Under 5 Years | 0 (0.0%) | 13 (40.6%) |
| 5 to 17 Years | 0 (0.0%) | 0 (0.0%) |
| 18 to 34 Years | 0 (0.0%) | 0 (0.0%) |
| 35 to 64 Years | 8 (3.6%) | 0 (0.0%) |
| 65 to 74 Years | 26 (39.4%) | 39 (55.7%) |
| 75 Years and over | 30 (51.7%) | 39 (51.3%) |
Disability Class: Vision Difficulty
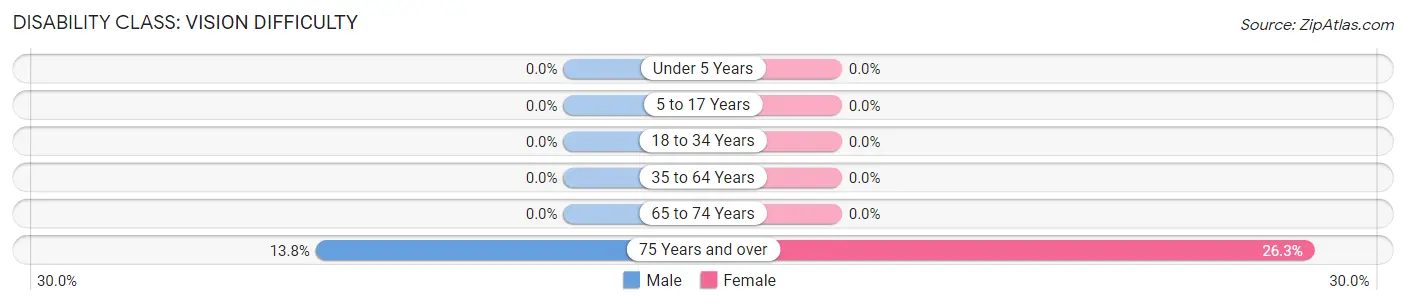
| Age Bracket | Male | Female |
| Under 5 Years | 0 (0.0%) | 0 (0.0%) |
| 5 to 17 Years | 0 (0.0%) | 0 (0.0%) |
| 18 to 34 Years | 0 (0.0%) | 0 (0.0%) |
| 35 to 64 Years | 0 (0.0%) | 0 (0.0%) |
| 65 to 74 Years | 0 (0.0%) | 0 (0.0%) |
| 75 Years and over | 8 (13.8%) | 20 (26.3%) |
Disability Class: Cognitive Difficulty
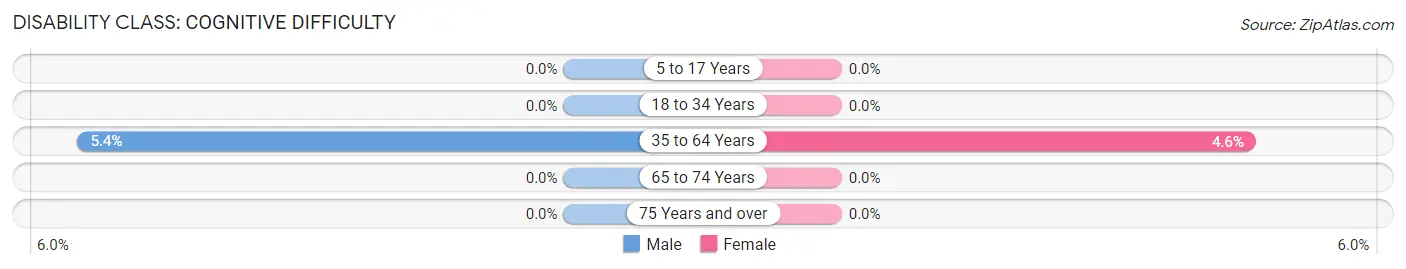
| Age Bracket | Male | Female |
| 5 to 17 Years | 0 (0.0%) | 0 (0.0%) |
| 18 to 34 Years | 0 (0.0%) | 0 (0.0%) |
| 35 to 64 Years | 12 (5.4%) | 10 (4.6%) |
| 65 to 74 Years | 0 (0.0%) | 0 (0.0%) |
| 75 Years and over | 0 (0.0%) | 0 (0.0%) |
Disability Class: Ambulatory Difficulty
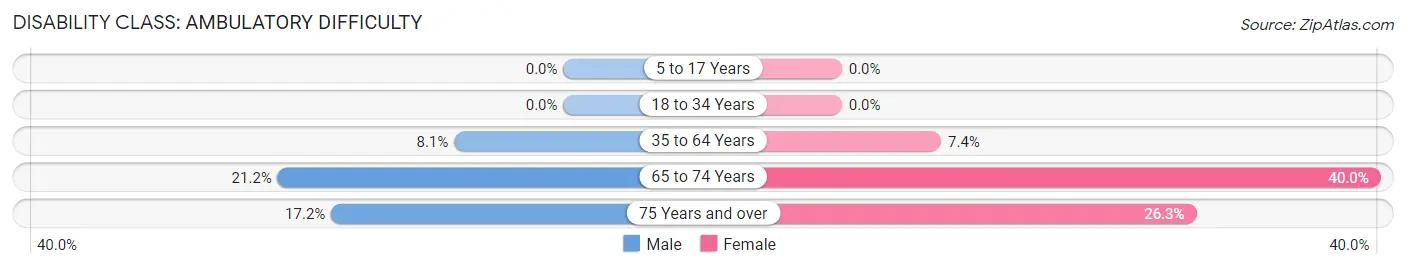
| Age Bracket | Male | Female |
| 5 to 17 Years | 0 (0.0%) | 0 (0.0%) |
| 18 to 34 Years | 0 (0.0%) | 0 (0.0%) |
| 35 to 64 Years | 18 (8.1%) | 16 (7.4%) |
| 65 to 74 Years | 14 (21.2%) | 28 (40.0%) |
| 75 Years and over | 10 (17.2%) | 20 (26.3%) |
Disability Class: Self-Care Difficulty
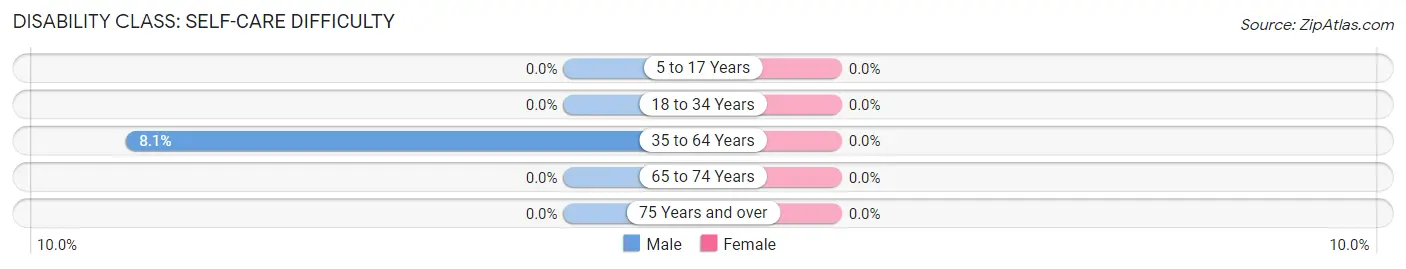
| Age Bracket | Male | Female |
| 5 to 17 Years | 0 (0.0%) | 0 (0.0%) |
| 18 to 34 Years | 0 (0.0%) | 0 (0.0%) |
| 35 to 64 Years | 18 (8.1%) | 0 (0.0%) |
| 65 to 74 Years | 0 (0.0%) | 0 (0.0%) |
| 75 Years and over | 0 (0.0%) | 0 (0.0%) |
Technology Access in Upton
Computing Device Access in Upton
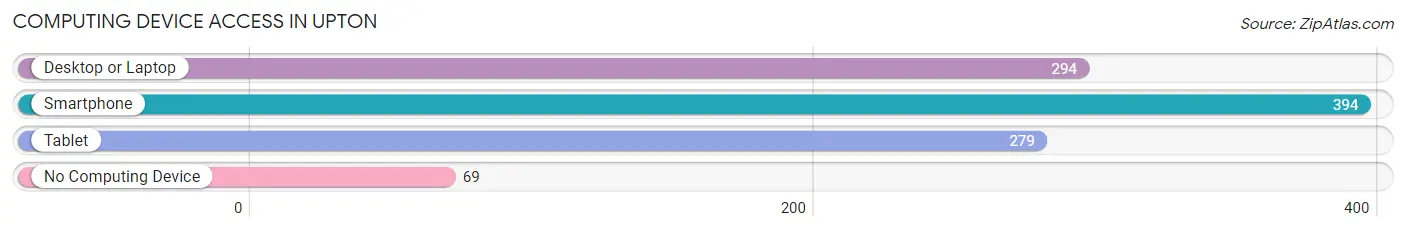
| Device Type | # Households | % Households |
| Desktop or Laptop | 294 | 60.1% |
| Smartphone | 394 | 80.6% |
| Tablet | 279 | 57.1% |
| No Computing Device | 69 | 14.1% |
| Total | 489 | 100.0% |
Internet Access in Upton
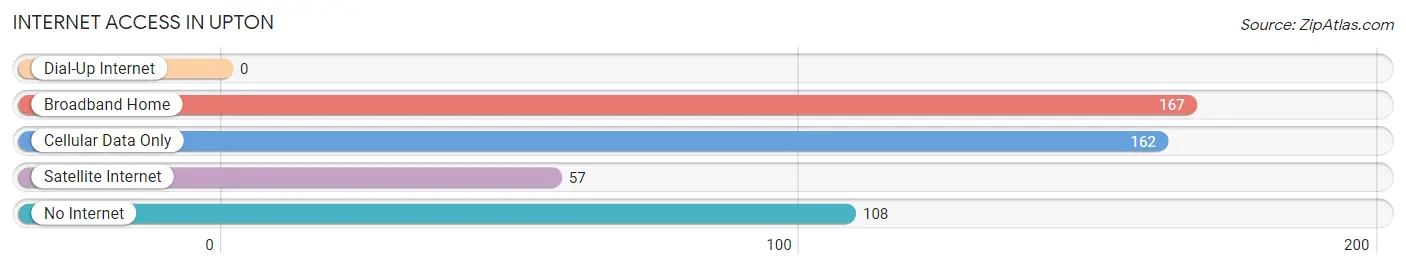
| Internet Type | # Households | % Households |
| Dial-Up Internet | 0 | 0.0% |
| Broadband Home | 167 | 34.2% |
| Cellular Data Only | 162 | 33.1% |
| Satellite Internet | 57 | 11.7% |
| No Internet | 108 | 22.1% |
| Total | 489 | 100.0% |
Upton Summary
Upton, Wyoming is a small town located in Weston County in the northeastern part of the state. It is situated on the banks of the Little Powder River, and is surrounded by rolling hills and prairies. The town was founded in 1887 and has a population of approximately 1,000 people.
Upton is located in the Powder River Basin, which is a major agricultural region in Wyoming. The town is home to a variety of businesses, including a grocery store, a hardware store, a bank, a post office, and a few restaurants. The town also has a small airport, which serves the surrounding area.
The town's economy is largely based on agriculture, with wheat, barley, and hay being the main crops. The town also has a few small businesses, such as a gas station, a bar, and a few other retail stores.
The town's geography is characterized by rolling hills and prairies, with the Little Powder River running through the center of town. The town is located at an elevation of 4,400 feet, and the surrounding area is mostly flat. The town is located in a semi-arid climate, with hot summers and cold winters.
The population of Upton in 2000 was 1,000 people, with a median age of 37. The town is predominantly white, with a small Hispanic population. The town has a low unemployment rate, and the median household income is slightly above the state average.
The town is served by the Weston County School District, which includes two elementary schools, a middle school, and a high school. The town also has a library, a museum, and a few churches.
Upton is a small town with a rich history and a strong sense of community. The town is home to a variety of businesses, and the surrounding area is home to a variety of agricultural activities. The town is a great place to live, work, and raise a family.
Common Questions
What is Per Capita Income in Upton?
Per Capita income in Upton is $41,344.
What is the Median Family Income in Upton?
Median Family Income in Upton is $97,716.
What is the Median Household income in Upton?
Median Household Income in Upton is $65,664.
What is Income or Wage Gap in Upton?
Income or Wage Gap in Upton is 86.1%.
Women in Upton earn 13.9 cents for every dollar earned by a man.
What is Inequality or Gini Index in Upton?
Inequality or Gini Index in Upton is 0.45.
What is the Total Population of Upton?
Total Population of Upton is 943.
What is the Total Male Population of Upton?
Total Male Population of Upton is 421.
What is the Total Female Population of Upton?
Total Female Population of Upton is 522.
What is the Ratio of Males per 100 Females in Upton?
There are 80.65 Males per 100 Females in Upton.
What is the Ratio of Females per 100 Males in Upton?
There are 123.99 Females per 100 Males in Upton.
What is the Median Population Age in Upton?
Median Population Age in Upton is 50.4 Years.
What is the Average Family Size in Upton
Average Family Size in Upton is 2.6 People.
What is the Average Household Size in Upton
Average Household Size in Upton is 1.9 People.
How Large is the Labor Force in Upton?
There are 521 People in the Labor Forcein in Upton.
What is the Percentage of People in the Labor Force in Upton?
62.8% of People are in the Labor Force in Upton.
What is the Unemployment Rate in Upton?
Unemployment Rate in Upton is 2.9%.