Ten Sleep, WY Map & Demographics
Ten Sleep Map
Ten Sleep Overview
$23,623
PER CAPITA INCOME
$61,500
AVG FAMILY INCOME
$37,500
AVG HOUSEHOLD INCOME
59.3%
WAGE / INCOME GAP [ % ]
40.7¢/ $1
WAGE / INCOME GAP [ $ ]
0.38
INEQUALITY / GINI INDEX
236
TOTAL POPULATION
140
MALE POPULATION
96
FEMALE POPULATION
145.83
MALES / 100 FEMALES
68.57
FEMALES / 100 MALES
54.3
MEDIAN AGE
2.7
AVG FAMILY SIZE
1.9
AVG HOUSEHOLD SIZE
90
LABOR FORCE [ PEOPLE ]
46.6%
PERCENT IN LABOR FORCE
Ten Sleep Zip Codes
Ten Sleep Area Codes
Income in Ten Sleep
Income Overview in Ten Sleep
Per Capita Income in Ten Sleep is $23,623, while median incomes of families and households are $61,500 and $37,500 respectively.
| Characteristic | Number | Measure |
| Per Capita Income | 236 | $23,623 |
| Median Family Income | 60 | $61,500 |
| Mean Family Income | 60 | $62,385 |
| Median Household Income | 124 | $37,500 |
| Mean Household Income | 124 | $45,177 |
| Income Deficit | 60 | $0 |
| Wage / Income Gap (%) | 236 | 59.26% |
| Wage / Income Gap ($) | 236 | 40.74¢ per $1 |
| Gini / Inequality Index | 236 | 0.38 |
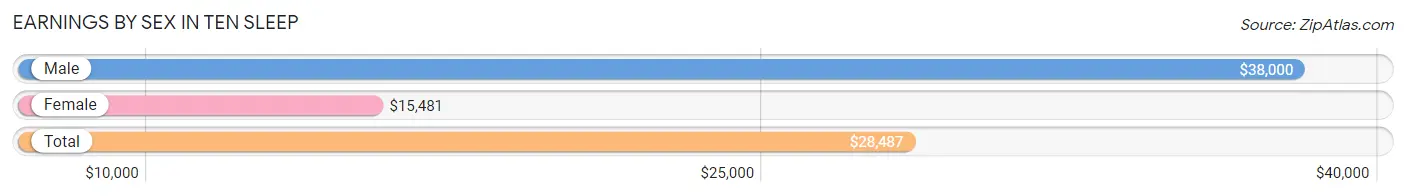
Earnings by Sex in Ten Sleep
Average Earnings in Ten Sleep are $28,487, $38,000 for men and $15,481 for women, a difference of 59.3%.
| Sex | Number | Average Earnings |
| Male | 62 (59.1%) | $38,000 |
| Female | 43 (40.9%) | $15,481 |
| Total | 105 (100.0%) | $28,487 |
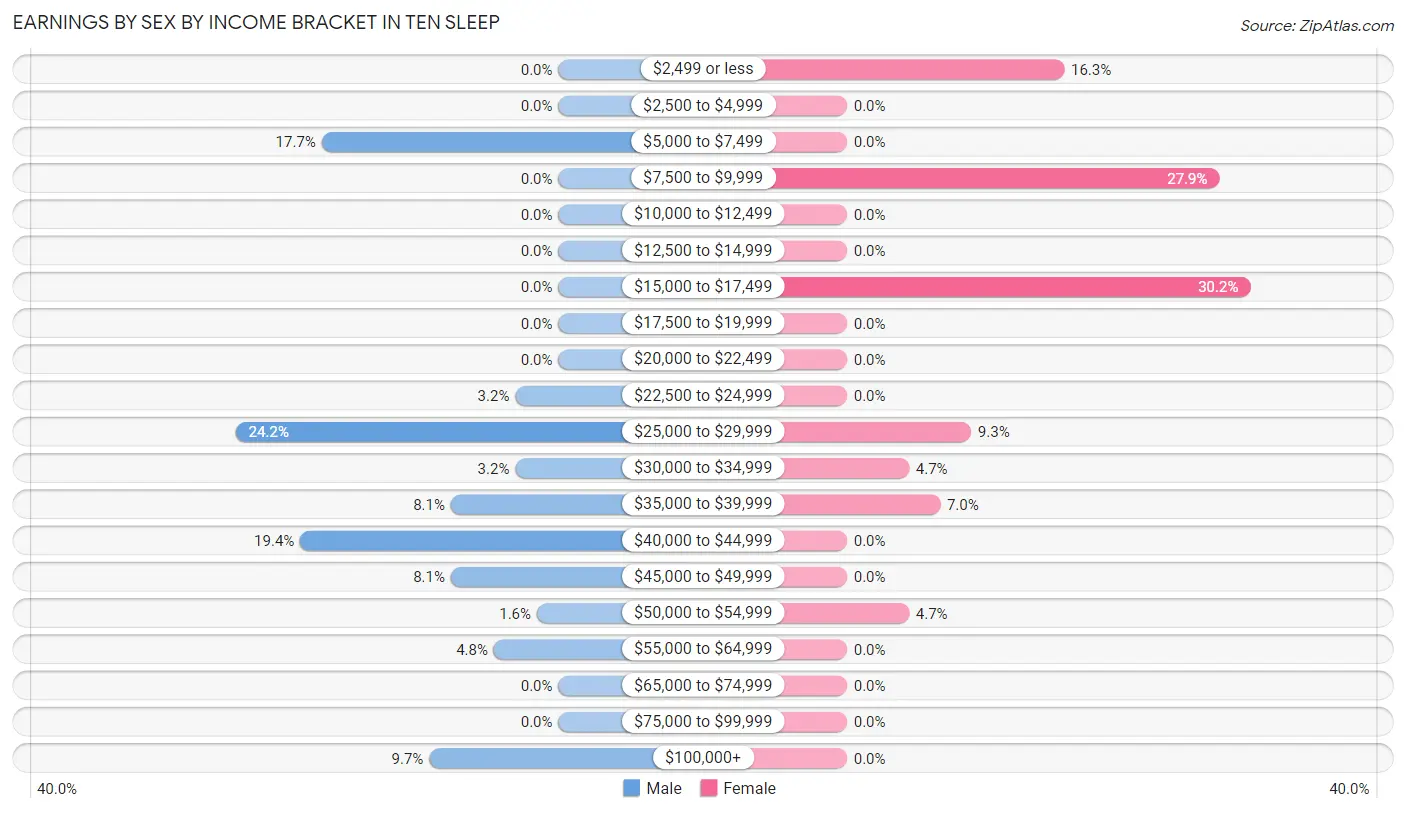
Earnings by Sex by Income Bracket in Ten Sleep
The most common earnings brackets in Ten Sleep are $25,000 to $29,999 for men (15 | 24.2%) and $15,000 to $17,499 for women (13 | 30.2%).
| Income | Male | Female |
| $2,499 or less | 0 (0.0%) | 7 (16.3%) |
| $2,500 to $4,999 | 0 (0.0%) | 0 (0.0%) |
| $5,000 to $7,499 | 11 (17.7%) | 0 (0.0%) |
| $7,500 to $9,999 | 0 (0.0%) | 12 (27.9%) |
| $10,000 to $12,499 | 0 (0.0%) | 0 (0.0%) |
| $12,500 to $14,999 | 0 (0.0%) | 0 (0.0%) |
| $15,000 to $17,499 | 0 (0.0%) | 13 (30.2%) |
| $17,500 to $19,999 | 0 (0.0%) | 0 (0.0%) |
| $20,000 to $22,499 | 0 (0.0%) | 0 (0.0%) |
| $22,500 to $24,999 | 2 (3.2%) | 0 (0.0%) |
| $25,000 to $29,999 | 15 (24.2%) | 4 (9.3%) |
| $30,000 to $34,999 | 2 (3.2%) | 2 (4.6%) |
| $35,000 to $39,999 | 5 (8.1%) | 3 (7.0%) |
| $40,000 to $44,999 | 12 (19.4%) | 0 (0.0%) |
| $45,000 to $49,999 | 5 (8.1%) | 0 (0.0%) |
| $50,000 to $54,999 | 1 (1.6%) | 2 (4.6%) |
| $55,000 to $64,999 | 3 (4.8%) | 0 (0.0%) |
| $65,000 to $74,999 | 0 (0.0%) | 0 (0.0%) |
| $75,000 to $99,999 | 0 (0.0%) | 0 (0.0%) |
| $100,000+ | 6 (9.7%) | 0 (0.0%) |
| Total | 62 (100.0%) | 43 (100.0%) |
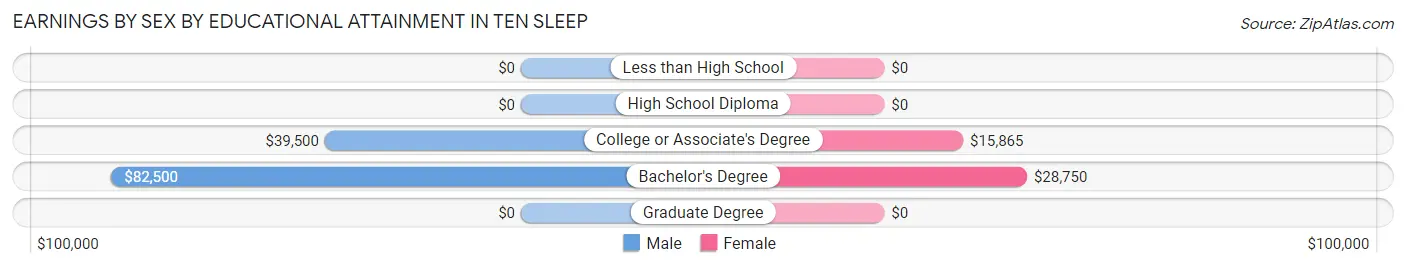
Earnings by Sex by Educational Attainment in Ten Sleep
Average earnings in Ten Sleep are $49,000 for men and $16,154 for women, a difference of 67.0%. Men with an educational attainment of bachelor's degree enjoy the highest average annual earnings of $82,500, while those with college or associate's degree education earn the least with $39,500. Women with an educational attainment of bachelor's degree earn the most with the average annual earnings of $28,750, while those with college or associate's degree education have the smallest earnings of $15,865.
| Educational Attainment | Male Income | Female Income |
| Less than High School | - | - |
| High School Diploma | - | - |
| College or Associate's Degree | $39,500 | $15,865 |
| Bachelor's Degree | $82,500 | $28,750 |
| Graduate Degree | - | - |
| Total | $49,000 | $16,154 |
Family Income in Ten Sleep
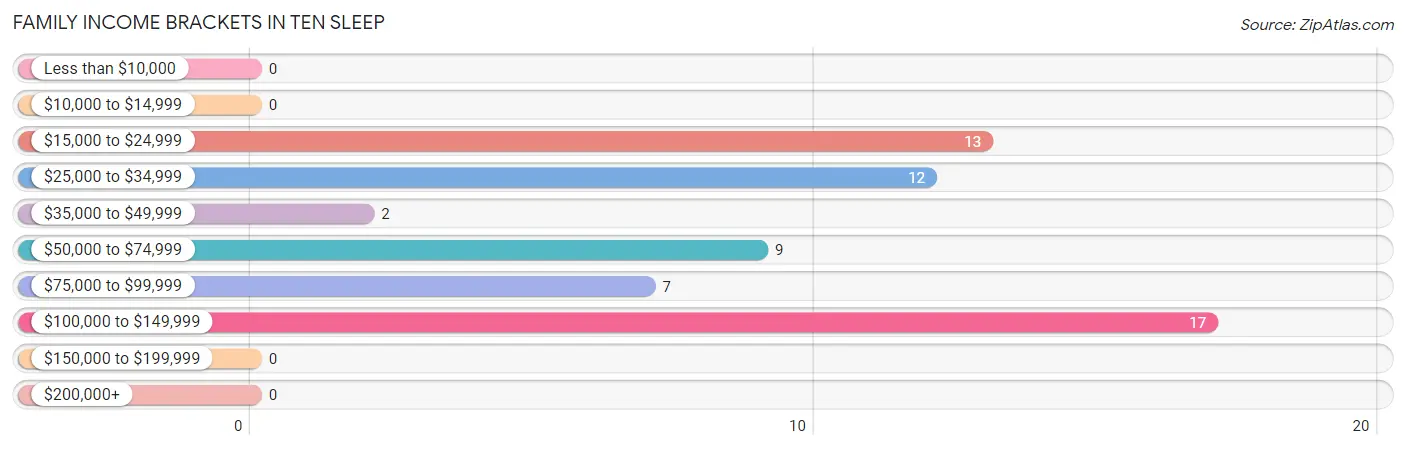
Family Income Brackets in Ten Sleep
According to the Ten Sleep family income data, there are 17 families falling into the $100,000 to $149,999 income range, which is the most common income bracket and makes up 28.3% of all families.
| Income Bracket | # Families | % Families |
| Less than $10,000 | 0 | 0.0% |
| $10,000 to $14,999 | 0 | 0.0% |
| $15,000 to $24,999 | 13 | 21.7% |
| $25,000 to $34,999 | 12 | 20.0% |
| $35,000 to $49,999 | 2 | 3.3% |
| $50,000 to $74,999 | 9 | 15.0% |
| $75,000 to $99,999 | 7 | 11.7% |
| $100,000 to $149,999 | 17 | 28.3% |
| $150,000 to $199,999 | 0 | 0.0% |
| $200,000+ | 0 | 0.0% |
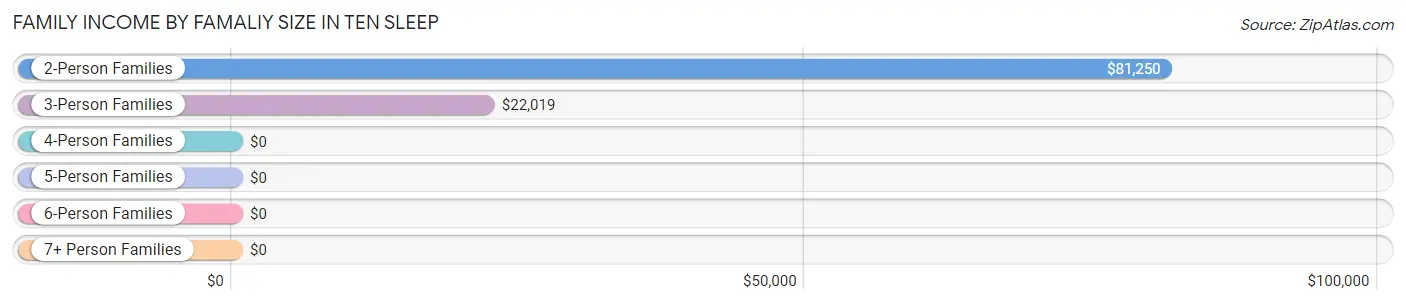
Family Income by Famaliy Size in Ten Sleep
2-person families (32 | 53.3%) account for the highest median family income in Ten Sleep with $81,250 per family, while 2-person families (32 | 53.3%) have the highest median income of $40,625 per family member.
| Income Bracket | # Families | Median Income |
| 2-Person Families | 32 (53.3%) | $81,250 |
| 3-Person Families | 21 (35.0%) | $22,019 |
| 4-Person Families | 4 (6.7%) | $0 |
| 5-Person Families | 3 (5.0%) | $0 |
| 6-Person Families | 0 (0.0%) | $0 |
| 7+ Person Families | 0 (0.0%) | $0 |
| Total | 60 (100.0%) | $61,500 |
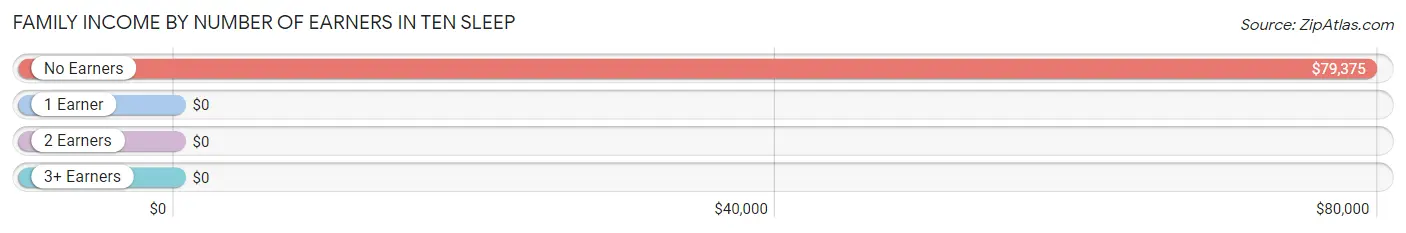
Family Income by Number of Earners in Ten Sleep
| Number of Earners | # Families | Median Income |
| No Earners | 13 (21.7%) | $79,375 |
| 1 Earner | 33 (55.0%) | $0 |
| 2 Earners | 14 (23.3%) | $0 |
| 3+ Earners | 0 (0.0%) | $0 |
| Total | 60 (100.0%) | $61,500 |
Household Income in Ten Sleep
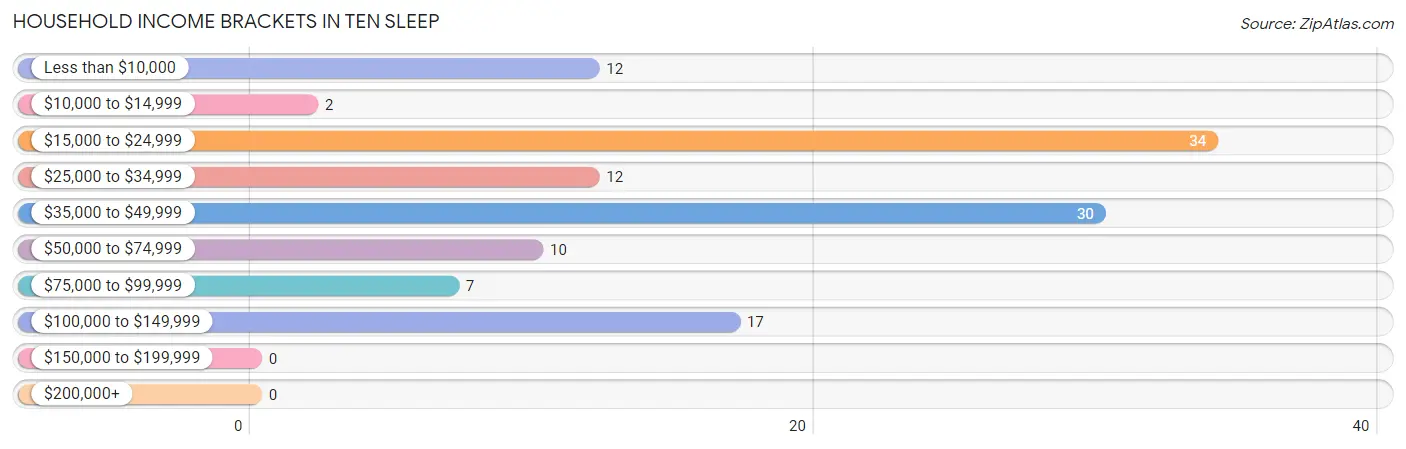
Household Income Brackets in Ten Sleep
With 34 households falling in the category, the $15,000 to $24,999 income range is the most frequent in Ten Sleep, accounting for 27.4% of all households.
| Income Bracket | # Households | % Households |
| Less than $10,000 | 12 | 9.7% |
| $10,000 to $14,999 | 2 | 1.6% |
| $15,000 to $24,999 | 34 | 27.4% |
| $25,000 to $34,999 | 12 | 9.7% |
| $35,000 to $49,999 | 30 | 24.2% |
| $50,000 to $74,999 | 10 | 8.1% |
| $75,000 to $99,999 | 7 | 5.6% |
| $100,000 to $149,999 | 17 | 13.7% |
| $150,000 to $199,999 | 0 | 0.0% |
| $200,000+ | 0 | 0.0% |
Household Income by Householder Age in Ten Sleep
The median household income in Ten Sleep is $37,500, with the highest median household income of $38,558 found in the 65+ years age bracket for the primary householder. A total of 51 households (41.1%) fall into this category. Meanwhile, the 15 to 24 years age bracket for the primary householder has the lowest median household income of $0, with 19 households (15.3%) in this group.
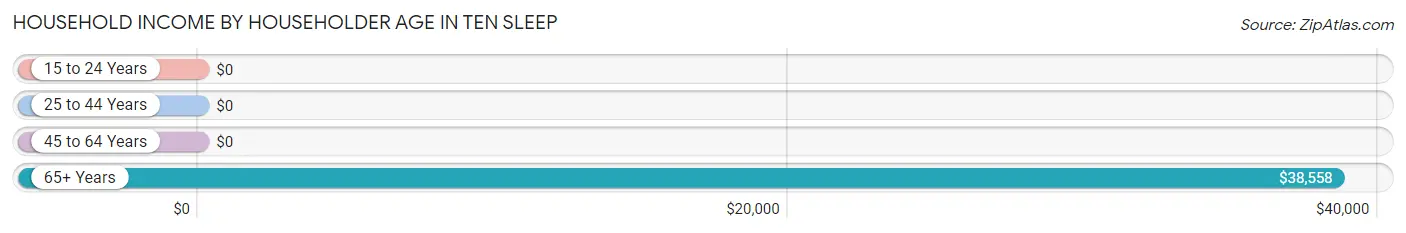
| Income Bracket | # Households | Median Income |
| 15 to 24 Years | 19 (15.3%) | $0 |
| 25 to 44 Years | 17 (13.7%) | $0 |
| 45 to 64 Years | 37 (29.8%) | $0 |
| 65+ Years | 51 (41.1%) | $38,558 |
| Total | 124 (100.0%) | $37,500 |
Poverty in Ten Sleep
Income Below Poverty by Sex and Age in Ten Sleep
With 25.0% poverty level for males and 25.0% for females among the residents of Ten Sleep, 6 to 11 year old males and 35 to 44 year old females are the most vulnerable to poverty, with 10 males (76.9%) and 13 females (76.5%) in their respective age groups living below the poverty level.
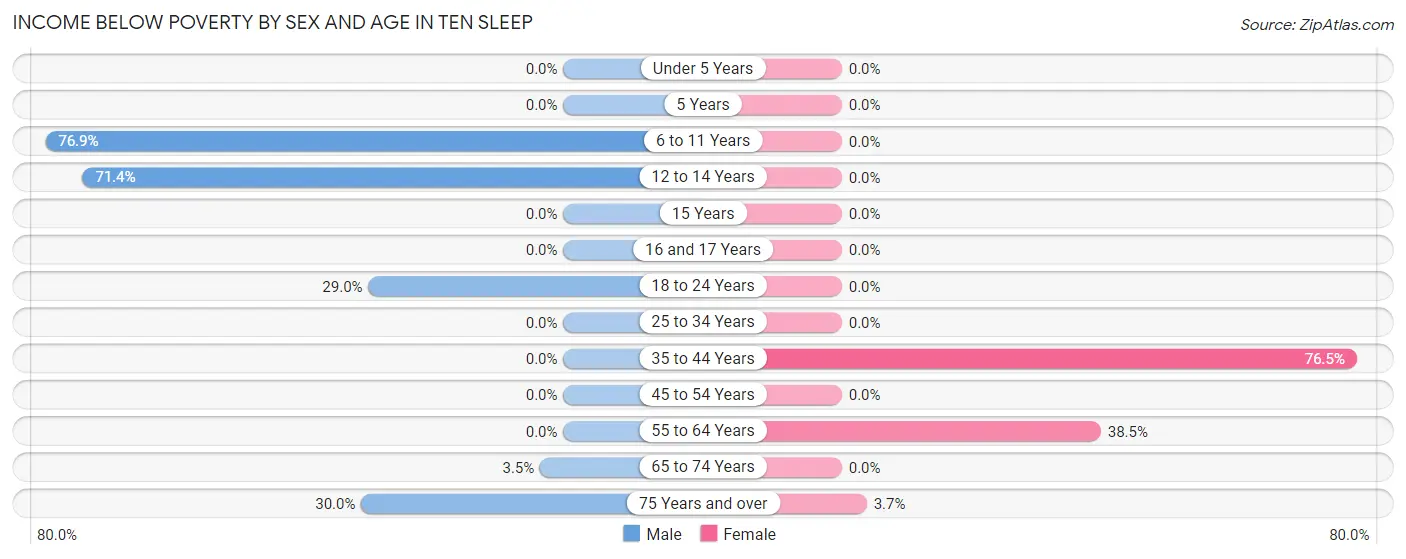
| Age Bracket | Male | Female |
| Under 5 Years | 0 (0.0%) | 0 (0.0%) |
| 5 Years | 0 (0.0%) | 0 (0.0%) |
| 6 to 11 Years | 10 (76.9%) | 0 (0.0%) |
| 12 to 14 Years | 10 (71.4%) | 0 (0.0%) |
| 15 Years | 0 (0.0%) | 0 (0.0%) |
| 16 and 17 Years | 0 (0.0%) | 0 (0.0%) |
| 18 to 24 Years | 11 (28.9%) | 0 (0.0%) |
| 25 to 34 Years | 0 (0.0%) | 0 (0.0%) |
| 35 to 44 Years | 0 (0.0%) | 13 (76.5%) |
| 45 to 54 Years | 0 (0.0%) | 0 (0.0%) |
| 55 to 64 Years | 0 (0.0%) | 10 (38.5%) |
| 65 to 74 Years | 1 (3.5%) | 0 (0.0%) |
| 75 Years and over | 3 (30.0%) | 1 (3.7%) |
| Total | 35 (25.0%) | 24 (25.0%) |
Income Above Poverty by Sex and Age in Ten Sleep
According to the poverty statistics in Ten Sleep, males aged under 5 years and females aged 6 to 11 years are the age groups that are most secure financially, with 100.0% of males and 100.0% of females in these age groups living above the poverty line.
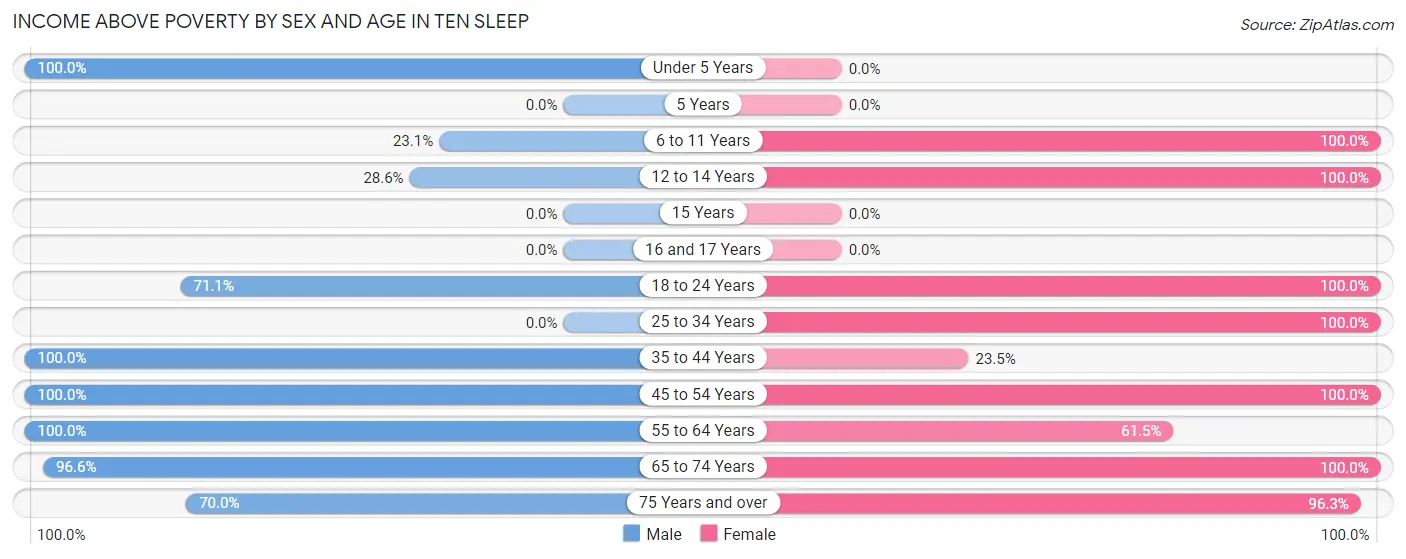
| Age Bracket | Male | Female |
| Under 5 Years | 11 (100.0%) | 0 (0.0%) |
| 5 Years | 0 (0.0%) | 0 (0.0%) |
| 6 to 11 Years | 3 (23.1%) | 2 (100.0%) |
| 12 to 14 Years | 4 (28.6%) | 3 (100.0%) |
| 15 Years | 0 (0.0%) | 0 (0.0%) |
| 16 and 17 Years | 0 (0.0%) | 0 (0.0%) |
| 18 to 24 Years | 27 (71.1%) | 7 (100.0%) |
| 25 to 34 Years | 0 (0.0%) | 2 (100.0%) |
| 35 to 44 Years | 5 (100.0%) | 4 (23.5%) |
| 45 to 54 Years | 7 (100.0%) | 2 (100.0%) |
| 55 to 64 Years | 13 (100.0%) | 16 (61.5%) |
| 65 to 74 Years | 28 (96.6%) | 10 (100.0%) |
| 75 Years and over | 7 (70.0%) | 26 (96.3%) |
| Total | 105 (75.0%) | 72 (75.0%) |
Income Below Poverty Among Married-Couple Families in Ten Sleep
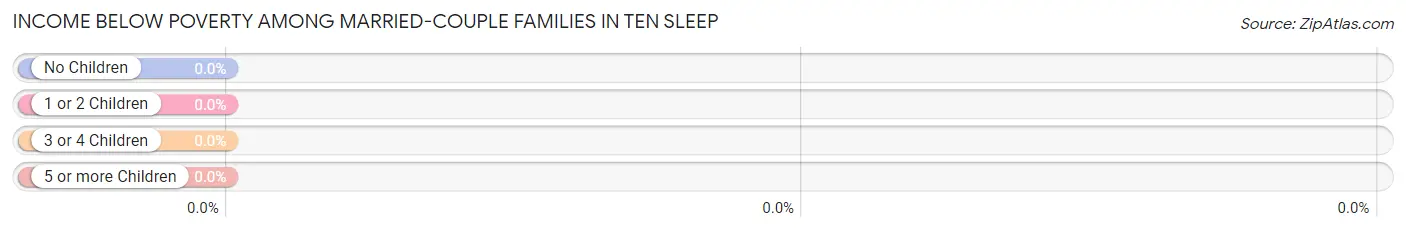
| Children | Above Poverty | Below Poverty |
| No Children | 28 (100.0%) | 0 (0.0%) |
| 1 or 2 Children | 11 (100.0%) | 0 (0.0%) |
| 3 or 4 Children | 3 (100.0%) | 0 (0.0%) |
| 5 or more Children | 0 (0.0%) | 0 (0.0%) |
| Total | 42 (100.0%) | 0 (0.0%) |
Income Below Poverty Among Single-Parent Households in Ten Sleep
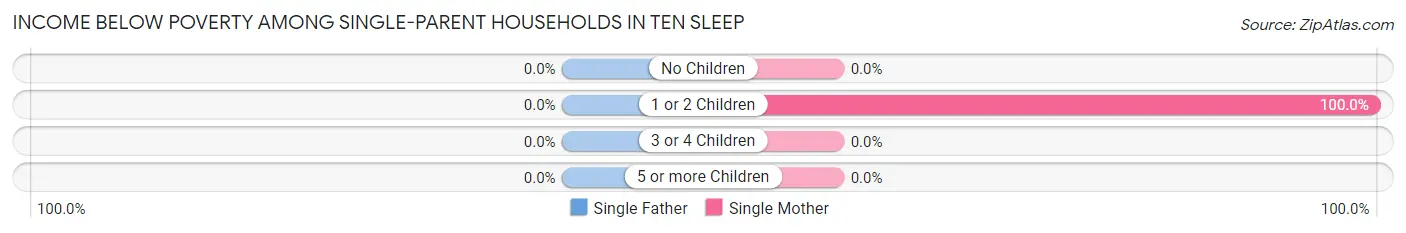
| Children | Single Father | Single Mother |
| No Children | 0 (0.0%) | 0 (0.0%) |
| 1 or 2 Children | 0 (0.0%) | 13 (100.0%) |
| 3 or 4 Children | 0 (0.0%) | 0 (0.0%) |
| 5 or more Children | 0 (0.0%) | 0 (0.0%) |
| Total | 0 (0.0%) | 13 (86.7%) |
Income Below Poverty Among Married-Couple vs Single-Parent Households in Ten Sleep
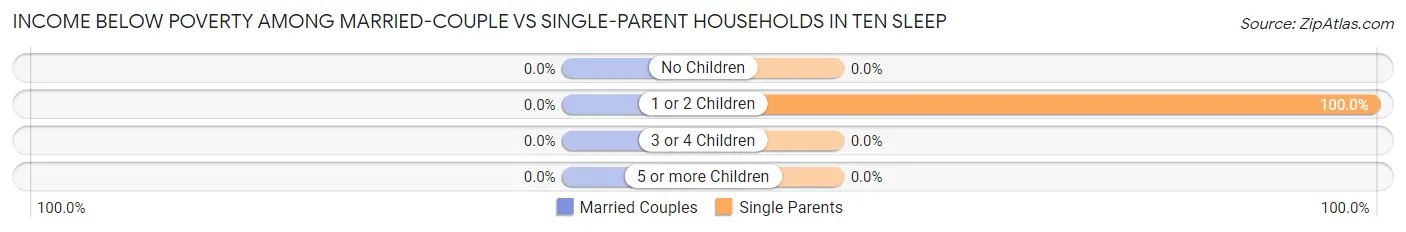
| Children | Married-Couple Families | Single-Parent Households |
| No Children | 0 (0.0%) | 0 (0.0%) |
| 1 or 2 Children | 0 (0.0%) | 13 (100.0%) |
| 3 or 4 Children | 0 (0.0%) | 0 (0.0%) |
| 5 or more Children | 0 (0.0%) | 0 (0.0%) |
| Total | 0 (0.0%) | 13 (72.2%) |
Race in Ten Sleep
The most populous races in Ten Sleep are White / Caucasian (212 | 89.8%), Two or more Races (20 | 8.5%), and Hispanic or Latino (11 | 4.7%).
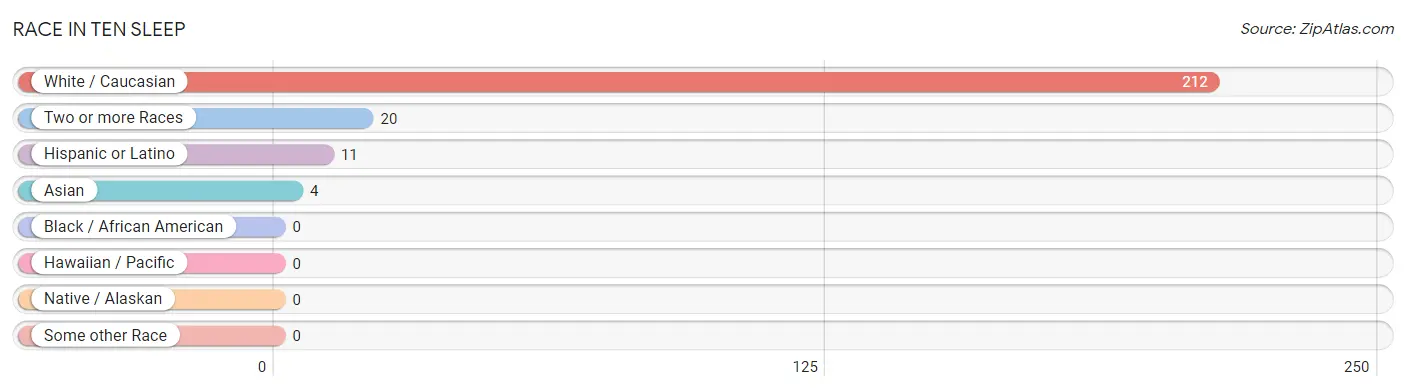
| Race | # Population | % Population |
| Asian | 4 | 1.7% |
| Black / African American | 0 | 0.0% |
| Hawaiian / Pacific | 0 | 0.0% |
| Hispanic or Latino | 11 | 4.7% |
| Native / Alaskan | 0 | 0.0% |
| White / Caucasian | 212 | 89.8% |
| Two or more Races | 20 | 8.5% |
| Some other Race | 0 | 0.0% |
| Total | 236 | 100.0% |
Ancestry in Ten Sleep
The most populous ancestries reported in Ten Sleep are German (67 | 28.4%), English (38 | 16.1%), Finnish (33 | 14.0%), Irish (24 | 10.2%), and Austrian (20 | 8.5%), together accounting for 77.1% of all Ten Sleep residents.
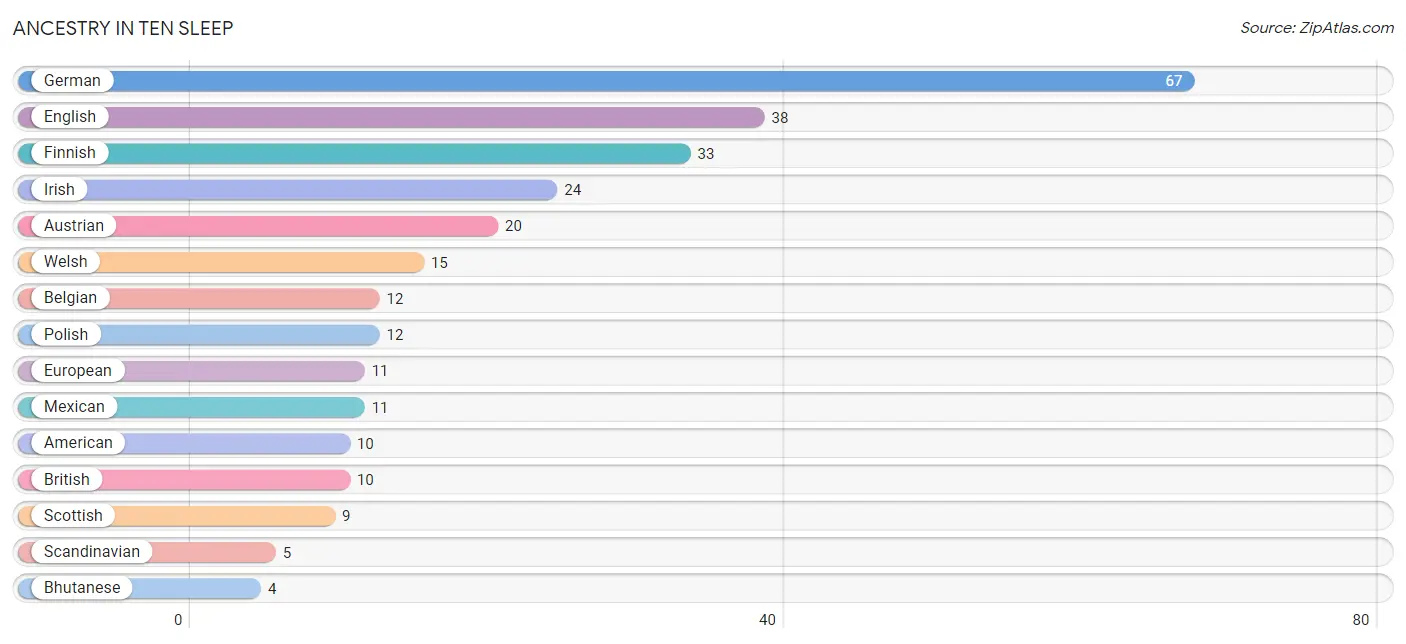
| Ancestry | # Population | % Population |
| American | 10 | 4.2% |
| Austrian | 20 | 8.5% |
| Belgian | 12 | 5.1% |
| Bhutanese | 4 | 1.7% |
| British | 10 | 4.2% |
| Danish | 2 | 0.9% |
| Dutch | 2 | 0.9% |
| English | 38 | 16.1% |
| European | 11 | 4.7% |
| Finnish | 33 | 14.0% |
| German | 67 | 28.4% |
| German Russian | 1 | 0.4% |
| Irish | 24 | 10.2% |
| Mexican | 11 | 4.7% |
| Norwegian | 3 | 1.3% |
| Polish | 12 | 5.1% |
| Scandinavian | 5 | 2.1% |
| Scottish | 9 | 3.8% |
| Welsh | 15 | 6.4% | View All 19 Rows |
Immigrants in Ten Sleep
The most numerous immigrant groups reported in Ten Sleep came from Europe (7 | 3.0%), Germany (7 | 3.0%), Western Europe (7 | 3.0%), Asia (4 | 1.7%), and Eastern Asia (4 | 1.7%), together accounting for 12.3% of all Ten Sleep residents.
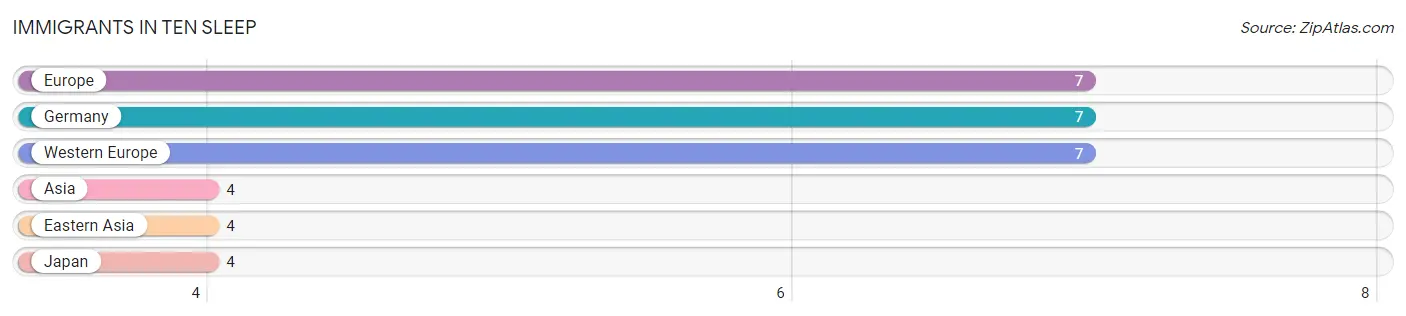
| Immigration Origin | # Population | % Population |
| Asia | 4 | 1.7% |
| Eastern Asia | 4 | 1.7% |
| Europe | 7 | 3.0% |
| Germany | 7 | 3.0% |
| Japan | 4 | 1.7% |
| Western Europe | 7 | 3.0% | View All 6 Rows |
Sex and Age in Ten Sleep
Sex and Age in Ten Sleep
The most populous age groups in Ten Sleep are 20 to 24 Years (38 | 27.1%) for men and 35 to 39 Years (17 | 17.7%) for women.
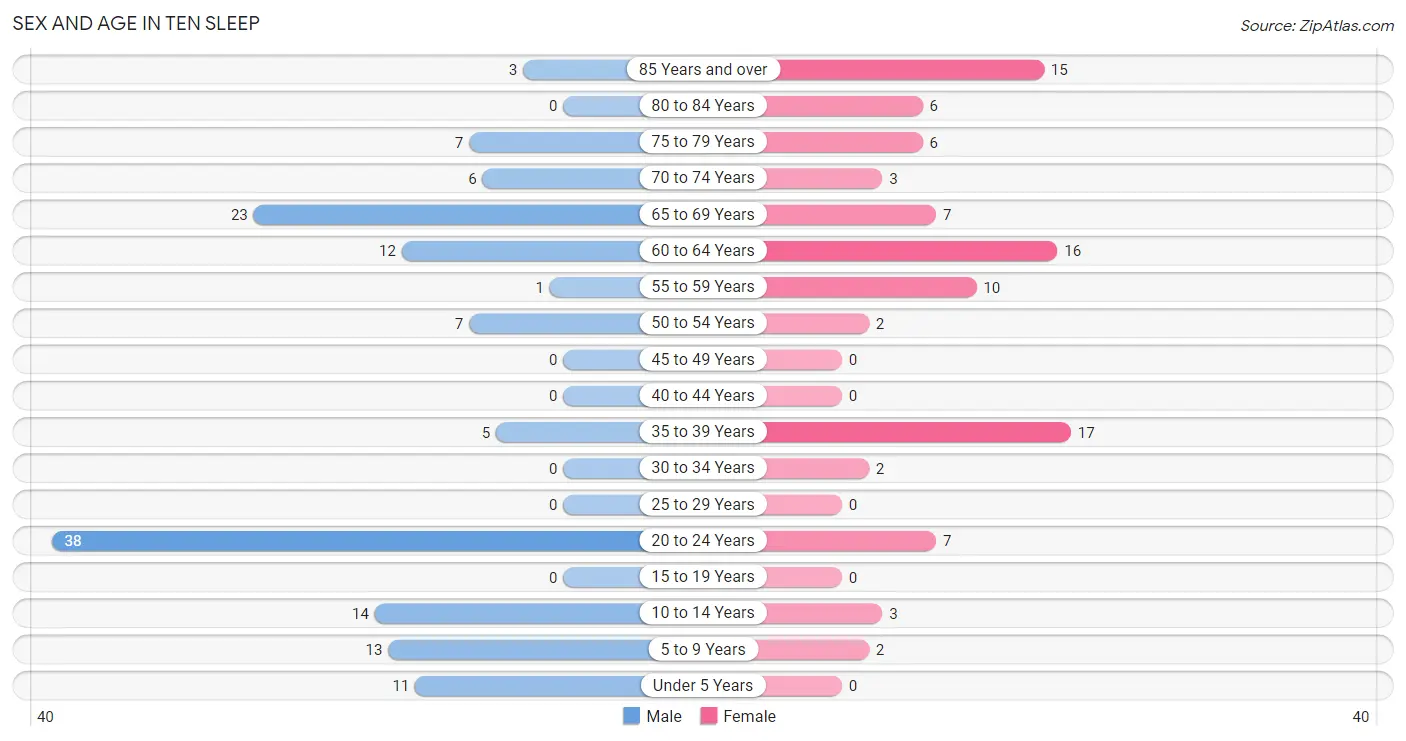
| Age Bracket | Male | Female |
| Under 5 Years | 11 (7.9%) | 0 (0.0%) |
| 5 to 9 Years | 13 (9.3%) | 2 (2.1%) |
| 10 to 14 Years | 14 (10.0%) | 3 (3.1%) |
| 15 to 19 Years | 0 (0.0%) | 0 (0.0%) |
| 20 to 24 Years | 38 (27.1%) | 7 (7.3%) |
| 25 to 29 Years | 0 (0.0%) | 0 (0.0%) |
| 30 to 34 Years | 0 (0.0%) | 2 (2.1%) |
| 35 to 39 Years | 5 (3.6%) | 17 (17.7%) |
| 40 to 44 Years | 0 (0.0%) | 0 (0.0%) |
| 45 to 49 Years | 0 (0.0%) | 0 (0.0%) |
| 50 to 54 Years | 7 (5.0%) | 2 (2.1%) |
| 55 to 59 Years | 1 (0.7%) | 10 (10.4%) |
| 60 to 64 Years | 12 (8.6%) | 16 (16.7%) |
| 65 to 69 Years | 23 (16.4%) | 7 (7.3%) |
| 70 to 74 Years | 6 (4.3%) | 3 (3.1%) |
| 75 to 79 Years | 7 (5.0%) | 6 (6.2%) |
| 80 to 84 Years | 0 (0.0%) | 6 (6.2%) |
| 85 Years and over | 3 (2.1%) | 15 (15.6%) |
| Total | 140 (100.0%) | 96 (100.0%) |
Families and Households in Ten Sleep
Median Family Size in Ten Sleep
The median family size in Ten Sleep is 2.67 persons per family, with married-couple families (42 | 70.0%) accounting for the largest median family size of 2.86 persons per family. On the other hand, single male/father families (3 | 5.0%) represent the smallest median family size with 1.33 persons per family.
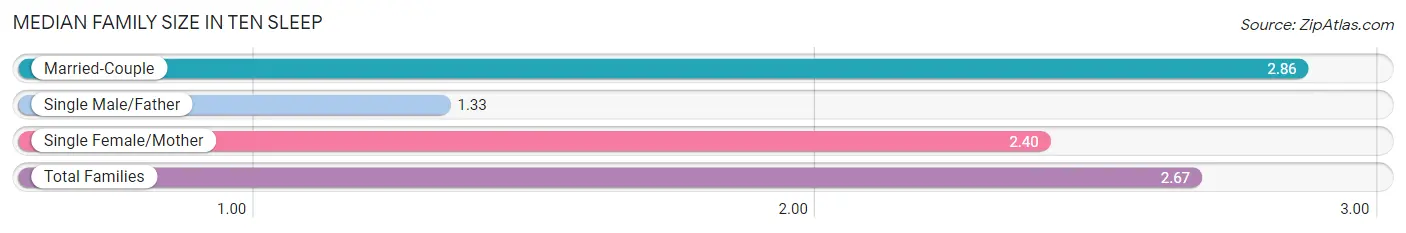
| Family Type | # Families | Family Size |
| Married-Couple | 42 (70.0%) | 2.86 |
| Single Male/Father | 3 (5.0%) | 1.33 |
| Single Female/Mother | 15 (25.0%) | 2.40 |
| Total Families | 60 (100.0%) | 2.67 |
Median Household Size in Ten Sleep
The median household size in Ten Sleep is 1.90 persons per household, with married-couple households (42 | 33.9%) accounting for the largest median household size of 2.86 persons per household. non-family households (64 | 51.6%) represent the smallest median household size with 1.19 persons per household.
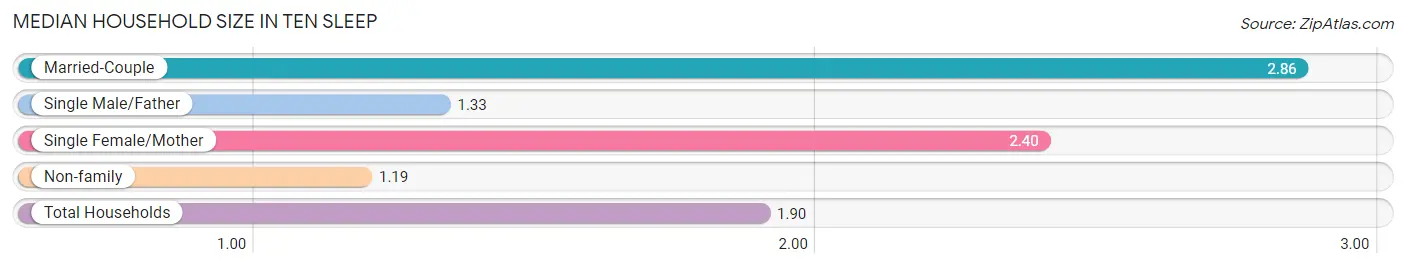
| Household Type | # Households | Household Size |
| Married-Couple | 42 (33.9%) | 2.86 |
| Single Male/Father | 3 (2.4%) | 1.33 |
| Single Female/Mother | 15 (12.1%) | 2.40 |
| Non-family | 64 (51.6%) | 1.19 |
| Total Households | 124 (100.0%) | 1.90 |
Household Size by Marriage Status in Ten Sleep
Out of a total of 124 households in Ten Sleep, 60 (48.4%) are family households, while 64 (51.6%) are nonfamily households. The most numerous type of family households are 2-person households, comprising 32, and the most common type of nonfamily households are 1-person households, comprising 50.
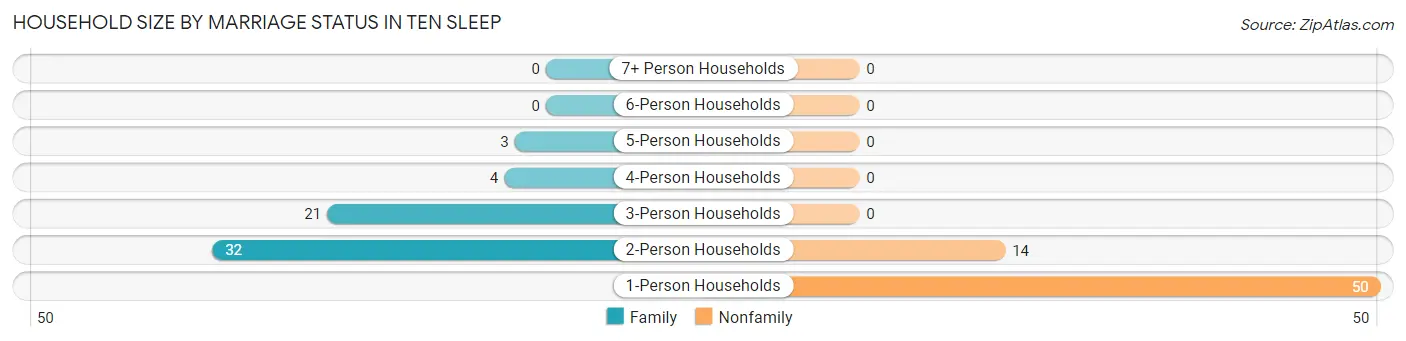
| Household Size | Family Households | Nonfamily Households |
| 1-Person Households | - | 50 (40.3%) |
| 2-Person Households | 32 (25.8%) | 14 (11.3%) |
| 3-Person Households | 21 (16.9%) | 0 (0.0%) |
| 4-Person Households | 4 (3.2%) | 0 (0.0%) |
| 5-Person Households | 3 (2.4%) | 0 (0.0%) |
| 6-Person Households | 0 (0.0%) | 0 (0.0%) |
| 7+ Person Households | 0 (0.0%) | 0 (0.0%) |
| Total | 60 (48.4%) | 64 (51.6%) |
Female Fertility in Ten Sleep
Fertility by Age in Ten Sleep
| Age Bracket | Women with Births | Births / 1,000 Women |
| 15 to 19 years | 0 (0.0%) | 0.0 |
| 20 to 34 years | 0 (0.0%) | 0.0 |
| 35 to 50 years | 0 (0.0%) | 0.0 |
| Total | 0 (0.0%) | 0.0 |
Fertility by Age by Marriage Status in Ten Sleep
| Age Bracket | Married | Unmarried |
| 15 to 19 years | 0 (0.0%) | 0 (0.0%) |
| 20 to 34 years | 0 (0.0%) | 0 (0.0%) |
| 35 to 50 years | 0 (0.0%) | 0 (0.0%) |
| Total | 0 (0.0%) | 0 (0.0%) |
Fertility by Education in Ten Sleep
| Educational Attainment | Women with Births | Births / 1,000 Women |
| Less than High School | 0 (0.0%) | 0.0 |
| High School Diploma | 0 (0.0%) | 0.0 |
| College or Associate's Degree | 0 (0.0%) | 0.0 |
| Bachelor's Degree | 0 (0.0%) | 0.0 |
| Graduate Degree | 0 (0.0%) | 0.0 |
| Total | 0 (0.0%) | 0.0 |
Fertility by Education by Marriage Status in Ten Sleep
| Educational Attainment | Married | Unmarried |
| Less than High School | 0 (0.0%) | 0 (0.0%) |
| High School Diploma | 0 (0.0%) | 0 (0.0%) |
| College or Associate's Degree | 0 (0.0%) | 0 (0.0%) |
| Bachelor's Degree | 0 (0.0%) | 0 (0.0%) |
| Graduate Degree | 0 (0.0%) | 0 (0.0%) |
| Total | 0 (0.0%) | 0 (0.0%) |
Employment Characteristics in Ten Sleep
Employment by Class of Employer in Ten Sleep
Among the 90 employed individuals in Ten Sleep, state government employees (25 | 27.8%), private company employees (23 | 25.6%), and self-employed (not incorporated) (23 | 25.6%) make up the most common classes of employment.
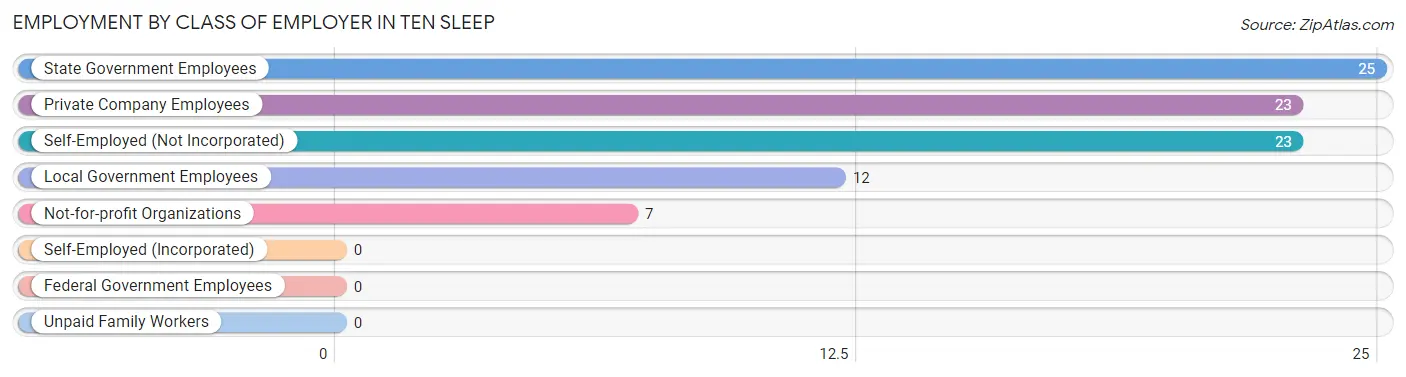
| Employer Class | # Employees | % Employees |
| Private Company Employees | 23 | 25.6% |
| Self-Employed (Incorporated) | 0 | 0.0% |
| Self-Employed (Not Incorporated) | 23 | 25.6% |
| Not-for-profit Organizations | 7 | 7.8% |
| Local Government Employees | 12 | 13.3% |
| State Government Employees | 25 | 27.8% |
| Federal Government Employees | 0 | 0.0% |
| Unpaid Family Workers | 0 | 0.0% |
| Total | 90 | 100.0% |
Employment Status by Age in Ten Sleep
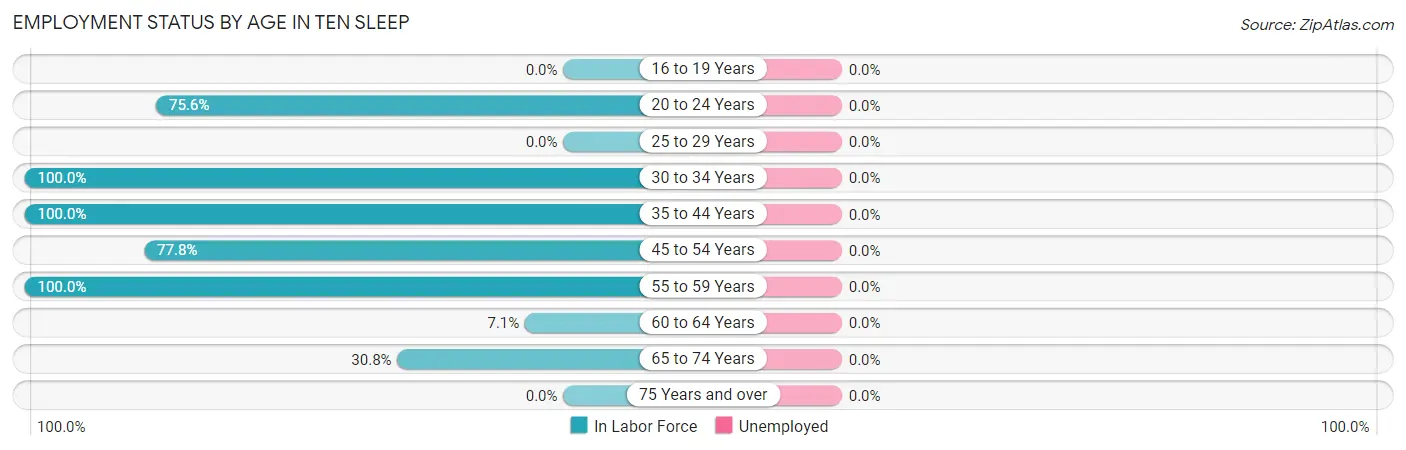
| Age Bracket | In Labor Force | Unemployed |
| 16 to 19 Years | 0 (0.0%) | 0 (0.0%) |
| 20 to 24 Years | 34 (75.6%) | 0 (0.0%) |
| 25 to 29 Years | 0 (0.0%) | 0 (0.0%) |
| 30 to 34 Years | 2 (100.0%) | 0 (0.0%) |
| 35 to 44 Years | 22 (100.0%) | 0 (0.0%) |
| 45 to 54 Years | 7 (77.8%) | 0 (0.0%) |
| 55 to 59 Years | 11 (100.0%) | 0 (0.0%) |
| 60 to 64 Years | 2 (7.1%) | 0 (0.0%) |
| 65 to 74 Years | 12 (30.8%) | 0 (0.0%) |
| 75 Years and over | 0 (0.0%) | 0 (0.0%) |
| Total | 90 (46.6%) | 0 (0.0%) |
Employment Status by Educational Attainment in Ten Sleep
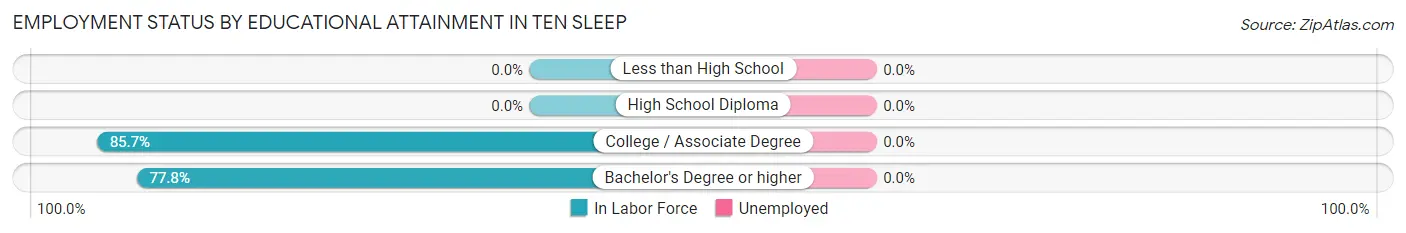
| Educational Attainment | In Labor Force | Unemployed |
| Less than High School | 0 (0.0%) | 0 (0.0%) |
| High School Diploma | 0 (0.0%) | 0 (0.0%) |
| College / Associate Degree | 30 (85.7%) | 0 (0.0%) |
| Bachelor's Degree or higher | 14 (77.8%) | 0 (0.0%) |
| Total | 44 (61.1%) | 0 (0.0%) |
Employment Occupations by Sex in Ten Sleep
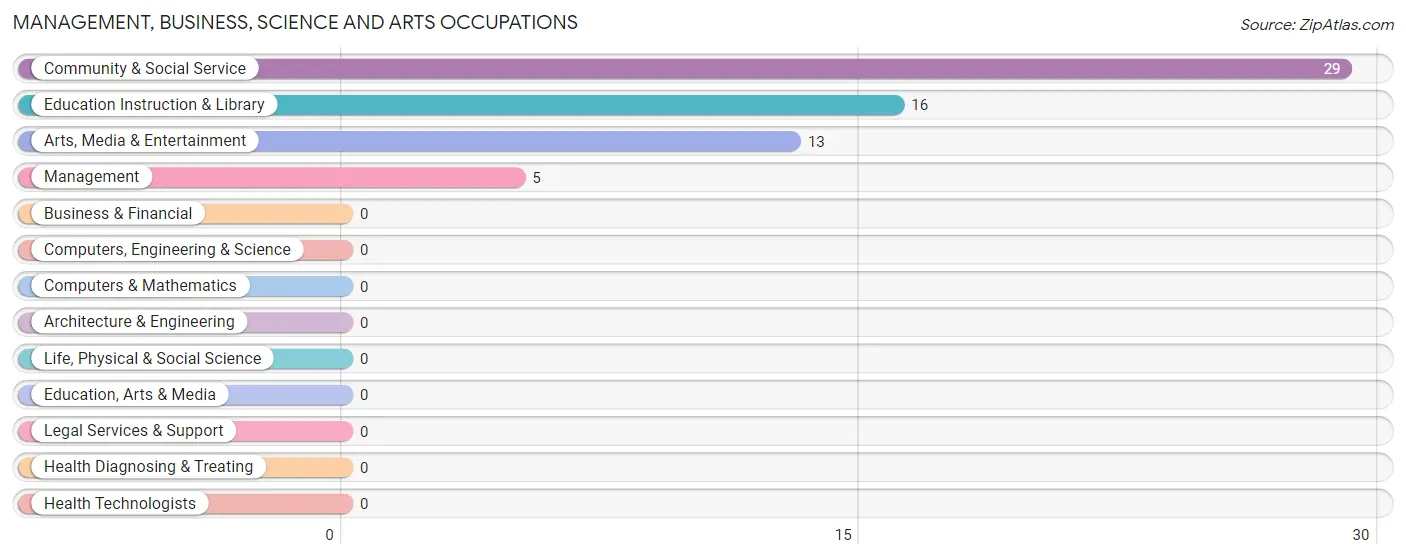
Management, Business, Science and Arts Occupations
The most common Management, Business, Science and Arts occupations in Ten Sleep are Community & Social Service (29 | 32.2%), Education Instruction & Library (16 | 17.8%), Arts, Media & Entertainment (13 | 14.4%), and Management (5 | 5.6%).
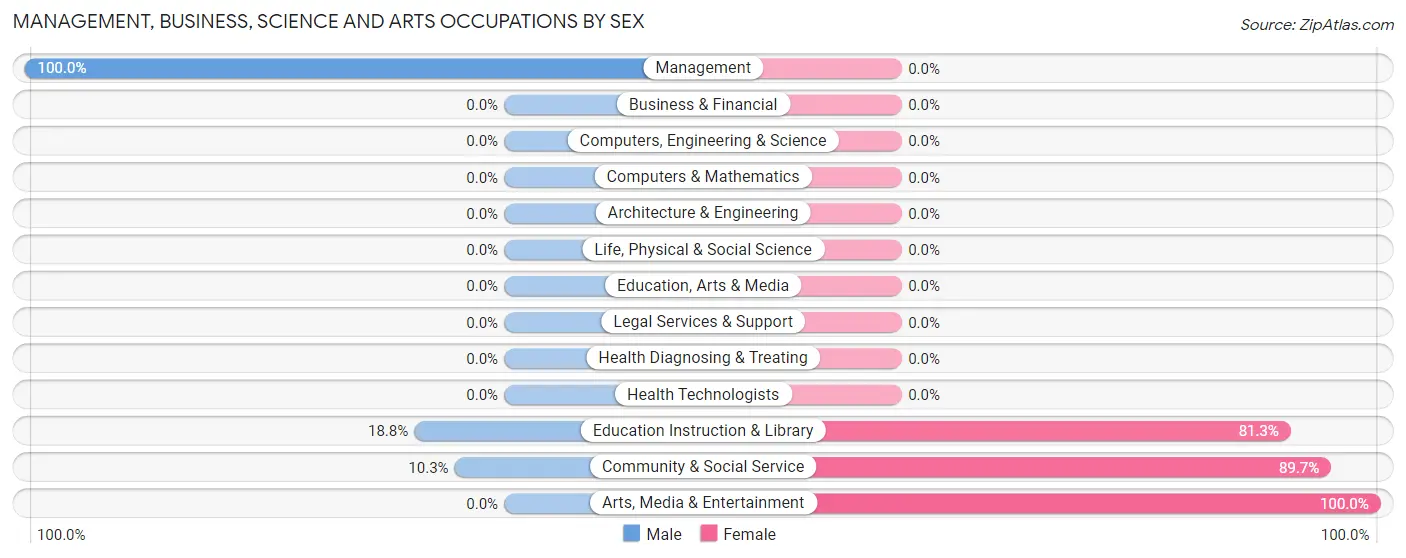
Management, Business, Science and Arts Occupations by Sex
Within the Management, Business, Science and Arts occupations in Ten Sleep, the most male-oriented occupations are Management (100.0%), Education Instruction & Library (18.8%), and Community & Social Service (10.3%), while the most female-oriented occupations are Arts, Media & Entertainment (100.0%), Community & Social Service (89.7%), and Education Instruction & Library (81.2%).
| Occupation | Male | Female |
| Management | 5 (100.0%) | 0 (0.0%) |
| Business & Financial | 0 (0.0%) | 0 (0.0%) |
| Computers, Engineering & Science | 0 (0.0%) | 0 (0.0%) |
| Computers & Mathematics | 0 (0.0%) | 0 (0.0%) |
| Architecture & Engineering | 0 (0.0%) | 0 (0.0%) |
| Life, Physical & Social Science | 0 (0.0%) | 0 (0.0%) |
| Community & Social Service | 3 (10.3%) | 26 (89.7%) |
| Education, Arts & Media | 0 (0.0%) | 0 (0.0%) |
| Legal Services & Support | 0 (0.0%) | 0 (0.0%) |
| Education Instruction & Library | 3 (18.8%) | 13 (81.2%) |
| Arts, Media & Entertainment | 0 (0.0%) | 13 (100.0%) |
| Health Diagnosing & Treating | 0 (0.0%) | 0 (0.0%) |
| Health Technologists | 0 (0.0%) | 0 (0.0%) |
| Total (Category) | 8 (23.5%) | 26 (76.5%) |
| Total (Overall) | 51 (56.7%) | 39 (43.3%) |
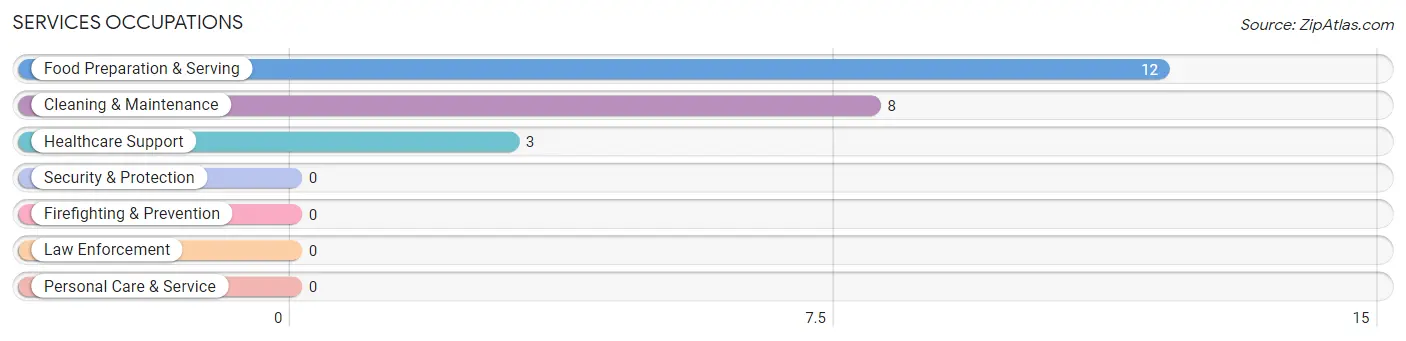
Services Occupations
The most common Services occupations in Ten Sleep are Food Preparation & Serving (12 | 13.3%), Cleaning & Maintenance (8 | 8.9%), and Healthcare Support (3 | 3.3%).
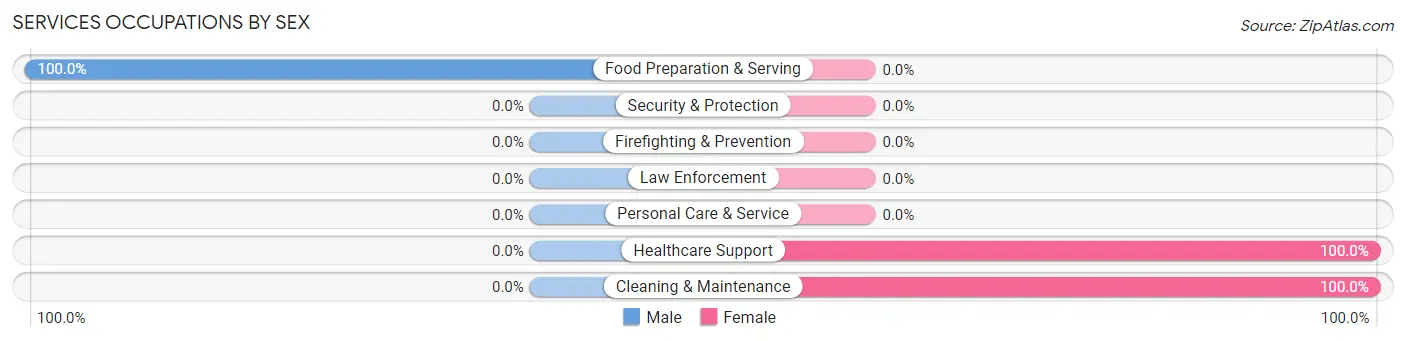
Services Occupations by Sex
| Occupation | Male | Female |
| Healthcare Support | 0 (0.0%) | 3 (100.0%) |
| Security & Protection | 0 (0.0%) | 0 (0.0%) |
| Firefighting & Prevention | 0 (0.0%) | 0 (0.0%) |
| Law Enforcement | 0 (0.0%) | 0 (0.0%) |
| Food Preparation & Serving | 12 (100.0%) | 0 (0.0%) |
| Cleaning & Maintenance | 0 (0.0%) | 8 (100.0%) |
| Personal Care & Service | 0 (0.0%) | 0 (0.0%) |
| Total (Category) | 12 (52.2%) | 11 (47.8%) |
| Total (Overall) | 51 (56.7%) | 39 (43.3%) |
Sales and Office Occupations
Sales and Office Occupations by Sex
| Occupation | Male | Female |
| Sales & Related | 0 (0.0%) | 0 (0.0%) |
| Office & Administration | 0 (0.0%) | 0 (0.0%) |
| Total (Category) | 0 (0.0%) | 0 (0.0%) |
| Total (Overall) | 51 (56.7%) | 39 (43.3%) |
Natural Resources, Construction and Maintenance Occupations
The most common Natural Resources, Construction and Maintenance occupations in Ten Sleep are , and Construction & Extraction (26 | 28.9%).
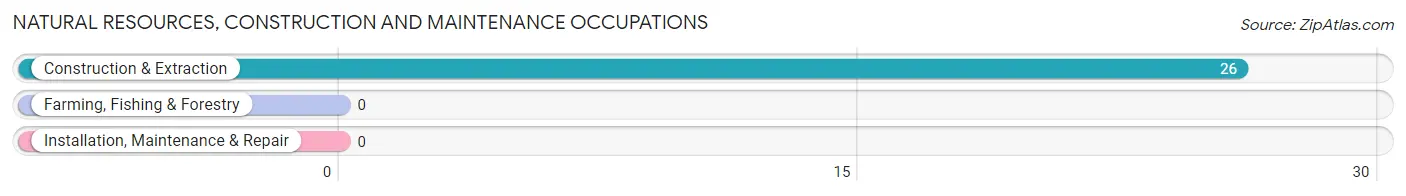
Natural Resources, Construction and Maintenance Occupations by Sex
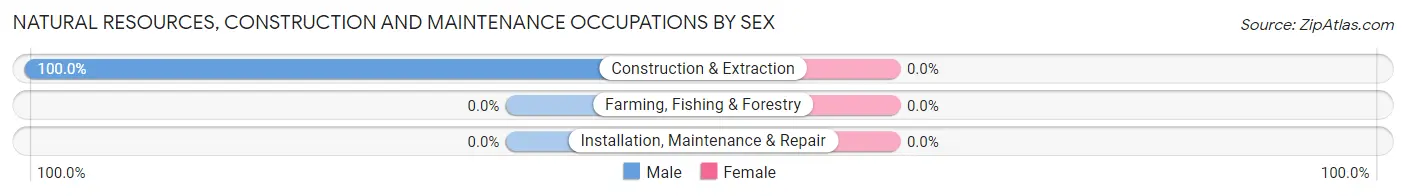
| Occupation | Male | Female |
| Farming, Fishing & Forestry | 0 (0.0%) | 0 (0.0%) |
| Construction & Extraction | 26 (100.0%) | 0 (0.0%) |
| Installation, Maintenance & Repair | 0 (0.0%) | 0 (0.0%) |
| Total (Category) | 26 (100.0%) | 0 (0.0%) |
| Total (Overall) | 51 (56.7%) | 39 (43.3%) |
Production, Transportation and Moving Occupations
The most common Production, Transportation and Moving occupations in Ten Sleep are , and Transportation (7 | 7.8%).
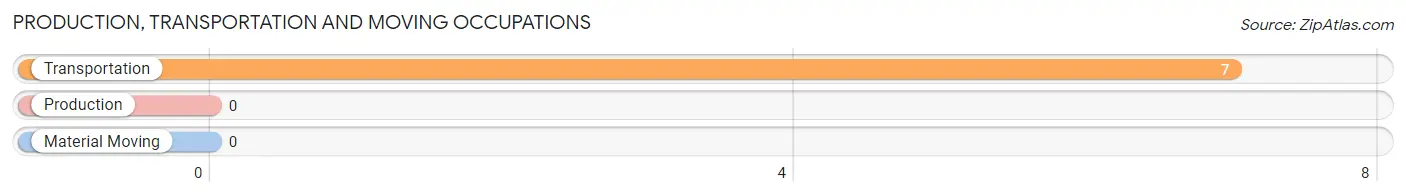
Production, Transportation and Moving Occupations by Sex
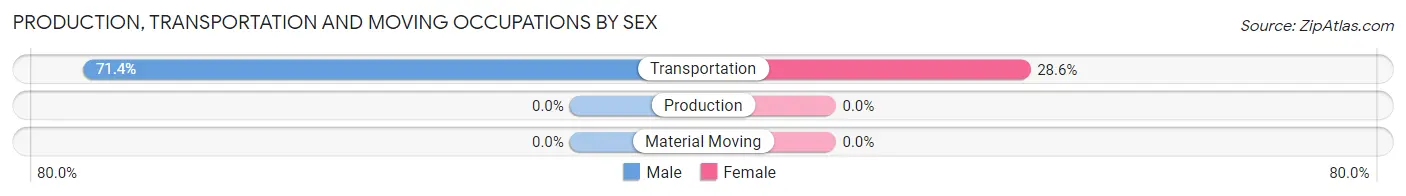
| Occupation | Male | Female |
| Production | 0 (0.0%) | 0 (0.0%) |
| Transportation | 5 (71.4%) | 2 (28.6%) |
| Material Moving | 0 (0.0%) | 0 (0.0%) |
| Total (Category) | 5 (71.4%) | 2 (28.6%) |
| Total (Overall) | 51 (56.7%) | 39 (43.3%) |
Employment Industries by Sex in Ten Sleep
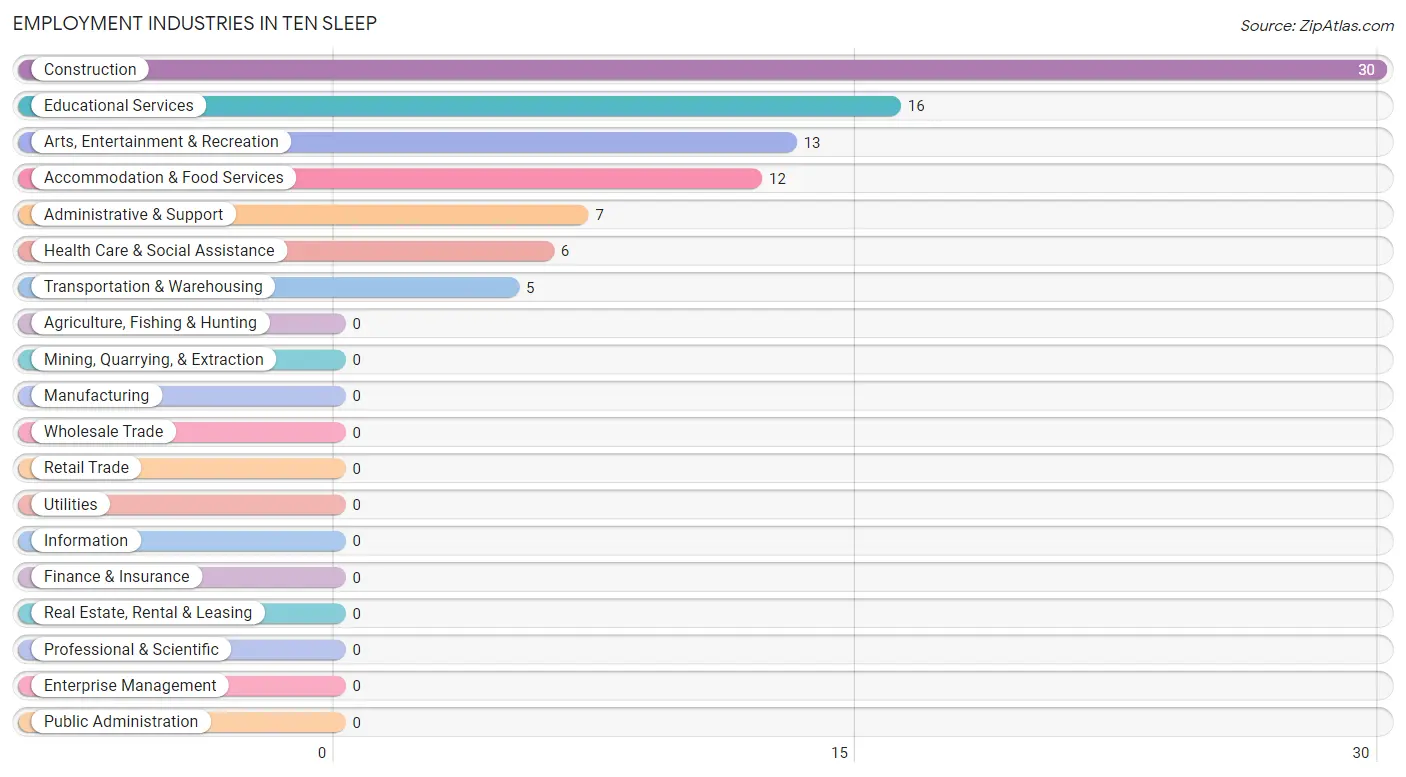
Employment Industries in Ten Sleep
The major employment industries in Ten Sleep include Construction (30 | 33.3%), Educational Services (16 | 17.8%), Arts, Entertainment & Recreation (13 | 14.4%), Accommodation & Food Services (12 | 13.3%), and Administrative & Support (7 | 7.8%).
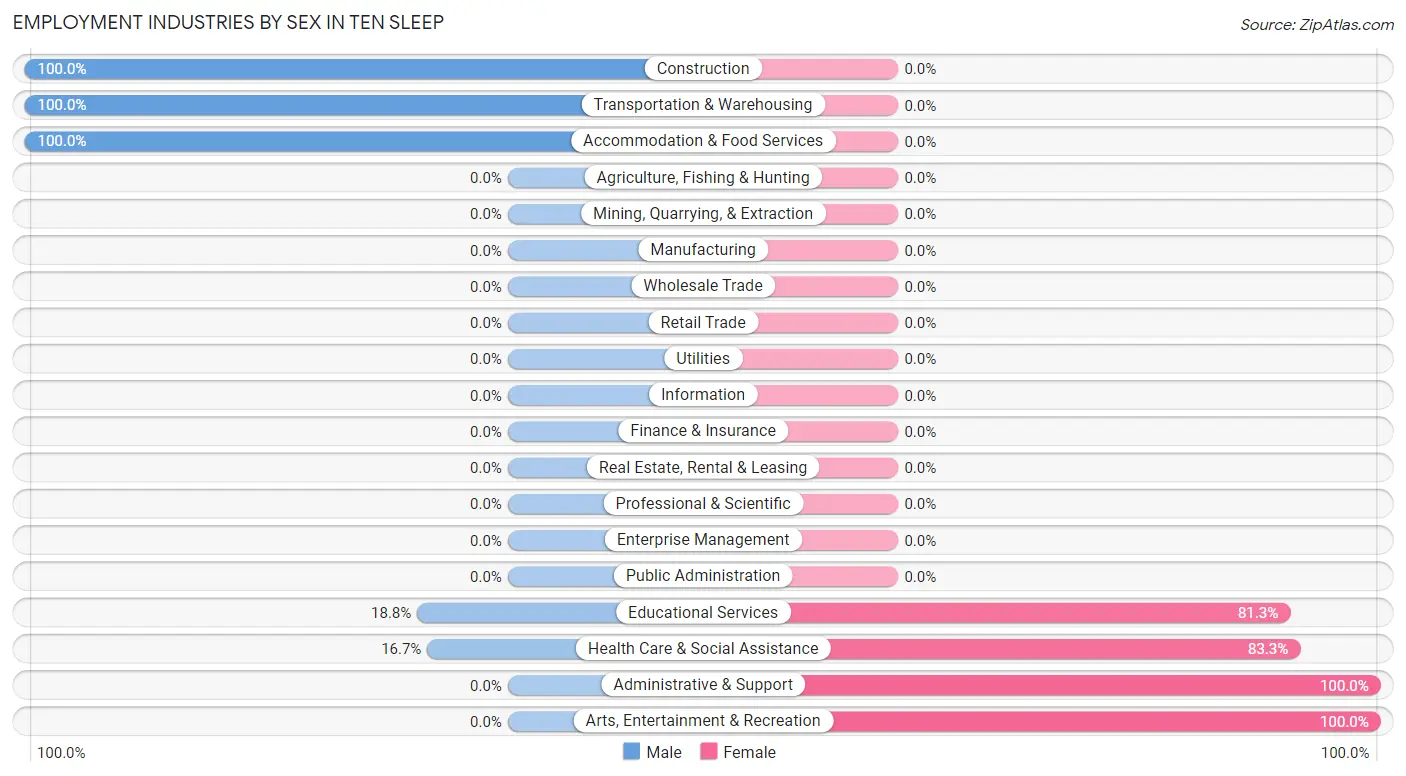
Employment Industries by Sex in Ten Sleep
The Ten Sleep industries that see more men than women are Construction (100.0%), Transportation & Warehousing (100.0%), and Accommodation & Food Services (100.0%), whereas the industries that tend to have a higher number of women are Administrative & Support (100.0%), Arts, Entertainment & Recreation (100.0%), and Health Care & Social Assistance (83.3%).
| Industry | Male | Female |
| Agriculture, Fishing & Hunting | 0 (0.0%) | 0 (0.0%) |
| Mining, Quarrying, & Extraction | 0 (0.0%) | 0 (0.0%) |
| Construction | 30 (100.0%) | 0 (0.0%) |
| Manufacturing | 0 (0.0%) | 0 (0.0%) |
| Wholesale Trade | 0 (0.0%) | 0 (0.0%) |
| Retail Trade | 0 (0.0%) | 0 (0.0%) |
| Transportation & Warehousing | 5 (100.0%) | 0 (0.0%) |
| Utilities | 0 (0.0%) | 0 (0.0%) |
| Information | 0 (0.0%) | 0 (0.0%) |
| Finance & Insurance | 0 (0.0%) | 0 (0.0%) |
| Real Estate, Rental & Leasing | 0 (0.0%) | 0 (0.0%) |
| Professional & Scientific | 0 (0.0%) | 0 (0.0%) |
| Enterprise Management | 0 (0.0%) | 0 (0.0%) |
| Administrative & Support | 0 (0.0%) | 7 (100.0%) |
| Educational Services | 3 (18.8%) | 13 (81.2%) |
| Health Care & Social Assistance | 1 (16.7%) | 5 (83.3%) |
| Arts, Entertainment & Recreation | 0 (0.0%) | 13 (100.0%) |
| Accommodation & Food Services | 12 (100.0%) | 0 (0.0%) |
| Public Administration | 0 (0.0%) | 0 (0.0%) |
| Total | 51 (56.7%) | 39 (43.3%) |
Education in Ten Sleep
School Enrollment in Ten Sleep
The most common levels of schooling among the 32 students in Ten Sleep are elementary school (15 | 46.9%), high school (10 | 31.2%), and middle school (7 | 21.9%).
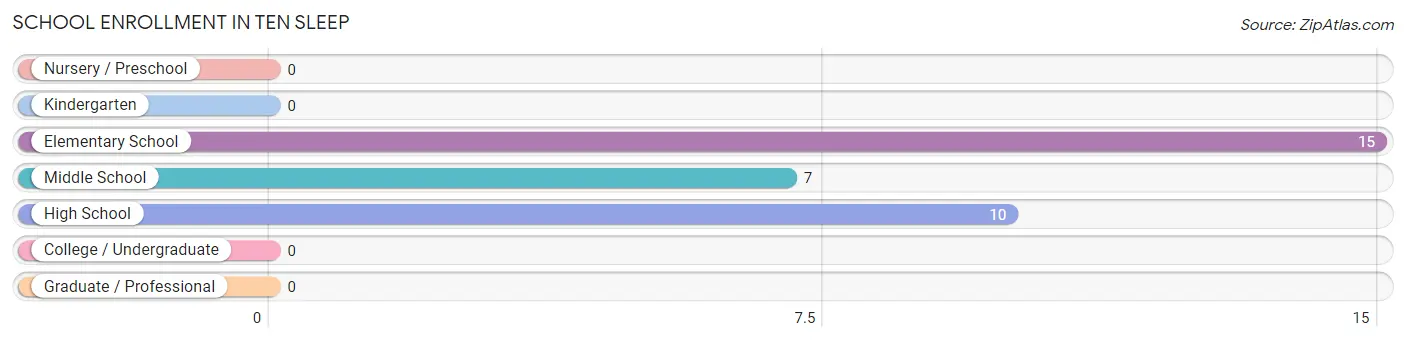
| School Level | # Students | % Students |
| Nursery / Preschool | 0 | 0.0% |
| Kindergarten | 0 | 0.0% |
| Elementary School | 15 | 46.9% |
| Middle School | 7 | 21.9% |
| High School | 10 | 31.2% |
| College / Undergraduate | 0 | 0.0% |
| Graduate / Professional | 0 | 0.0% |
| Total | 32 | 100.0% |
School Enrollment by Age by Funding Source in Ten Sleep
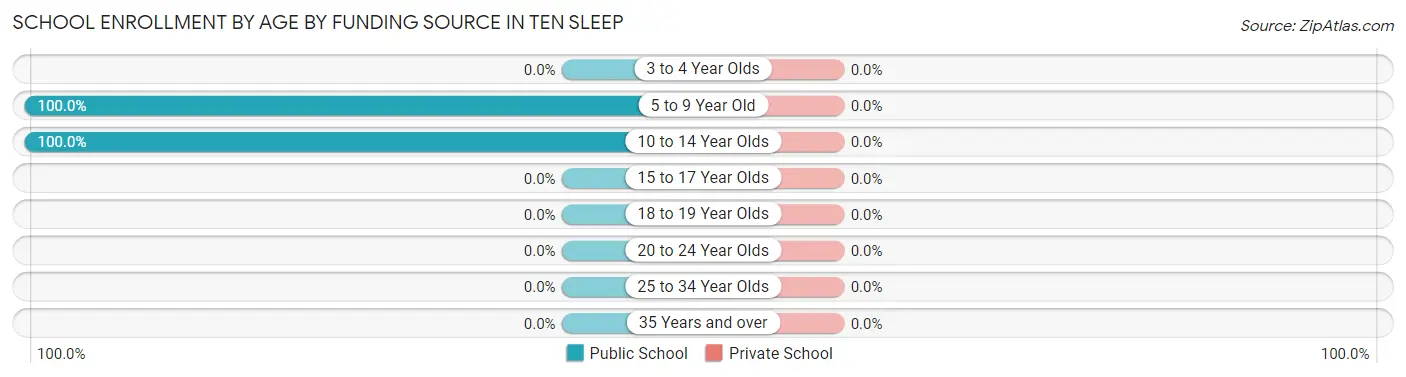
| Age Bracket | Public School | Private School |
| 3 to 4 Year Olds | 0 (0.0%) | 0 (0.0%) |
| 5 to 9 Year Old | 15 (100.0%) | 0 (0.0%) |
| 10 to 14 Year Olds | 17 (100.0%) | 0 (0.0%) |
| 15 to 17 Year Olds | 0 (0.0%) | 0 (0.0%) |
| 18 to 19 Year Olds | 0 (0.0%) | 0 (0.0%) |
| 20 to 24 Year Olds | 0 (0.0%) | 0 (0.0%) |
| 25 to 34 Year Olds | 0 (0.0%) | 0 (0.0%) |
| 35 Years and over | 0 (0.0%) | 0 (0.0%) |
| Total | 32 (100.0%) | 0 (0.0%) |
Educational Attainment by Field of Study in Ten Sleep
Education (13 | 33.3%), computers & mathematics (6 | 15.4%), physical & health sciences (4 | 10.3%), science & technology (4 | 10.3%), and literature & languages (4 | 10.3%) are the most common fields of study among 39 individuals in Ten Sleep who have obtained a bachelor's degree or higher.
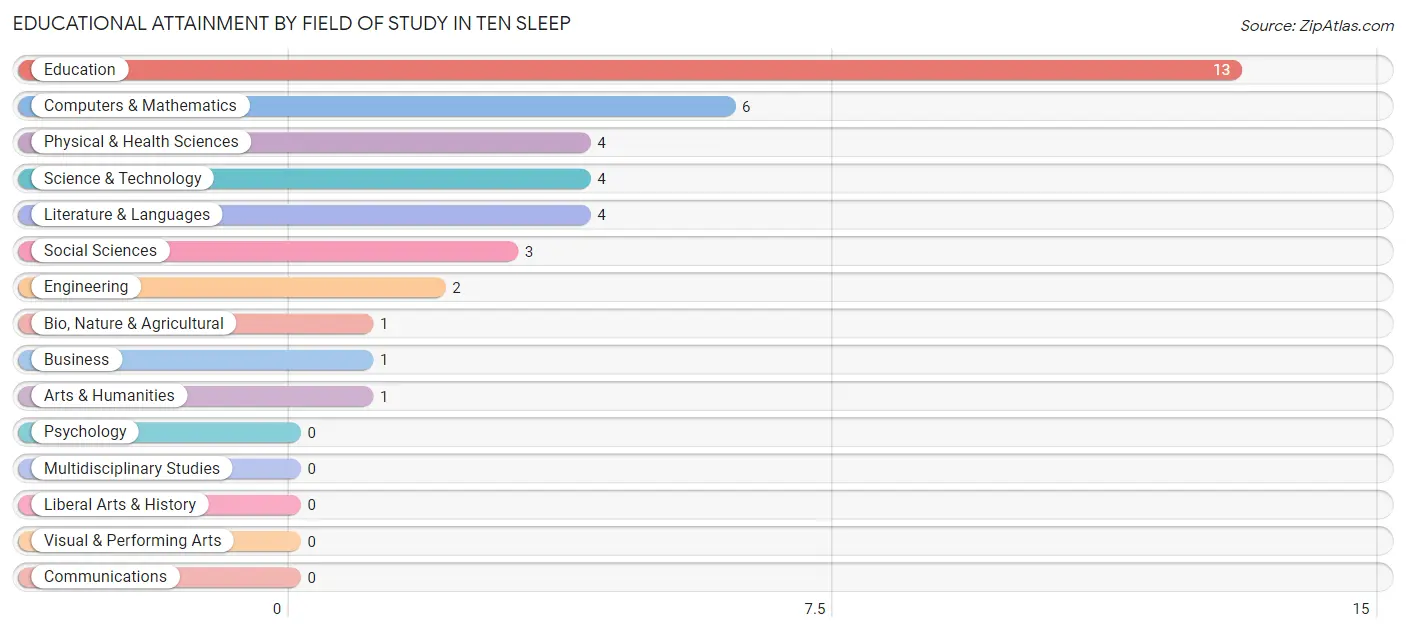
| Field of Study | # Graduates | % Graduates |
| Computers & Mathematics | 6 | 15.4% |
| Bio, Nature & Agricultural | 1 | 2.6% |
| Physical & Health Sciences | 4 | 10.3% |
| Psychology | 0 | 0.0% |
| Social Sciences | 3 | 7.7% |
| Engineering | 2 | 5.1% |
| Multidisciplinary Studies | 0 | 0.0% |
| Science & Technology | 4 | 10.3% |
| Business | 1 | 2.6% |
| Education | 13 | 33.3% |
| Literature & Languages | 4 | 10.3% |
| Liberal Arts & History | 0 | 0.0% |
| Visual & Performing Arts | 0 | 0.0% |
| Communications | 0 | 0.0% |
| Arts & Humanities | 1 | 2.6% |
| Total | 39 | 100.0% |
Transportation & Commute in Ten Sleep
Vehicle Availability by Sex in Ten Sleep
The most prevalent vehicle ownership categories in Ten Sleep are males with 2 vehicles (37, accounting for 72.6%) and females with 2 vehicles (14, making up 94.9%).
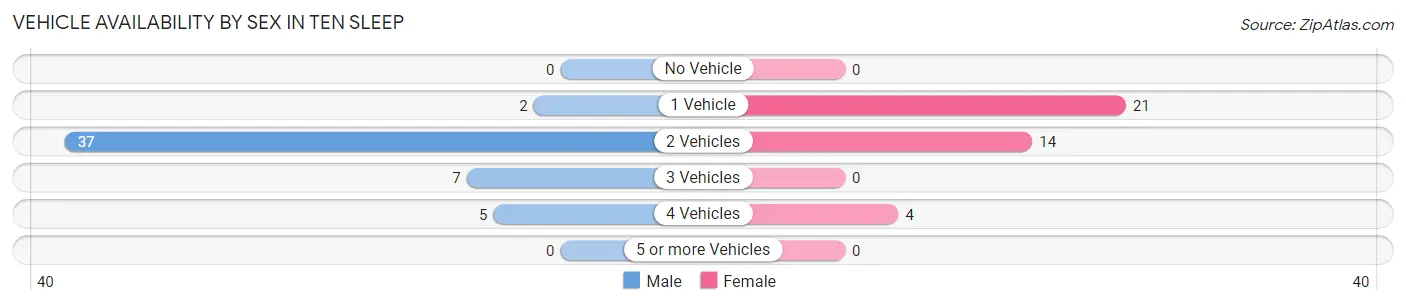
| Vehicles Available | Male | Female |
| No Vehicle | 0 (0.0%) | 0 (0.0%) |
| 1 Vehicle | 2 (3.9%) | 21 (53.8%) |
| 2 Vehicles | 37 (72.6%) | 14 (35.9%) |
| 3 Vehicles | 7 (13.7%) | 0 (0.0%) |
| 4 Vehicles | 5 (9.8%) | 4 (10.3%) |
| 5 or more Vehicles | 0 (0.0%) | 0 (0.0%) |
| Total | 51 (100.0%) | 39 (100.0%) |
Commute Time in Ten Sleep
The most frequently occuring commute durations in Ten Sleep are 10 to 14 minutes (26 commuters, 30.6%), less than 5 minutes (23 commuters, 27.1%), and 15 to 19 minutes (19 commuters, 22.4%).
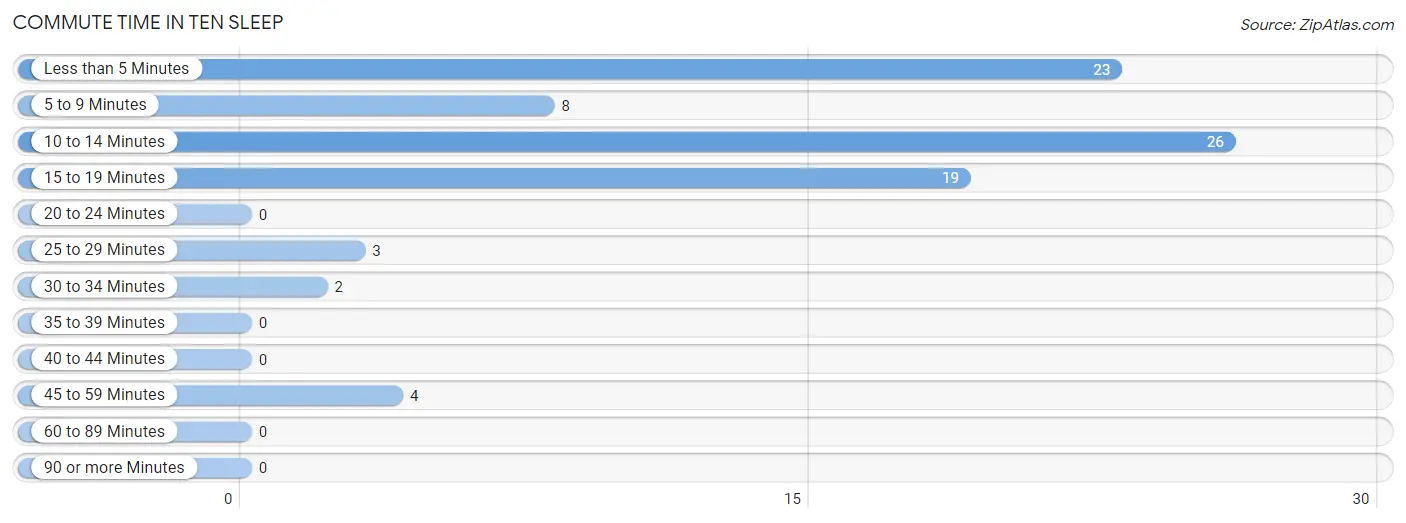
| Commute Time | # Commuters | % Commuters |
| Less than 5 Minutes | 23 | 27.1% |
| 5 to 9 Minutes | 8 | 9.4% |
| 10 to 14 Minutes | 26 | 30.6% |
| 15 to 19 Minutes | 19 | 22.4% |
| 20 to 24 Minutes | 0 | 0.0% |
| 25 to 29 Minutes | 3 | 3.5% |
| 30 to 34 Minutes | 2 | 2.4% |
| 35 to 39 Minutes | 0 | 0.0% |
| 40 to 44 Minutes | 0 | 0.0% |
| 45 to 59 Minutes | 4 | 4.7% |
| 60 to 89 Minutes | 0 | 0.0% |
| 90 or more Minutes | 0 | 0.0% |
Commute Time by Sex in Ten Sleep
The most common commute times in Ten Sleep are 10 to 14 minutes (19 commuters, 41.3%) for males and 15 to 19 minutes (19 commuters, 48.7%) for females.
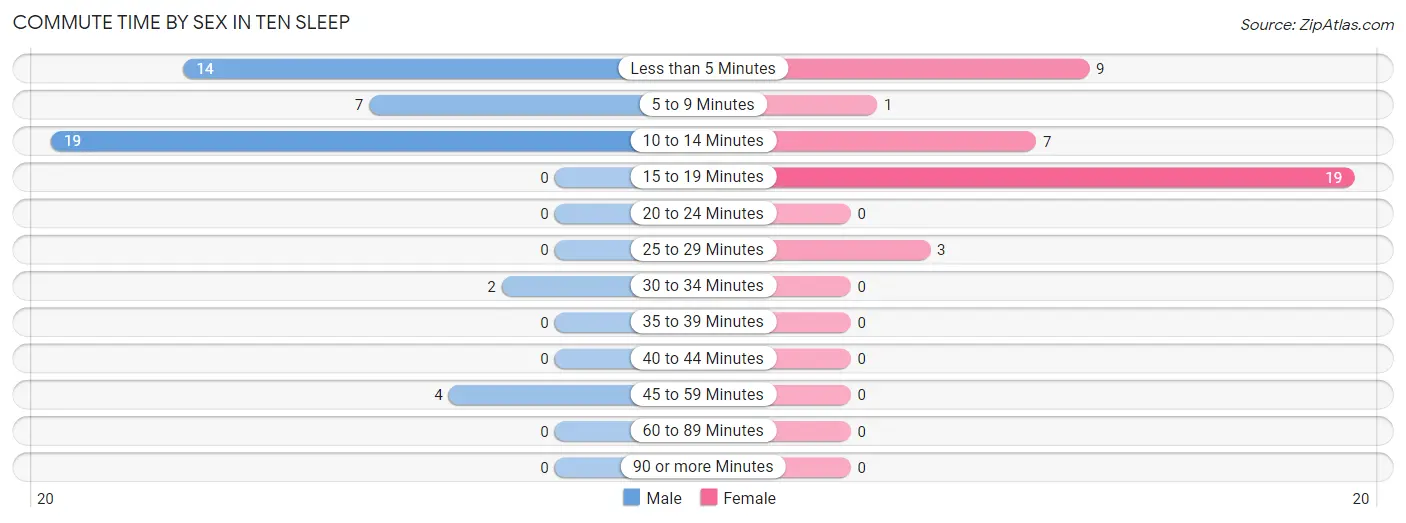
| Commute Time | Male | Female |
| Less than 5 Minutes | 14 (30.4%) | 9 (23.1%) |
| 5 to 9 Minutes | 7 (15.2%) | 1 (2.6%) |
| 10 to 14 Minutes | 19 (41.3%) | 7 (17.9%) |
| 15 to 19 Minutes | 0 (0.0%) | 19 (48.7%) |
| 20 to 24 Minutes | 0 (0.0%) | 0 (0.0%) |
| 25 to 29 Minutes | 0 (0.0%) | 3 (7.7%) |
| 30 to 34 Minutes | 2 (4.3%) | 0 (0.0%) |
| 35 to 39 Minutes | 0 (0.0%) | 0 (0.0%) |
| 40 to 44 Minutes | 0 (0.0%) | 0 (0.0%) |
| 45 to 59 Minutes | 4 (8.7%) | 0 (0.0%) |
| 60 to 89 Minutes | 0 (0.0%) | 0 (0.0%) |
| 90 or more Minutes | 0 (0.0%) | 0 (0.0%) |
Time of Departure to Work by Sex in Ten Sleep
The most frequent times of departure to work in Ten Sleep are 7:00 AM to 7:29 AM (16, 34.8%) for males and 7:30 AM to 7:59 AM (15, 38.5%) for females.
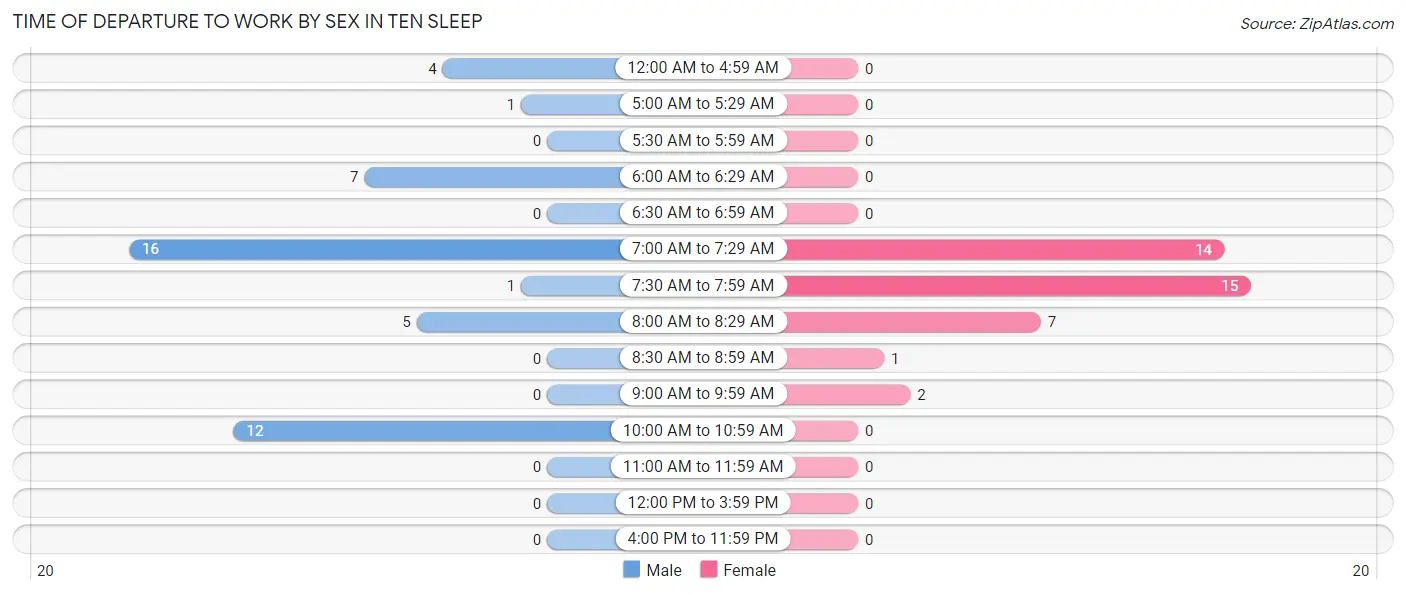
| Time of Departure | Male | Female |
| 12:00 AM to 4:59 AM | 4 (8.7%) | 0 (0.0%) |
| 5:00 AM to 5:29 AM | 1 (2.2%) | 0 (0.0%) |
| 5:30 AM to 5:59 AM | 0 (0.0%) | 0 (0.0%) |
| 6:00 AM to 6:29 AM | 7 (15.2%) | 0 (0.0%) |
| 6:30 AM to 6:59 AM | 0 (0.0%) | 0 (0.0%) |
| 7:00 AM to 7:29 AM | 16 (34.8%) | 14 (35.9%) |
| 7:30 AM to 7:59 AM | 1 (2.2%) | 15 (38.5%) |
| 8:00 AM to 8:29 AM | 5 (10.9%) | 7 (17.9%) |
| 8:30 AM to 8:59 AM | 0 (0.0%) | 1 (2.6%) |
| 9:00 AM to 9:59 AM | 0 (0.0%) | 2 (5.1%) |
| 10:00 AM to 10:59 AM | 12 (26.1%) | 0 (0.0%) |
| 11:00 AM to 11:59 AM | 0 (0.0%) | 0 (0.0%) |
| 12:00 PM to 3:59 PM | 0 (0.0%) | 0 (0.0%) |
| 4:00 PM to 11:59 PM | 0 (0.0%) | 0 (0.0%) |
| Total | 46 (100.0%) | 39 (100.0%) |
Housing Occupancy in Ten Sleep
Occupancy by Ownership in Ten Sleep
Of the total 124 dwellings in Ten Sleep, owner-occupied units account for 65 (52.4%), while renter-occupied units make up 59 (47.6%).
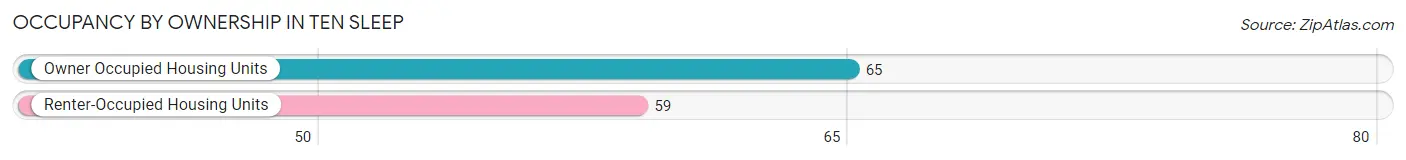
| Occupancy | # Housing Units | % Housing Units |
| Owner Occupied Housing Units | 65 | 52.4% |
| Renter-Occupied Housing Units | 59 | 47.6% |
| Total Occupied Housing Units | 124 | 100.0% |
Occupancy by Household Size in Ten Sleep
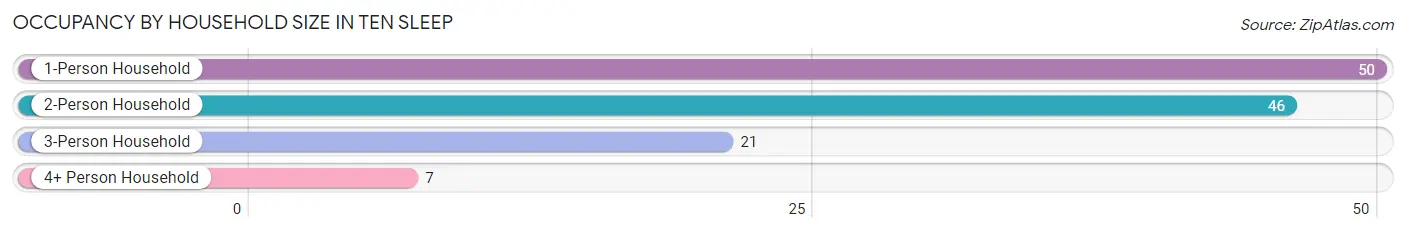
| Household Size | # Housing Units | % Housing Units |
| 1-Person Household | 50 | 40.3% |
| 2-Person Household | 46 | 37.1% |
| 3-Person Household | 21 | 16.9% |
| 4+ Person Household | 7 | 5.7% |
| Total Housing Units | 124 | 100.0% |
Occupancy by Ownership by Household Size in Ten Sleep
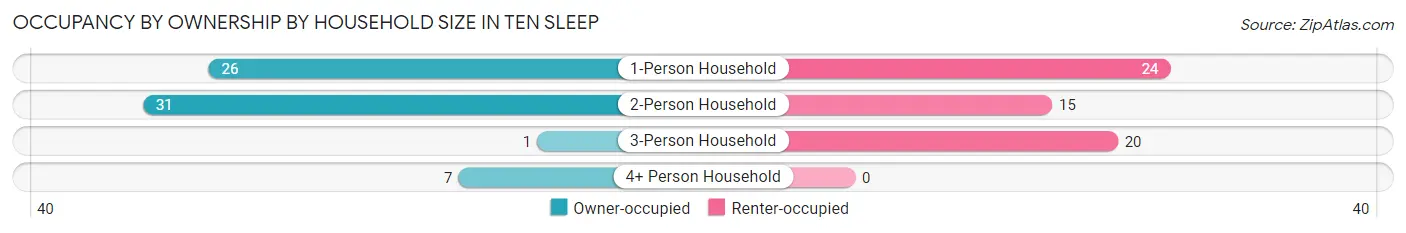
| Household Size | Owner-occupied | Renter-occupied |
| 1-Person Household | 26 (52.0%) | 24 (48.0%) |
| 2-Person Household | 31 (67.4%) | 15 (32.6%) |
| 3-Person Household | 1 (4.8%) | 20 (95.2%) |
| 4+ Person Household | 7 (100.0%) | 0 (0.0%) |
| Total Housing Units | 65 (52.4%) | 59 (47.6%) |
Occupancy by Educational Attainment in Ten Sleep
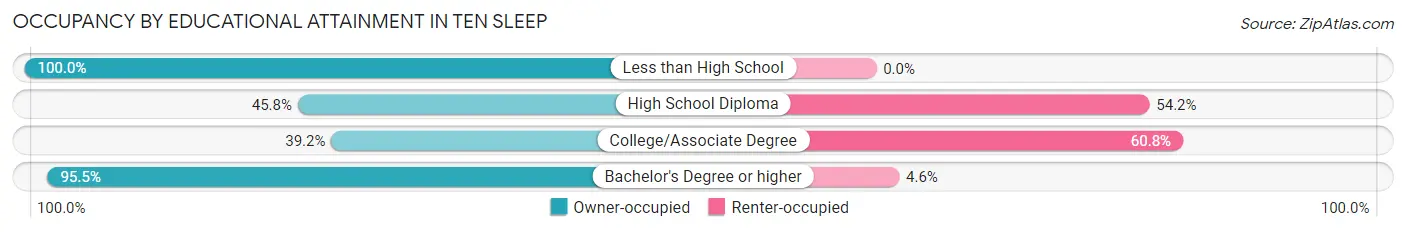
| Household Size | Owner-occupied | Renter-occupied |
| Less than High School | 4 (100.0%) | 0 (0.0%) |
| High School Diploma | 11 (45.8%) | 13 (54.2%) |
| College/Associate Degree | 29 (39.2%) | 45 (60.8%) |
| Bachelor's Degree or higher | 21 (95.5%) | 1 (4.5%) |
Occupancy by Age of Householder in Ten Sleep
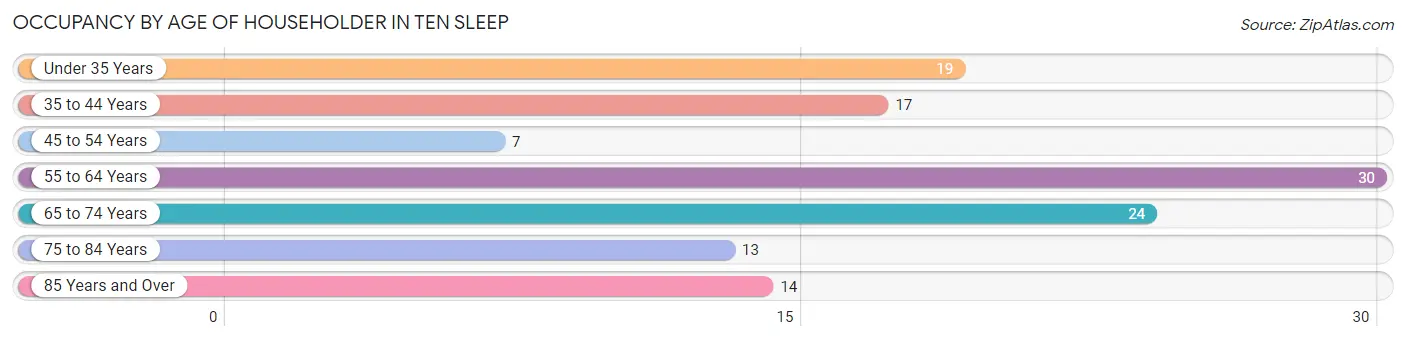
| Age Bracket | # Households | % Households |
| Under 35 Years | 19 | 15.3% |
| 35 to 44 Years | 17 | 13.7% |
| 45 to 54 Years | 7 | 5.7% |
| 55 to 64 Years | 30 | 24.2% |
| 65 to 74 Years | 24 | 19.4% |
| 75 to 84 Years | 13 | 10.5% |
| 85 Years and Over | 14 | 11.3% |
| Total | 124 | 100.0% |
Housing Finances in Ten Sleep
Median Income by Occupancy in Ten Sleep
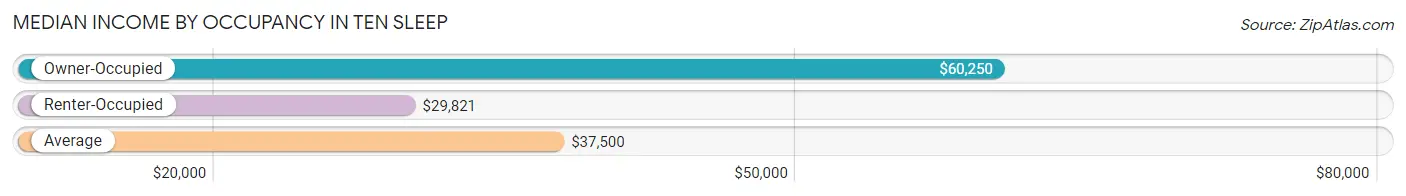
| Occupancy Type | # Households | Median Income |
| Owner-Occupied | 65 (52.4%) | $60,250 |
| Renter-Occupied | 59 (47.6%) | $29,821 |
| Average | 124 (100.0%) | $37,500 |
Occupancy by Householder Income Bracket in Ten Sleep
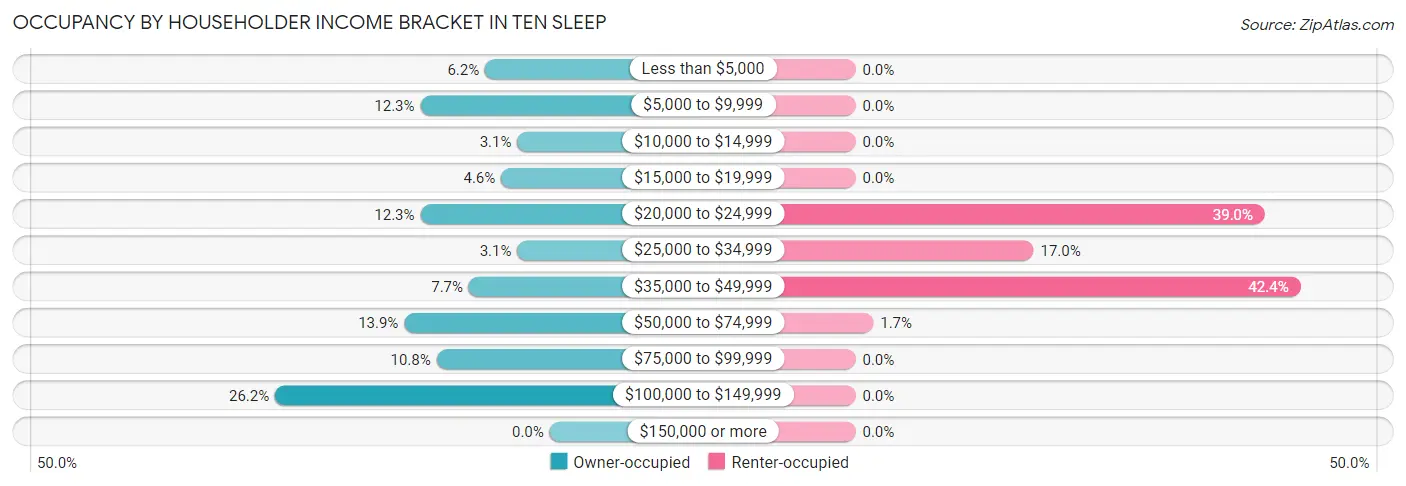
| Income Bracket | Owner-occupied | Renter-occupied |
| Less than $5,000 | 4 (6.1%) | 0 (0.0%) |
| $5,000 to $9,999 | 8 (12.3%) | 0 (0.0%) |
| $10,000 to $14,999 | 2 (3.1%) | 0 (0.0%) |
| $15,000 to $19,999 | 3 (4.6%) | 0 (0.0%) |
| $20,000 to $24,999 | 8 (12.3%) | 23 (39.0%) |
| $25,000 to $34,999 | 2 (3.1%) | 10 (17.0%) |
| $35,000 to $49,999 | 5 (7.7%) | 25 (42.4%) |
| $50,000 to $74,999 | 9 (13.9%) | 1 (1.7%) |
| $75,000 to $99,999 | 7 (10.8%) | 0 (0.0%) |
| $100,000 to $149,999 | 17 (26.2%) | 0 (0.0%) |
| $150,000 or more | 0 (0.0%) | 0 (0.0%) |
| Total | 65 (100.0%) | 59 (100.0%) |
Monthly Housing Cost Tiers in Ten Sleep
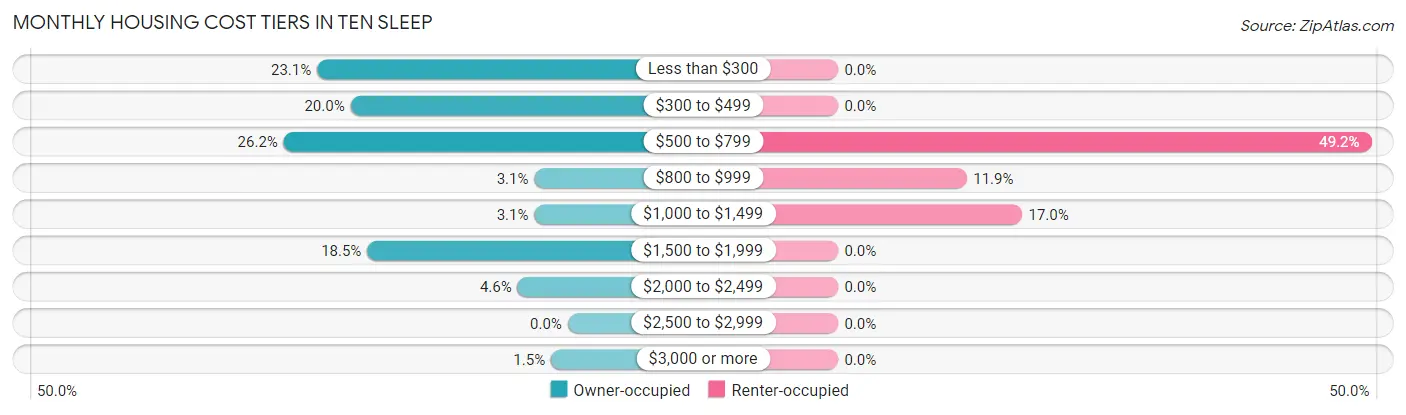
| Monthly Cost | Owner-occupied | Renter-occupied |
| Less than $300 | 15 (23.1%) | 0 (0.0%) |
| $300 to $499 | 13 (20.0%) | 0 (0.0%) |
| $500 to $799 | 17 (26.2%) | 29 (49.1%) |
| $800 to $999 | 2 (3.1%) | 7 (11.9%) |
| $1,000 to $1,499 | 2 (3.1%) | 10 (17.0%) |
| $1,500 to $1,999 | 12 (18.5%) | 0 (0.0%) |
| $2,000 to $2,499 | 3 (4.6%) | 0 (0.0%) |
| $2,500 to $2,999 | 0 (0.0%) | 0 (0.0%) |
| $3,000 or more | 1 (1.5%) | 0 (0.0%) |
| Total | 65 (100.0%) | 59 (100.0%) |
Physical Housing Characteristics in Ten Sleep
Housing Structures in Ten Sleep
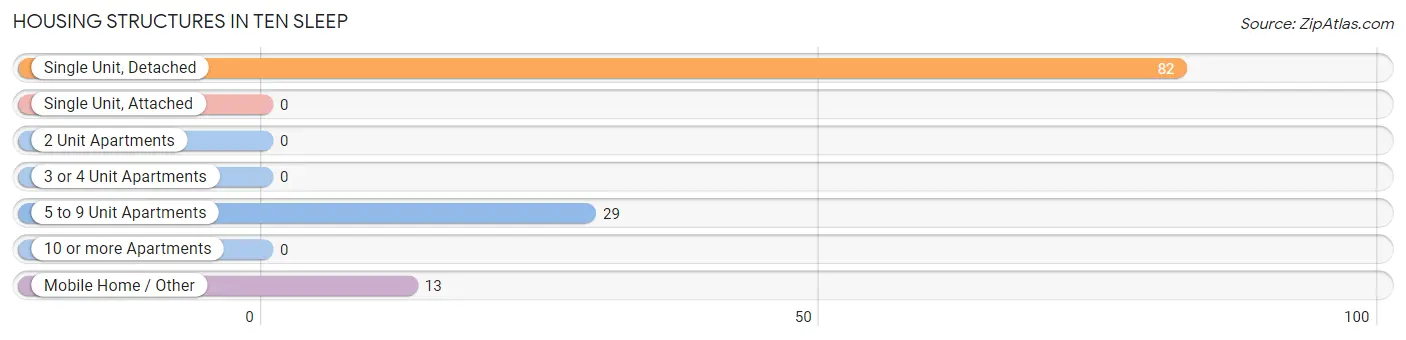
| Structure Type | # Housing Units | % Housing Units |
| Single Unit, Detached | 82 | 66.1% |
| Single Unit, Attached | 0 | 0.0% |
| 2 Unit Apartments | 0 | 0.0% |
| 3 or 4 Unit Apartments | 0 | 0.0% |
| 5 to 9 Unit Apartments | 29 | 23.4% |
| 10 or more Apartments | 0 | 0.0% |
| Mobile Home / Other | 13 | 10.5% |
| Total | 124 | 100.0% |
Housing Structures by Occupancy in Ten Sleep
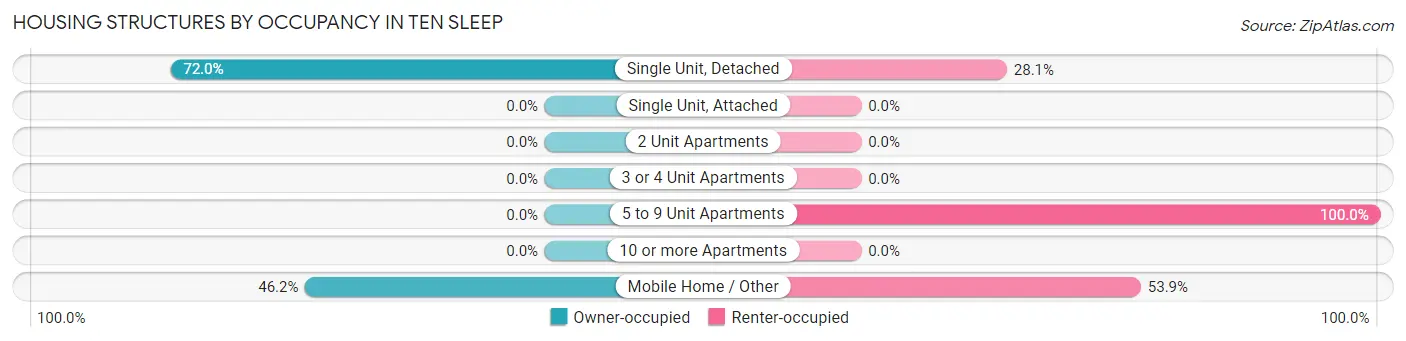
| Structure Type | Owner-occupied | Renter-occupied |
| Single Unit, Detached | 59 (72.0%) | 23 (28.1%) |
| Single Unit, Attached | 0 (0.0%) | 0 (0.0%) |
| 2 Unit Apartments | 0 (0.0%) | 0 (0.0%) |
| 3 or 4 Unit Apartments | 0 (0.0%) | 0 (0.0%) |
| 5 to 9 Unit Apartments | 0 (0.0%) | 29 (100.0%) |
| 10 or more Apartments | 0 (0.0%) | 0 (0.0%) |
| Mobile Home / Other | 6 (46.2%) | 7 (53.8%) |
| Total | 65 (52.4%) | 59 (47.6%) |
Housing Structures by Number of Rooms in Ten Sleep
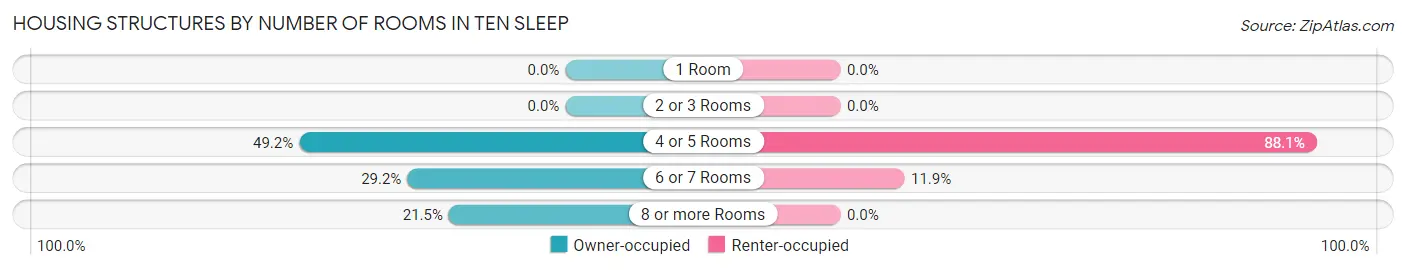
| Number of Rooms | Owner-occupied | Renter-occupied |
| 1 Room | 0 (0.0%) | 0 (0.0%) |
| 2 or 3 Rooms | 0 (0.0%) | 0 (0.0%) |
| 4 or 5 Rooms | 32 (49.2%) | 52 (88.1%) |
| 6 or 7 Rooms | 19 (29.2%) | 7 (11.9%) |
| 8 or more Rooms | 14 (21.5%) | 0 (0.0%) |
| Total | 65 (100.0%) | 59 (100.0%) |
Housing Structure by Heating Type in Ten Sleep
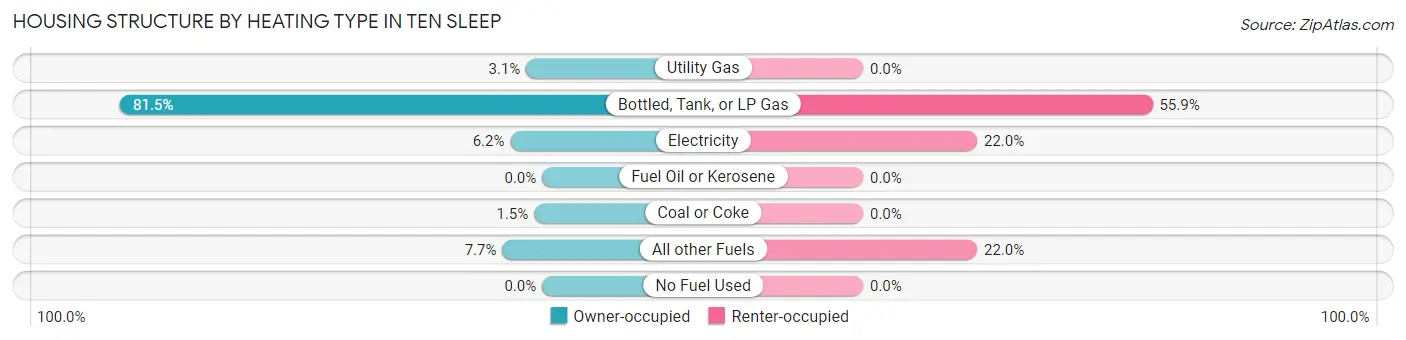
| Heating Type | Owner-occupied | Renter-occupied |
| Utility Gas | 2 (3.1%) | 0 (0.0%) |
| Bottled, Tank, or LP Gas | 53 (81.5%) | 33 (55.9%) |
| Electricity | 4 (6.1%) | 13 (22.0%) |
| Fuel Oil or Kerosene | 0 (0.0%) | 0 (0.0%) |
| Coal or Coke | 1 (1.5%) | 0 (0.0%) |
| All other Fuels | 5 (7.7%) | 13 (22.0%) |
| No Fuel Used | 0 (0.0%) | 0 (0.0%) |
| Total | 65 (100.0%) | 59 (100.0%) |
Household Vehicle Usage in Ten Sleep
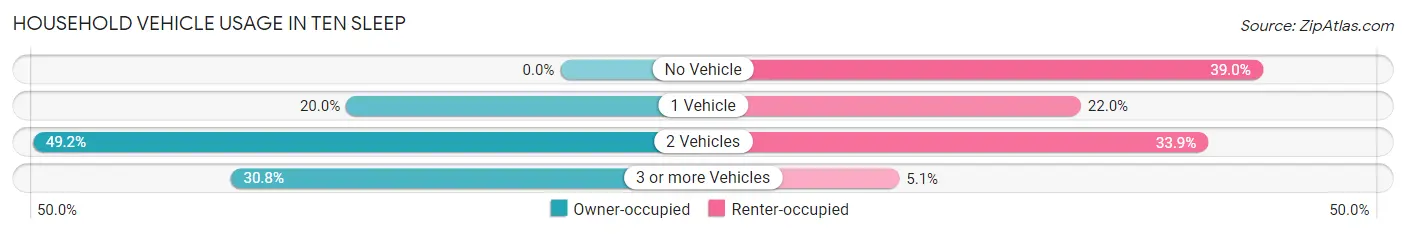
| Vehicles per Household | Owner-occupied | Renter-occupied |
| No Vehicle | 0 (0.0%) | 23 (39.0%) |
| 1 Vehicle | 13 (20.0%) | 13 (22.0%) |
| 2 Vehicles | 32 (49.2%) | 20 (33.9%) |
| 3 or more Vehicles | 20 (30.8%) | 3 (5.1%) |
| Total | 65 (100.0%) | 59 (100.0%) |
Real Estate & Mortgages in Ten Sleep
Real Estate and Mortgage Overview in Ten Sleep
| Characteristic | Without Mortgage | With Mortgage |
| Housing Units | 48 | 17 |
| Median Property Value | $200,000 | $358,300 |
| Median Household Income | $28,750 | $0 |
| Monthly Housing Costs | $464 | $0 |
| Real Estate Taxes | $1,515 | $0 |
Property Value by Mortgage Status in Ten Sleep
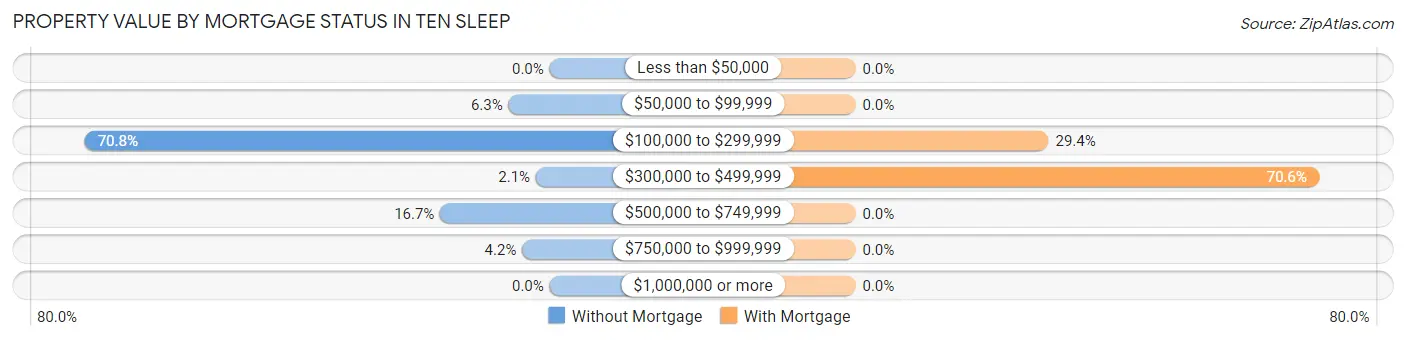
| Property Value | Without Mortgage | With Mortgage |
| Less than $50,000 | 0 (0.0%) | 0 (0.0%) |
| $50,000 to $99,999 | 3 (6.2%) | 0 (0.0%) |
| $100,000 to $299,999 | 34 (70.8%) | 5 (29.4%) |
| $300,000 to $499,999 | 1 (2.1%) | 12 (70.6%) |
| $500,000 to $749,999 | 8 (16.7%) | 0 (0.0%) |
| $750,000 to $999,999 | 2 (4.2%) | 0 (0.0%) |
| $1,000,000 or more | 0 (0.0%) | 0 (0.0%) |
| Total | 48 (100.0%) | 17 (100.0%) |
Household Income by Mortgage Status in Ten Sleep
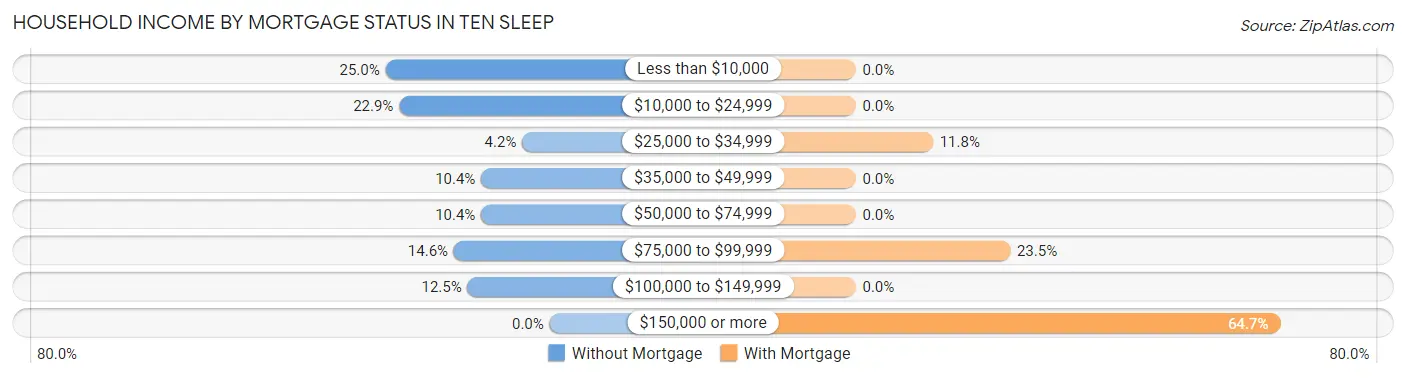
| Household Income | Without Mortgage | With Mortgage |
| Less than $10,000 | 12 (25.0%) | 0 (0.0%) |
| $10,000 to $24,999 | 11 (22.9%) | 0 (0.0%) |
| $25,000 to $34,999 | 2 (4.2%) | 2 (11.8%) |
| $35,000 to $49,999 | 5 (10.4%) | 0 (0.0%) |
| $50,000 to $74,999 | 5 (10.4%) | 0 (0.0%) |
| $75,000 to $99,999 | 7 (14.6%) | 4 (23.5%) |
| $100,000 to $149,999 | 6 (12.5%) | 0 (0.0%) |
| $150,000 or more | 0 (0.0%) | 11 (64.7%) |
| Total | 48 (100.0%) | 17 (100.0%) |
Property Value to Household Income Ratio in Ten Sleep
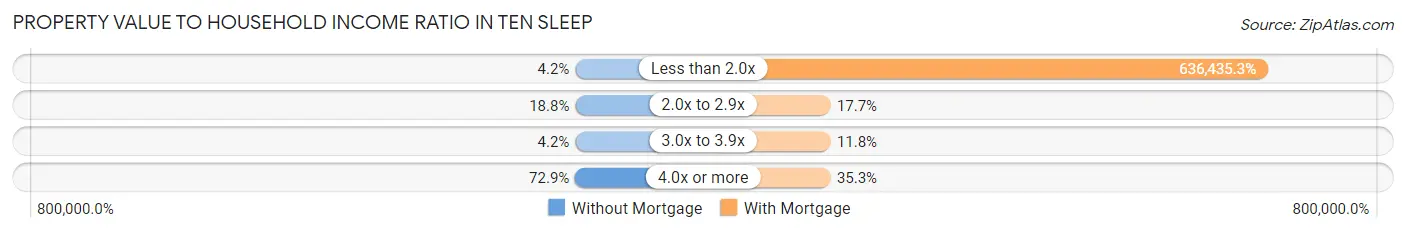
| Value-to-Income Ratio | Without Mortgage | With Mortgage |
| Less than 2.0x | 2 (4.2%) | 108,194 (636,435.3%) |
| 2.0x to 2.9x | 9 (18.8%) | 3 (17.6%) |
| 3.0x to 3.9x | 2 (4.2%) | 2 (11.8%) |
| 4.0x or more | 35 (72.9%) | 6 (35.3%) |
| Total | 48 (100.0%) | 17 (100.0%) |
Real Estate Taxes by Mortgage Status in Ten Sleep
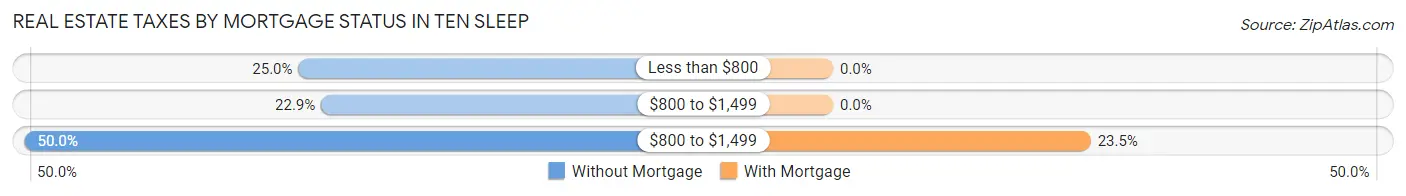
| Property Taxes | Without Mortgage | With Mortgage |
| Less than $800 | 12 (25.0%) | 0 (0.0%) |
| $800 to $1,499 | 11 (22.9%) | 0 (0.0%) |
| $800 to $1,499 | 24 (50.0%) | 4 (23.5%) |
| Total | 48 (100.0%) | 17 (100.0%) |
Health & Disability in Ten Sleep
Health Insurance Coverage by Age in Ten Sleep
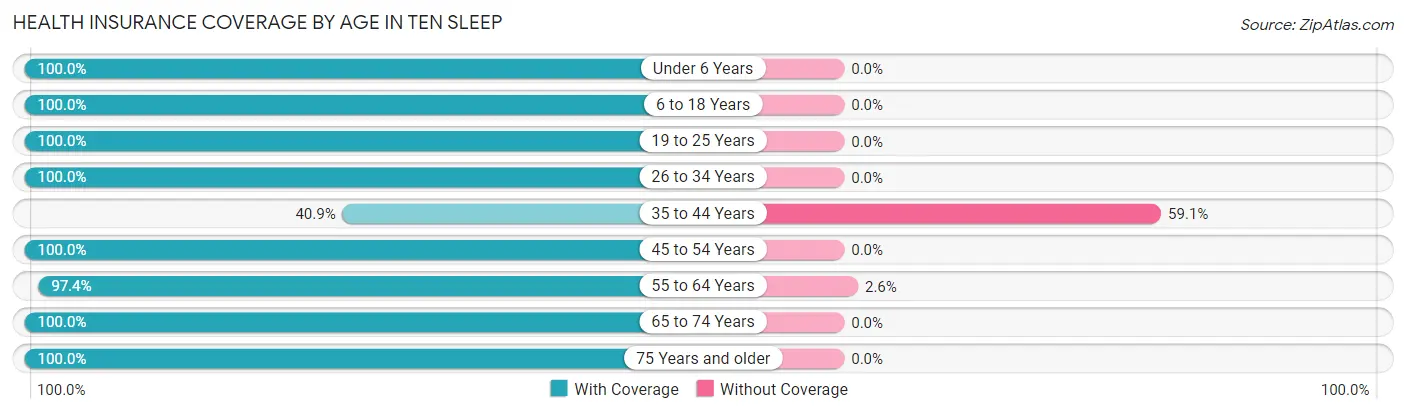
| Age Bracket | With Coverage | Without Coverage |
| Under 6 Years | 11 (100.0%) | 0 (0.0%) |
| 6 to 18 Years | 32 (100.0%) | 0 (0.0%) |
| 19 to 25 Years | 45 (100.0%) | 0 (0.0%) |
| 26 to 34 Years | 2 (100.0%) | 0 (0.0%) |
| 35 to 44 Years | 9 (40.9%) | 13 (59.1%) |
| 45 to 54 Years | 9 (100.0%) | 0 (0.0%) |
| 55 to 64 Years | 38 (97.4%) | 1 (2.6%) |
| 65 to 74 Years | 39 (100.0%) | 0 (0.0%) |
| 75 Years and older | 37 (100.0%) | 0 (0.0%) |
| Total | 222 (94.1%) | 14 (5.9%) |
Health Insurance Coverage by Citizenship Status in Ten Sleep
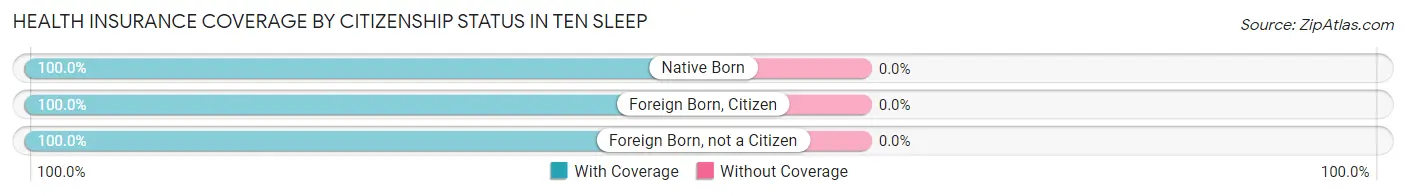
| Citizenship Status | With Coverage | Without Coverage |
| Native Born | 11 (100.0%) | 0 (0.0%) |
| Foreign Born, Citizen | 32 (100.0%) | 0 (0.0%) |
| Foreign Born, not a Citizen | 45 (100.0%) | 0 (0.0%) |
Health Insurance Coverage by Household Income in Ten Sleep
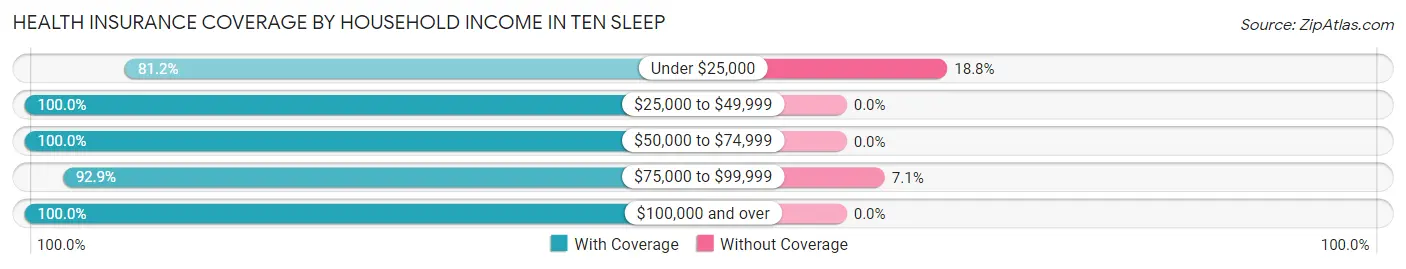
| Household Income | With Coverage | Without Coverage |
| Under $25,000 | 56 (81.2%) | 13 (18.8%) |
| $25,000 to $49,999 | 84 (100.0%) | 0 (0.0%) |
| $50,000 to $74,999 | 28 (100.0%) | 0 (0.0%) |
| $75,000 to $99,999 | 13 (92.9%) | 1 (7.1%) |
| $100,000 and over | 41 (100.0%) | 0 (0.0%) |
Public vs Private Health Insurance Coverage by Age in Ten Sleep
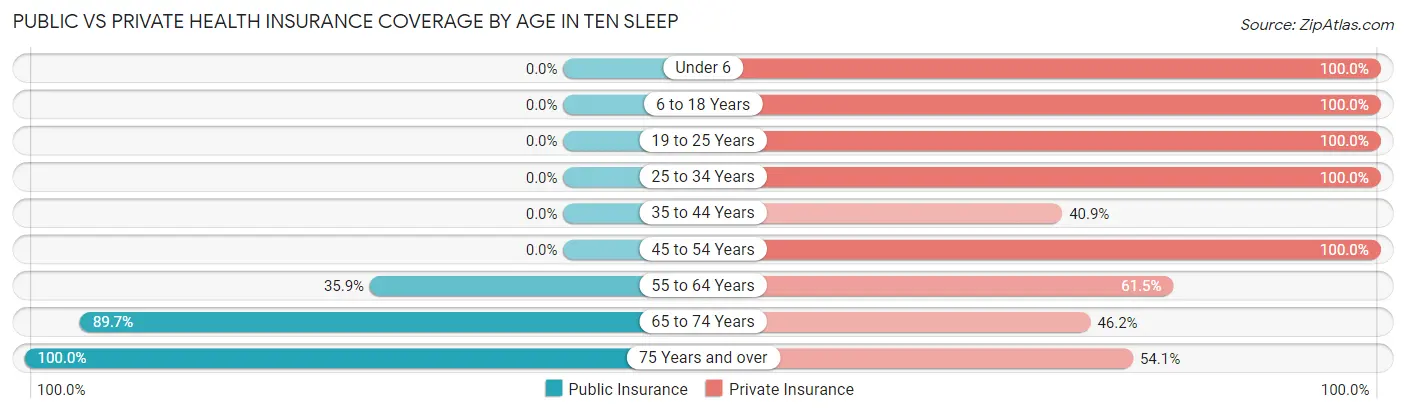
| Age Bracket | Public Insurance | Private Insurance |
| Under 6 | 0 (0.0%) | 11 (100.0%) |
| 6 to 18 Years | 0 (0.0%) | 32 (100.0%) |
| 19 to 25 Years | 0 (0.0%) | 45 (100.0%) |
| 25 to 34 Years | 0 (0.0%) | 2 (100.0%) |
| 35 to 44 Years | 0 (0.0%) | 9 (40.9%) |
| 45 to 54 Years | 0 (0.0%) | 9 (100.0%) |
| 55 to 64 Years | 14 (35.9%) | 24 (61.5%) |
| 65 to 74 Years | 35 (89.7%) | 18 (46.2%) |
| 75 Years and over | 37 (100.0%) | 20 (54.0%) |
| Total | 86 (36.4%) | 170 (72.0%) |
Disability Status by Sex by Age in Ten Sleep
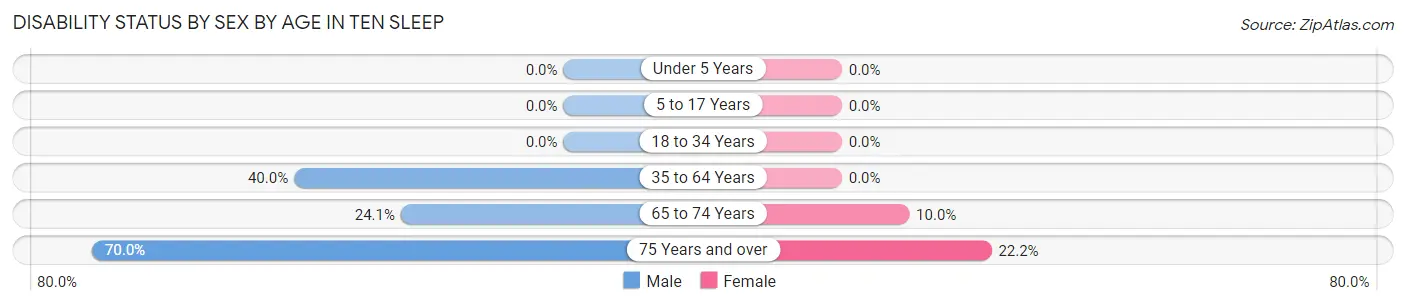
| Age Bracket | Male | Female |
| Under 5 Years | 0 (0.0%) | 0 (0.0%) |
| 5 to 17 Years | 0 (0.0%) | 0 (0.0%) |
| 18 to 34 Years | 0 (0.0%) | 0 (0.0%) |
| 35 to 64 Years | 10 (40.0%) | 0 (0.0%) |
| 65 to 74 Years | 7 (24.1%) | 1 (10.0%) |
| 75 Years and over | 7 (70.0%) | 6 (22.2%) |
Disability Class by Sex by Age in Ten Sleep
Disability Class: Hearing Difficulty
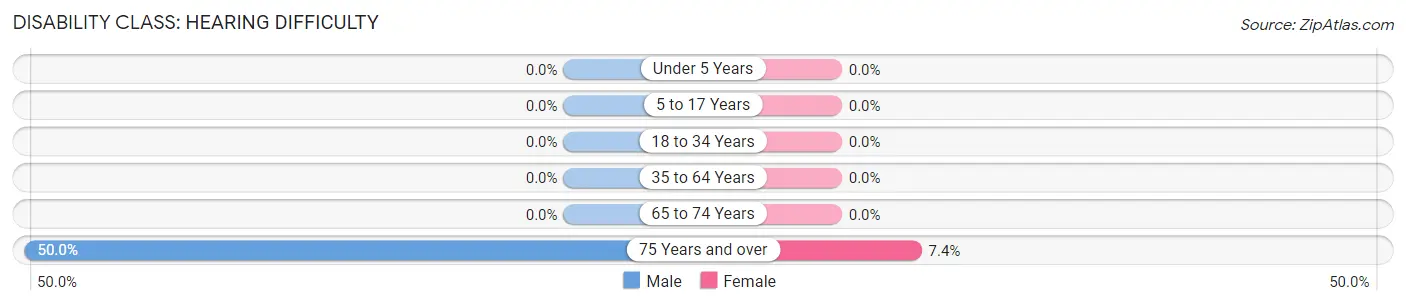
| Age Bracket | Male | Female |
| Under 5 Years | 0 (0.0%) | 0 (0.0%) |
| 5 to 17 Years | 0 (0.0%) | 0 (0.0%) |
| 18 to 34 Years | 0 (0.0%) | 0 (0.0%) |
| 35 to 64 Years | 0 (0.0%) | 0 (0.0%) |
| 65 to 74 Years | 0 (0.0%) | 0 (0.0%) |
| 75 Years and over | 5 (50.0%) | 2 (7.4%) |
Disability Class: Vision Difficulty
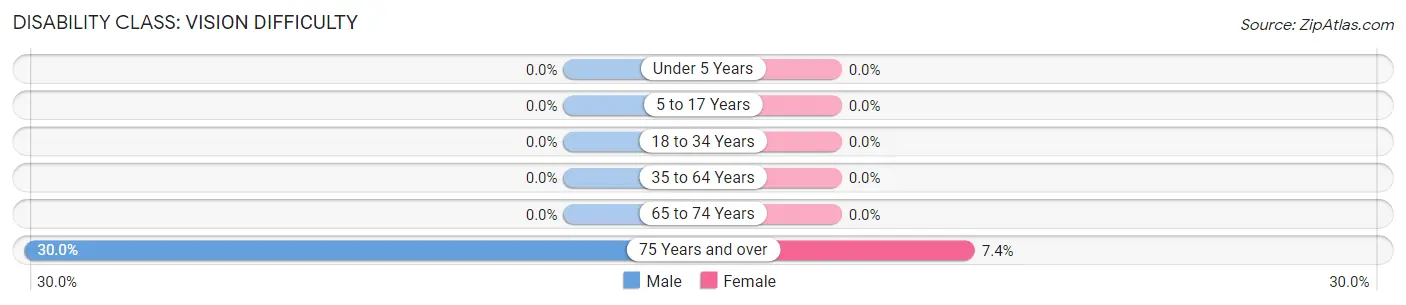
| Age Bracket | Male | Female |
| Under 5 Years | 0 (0.0%) | 0 (0.0%) |
| 5 to 17 Years | 0 (0.0%) | 0 (0.0%) |
| 18 to 34 Years | 0 (0.0%) | 0 (0.0%) |
| 35 to 64 Years | 0 (0.0%) | 0 (0.0%) |
| 65 to 74 Years | 0 (0.0%) | 0 (0.0%) |
| 75 Years and over | 3 (30.0%) | 2 (7.4%) |
Disability Class: Cognitive Difficulty
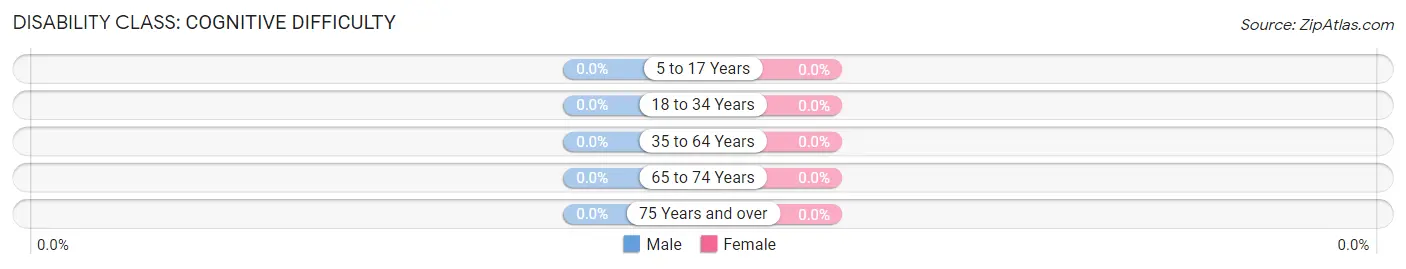
| Age Bracket | Male | Female |
| 5 to 17 Years | 0 (0.0%) | 0 (0.0%) |
| 18 to 34 Years | 0 (0.0%) | 0 (0.0%) |
| 35 to 64 Years | 0 (0.0%) | 0 (0.0%) |
| 65 to 74 Years | 0 (0.0%) | 0 (0.0%) |
| 75 Years and over | 0 (0.0%) | 0 (0.0%) |
Disability Class: Ambulatory Difficulty
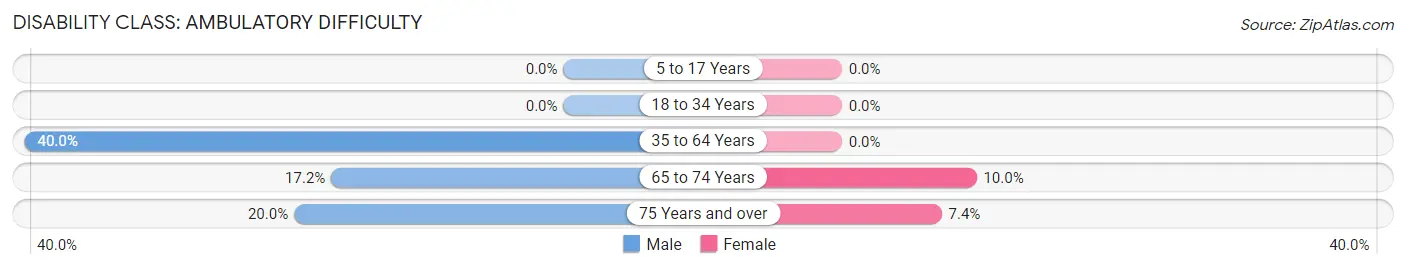
| Age Bracket | Male | Female |
| 5 to 17 Years | 0 (0.0%) | 0 (0.0%) |
| 18 to 34 Years | 0 (0.0%) | 0 (0.0%) |
| 35 to 64 Years | 10 (40.0%) | 0 (0.0%) |
| 65 to 74 Years | 5 (17.2%) | 1 (10.0%) |
| 75 Years and over | 2 (20.0%) | 2 (7.4%) |
Disability Class: Self-Care Difficulty
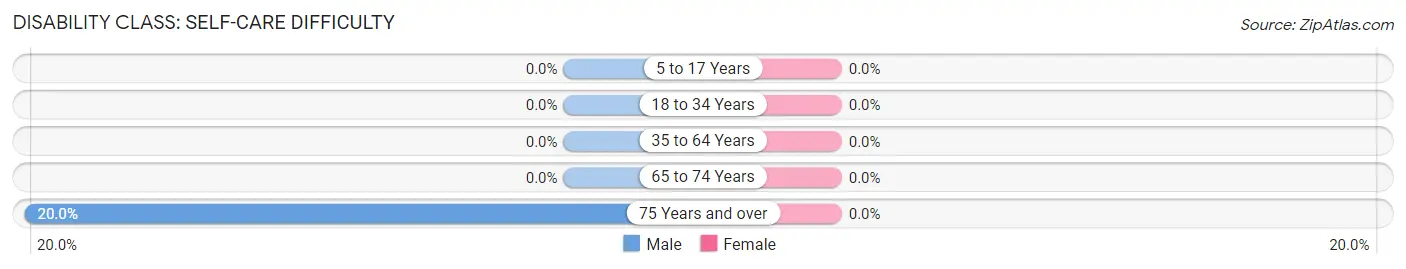
| Age Bracket | Male | Female |
| 5 to 17 Years | 0 (0.0%) | 0 (0.0%) |
| 18 to 34 Years | 0 (0.0%) | 0 (0.0%) |
| 35 to 64 Years | 0 (0.0%) | 0 (0.0%) |
| 65 to 74 Years | 0 (0.0%) | 0 (0.0%) |
| 75 Years and over | 2 (20.0%) | 0 (0.0%) |
Technology Access in Ten Sleep
Computing Device Access in Ten Sleep
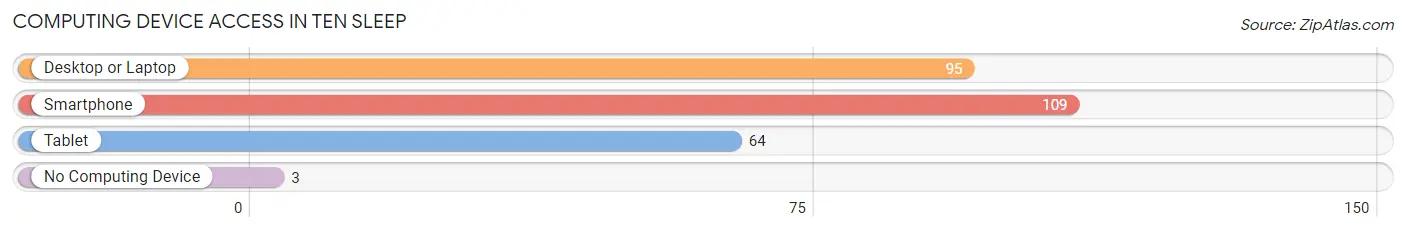
| Device Type | # Households | % Households |
| Desktop or Laptop | 95 | 76.6% |
| Smartphone | 109 | 87.9% |
| Tablet | 64 | 51.6% |
| No Computing Device | 3 | 2.4% |
| Total | 124 | 100.0% |
Internet Access in Ten Sleep
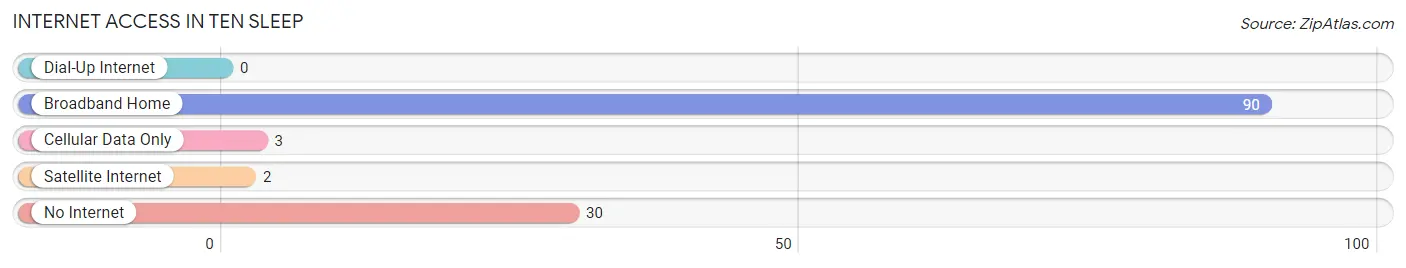
| Internet Type | # Households | % Households |
| Dial-Up Internet | 0 | 0.0% |
| Broadband Home | 90 | 72.6% |
| Cellular Data Only | 3 | 2.4% |
| Satellite Internet | 2 | 1.6% |
| No Internet | 30 | 24.2% |
| Total | 124 | 100.0% |
Ten Sleep Summary
Ten Sleep, Wyoming is a small town located in the Big Horn Basin of the state. It is situated in the foothills of the Big Horn Mountains, about 25 miles west of Worland. The town was founded in 1884 and was named after the nearby Ten Sleep Creek. The creek was so named because it was said to take ten sleeps to travel from one end to the other.
Ten Sleep has a population of about 500 people, and is the smallest incorporated town in the state. The town is located in Washakie County, and is part of the Worland Micropolitan Statistical Area. The town is located at an elevation of 4,890 feet, and has a total area of 0.7 square miles.
The town is located in a semi-arid climate, with hot summers and cold winters. The average annual temperature is about 45 degrees Fahrenheit, and the average annual precipitation is about 12 inches.
The economy of Ten Sleep is largely based on agriculture and tourism. The town is home to several small farms, and the surrounding area is known for its cattle and sheep ranching. The town is also home to several small businesses, including a grocery store, a hardware store, and a few restaurants.
Tourism is an important part of the local economy, as the town is located near several popular outdoor recreation areas. The nearby Big Horn Mountains offer a variety of activities, including hiking, camping, fishing, and hunting. The nearby Ten Sleep Canyon is also popular for rock climbing and rappelling.
The demographics of Ten Sleep are largely white, with about 90% of the population being Caucasian. The median household income is about $35,000, and the median home value is about $90,000. The town has a low unemployment rate, and the poverty rate is about 10%.
Ten Sleep is a small town with a rich history and a unique culture. The town is home to a variety of outdoor activities, and is a great place to visit for those looking for a quiet, rural getaway. The town is also home to a variety of small businesses, and is a great place to live for those looking for a small-town lifestyle.
Common Questions
What is Per Capita Income in Ten Sleep?
Per Capita income in Ten Sleep is $23,623.
What is the Median Family Income in Ten Sleep?
Median Family Income in Ten Sleep is $61,500.
What is the Median Household income in Ten Sleep?
Median Household Income in Ten Sleep is $37,500.
What is Income or Wage Gap in Ten Sleep?
Income or Wage Gap in Ten Sleep is 59.3%.
Women in Ten Sleep earn 40.7 cents for every dollar earned by a man.
What is Inequality or Gini Index in Ten Sleep?
Inequality or Gini Index in Ten Sleep is 0.38.
What is the Total Population of Ten Sleep?
Total Population of Ten Sleep is 236.
What is the Total Male Population of Ten Sleep?
Total Male Population of Ten Sleep is 140.
What is the Total Female Population of Ten Sleep?
Total Female Population of Ten Sleep is 96.
What is the Ratio of Males per 100 Females in Ten Sleep?
There are 145.83 Males per 100 Females in Ten Sleep.
What is the Ratio of Females per 100 Males in Ten Sleep?
There are 68.57 Females per 100 Males in Ten Sleep.
What is the Median Population Age in Ten Sleep?
Median Population Age in Ten Sleep is 54.3 Years.
What is the Average Family Size in Ten Sleep
Average Family Size in Ten Sleep is 2.7 People.
What is the Average Household Size in Ten Sleep
Average Household Size in Ten Sleep is 1.9 People.
How Large is the Labor Force in Ten Sleep?
There are 90 People in the Labor Forcein in Ten Sleep.
What is the Percentage of People in the Labor Force in Ten Sleep?
46.6% of People are in the Labor Force in Ten Sleep.