Sundance, WY Map & Demographics
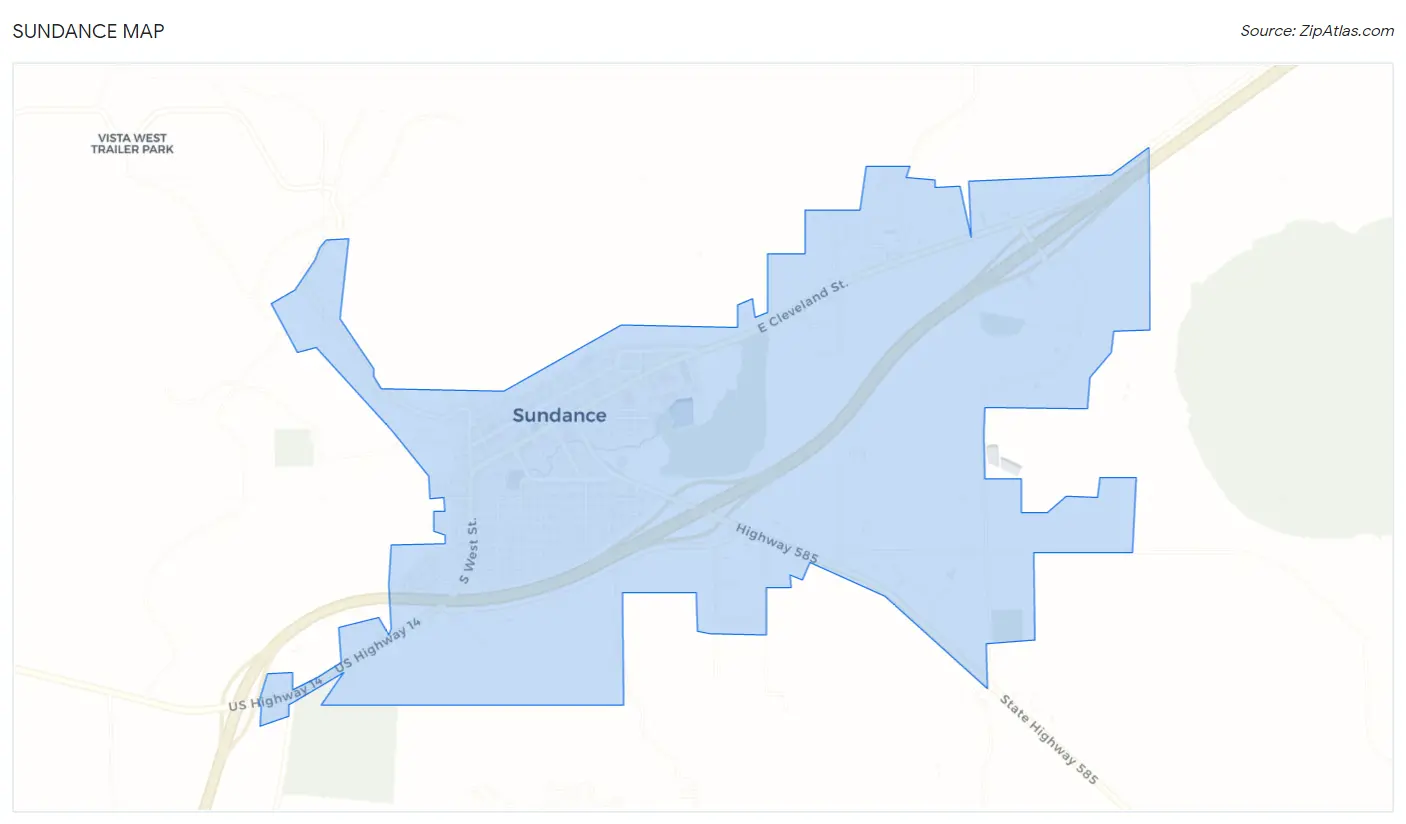
Sundance Map
Sundance Overview
$30,741
PER CAPITA INCOME
$82,083
AVG FAMILY INCOME
$54,167
AVG HOUSEHOLD INCOME
39.8%
WAGE / INCOME GAP [ % ]
60.2¢/ $1
WAGE / INCOME GAP [ $ ]
$12,231
FAMILY INCOME DEFICIT
0.36
INEQUALITY / GINI INDEX
1,102
TOTAL POPULATION
445
MALE POPULATION
657
FEMALE POPULATION
67.73
MALES / 100 FEMALES
147.64
FEMALES / 100 MALES
34.6
MEDIAN AGE
3.2
AVG FAMILY SIZE
2.3
AVG HOUSEHOLD SIZE
495
LABOR FORCE [ PEOPLE ]
58.4%
PERCENT IN LABOR FORCE
Sundance Zip Codes
Sundance Area Codes
Income in Sundance
Income Overview in Sundance
Per Capita Income in Sundance is $30,741, while median incomes of families and households are $82,083 and $54,167 respectively.
| Characteristic | Number | Measure |
| Per Capita Income | 1,102 | $30,741 |
| Median Family Income | 259 | $82,083 |
| Mean Family Income | 259 | $80,356 |
| Median Household Income | 444 | $54,167 |
| Mean Household Income | 444 | $69,352 |
| Income Deficit | 259 | $12,231 |
| Wage / Income Gap (%) | 1,102 | 39.81% |
| Wage / Income Gap ($) | 1,102 | 60.19¢ per $1 |
| Gini / Inequality Index | 1,102 | 0.36 |
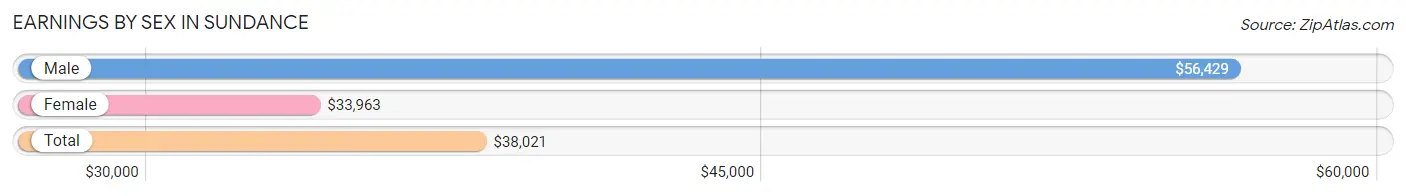
Earnings by Sex in Sundance
Average Earnings in Sundance are $38,021, $56,429 for men and $33,963 for women, a difference of 39.8%.
| Sex | Number | Average Earnings |
| Male | 266 (51.1%) | $56,429 |
| Female | 254 (48.8%) | $33,963 |
| Total | 520 (100.0%) | $38,021 |
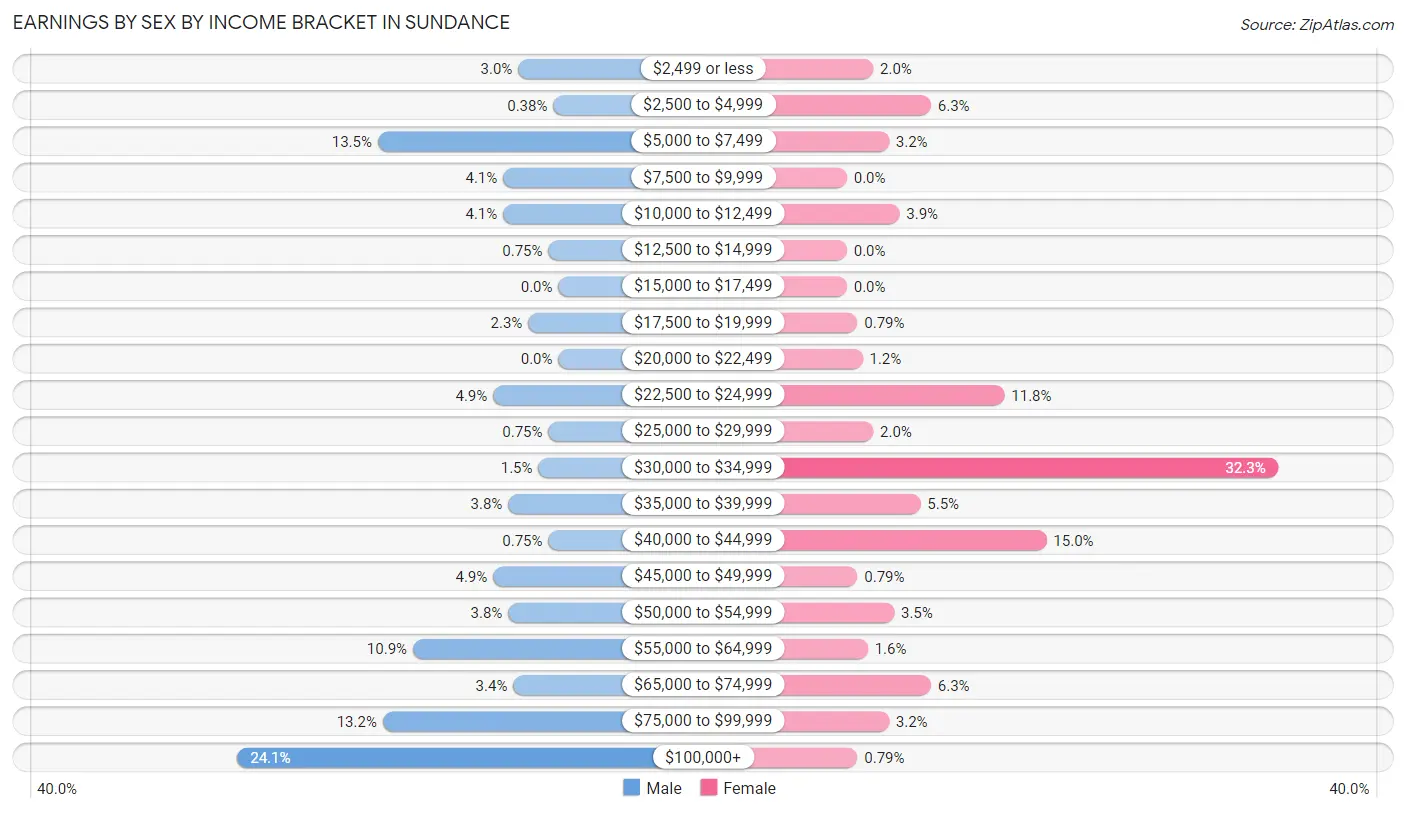
Earnings by Sex by Income Bracket in Sundance
The most common earnings brackets in Sundance are $100,000+ for men (64 | 24.1%) and $30,000 to $34,999 for women (82 | 32.3%).
| Income | Male | Female |
| $2,499 or less | 8 (3.0%) | 5 (2.0%) |
| $2,500 to $4,999 | 1 (0.4%) | 16 (6.3%) |
| $5,000 to $7,499 | 36 (13.5%) | 8 (3.2%) |
| $7,500 to $9,999 | 11 (4.1%) | 0 (0.0%) |
| $10,000 to $12,499 | 11 (4.1%) | 10 (3.9%) |
| $12,500 to $14,999 | 2 (0.7%) | 0 (0.0%) |
| $15,000 to $17,499 | 0 (0.0%) | 0 (0.0%) |
| $17,500 to $19,999 | 6 (2.3%) | 2 (0.8%) |
| $20,000 to $22,499 | 0 (0.0%) | 3 (1.2%) |
| $22,500 to $24,999 | 13 (4.9%) | 30 (11.8%) |
| $25,000 to $29,999 | 2 (0.7%) | 5 (2.0%) |
| $30,000 to $34,999 | 4 (1.5%) | 82 (32.3%) |
| $35,000 to $39,999 | 10 (3.8%) | 14 (5.5%) |
| $40,000 to $44,999 | 2 (0.7%) | 38 (15.0%) |
| $45,000 to $49,999 | 13 (4.9%) | 2 (0.8%) |
| $50,000 to $54,999 | 10 (3.8%) | 9 (3.5%) |
| $55,000 to $64,999 | 29 (10.9%) | 4 (1.6%) |
| $65,000 to $74,999 | 9 (3.4%) | 16 (6.3%) |
| $75,000 to $99,999 | 35 (13.2%) | 8 (3.2%) |
| $100,000+ | 64 (24.1%) | 2 (0.8%) |
| Total | 266 (100.0%) | 254 (100.0%) |
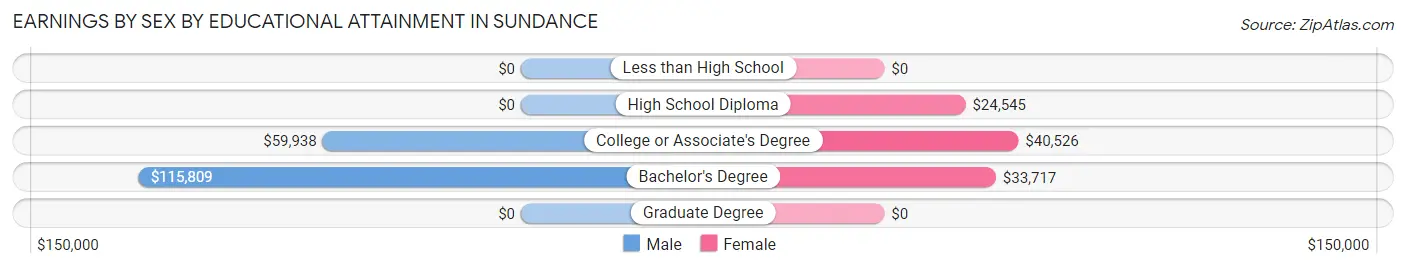
Earnings by Sex by Educational Attainment in Sundance
Average earnings in Sundance are $57,813 for men and $34,085 for women, a difference of 41.0%. Men with an educational attainment of bachelor's degree enjoy the highest average annual earnings of $115,809, while those with college or associate's degree education earn the least with $59,938. Women with an educational attainment of college or associate's degree earn the most with the average annual earnings of $40,526, while those with high school diploma education have the smallest earnings of $24,545.
| Educational Attainment | Male Income | Female Income |
| Less than High School | - | - |
| High School Diploma | - | - |
| College or Associate's Degree | $59,938 | $40,526 |
| Bachelor's Degree | $115,809 | $33,717 |
| Graduate Degree | - | - |
| Total | $57,813 | $34,085 |
Family Income in Sundance
Family Income Brackets in Sundance
According to the Sundance family income data, there are 69 families falling into the $75,000 to $99,999 income range, which is the most common income bracket and makes up 26.6% of all families.
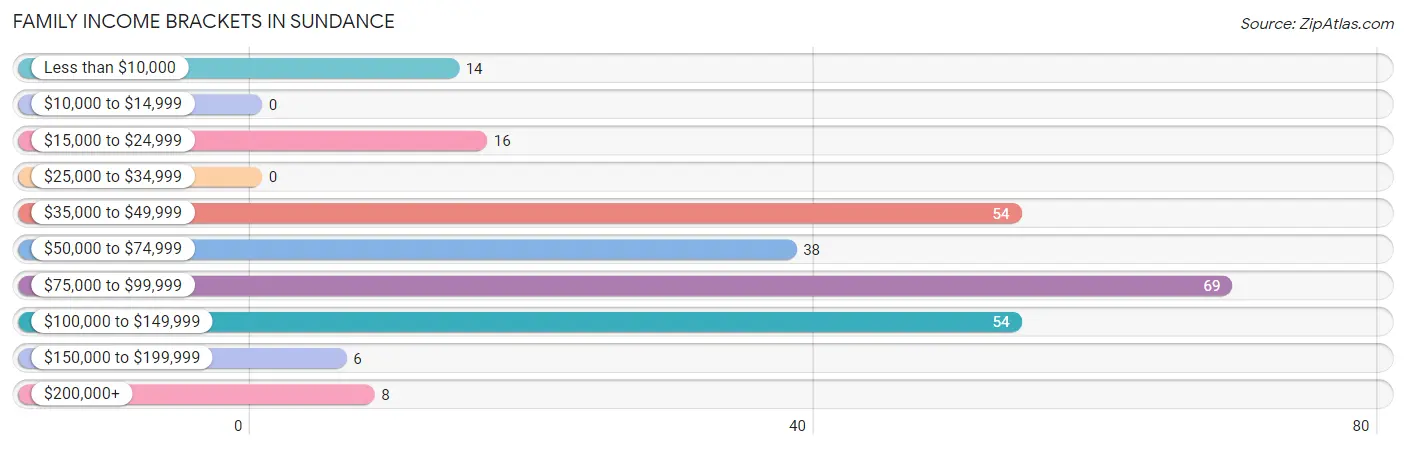
| Income Bracket | # Families | % Families |
| Less than $10,000 | 14 | 5.4% |
| $10,000 to $14,999 | 0 | 0.0% |
| $15,000 to $24,999 | 16 | 6.2% |
| $25,000 to $34,999 | 0 | 0.0% |
| $35,000 to $49,999 | 54 | 20.8% |
| $50,000 to $74,999 | 38 | 14.7% |
| $75,000 to $99,999 | 69 | 26.6% |
| $100,000 to $149,999 | 54 | 20.8% |
| $150,000 to $199,999 | 6 | 2.3% |
| $200,000+ | 8 | 3.1% |
Family Income by Famaliy Size in Sundance
3-person families (63 | 24.3%) account for the highest median family income in Sundance with $115,625 per family, while 3-person families (63 | 24.3%) have the highest median income of $38,542 per family member.
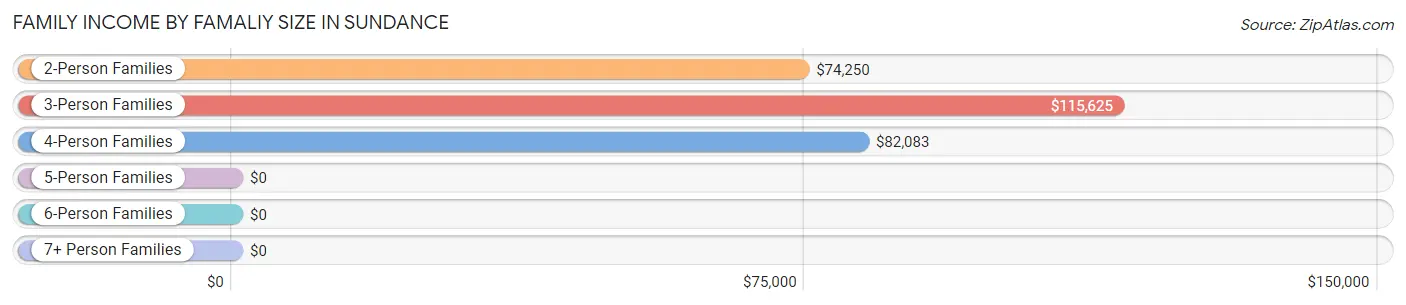
| Income Bracket | # Families | Median Income |
| 2-Person Families | 151 (58.3%) | $74,250 |
| 3-Person Families | 63 (24.3%) | $115,625 |
| 4-Person Families | 26 (10.0%) | $82,083 |
| 5-Person Families | 5 (1.9%) | $0 |
| 6-Person Families | 14 (5.4%) | $0 |
| 7+ Person Families | 0 (0.0%) | $0 |
| Total | 259 (100.0%) | $82,083 |
Family Income by Number of Earners in Sundance
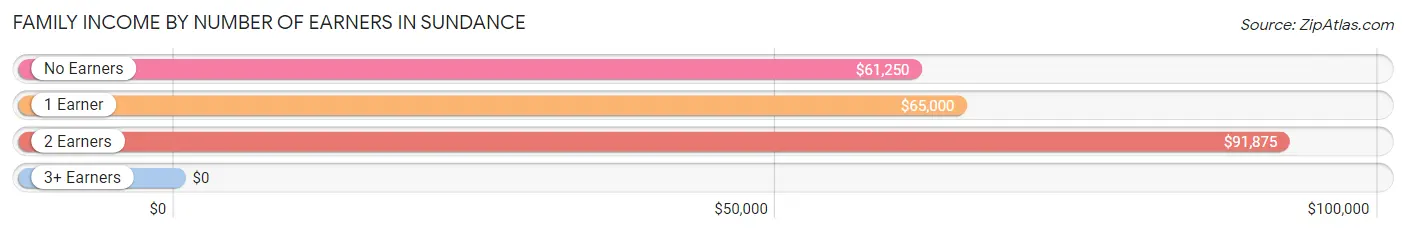
| Number of Earners | # Families | Median Income |
| No Earners | 28 (10.8%) | $61,250 |
| 1 Earner | 154 (59.5%) | $65,000 |
| 2 Earners | 77 (29.7%) | $91,875 |
| 3+ Earners | 0 (0.0%) | $0 |
| Total | 259 (100.0%) | $82,083 |
Household Income in Sundance
Household Income Brackets in Sundance
With 132 households falling in the category, the $35,000 to $49,999 income range is the most frequent in Sundance, accounting for 29.7% of all households. In contrast, only 6 households (1.3%) fall into the $15,000 to $24,999 income bracket, making it the least populous group.
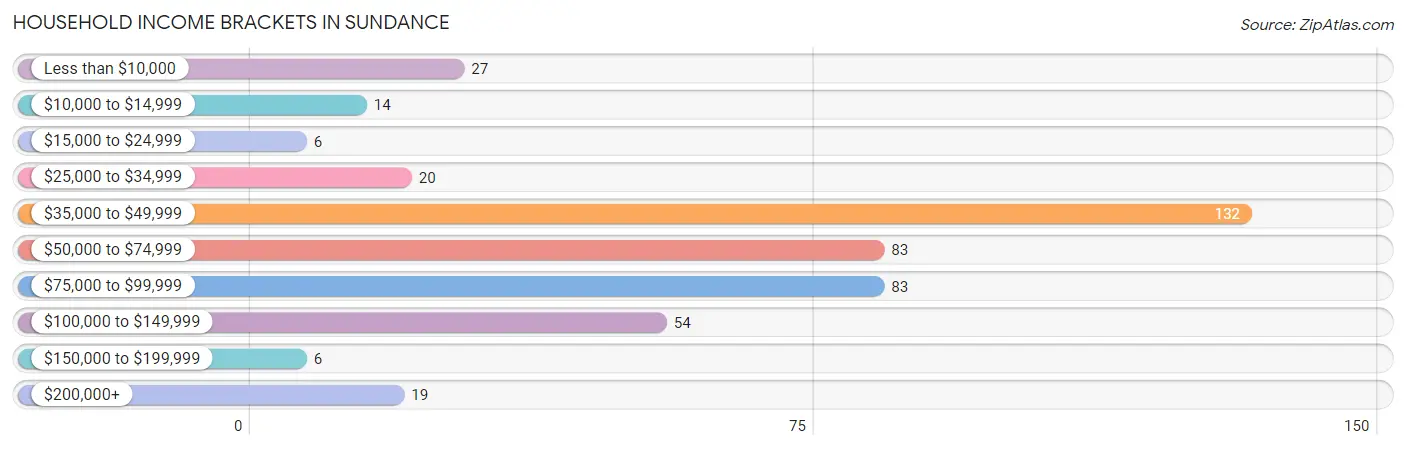
| Income Bracket | # Households | % Households |
| Less than $10,000 | 27 | 6.1% |
| $10,000 to $14,999 | 14 | 3.2% |
| $15,000 to $24,999 | 6 | 1.4% |
| $25,000 to $34,999 | 20 | 4.5% |
| $35,000 to $49,999 | 132 | 29.7% |
| $50,000 to $74,999 | 83 | 18.7% |
| $75,000 to $99,999 | 83 | 18.7% |
| $100,000 to $149,999 | 54 | 12.2% |
| $150,000 to $199,999 | 6 | 1.4% |
| $200,000+ | 19 | 4.3% |
Household Income by Householder Age in Sundance
The median household income in Sundance is $54,167, with the highest median household income of $80,625 found in the 45 to 64 years age bracket for the primary householder. A total of 119 households (26.8%) fall into this category. Meanwhile, the 15 to 24 years age bracket for the primary householder has the lowest median household income of $0, with 4 households (0.9%) in this group.
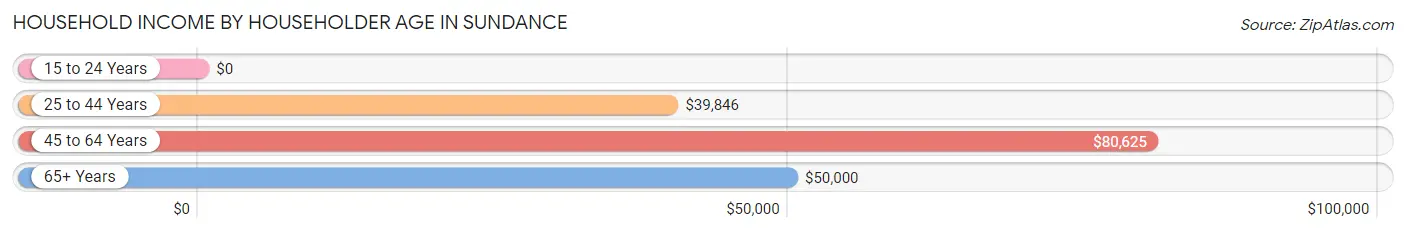
| Income Bracket | # Households | Median Income |
| 15 to 24 Years | 4 (0.9%) | $0 |
| 25 to 44 Years | 205 (46.2%) | $39,846 |
| 45 to 64 Years | 119 (26.8%) | $80,625 |
| 65+ Years | 116 (26.1%) | $50,000 |
| Total | 444 (100.0%) | $54,167 |
Poverty in Sundance
Income Below Poverty by Sex and Age in Sundance
With 13.1% poverty level for males and 11.5% for females among the residents of Sundance, 15 year old males and 18 to 24 year old females are the most vulnerable to poverty, with 2 males (100.0%) and 8 females (100.0%) in their respective age groups living below the poverty level.
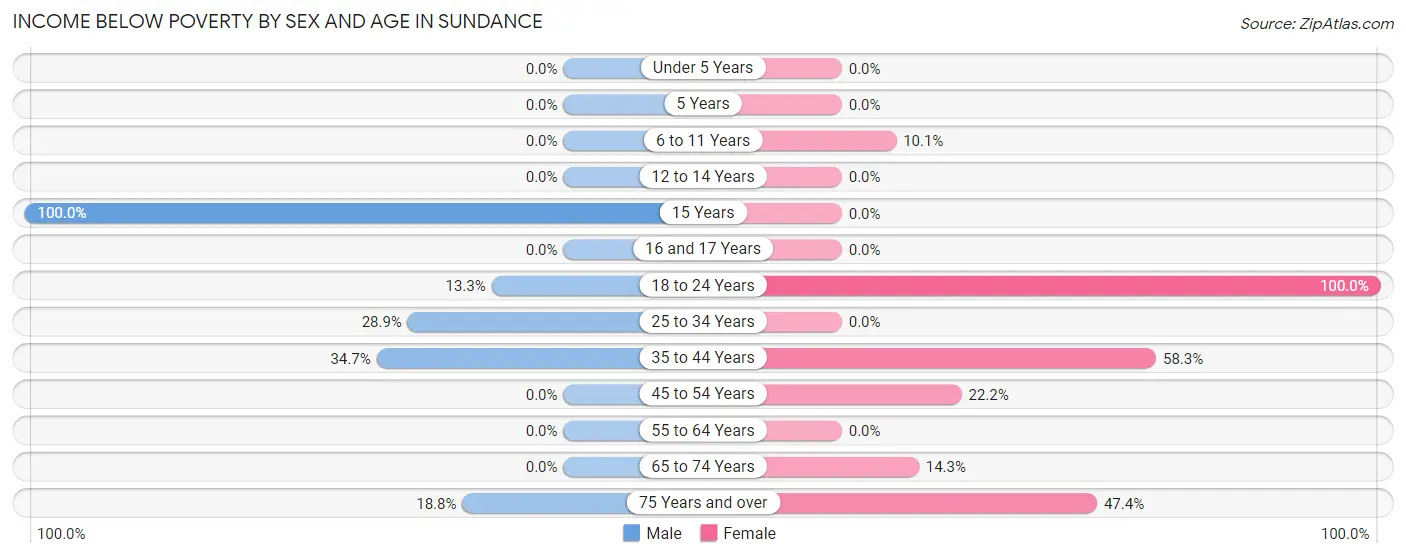
| Age Bracket | Male | Female |
| Under 5 Years | 0 (0.0%) | 0 (0.0%) |
| 5 Years | 0 (0.0%) | 0 (0.0%) |
| 6 to 11 Years | 0 (0.0%) | 10 (10.1%) |
| 12 to 14 Years | 0 (0.0%) | 0 (0.0%) |
| 15 Years | 2 (100.0%) | 0 (0.0%) |
| 16 and 17 Years | 0 (0.0%) | 0 (0.0%) |
| 18 to 24 Years | 4 (13.3%) | 8 (100.0%) |
| 25 to 34 Years | 26 (28.9%) | 0 (0.0%) |
| 35 to 44 Years | 17 (34.7%) | 21 (58.3%) |
| 45 to 54 Years | 0 (0.0%) | 8 (22.2%) |
| 55 to 64 Years | 0 (0.0%) | 0 (0.0%) |
| 65 to 74 Years | 0 (0.0%) | 6 (14.3%) |
| 75 Years and over | 6 (18.8%) | 18 (47.4%) |
| Total | 55 (13.1%) | 71 (11.5%) |
Income Above Poverty by Sex and Age in Sundance
According to the poverty statistics in Sundance, males aged under 5 years and females aged under 5 years are the age groups that are most secure financially, with 100.0% of males and 100.0% of females in these age groups living above the poverty line.
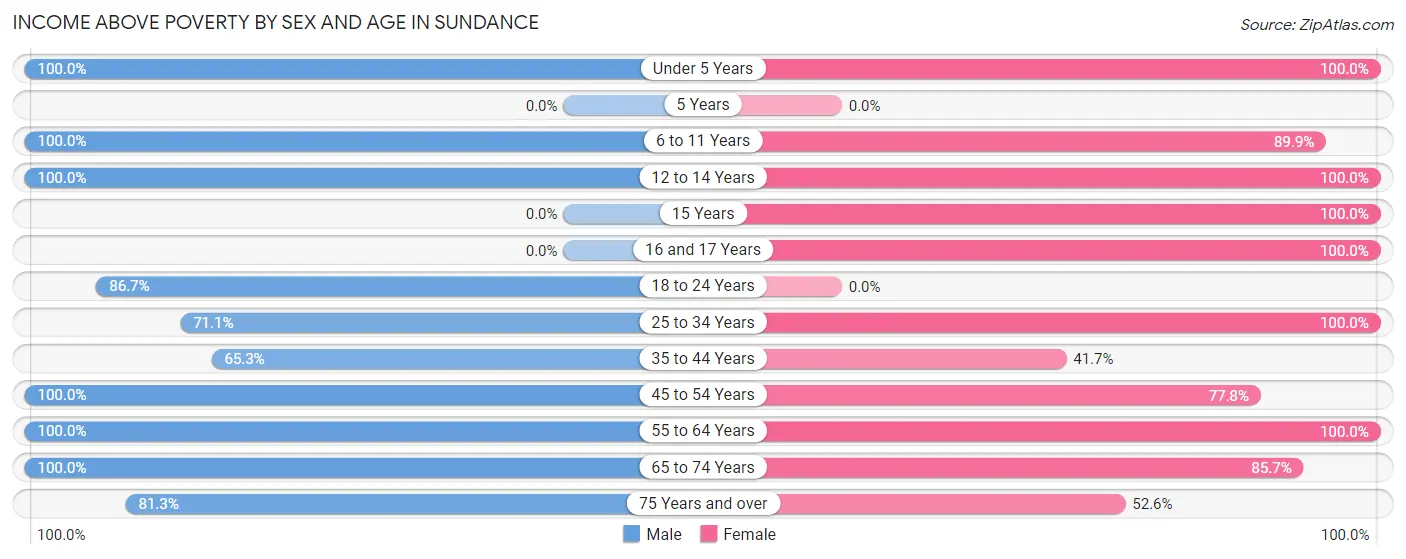
| Age Bracket | Male | Female |
| Under 5 Years | 7 (100.0%) | 93 (100.0%) |
| 5 Years | 0 (0.0%) | 0 (0.0%) |
| 6 to 11 Years | 21 (100.0%) | 89 (89.9%) |
| 12 to 14 Years | 26 (100.0%) | 4 (100.0%) |
| 15 Years | 0 (0.0%) | 3 (100.0%) |
| 16 and 17 Years | 0 (0.0%) | 3 (100.0%) |
| 18 to 24 Years | 26 (86.7%) | 0 (0.0%) |
| 25 to 34 Years | 64 (71.1%) | 170 (100.0%) |
| 35 to 44 Years | 32 (65.3%) | 15 (41.7%) |
| 45 to 54 Years | 30 (100.0%) | 28 (77.8%) |
| 55 to 64 Years | 57 (100.0%) | 88 (100.0%) |
| 65 to 74 Years | 75 (100.0%) | 36 (85.7%) |
| 75 Years and over | 26 (81.2%) | 20 (52.6%) |
| Total | 364 (86.9%) | 549 (88.5%) |
Income Below Poverty Among Married-Couple Families in Sundance
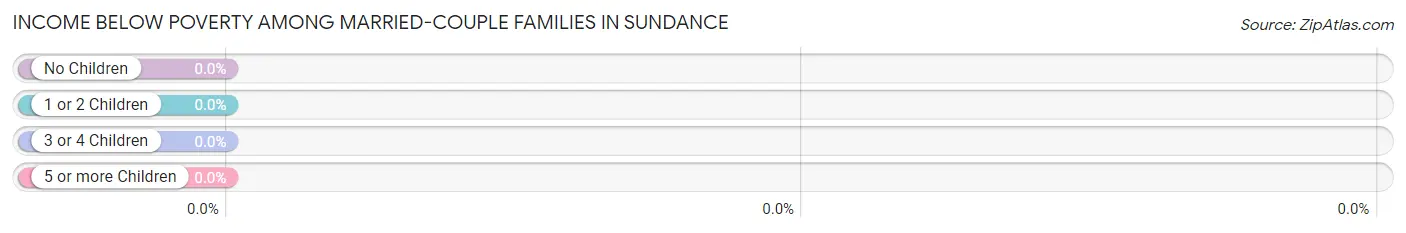
| Children | Above Poverty | Below Poverty |
| No Children | 121 (100.0%) | 0 (0.0%) |
| 1 or 2 Children | 56 (100.0%) | 0 (0.0%) |
| 3 or 4 Children | 19 (100.0%) | 0 (0.0%) |
| 5 or more Children | 0 (0.0%) | 0 (0.0%) |
| Total | 196 (100.0%) | 0 (0.0%) |
Income Below Poverty Among Single-Parent Households in Sundance
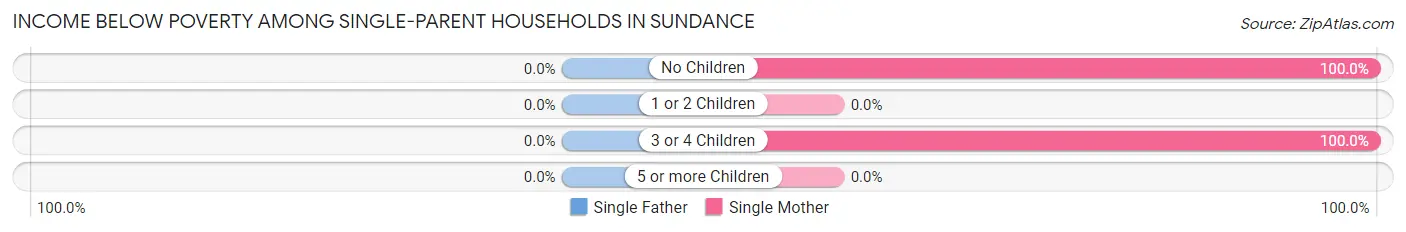
| Children | Single Father | Single Mother |
| No Children | 0 (0.0%) | 14 (100.0%) |
| 1 or 2 Children | 0 (0.0%) | 0 (0.0%) |
| 3 or 4 Children | 0 (0.0%) | 2 (100.0%) |
| 5 or more Children | 0 (0.0%) | 0 (0.0%) |
| Total | 0 (0.0%) | 16 (34.0%) |
Income Below Poverty Among Married-Couple vs Single-Parent Households in Sundance
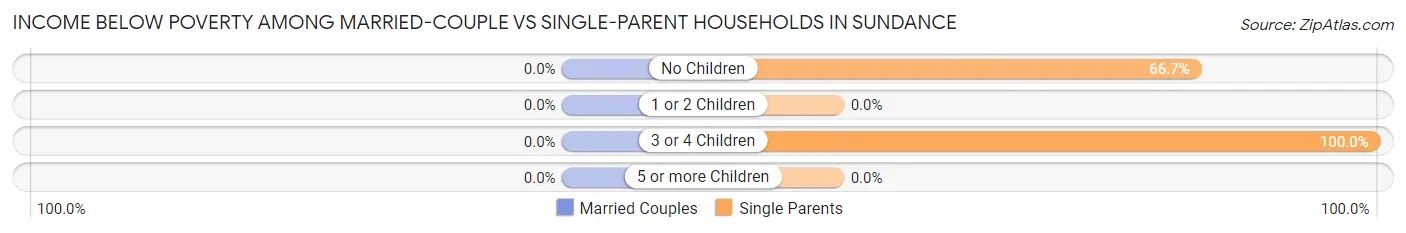
| Children | Married-Couple Families | Single-Parent Households |
| No Children | 0 (0.0%) | 14 (66.7%) |
| 1 or 2 Children | 0 (0.0%) | 0 (0.0%) |
| 3 or 4 Children | 0 (0.0%) | 2 (100.0%) |
| 5 or more Children | 0 (0.0%) | 0 (0.0%) |
| Total | 0 (0.0%) | 16 (25.4%) |
Race in Sundance
The most populous races in Sundance are White / Caucasian (996 | 90.4%), Two or more Races (90 | 8.2%), and Hispanic or Latino (50 | 4.5%).
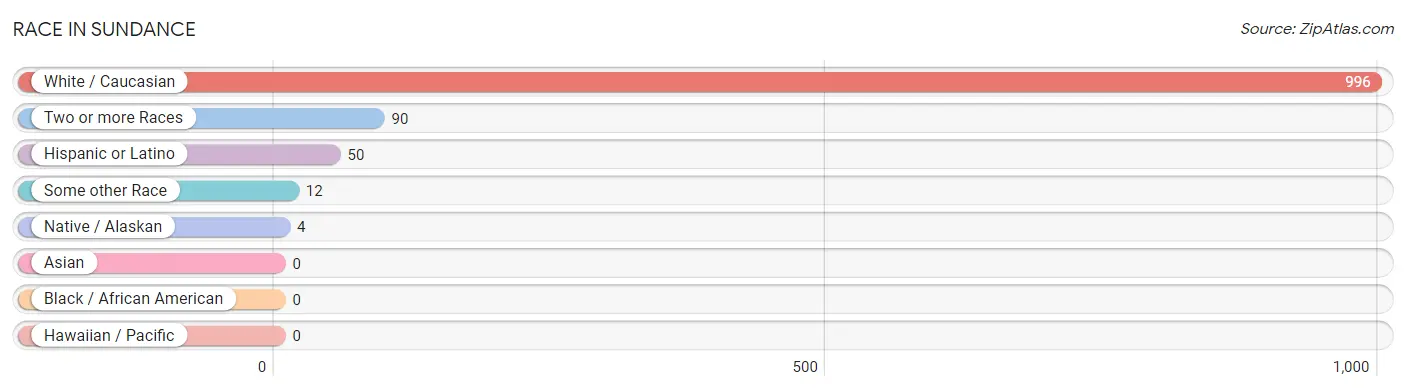
| Race | # Population | % Population |
| Asian | 0 | 0.0% |
| Black / African American | 0 | 0.0% |
| Hawaiian / Pacific | 0 | 0.0% |
| Hispanic or Latino | 50 | 4.5% |
| Native / Alaskan | 4 | 0.4% |
| White / Caucasian | 996 | 90.4% |
| Two or more Races | 90 | 8.2% |
| Some other Race | 12 | 1.1% |
| Total | 1,102 | 100.0% |
Ancestry in Sundance
The most populous ancestries reported in Sundance are German (303 | 27.5%), English (109 | 9.9%), Irish (89 | 8.1%), Polish (83 | 7.5%), and Norwegian (79 | 7.2%), together accounting for 60.2% of all Sundance residents.
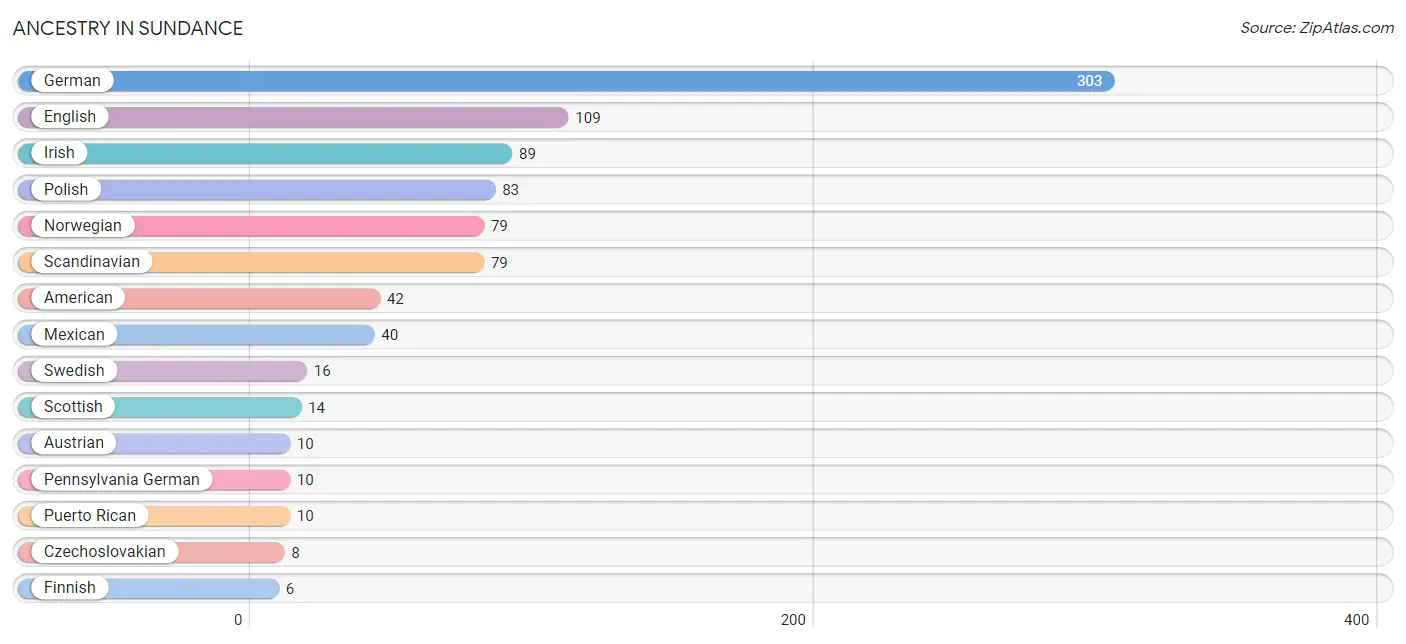
| Ancestry | # Population | % Population |
| American | 42 | 3.8% |
| Austrian | 10 | 0.9% |
| British | 2 | 0.2% |
| Czech | 2 | 0.2% |
| Czechoslovakian | 8 | 0.7% |
| Danish | 4 | 0.4% |
| Dutch | 1 | 0.1% |
| English | 109 | 9.9% |
| Finnish | 6 | 0.5% |
| French | 4 | 0.4% |
| German | 303 | 27.5% |
| Hungarian | 2 | 0.2% |
| Irish | 89 | 8.1% |
| Mexican | 40 | 3.6% |
| Northern European | 2 | 0.2% |
| Norwegian | 79 | 7.2% |
| Pennsylvania German | 10 | 0.9% |
| Polish | 83 | 7.5% |
| Portuguese | 5 | 0.4% |
| Puerto Rican | 10 | 0.9% |
| Scandinavian | 79 | 7.2% |
| Scottish | 14 | 1.3% |
| Swedish | 16 | 1.5% |
| Swiss | 3 | 0.3% | View All 24 Rows |
Immigrants in Sundance
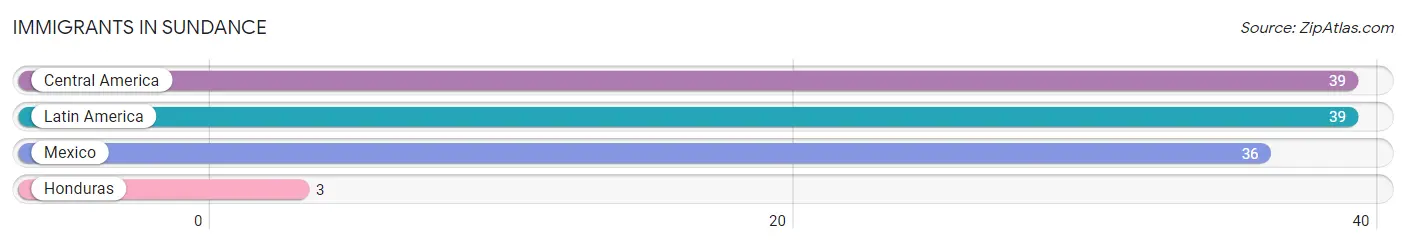
The most numerous immigrant groups reported in Sundance came from Central America (39 | 3.5%), Latin America (39 | 3.5%), Mexico (36 | 3.3%), and Honduras (3 | 0.3%), together accounting for 10.6% of all Sundance residents.
| Immigration Origin | # Population | % Population |
| Central America | 39 | 3.5% |
| Honduras | 3 | 0.3% |
| Latin America | 39 | 3.5% |
| Mexico | 36 | 3.3% | View All 4 Rows |
Sex and Age in Sundance
Sex and Age in Sundance
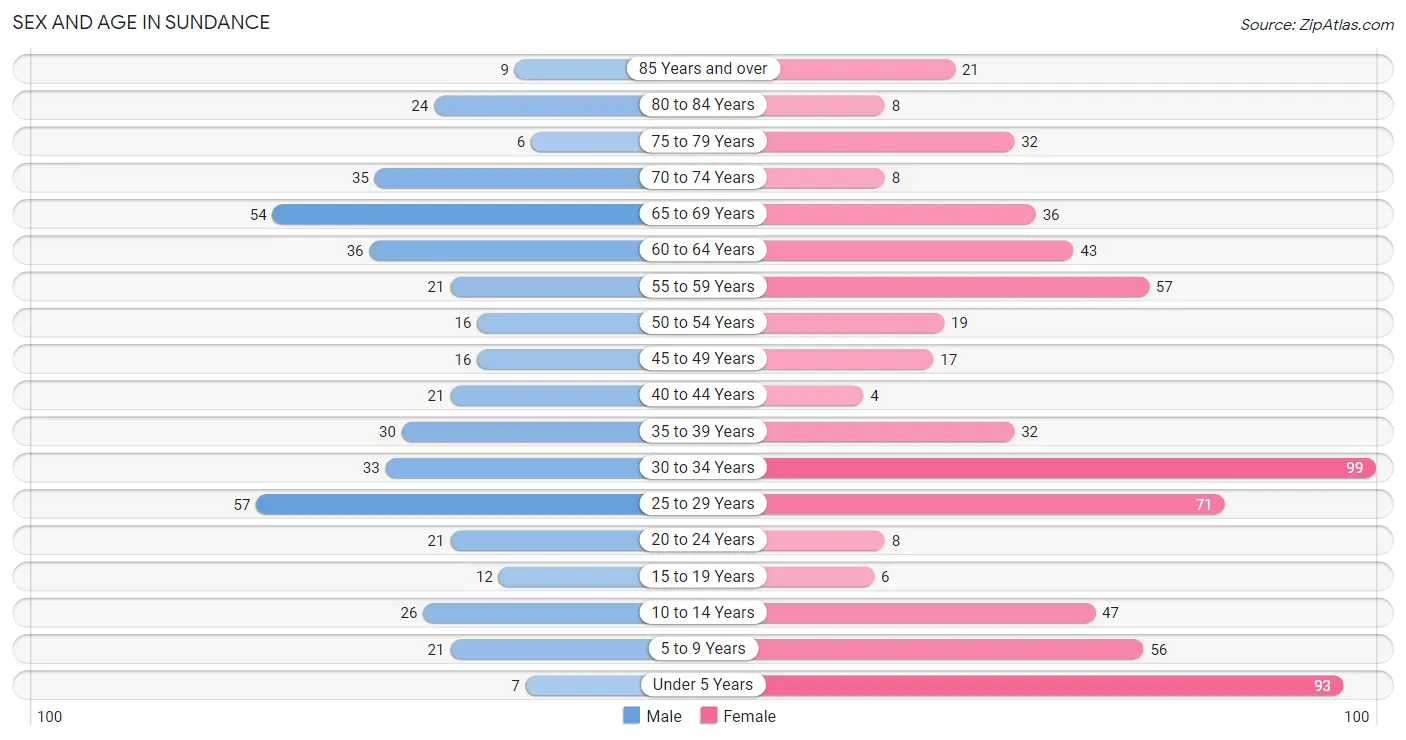
The most populous age groups in Sundance are 25 to 29 Years (57 | 12.8%) for men and 30 to 34 Years (99 | 15.1%) for women.
| Age Bracket | Male | Female |
| Under 5 Years | 7 (1.6%) | 93 (14.2%) |
| 5 to 9 Years | 21 (4.7%) | 56 (8.5%) |
| 10 to 14 Years | 26 (5.8%) | 47 (7.1%) |
| 15 to 19 Years | 12 (2.7%) | 6 (0.9%) |
| 20 to 24 Years | 21 (4.7%) | 8 (1.2%) |
| 25 to 29 Years | 57 (12.8%) | 71 (10.8%) |
| 30 to 34 Years | 33 (7.4%) | 99 (15.1%) |
| 35 to 39 Years | 30 (6.7%) | 32 (4.9%) |
| 40 to 44 Years | 21 (4.7%) | 4 (0.6%) |
| 45 to 49 Years | 16 (3.6%) | 17 (2.6%) |
| 50 to 54 Years | 16 (3.6%) | 19 (2.9%) |
| 55 to 59 Years | 21 (4.7%) | 57 (8.7%) |
| 60 to 64 Years | 36 (8.1%) | 43 (6.5%) |
| 65 to 69 Years | 54 (12.1%) | 36 (5.5%) |
| 70 to 74 Years | 35 (7.9%) | 8 (1.2%) |
| 75 to 79 Years | 6 (1.3%) | 32 (4.9%) |
| 80 to 84 Years | 24 (5.4%) | 8 (1.2%) |
| 85 Years and over | 9 (2.0%) | 21 (3.2%) |
| Total | 445 (100.0%) | 657 (100.0%) |
Families and Households in Sundance
Median Family Size in Sundance
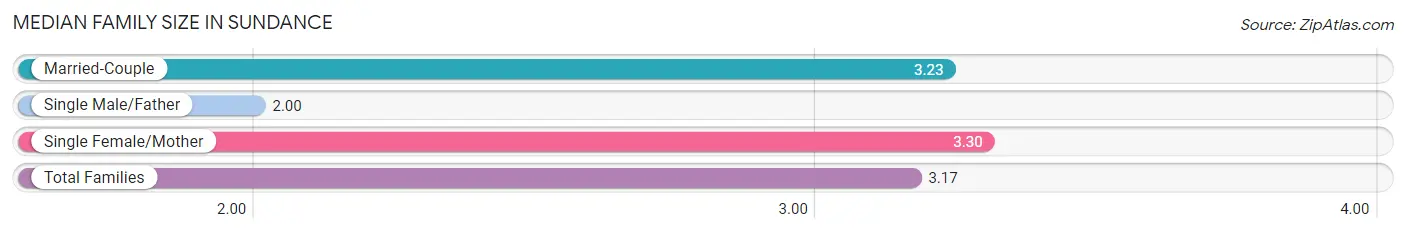
The median family size in Sundance is 3.17 persons per family, with single female/mother families (47 | 18.1%) accounting for the largest median family size of 3.3 persons per family. On the other hand, single male/father families (16 | 6.2%) represent the smallest median family size with 2.00 persons per family.
| Family Type | # Families | Family Size |
| Married-Couple | 196 (75.7%) | 3.23 |
| Single Male/Father | 16 (6.2%) | 2.00 |
| Single Female/Mother | 47 (18.1%) | 3.30 |
| Total Families | 259 (100.0%) | 3.17 |
Median Household Size in Sundance
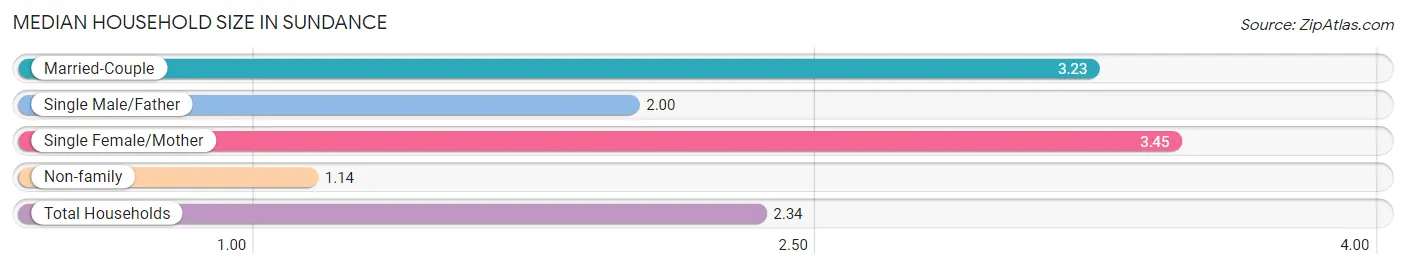
The median household size in Sundance is 2.34 persons per household, with single female/mother households (47 | 10.6%) accounting for the largest median household size of 3.45 persons per household. non-family households (185 | 41.7%) represent the smallest median household size with 1.14 persons per household.
| Household Type | # Households | Household Size |
| Married-Couple | 196 (44.1%) | 3.23 |
| Single Male/Father | 16 (3.6%) | 2.00 |
| Single Female/Mother | 47 (10.6%) | 3.45 |
| Non-family | 185 (41.7%) | 1.14 |
| Total Households | 444 (100.0%) | 2.34 |
Household Size by Marriage Status in Sundance
Out of a total of 444 households in Sundance, 259 (58.3%) are family households, while 185 (41.7%) are nonfamily households. The most numerous type of family households are 2-person households, comprising 137, and the most common type of nonfamily households are 1-person households, comprising 175.
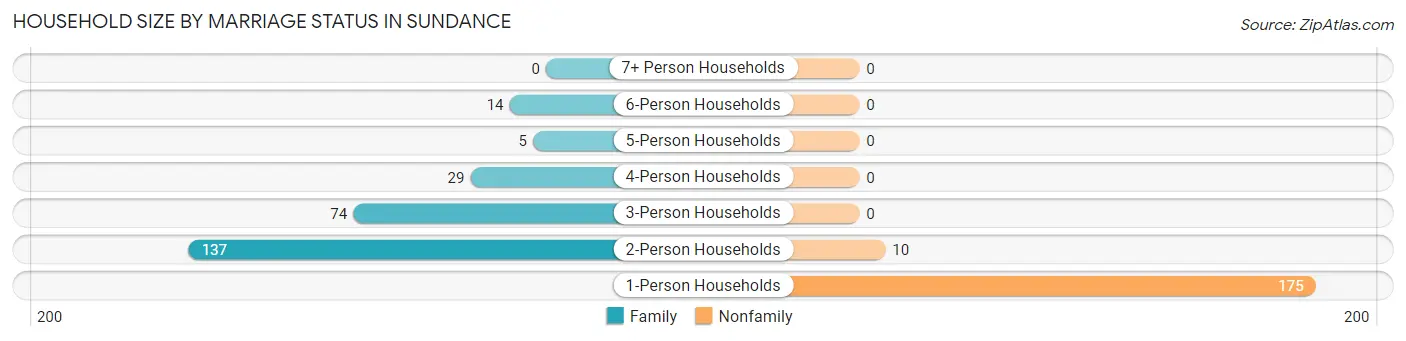
| Household Size | Family Households | Nonfamily Households |
| 1-Person Households | - | 175 (39.4%) |
| 2-Person Households | 137 (30.9%) | 10 (2.2%) |
| 3-Person Households | 74 (16.7%) | 0 (0.0%) |
| 4-Person Households | 29 (6.5%) | 0 (0.0%) |
| 5-Person Households | 5 (1.1%) | 0 (0.0%) |
| 6-Person Households | 14 (3.2%) | 0 (0.0%) |
| 7+ Person Households | 0 (0.0%) | 0 (0.0%) |
| Total | 259 (58.3%) | 185 (41.7%) |
Female Fertility in Sundance
Fertility by Age in Sundance
Average fertility rate in Sundance is 58.0 births per 1,000 women. Women in the age bracket of 20 to 34 years have the highest fertility rate with 79.0 births per 1,000 women. Women in the age bracket of 20 to 34 years acount for 100.0% of all women with births.
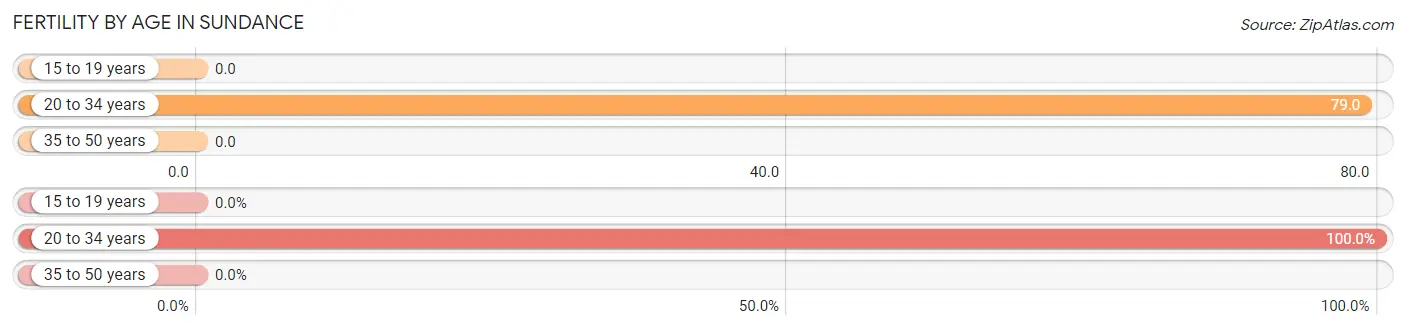
| Age Bracket | Women with Births | Births / 1,000 Women |
| 15 to 19 years | 0 (0.0%) | 0.0 |
| 20 to 34 years | 14 (100.0%) | 79.0 |
| 35 to 50 years | 0 (0.0%) | 0.0 |
| Total | 14 (100.0%) | 58.0 |
Fertility by Age by Marriage Status in Sundance
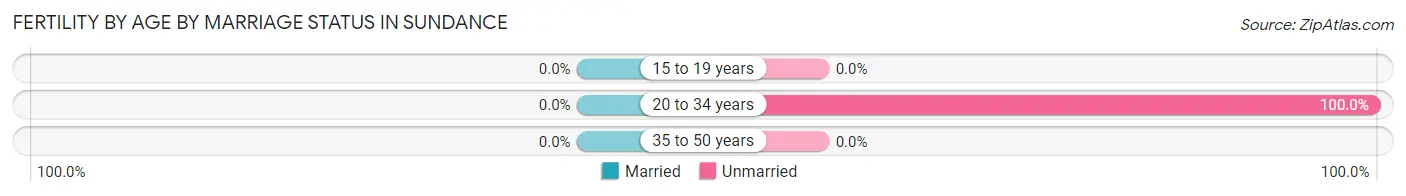
| Age Bracket | Married | Unmarried |
| 15 to 19 years | 0 (0.0%) | 0 (0.0%) |
| 20 to 34 years | 0 (0.0%) | 14 (100.0%) |
| 35 to 50 years | 0 (0.0%) | 0 (0.0%) |
| Total | 0 (0.0%) | 14 (100.0%) |
Fertility by Education in Sundance
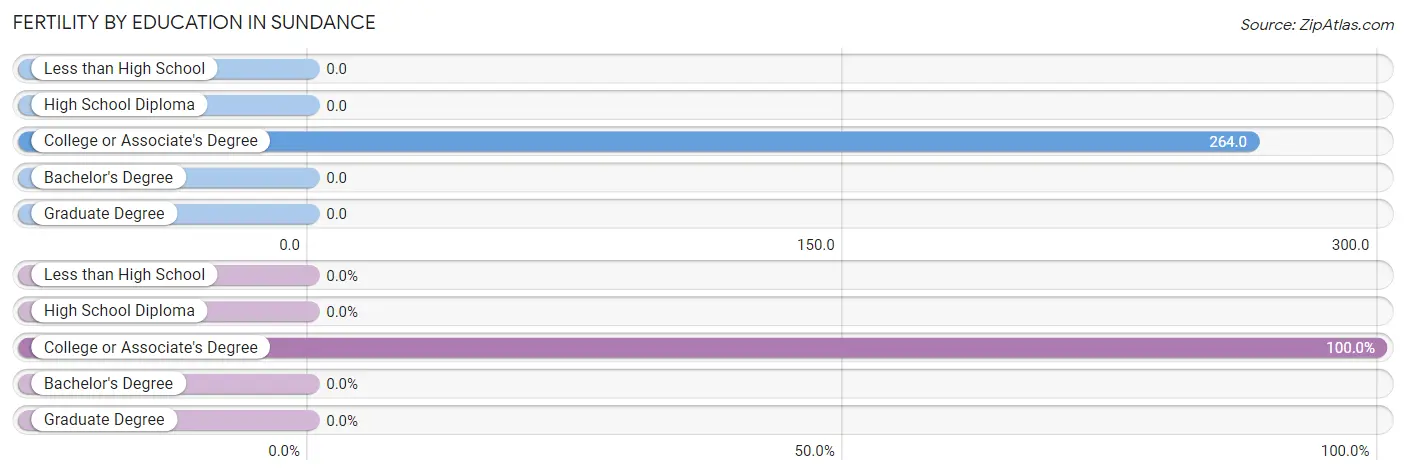
| Educational Attainment | Women with Births | Births / 1,000 Women |
| Less than High School | 0 (0.0%) | 0.0 |
| High School Diploma | 0 (0.0%) | 0.0 |
| College or Associate's Degree | 14 (100.0%) | 264.0 |
| Bachelor's Degree | 0 (0.0%) | 0.0 |
| Graduate Degree | 0 (0.0%) | 0.0 |
| Total | 14 (100.0%) | 58.0 |
Fertility by Education by Marriage Status in Sundance
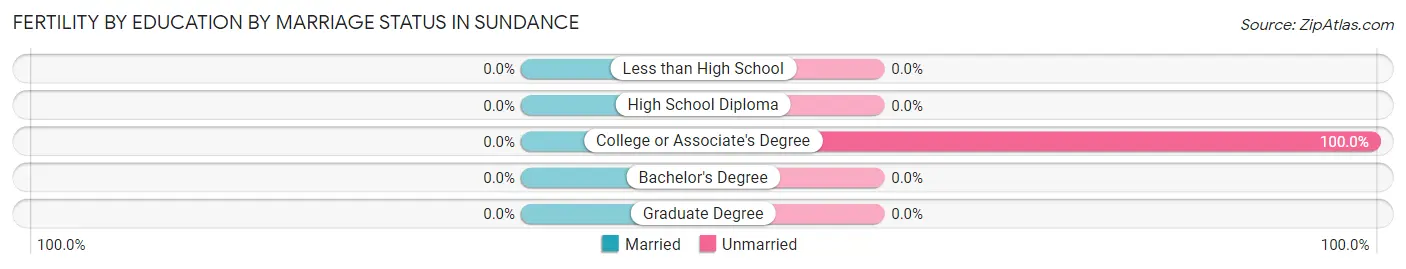
| Educational Attainment | Married | Unmarried |
| Less than High School | 0 (0.0%) | 0 (0.0%) |
| High School Diploma | 0 (0.0%) | 0 (0.0%) |
| College or Associate's Degree | 0 (0.0%) | 14 (100.0%) |
| Bachelor's Degree | 0 (0.0%) | 0 (0.0%) |
| Graduate Degree | 0 (0.0%) | 0 (0.0%) |
| Total | 0 (0.0%) | 14 (100.0%) |
Employment Characteristics in Sundance
Employment by Class of Employer in Sundance
Among the 487 employed individuals in Sundance, private company employees (191 | 39.2%), federal government employees (86 | 17.7%), and local government employees (72 | 14.8%) make up the most common classes of employment.
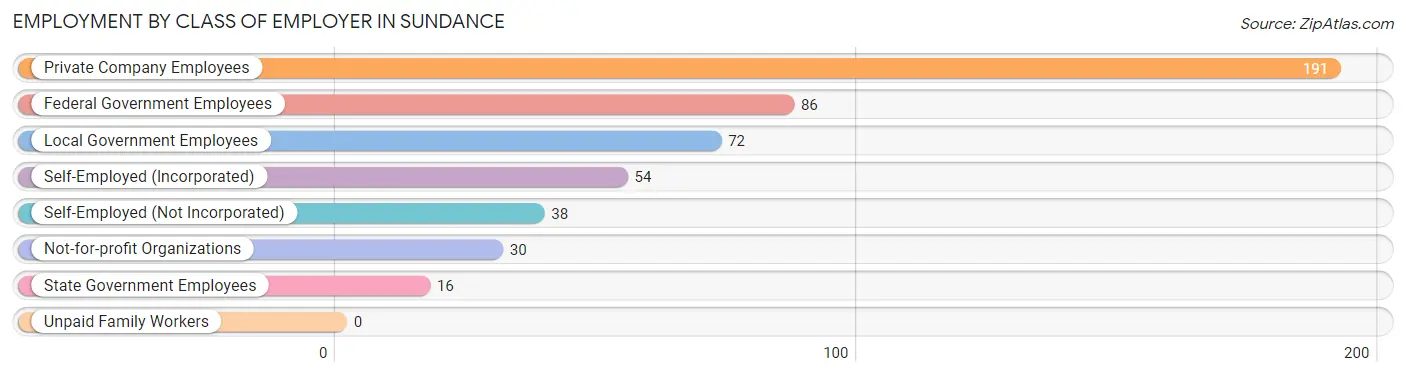
| Employer Class | # Employees | % Employees |
| Private Company Employees | 191 | 39.2% |
| Self-Employed (Incorporated) | 54 | 11.1% |
| Self-Employed (Not Incorporated) | 38 | 7.8% |
| Not-for-profit Organizations | 30 | 6.2% |
| Local Government Employees | 72 | 14.8% |
| State Government Employees | 16 | 3.3% |
| Federal Government Employees | 86 | 17.7% |
| Unpaid Family Workers | 0 | 0.0% |
| Total | 487 | 100.0% |
Employment Status by Age in Sundance
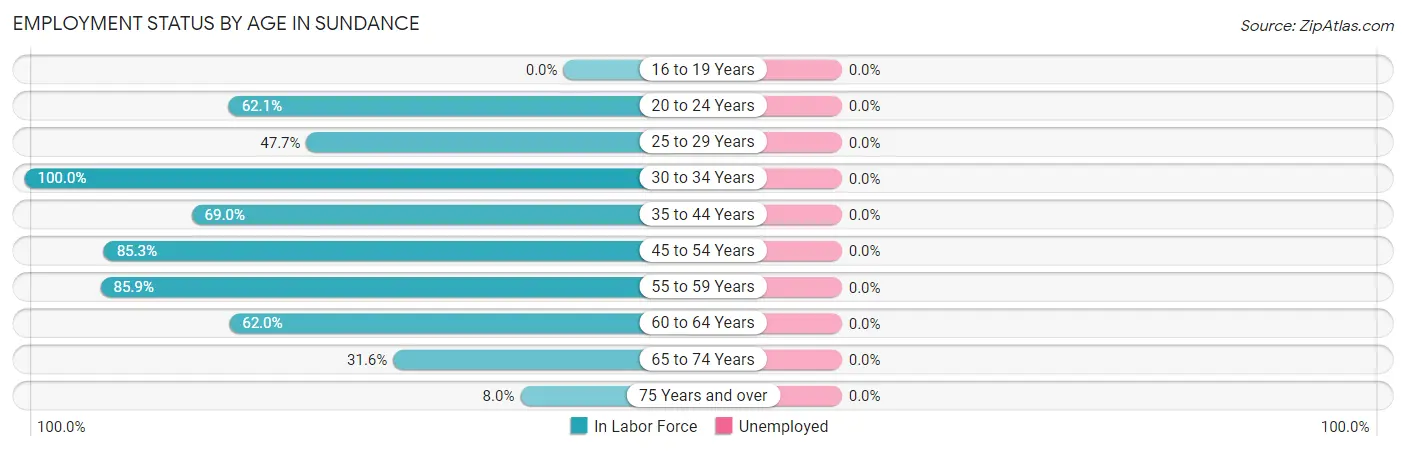
| Age Bracket | In Labor Force | Unemployed |
| 16 to 19 Years | 0 (0.0%) | 0 (0.0%) |
| 20 to 24 Years | 18 (62.1%) | 0 (0.0%) |
| 25 to 29 Years | 61 (47.7%) | 0 (0.0%) |
| 30 to 34 Years | 132 (100.0%) | 0 (0.0%) |
| 35 to 44 Years | 60 (69.0%) | 0 (0.0%) |
| 45 to 54 Years | 58 (85.3%) | 0 (0.0%) |
| 55 to 59 Years | 67 (85.9%) | 0 (0.0%) |
| 60 to 64 Years | 49 (62.0%) | 0 (0.0%) |
| 65 to 74 Years | 42 (31.6%) | 0 (0.0%) |
| 75 Years and over | 8 (8.0%) | 0 (0.0%) |
| Total | 495 (58.4%) | 0 (0.0%) |
Employment Status by Educational Attainment in Sundance
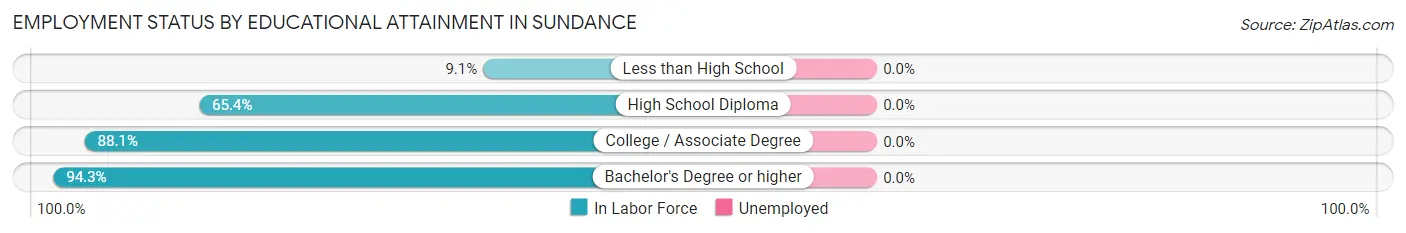
| Educational Attainment | In Labor Force | Unemployed |
| Less than High School | 6 (9.1%) | 0 (0.0%) |
| High School Diploma | 100 (65.4%) | 0 (0.0%) |
| College / Associate Degree | 171 (88.1%) | 0 (0.0%) |
| Bachelor's Degree or higher | 150 (94.3%) | 0 (0.0%) |
| Total | 427 (74.7%) | 0 (0.0%) |
Employment Occupations by Sex in Sundance
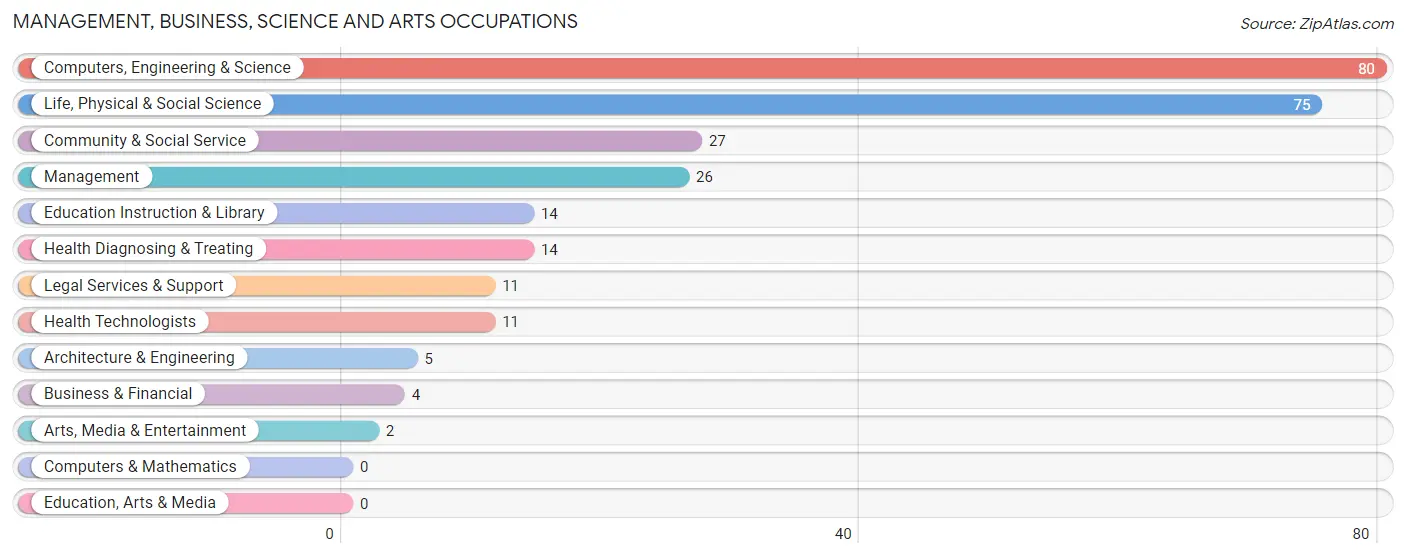
Management, Business, Science and Arts Occupations
The most common Management, Business, Science and Arts occupations in Sundance are Computers, Engineering & Science (80 | 16.2%), Life, Physical & Social Science (75 | 15.1%), Community & Social Service (27 | 5.4%), Management (26 | 5.2%), and Education Instruction & Library (14 | 2.8%).
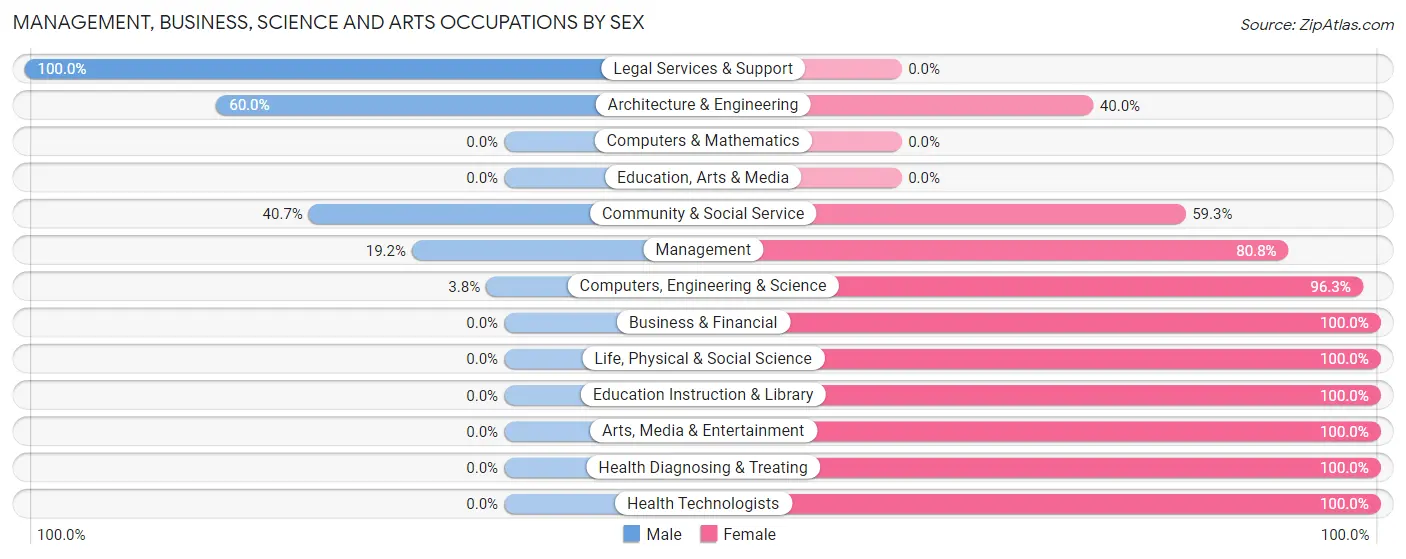
Management, Business, Science and Arts Occupations by Sex
Within the Management, Business, Science and Arts occupations in Sundance, the most male-oriented occupations are Legal Services & Support (100.0%), Architecture & Engineering (60.0%), and Community & Social Service (40.7%), while the most female-oriented occupations are Business & Financial (100.0%), Life, Physical & Social Science (100.0%), and Education Instruction & Library (100.0%).
| Occupation | Male | Female |
| Management | 5 (19.2%) | 21 (80.8%) |
| Business & Financial | 0 (0.0%) | 4 (100.0%) |
| Computers, Engineering & Science | 3 (3.7%) | 77 (96.3%) |
| Computers & Mathematics | 0 (0.0%) | 0 (0.0%) |
| Architecture & Engineering | 3 (60.0%) | 2 (40.0%) |
| Life, Physical & Social Science | 0 (0.0%) | 75 (100.0%) |
| Community & Social Service | 11 (40.7%) | 16 (59.3%) |
| Education, Arts & Media | 0 (0.0%) | 0 (0.0%) |
| Legal Services & Support | 11 (100.0%) | 0 (0.0%) |
| Education Instruction & Library | 0 (0.0%) | 14 (100.0%) |
| Arts, Media & Entertainment | 0 (0.0%) | 2 (100.0%) |
| Health Diagnosing & Treating | 0 (0.0%) | 14 (100.0%) |
| Health Technologists | 0 (0.0%) | 11 (100.0%) |
| Total (Category) | 19 (12.6%) | 132 (87.4%) |
| Total (Overall) | 248 (50.1%) | 247 (49.9%) |
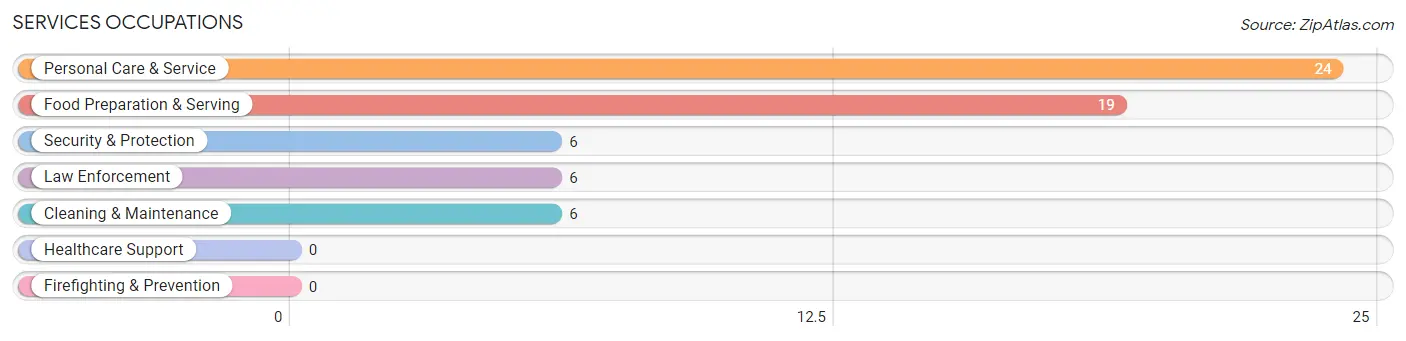
Services Occupations
The most common Services occupations in Sundance are Personal Care & Service (24 | 4.9%), Food Preparation & Serving (19 | 3.8%), Security & Protection (6 | 1.2%), Law Enforcement (6 | 1.2%), and Cleaning & Maintenance (6 | 1.2%).
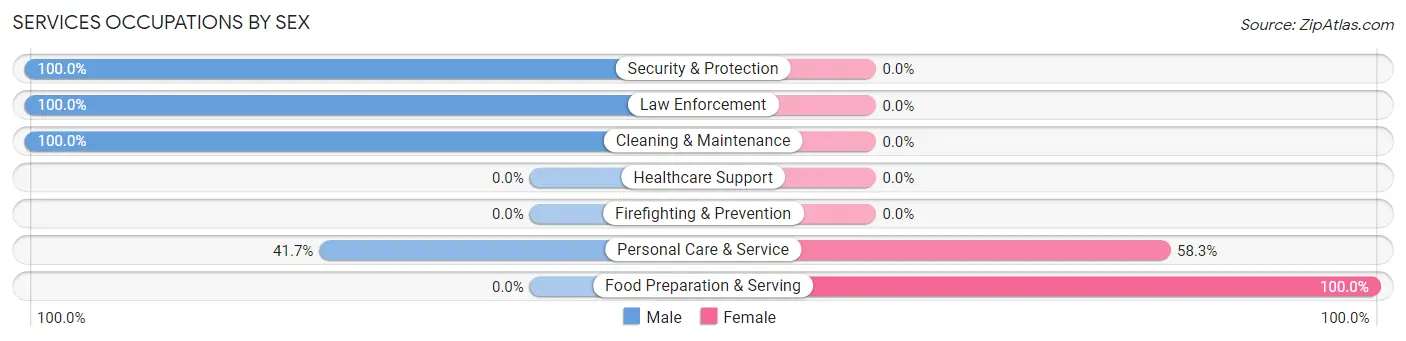
Services Occupations by Sex
Within the Services occupations in Sundance, the most male-oriented occupations are Security & Protection (100.0%), Law Enforcement (100.0%), and Cleaning & Maintenance (100.0%), while the most female-oriented occupations are Food Preparation & Serving (100.0%), and Personal Care & Service (58.3%).
| Occupation | Male | Female |
| Healthcare Support | 0 (0.0%) | 0 (0.0%) |
| Security & Protection | 6 (100.0%) | 0 (0.0%) |
| Firefighting & Prevention | 0 (0.0%) | 0 (0.0%) |
| Law Enforcement | 6 (100.0%) | 0 (0.0%) |
| Food Preparation & Serving | 0 (0.0%) | 19 (100.0%) |
| Cleaning & Maintenance | 6 (100.0%) | 0 (0.0%) |
| Personal Care & Service | 10 (41.7%) | 14 (58.3%) |
| Total (Category) | 22 (40.0%) | 33 (60.0%) |
| Total (Overall) | 248 (50.1%) | 247 (49.9%) |
Sales and Office Occupations
The most common Sales and Office occupations in Sundance are Office & Administration (48 | 9.7%), and Sales & Related (33 | 6.7%).
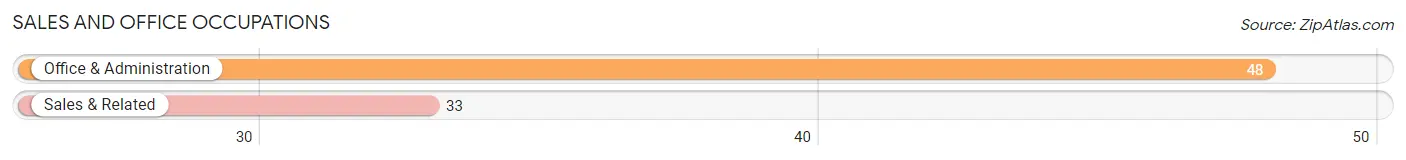
Sales and Office Occupations by Sex
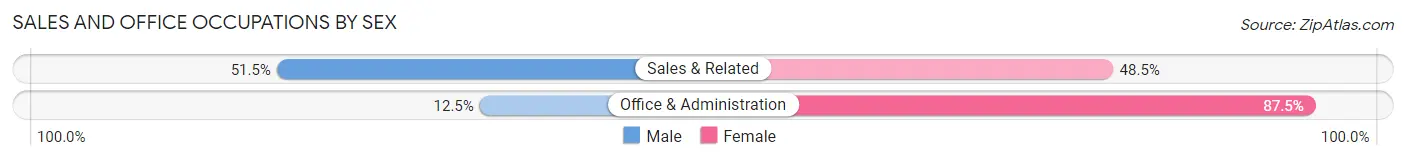
| Occupation | Male | Female |
| Sales & Related | 17 (51.5%) | 16 (48.5%) |
| Office & Administration | 6 (12.5%) | 42 (87.5%) |
| Total (Category) | 23 (28.4%) | 58 (71.6%) |
| Total (Overall) | 248 (50.1%) | 247 (49.9%) |
Natural Resources, Construction and Maintenance Occupations
The most common Natural Resources, Construction and Maintenance occupations in Sundance are Construction & Extraction (128 | 25.9%), Installation, Maintenance & Repair (30 | 6.1%), and Farming, Fishing & Forestry (11 | 2.2%).
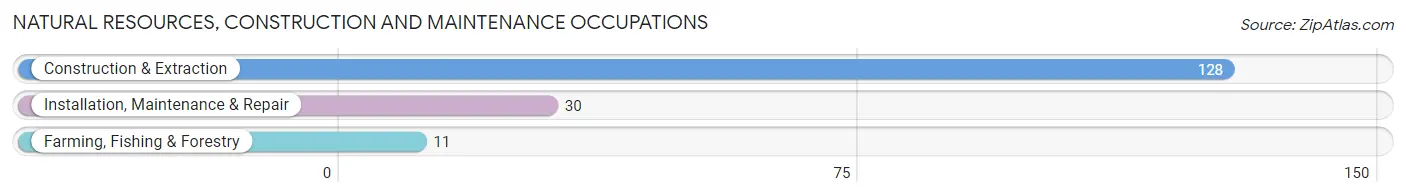
Natural Resources, Construction and Maintenance Occupations by Sex
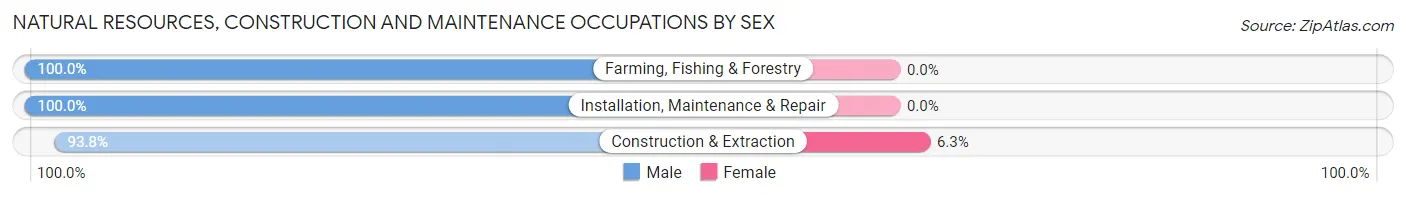
| Occupation | Male | Female |
| Farming, Fishing & Forestry | 11 (100.0%) | 0 (0.0%) |
| Construction & Extraction | 120 (93.8%) | 8 (6.2%) |
| Installation, Maintenance & Repair | 30 (100.0%) | 0 (0.0%) |
| Total (Category) | 161 (95.3%) | 8 (4.7%) |
| Total (Overall) | 248 (50.1%) | 247 (49.9%) |
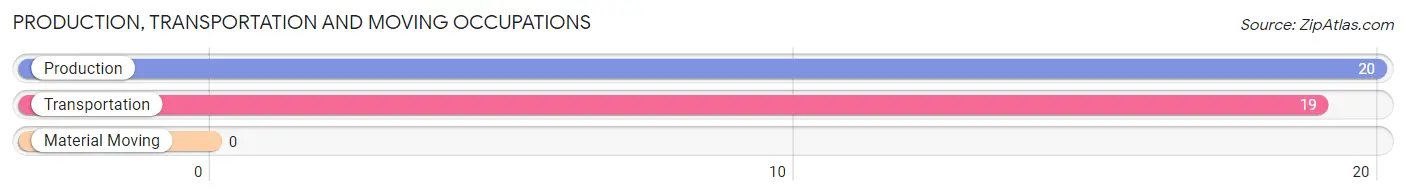
Production, Transportation and Moving Occupations
The most common Production, Transportation and Moving occupations in Sundance are Production (20 | 4.0%), and Transportation (19 | 3.8%).
Production, Transportation and Moving Occupations by Sex
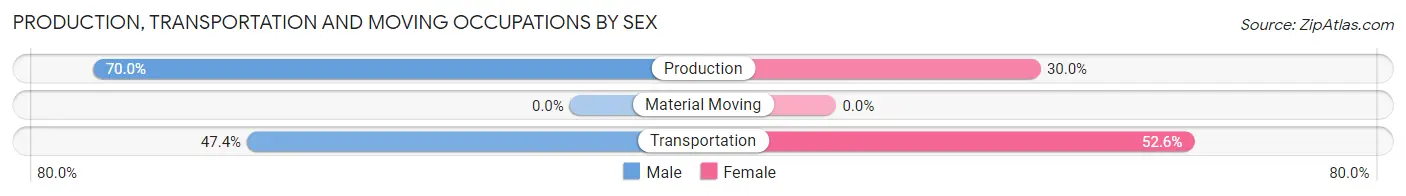
| Occupation | Male | Female |
| Production | 14 (70.0%) | 6 (30.0%) |
| Transportation | 9 (47.4%) | 10 (52.6%) |
| Material Moving | 0 (0.0%) | 0 (0.0%) |
| Total (Category) | 23 (59.0%) | 16 (41.0%) |
| Total (Overall) | 248 (50.1%) | 247 (49.9%) |
Employment Industries by Sex in Sundance
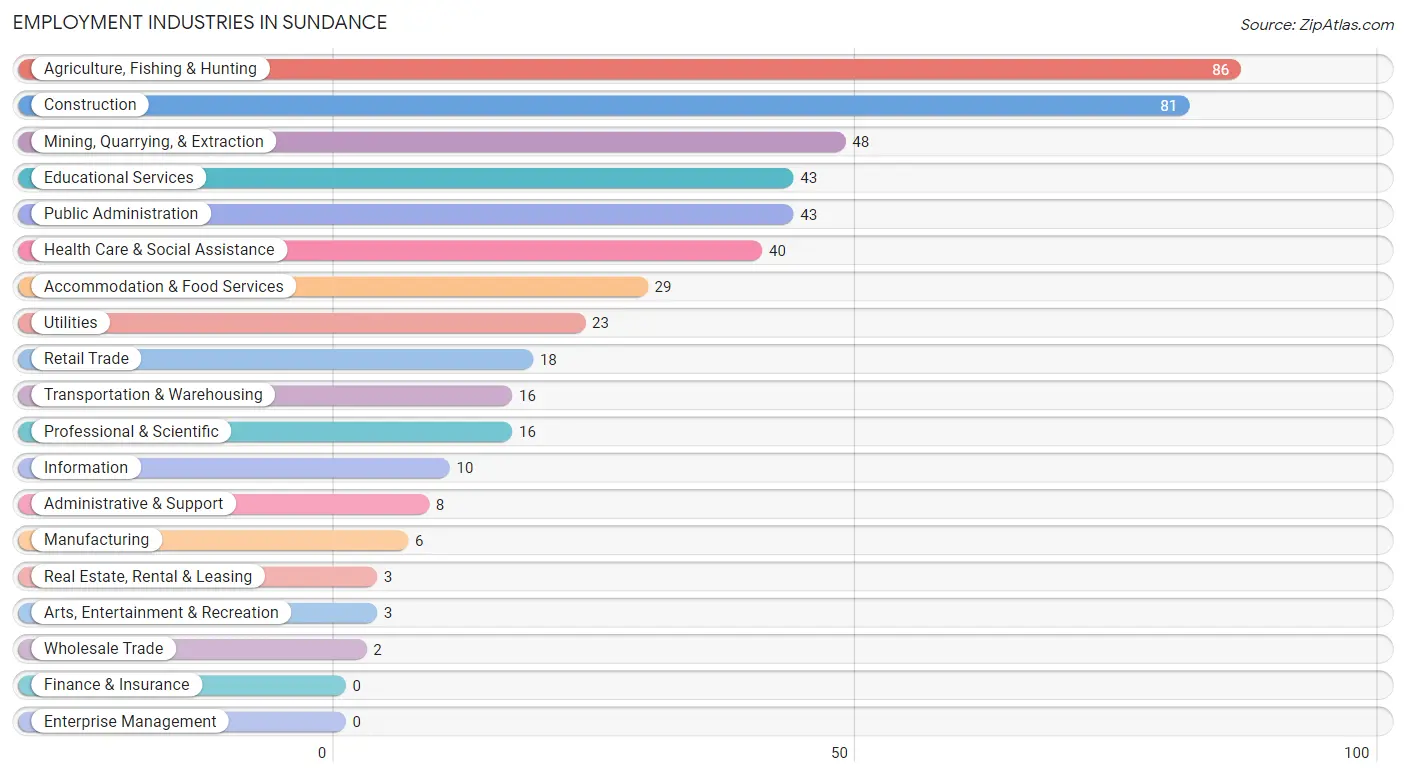
Employment Industries in Sundance
The major employment industries in Sundance include Agriculture, Fishing & Hunting (86 | 17.4%), Construction (81 | 16.4%), Mining, Quarrying, & Extraction (48 | 9.7%), Educational Services (43 | 8.7%), and Public Administration (43 | 8.7%).
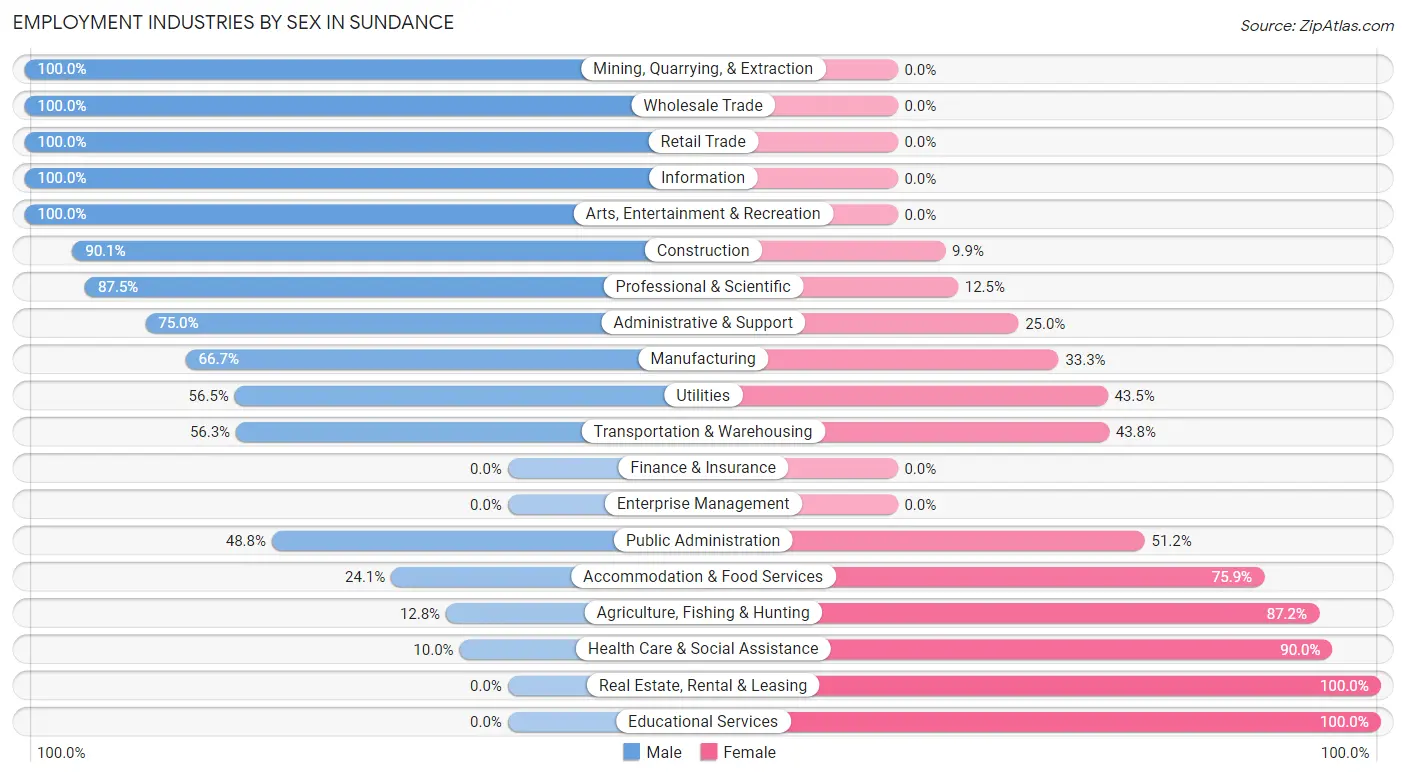
Employment Industries by Sex in Sundance
The Sundance industries that see more men than women are Mining, Quarrying, & Extraction (100.0%), Wholesale Trade (100.0%), and Retail Trade (100.0%), whereas the industries that tend to have a higher number of women are Real Estate, Rental & Leasing (100.0%), Educational Services (100.0%), and Health Care & Social Assistance (90.0%).
| Industry | Male | Female |
| Agriculture, Fishing & Hunting | 11 (12.8%) | 75 (87.2%) |
| Mining, Quarrying, & Extraction | 48 (100.0%) | 0 (0.0%) |
| Construction | 73 (90.1%) | 8 (9.9%) |
| Manufacturing | 4 (66.7%) | 2 (33.3%) |
| Wholesale Trade | 2 (100.0%) | 0 (0.0%) |
| Retail Trade | 18 (100.0%) | 0 (0.0%) |
| Transportation & Warehousing | 9 (56.2%) | 7 (43.8%) |
| Utilities | 13 (56.5%) | 10 (43.5%) |
| Information | 10 (100.0%) | 0 (0.0%) |
| Finance & Insurance | 0 (0.0%) | 0 (0.0%) |
| Real Estate, Rental & Leasing | 0 (0.0%) | 3 (100.0%) |
| Professional & Scientific | 14 (87.5%) | 2 (12.5%) |
| Enterprise Management | 0 (0.0%) | 0 (0.0%) |
| Administrative & Support | 6 (75.0%) | 2 (25.0%) |
| Educational Services | 0 (0.0%) | 43 (100.0%) |
| Health Care & Social Assistance | 4 (10.0%) | 36 (90.0%) |
| Arts, Entertainment & Recreation | 3 (100.0%) | 0 (0.0%) |
| Accommodation & Food Services | 7 (24.1%) | 22 (75.9%) |
| Public Administration | 21 (48.8%) | 22 (51.2%) |
| Total | 248 (50.1%) | 247 (49.9%) |
Education in Sundance
School Enrollment in Sundance
The most common levels of schooling among the 185 students in Sundance are elementary school (69 | 37.3%), middle school (57 | 30.8%), and kindergarten (26 | 14.1%).
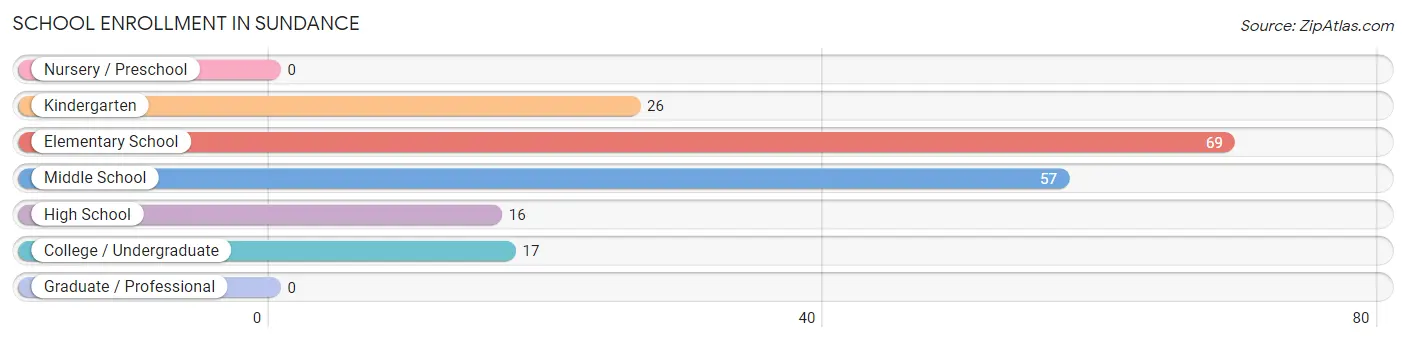
| School Level | # Students | % Students |
| Nursery / Preschool | 0 | 0.0% |
| Kindergarten | 26 | 14.1% |
| Elementary School | 69 | 37.3% |
| Middle School | 57 | 30.8% |
| High School | 16 | 8.6% |
| College / Undergraduate | 17 | 9.2% |
| Graduate / Professional | 0 | 0.0% |
| Total | 185 | 100.0% |
School Enrollment by Age by Funding Source in Sundance
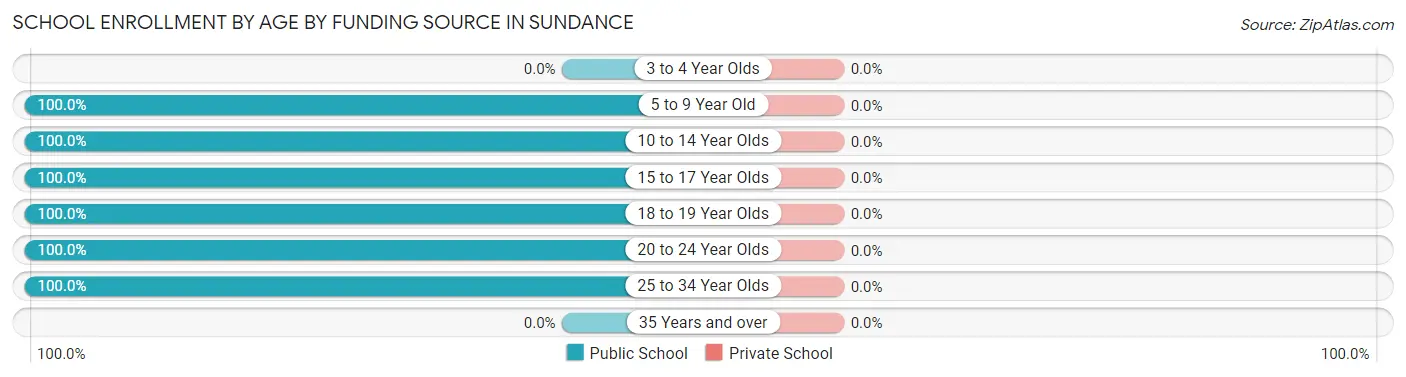
| Age Bracket | Public School | Private School |
| 3 to 4 Year Olds | 0 (0.0%) | 0 (0.0%) |
| 5 to 9 Year Old | 77 (100.0%) | 0 (0.0%) |
| 10 to 14 Year Olds | 73 (100.0%) | 0 (0.0%) |
| 15 to 17 Year Olds | 8 (100.0%) | 0 (0.0%) |
| 18 to 19 Year Olds | 10 (100.0%) | 0 (0.0%) |
| 20 to 24 Year Olds | 10 (100.0%) | 0 (0.0%) |
| 25 to 34 Year Olds | 7 (100.0%) | 0 (0.0%) |
| 35 Years and over | 0 (0.0%) | 0 (0.0%) |
| Total | 185 (100.0%) | 0 (0.0%) |
Educational Attainment by Field of Study in Sundance
Bio, nature & agricultural (112 | 37.5%), physical & health sciences (75 | 25.1%), education (32 | 10.7%), social sciences (22 | 7.4%), and business (19 | 6.4%) are the most common fields of study among 299 individuals in Sundance who have obtained a bachelor's degree or higher.
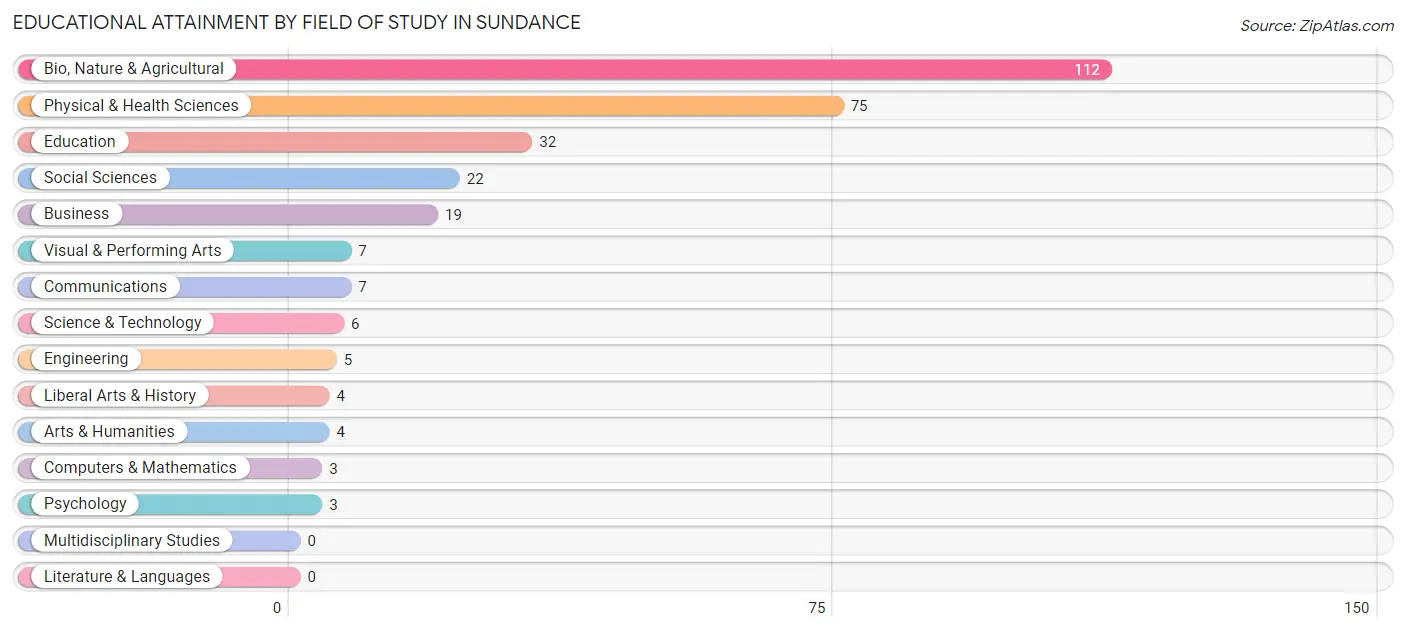
| Field of Study | # Graduates | % Graduates |
| Computers & Mathematics | 3 | 1.0% |
| Bio, Nature & Agricultural | 112 | 37.5% |
| Physical & Health Sciences | 75 | 25.1% |
| Psychology | 3 | 1.0% |
| Social Sciences | 22 | 7.4% |
| Engineering | 5 | 1.7% |
| Multidisciplinary Studies | 0 | 0.0% |
| Science & Technology | 6 | 2.0% |
| Business | 19 | 6.4% |
| Education | 32 | 10.7% |
| Literature & Languages | 0 | 0.0% |
| Liberal Arts & History | 4 | 1.3% |
| Visual & Performing Arts | 7 | 2.3% |
| Communications | 7 | 2.3% |
| Arts & Humanities | 4 | 1.3% |
| Total | 299 | 100.0% |
Transportation & Commute in Sundance
Vehicle Availability by Sex in Sundance
The most prevalent vehicle ownership categories in Sundance are males with 3 vehicles (104, accounting for 41.9%) and females with 3 vehicles (45, making up 43.5%).
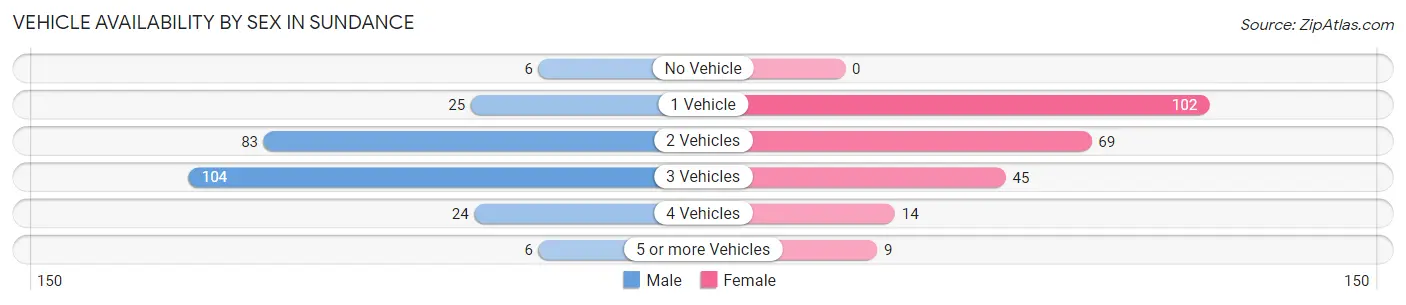
| Vehicles Available | Male | Female |
| No Vehicle | 6 (2.4%) | 0 (0.0%) |
| 1 Vehicle | 25 (10.1%) | 102 (42.7%) |
| 2 Vehicles | 83 (33.5%) | 69 (28.9%) |
| 3 Vehicles | 104 (41.9%) | 45 (18.8%) |
| 4 Vehicles | 24 (9.7%) | 14 (5.9%) |
| 5 or more Vehicles | 6 (2.4%) | 9 (3.8%) |
| Total | 248 (100.0%) | 239 (100.0%) |
Commute Time in Sundance
The most frequently occuring commute durations in Sundance are less than 5 minutes (149 commuters, 33.7%), 5 to 9 minutes (113 commuters, 25.6%), and 30 to 34 minutes (66 commuters, 14.9%).
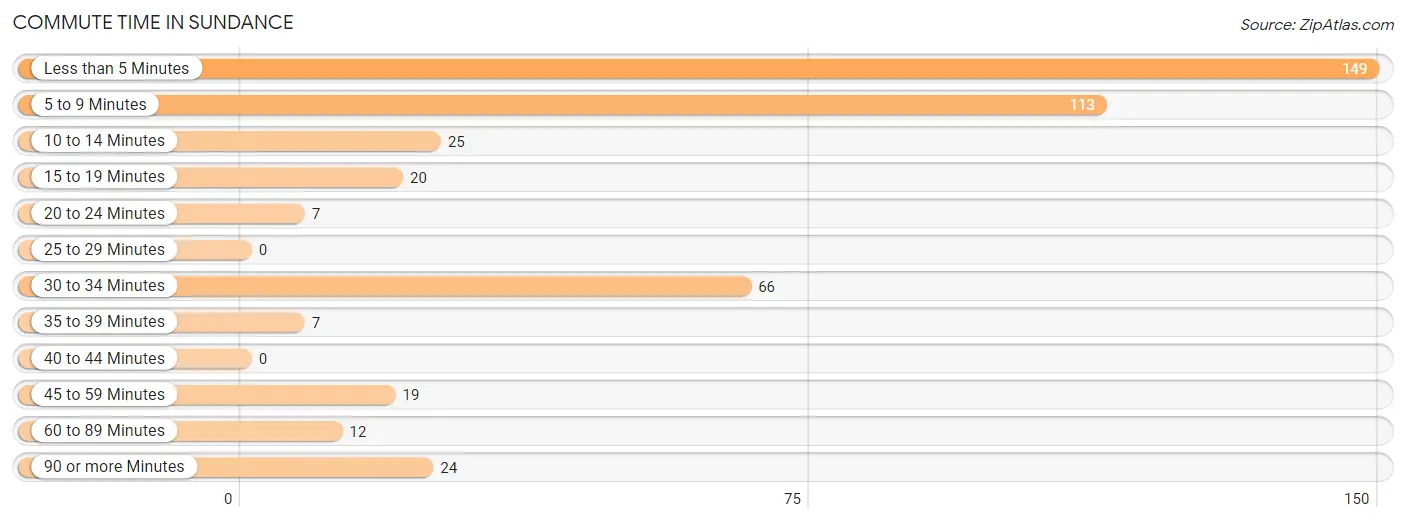
| Commute Time | # Commuters | % Commuters |
| Less than 5 Minutes | 149 | 33.7% |
| 5 to 9 Minutes | 113 | 25.6% |
| 10 to 14 Minutes | 25 | 5.7% |
| 15 to 19 Minutes | 20 | 4.5% |
| 20 to 24 Minutes | 7 | 1.6% |
| 25 to 29 Minutes | 0 | 0.0% |
| 30 to 34 Minutes | 66 | 14.9% |
| 35 to 39 Minutes | 7 | 1.6% |
| 40 to 44 Minutes | 0 | 0.0% |
| 45 to 59 Minutes | 19 | 4.3% |
| 60 to 89 Minutes | 12 | 2.7% |
| 90 or more Minutes | 24 | 5.4% |
Commute Time by Sex in Sundance
The most common commute times in Sundance are 30 to 34 minutes (66 commuters, 28.9%) for males and less than 5 minutes (117 commuters, 54.7%) for females.
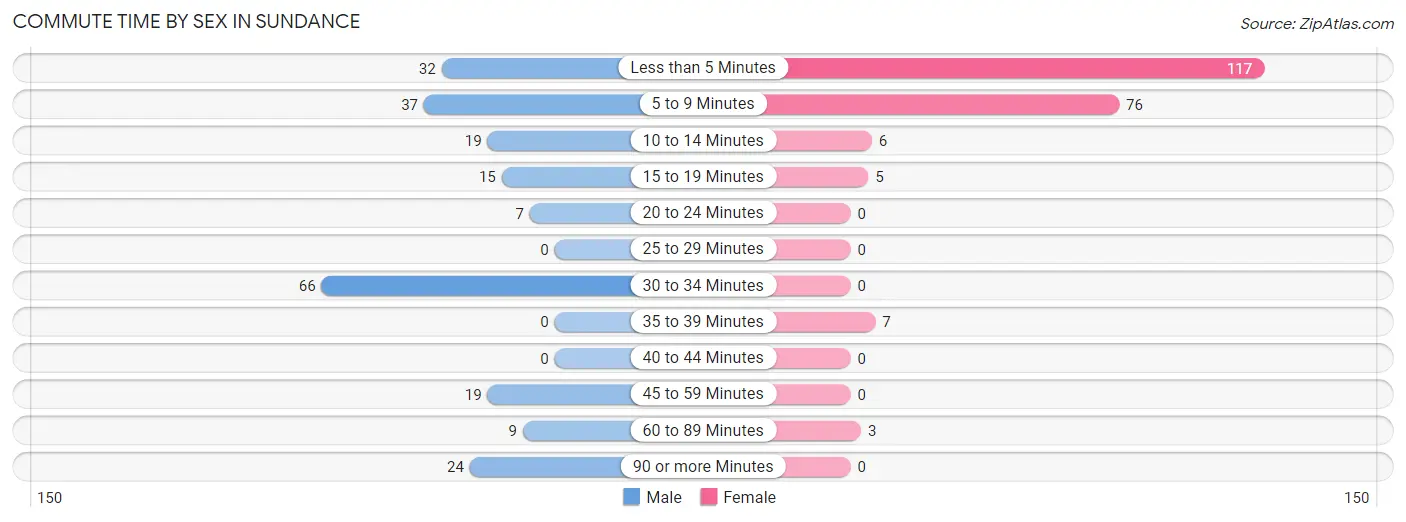
| Commute Time | Male | Female |
| Less than 5 Minutes | 32 (14.0%) | 117 (54.7%) |
| 5 to 9 Minutes | 37 (16.2%) | 76 (35.5%) |
| 10 to 14 Minutes | 19 (8.3%) | 6 (2.8%) |
| 15 to 19 Minutes | 15 (6.6%) | 5 (2.3%) |
| 20 to 24 Minutes | 7 (3.1%) | 0 (0.0%) |
| 25 to 29 Minutes | 0 (0.0%) | 0 (0.0%) |
| 30 to 34 Minutes | 66 (28.9%) | 0 (0.0%) |
| 35 to 39 Minutes | 0 (0.0%) | 7 (3.3%) |
| 40 to 44 Minutes | 0 (0.0%) | 0 (0.0%) |
| 45 to 59 Minutes | 19 (8.3%) | 0 (0.0%) |
| 60 to 89 Minutes | 9 (4.0%) | 3 (1.4%) |
| 90 or more Minutes | 24 (10.5%) | 0 (0.0%) |
Time of Departure to Work by Sex in Sundance
The most frequent times of departure to work in Sundance are 6:30 AM to 6:59 AM (71, 31.1%) for males and 6:30 AM to 6:59 AM (89, 41.6%) for females.
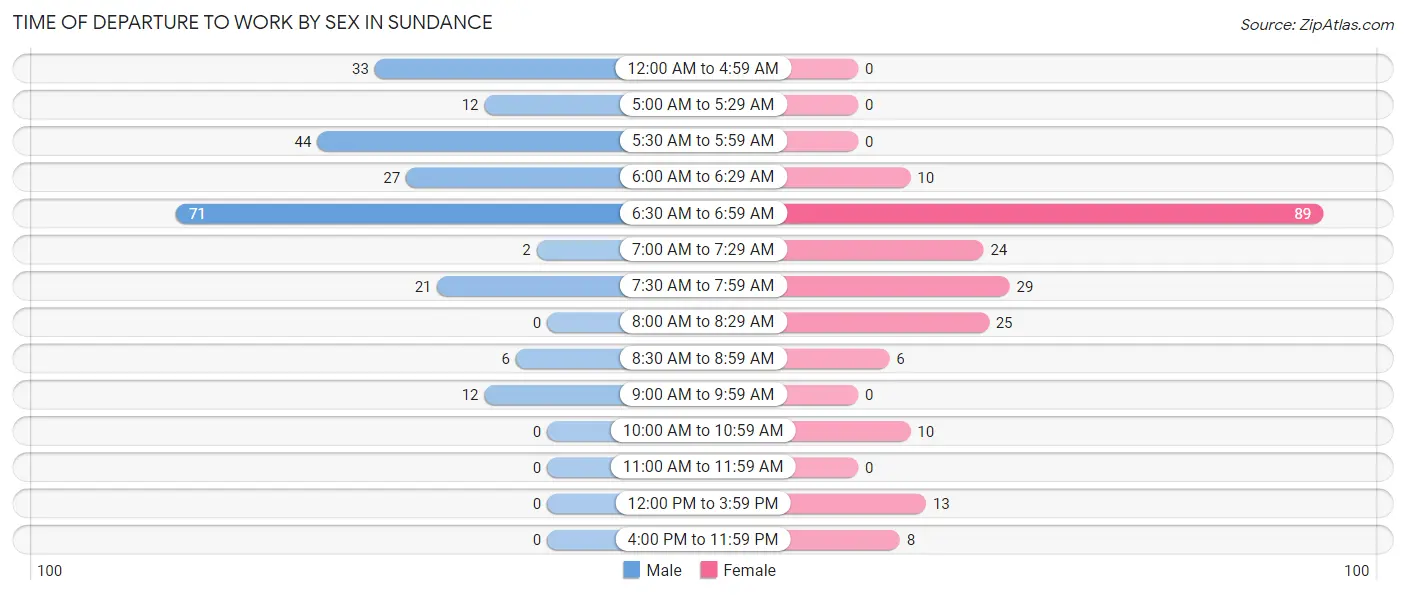
| Time of Departure | Male | Female |
| 12:00 AM to 4:59 AM | 33 (14.5%) | 0 (0.0%) |
| 5:00 AM to 5:29 AM | 12 (5.3%) | 0 (0.0%) |
| 5:30 AM to 5:59 AM | 44 (19.3%) | 0 (0.0%) |
| 6:00 AM to 6:29 AM | 27 (11.8%) | 10 (4.7%) |
| 6:30 AM to 6:59 AM | 71 (31.1%) | 89 (41.6%) |
| 7:00 AM to 7:29 AM | 2 (0.9%) | 24 (11.2%) |
| 7:30 AM to 7:59 AM | 21 (9.2%) | 29 (13.6%) |
| 8:00 AM to 8:29 AM | 0 (0.0%) | 25 (11.7%) |
| 8:30 AM to 8:59 AM | 6 (2.6%) | 6 (2.8%) |
| 9:00 AM to 9:59 AM | 12 (5.3%) | 0 (0.0%) |
| 10:00 AM to 10:59 AM | 0 (0.0%) | 10 (4.7%) |
| 11:00 AM to 11:59 AM | 0 (0.0%) | 0 (0.0%) |
| 12:00 PM to 3:59 PM | 0 (0.0%) | 13 (6.1%) |
| 4:00 PM to 11:59 PM | 0 (0.0%) | 8 (3.7%) |
| Total | 228 (100.0%) | 214 (100.0%) |
Housing Occupancy in Sundance
Occupancy by Ownership in Sundance
Of the total 444 dwellings in Sundance, owner-occupied units account for 291 (65.5%), while renter-occupied units make up 153 (34.5%).
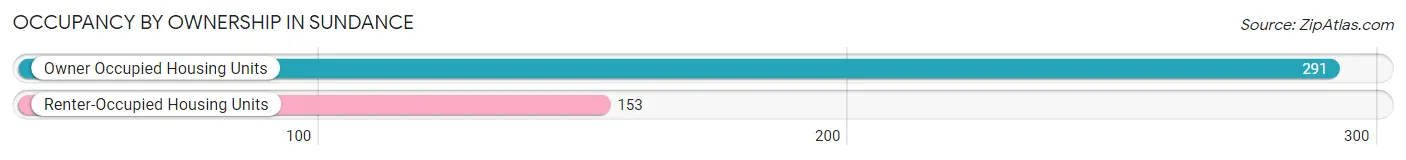
| Occupancy | # Housing Units | % Housing Units |
| Owner Occupied Housing Units | 291 | 65.5% |
| Renter-Occupied Housing Units | 153 | 34.5% |
| Total Occupied Housing Units | 444 | 100.0% |
Occupancy by Household Size in Sundance
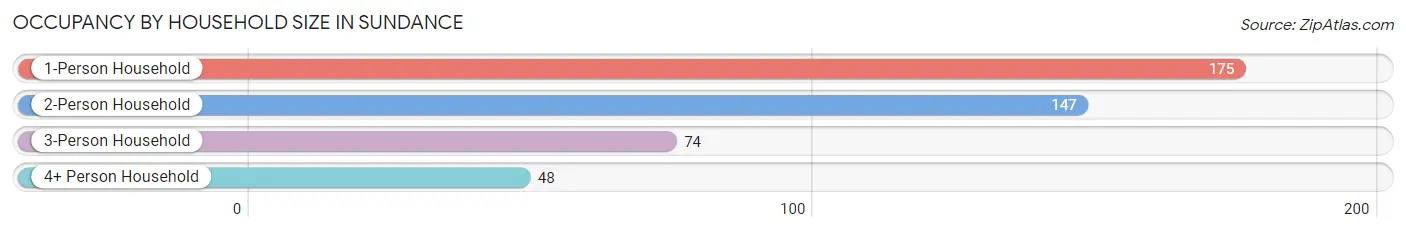
| Household Size | # Housing Units | % Housing Units |
| 1-Person Household | 175 | 39.4% |
| 2-Person Household | 147 | 33.1% |
| 3-Person Household | 74 | 16.7% |
| 4+ Person Household | 48 | 10.8% |
| Total Housing Units | 444 | 100.0% |
Occupancy by Ownership by Household Size in Sundance
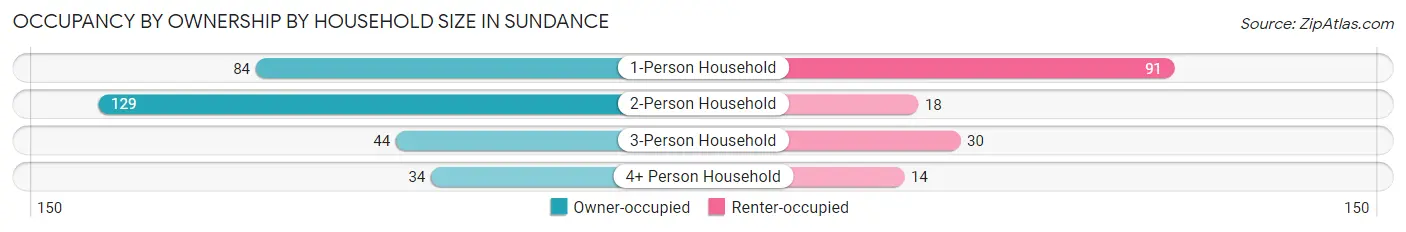
| Household Size | Owner-occupied | Renter-occupied |
| 1-Person Household | 84 (48.0%) | 91 (52.0%) |
| 2-Person Household | 129 (87.8%) | 18 (12.2%) |
| 3-Person Household | 44 (59.5%) | 30 (40.5%) |
| 4+ Person Household | 34 (70.8%) | 14 (29.2%) |
| Total Housing Units | 291 (65.5%) | 153 (34.5%) |
Occupancy by Educational Attainment in Sundance
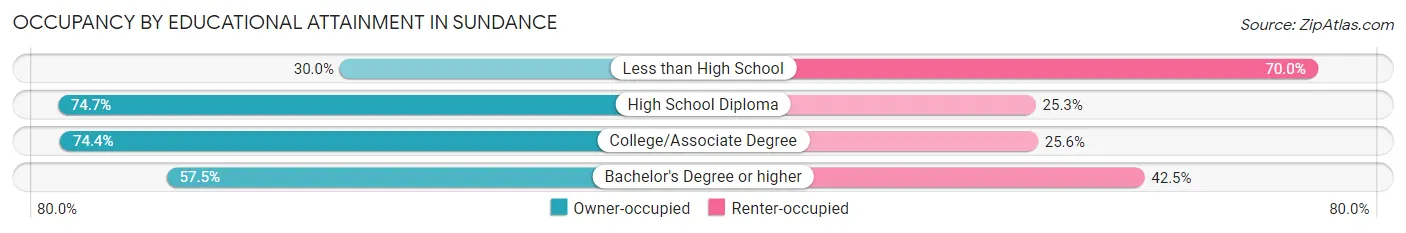
| Household Size | Owner-occupied | Renter-occupied |
| Less than High School | 6 (30.0%) | 14 (70.0%) |
| High School Diploma | 65 (74.7%) | 22 (25.3%) |
| College/Associate Degree | 116 (74.4%) | 40 (25.6%) |
| Bachelor's Degree or higher | 104 (57.5%) | 77 (42.5%) |
Occupancy by Age of Householder in Sundance
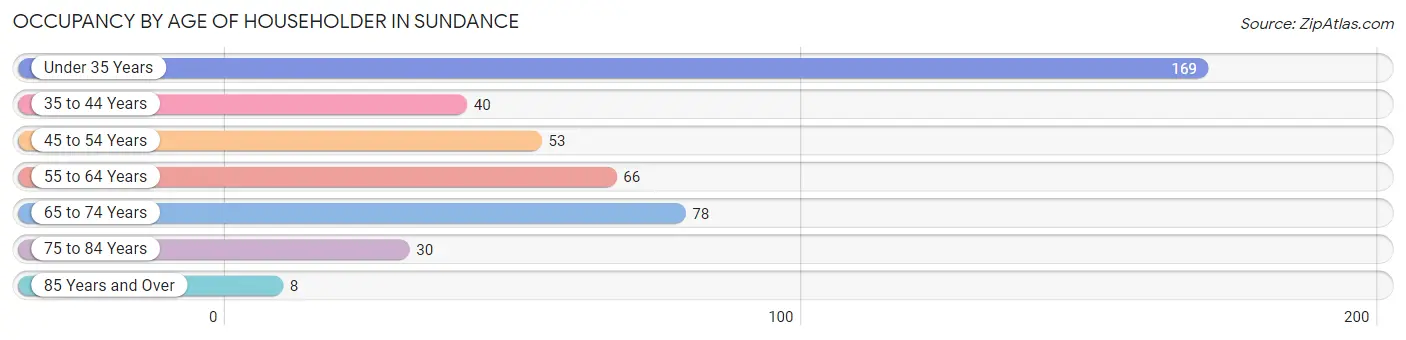
| Age Bracket | # Households | % Households |
| Under 35 Years | 169 | 38.1% |
| 35 to 44 Years | 40 | 9.0% |
| 45 to 54 Years | 53 | 11.9% |
| 55 to 64 Years | 66 | 14.9% |
| 65 to 74 Years | 78 | 17.6% |
| 75 to 84 Years | 30 | 6.8% |
| 85 Years and Over | 8 | 1.8% |
| Total | 444 | 100.0% |
Housing Finances in Sundance
Median Income by Occupancy in Sundance
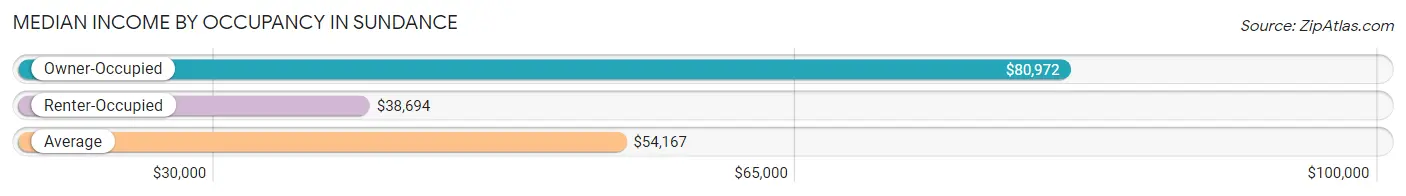
| Occupancy Type | # Households | Median Income |
| Owner-Occupied | 291 (65.5%) | $80,972 |
| Renter-Occupied | 153 (34.5%) | $38,694 |
| Average | 444 (100.0%) | $54,167 |
Occupancy by Householder Income Bracket in Sundance
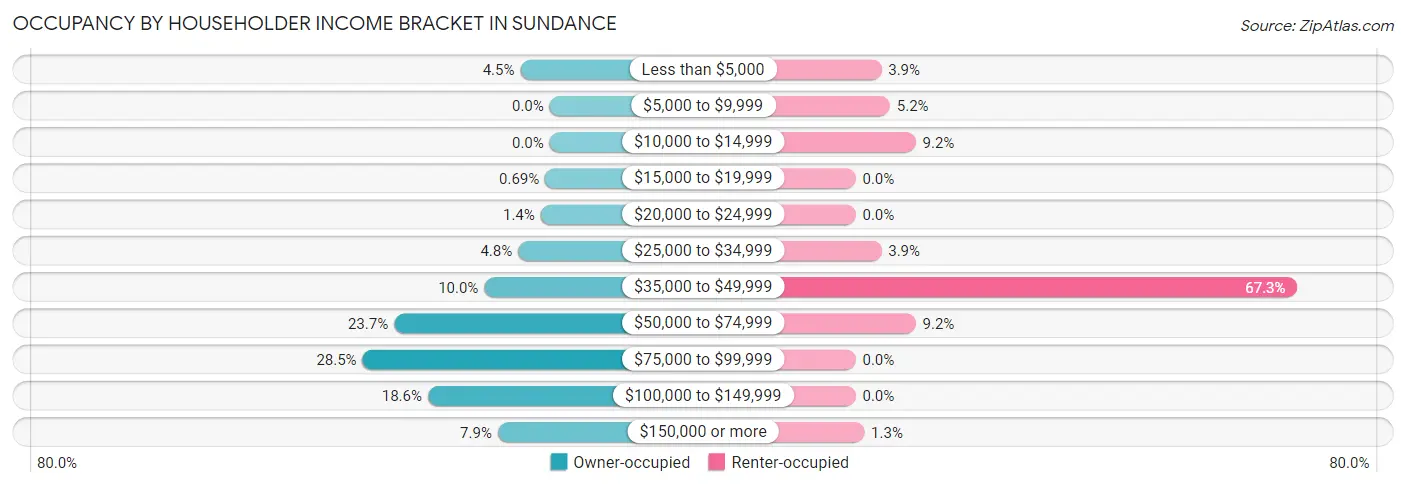
| Income Bracket | Owner-occupied | Renter-occupied |
| Less than $5,000 | 13 (4.5%) | 6 (3.9%) |
| $5,000 to $9,999 | 0 (0.0%) | 8 (5.2%) |
| $10,000 to $14,999 | 0 (0.0%) | 14 (9.1%) |
| $15,000 to $19,999 | 2 (0.7%) | 0 (0.0%) |
| $20,000 to $24,999 | 4 (1.4%) | 0 (0.0%) |
| $25,000 to $34,999 | 14 (4.8%) | 6 (3.9%) |
| $35,000 to $49,999 | 29 (10.0%) | 103 (67.3%) |
| $50,000 to $74,999 | 69 (23.7%) | 14 (9.1%) |
| $75,000 to $99,999 | 83 (28.5%) | 0 (0.0%) |
| $100,000 to $149,999 | 54 (18.6%) | 0 (0.0%) |
| $150,000 or more | 23 (7.9%) | 2 (1.3%) |
| Total | 291 (100.0%) | 153 (100.0%) |
Monthly Housing Cost Tiers in Sundance
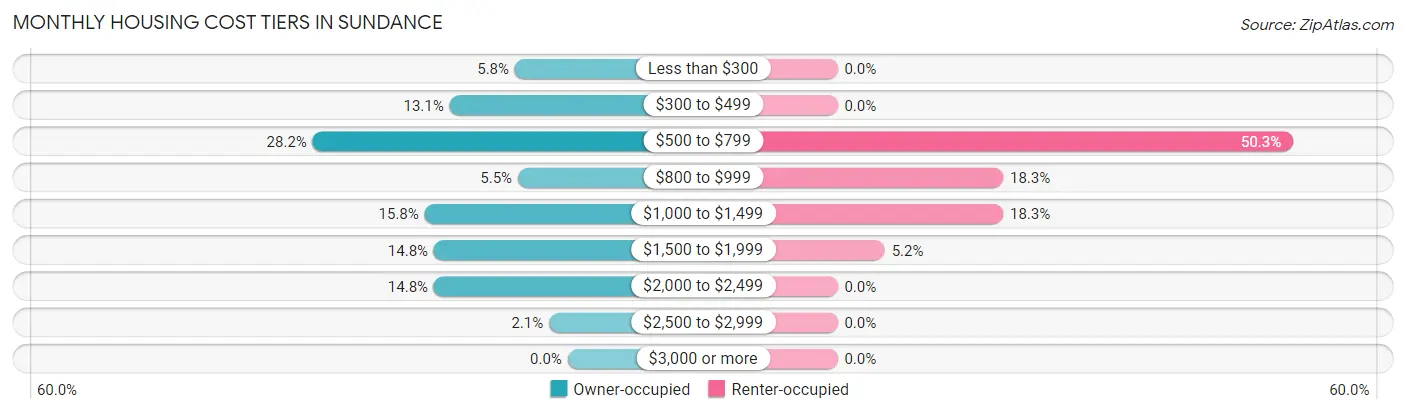
| Monthly Cost | Owner-occupied | Renter-occupied |
| Less than $300 | 17 (5.8%) | 0 (0.0%) |
| $300 to $499 | 38 (13.1%) | 0 (0.0%) |
| $500 to $799 | 82 (28.2%) | 77 (50.3%) |
| $800 to $999 | 16 (5.5%) | 28 (18.3%) |
| $1,000 to $1,499 | 46 (15.8%) | 28 (18.3%) |
| $1,500 to $1,999 | 43 (14.8%) | 8 (5.2%) |
| $2,000 to $2,499 | 43 (14.8%) | 0 (0.0%) |
| $2,500 to $2,999 | 6 (2.1%) | 0 (0.0%) |
| $3,000 or more | 0 (0.0%) | 0 (0.0%) |
| Total | 291 (100.0%) | 153 (100.0%) |
Physical Housing Characteristics in Sundance
Housing Structures in Sundance
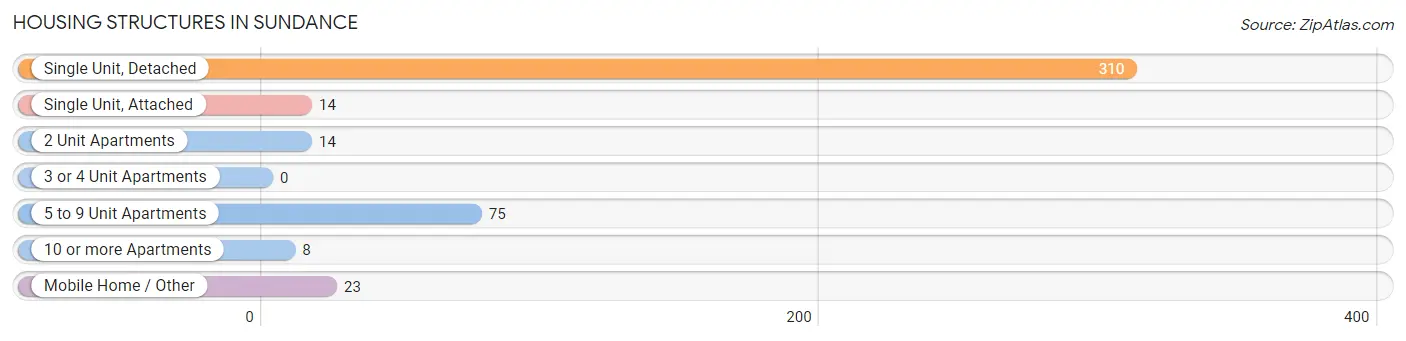
| Structure Type | # Housing Units | % Housing Units |
| Single Unit, Detached | 310 | 69.8% |
| Single Unit, Attached | 14 | 3.2% |
| 2 Unit Apartments | 14 | 3.2% |
| 3 or 4 Unit Apartments | 0 | 0.0% |
| 5 to 9 Unit Apartments | 75 | 16.9% |
| 10 or more Apartments | 8 | 1.8% |
| Mobile Home / Other | 23 | 5.2% |
| Total | 444 | 100.0% |
Housing Structures by Occupancy in Sundance
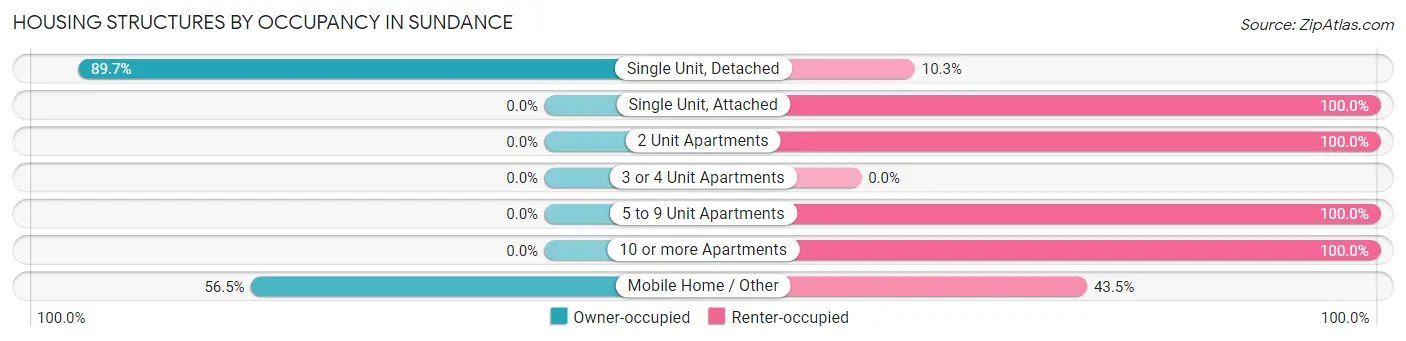
| Structure Type | Owner-occupied | Renter-occupied |
| Single Unit, Detached | 278 (89.7%) | 32 (10.3%) |
| Single Unit, Attached | 0 (0.0%) | 14 (100.0%) |
| 2 Unit Apartments | 0 (0.0%) | 14 (100.0%) |
| 3 or 4 Unit Apartments | 0 (0.0%) | 0 (0.0%) |
| 5 to 9 Unit Apartments | 0 (0.0%) | 75 (100.0%) |
| 10 or more Apartments | 0 (0.0%) | 8 (100.0%) |
| Mobile Home / Other | 13 (56.5%) | 10 (43.5%) |
| Total | 291 (65.5%) | 153 (34.5%) |
Housing Structures by Number of Rooms in Sundance
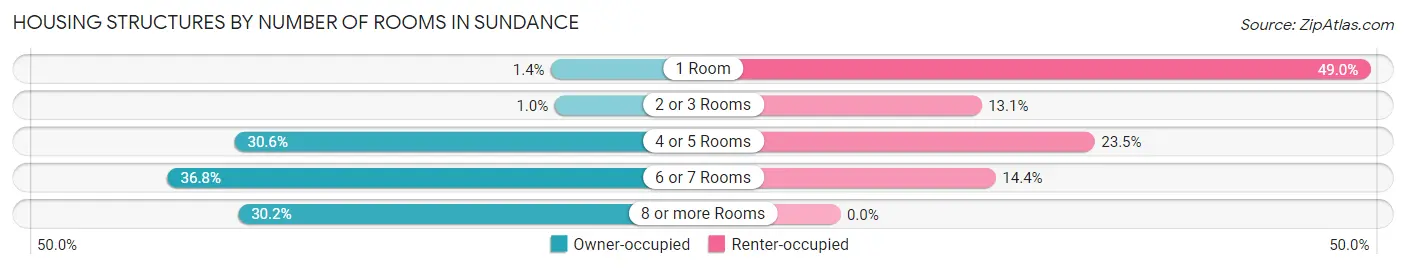
| Number of Rooms | Owner-occupied | Renter-occupied |
| 1 Room | 4 (1.4%) | 75 (49.0%) |
| 2 or 3 Rooms | 3 (1.0%) | 20 (13.1%) |
| 4 or 5 Rooms | 89 (30.6%) | 36 (23.5%) |
| 6 or 7 Rooms | 107 (36.8%) | 22 (14.4%) |
| 8 or more Rooms | 88 (30.2%) | 0 (0.0%) |
| Total | 291 (100.0%) | 153 (100.0%) |
Housing Structure by Heating Type in Sundance
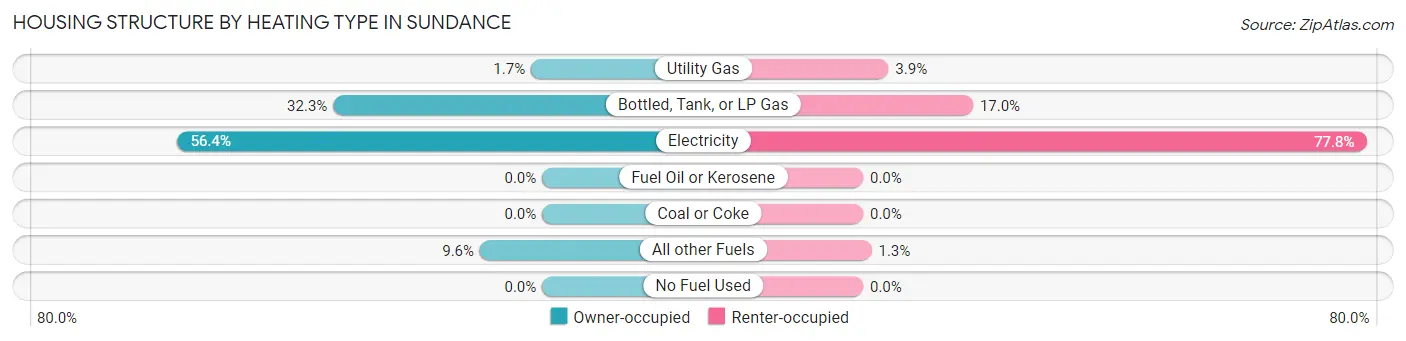
| Heating Type | Owner-occupied | Renter-occupied |
| Utility Gas | 5 (1.7%) | 6 (3.9%) |
| Bottled, Tank, or LP Gas | 94 (32.3%) | 26 (17.0%) |
| Electricity | 164 (56.4%) | 119 (77.8%) |
| Fuel Oil or Kerosene | 0 (0.0%) | 0 (0.0%) |
| Coal or Coke | 0 (0.0%) | 0 (0.0%) |
| All other Fuels | 28 (9.6%) | 2 (1.3%) |
| No Fuel Used | 0 (0.0%) | 0 (0.0%) |
| Total | 291 (100.0%) | 153 (100.0%) |
Household Vehicle Usage in Sundance
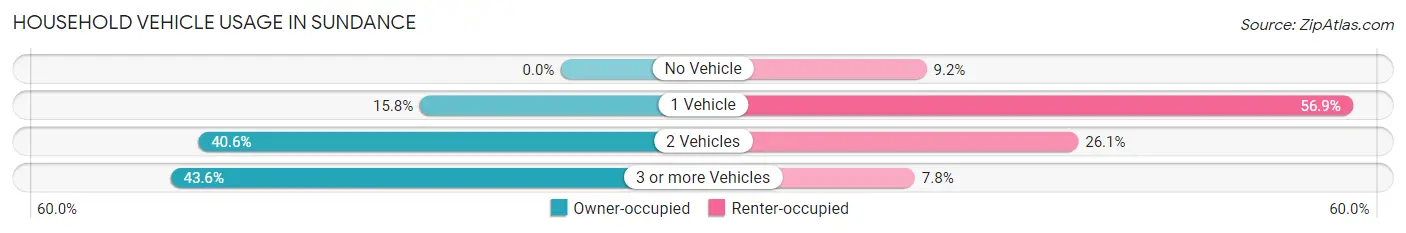
| Vehicles per Household | Owner-occupied | Renter-occupied |
| No Vehicle | 0 (0.0%) | 14 (9.1%) |
| 1 Vehicle | 46 (15.8%) | 87 (56.9%) |
| 2 Vehicles | 118 (40.6%) | 40 (26.1%) |
| 3 or more Vehicles | 127 (43.6%) | 12 (7.8%) |
| Total | 291 (100.0%) | 153 (100.0%) |
Real Estate & Mortgages in Sundance
Real Estate and Mortgage Overview in Sundance
| Characteristic | Without Mortgage | With Mortgage |
| Housing Units | 141 | 150 |
| Median Property Value | $263,400 | $256,900 |
| Median Household Income | $78,068 | $4 |
| Monthly Housing Costs | $540 | $0 |
| Real Estate Taxes | $1,246 | $3 |
Property Value by Mortgage Status in Sundance
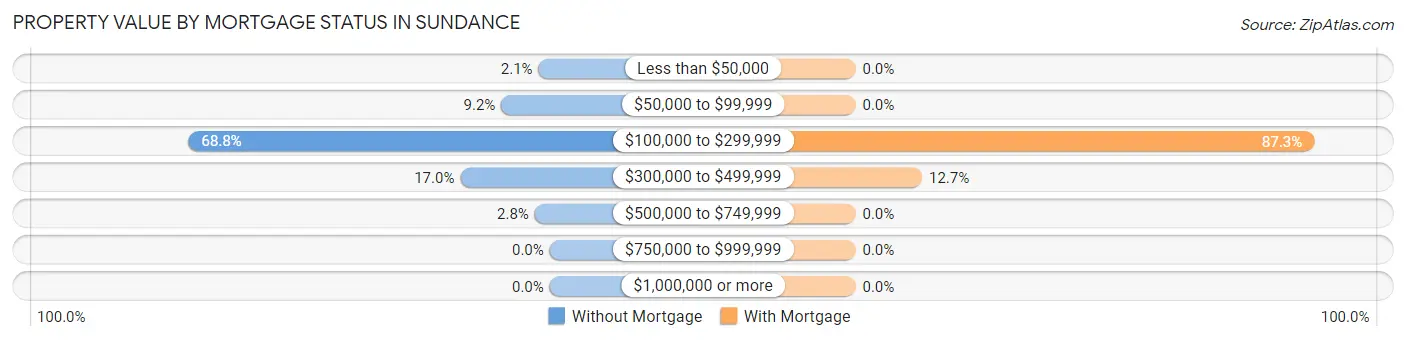
| Property Value | Without Mortgage | With Mortgage |
| Less than $50,000 | 3 (2.1%) | 0 (0.0%) |
| $50,000 to $99,999 | 13 (9.2%) | 0 (0.0%) |
| $100,000 to $299,999 | 97 (68.8%) | 131 (87.3%) |
| $300,000 to $499,999 | 24 (17.0%) | 19 (12.7%) |
| $500,000 to $749,999 | 4 (2.8%) | 0 (0.0%) |
| $750,000 to $999,999 | 0 (0.0%) | 0 (0.0%) |
| $1,000,000 or more | 0 (0.0%) | 0 (0.0%) |
| Total | 141 (100.0%) | 150 (100.0%) |
Household Income by Mortgage Status in Sundance
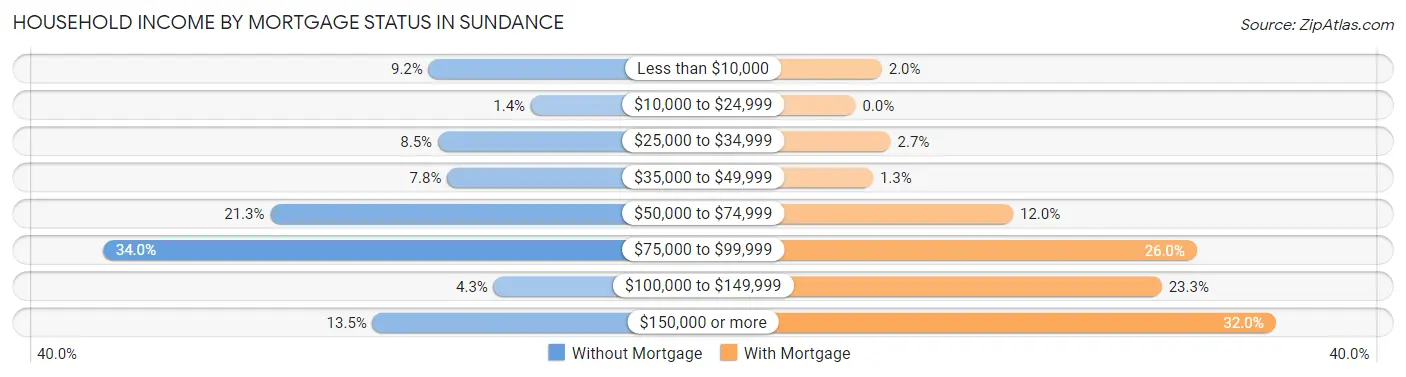
| Household Income | Without Mortgage | With Mortgage |
| Less than $10,000 | 13 (9.2%) | 3 (2.0%) |
| $10,000 to $24,999 | 2 (1.4%) | 0 (0.0%) |
| $25,000 to $34,999 | 12 (8.5%) | 4 (2.7%) |
| $35,000 to $49,999 | 11 (7.8%) | 2 (1.3%) |
| $50,000 to $74,999 | 30 (21.3%) | 18 (12.0%) |
| $75,000 to $99,999 | 48 (34.0%) | 39 (26.0%) |
| $100,000 to $149,999 | 6 (4.3%) | 35 (23.3%) |
| $150,000 or more | 19 (13.5%) | 48 (32.0%) |
| Total | 141 (100.0%) | 150 (100.0%) |
Property Value to Household Income Ratio in Sundance
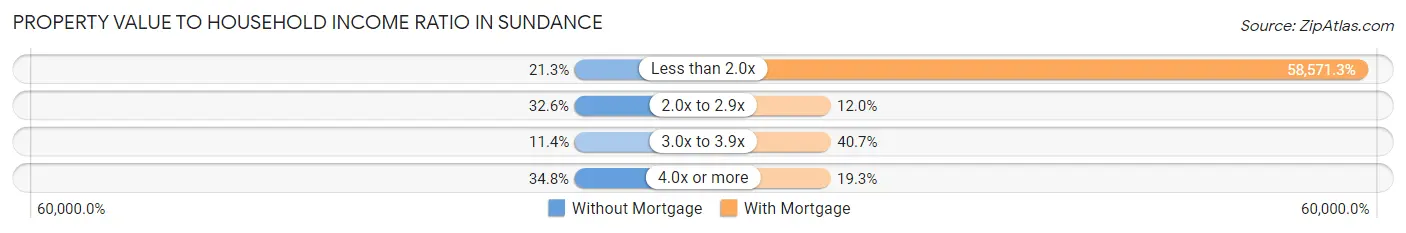
| Value-to-Income Ratio | Without Mortgage | With Mortgage |
| Less than 2.0x | 30 (21.3%) | 87,857 (58,571.3%) |
| 2.0x to 2.9x | 46 (32.6%) | 18 (12.0%) |
| 3.0x to 3.9x | 16 (11.4%) | 61 (40.7%) |
| 4.0x or more | 49 (34.7%) | 29 (19.3%) |
| Total | 141 (100.0%) | 150 (100.0%) |
Real Estate Taxes by Mortgage Status in Sundance
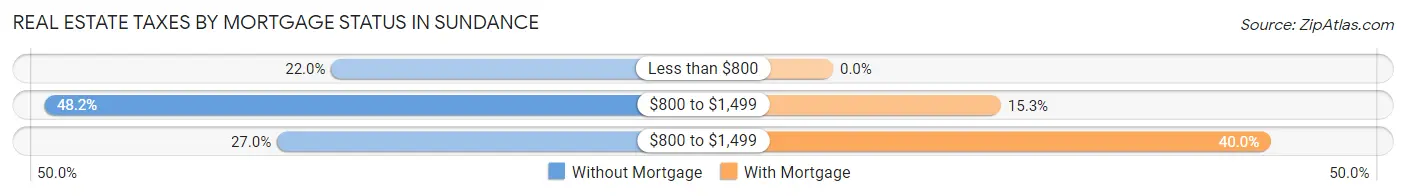
| Property Taxes | Without Mortgage | With Mortgage |
| Less than $800 | 31 (22.0%) | 0 (0.0%) |
| $800 to $1,499 | 68 (48.2%) | 23 (15.3%) |
| $800 to $1,499 | 38 (27.0%) | 60 (40.0%) |
| Total | 141 (100.0%) | 150 (100.0%) |
Health & Disability in Sundance
Health Insurance Coverage by Age in Sundance
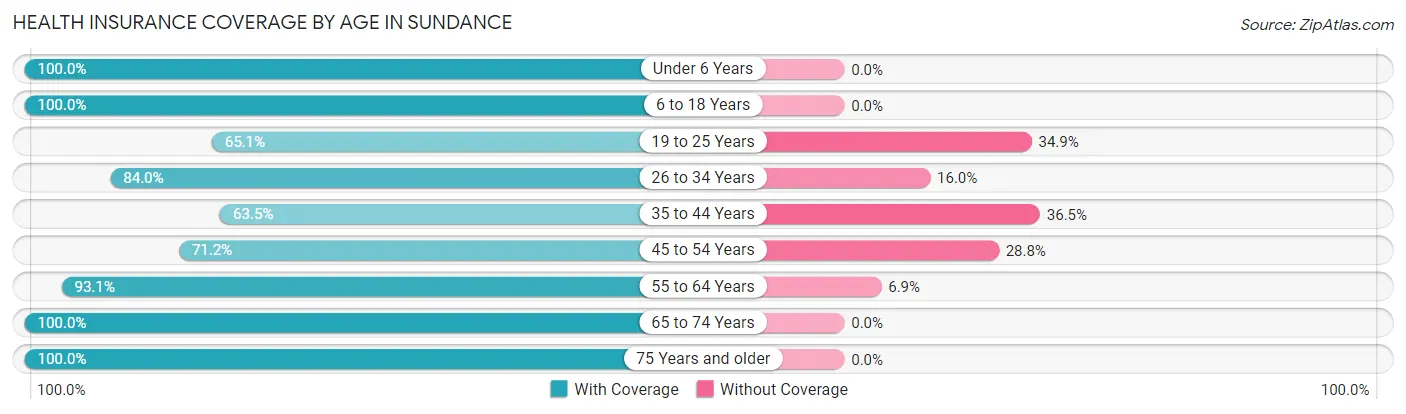
| Age Bracket | With Coverage | Without Coverage |
| Under 6 Years | 100 (100.0%) | 0 (0.0%) |
| 6 to 18 Years | 168 (100.0%) | 0 (0.0%) |
| 19 to 25 Years | 41 (65.1%) | 22 (34.9%) |
| 26 to 34 Years | 189 (84.0%) | 36 (16.0%) |
| 35 to 44 Years | 54 (63.5%) | 31 (36.5%) |
| 45 to 54 Years | 47 (71.2%) | 19 (28.8%) |
| 55 to 64 Years | 135 (93.1%) | 10 (6.9%) |
| 65 to 74 Years | 117 (100.0%) | 0 (0.0%) |
| 75 Years and older | 70 (100.0%) | 0 (0.0%) |
| Total | 921 (88.6%) | 118 (11.4%) |
Health Insurance Coverage by Citizenship Status in Sundance
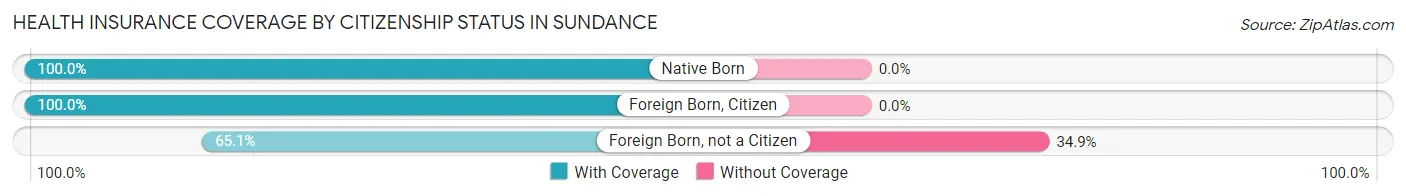
| Citizenship Status | With Coverage | Without Coverage |
| Native Born | 100 (100.0%) | 0 (0.0%) |
| Foreign Born, Citizen | 168 (100.0%) | 0 (0.0%) |
| Foreign Born, not a Citizen | 41 (65.1%) | 22 (34.9%) |
Health Insurance Coverage by Household Income in Sundance
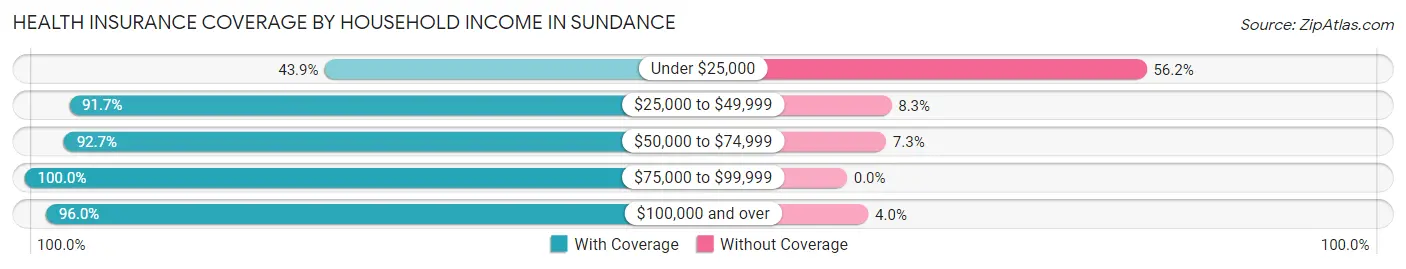
| Household Income | With Coverage | Without Coverage |
| Under $25,000 | 57 (43.9%) | 73 (56.1%) |
| $25,000 to $49,999 | 264 (91.7%) | 24 (8.3%) |
| $50,000 to $74,999 | 139 (92.7%) | 11 (7.3%) |
| $75,000 to $99,999 | 221 (100.0%) | 0 (0.0%) |
| $100,000 and over | 240 (96.0%) | 10 (4.0%) |
Public vs Private Health Insurance Coverage by Age in Sundance
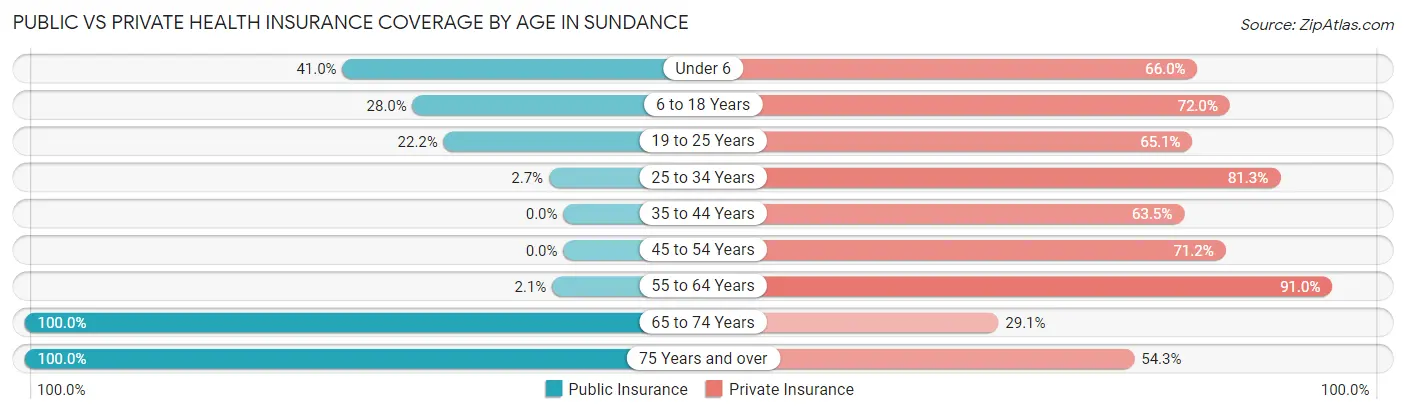
| Age Bracket | Public Insurance | Private Insurance |
| Under 6 | 41 (41.0%) | 66 (66.0%) |
| 6 to 18 Years | 47 (28.0%) | 121 (72.0%) |
| 19 to 25 Years | 14 (22.2%) | 41 (65.1%) |
| 25 to 34 Years | 6 (2.7%) | 183 (81.3%) |
| 35 to 44 Years | 0 (0.0%) | 54 (63.5%) |
| 45 to 54 Years | 0 (0.0%) | 47 (71.2%) |
| 55 to 64 Years | 3 (2.1%) | 132 (91.0%) |
| 65 to 74 Years | 117 (100.0%) | 34 (29.1%) |
| 75 Years and over | 70 (100.0%) | 38 (54.3%) |
| Total | 298 (28.7%) | 716 (68.9%) |
Disability Status by Sex by Age in Sundance
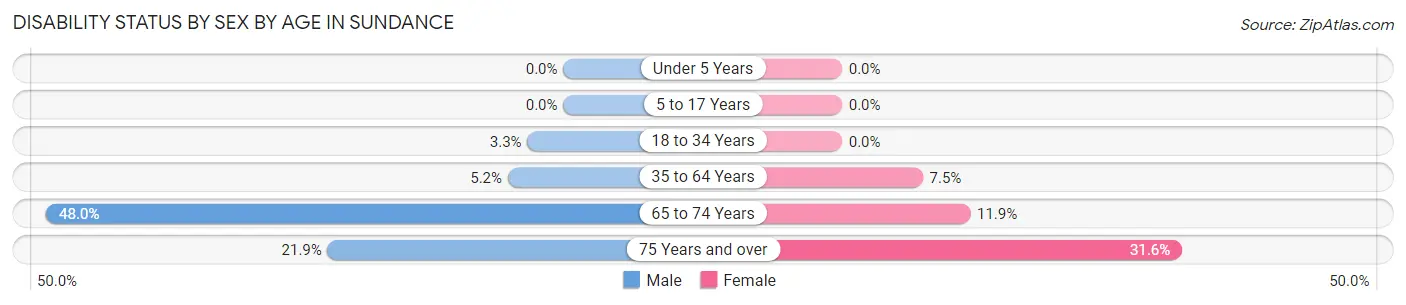
| Age Bracket | Male | Female |
| Under 5 Years | 0 (0.0%) | 0 (0.0%) |
| 5 to 17 Years | 0 (0.0%) | 0 (0.0%) |
| 18 to 34 Years | 4 (3.3%) | 0 (0.0%) |
| 35 to 64 Years | 7 (5.1%) | 12 (7.5%) |
| 65 to 74 Years | 36 (48.0%) | 5 (11.9%) |
| 75 Years and over | 7 (21.9%) | 12 (31.6%) |
Disability Class by Sex by Age in Sundance
Disability Class: Hearing Difficulty
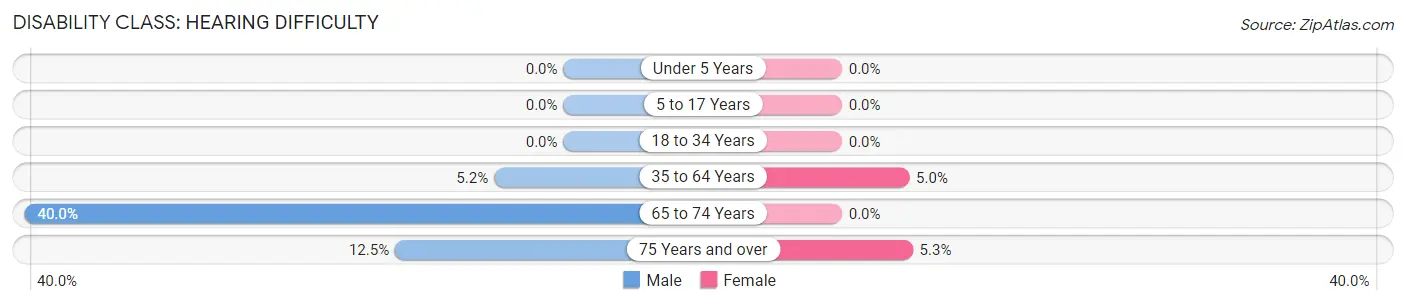
| Age Bracket | Male | Female |
| Under 5 Years | 0 (0.0%) | 0 (0.0%) |
| 5 to 17 Years | 0 (0.0%) | 0 (0.0%) |
| 18 to 34 Years | 0 (0.0%) | 0 (0.0%) |
| 35 to 64 Years | 7 (5.1%) | 8 (5.0%) |
| 65 to 74 Years | 30 (40.0%) | 0 (0.0%) |
| 75 Years and over | 4 (12.5%) | 2 (5.3%) |
Disability Class: Vision Difficulty
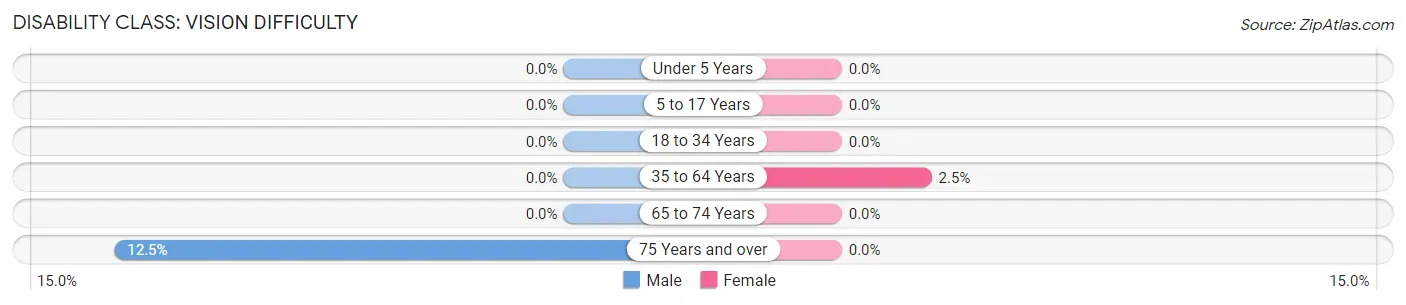
| Age Bracket | Male | Female |
| Under 5 Years | 0 (0.0%) | 0 (0.0%) |
| 5 to 17 Years | 0 (0.0%) | 0 (0.0%) |
| 18 to 34 Years | 0 (0.0%) | 0 (0.0%) |
| 35 to 64 Years | 0 (0.0%) | 4 (2.5%) |
| 65 to 74 Years | 0 (0.0%) | 0 (0.0%) |
| 75 Years and over | 4 (12.5%) | 0 (0.0%) |
Disability Class: Cognitive Difficulty
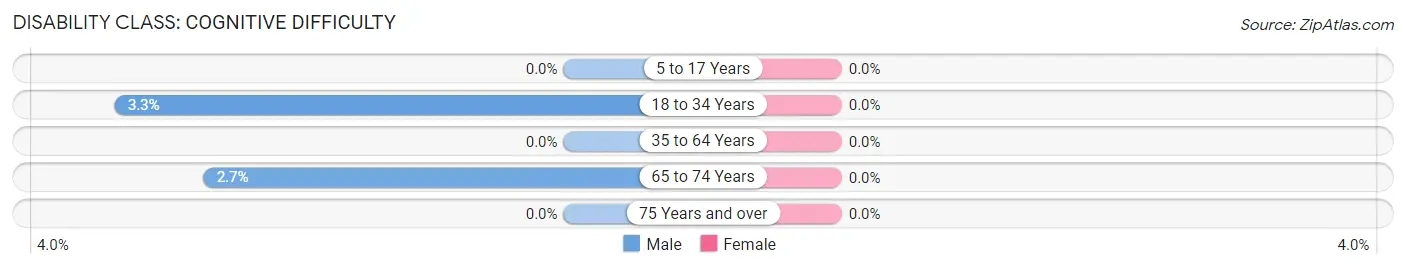
| Age Bracket | Male | Female |
| 5 to 17 Years | 0 (0.0%) | 0 (0.0%) |
| 18 to 34 Years | 4 (3.3%) | 0 (0.0%) |
| 35 to 64 Years | 0 (0.0%) | 0 (0.0%) |
| 65 to 74 Years | 2 (2.7%) | 0 (0.0%) |
| 75 Years and over | 0 (0.0%) | 0 (0.0%) |
Disability Class: Ambulatory Difficulty
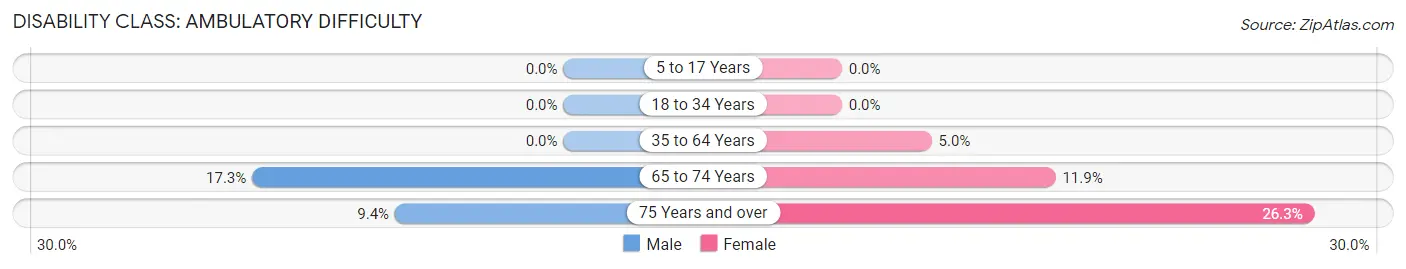
| Age Bracket | Male | Female |
| 5 to 17 Years | 0 (0.0%) | 0 (0.0%) |
| 18 to 34 Years | 0 (0.0%) | 0 (0.0%) |
| 35 to 64 Years | 0 (0.0%) | 8 (5.0%) |
| 65 to 74 Years | 13 (17.3%) | 5 (11.9%) |
| 75 Years and over | 3 (9.4%) | 10 (26.3%) |
Disability Class: Self-Care Difficulty
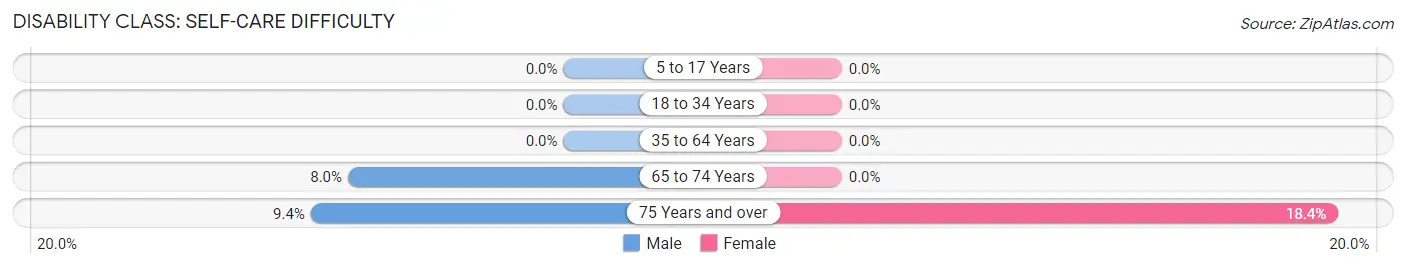
| Age Bracket | Male | Female |
| 5 to 17 Years | 0 (0.0%) | 0 (0.0%) |
| 18 to 34 Years | 0 (0.0%) | 0 (0.0%) |
| 35 to 64 Years | 0 (0.0%) | 0 (0.0%) |
| 65 to 74 Years | 6 (8.0%) | 0 (0.0%) |
| 75 Years and over | 3 (9.4%) | 7 (18.4%) |
Technology Access in Sundance
Computing Device Access in Sundance
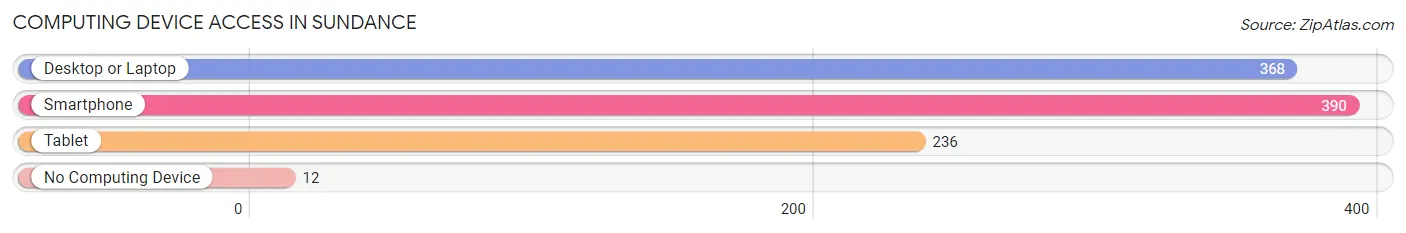
| Device Type | # Households | % Households |
| Desktop or Laptop | 368 | 82.9% |
| Smartphone | 390 | 87.8% |
| Tablet | 236 | 53.1% |
| No Computing Device | 12 | 2.7% |
| Total | 444 | 100.0% |
Internet Access in Sundance
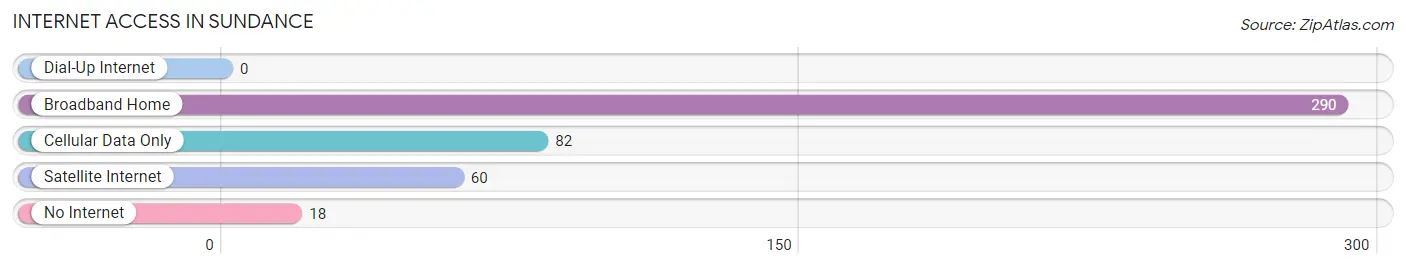
| Internet Type | # Households | % Households |
| Dial-Up Internet | 0 | 0.0% |
| Broadband Home | 290 | 65.3% |
| Cellular Data Only | 82 | 18.5% |
| Satellite Internet | 60 | 13.5% |
| No Internet | 18 | 4.1% |
| Total | 444 | 100.0% |
Sundance Summary
Sundance, Wyoming is a small town located in the northeastern corner of the state, in the foothills of the Black Hills. It is the county seat of Crook County and is home to a population of 1,182 people as of the 2010 census. The town was founded in 1887 and named after the nearby Sundance Creek.
History
The area around Sundance was first inhabited by the Arapaho and Cheyenne Native American tribes. The first white settlers arrived in the area in the late 1870s, and the town of Sundance was officially founded in 1887. The town was named after the nearby Sundance Creek, which was named by the Native Americans who used the area for hunting and gathering.
The town quickly grew and by the early 1900s, it had become a bustling center of commerce and industry. The town was home to several businesses, including a hotel, a bank, a newspaper, a lumber mill, and a creamery. The town also had a railroad station, which connected it to the rest of the state.
In the early 1900s, the town was also home to a large number of sheep and cattle ranches. The town was also home to a large number of coal mines, which provided employment for many of the town's residents.
Geography
Sundance is located in the northeastern corner of Wyoming, in the foothills of the Black Hills. The town is situated at an elevation of 4,890 feet above sea level. The town is located in a semi-arid climate, with hot summers and cold winters.
The town is located near the Bear Lodge Mountains, which are part of the Black Hills National Forest. The town is also located near the Belle Fourche River, which is a tributary of the Cheyenne River.
Economy
The economy of Sundance is largely based on agriculture and tourism. The town is home to several large ranches, which raise cattle and sheep. The town is also home to several small businesses, including restaurants, hotels, and retail stores.
The town is also home to several tourist attractions, including the Sundance Mountain Resort, which is a ski resort located in the nearby Bear Lodge Mountains. The town is also home to the Crook County Museum, which is a museum dedicated to the history of the area.
Demographics
As of the 2010 census, the population of Sundance was 1,182 people. The town has a median household income of $41,250 and a median home value of $127,000. The town is predominantly white, with 91.3% of the population identifying as white. The town also has a small Hispanic population, with 4.2% of the population identifying as Hispanic or Latino. The town also has a small Native American population, with 1.2% of the population identifying as Native American.
Common Questions
What is Per Capita Income in Sundance?
Per Capita income in Sundance is $30,741.
What is the Median Family Income in Sundance?
Median Family Income in Sundance is $82,083.
What is the Median Household income in Sundance?
Median Household Income in Sundance is $54,167.
What is Income or Wage Gap in Sundance?
Income or Wage Gap in Sundance is 39.8%.
Women in Sundance earn 60.2 cents for every dollar earned by a man.
What is Family Income Deficit in Sundance?
Family Income Deficit in Sundance is $12,231.
Families that are below poverty line in Sundance earn $12,231 less on average than the poverty threshold level.
What is Inequality or Gini Index in Sundance?
Inequality or Gini Index in Sundance is 0.36.
What is the Total Population of Sundance?
Total Population of Sundance is 1,102.
What is the Total Male Population of Sundance?
Total Male Population of Sundance is 445.
What is the Total Female Population of Sundance?
Total Female Population of Sundance is 657.
What is the Ratio of Males per 100 Females in Sundance?
There are 67.73 Males per 100 Females in Sundance.
What is the Ratio of Females per 100 Males in Sundance?
There are 147.64 Females per 100 Males in Sundance.
What is the Median Population Age in Sundance?
Median Population Age in Sundance is 34.6 Years.
What is the Average Family Size in Sundance
Average Family Size in Sundance is 3.2 People.
What is the Average Household Size in Sundance
Average Household Size in Sundance is 2.3 People.
How Large is the Labor Force in Sundance?
There are 495 People in the Labor Forcein in Sundance.
What is the Percentage of People in the Labor Force in Sundance?
58.4% of People are in the Labor Force in Sundance.